The effect of gemfibrozil on the pharmacokinetics of rosuvastatin
Upload
independentCategory
view
0download
0
BeermannT. M. Byrem, T. F. Robinson, Y. R. Boisclair, A. W. Bell, W. S. Schwark and D. H.
Analysis and pharmacokinetics of cimaterol in growing Holstein steers
1992, 70:3812-3819.J ANIM SCI
http://jas.fass.org/content/70/12/3812the World Wide Web at:
The online version of this article, along with updated information and services, is located on
www.asas.org
by guest on July 10, 2011jas.fass.orgDownloaded from

Analysis and Pharmacokinetics of Cimaterol in Growing Holstein Steers'
T. M. Byrem*, T. F. Robinson*, Y. R. Boisclair", A. W. Bell*, W. S. Schwarkt, And D. H. Beennann*p2
*Department of Animal Science and +Department of Pharmacology, College of Veterinary Medicine, Cornel1 University, Ithaca, NY 14853-4801
ABSTRACT1 Pharmacokinetic parameters for the P2-adrenergic agonist, cimaterol (CIM), were deter- mined in growing Holstein steers. Compartmental analysis was used after measurement of CIM in body fluids by affinity chromatography and HPLC using UV detection. Recoveries from spiked plasma and urine standards were 70 f 1.2% and 68 f 1.1%, respectively. The minimum detection level in plasma was 1 ng/mL and the average CV was 5.1% for concentrations that ranged from 1 to 30 ng/mL. Four steers (276 f 24 kg) received 15 mg of CIM by bolus intravenous injection. Plasma CIM levels declined in a biphasic manner with half-lives of 2.5 min for the distribution phase and 54 min for the elimination phase. A two-compart- ment open model was used to describe the
disappearance of CIM and the following phar- macokinetic parameters were obtained: central compartment volume Wcl = .76 L/kg, apparent volume of distribution Wd) = 4.1 L/kg, and transfer rate constants from the central to peripheral compartment (klz) = .177/min, from the peripheral to central compartment (kzl) = .054/ min and elimination from the central compart- ment &e,) = .074/min. After 8 h, total urinary CIM accounted for only 18.3% of the administered dose. Results suggest that circulating concentrations of CIM in growing steers are influenced by its accumulation in an unidentified peripheral pool and its conversion into unknown metaboliteIs1 before elimination.
Key Words: Cattle, Sympathomimetics, Cimaterol, Analytical Methods, Pharmacokinetics
Introduction
Increased skeletal muscle gains and decreased lipid accretion result from oral administration of certain P2-adrenergic agonists to cattle (Ricks et al., 1984; Allen et al., 19871, sheep (Baker et al., 1984; Beermann et al., 19861, pigs (Jones et al., 1985; Wallace et al., 19871, and poultry (Dalrymple et al., 1984; Duquette et al., 1987). These changes contrib- ute to associated increases in feed efficiency n e s s et al., 19841 that make some P2-adrenergic agonists
'Supported by the Cornel1 Univ. Agric. Exp. Sta. The authors gratefully acknowledge the assistance of G. Maylin during development of the cimaterol assay and J. G. Parsons during the preparation of this manuscript. Cimaterol was provided as a gift from American Cyanamid, Princeton, NJ.
2To whom correspondence should be addressed: B-53 Morri- son Hall.
Received March 18, 1902. Accepted July 24, 1092.
J. Anim. Sci. 1992. 70:3812-3819
potential candidates for commercial application in meat animal production.
Mechanistic studies on P2-adrenergic agonist action have been concerned with specific effects on protein metabolism (Bergen et al., 1989; Claeys et al., 19891, lipid metabolism (Merkel et al., 1987; Liu et al., 19891, energy metabolism (MacRae et al., 1988; Kim et al., 1989; Rikhardsson et al., 19911, and endocrine status (Beermann et al., 1987; O'Connor et al., 19911. However, little is known about the disposition of the P2-adrenergic agonist after it enters the body.
Pharmacokinetic studies of P2-adrenergic agonists have been limited by the absence of specific methods to quantify these compounds in biological fluids and tissues. Meyer and Rinke (1991) found significantly higher clenbuterol residues in various tissues than in plasma of treated veal calves, but clenbuterol plasma kinet- ics were not reported. The objective of this study was to define basic pharmacokinetic parameters
3812
by guest on July 10, 2011jas.fass.orgDownloaded from

CIMATEROL ANALYSIS
of the Pz-adrenergic agonist cimaterol KIM) in growing Holstein steers. We report an extraction procedure for CIM, a sensitive HPLC that uses W detection method for its quantification, and esti- mates of its pharmacokinetic characteristics.
Materials and Methods
Animals
Protocol and procedures that involved animals used in this study were approved by the Cornel1 University Institutional Animal Care and Use Committee. The four Holstein steers (276 f 24 kg) used in this study were confined in stanchions under thermoneutral conditions. Chronic indwel- ling catheters (polyvinyl chloride) located in the external iliac artery and external iliac vein were surgically implanted and maintained in each steer as described by Boisclair (19911. During these studies the animals were fed hourly a completely mixed diet that contained cracked corn, ground alfalfa, and soybean meal, balanced to meet the requirements of steers gaining 1 kg/d (NRC, 1984). Access to water was ad libitum. The steers were also fitted with a urine collection harness to allow complete urine collection during the experiment. The urine was siphoned via a diaphragm vacuum pump (Gast Manufacturing, Benton Harbor, MI) into a 6-L plastic bottle and sampled at predeter- mined times.
Sample Collection
Cimaterol . HC1 (30 mg) was solubilized in 2 mL of .1 N perchloric acid (PCA) that had been previously filtered through a . 2 2 - p filter unit (Cameo IIS, Micron Separations, Westborough, MA). The stock solution was brought to a volume of 20 mL with sterile saline (9 g of NaCVLI. Each steer was administered 15 mg of CIM LO47 to .065 mg/kg BWI in a 10-mL volume by bolus injection into the external iliac vein to determine the time course of CIM disappearance. The catheters were flushed immediately with 5 mL of sterile, heparinized (100 U/mLI saline. At times 0, 4, 6, 8, 10, 12, 14, 16, 20, 25, 30, 40, 50, 60, 70, 80, 100, 120, and 180 min after injection, whole blood was collected from the external iliac artery into heparinized (0 U/mL blood) tubes and stored on ice. Plasma was obtained by centrifugation at 3,000 x g for 30 rnin a t 4" C and immediately frozen (-20" C1. Urine collection started immediately after the bolus injection. Voided urine was weighed and specific gravity recorded. A representative sample was collected and frozen (-20°C) a t 1.5, 3, 5, and 8 h after injection. All CIM analyses in the present study were completed within 28 d of sample collection.
AND PHARMACOKINETICS 3813
CimateroI AnaZysis
Cimaterol extraction procedures were devel- oped by modifying those for clenbuterol analysis (Eddins et al., 19851, in which clenbuterol was extracted into the nonpolar support, hexane, as- sisted by a hydrophilic affinity column to remove interfering water soluble compounds. However, the excessive solubility of CIM in hexane did not permit adequate desorption and a more polar solvent, chloroform, was used.
For plasma, the samples were first made alka- line (pH 2 11) with a 2 5 N NaOH solution. Because a wide range of plasma concentrations was e x pected and short initial sampling intervals limited sample volumes, three plasma volumes (.25, 1, and 3 mL1 were extracted by bringing each to a volume of 5 mL with the NaOH solution. After vortexing, the samples were poured onto a 5-mL affinity column (ChemElut@ CE 1005, Analytichem Interna- tional, Harbor City, CAI positioned above a poly propylene 50-mL conical bottom centrifuge tube and allowed to stand 5 min. Sample tubes were rinsed with 5 mL of chloroform and poured onto the column. The chloroform was allowed to com- pletely enter the column before the column was washed with an additional 25 mL of chloroform. Solvent that remained in the column after 20 rnin was gently pushed through with an air stream to facilitate recovery.
Cimaterol was extracted from the chloroform into .1 N PCA. A volume of 100 pL of .1 N PCA was added to the collection tube and shaken vigorously for 10 min on EL mechanical shaker. After standing 10 min, the PCA droplet was transferred by Pasteur pipette to limited volume inserts and subsequently analyzed by HPLC.
Urine analysis for CIM required an initial liquid-liquid extraction with ethylacetate to re- move interfering substances not found in apprecia- ble amounts in plasma (e.g., NH31. A sufficient amount of 12.5 N NaOH was added to 15 mL of urine to attain a pH of 9.5. The sample was vortexed and centrifuged for 15 min a t 3,000 x g, 25OC. A 10-mL volume of supernate was washed with 8 mL of ethylacetate. After centrifugation for 10 min at 3,000 x g and 25OC, 0 mL of the ethylacetate was removed and replaced with 5 mL of fresh ethylacetate and the wash repeated. Another 0 mL of ethylacetate was removed, giving a total of 12 mL, which was subsequently washed with 5 mL of .1 N HCl. After centrifugation, the HCl was transferred to a glass culture tube. Sample pH was raised to 2 11 with several drops of 12.5 N NaOH. This sample was extracted on a 5-mL affinity column (ChemElut CE1005) as previ- ously described.
Plasma standards for CIM were constructed by spiking whole blood to various concentrations
by guest on July 10, 2011jas.fass.orgDownloaded from

3814 BYREM
using dilutions of a stock solution of CIM solubi- lized in .1 N PCA. The whole blood was gently mixed and allowed to stand 10 min before obtain- ing plasma by centrifugation. Prior work (unpub- lished data) had shown that CIM equilibrates rapidly across the red blood cell membrane, as does another P-agonist, terbutaline (Ericksson et al., 1975). Therefore, plasma and whole blood concentrations are essentially equal. Urine from untreated steers was spiked similarly and ex- tracted accordingly to obtain standard curves for urine analysis. Standard curves were defined by five data points in duplicate and recoveries were calculated on all standards using peak dimensions of chromatograms from samples of known concen- tration and back calculation.
Sample separation was achieved by reverse- phase HPLC using a liquid chromatograph that consisted of a sample processor (Model 710B, Waters Associates, Milford, MA), a solvent deliv- ery system (Model 510, Waters Associates), and a multiwavelength absorbance detector (Model 44 1, Waters Associates). A pen recorder (Model 196k, Honeywell, Philadelphia, PA) was used to record the chromatograms. Separation was achieved on a 15-cm x 4.6-mm deactivated HPLC column (Supel- cosil LC-8-DB, Supelco, Bellefonte, PA) preceded by a guard column packed with a CIS modified silica resin (Cls/Corasil Bondapak, Waters Associates). The mobile phase was a 20 and 10% acetonitrile solution in 2 mM KH2P04 for plasma and urine analysis, respectively. Each solution was adjusted to pH 3 with H3P04 and filtered through a -2-m nylon membrane (Nylon 66, Rainin Instrument, Woburn, MA) under vacuum. Flow rates of 1 mL/ min (8.913 MPJ and detection at 214 nm wavelength were used for both plasma and urine analysis. Sensitivity settings were .01 and 1 activity units full scale (AUFS) and injection volumes were 20 and 5 pL for plasma and urine analysis, respec- tively.
Data Analysis
Plasma and urine samples and standards were analyzed concurrently in duplicate. Sample con- centrations were obtained by regression analysis (Gill, 1978) based on the appropriate standard curve defined by five points over the range expected. Where appropriate, data were subjected to analysis of variance and means separated by Tukey’s honestly significant difference test (Gill, 1978). Cimaterol decay curves were evaluated using the ESTRIP basic pharmacokinetics com- puter program (Brown and Manno, 19781, and the results were subsequently subjected to compart- mental analysis (Baggot, 1977).
ET AL.
Results
Figure 1 represents a typical chromatogram that compares the presence of CIM in both plasma and urine against their negative controls. The HPLC retention times (RT) were 4 and 6 min for plasma and urine analysis, respectively, which allowed sufficient separation from the solvent fronts and no apparent interference from other peaks.
Regression analysis of peak heights vs spiked plasma concentrations was used to validate linear-
R = 4 min. T
R = 6 min. T
Figure 1. Chromatograms of a) plasma and b) urine analysis comparing control samples with spiked stan- dards. Arrows indicate time of injection for controls (left) and spiked standards (right), 3.7 ng of cimateroll mL of plasma and 10 pg of cimaterollmL of urine. RT = retention time.
by guest on July 10, 2011jas.fass.orgDownloaded from

CIMATEROL ANALYSIS AND PHARMACOKINETICS
Table 1. Regression parameters, coefficients of determination, and recoveries of the standard curves used to estimate cimaterol concentration
in plasma and urine
3815
Standard curvea ~~~~~ ~
Extraction, mL Plb f SE Boc f SE R2 Recovery f SE
Plasma 3 .05 f ,003 .27 f .28 .99 1 e9.+ f 1.22% 1 .18 f ,016 -2.40 f 2.12 .978 73Bd f 1.22% .25 .81 f ,033 8.51 f 3.01 .987 68.3* f 1.22%
Urine 10 14.66 f ,332 -.36 f .32 ,995 67.8 f 1.14%
&The independent variable waa peak height and area under the peak for plasma and urine
b ~ 1 = slope. analysis, respectively.
= intercept. P eMeans with superscripts that do not have a common superscript letter differ (P < .01).
ity in plasma samples, whereas area under the peak was found to be more appropriate for urine analysis. Standard curves for CIM quantitation were analyzed individually for each extraction volume. Plasma volumes of 3, 1, and .25 mL were used to estimate concentration ranges of 1 to 7, 5 to 35, and 20 to 140 ng/mL, respectively. Estimates for plasma concentrations of 5, 14.7, and 66.5 ng/ mL had standard errors of .08, .35, and 1.01 ng/mL, respectively. The standard error for an estimated urinary concentration of 4 pg/mL was .19 pg/mL. Results from the regression analyses, which in- clude regression parameters and their standard errors, coefficients of determination, and recover- ies are presented in Table 1. Intercepts (PO) were not different from zero (P > .1). The average recovery from spiked plasma standards was 70 f 1.2% (SEI and a significant difference (P < .Ol) was noted between the 1- and .25-mL plasma extrac- tions. The overall CV for plasma analysis was 5.1% (.Q to 15.3%) over a concentration range of 1 to 30 ng/mL. The average recovery from spiked urine standards was 68 f 1.1%.
A two-compartment open model was deemed to be appropriate for pharmacokinetic analysis as determined by the ESTRIP program (Brown and Manno, 1978). Figure 2 shows the average time course of plasma concentration changes compared with the decay curve described by the computer- derived equation (inset). The high correlation Cr = .997) between predicted and measured points indicates that the two-compartment open model adequately described the time-dependent changes in plasma CIM levels. Cumulative urinary excre- tion of CIM was obtained by summing the products or urine CIM concentration and volume. Only 18.3% of the administered CIM was reco- vered in the urine after 8 h of collection (Table 2).
Pharmacokinetic parameters were calculated for each animal and the means and standard
errors are shown in Table 3. Equilibration between the two compartments was rapid as indicated by a distribution half-life (t of approximately 2.5 min. Cimaterol disposition within the body is described by the transfer rate constants that show that fractional entrance into the larger second pool (k12 G .18/min) is three times greater than back diffusion a(21 G .054/min). Volumes of 1,130 and 210 L were estimated for the peripheral and central compartments, respectively. The mean elimination half-life (tl/2p1 for CIM in these steers was 54 min.
100 7
Y = 62.4e + 10.6e
0 20 40 60 80 100 120 140 160 180 200
Time post injection (mid
Figure 2. Semilogarithmic plot of the mean cimaterol concentration (n = 4) in plasma vs time after a single i.v. administration of 15 mg of cimaterol. The drawn curve represents the best fit described by the biex- ponential equation [inset) conferring two-compartment model characteristics.
by guest on July 10, 2011jas.fass.orgDownloaded from

3816 BYREM
Table 2. Cimaterol content in urine of steers after an intravenous bolus injection
of 15 milligrams of cimaterol
Time, Concentration, Cumulative h M/mL SE excretion, mg 1.5 5.14 .SO 1.02 3.0 3.01 1.50 2.02 5.0 .77 .28 2.48 8.0 .39 .18 2.74
Discussion
Methods for quantifying Pa-adrenergic agonists in biological tissues are scarce. Therefore, est& mates of circulating Pzadrenergic agonist concen- trations in treated meat animal species have not been reported. Anton and Sayre (1962) developed the most commonly used procedure for extracting and concentrating the naturally occurring catecholamines from biological fluids. Adsorption and desorption from alumina in media of various pH is the basis for their procedure. In another study, Iwamoto et al. (1987) determined more specifically that under mild alkaline conditions the rn-hydroxyl and carboxyl groups of catechola- mines and their metabolites become ionized, in- creasing their affinity for alumina. After washing the alumina, catecholamines are concentrated into small volumes of acidic media and separated using HPLC.
Figure 3 compares the chemical structure of an endogenous catecholamine, epinephrine, and CIM and demonstrates that in CIM the two vicinal phenolic hydroxyl groups have been replaced with functional groups that are electrically neutral under alkaline conditions. Similarly, the addi-
Table 3. Pharmacokinetic parameters
ET AL.
tional hydrophobic methyl groups on the amino end of CIM make this compound nonpolar under alkaline conditions and polar under acidic condi- tions. Therefore, under alkaline conditions, ad- sorption and desorption of CIM must take place in or on a nonpolar support rather than a polar support such as alumina.
There are HPLC with electrochemical detection procedures available for the naturally occurring catecholamines (Hjemdahl et al., 19791, but elec- trochemical detection is not suitable for their synthetic analogs because of the excessive poten- tial required to oxidize them (G. Maylin, personal communication). Forster et al. (1988) were able to measure plasma levels of clenbuterol as low as 15 pg/mL using capillary gas chromatography/mass spectrometry, but the cost and availability of apparatus limits application of this procedure. Our procedure can be used to measure whole blood concentrations of CIM as low as 1 ng/mL; the limit for urine detection was not addressed. This level of sensitivity, although much less than those of the procedures above, seems near m a x imal for the HPLC/UV detection of adrenergic related compounds in biological fluids (Eddins et al., 1985; Achari et al., 1988) and is adequate for pharmacokinetic studies.
Eddins et al. (19851, using a similar procedure, obtained a detectable limit of 2 ng/mL with 85% recovery in their assay for clenbuterol in urine. Our recoveries were lower; however, sensitivity and reliability were comparable. The similarity between whole blood and urine recoveries in the present study highlights both the range in abso- lute amounts of CIM (nanograms to micrograms) and the range in sample composition that can be accommodated by the ChemElut columns. The difference in recoveries between the 1- and .25-mL plasma extractions is difficult to explain. However,
describing the disposition of cimaterol in steers after administration of a single intraGenous dose
Kinetic Mean parameter Definition (units) (n = 4) SE
c: A a t1/2(d B
Initial concentration, ng/mL Distribution intercept, ng/mL Distribution rate constant, min-' Distribution half-life, min Elimination intercept, ng/mL Elimination rate constant, min-' Elimination half-life, min First-order transfer constant, compartment 1 + 2, min-l First-order transfer constant, compartment 2 1, min-l First-order elimination rate constant, min-' Central compartment volume, L k g Volume of distribution, L/kg Body clearance, mL . kg-' . min-'
73.3 82.4
2.5 10.7
54.4
.29
.014
.177
.OS4
.075
.76 4.1 1 54.8
10.5 0.1
.04
.32 1 .58 .002
9.1 .02 .o 1 .01 .05 .37 6.0
by guest on July 10, 2011jas.fass.orgDownloaded from
CIMATEROL ANALYSIS AND PHARMACOKINETICS 3817
HO
EPINEPHRINE + / CH-CH,-NH,-CH,
N E C
Figure 3. Chemical structures of (a) epinephrine and (b) cimaterol.
the variability of extraction was not different between sample volumes and individual standard curves were used for quantification. The success of the assay with both plasma and urine measure- ments indicates that this procedure may also be applicable for estimating CIM levels in tissue samples.
Plasma decay curves for CIM were best described by a two-compartment open model. Biexponential fits are superior for the endogenous catecholamines (Rosen et al., 19891, the P2-adrener- gic agonists isoproterenol [Kadar et al., 19741 and terbutaline (Madsen and Ribel, 10811, and the p- antagonist esmolol [Achari et al., 19881, indicating that this model may universally describe the kinetics of adrenergic-like compounds. For epinephrine, the volume of the central compart- ment was nearly equivalent to the vascular space [Rosen et al., 1989). Estimates of these parameters for synthetic pradrenergic . agonists are much larger and cannot be associated with true physio- logical compartments. In the present study, volumes of .76 and 4.1 L/kg were obtained for the central and peripheral compartments, respec- tively. Similar estimates have been observed for most synthetic P2-adrenergic agonists including terbutaline (Madsen and Ribel, 198 11, clenbuterol (Schmid et al., 19881, and procaterol (Ishigami et al., 1979) in various species.
Distribution volumes in excess of the total water space indicate the accumulation of a given com- pound somewhere within the periphery or specific binding to biological material (Ritschel, 19821. The former possibility includes highly lipophilic or- ganic bases that are readily capable of diffusing across biological membranes at physiological pH (Baggot, 19771. Such compounds may be accumu- lated in acidic environments, relative to the plasma, according to the pH-partition hypothesis.
1.01 r 55
44 --. 0, C v
33 2
22 m
B a
a I
.- E 0
5 m 11
v
0 0 20 40 60 80 100 120 140 160 180
Time post injection (min)
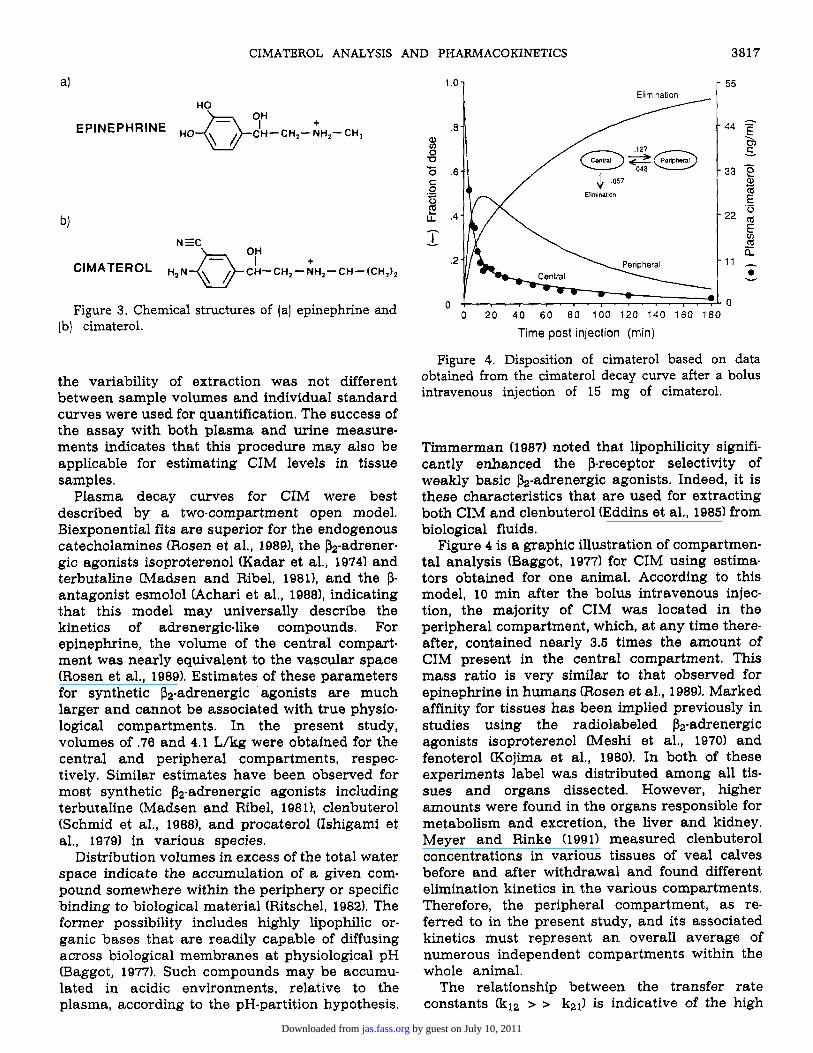
Figure 4. Disposition of cimaterol based on data obtained from the cimaterol decay curve after a bolus intravenous injection of 15 mg of cimaterol.
Timmerman 11 987) noted that lipophilicity signifi- cantly enhanced the P-receptor selectivity of weakly basic j3z-adrenergic agonists. Indeed, it is these characteristics that are used for extracting both CIM and clenbuterol (Eddins et al., 1985) from biological fluids.
Figure 4 is a graphic illustration of compartmen- tal analysis (Baggot, 1977) for CIM using estima- tors obtained for one animal. According to this model, 10 min after the bolus intravenous injec- tion, the majority of CIM was located in the peripheral compartment, which, at any time there- after, contained nearly 3.5 times the amount of CIM present in the central compartment. This mass ratio is very similar to that observed for epinephrine in humans (Rosen et al., 19891. Marked affinity for tissues has been implied previously in studies using the radiolabeled P2-adrenergic agonists isoproterenol [Meshi et al., 19701 and fenoterol (Kojima et al., 1980). In both of these experiments label was distributed among all tis- sues and organs dissected. However, higher amounts were found in the organs responsible for metabolism and excretion, the liver and kidney. Meyer and Rinke (1991) measured clenbuterol concentrations in various tissues of veal calves before and after withdrawal and found different elimination kinetics in the various compartments. Therefore, the peripheral compartment, as re- ferred to in the present study, and its associated kinetics must represent a n overall average of numerous independent compartments within the whole animal.
The relationship between the transfer rate constants (k12 > > kzl) is indicative of the high
by guest on July 10, 2011jas.fass.orgDownloaded from

3818 BYREM
affinity for CIM in the peripheral compartment. In general, the initial rate of transfer of Pz-adrenergic agonists from the central to the peripheral com- partment is greater than the reverse, resulting in larger peripheral masses, but the magnitude varies widely and depends on the agonist and species in question flshigami et al., 1979; Madsen and Ribel, 1981; Rosen et al., 19891. Given the differences in efficacy of various P2-adrenergic agonists for nutrient repartitioning, both within and between species, the function of these two different drug pools and their relation with tissue growth become intriguing questions.
Metabolism and elimination vary among the P2- adrenergic agonists developed for therapeutic use and between species. In rats, biological half-lives vary from 2 h for fenoterol (Rominger and Pollmann, 1972) to 24 h for clenbuterol (Kopitar and Zimmer, 1976). The half-life of isoproterenol in cats ranged between 58 and 77 min (Kadar et al., 19781, whereas in humans the value was closer to 7 h (Kadar et al., 1974). Clenbuterol clearance occurs predominantly via the urine, mainly as the un- changed parent compound (Kopitar and Zimmer, 19761, whereas isoproterenol is largely metabolized before excretion. The parent compound represented only 3% of the total activity excreted in the urine of children after a single intravenous administration of 7-3H-isoproterenol (Kadar et al., 1974). The model depicted in Figure 4 shows that the elimination of CIM is 90% complete 3 h after administration, yet only 20% or approximately 3 mg was recovered in urine during this time (Table 2). Additional studies would be necessary to determine whether the remainder exists in a third, more tightly bound, pool or as metabolite(s1 ex- creted in the urine. However, it is assumed that metabolism and urinary excretion is the most likely situation because two-pool kinetics are extensively associated with Pz-adrenergic agonists and enterohepatic recycling and fecal excretion have rarely been associated with the elimination of P2-adrenergic agonists (Hengstmann, 19761. The consistent presence of an unidentified peak (RT = 9 min) in the plasma chromatograms (unpublished data) after CIM administration to steers, but not in those from spiked whole blood, also lends support to this assumption.
The apparent metabolism and relatively short half-life (1 hl of CIM in growing steers may provide an explanation for the lower effectiveness of CIM than that of clenbuterol in growth trials examining the repartitioning effects of these Pz-adrenergic agonists (Hovel1 et al., 1989; Warriss et al., 1989). The short half-life of orally administered CIM necessitates more frequent dosing to maintain steady state concentrations. Other pharmacologi- cal characteristics would also need to be consid-
ET AL.
ered when comparing efficacy among the most commonly used P2-adrenergic agonists under cur- rent investigation.
Implications
The pharmacokinetic parameters estimated in the present study are required to design strategies capable of determining and maintaining max- imally effective circulating concentrations of cimaterol in growing steers. Subsequent studies should be directed toward identifying specific pools and associated kinetics within the compart- ments characterized here. The extent to which these specific pools influence the ability of cimaterol and other P2-adrenergic agonists to repartition nutrient use for tissue growth remains to be determined. By identifying the relationships between pharmacokinetic parameters and specific response variables, the mode of action and poten- tial applications of Pz-adrenergic agonists in grow- ing animals can more clearly be defined.
Literature Cited
Achari, R., D. Drissel, D. Thomas, K. Shin, and Z. Look. 1988. Analysis of esmolol in human blood by high-performance liquid chromatography and its application to pharmacoki- netic studies. J. Chromatogr. 424:430.
Allen, P., J. F. Quirke, and P. V. Tarrant. 1987. Effects of cimaterol on the growth, food efficiency and carcass qual- ity of friesian cattle. In: J. P. Hanrahan (Ed.] Beta-Agonists and Their Effects on Animal Growth and Carcass Quality. pp 83-92. Elsevier Applied Science Publishers Ltd, Essex, U.K.
Anton, A. H., and D. F. Sayre. 1062. A study of the factors affecting the aluminum oxide-trihydroxyindole procedure for the analysis of catecholamines. J. Pharmacol. Exp. Ther. 138:380.
Baggot, J. D. 1977. Principles of Drug Disposition in Domestic Animals. W. B. Saunders, Philadelphia, PA.
Baker, P. K., R. H. Dalrymple, D. L. Ingle, and C. A. Ricks. 1984. Use of a &-adrenergic agonist to alter muscle and fat deposition in lambs. J. h i m . Sci. 59:1258.
Beermann, D. H., W. R. Butler, D. E. Hogue, V. K. Fishell, R. H. Dalrymple, C. A. Ricks, and C. G. Scanes. 1987. Cimaterol- induced muscle hypertrophy and altered endocrine status in lambs. J. Anim. Sci. 65:1514.
Beermann, D. H., D. E. Hogue, V. K. Fishell, R. H. Dalrymple, and C. A. Ricks. 1986. Effects of cimaterol and fishmeal on performance, carcass characteristics and skeletal muscle growth in lambs. J. Anim. Sci. 62:370.
Bergen, W. G., S. E. Johnson, D. M. Skjaerlund, A. S. Babiker, N. K. Ames, R. A. Merkel, and D. B. Anderson. 1989. Muscle protein metabolism in finishing pigs fed ractopamine. J. Anim. Sci. 872255.
Boisclair, Y. R. 1991. Effect of exogenous administration of bovine somatotropin on protein turnover and nutrient utili- zation in the hindlimb of growing cattle. Ph.D. Dissertation. Cornel1 Univ., Ithaca, NY.
Brown, R. D., and J. E. Manno. 1978. ESTRIP, a basic computer program for obtaining initial polyexponential parameter estimates. J. Pharm. Sci. 87:1687.
by guest on July 10, 2011jas.fass.orgDownloaded from
CJMATEROL ANALYSIS AND PHARMACOKINETICS 3819
Claeys, M. C., D. R. Mulvaney, F. D. McCarthy, M. T. Gore, D. N. Marple, and J. L. Sartin. 1989. Skeletal muscle protein synthesis and growth hormone secretion in young lambs treated with clenbuterol. J. Anim. Sci. 67:2245.
Dalrymple, R. H., P. K. Baker, P. E. Gingher, D. L. Ingle, J. M. Pensack, and C. A. Ricks. 1984. A repartitioning agent to improve performance and carcass composition of broilers. Poult. Sci. 63:2376.
Duquette, P. F., E. L. Rickes, G. Olsen, T. P. Capizzi, and E. M. Convey. 1987. Growth and carcass composition of broilers fed beta-adrenergic agonist L-640,033. In: J. P. Hanrahan (Ed.] Beta-Agonists and Their Effects on Animal Growth and Carcass Quality. pp 173-177. Elsevier Applied Science Publishers Ltd, Essex, U.K.
Eddins, C., J. Hamann, and K. Johnson. 1985. HPLC analysis of clenbuterol, a beta-adrenergic drug, in equine urine. J. Chromatogr. Sci. 23:308.
Eriksson, H., W. Hellstrom, and A. Ryrfeldt. 1975. The biliary excretion of 3H-inulin and 3H-terbutaline in the unanesthe- tized rat. Acta Physiol. Scand. 95:l.
Forster, H. J., K. L. Rominger, E. Ecker, H. Peil, and A. Wittrock. 1988. Quantitation of clenbuterol in biological fluids using ammonia CI and automated capillary GCMS. Biomed. En- viron. Mass Spectrom. 17:417.
Gill, J. L. 1978. Design and Analysis of Experiments in the Animal and Medical Sciences mol. 11. The Iowa State University Press, Ames.
Hengstmann, J. 1976. Metabolic pattern and pharmacokinetic properties of phenolic sympathomimetic amines. Arzneim.- Forsch. 26:1251.
Hjemdahl, P., M. Daleskog, and T. Kahan. 1979. Determination of plasma catechnolamines by high performance liquid chromatography with electrochemical detection Compari- son with a radioenzymatic method. Life Sci. 25:131.
Hovell, F. D. DeB., D. J. Kyle, P. J. Reeds, and D. H. Beermann. 1989. The effect of clenbuterol and cimaterol on the e n dogenous nitrogen loss of sheep. Nutr. Rep. Int. 39:1177.
Ishigami, M., K. Saburomaru, K. Niino, S. Morita, G. Miyamoto, and H. Kohri. 1979. Pharmacokinetics of procaterol in the rat, rabbit and beagle dog. Arzneim.-Forsch. 29:268.
Iwamoto, T., M. Yoshiura, and K. Inyama. 1987. Liquid chro- matographic identification of urinary catecholamine metabolites adsorbed on alumina. J. Liq. Chromatogr. 10:
Jones, R. W., R. A. Easter, F. K. McKeith, R. H. Dalrymple, H. M. Maddock, and P. J. Bechtel. 1985. Effect of the pz-adrener- gic agonist Cimaterol (CL 263,780) on the growth and car- cass characteristics of finishing swine. J. Anim. Sci. 61:905.
Kadar, D., A. J. Lovrics, and L. Endrenyi. 1978. The fate of 17- 3Hlisoproterenol in cats after intravenous administration. Drug Metab. Dispos. 6:476.
Kadar, D., H. Y. Tang, and A. W. Conn. 1974. Isoproterenol metabolism in children after intravenous administration. Clin. Pharmacol. "her. 16:789.
Kim, Y. S., Y. B. Lee, W. N. Garrett, and R. H. Dalrymple. 1989. Effects of cimaterol on nitrogen retention and energy utili- zation in lambs. J. Anim. Sci. 67:674.
Kojima, S., M. Otani, and A. Kubodera. 1980. Studies on the absorption, distribution, metabolism and excretion of 1-(3,5-dihydroxyphenly)-l -hydroxy-244-hydroxyphenly)- isopropylaminol-ethane hydrobromide (Th 1 165 a, Fenoterol Hydrobromide) in mice. Arzneim.-Forsch. 30:959.
1217.
Kopitar, V. Z., and A. Zimmer. 1976. Pharmakokinetik und metabolitenmuster von clenbuterol bei der ratte. Arzneim.- Forsch. 28: 1435.
Liu, C. Y., J. L. Boyer, and S. E. Mills. 1989. Acute effects of beta adrenergic agonists of porcine adipocyte metabolism in vitro. J. h i m . Sci. 67:2030.
MacRae, J. C., P. A. Skene, A. Connell, V. Buchan, and G. E. Lobley. 1988. The action of the Pagonist clenbuterol on protein and energy metabolism in fattening wether lambs. Br. J. Nutr. 59:457.
Madsen, S. M., and U. Ribel. 1981. Pharmacokinetics of terbuta line and theophylline in guinea pigs when administered simultaneously. Acta Pharmacol. Toxicol. 48:13.
Merkel, R. A,, P. S. Dickerson, S. E. Johnson, R. J. Burkett, R. J. Burnett, A. L. Schroeder, W. G. Bergen, and D. B. Ander- son. 1987. The effects of ractopamine on lipid metabolism in pigs. Fed. Roc. 48:1177 (Abstr.1.
Meshi, T., M. Otsuka, and Y. Sato. 1970. Distribution, excretion and metabolism of trimetoquinol. Biochem. Pharmacol. 19: 2937.
Meyer, H.H.D., and L. Rinke. 1991. The pharmacokinetics and residues of clenbuterol in veal calves. J. Anim. Sci. 69:4538.
NRC. 1984. Nutrient Requirements of Beef Cattle (0th Ed.). Na- tional Academy Press, Washington, DC.
O'Connor, R. M., W. R. Butler, K. D. Finnerty, D. E. Hogue, and D. H. Beermann. 1991. Acute and chronic hormone and metabolite changes in lambs fed the beta-agonist, cimaterol. Domest. Anim. Endocrinol. 8(4):537.
Ricks, C. A., R. H. Dalrymple, P. K. Baker, and D. L. Ingle. 1984. Use of a pa-adrenergic agonist to alter fat and muscle deposition in steers. J. Anim. Sci. 59:1247.
Rikhardsson, G., K. A. Johnson, and D. E. Johnson. 1991. Effects of cimaterol on energetics and carcass characteristics of suffolk ewe lambs. J. Anim. Sci. 69:396.
Ritschel, W. A. 1982. Handbook of Basic Pharmacokinetics (2nd Ed.). Drug Intelligence Publications, Hamilton, IL.
Rominger, K. L., and W. Pollmann. 1972. Vergleichende phar. makokinetik von fenoterol hydrobromid bei ratte, hund und mensch. Arzneim.-Forsch. 22:1190.
Rosen, S. G., 0. A. Linares, J. A. Sanfield, L. A. Zech, V. P. Lizzio, and J. B. Halter. 1989. Epinephrine kinetics in hu- mans: radiotracer methodology. J. Clin. Endocrinol. & Metab. 69:753.
Schmid, J., A. Bucheler, and K. Thomae. 1988. A rapid liquid- solid extraction procedure for the quantification of clen- buterol in urine. Biomed. Environ. Mass Spectrom. 17:413.
Tess, M. W., G. E. Dickerson, J. A. Nienaber, J. T. Yen, and C. L. Ferrell. 1984. Energy costs of protein and fat deposition in pigs fed ad libitum. J. Anim. Sci. 58:111.
Timmerman, T. 1987. &Adrenergic; physiology, pharmacology, applications, structures and structure-activity relation- ships. In: J. P. Hanrahan (Ed.) Beta-Agonists and Their Effects on Animal Growth and Carcass Quality. pp 13-28. Elsevier Applied Science Publishers Ltd, Essex, U.K.
Wallace, D. H., H. B. Hedrick, R. L. Seward, C. P. Daurio, andE. M. Convey. 1987. Growth and efficiency of feed utilization of swine fed a bete-adrenergic agonist (L-644,969). In: J. P. Hanrahan (Ed.] Beta-Agonists and Their Effects on Animal Growth and Carcass Quality. pp 143-151. Elsevier Applied Science Publishers Ltd, Essex, U.K.
Wamss, P. D., S. C. Kestin, and S. N. Brown. 1989. The effect of betaadrenergic agonists of carcass and meat quality in sheep. Anim. Prod. 48:385.
by guest on July 10, 2011jas.fass.orgDownloaded from
Copyright © 2022 FDOKUMEN