Genetic parameters for growth and carcass traits of Brahman steers
25
T. Smith, J. D. Domingue, J. C. Paschal, D. E. Franke, T. D. Bidner and G. Whipple Genetic parameters for growth and carcass traits of Brahman steers published online March 5, 2007 J ANIM SCI http://jas.fass.org/content/early/2007/03/05/jas.2006-653.citation the World Wide Web at: The online version of this article, along with updated information and services, is located on www.asas.org by guest on May 18, 2011 jas.fass.org Downloaded from
Transcript of Genetic parameters for growth and carcass traits of Brahman steers

T. Smith, J. D. Domingue, J. C. Paschal, D. E. Franke, T. D. Bidner and G. WhippleGenetic parameters for growth and carcass traits of Brahman steers
published online March 5, 2007J ANIM SCI
http://jas.fass.org/content/early/2007/03/05/jas.2006-653.citationthe World Wide Web at:
The online version of this article, along with updated information and services, is located on
www.asas.org
by guest on May 18, 2011jas.fass.orgDownloaded from
Running Head: Genetic parameters for Brahman steers 123
Genetic parameters for growth and carcass traits of Brahman steers1,2 45
T. Smith*3, J. D. Domingue†, J. C. Paschal‡, 6D. E. Franke†, T. D. Bidner†, and G. Whipple§ 7
8*University of Louisiana at Monroe, †LSU Agricultural Center, Baton Rouge, ‡Texas A&M 9
Research and Extension Center, Corpus Christi, and §Woodland Mills, TN. 1011
12
13
14
15
16
17
18
19
20
21
22
1Approved for publication by the Director of the Louisiana Agric. Exp. Stn. as Manuscript No. 23
06-18-0301. 24
2Acknowledgement: The authors thank Manual A. Persica III, and John T. Carothers, Research 25
Associates in the Department of Animal Sciences, for assistance in preparing, aging, and cooking 26
steaks and in obtaining shear force data for this project. 27
3Correspondence: phone 318-342-1785; fax 318-342-1779; email: [email protected]. 28
Page 1 of 23 Journal of Animal Science
Published Online First on March 5, 2007 as doi:10.2527/jas.2006-653 by guest on May 18, 2011jas.fass.orgDownloaded from
2
ABSTRACT: Spring born purebred Brahman bull calves (n = 467) with known pedigrees and 29
sired by 68 bulls in 17 private herds in Louisiana were purchased at weaning from 1996 through 30
2000 to study variation in growth, carcass, and tenderness traits. After purchase, calves were 31
processed for stocker grazing on ryegrass, fed in a south Texas feedlot, and processed in a 32
commercial facility. Carcass data were recorded 24 hr postmortem. Muscle samples and primal 33
ribs were taken to measure calpastatin activity and shear force. An animal model was used to 34
estimate heritability, genetic correlations, and sire EPD. Relatively high heritability estimates 35
were found for BW at slaughter (0.59 ± 0.16), hot carcass weight (0.57 ± 0.15), longissimus 36
muscle area (0.50 ± 0.16), yield grade (0.46 ± 0.17), calpastatin enzyme activity (0.45 ± 0.17), 37
and carcass quality grade (0.42 ± 0.16); moderate heritability estimates were found for hump 38
height (0.38 ± 0.16), marbling score (0.37 ± 0.16), fat thickness (0.36 ± 0.17), feedlot ADG (0.33 39
± 0.14), 7-d shear force (0.29 ± 0.14); and 14-d shear force (0.20 ± 0.11); relatively low 40
heritability estimates were found for skeletal maturity (0.10 ± 0.10), lean maturity (0.00 ± 0.07) 41
and percent kidney, pelvic, and heart fat (0.00 ± 0.07). Most genetic correlations were between -42
0.50 and +0.50. Other genetic correlations were 0.74 ± 0.27 between calpastatin activity and 7-d 43
shear force, 0.72 ± 0.25 between calpastatin activity and 14-d shear force, -0.90 ± 0.30 between 44
yield grade and 7-d shear force, and -0.82 ± 0.27 between fat thickness and 7-d shear force. 45
Heritability estimates and genetic correlations for most traits were similar to estimates reported 46
in the literature. Sire EPD ranges for carcass traits approached those reported for sires in other 47
breeds. The magnitude of heritability estimates suggests that improvement in carcass yield, 48
carcass quality, and consumer acceptance traits can be made within the Brahman population. 49
KeyWords: Brahman steers, carcass traits, genetic parameters. 50
51
Page 2 of 23Journal of Animal Science
by guest on May 18, 2011jas.fass.orgDownloaded from

3
INTRODUCTION 52
The Brahman is the most common tropically adapted breed in the Gulf Coast Region. 53
Many commercial cow-calf producers in the region use Brahman crossbred cows in their herds 54
because of their reproductive and maternal advantages. However, Damon et al. (1960), DeRouen 55
et al. (1992), and Wheeler et al. (2001) reported that meat from Brahman cattle is less tender than 56
meat from non-Brahman cattle. Also, Luckett et al. (1975), Johnson et al. (1990) and O'Conner 57
et al. (1997) reported that shear force of meat increased as the percentage of Bos indicus 58
inheritance increased in crossbreds. Additionally, Damon et al. (1960), Wheeler et al. (2001) and 59
DeRouen et al. (2002) reported that carcasses of Brahman steers had lower marbling scores than 60
non-Brahman steers, resulting in lower carcass quality grades. 61
With the emphasis being placed on carcass and tenderness traits in the beef cattle industry 62
today, obtaining information on heritabilities and genetic correlations of these traits is necessary 63
in order to design a scheme to improve purebred Brahman cattle. Most reviews of genetic 64
parameters for carcass traits have been from Bos taurus cattle (Marshall, 1994; Koots et al., 65
1994; Utrera and Van Vleck, 2006). Crews and Franke (1998), Elzo et al. (1998), and Riley et al. 66
(2002; 2003) published genetic parameters for carcass traits of Brahman and Brahman crossbred 67
cattle. Johnston et al. (2003) reported slightly higher heritability estimates for shear force of 68
tropically adapted breeds in Australia than for temperate breeds. 69
In order to learn more about genetic variation in the Brahman breed, the objective of this 70
study was to gain additional information about heritabilities and genetic correlations for 71
postweaning growth, carcass, and tenderness traits in purebred Brahman steers and to predict 72
EPD of sires represented in the sample of steers. 73
Page 3 of 23 Journal of Animal Science
by guest on May 18, 2011jas.fass.orgDownloaded from
4
MATERIALS AND METHODS 74
Paternal half-sib Brahman male calves (n = 467) sired by 68 bulls were purchased from 75
17 purebred Brahman breeders in Louisiana over five yr (1996 to 2000). Calves were spring 76
born, weaned in the fall, and transported from breeders’ farms to the LSU Agricultural Center 77
Central Station (AGCCS) in Baton Rouge. Owners of these Brahman herds indicated their sires 78
were selected on the basis of some combination of weight at 12 or 24 mo of age, muscle 79
thickness, breed character, parental or individual show ring performance, or pedigree. None of 80
the producers considered carcass merit in sire selection. Most bull calves purchased from 81
producers were average or above for weaning weight in that herd-year group. The LSU 82
Agricultural Center Animal Use and Care Committee approved managerial aspects of this 83
research. 84
Management 85
Calves were castrated, dehorned if necessary, given appropriate vaccinations and 86
dewormed within two wk after arrival at the AGCCS. Each calf was assigned an identification 87
number for data collection and for association with its ancestral pedigree. After processing, 88
calves were placed on regrowth common bermudagrass (Cynadon dactylon) pastures with 2.3 kg 89
of a high roughage corn based diet (12% total protein) per head*d-1. Bermudagrass hay was 90
available at all times. Calves were placed on ryegrass pasture (Lolium multiflorum) about 91
December 1 each year, stocked at approximately 730 kg of calf per ha, and grazed for an annual 92
average of 120 d. Steers were implanted with Synovex before placement on ryegrass the first 93
yr and with Ralgro the remaining four yr. Upon completion of the grazing period steers were 94
shipped to a feedlot in south Texas for finishing. 95
Feedlot and Slaughter 96
Page 4 of 23Journal of Animal Science
by guest on May 18, 2011jas.fass.orgDownloaded from
5
Steers were weighed upon arrival at the feedlot, implanted with Ralgro, and placed in one 97
pen for feeding. Steers were harvested in two or three groups each yr. When a group of steers in 98
the pen reached an estimated average of 7 to 10 mm fat thickness and a BW of 500 to 570 kg, 99
that group was harvested. Time of harvest for each group was visually estimated by trained 100
feedlot personnel. Steers were fed an average of 148 d in the feedlot over the 5 yr. Steers were 101
processed at Sam Kane Beef Processors in Corpus Christi, TX at an average age of 545 d. 102
Carcasses were electrically stimulated with high voltage during the slaughter process. After a 24-103
hr chill, carcasses were ribbed and carcass data recorded. A 15-g longissimus muscle sample was 104
collected at this time for measurement of calpastatin enzyme activity. Calpastatin activity was 105
determined at Central Community College in Hastings, NE, following the procedures of Whipple 106
et al. (1990a) and Shackelford et al. (1994). Calpastatin activity was not measured the last year 107
of the study. 108
Cooking and Shear Force Measurements 109
A boneless wholesale rib (#112; NAMP, 1997) was obtained from the right side of each 110
carcass at the time the carcasses were processed. The ribs were transported by refrigerated truck 111
to the Louisiana State University Animal Sciences Department Meats Laboratory. Two 2.54-cm 112
thick steaks were cut from the small end of each rib section, trimmed of outside fat and 113
connective tissue, vacuum packaged, and randomly assigned to aging for 7- or 14-d, 114
respectively. After the steaks were aged the appropriate time at 4°C they were frozen at -20°C. 115
When steaks from all steers had been aged and frozen, steaks were thawed for 24 h at 4°C and 116
then broiled to an internal temperature of 70°C (medium doneness) on a Farberware Open-117
Hearth Broiler (Model FSR200; Faberware Co., Bronx, NY). Internal temperatures were 118
monitored by 30-ga., type-T constantan-copper thermocouple connected to a strip chart recorder 119
Page 5 of 23 Journal of Animal Science
by guest on May 18, 2011jas.fass.orgDownloaded from
6
(Honeywell, Inc., Fort Washington, PA). Steaks were turned once at about 35°C and removed at 120
70°C. After steaks were held for 24 hr at 4°C, six 1.27-cm cores were removed from each steak 121
parallel to the orientation of the muscle fibers. Cores were sheared with a Model 4501 Instron 122
Universal Testing Machine (Instron Corp., Canton, MA) equipped with a Warner-Bratzler V-123
blade shearing attachment with a cross-head speed of 100 mm/min. The average of the six shear 124
force measurements on each steak was used as the shear force observation for each steer. This 125
procedure follows guidelines established by the American Meat Science Association (AMSA, 126
1995). 127
Statistical Analysis 128
The Multiple Trait Derivative Free Restricted Maximum Likelihood (MTDFREML) 129
programs of Boldman et al. (1995) were used to estimate heritability, genetic correlations 130
between all traits, and sire EPD. The MIXED procedure of SAS (SAS Inst. Inc., Cary, NC) was 131
used to obtain starting additive genetic and residual variances for MTDFREML. Proc MIXED 132
included sire as a random effect, and contemporary group (yr x harvest group) and the linear 133
covariate of slaughter age as fixed effects. Sires were confounded with herd, however herd was 134
not a significant source of variation in early analyses. Artificial insemination was not used across 135
the private herds. Connectedness across herds was assumed to occur through the numerator 136
relationship matrix, A, used in the animal model (Kennedy and Trus, 1993). The fact that all 137
herds were located in Louisiana and that breeders often exchanged germplasm most likely 138
improved this assumption. 139
Four-generation pedigrees were available for all steers. A total of 2,155 animals 140
contributed information to the A matrix. Heritabilities and sire breeding values were estimated 141
with single-trait analyses in MTDFREML while two-trait analyses in MTDFREML were used to 142
Page 6 of 23Journal of Animal Science
by guest on May 18, 2011jas.fass.orgDownloaded from
7
estimate phenotypic and genetic correlations. To obtain estimates of SE for the two-trait 143
analyses, the data were edited to include only steers that had observations for those two traits. 144
Analyses were run initially at a convergence of 10-6 and then rerun to a convergence of 145
the simplex of 10-9. Cold restarts were made to insure the global maximum was reached. This 146
was assumed when the -2(log likelihood) did not change to the second decimal place. Variances 147
and co-variances obtained from the analyses were assumed to be based on a constant age at 148
slaughter endpoint. Slaughter age was used to adjust for the range of birth dates in the calves. 149
Contemporary groups were determined by the year and group in which each steer was harvested. 150
Thirteen contemporary groups were involved in the study with an average of 33 steers per group. 151
Response variables based on objective observations included feedlot ADG, BW at 152
slaughter, hot carcass weight, fat thickness, longissimus muscle area, quality grade, yield grade, 153
calpastatin enzyme activity, shear force after 7- and 14-d aging, and hump height. Skeletal and 154
lean maturity, percent kidney, pelvic and heart fat, and marbling score data were visually 155
estimated at ribbing of carcasses. Yield grade was calculated from an equation from the meats 156
manual of Boggs and Merkel (1979). Subjective measurements were determined by the same 157
trained meats specialist all five yr of the study. Ribeye area was determined using a direct grid 158
reading. 159
RESULTS AND DISCUSSION 160
Performance and Carcass Data 161
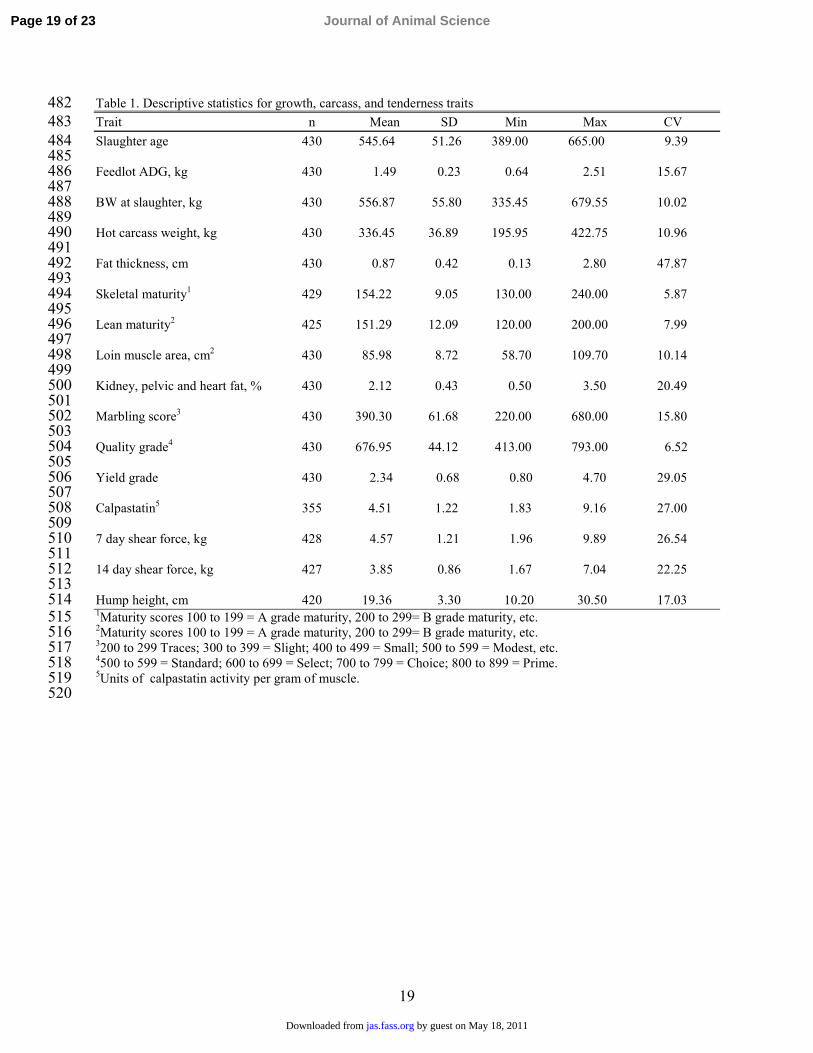
Descriptive statistics for growth, carcass, and tenderness traits are given in Table 1. A 162
total of 430 steers contributed data to most responses. Calpastatin activity was limited to 355 163
observations. Average BW at slaughter and fat thickness was within the range of criteria given 164
feedlot personnel for harvesting slaughter groups. Slaughter and carcass weights were slightly 165
Page 7 of 23 Journal of Animal Science
by guest on May 18, 2011jas.fass.orgDownloaded from

8
higher and fat thickness was slightly less than Brahman steers and heifers fed and harvested in 166
Florida (Riley et al., 2002). 167
Variance Components and Heritabilities 168
Heritability estimates for traits discussed in this study are presented in Table 2. High 169
heritability estimates (>0.40) were found for BW at slaughter, hot carcass weight, longissimus 170
muscle area, quality grade, yield grade, and calpastatin activity. Moderate estimates of 171
heritability (0.20 to 0.39) were obtained for feedlot ADG, fat thickness, marbling score, 7- and 172
14-d shear force, and hump height, while low estimates of heritability (<0.20) were found for 173
skeletal maturity, lean maturity, and percent kidney, pelvic and heart fat. 174
The estimate of heritability for feedlot ADG (0.33 ± 0.14) was similar to an estimate of 175
0.36 ± 0.09 reported by Gregory et al. (1995) for purebred and composite populations of cattle. 176
The estimates of heritability for BW at slaughter (0.59 ± 0.16) and hot carcass weight (0.57 ±177
0.15) were the highest in the study and were similar to mean estimates of 0.52 ± 0.14 and 0.45 ±178
0.12 reported by Koots et al. (1994) and estimates of 0.47 and 0.55 reported by Riley et al. 179
(2002). Utrera and Van Vleck (2006) reported a mean heritability of 0.42 for carcass weight 180
adjusted to a constant age. Lower estimates ranging from 0.15 ± 0.11 to 0.28 ± 0.08 were also 181
reported for these traits (Gregory et al., 1995; Wulf et al., 1996). 182
Our estimate of heritability for longissimus muscle area was 0.50 ± 0.16. This estimate is 183
lower but not different from estimates of 0.62, 0.65 ± 0.13, and 0.69 ± 0.14 reported by Van 184
Vleck et al. (1992) and Wheeler et al. (1996; 2001). Marshall (1994) and Koots et al. (1994) 185
reported mean estimates of 0.37 and 0.43, respectively for longissimus muscle area. Utrera and 186
Van Vleck (2006) reported a mean heritability estimate of 0.41 for longissimus muscle area from 187
36 estimates. 188
Page 8 of 23Journal of Animal Science
by guest on May 18, 2011jas.fass.orgDownloaded from

9
The heritability estimate for fat thickness was 0.36 ± 0.17. This estimate is larger than 189
the 0.25 ± 0.08 reported by Gregory et al. (1995) and smaller than those reported by Wheeler et 190
al. (1996; 2001) and Marshall (1994) (0.44 to 0.84 ± 0.14) and the estimate of 0.63 reported by 191
Riley et al. (2002). Utrera and Van Vleck (2006) reported a mean heritability estimate of 0.41 for 192
adjusted fat thickness on 36 estimates. 193
For marbling score, the heritability estimate of 0.37 ± 0.16 found in this study was lower 194
than the range of estimates (0.43 to 0.93 ± 0.02) reported for marbling score by several authors 195
(Van Vleck et al., 1992; Shackelford et al., 1994; Wheeler et al., 2001). Wulf et al. (1996) 196
reported a lower estimate at 0.16 ± 0.11. Riley et al. (2002) reported a heritability estimate for 197
marbling score on Brahman steers and heifers of 0.44. Marshall (1994) reported a mean estimate 198
of 0.35 on 9 estimates whereas Utrera and Van Vleck (2006) reported a mean heritability 199
estimate of 0.45 on 29 estimates. Estimates of heritability for carcass quality grade were limited. 200
Riley et al. (2002) reported a heritability estimate for carcass quality grade of 0.47 that is similar 201
to our estimate of 0.42 ± 0.16.202
The estimate of heritability for yield grade was 0.46 ± 0.17, which is lower than estimates 203
reported by Wheeler et al. (1996; 2001) (0.76 ± 0.13, 0.85 ± 0.14) and Wulf et al. (1996) (0.76 ±204
0.26). Estimates of heritability for skeletal and lean maturity were not different from zero (0.10 ±205
0.10 and 0.00 ± 0.08, respectively). No literature estimates were found for these comparisons. 206
All steers were classified as A-maturity, therefore genetic variation for maturity was relatively 207
small. 208
The heritability estimate for percent kidney, pelvic, and heart fat was not different from 209
zero (0.00 ± 0.08). Elzo et al. (1998) reported low estimates of heritability for percent kidney, 210
pelvic, and heart fat ranging from .01 to .14 in several groups of cattle. Moderate levels of 211
Page 9 of 23 Journal of Animal Science
by guest on May 18, 2011jas.fass.orgDownloaded from
10
heritability for percent kidney, pelvic, and heart fat (0.32 ± 0.12; 0.28 ± 0.12) were reported by 212
Wheeler et al. (1996; 2001). A relatively high mean estimate of heritability for percent kidney, 213
pelvic, and heart fat of 0.48 on 8 estimates was reported by Utrera and Van Vleck (2006). 214
Heritability estimates for percent kidney, pelvic, and heart fat from dissected carcasses may be 215
larger than when KPH is subjectively measured by carcass observation. 216
The heritability estimate for hump height in this study was 0.38 ± 0.16. Riley et al. 217
(2002) reported an estimate of 0.54 for purebred Brahman cattle. Sherbeck et al. (1996) found 218
that shear force increased as hump height in Brahman crossbred cattle increased. 219
Heritability for calpastatin activity was 0.45 ± 0.17 and slightly lower than estimates 220
reported by Wulf et al. (1996), Marshall (1994), and Shackelford et al. (1994) of 0.52 ± 0.21,221
0.70, and 0.65 ± 0.19, respectively. However, our estimate was higher than those reported by 222
O’Conner et al. (1997) and Riley et al. (2003), that were 0.15 ± 0.15 and 0.07 respectively. 223
Estimates of heritability for shear force after different aging times have been variable, 224
ranging from 0.06 to 0.37 (Wulf et al., 1996; O’Conner et al., 1997; Wheeler et al., 1996; Riley 225
et al., 2003). Crews and Franke (1998) found that heritability for shear force decreased (0.24 to 226
0.02) as Brahman breeding decreased. This is contrary to the report of Elzo et al. (1998) who 227
reported higher heritability estimates as percent Brahman decreased (0.17 to 0.58). The 228
estimates of heritability in this study for shear force at 7-d and 14-d of aging were 0.29 ± 0.14229
and 0.20 ± 0.11, respectively. These values are consistent with most of the reports in the 230
scientific literature. However, Shackelford et al. (1994) reported an estimate of 0.53 ± 0.15231
across groups of cattle. 232
Estimates of heritability for carcass and shear force traits were reported from temperate 233
and tropical breeds of cattle in Australia. Johnston et al. (2003) reported the heritability of shear 234
Page 10 of 23Journal of Animal Science
by guest on May 18, 2011jas.fass.orgDownloaded from

11
force was slightly larger for tropical breeds (0.30; Brahman, Belmont Red and Santa Gertrudis) 235
than for temperate breeds (0.09; Angus, Hereford, Murray Gray and Shorthorn). However, 236
Reverter et al. (2003) in a companion paper reported that heritability estimates for carcass traits 237
were similar for tropical and temperate breeds. 238
Ferguson et al. (2000) reported that electrical stimulation of carcasses prior to chilling 239
resulted in lower shear force and in lower calpastatin enzyme activity. We were not able to 240
determine the effect of electrical stimulation on shear force and calpastatin activity in these cattle 241
as all were electrical stimulated. It is not clear if electrical stimulation influenced the magnitude 242
of genetic parameters estimated for these traits. 243
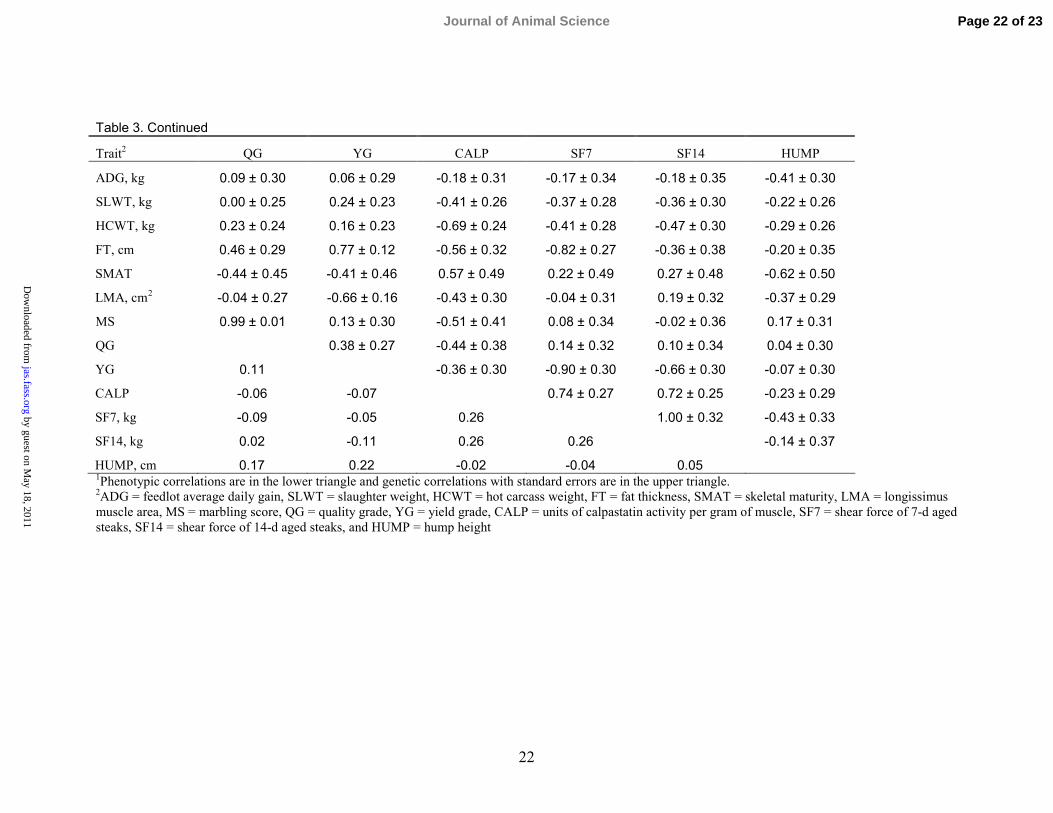
Phenotypic and Genetic Correlations 244
Phenotypic and genotypic correlations are given in Table 3. Most phenotypic 245
correlations were relatively small with values less than 0.30. Lean maturity and percent kidney, 246
pelvic, and heart fat were not included in the two-trait analyses because their estimated additive 247
genetic variance was zero. Feedlot ADG was positively correlated with BW at slaughter (0.67) 248
and hot carcass weight (0.61). Body weight at slaughter was also positively correlated (0.90) 249
with hot carcass weight. Longissimus muscle area was positively correlated with BW at 250
slaughter (0.31) and hot carcass weight (0.40). Yield grade was positively correlated with fat 251
thickness (0.79) and negatively correlated with longissimus muscle area (-0.49). Fatter carcasses 252
were associated with higher yield grades and smaller longissimus muscle areas. 253
Most genetic correlations were between -0.50 and +0.50. Standard errors associated with 254
the genetic correlations averaged 0.30 and ranged from 0.01 to 0.50. Genetic correlations 255
between feedlot ADG and BW at slaughter and ADG and hot carcass weight were 0.71 ± 0.15,256
and 0.56 ± 0.18, respectively. Hot carcass weight was also genetically correlated with 257
Page 11 of 23 Journal of Animal Science
by guest on May 18, 2011jas.fass.orgDownloaded from

12
longissimus muscle area (0.45 ± 0.19) and marbling score (0.51 ± 0.23). The genetic correlation 258
between yield grade and fat thickness was relatively high in this study (0.77 ± 0.12) but lower 259
than values reported by Wheeler et al. (1996; 2001) (0.86 ± 0.04 and 0.89 ± 0.03). Yield grade 260
was highly correlated genetically with longissimus muscle area (-0.66 ± 0.16). Wheeler et al. 261
(1996; 2001) reported large genetic correlations between yield grade and longissimus muscle 262
area (-0.79 ± 0.21; -0.72 ± 0.19). Marbling score was highly correlated (0.99 ± 0.02) genetically 263
with quality grade because marbling score is the main indicator of carcass quality grade. 264
Calpastatin enzyme activity was negatively correlated genetically with hot carcass weight 265
(-0.69 ± 0.24) but positively correlated with shear force after steaks were aged for 7- (0.74 ±266
0.28) and 14-d (0.72 ± 0.26). Whipple et al. (1990b) identified calpastatin activity as one 267
possible cause for the difference in tenderness between Bos indicus and Bos taurus crosses. 268
Whipple et al. (1990a) and Shackelford et al. (1991) found that calpastatin activity at 24 hr 269
postmortem was strongly associated with beef tenderness (r = 0.66 and 0.39, respectively). Other 270
researchers (Marshal, 1994; Shackelford et al., 1994; Wulf et al., 1996) reported high positive 271
correlations of 0.58 and 0.50 ± 0.22 between calpastatin enzyme activity and shear force. 272
Shear force at 7-d and 14-d of aging was negatively correlated genetically with yield 273
grade (-0.90 ± .30 and -0.66 ± 0.30, respectively). Wheeler et al. (2001) also found a negative 274
genetic correlation between shear force and yield grade at 7- (-0.50 ± 0.26) and 14-d (-0.41 ±275
0.28) of aging. Seven-day shear force was also negatively correlated with fat thickness at -0.82 ±276
0.27. Wheeler et al. (2001) also reported a negative genetic correlation (-0.41 ± 0.25). Shear 277
force has been known to be greater in carcasses with less fat thickness due to cold shortening 278
(Koohmaraie et al., 1996; King et al., 2003). Bidner et al. (1997) showed that removing the back 279
fat from carcasses resulted in faster cooling of the carcass, a higher pH, and a higher shear force. 280
Page 12 of 23Journal of Animal Science
by guest on May 18, 2011jas.fass.orgDownloaded from
13
We do not know if cold shortening is responsible for the high genetic correlation between fat 281
thickness and shear force in these data. The genetic correlations between 7-d shear force and 282
yield grade and 7-d shear force and fat thickness indicate that selection for improved tenderness 283
may be associated with increased fat thickness and low yielding carcasses. However, EPD of 284
approximately 30% of the sires with negative EPD for 7-d shear force were associated with 285
negative EPD for yield grade and for fat thickness. This indicates that it is possible to find sires 286
in this sample that would improve 7-d shear force and not cause fatter or lower yielding 287
carcasses. The phenotypic correlation between fat thickness and shear force was near zero. 288
The genetic correlation for fat thickness and marbling score was 0.04 ± 0.33. Our finding 289
was similar to low values ranging from -0.19 to 0.26 ± 0.24 (Crews et al., 2004; Wilson et al., 290
1993; Hirooka et al., 1996; Wheeler et al., 1996; Shanks et al., 2001; Pariacote et al., 1998). 291
When analyzing data from purebred Brahman cattle, Elzo et al. (1998) and Riley et al. (2002) 292
reported estimates of 0.03 and 0.56, respectively. Moderate values of 0.42 ± 0.14 and 0.44 ± 0.18293
were reported by Wheeler et al. (2001) and Gregory et al. (1995). 294
Marbling score was not associated genetically with shear force at 7 (0.08 ± 0.34) or 14 295
days (-0.02 ± .36) of aging. Wheeler et al. (1994) reported that the small positive association of 296
marbling score with palatability was similar in Bos taurus and Bos indicus cattle and that 297
marbling explained at best only 5% of the variation in palatability traits. Dikeman et al. (2005) 298
said that selection for marbling would result in little improvement in meat tenderness. In a 299
summary of several papers, Marshall (1994) reported a range of estimates from -0.25 to -0.53. 300
Results by Elzo et al. (1998) gave a value of -0.06 for purebred Brahman cattle while Sherbeck 301
et al. (1996) showed similar findings with small relationships between marbling score and 302
tenderness on steers of varying percentages of Brahman inheritance. Moderate values were 303
Page 13 of 23 Journal of Animal Science
by guest on May 18, 2011jas.fass.orgDownloaded from

14
reported by Wheeler et al. (2001) when aging steaks for 7 (-0.27 ± 0.27) and 14 days (-0.30 ±304
0.30). 305
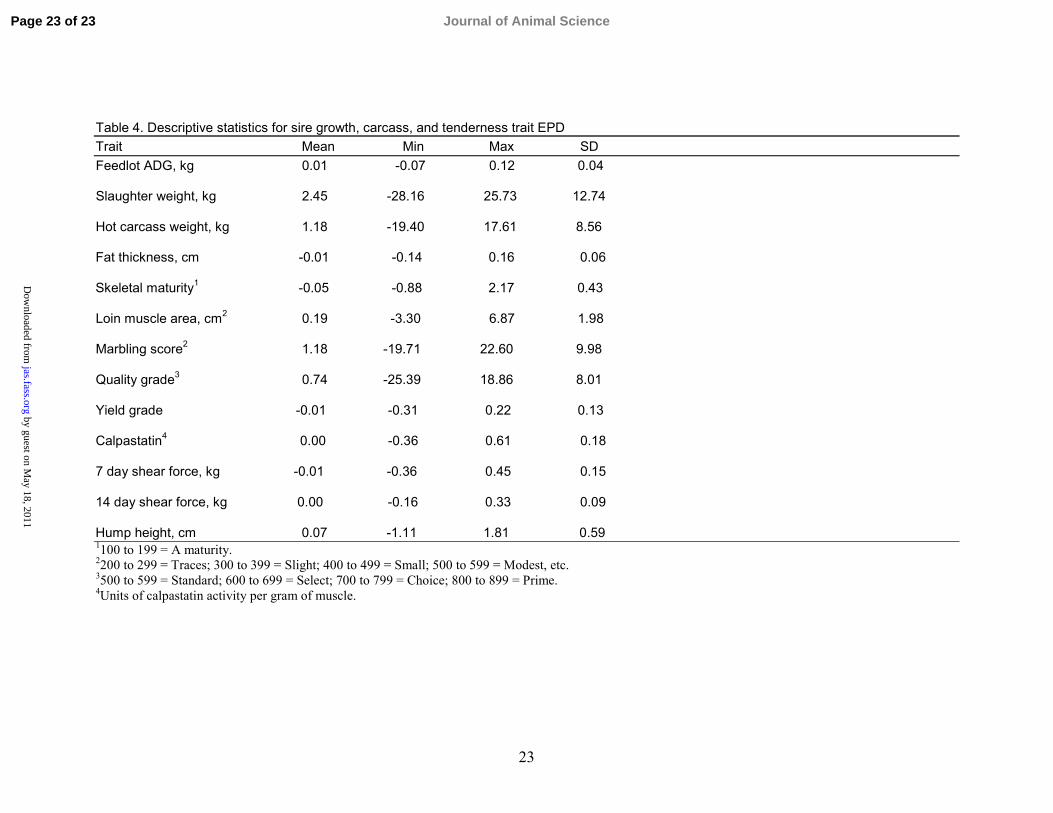
Expected Progeny Differences 306
Expected progeny differences were calculated for each of the 68 sires. Descriptive 307
statistics of the sire EPD are given in Table 4. The mean EPD for each trait was near zero. 308
Ranges of sire EPD for the traits in this study are similar to ranges for carcass trait EPD of the 309
230 bulls in the 2006 American Brahman Breeders Association Sire Summary (American 310
Brahman Breeders Association, Houston, TX). Interestingly, ranges of sire EPD for carcass 311
weight and longissimus muscle area in this study were generally similar to those in the 2006 312
Angus sire summary (www.angus.org/sireeval/averages.html), but Angus bulls had greater range 313
for marbling score and for fat thickness. Sire EPD for shear force after a 14-d aging period in 314
103 Simmental, 23 Shorthorn, and 69 Hereford bulls involved in the National Cattlemen’s Beef 315
Association Carcass Merit Project were similar across breeds and ranged from -0.48 to 0.36 kg 316
(Dikeman et al., 2005). Ranges for Simbrah sire EPD for carcass traits were generally similar to 317
those in this study (www.simmental.org/simmapp/evalstats/). 318
Ranges of sire EPD found in this study and magnitude of genetic parameters discussed 319
earlier indicate sufficient genetic variation in these cattle to select for genetic improvement of 320
most important carcass characteristics. It is recognized that steers used in this study were not a 321
random sample of the U. S. Brahman population, but rather a sample of calves from participating 322
Brahman breeders in Louisiana. 323
IMPLICATIONS 324
The magnitude of genetic parameters estimated for carcass and tenderness traits in a 325
sample of Brahman steers indicates that selection within the Brahman breed may improve 326
Page 14 of 23Journal of Animal Science
by guest on May 18, 2011jas.fass.orgDownloaded from
15
carcass quality and consumer related traits. However, selection of some sires for improvement in 327
tenderness may result in fatter and less yielding carcasses. Further research is needed to 328
determine if these correlations are as high in Brahman cattle as found in this study. The ranges of 329
Brahman sire EPD for carcass quality and tenderness traits were not radically different from EPD 330
ranges of sires in other breeds. 331
332LITERATURE CITED 333
334AMSA. 1995. Research guidelines for cookery, sensory evaluations, and instrumental 335
tenderness measurements of fresh meat. Am. Meat Sci. Assoc., Chicago, IL. 336337
Bidner, T. D., K. M. Laurent, and M. M. Pike. 1997. Effect of subcutaneous fat removal and 338aging in beef tenderness. Louisiana State Univ. AgCenter Beef Cattle Res. Rep. 29:80-33982. 340
341Boggs, D. L., and R. A. Merkel. 1979. Live Animal Carcass Evaluation and Selection Manual. 342
Kendall-Hunt Publishing Co., Dubuque, IA. 343344
Boldman, K. G., L. A. Kriese, L. D. Van Vleck, C. P. Van Tassell and S. D. Kachman. 1995. A 345Manual for Use of MTDFREML. A Set of Programs To Obtain Estimates of Variances 346and Covariances. ARS-USDA, Washington, DC. 347
348Crews, D. H., Jr., and D. E. Franke. 1998. Heterogeneity of variances for carcass traits by 349
percentage Brahman inheritance. J. Anim. Sci. 76:1803-1809. 350351
Crews, D. H., Jr., M. Lowerison, N. Caron, and R. A. Kemp. 2004. Genetic parameters among 352growth and carcass traits of Canadian Charolais cattle. Can. J. Anim. Sci. 84:589-597. 353
354Damon, R. A., Jr., R. M. Crown, C. B. Singletary, and S. E. McCraine. 1960. Carcass 355
characteristics of purebred and crossbred beef steers in the Gulf Coast Region. J. 356Anim. Sci. 19:820-844. 357
358DeRouen, S. M., D. E. Franke, T. D. Bidner, and D. C. Blouin. 1992. Two-, three-, and four- 359
breed rotational crossbreeding of beef cattle: Carcass traits. J. Anim. Sci. 70:3665-3676. 360361
Dikeman, M. E., E. J. Pollak, Z. Zhang, D.W. Moser, C. A Gill, and E. A. Dressler. 2005. 362Phenotypic ranges and relationships among carcass and meat palatability traits for 363fourteen cattle breeds, and heritabilities and expected progeny differences for Warner-364Bratzler shear force in three cattle breeds. J. Anim. Sci. 83:2461-2467. 365
366Elzo, M. A., R. L. West, D. D. Johnson, and D. L. Wakeman. 1998. Genetic variation and 367
Page 15 of 23 Journal of Animal Science
by guest on May 18, 2011jas.fass.orgDownloaded from

16
prediction of additive and nonadditive genetic effects for six carcass traits in an 368Angus-Brahman multibreed herd. J. Anim. Sci. 76:1810-1823. 369
370Ferguson, D. M., S. J. Jiang, H. Hearnshaw, S. R. Rymill, and J. M. Thompson. 2000. Effect of 371
electrical stimulation on protease activity and tenderness of M. Longissimus from cattle 372with different proportions of Bos indicus content. Meat Sci. 55:265-272. 373
374Gregory, K. E., L. V. Cundiff, and R. M. Koch. 1995. Genetic and phenotypic 375
(co)variances for growth and carcass traits of purebred and composite populations 376of beef cattle. J. Anim. Sci. 73:1920-1926. 377
378Hirooka, H., A. F. Groen, and M. Matsumoto. 1996. Genetic parameters for growth and carcass 379
traits in Japanese Brown cattle estimated from field records. J. Anim. Sci. 74:2112-2116. 380381
Johnson, D. D., R. D. Huffman, S. E. Williams, and D. D. Hargrove. 1990. Effects of percentage 382Brahman and Angus breeding, age-season of feeding and slaughter end point on meat 383palatability and muscle characteristics. J. Anim. Sci. 68:1980-1986. 384
385Johnston, D. J., A Reverter, D. M. Ferguson, J. M. Thompson, and H. M. Burrow. Genetic and 386
phenotypic characterization of animal, carcass, and meat quality traits from temperate 387and tropically adapted beef breeds. 3. Meat quality traits. Aust. J. Agric. Res. 54:135-147. 388
389Kennedy, B. W., and D. Trus. 1993. Considerations on Genetic Connectedness Between 390
Management Units Under an Animal Model. J. Anim. Sci. 71:2341-2352. 391392
King, D. A., M. E. Dikeman, T. L. Wheeler, C. L. Kastner, and M. Koohmaraie. 2003. Chilling 393and cooking rate effects on some myofibrillar determinants of tenderness of beef. J. 394Anim. Sci. 81:1473-1481. 395
396Koohmaraie, M., M. E. Doumit, and T. H. Wheeler. 1996. Meat toughening does not occur when 397
rigor shortening is prevented. J. Anim. Sci. 74:2935-2942. 398399
Koots, K. R., J. P. Gibson, C. Smith, and J. W. Wilton. 1994. Analyses of published 400genetic parameter estimates for beef production traits. 1. Heritability. Anim. Breed Abstr. 40162:309-338. 402
403Luckett, R. L., T. D. Bidner, E. A. Icaza, and J. W. Turner. 1975. Tenderness studies in 404
straightbred and crossbred steers. J. Anim. Sci. 40:468-475. 405406
Marshall, D. M. 1994. Breed differences and genetic parameters for body composition traits in 407beef cattle. J. Anim. Sci. 72:2745-2755. 408
409NAMP. 1997. The Meat Buyers Guide. North American Meat Processors Association, Ruston, 410
VA. 411412
O’Conner, S. F., J. D. Tatum, D. M. Wulf, R. D. Green, and G. C. Smith. 1997. Genetic 413
Page 16 of 23Journal of Animal Science
by guest on May 18, 2011jas.fass.orgDownloaded from
17
effects on beef tenderness in Bos indicus composite and Bos taurus cattle. J. 414Anim. Sci. 75:1822-1830. 415
416Pariacote, F., L. D. Van Vleck, and R. E. Hunsley. 1998. Genetic and phenotypic parameters for 417
carcass traits of American Shorthorn beef cattle. J. Anim.Sci. 2584-2588. 418419
Reverter, A., D. J. Johnston, D. Perry, M. E. Goddard, and H. M. Burrow. 2003. Genetic and 420phenotypic characterization of animal, carcass, and meat quality traits from temperate 421and tropically adapted beef breeds. 2. Abattoir carcass traits. Aust. J. Agric. Res. 54:119-422134. 423
424Riley, D. G., C. C. Chase, Jr., A. C. Hammond, R. L. West, D. D. Johnson, T. A. Olson, 425
and S. W. Coleman. 2002. Estimated genetic parameters for carcass traits of 426Brahman cattle. J. Anim. Sci. 80:955-962. 427
428Riley, D. G., C. C. Chase, Jr., A. C. Hammond, R. L. West, D. D. Johnson, T. A. Olson, 429
and S. W. Coleman. 2003. Estimated genetic parameters for palatability traits of 430Brahman cattle. J. Anim. Sci. 81:54-60. 431
432Shackelford, S. D., M. Koohmaraie, L. V. Cundiff, K. E. Gregory, G. A. Rohrer, and J. 433
W. Savell. 1994. Heritabilities and phenotypic and genetic correlations for bovine 434postrigor calpastatin activity, intramuscular fat content, Warner-Bratzler shear 435force, retail product yield, and growth rate. J. Anim. Sci. 72:857-863. 436
437Shackelford, S. D., M. Koohmaraie, M. F. Miller, J. D. Crouse, and J. O. Reagan. 1991. 438
An evaluation of tenderness of the longissimus muscle of Angus by Hereford 439versus Brahman crossbred heifers. J. Anim. Sci. 69:171-177. 440
441Shanks, B. C., M. W. Tess, D. D. Kress, and B. E. Cunningham. 2001. Genetic evaluation of 442
carcass traits in Simmental-sired cattle at different slaughter end points. J. Anim. Sci. 79: 443595-604. 444
445Sherbeck, J. A., J. D. Tatum, T. G. Field, J. B. Morgan, and G. C. Smith. 1996. Effect of 446
phenotypic expression of Brahman breeding on marbling and tenderness traits. J. Anim. 447Sci. 74:304-309. 448
449Utrera, A. R. and L. D. Van Vleck. 2006. Heritability estimates for carcass traits of cattle: A 450
review. Genet. Mol. Res. 3:380-394. 451452
Van Vleck, L. D., A. F. Hakim, L. V. Cundiff, R. M. Koch, J. D. Crouse, and K. G. 453Boldman. 1992. Estimated breeding values for meat characteristics of crossbred 454cattle with an animal model. J. Anim. Sci. 70:363-371. 455
456Wheeler, T. L., L. V. Cundiff, and R. M. Koch. 1994. Effect of marbling degree on beef 457
palatability in Bos taurus and Bos indicus cattle. J. Anim. Sci. 72:3145-3151. 458459
Page 17 of 23 Journal of Animal Science
by guest on May 18, 2011jas.fass.orgDownloaded from

18
Wheeler, T. L., L. V. Cundiff, R. M. Koch, and J. D. Crouse. 1996. Characterization of 460biological types of cattle (Cycle IV): Carcass traits and longissimus palatability. J. 461Anim. Sci. 74:1023-1035. 462
463Wheeler, T. L., L. V. Cundiff, S. D. Shackelford, and M. Koohmaraie. 2001. 464
Characteristics of biological types of cattle (Cycle)V): Carcass traits and 465longissimus palatability. J. Anim. Sci. 79:1209-1222. 466
467Whipple, G., M. Koohmaraie, M. E. Dikeman, and J. D. Crouse. 1990a. Predicting beef- 468
longissimus tenderness from various biochemical and histological muscle traits. J. 469Anim. Sci. 68:4193-4199. 470
471Whipple, G., M. Koohmaraie, M. E. Dikeman, J. D. Crouse, M. C. Hunt, and R. D. 472
Klemm. 1990b. Evaluation of attributes that affect longissimus muscle tenderness 473in Bos taurus and Bos indicus cattle. J. Anim. Sci. 68:2716-2728. 474
475Wilson, D. E., R. L. Willham, S. L. Northcutt, and G. H. Rouse. 1993. Genetic parameters for 476
carcass traits estimated from Angus field records. J. Anim. Sci. 71:2365-2370. 477478
Wulf, D. M., J. D. Tatum, R. D. Green, J. B. Morgan, B. L. Golden, and G. C. Smith. 4791996. Genetic influences on beef longissimus palatability in Charolais- and 480Limousin-sired steers and heifers. J. Anim. Sci. 74:2394-2405. 481
Page 18 of 23Journal of Animal Science
by guest on May 18, 2011jas.fass.orgDownloaded from
19
Table 1. Descriptive statistics for growth, carcass, and tenderness traits 482Trait n Mean SD Min Max CV 483Slaughter age 430 545.64 51.26 389.00 665.00 9.39 484
485Feedlot ADG, kg 430 1.49 0.23 0.64 2.51 15.67 486
487BW at slaughter, kg 430 556.87 55.80 335.45 679.55 10.02 488
489Hot carcass weight, kg 430 336.45 36.89 195.95 422.75 10.96 490
491Fat thickness, cm 430 0.87 0.42 0.13 2.80 47.87 492
493Skeletal maturity1 429 154.22 9.05 130.00 240.00 5.87 494
495Lean maturity2 425 151.29 12.09 120.00 200.00 7.99 496
497Loin muscle area, cm2 430 85.98 8.72 58.70 109.70 10.14 498
499Kidney, pelvic and heart fat, % 430 2.12 0.43 0.50 3.50 20.49 500
501Marbling score3 430 390.30 61.68 220.00 680.00 15.80 502
503Quality grade4 430 676.95 44.12 413.00 793.00 6.52 504
505Yield grade 430 2.34 0.68 0.80 4.70 29.05 506
507Calpastatin5 355 4.51 1.22 1.83 9.16 27.00 508
5097 day shear force, kg 428 4.57 1.21 1.96 9.89 26.54 510
51114 day shear force, kg 427 3.85 0.86 1.67 7.04 22.25 512
513Hump height, cm 420 19.36 3.30 10.20 30.50 17.03 5141Maturity scores 100 to 199 = A grade maturity, 200 to 299= B grade maturity, etc. 5152Maturity scores 100 to 199 = A grade maturity, 200 to 299= B grade maturity, etc. 5163200 to 299 Traces; 300 to 399 = Slight; 400 to 499 = Small; 500 to 599 = Modest, etc. 5174500 to 599 = Standard; 600 to 699 = Select; 700 to 799 = Choice; 800 to 899 = Prime. 5185Units of calpastatin activity per gram of muscle. 519
520
Page 19 of 23 Journal of Animal Science
by guest on May 18, 2011jas.fass.orgDownloaded from

20
Table 2. Additive genetic and residual variances and estimates of heritability 521Trait Additive variance Residual variance Heritability 522Feedlot ADG, kg 0.013 0.026 0.33 ± 0.14 523
524Slaughter weight, kg 1112.693 793.057 0.59 ± 0.16 525
526Hot carcass weight, kg 483.014 370.513 0.57 ± 0.15 527
528Fat thickness, cm 0.049 0.087 0.36 ± 0.17 529
530Skeletal maturity score1 6.721 62.194 0.10 ± 0.10 531
532Lean maturity score2 0.619 124.054 0.00 ± 0.08 533
534Longissimus muscle area, cm2 34.490 33.857 0.50 ± 0.16 535
536Kidney, pelvic and heart fat, % 0.000 0.167 0.00 ± 0.08 537
538Marbling score3 1170.077 1993.964 0.37 ± 0.16 539
540Quality Grade4 672.108 933.952 0.42 ± 0.16 541
542Yield grade 0.169 0.198 0.46 ± 0.17 543
544Calpastatin5 0.374 0.462 0.45 ± 0.17 545
5467-d shear force, kg 0.291 0.727 0.29 ± 0.14 547
54814-d shear force, kg 0.120 0.476 0.20 ± 0.11 549
550Hump height, cm 4.028 6.607 0.38 ± 0.16 5511Maturity scores 100 to 199 = A grade maturity, 200 to 299= B grade maturity, etc. 5522Maturity scores 100 to 199 = A grade maturity, 200 to 299= B grade maturity, etc. 5533200 to 299 Traces; 300 to 399 = Slight; 400 to 499 = Small; 500 to 599 = Modest, etc. 5544500 to 599 = Standard; 600 to 699 = Select; 700 to 799 = Choice; 800 to 899 = Prime. 5555Units of calpastatin activity per gram of muscle. 556
557558
Page 20 of 23Journal of Animal Science
by guest on May 18, 2011jas.fass.orgDownloaded from

Table 3. Phenotypic and genetic correlations among growth, carcass and tenderness traits1
Trait2 ADG SLWT HCWT FT SMAT LMA MS
ADG, kg 0.71 ± 0.14 0.56 ± 0.17 -0.13 ± 0.33 -0.48 ± 0.45 0.16 ± 0.27 0.27 ± 0.28
SLWT, kg 0.66 0.94 ± 0.03 0.10 ± 0.27 -0.26 ± 0.44 0.30 ± 0.21 0.33 ± 0.24
HCWT, kg 0.61 0.89 0.08 ± 0.26 -0.24 ± 0.43 0.45 ± 0.19 0.51 ± 0.22
FT, cm 0.11 0.16 0.25 -0.27 ± 0.50 -0.25 ± 0.27 0.04 ± 0.33
SMAT -0.03 0.07 0.10 0.04 0.11 ± 0.43 -0.45 ± 0.47
LMA, cm2 0.20 0.31 0.39 -0.07 0.12 0.17 ± 0.28
MS 0.14 0.15 0.21 0.11 0.01 0.04
QG 0.13 0.10 0.16 0.12 0.00 0.05 0.81
YG 0.18 0.25 0.29 0.78 -0.01 -0.48 0.13
CALP 0.03 -0.03 0.08 -0.11 0.02 -0.03 -0.08
SF7, kg -0.06 -0.03 0.00 -0.02 0.05 0.05 -0.13
SF14, kg 0.03 0.00 -0.03 -0.02 -0.02 0.12 -0.02
HUMP, cm 0.23 0.02 0.26 0.21 -0.01 0.02 0.21Continued
Page 21 of 23 Journal of Animal Science
by guest on May 18, 2011
jas.fass.orgD
ownloaded from
22
Table 3. Continued
Trait2 QG YG CALP SF7 SF14 HUMP
ADG, kg 0.09 ± 0.30 0.06 ± 0.29 -0.18 ± 0.31 -0.17 ± 0.34 -0.18 ± 0.35 -0.41 ± 0.30
SLWT, kg 0.00 ± 0.25 0.24 ± 0.23 -0.41 ± 0.26 -0.37 ± 0.28 -0.36 ± 0.30 -0.22 ± 0.26
HCWT, kg 0.23 ± 0.24 0.16 ± 0.23 -0.69 ± 0.24 -0.41 ± 0.28 -0.47 ± 0.30 -0.29 ± 0.26
FT, cm 0.46 ± 0.29 0.77 ± 0.12 -0.56 ± 0.32 -0.82 ± 0.27 -0.36 ± 0.38 -0.20 ± 0.35
SMAT -0.44 ± 0.45 -0.41 ± 0.46 0.57 ± 0.49 0.22 ± 0.49 0.27 ± 0.48 -0.62 ± 0.50
LMA, cm2 -0.04 ± 0.27 -0.66 ± 0.16 -0.43 ± 0.30 -0.04 ± 0.31 0.19 ± 0.32 -0.37 ± 0.29
MS 0.99 ± 0.01 0.13 ± 0.30 -0.51 ± 0.41 0.08 ± 0.34 -0.02 ± 0.36 0.17 ± 0.31
QG 0.38 ± 0.27 -0.44 ± 0.38 0.14 ± 0.32 0.10 ± 0.34 0.04 ± 0.30
YG 0.11 -0.36 ± 0.30 -0.90 ± 0.30 -0.66 ± 0.30 -0.07 ± 0.30
CALP -0.06 -0.07 0.74 ± 0.27 0.72 ± 0.25 -0.23 ± 0.29
SF7, kg -0.09 -0.05 0.26 1.00 ± 0.32 -0.43 ± 0.33
SF14, kg 0.02 -0.11 0.26 0.26 -0.14 ± 0.37
HUMP, cm 0.17 0.22 -0.02 -0.04 0.051Phenotypic correlations are in the lower triangle and genetic correlations with standard errors are in the upper triangle.2ADG = feedlot average daily gain, SLWT = slaughter weight, HCWT = hot carcass weight, FT = fat thickness, SMAT = skeletal maturity, LMA = longissimusmuscle area, MS = marbling score, QG = quality grade, YG = yield grade, CALP = units of calpastatin activity per gram of muscle, SF7 = shear force of 7-d agedsteaks, SF14 = shear force of 14-d aged steaks, and HUMP = hump height
Page 22 of 23Journal of Animal Science
by guest on May 18, 2011
jas.fass.orgD
ownloaded from
23
Table 4. Descriptive statistics for sire growth, carcass, and tenderness trait EPDTrait Mean Min Max SDFeedlot ADG, kg 0.01 -0.07 0.12 0.04
Slaughter weight, kg 2.45 -28.16 25.73 12.74
Hot carcass weight, kg 1.18 -19.40 17.61 8.56
Fat thickness, cm -0.01 -0.14 0.16 0.06
Skeletal maturity1 -0.05 -0.88 2.17 0.43
Loin muscle area, cm2 0.19 -3.30 6.87 1.98
Marbling score2 1.18 -19.71 22.60 9.98
Quality grade3 0.74 -25.39 18.86 8.01
Yield grade -0.01 -0.31 0.22 0.13
Calpastatin4 0.00 -0.36 0.61 0.18
7 day shear force, kg -0.01 -0.36 0.45 0.15
14 day shear force, kg 0.00 -0.16 0.33 0.09
Hump height, cm 0.07 -1.11 1.81 0.591100 to 199 = A maturity.2200 to 299 = Traces; 300 to 399 = Slight; 400 to 499 = Small; 500 to 599 = Modest, etc.3500 to 599 = Standard; 600 to 699 = Select; 700 to 799 = Choice; 800 to 899 = Prime.4Units of calpastatin activity per gram of muscle.
Page 23 of 23 Journal of Animal Science
by guest on May 18, 2011
jas.fass.orgD
ownloaded from

Citations
cleshttp://jas.fass.org/content/early/2007/03/05/jas.2006-653.citation#otherartiThis article has been cited by 2 HighWire-hosted articles:
by guest on May 18, 2011jas.fass.orgDownloaded from