Developments of carcass cuts, organs, body tissues and chemical body composition during growth of...
11
Developments of carcass cuts, organs, body tissues and chemical body composition during growth of pigs S. Landgraf 1 , A. Susenbeth 2 , P.W. Knap 3 , H. Looft 3 , G.S. Plastow 3 , E. Kalm 1 and R. Roehe 1† 1 Institute of Animal Breeding and Husbandry, Christian-Albrechts-University of Kiel, Hermann-Rodewald-Strasse 6, D-24118 Kiel, Germany 2 Institute of Animal Nutrition, Physiology and Metabolism, Christian-Albrechts-University of Kiel, Hermann-Rodewald-Strasse 9, D-24098 Kiel, Germany 3 PIC International Group, Ratsteich 31, D-24837 Schleswig, Germany † Corresponding author. E-mail: [email protected] Present address: Sustainable Livestock Systems, Scottish Agricultural College, Bush Estate, Penicuik EH26 0PH, UK. Abstract A serial slaughter trial was carried out to examine the developmental change of physical and chemical body composition in pigs highly selected for lean content. A total of 48 pigs (17 females and 31 castrated males) were serially slaughtered and chemically analysed. Eight pigs were slaughtered at 20, 30, 60, 90, 120 and 140 kg live weight, (LW) respectively. The carcass was chilled and the left carcass side was dissected into the primal carcass cuts ham, loin, shoulder, belly and neck. Each primal carcass cut was further dissected into lean tissue, bones and rind. Additionally, the physical and chemical body composition was obtained for the total empty body as well as for the three fractions soft tissue, bones and viscera. Viscera included the organs, blood, empty intestinal tract and leaf fat. The relationship between physical or chemical body composition and empty body weight (EBWT) at slaughter was assessed using allometric equations (log 10 y ¼ log 10 a þ b log 10 EBWT). Dressing percentage increased from 69·4 to 85·2% at 20 to 120 kg and then decreased to 83·1% at 140 kg LW, whereas percentage of soft tissue, bones and viscera changed from 23·5 to 33·0%, 10·1 to 6·3% and 14·7 to 10·3%, respectively, during the entire growth period. Substantial changes in proportional weights of carcass cuts on the left carcass side were obtained for loin (10·5 to 17·5%) and belly (11·3 to 13·8%) during growth from 20 to 140 kg. Soft tissue fraction showed an allometric coefficient above 1 ( b ¼ 1·14) reflecting higher growth rate in relation to the total empty body. The coefficients for the fractions bones and viscera were substantially below 1 with b ¼ 0·77 and 0·79, respectively, indicating substantial lower growth relative to growth of the total empty body. Lean tissue allometric growth rate of different primal cuts ranged from b ¼ 1·02 (neck) to 1·28 (belly), whereas rates of components associated with fat tissue growth rate ranged from b ¼ 0·62 (rind of belly) to 1·79 (backfat). For organs, allometric growth rate ranged from b ¼ 0·61 (liver) to 0·90 (spleen). For the entire empty body, allometric accretion rate was 1·01, 1·75, 1·02 and 0·85 for protein, lipid, ash and water, respectively. Extreme increase in lipid deposition was obtained during growth from 120 to 140 kg growth. This was strongly associated with an increase in backfat and leaf fat in this period. Interestingly, breeds selected for high leanness such as Pie ´ train sired progeny showed an extreme increase in lipid accretion at a range of LW from 120 to 140 kg, which indicates that selection has only postponed the lipid deposition to an higher weight compared with the normally used final weight of 100 kg on the performance test. The estimates obtained for allometric growth rates of primal carcass cuts, body tissue and chemical body composition can be used to predict changes in weight of carcass cuts, determine selection goals concerning lean tissue growth, food intake capacity, etc. and generally as input parameters for pig growth models that can be used to improve the efficiency of the entire pig production system for pigs highly selected for lean content. Keywords: allometry, body composition, carcass composition, growth, organs, pigs. Introduction Growth, a complex and highly integrated process, was defined as the production of new biochemical units through metabolic and biological synthesis (Brody, 1945). In pigs, qualitative and quantitative changes in body composition are of increasing interest in the last years due to strong association of those traits with profit. Component pricing systems for pork have been developed reflecting the true carcass value more accurately (Akridge et al., 1992; Tholen et al., 2003). Using these systems, carcass value is strongly Animal Science 2006, 82: 889–899 Q 2006 British Society of Animal Science ISSN 1357-7298 DOI: 10.1017/ASC2006097 889
-
Upload
independent -
Category
Documents
-
view
2 -
download
0
Transcript of Developments of carcass cuts, organs, body tissues and chemical body composition during growth of...

Developments of carcass cuts, organs, body tissues and chemical bodycomposition during growth of pigs
S. Landgraf1, A. Susenbeth2, P.W. Knap3, H. Looft3, G.S. Plastow3, E. Kalm1 and R. Roehe1†
1Institute of Animal Breeding and Husbandry, Christian-Albrechts-University of Kiel, Hermann-Rodewald-Strasse 6, D-24118Kiel, Germany2Institute of Animal Nutrition, Physiology and Metabolism, Christian-Albrechts-University of Kiel, Hermann-Rodewald-Strasse9, D-24098 Kiel, Germany3PIC International Group, Ratsteich 31, D-24837 Schleswig, Germany
†Corresponding author. E-mail: [email protected] Present address: Sustainable Livestock Systems, Scottish Agricultural College,
Bush Estate, Penicuik EH26 0PH, UK.
Abstract
A serial slaughter trial was carried out to examine the developmental change of physical and chemical body composition
in pigs highly selected for lean content. A total of 48 pigs (17 females and 31 castrated males) were serially slaughtered
and chemically analysed. Eight pigs were slaughtered at 20, 30, 60, 90, 120 and 140 kg live weight, (LW) respectively.
The carcass was chilled and the left carcass side was dissected into the primal carcass cuts ham, loin, shoulder, belly
and neck. Each primal carcass cut was further dissected into lean tissue, bones and rind. Additionally, the physical and
chemical body composition was obtained for the total empty body as well as for the three fractions soft tissue, bones and
viscera. Viscera included the organs, blood, empty intestinal tract and leaf fat. The relationship between physical or
chemical body composition and empty body weight (EBWT) at slaughter was assessed using allometric equations (log10
y ¼ log10 a þ b log10 EBWT). Dressing percentage increased from 69·4 to 85·2% at 20 to 120 kg and then decreased to
83·1% at 140 kg LW, whereas percentage of soft tissue, bones and viscera changed from 23·5 to 33·0%, 10·1 to 6·3%
and 14·7 to 10·3%, respectively, during the entire growth period. Substantial changes in proportional weights of carcass
cuts on the left carcass side were obtained for loin (10·5 to 17·5%) and belly (11·3 to 13·8%) during growth from 20 to
140 kg. Soft tissue fraction showed an allometric coefficient above 1 ( b ¼ 1·14) reflecting higher growth rate in relation to
the total empty body. The coefficients for the fractions bones and viscera were substantially below 1 with b ¼ 0·77 and
0·79, respectively, indicating substantial lower growth relative to growth of the total empty body. Lean tissue allometric
growth rate of different primal cuts ranged from b ¼ 1·02 (neck) to 1·28 (belly), whereas rates of components associated
with fat tissue growth rate ranged from b ¼ 0·62 (rind of belly) to 1·79 (backfat). For organs, allometric growth rate ranged
from b ¼ 0·61 (liver) to 0·90 (spleen). For the entire empty body, allometric accretion rate was 1·01, 1·75, 1·02 and 0·85
for protein, lipid, ash and water, respectively. Extreme increase in lipid deposition was obtained during growth from 120 to
140 kg growth. This was strongly associated with an increase in backfat and leaf fat in this period. Interestingly, breeds
selected for high leanness such as Pietrain sired progeny showed an extreme increase in lipid accretion at a range of LW
from 120 to 140 kg, which indicates that selection has only postponed the lipid deposition to an higher weight compared
with the normally used final weight of 100 kg on the performance test. The estimates obtained for allometric growth rates
of primal carcass cuts, body tissue and chemical body composition can be used to predict changes in weight of carcass
cuts, determine selection goals concerning lean tissue growth, food intake capacity, etc. and generally as input
parameters for pig growth models that can be used to improve the efficiency of the entire pig production system for pigs
highly selected for lean content.
Keywords: allometry, body composition, carcass composition, growth, organs, pigs.
IntroductionGrowth, a complex and highly integrated process, wasdefined as the production of new biochemical units throughmetabolic and biological synthesis (Brody, 1945). In pigs,
qualitative and quantitative changes in body composition
are of increasing interest in the last years due to strong
association of those traits with profit. Component pricing
systems for pork have been developed reflecting the truecarcass value more accurately (Akridge et al., 1992; Tholenet al., 2003). Using these systems, carcass value is strongly
Animal Science 2006, 82: 889–899
Q 2006 British Society of Animal Science
ISSN 1357-7298
DOI: 10.1017/ASC2006097
889

related to the amount of dissected lean of each primal cut.Knowledge of pig carcass composition and the developmentof body composition during growth are important to improvethe efficiency of the production system and to increase theprofit on present pig populations highly selected for lean tis-sue. In particular, the development of physical and chemicalbody composition of these pigs during growth is of higheconomic value in order to: (1) predict the development ofcarcass value during growth; (2) optimize the nutritionalsupply during growing and finishing; (3) determine selectionobjectives for optimal development of body tissue growthand food intake capacity; (4) refine alternative methods toidentify optimal slaughter weights; and (5) provide par-ameters for description of growth and carcass compositionfor a pig growth model that can be used to improve the effi-ciency of the entire pig production system. To estimatebody composition over the growth period the allometricmodel described by Huxley (1932) is of advantage becausethis function results in stable linear estimation function afterlog to log transformation, provides parameters with straightforward biological interpretation and stable first derivativeestimates indicating the marginal growth. Seebeck (1968),Berg et al. (1978) in cattle, Evans and Kempster (1979) andGu et al. (1992) in pigs have demonstrated that the allo-metric function appropriately describes the compositionalchanges throughout the growth period in meat animals. Theobjectives of the present study were to examine in a pigpopulation selected for high leanness: (1) the developmentof primal carcass cuts and their dissected componentsduring growth; (2) the growth of organs and minor carcasscuts; (3) the development of the chemical components ofthe total body of growing pigs; and (4) to identify indicatorcuts for the development of the entire body composition.
Material and methodsData were obtained in a three generation full-sib design andhas been used to detect quantitative trait loci for protein andlipid deposition rate (Mohrmann et al., 2006a). The presentanalysis is based on the measurements of the F1 generationthat was generated from seven unrelated Pietrain boars(heterozygous at porcine ryanodine receptor locus, whichare associated with stress susceptibility; Fujii et al. (1991))of a sire line and 14 unrelated sows (Large White £
Landrace £ Leicoma) of a dam line. The experimental pigswere housed in identical straw-bedded pens (up to 15 pigs)with an electronic feeding station of the type ACEMA 48.The pigs were allowed ad libitum access to four pelleteddiets designed to provide adequate nutrients for expressionof their maximum protein accretion during the respectivegrowth periods as described in detail by Landgraf et al.(2006) and Mohrmann et al. (2006b).
This study involved a total of 48 experimental pigs (17females and 31 castrated males) serially slaughtered in sixgroups, covering a live weight (LW) range from 20 to140 kg. Pigs were weighed weekly and pigs closed to thetarget weight were chosen for chemical analysis. At allweight classes (20, 30, 60, 90, 120 and 140 kg), eightanimals were slaughtered in a nearby slaughter house.Organs, blood, empty intestinal tract and leaf fat were
weighted separately and their weights were accumulated tothe fraction viscera. The cold left carcass side was dis-sected (similar to DLG carcass cuts; Scheper and Scholz(1985)) at 24 h after slaughter as described in detail inTable 1. At first, the left carcass was dissected into the pri-mal cuts like ham, shoulder, loin, belly and neck, and intothe minor carcass cuts like thick rib, head, jowl, legs andtail. At second, the primal carcass cuts were dissected intothe boneless and rindless component, bones, rind and othercomponents. Then, the bones were pooled to the fraction‘bone’ and the non-bone tissue to the fraction ‘soft tissue’.These fractions and the viscera of the entire body werethen chemical analysed as described in detail by Landgrafet al. (2006) and Mohrmann et al. (2006b).
The following allometric equation was used to evaluategrowth rate of each carcass component relative to carcassweight or empty body weight (EBWT):
Y ¼ a X b
where Y is weight of carcass component, X is weight of car-cass or empty body weight, a is the intercept and b is theallometric growth coefficient relating the growth of Y to that
Table 1 Primal carcass cuts (in bold) and their components afterdissection
Trait Description
Ham Ham separated from loin by cut between lastand proceeding lumbar vertebrae, includingrind, bones, hindquarter hock and tip oftenderloin
Ham trimmed Ham boneless, rindless, without hindquarterhock and tip of tenderloin
Ham bones Pelvis bone, femoral, tibial without hindquarterhock
Ham rind Rind above ham without hindquarter hockTip of tenderloin Tip of the filetHockLoin Loin without neck, separated between 5 and 6
thoracic vertebrae and 5 and 6 lumbarvertebrae including tenderloin and bones
Loin trimmed Loin boneless, without tenderloin and backfatLoin bones Bones of loinBackfat Fat above loinTenderloinShoulder Shoulder with shoulder meat, rind, bones and
forequarter, without neck and thick ribsShoulder trimmed Shoulder boneless, rindless without forequarter
hockShoulder bones Shoulder blade, humerus, radius, without
forequarterShoulder rind Rind above the shoulder without forequarterHockBelly Belly with bones, flank and rindBelly trimmed Belly boneless, rindless, without flankBelly ribs Ribs of bellyBelly rind Fat above bellyFlankNeck Neck / spare rib with bones and rindNeck trimmed Neck rindless, bonelessNeck bones Bones of neckNeckfat Fat above neckHead Head without jowlJowlThick rib First four ribsForlegHindlegTail
Landgraf, Susenbeth, Knap, Looft, Plastow, Kalm and Roehe
890

of X. The statistical analysis was performed using SAS–procedure GLM (Statistical Analysis Systems Institute,1992). The allometric equation Y ¼ a X b was fit by lineariz-ing the function as log10 Y ¼ log10 a þ b log10 X. Accordingto Gu et al. (1992) the following parameters were used toevaluate the goodness of fit of the allometric model:
(1) correlation (r) between the predicted values (Yi ) andobserved values (Yi) for each component;
(2) the residual standard deviation (RSD) was calculated asfollows:
RSD ¼Xni¼1
ðei Þ2=n 2 p
!12
;
where ei is the residual value for the ith observation,n ¼ number of observations and p ¼ degrees of freedom inthe model.
ResultsGrowth of body componentsAt six target weights, LW, EBWT, carcass weight (CW), vis-cera of the entire body, carcass weight of the left side(CWl), weights of soft tissue and bones of the left carcassside, lean and fat tissue of the primal carcass cuts of theleft carcass side were measured as presented in Table 2.Dressing percentage increased from 69·4 to 85·2% at 20 to120 kg and thereafter decreased by 2·1 percent levels at140 kg LW. Over the entire growth period, percentage ofsoft tissue of the EBWT increased continuously from 23·5 to33·0%, whereas the corresponding ratios for bones and vis-cera decreased from 10·1 to 6·3% and 14·7 to 10·1%,respectively. The lean tissue of the primal cuts showed itshighest increase between 90 and 120 kg LW, whereas fattissue of these cuts increased extremely between 120 to140 kg LW. However, it has to be considered that the per-centage of fat tissue on the EBWT even decreased from 90
to 120 kg. The coefficients of variation were higher for traitsat 20 kg compared with higher weight groups. In particularat high weights, viscera showed higher coefficients of vari-ation than lean tissue.
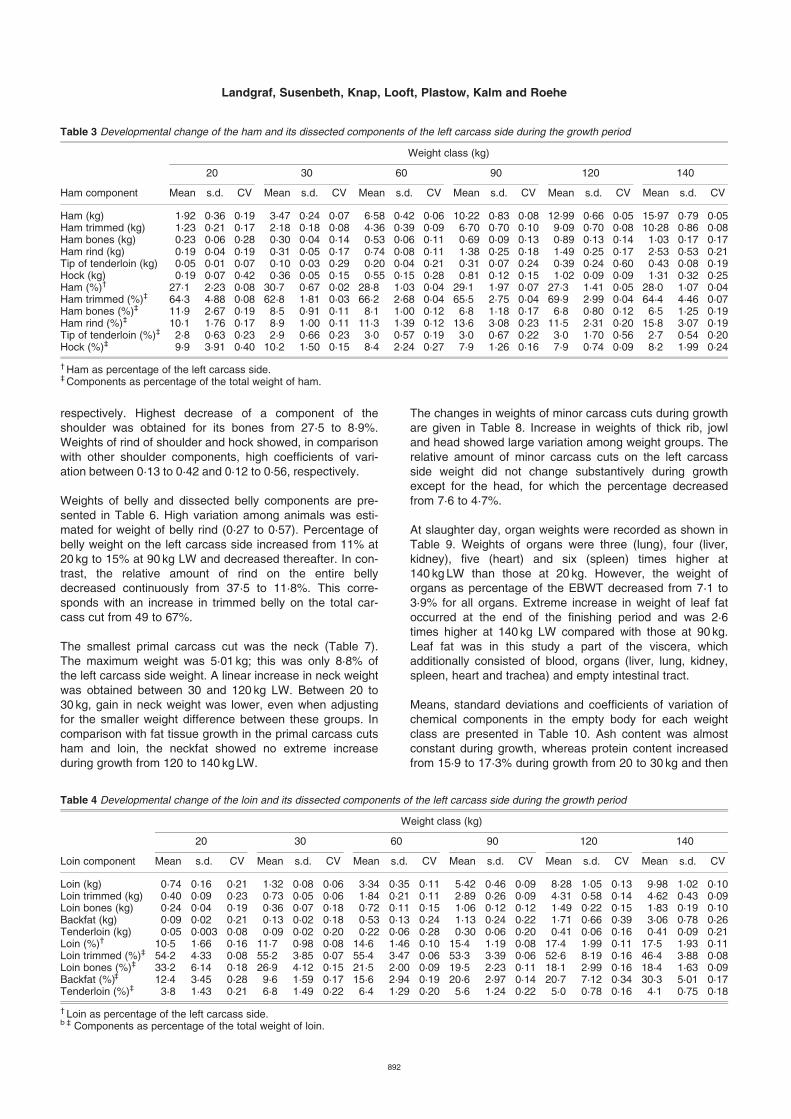
Table 3 presents the developmental change of ham andits dissected components of the left carcass side duringgrowth. Percentage of ham of the left carcass sideincreased from 27·1 to 30·7% at 20 to 30 kg and there-after decreased to be approximately similar at 60 to140 kg LW. Extreme increase in rind of ham occurredduring growth from 120 to 140 kg LW. However, it has tobe considered that the rind as percentage of the weight ofentire ham was lower at 120 kg than at 90 kg LW. Weightof ham bones increased from 0·23 to 1·03 kg, but theircorresponding proportion on the entire ham decreasedfrom 11·9 to 6·5%. The percentage of tip of tenderloin onham was about 3%, and showed very high variationamong animals.
Loin percentage of the left carcass side rose from 10·5 to17·5% (Table 4). The highest increase in loin growth of2·86 kg was found between 90 and 120 kg LW. Backfat onthe longissimus dorsi increased extremely by 1·35 kgbetween 120 and 140 kg LW. At LW of 140 kg, 30·3% ofthe entire loin consisted of backfat and there was sub-stantial variation among animals as indicated by a coeffi-cient of variation of 0·26. In contrast, bones and trimmedloin as percentage of the weight of entire loin decreasedfrom 33 to 18% and 54 to 46% during growth,respectively.
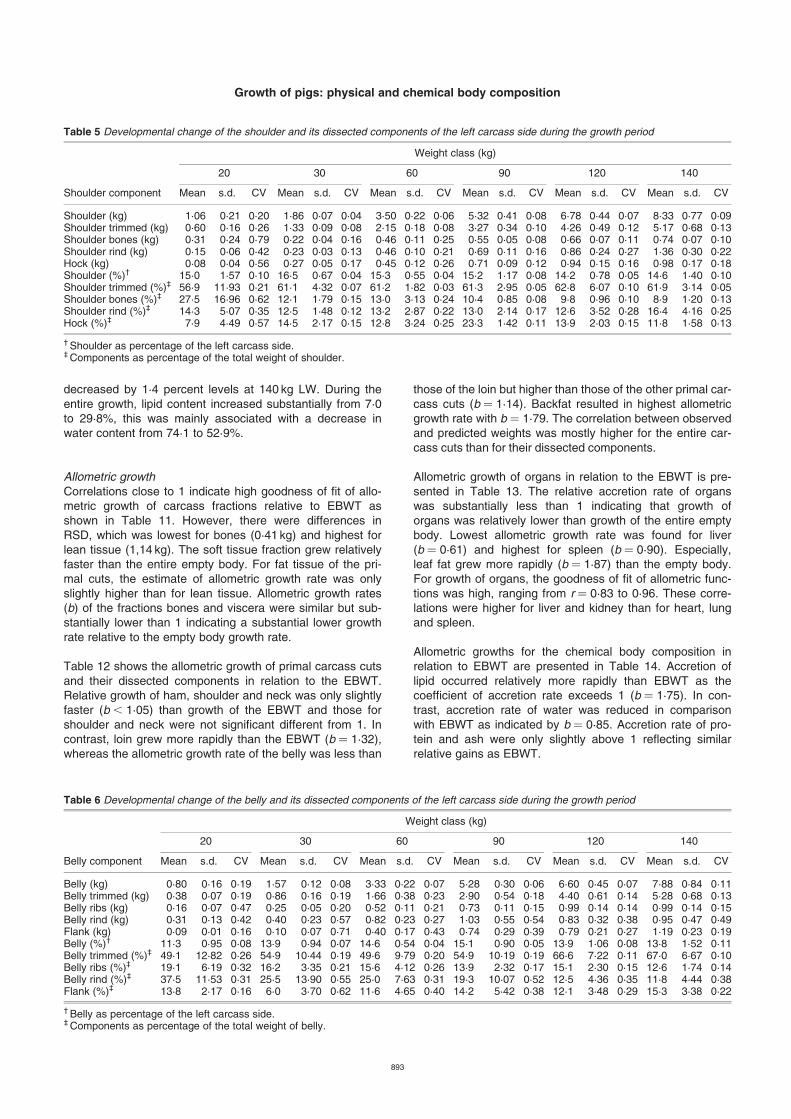
Highest increase in shoulder weight (1·82 kg) was obtainedbetween 60 and 90 kg LW (Table 5). The percentage ofshoulder on the left carcass weight increased between 20and 30 kg from 15·0 to 16·5%. Thereafter, the relativeamount of shoulder decreased to 14·6% at 140 kg LW. Also,percentage of shoulder trimmed and rind on the entireshoulder weight rose from 56·9 to 61·9% and 14·3 to 16·4%,
Table 2 Development of live weight (LW), empty body weight (EBWT), carcass weight (CW), carcass weight of the left side (CWl) and bodyfraction weights† of soft tissue, viscera and bones during growth
Weight class (kg)
20 30 60 90 120 140
Trait Mean s.d. CV Mean s.d. CV Mean s.d. CV Mean s.d. CV Mean s.d. CV Mean s.d. CV
LW (kg) 20·2 2·25 0·11 32·8 2·14 0·07 62·6 2·60 0·04 92·8 3·46 0·04 116·5 1·91 0·02 141·9 4·32 0·03EBWT (kg) 19·0 2·20 0·12 30·6 2·35 0·08 60·1 2·69 0·04 90·8 3·24 0·04 114·7 1·80 0·02 139·2 4·09 0·03CW (kg) 14·0 1·96 0·14 23·6 1·27 0·05 47·5 2·53 0·05 71·9 1·90 0·03 99·2 3·43 0·03 117·8 2·79 0·02CWl (kg) 7·1 1·11 0·16 11·3 0·64 0·06 22·9 1·16 0·05 35·1 1·21 0·03 47·7 1·98 0·04 57·0 1·75 0·03Soft tissue (kg) 4·5 0·84 0·19 8·1 0·54 0·07 16·8 1·25 0·07 27·9 0·94 0·03 37·6 0·76 0·02 46·0 1·90 0·04Lean tissue (kg)‡ 3·1 0·47 0·15 5·7 0·30 0·05 11·7 0·99 0·08 18·2 1·52 0·08 25·5 1·22 0·05 29·2 1·72 0·06Fat tissue (kg)‡ 0·9 0·23 0·26 1·2 0·30 0·25 2·9 0·52 0·18 4·9 0·86 0·17 5·9 1·02 0·17 9·0 1·20 0·13Viscera (kg) 2·8 0·44 0·16 4·6 0·36 0·08 7·4 0·56 0·08 10·2 0·70 0·07 12·0 1·23 0·10 14·1 1·40 0·10Bones (kg) 1·9 0·23 0·12 2·8 0·18 0·06 4·6 0·32 0·07 6·4 0·37 0·06 8·0 0·59 0·07 8·8 0·47 0·05CW:LW (%) 69·4 6·36 0·09 72·0 2·11 0·03 75·9 2·18 0·03 77·5 1·44 0·02 85·2 2·60 0·03 83·1 3·26 0·04Soft tissue: EBWT (%) 23·5 3·08 0·13 26·5 1·74 0·07 28·0 1·70 0·06 30·8 1·08 0·04 32·8 0·73 0·02 33·0 0·60 0·02Lean tissue: EBWT (%) 16·5 1·78 0·11 18·6 1·16 0·06 19·4 1·40 0·07 20·0 1·14 0·06 22·2 1·13 0·05 21·0 1·04 0·05Fat tissue: EBWT (%) 4·6 1·15 0·25 3·9 0·78 0·20 4·9 0·82 0·17 5·5 1·05 0·19 5·1 0·86 0·17 6·5 0·82 0·13Bones: EBWT (%) 10·1 0·77 0·08 9·1 0·72 0·08 7·6 0·47 0·06 7·0 0·54 0·08 6·9 0·56 0·08 6·3 0·35 0·06Viscera: EBWT (%) 14·7 1·67 0·11 14·9 0·85 0·06 12·3 1·23 0·10 11·3 0·72 0·06 10·5 1·11 0·11 10·1 0·82 0·08
† Fraction of soft tissue and bones of the left carcass side.‡ From the primal carcass cuts of the left carcass side (ham, loin, shoulder, belly and neck).
Growth of pigs: physical and chemical body composition
891
respectively. Highest decrease of a component of theshoulder was obtained for its bones from 27·5 to 8·9%.Weights of rind of shoulder and hock showed, in comparisonwith other shoulder components, high coefficients of vari-ation between 0·13 to 0·42 and 0·12 to 0·56, respectively.
Weights of belly and dissected belly components are pre-sented in Table 6. High variation among animals was esti-mated for weight of belly rind (0·27 to 0·57). Percentage ofbelly weight on the left carcass side increased from 11% at20 kg to 15% at 90 kg LW and decreased thereafter. In con-trast, the relative amount of rind on the entire bellydecreased continuously from 37·5 to 11·8%. This corre-sponds with an increase in trimmed belly on the total car-cass cut from 49 to 67%.
The smallest primal carcass cut was the neck (Table 7).The maximum weight was 5·01 kg; this was only 8·8% ofthe left carcass side weight. A linear increase in neck weightwas obtained between 30 and 120 kg LW. Between 20 to30 kg, gain in neck weight was lower, even when adjustingfor the smaller weight difference between these groups. Incomparison with fat tissue growth in the primal carcass cutsham and loin, the neckfat showed no extreme increaseduring growth from 120 to 140 kg LW.
The changes in weights of minor carcass cuts during growthare given in Table 8. Increase in weights of thick rib, jowland head showed large variation among weight groups. Therelative amount of minor carcass cuts on the left carcassside weight did not change substantively during growthexcept for the head, for which the percentage decreasedfrom 7·6 to 4·7%.
At slaughter day, organ weights were recorded as shown inTable 9. Weights of organs were three (lung), four (liver,kidney), five (heart) and six (spleen) times higher at140 kg LW than those at 20 kg. However, the weight oforgans as percentage of the EBWT decreased from 7·1 to3·9% for all organs. Extreme increase in weight of leaf fatoccurred at the end of the finishing period and was 2·6times higher at 140 kg LW compared with those at 90 kg.Leaf fat was in this study a part of the viscera, whichadditionally consisted of blood, organs (liver, lung, kidney,spleen, heart and trachea) and empty intestinal tract.
Means, standard deviations and coefficients of variation ofchemical components in the empty body for each weightclass are presented in Table 10. Ash content was almostconstant during growth, whereas protein content increasedfrom 15·9 to 17·3% during growth from 20 to 30 kg and then
Table 3 Developmental change of the ham and its dissected components of the left carcass side during the growth period
Weight class (kg)
20 30 60 90 120 140
Ham component Mean s.d. CV Mean s.d. CV Mean s.d. CV Mean s.d. CV Mean s.d. CV Mean s.d. CV
Ham (kg) 1·92 0·36 0·19 3·47 0·24 0·07 6·58 0·42 0·06 10·22 0·83 0·08 12·99 0·66 0·05 15·97 0·79 0·05Ham trimmed (kg) 1·23 0·21 0·17 2·18 0·18 0·08 4·36 0·39 0·09 6·70 0·70 0·10 9·09 0·70 0·08 10·28 0·86 0·08Ham bones (kg) 0·23 0·06 0·28 0·30 0·04 0·14 0·53 0·06 0·11 0·69 0·09 0·13 0·89 0·13 0·14 1·03 0·17 0·17Ham rind (kg) 0·19 0·04 0·19 0·31 0·05 0·17 0·74 0·08 0·11 1·38 0·25 0·18 1·49 0·25 0·17 2·53 0·53 0·21Tip of tenderloin (kg) 0·05 0·01 0·07 0·10 0·03 0·29 0·20 0·04 0·21 0·31 0·07 0·24 0·39 0·24 0·60 0·43 0·08 0·19Hock (kg) 0·19 0·07 0·42 0·36 0·05 0·15 0·55 0·15 0·28 0·81 0·12 0·15 1·02 0·09 0·09 1·31 0·32 0·25Ham (%)† 27·1 2·23 0·08 30·7 0·67 0·02 28·8 1·03 0·04 29·1 1·97 0·07 27·3 1·41 0·05 28·0 1·07 0·04Ham trimmed (%)‡ 64·3 4·88 0·08 62·8 1·81 0·03 66·2 2·68 0·04 65·5 2·75 0·04 69·9 2·99 0·04 64·4 4·46 0·07Ham bones (%)‡ 11·9 2·67 0·19 8·5 0·91 0·11 8·1 1·00 0·12 6·8 1·18 0·17 6·8 0·80 0·12 6·5 1·25 0·19Ham rind (%)‡ 10·1 1·76 0·17 8·9 1·00 0·11 11·3 1·39 0·12 13·6 3·08 0·23 11·5 2·31 0·20 15·8 3·07 0·19Tip of tenderloin (%)‡ 2·8 0·63 0·23 2·9 0·66 0·23 3·0 0·57 0·19 3·0 0·67 0·22 3·0 1·70 0·56 2·7 0·54 0·20Hock (%)‡ 9·9 3·91 0·40 10·2 1·50 0·15 8·4 2·24 0·27 7·9 1·26 0·16 7·9 0·74 0·09 8·2 1·99 0·24
† Ham as percentage of the left carcass side.‡ Components as percentage of the total weight of ham.
Table 4 Developmental change of the loin and its dissected components of the left carcass side during the growth period
Weight class (kg)
20 30 60 90 120 140
Loin component Mean s.d. CV Mean s.d. CV Mean s.d. CV Mean s.d. CV Mean s.d. CV Mean s.d. CV
Loin (kg) 0·74 0·16 0·21 1·32 0·08 0·06 3·34 0·35 0·11 5·42 0·46 0·09 8·28 1·05 0·13 9·98 1·02 0·10Loin trimmed (kg) 0·40 0·09 0·23 0·73 0·05 0·06 1·84 0·21 0·11 2·89 0·26 0·09 4·31 0·58 0·14 4·62 0·43 0·09Loin bones (kg) 0·24 0·04 0·19 0·36 0·07 0·18 0·72 0·11 0·15 1·06 0·12 0·12 1·49 0·22 0·15 1·83 0·19 0·10Backfat (kg) 0·09 0·02 0·21 0·13 0·02 0·18 0·53 0·13 0·24 1·13 0·24 0·22 1·71 0·66 0·39 3·06 0·78 0·26Tenderloin (kg) 0·05 0·003 0·08 0·09 0·02 0·20 0·22 0·06 0·28 0·30 0·06 0·20 0·41 0·06 0·16 0·41 0·09 0·21Loin (%)† 10·5 1·66 0·16 11·7 0·98 0·08 14·6 1·46 0·10 15·4 1·19 0·08 17·4 1·99 0·11 17·5 1·93 0·11Loin trimmed (%)‡ 54·2 4·33 0·08 55·2 3·85 0·07 55·4 3·47 0·06 53·3 3·39 0·06 52·6 8·19 0·16 46·4 3·88 0·08Loin bones (%)‡ 33·2 6·14 0·18 26·9 4·12 0·15 21·5 2·00 0·09 19·5 2·23 0·11 18·1 2·99 0·16 18·4 1·63 0·09Backfat (%)‡ 12·4 3·45 0·28 9·6 1·59 0·17 15·6 2·94 0·19 20·6 2·97 0·14 20·7 7·12 0·34 30·3 5·01 0·17Tenderloin (%)‡ 3·8 1·43 0·21 6·8 1·49 0·22 6·4 1·29 0·20 5·6 1·24 0·22 5·0 0·78 0·16 4·1 0·75 0·18
† Loin as percentage of the left carcass side.b ‡ Components as percentage of the total weight of loin.
Landgraf, Susenbeth, Knap, Looft, Plastow, Kalm and Roehe
892
decreased by 1·4 percent levels at 140 kg LW. During theentire growth, lipid content increased substantially from 7·0to 29·8%, this was mainly associated with a decrease inwater content from 74·1 to 52·9%.
Allometric growthCorrelations close to 1 indicate high goodness of fit of allo-metric growth of carcass fractions relative to EBWT asshown in Table 11. However, there were differences inRSD, which was lowest for bones (0·41 kg) and highest forlean tissue (1,14 kg). The soft tissue fraction grew relativelyfaster than the entire empty body. For fat tissue of the pri-mal cuts, the estimate of allometric growth rate was onlyslightly higher than for lean tissue. Allometric growth rates(b) of the fractions bones and viscera were similar but sub-stantially lower than 1 indicating a substantial lower growthrate relative to the empty body growth rate.
Table 12 shows the allometric growth of primal carcass cutsand their dissected components in relation to the EBWT.Relative growth of ham, shoulder and neck was only slightlyfaster (b , 1·05) than growth of the EBWT and those forshoulder and neck were not significant different from 1. Incontrast, loin grew more rapidly than the EBWT (b ¼ 1·32),whereas the allometric growth rate of the belly was less than
those of the loin but higher than those of the other primal car-cass cuts (b ¼ 1·14). Backfat resulted in highest allometricgrowth rate with b ¼ 1·79. The correlation between observedand predicted weights was mostly higher for the entire car-cass cuts than for their dissected components.
Allometric growth of organs in relation to the EBWT is pre-sented in Table 13. The relative accretion rate of organswas substantially less than 1 indicating that growth oforgans was relatively lower than growth of the entire emptybody. Lowest allometric growth rate was found for liver(b ¼ 0·61) and highest for spleen (b ¼ 0·90). Especially,leaf fat grew more rapidly (b ¼ 1·87) than the empty body.For growth of organs, the goodness of fit of allometric func-tions was high, ranging from r ¼ 0·83 to 0·96. These corre-lations were higher for liver and kidney than for heart, lungand spleen.
Allometric growths for the chemical body composition inrelation to EBWT are presented in Table 14. Accretion oflipid occurred relatively more rapidly than EBWT as thecoefficient of accretion rate exceeds 1 (b ¼ 1·75). In con-trast, accretion rate of water was reduced in comparisonwith EBWT as indicated by b ¼ 0·85. Accretion rate of pro-tein and ash were only slightly above 1 reflecting similarrelative gains as EBWT.
Table 5 Developmental change of the shoulder and its dissected components of the left carcass side during the growth period
Weight class (kg)
20 30 60 90 120 140
Shoulder component Mean s.d. CV Mean s.d. CV Mean s.d. CV Mean s.d. CV Mean s.d. CV Mean s.d. CV
Shoulder (kg) 1·06 0·21 0·20 1·86 0·07 0·04 3·50 0·22 0·06 5·32 0·41 0·08 6·78 0·44 0·07 8·33 0·77 0·09Shoulder trimmed (kg) 0·60 0·16 0·26 1·33 0·09 0·08 2·15 0·18 0·08 3·27 0·34 0·10 4·26 0·49 0·12 5·17 0·68 0·13Shoulder bones (kg) 0·31 0·24 0·79 0·22 0·04 0·16 0·46 0·11 0·25 0·55 0·05 0·08 0·66 0·07 0·11 0·74 0·07 0·10Shoulder rind (kg) 0·15 0·06 0·42 0·23 0·03 0·13 0·46 0·10 0·21 0·69 0·11 0·16 0·86 0·24 0·27 1·36 0·30 0·22Hock (kg) 0·08 0·04 0·56 0·27 0·05 0·17 0·45 0·12 0·26 0·71 0·09 0·12 0·94 0·15 0·16 0·98 0·17 0·18Shoulder (%)† 15·0 1·57 0·10 16·5 0·67 0·04 15·3 0·55 0·04 15·2 1·17 0·08 14·2 0·78 0·05 14·6 1·40 0·10Shoulder trimmed (%)‡ 56·9 11·93 0·21 61·1 4·32 0·07 61·2 1·82 0·03 61·3 2·95 0·05 62·8 6·07 0·10 61·9 3·14 0·05Shoulder bones (%)‡ 27·5 16·96 0·62 12·1 1·79 0·15 13·0 3·13 0·24 10·4 0·85 0·08 9·8 0·96 0·10 8·9 1·20 0·13Shoulder rind (%)‡ 14·3 5·07 0·35 12·5 1·48 0·12 13·2 2·87 0·22 13·0 2·14 0·17 12·6 3·52 0·28 16·4 4·16 0·25Hock (%)‡ 7·9 4·49 0·57 14·5 2·17 0·15 12·8 3·24 0·25 23·3 1·42 0·11 13·9 2·03 0·15 11·8 1·58 0·13
† Shoulder as percentage of the left carcass side.‡ Components as percentage of the total weight of shoulder.
Table 6 Developmental change of the belly and its dissected components of the left carcass side during the growth period
Weight class (kg)
20 30 60 90 120 140
Belly component Mean s.d. CV Mean s.d. CV Mean s.d. CV Mean s.d. CV Mean s.d. CV Mean s.d. CV
Belly (kg) 0·80 0·16 0·19 1·57 0·12 0·08 3·33 0·22 0·07 5·28 0·30 0·06 6·60 0·45 0·07 7·88 0·84 0·11Belly trimmed (kg) 0·38 0·07 0·19 0·86 0·16 0·19 1·66 0·38 0·23 2·90 0·54 0·18 4·40 0·61 0·14 5·28 0·68 0·13Belly ribs (kg) 0·16 0·07 0·47 0·25 0·05 0·20 0·52 0·11 0·21 0·73 0·11 0·15 0·99 0·14 0·14 0·99 0·14 0·15Belly rind (kg) 0·31 0·13 0·42 0·40 0·23 0·57 0·82 0·23 0·27 1·03 0·55 0·54 0·83 0·32 0·38 0·95 0·47 0·49Flank (kg) 0·09 0·01 0·16 0·10 0·07 0·71 0·40 0·17 0·43 0·74 0·29 0·39 0·79 0·21 0·27 1·19 0·23 0·19Belly (%)† 11·3 0·95 0·08 13·9 0·94 0·07 14·6 0·54 0·04 15·1 0·90 0·05 13·9 1·06 0·08 13·8 1·52 0·11Belly trimmed (%)‡ 49·1 12·82 0·26 54·9 10·44 0·19 49·6 9·79 0·20 54·9 10·19 0·19 66·6 7·22 0·11 67·0 6·67 0·10Belly ribs (%)‡ 19·1 6·19 0·32 16·2 3·35 0·21 15·6 4·12 0·26 13·9 2·32 0·17 15·1 2·30 0·15 12·6 1·74 0·14Belly rind (%)‡ 37·5 11·53 0·31 25·5 13·90 0·55 25·0 7·63 0·31 19·3 10·07 0·52 12·5 4·36 0·35 11·8 4·44 0·38Flank (%)‡ 13·8 2·17 0·16 6·0 3·70 0·62 11·6 4·65 0·40 14·2 5·42 0·38 12·1 3·48 0·29 15·3 3·38 0·22
† Belly as percentage of the left carcass side.‡ Components as percentage of the total weight of belly.
Growth of pigs: physical and chemical body composition
893

Table 7 Developmental change of the neck and its dissected components of the left carcass side during the growth period
Weight class (kg)
20 30 60 90 120 140
Neck component Mean s.d. CV Mean s.d. CV Mean s.d. CV Mean s.d. CV Mean s.d. CV Mean s.d. CV
Neck (kg) 0·69 0·16 0·24 0·98 0·11 0·11 2·06 0·28 0·14 3·19 0·36 0·11 4·33 0·42 0·10 5·01 1·07 0·21Neck trimmed (kg) 0·43 0·12 0·28 0·59 0·07 0·11 1·25 0·14 0·11 1·83 0·19 0·10 2·59 0·30 0·12 3·03 0·32 0·10Neck bones (kg) 0·22 0·05 0·21 0·25 0·05 0·18 0·41 0·09 0·23 0·62 0·15 0·25 0·83 0·10 0·12 0·95 0·29 0·31Neckfat (kg) 0·13 0·04 0·30 0·14 0·05 0·33 0·39 0·12 0·31 0·73 0·26 0·36 1·01 0·15 0·15 1·16 0·33 0·29Neck (%)† 9·8 1·40 0·14 8·7 0·86 0·10 9·0 1·13 0·13 9·1 0·97 0·11 9·1 0·95 0·10 8·8 1·76 0·20Neck trimmed (%)‡ 62·1 8·94 0·14 60·6 4·48 0·07 61·2 5·50 0·09 57·7 7·76 0·13 60·1 8·51 0·14 62·2 11·18 0·18Neck bones (%)‡ 31·5 4·32 0·14 25·6 3·14 0·12 19·7 3·47 0·18 19·3 4·04 0·21 19·3 2·78 0·14 19·4 5·33 0·27Neckfat (%)‡ 18·7 4·29 0·23 14·1 4·12 0·29 18·5 3·44 0·19 22·3 5·80 0·26 23·6 4·28 0·18 23·1 5·05 0·22
† Neck as percentage of the left carcass side.‡ Components as percentage of the total weight of neck.
Table 8 Developmental change of minor carcass cuts of the left carcass side during the growth period
Weight class (kg)
Minor carcasscomponents(kg)
20 30 60 90 120 140
Mean s.d. CV Mean s.d. CV Mean s.d. CV Mean s.d. CV Mean s.d. CV Mean s.d. CV
Head 0·54 0·15 0·28 0·76 0·05 0·06 1·27 0·12 0·09 1·86 0·14 0·08 2·19 0·16 0·07 2·69 0·18 0·07Jowl 0·23 0·09 0·38 0·46 0·09 0·19 0·83 0·21 0·25 1·21 0·16 0·13 1·76 0·24 0·14 2·22 0·15 0·07Thick rib 0·24 0·08 0·36 0·38 0·07 0·17 0·94 0·08 0·08 1·18 0·30 0·26 1·89 0·50 0·26 2·08 0·35 0·17Foreleg 0·08 0·03 0·34 0·13 0·02 0·15 0·25 0·04 0·14 0·52 0·19 0·37 0·41 0·15 0·36 0·39 0·08 0·22Hindleg 0·16 0·05 0·29 0·29 0·04 0·15 0·55 0·06 0·11 0·53 0·26 0·48 0·76 0·21 0·28 0·89 0·14 0·15Tail 0·11 0·06 0·57 0·17 0·05 0·32 0·26 0·09 0·35 0·46 0·17 0·37 0·42 0·09 0·22 0·51 0·29 0·56
Table 9 Developmental change of organs, empty gastrointestinal tract and leaf fat during the growth period
Weight class (kg)
20 30 60 90 120 140
Organ (kg) Mean s.d. CV Mean s.d. CV Mean s.d. CV Mean s.d. CV Mean s.d. CV Mean s.d. CV
Heart 0·11 0·01 0·09 0·17 0·05 0·28 0·31 0·14 0·46 0·37 0·04 0·11 0·40 0·16 0·40 0·51 0·05 0·10Liver 0·54 0·07 0·12 0·88 0·10 0·12 1·27 0·10 0·08 1·56 0·20 0·13 1·72 0·20 0·11 2·02 0·26 0·13Lung 0·35 0·13 0·37 0·48 0·09 0·18 0·77 0·13 0·18 0·85 0·15 0·17 1·08 0·14 0·13 1·15 0·41 0·36Spleen 0·04 0·01 0·18 0·07 0·01 0·15 0·11 0·02 0·18 0·20 0·02 0·09 0·23 0·09 0·40 0·25 0·08 0·33Kidney 0·10 0·02 0·17 0·16 0·02 0·13 0·28 0·03 0·10 0·32 0·04 0·13 0·40 0·05 0·13 0·44 0·03 0·06Trachea 0·20 0·03 0·16 0·31 0·08 0·27 0·53 0·09 0·17 0·67 0·05 0·08 0·81 0·09 0·11 0·91 0·16 0·18Intestinal tract 1·37 0·29 0·21 2·37 0·30 0·13 3·66 0·15 0·12 5·26 0·54 0·10 5·77 0·63 0·11 6·28 0·98 0·16Blood 0·86 0·16 0·18 1·52 0·17 0·11 2·38 0·37 0·16 3·42 0·43 0·13 4·19 0·48 0·12 4·56 0·47 0·10Leaf fat† 0·06 0·03 0·44 0·12 0·03 0·23 0·46 0·15 0·32 1·00 0·25 0·25 1·57 0·55 0·35 2·56 0·57 0·22
† Leaf fat is the entire tissue and not only lipid.
Table 10 Developmental change of the relative amount of chemical body composition on the empty body weight during the growth period
Weight class (kg)
20 30 60 90 120 140
Chemical component (%) Mean s.d. CV Mean s.d. CV Mean s.d. CV Mean s.d. CV Mean s.d. CV Mean s.d. CV
Water 74·07 1·59 0·02 71·33 1·63 0·02 62·35 1·99 0·03 58·90 2·70 0·05 60·70 5·83 0·10 52·87 4·47 0·08Lipid 7·04 1·11 0·16 8·39 1·49 0·18 17·40 2·26 0·13 21·49 2·84 0·13 22·86 5·35 0·23 29·75 4·61 0·15Protein 15·91 0·82 0·05 17·32 0·70 0·04 17·15 0·85 0·16 16·58 0·30 0·02 16·07 1·08 0·07 15·88 1·16 0·07Ash 3·01 0·25 0·08 2·99 0·39 0·13 3·13 0·22 0·07 3·06 0·22 0·07 3·14 0·22 0·07 2·91 0·34 0·12
Landgraf, Susenbeth, Knap, Looft, Plastow, Kalm and Roehe
894

Allometric accretion rates of the chemical components of thefractions soft tissue, bones and their accumulated value aswell as viscera in relation to the EBWT are given in Table 15.Highest allometric accretion rate of lipid (b ¼ 1·85) in relationto the EBWT was found in the soft tissue fraction but ofalmost similar rate in the viscera fraction. Substantial lowerrelative accretion rate of lipid (b ¼ 1·25) was obtained for thefraction bones, but this b value still exceeds 1 reflecting amore rapidly accumulating lipid than EBWT. Rate of accre-tion of protein (b ¼ 1·15) was above the rate of growth of theempty body in the soft tissue fraction and substantially lowerin the fractions bones and viscera with b ¼ 0·79 and 0·70,respectively. Accretion rate of water was slightly lower thanempty body growth rate in the soft tissue fraction, but sub-stantively lower in the fractions bones and viscera at almostequal magnitude. Ash accretion rate was similar to those ofthe empty body in the fractions soft tissue and bones, how-ever, much lower in the fraction viscera.
DiscussionEntire body and carcass compositionThe coefficient of variation of LW was substantially higher at20 kg LW than in other weight groups indicating the variationin growth during the adaptation period to the test station.Thereafter, the variation of LW was of small magnitude.Using commercial slaughter pigs, Ketels (1997) and Doedt(1997) estimated dressing percentages of 79·8% at about110 kg LW, which is within the range of those obtained at 90and 120 kg in the present study (Table 2). A developmentalchange of dressing percentage was shown by Wagner et al.(1999) with an increase from 68·1 to 76·2% when LW chan-ged from 25 to 129 kg and thereafter decreased to 75·7% at152 kg LW. In Table 2, dressing percentage increased from69·4 to 85·2% in the weight range from 20 to 120 kg anddecreased to 83·1% at 140 kg LW. Differences betweenstudies may partly be due to the use of different cutting sys-tems. In the half carcass of Large White £ Landrace cas-trates, Davis and Pryor (1977) reported fat and lean tissue of0·9 and 2·6 kg, respectively, at 19·8 kg LW and 5·8 and9·7 kg at 62 kg LW. The accumulated weights of these twotissues were lower than the corresponding weights of soft tis-sue fraction in the present study with 3·5 v. 4·5 kg and 15·5v. 16·8 kg for the corresponding weight groups, respectively.In Landrace, Davis and Kallweit (1979) reported for fat andlean tissue 0·9 and 3·2 kg at 17·5 kg LW and 17·2 and24·0 kg at 121 kg LW. At 70 kg carcass weight, Gu et al.(1992) obtained for five different genotypes 21 to 24 kg fattissue and 33 to 37 kg lean tissue of the entire carcass. Thisagrees well with the weight of soft tissue in the presentstudy, which represents the accumulated fat and lean tisureand was 55·8 kg (two times the weight of soft tissue fractionof 27·9 kg of the left carcass side) at 72 kg carcass weight.The weight of bones at equivalent LWs were higher than
Table 11 Estimated allometric growth functions† relating weights ofcarcass fractions to empty body weight
Components log a s.e. b s.e. r RSD‡ (kg)
Soft tissue 20·084 0·032 1·137 0·014 0·99 0·884Lean tissue§ 20·924 0·033 1·120 0·024 0·99 1·144Fat tissue§ 21·637 0·076 1·185 0·037 0·96 0·876Bones 20·709 0·033 0·774 0·013 0·99 0·408Viscera 20·546 0·025 0·792 0·022 0·98 0·800
† Allometric functions were fitted by linearizing the functions as log10
Y ¼ log10 a þ b log10 X.‡ RSD ¼ residual standard deviation.§ of the primal carcass cuts (ham, loin, shoulder, belly and neck).
Table 12 Estimated allometric growth functions† relating weights ofcarcass cuts and their dissected components to empty body weight
Carcass cut log a s.e. b s.e. r RSD‡ (kg)
Ham 21·040 0·026 1·047 0·012 0·99 0·448Ham trimmed 21·269 0·032 1·071 0·024 0·99 0·536Ham bones 21·664 0·056 0·776 0·025 0·94 0·107Ham rind 22·355 0·065 1·257 0·039 0·94 0·307Tip of tenderloin 22·589 0·103 1·044 0·063 0·81 0·104Hock 21·902 0·124 0·928 0·058 0·92 0·158Loin 21·826 0·051 1·318 0·034 0·98 0·686Loin trimmed 22·003 0·049 1·261 0·031 0·97 0·405Loin bones 21·951 0·058 1·022 0·027 0·97 0·154Backfat 23·447 0·122 1·789 0·064 0·92 0·482Tenderloin 22·685 0·082 1·097 0·038 0·91 0·063Shoulder 21·263 0·034 1·018 0·019 0·99 0·377Shoulder trimmed 21·559 0·047 1·061 0·033 0·98 0·356Shoulder bones 21·465 0·104 0·618 0·063 0·84 0·118Shoulder rind 22·199 0·101 1·050 0·045 0·91 0·193Hock 22·451 0·129 1·166 0·067 0·93 0·135Belly 21·520 0·036 1·138 0·023 0·99 0·453Belly trimmed 22·021 0·082 1·276 0·045 0·97 0·449Belly ribs 22·085 0·076 0·992 0·047 0·94 0·124Belly rind 21·332 0·177 0·621 0·101 0·55 0·368Flank 22·873 0·201 1·364 0·104 0·86 0·213Neck 21·514 0·063 1·032 0·027 0·96 0·461Neck trimmed 21·720 0·045 1·023 0·026 0·98 0·205Neck bones 21·720 0·089 0·774 0·052 0·89 0·148Neck rind 22·586 0·123 1·231 0·073 0·91 0·186
† Allometric functions were fitted by linearising the functions as log10
Y ¼ log10 a þ b log10 X.‡ RSD ¼ residual standard deviation.
Table 13 Estimated allometric growth functions† relating weights oforgans, empty gastro-intestinal tract and leaf fat to empty bodyweight
Fraction log a s.e. b s.e. r RSD‡ (kg)
Heart 21·867 0·151 0·719 0·076 0·83 0·093Liver 21·010 0·054 0·614 0·025 0·95 0·165Lung 21·255 0·076 0·617 0·044 0·84 0·193Spleen 22·522 0·081 0·900 0·043 0·85 0·051Kidney 21·867 0·053 0·710 0·031 0·96 0·036Trachea 21·645 0·069 0·752 0·039 0·94 0·095Blood 21·053 0·067 0·804 0·036 0·95 0·468Leaf fat 23·657 0·122 1·867 0·055 0·93 0·367
† Allometric functions were fitted by linearizing the functions as log10
Y ¼ log10 a þ b log10 X.‡ RSD ¼ residual standard deviation.
Table 14 Estimated allometric growth functions† relating weights ofchemical body components to empty body weight
Chemical component log a s.e. b s.e. r RSD‡ (kg)
Water 0·033 0·023 0·850 0·011 0·99 3·570Lipid 22·172 0·069 1·749 0·035 0·97 3·576Protein 20·820 0·026 1·005 0·014 0·99 0·879Ash 21·590 0·041 1·024 0·023 0·98 0·267
† Allometric functions were fitted by linearizing the functions as log10
Y ¼ log10 a þ b log10 X.‡ RSD ¼ residual standard deviation.
Growth of pigs: physical and chemical body composition
895

reported by Davis and Pryor (1977) and Davis and Kallweit(1979) because the present study additionally includedbones of head, tail and digits.
Development of primal carcass cutsCoefficients of variation of primal carcass cuts were mostlylower than their dissected components such as trimmed pri-mal cut, rind and bones. At 110 kg LW, Doedt (1997)obtained weights of 12·97, 6·87, 6·48, 6·87, 4·21, 1·28 and0·74 kg for ham, loin including backfat, shoulder, belly, neckincluding neckfat, backfat and neckfat weights, respectively.These correspond well with weights for ham, shoulder, bellyand neck measured in present study, but were lower inweights for loin, backfat and neckfat. For five different geno-types grown from 59 to 127 kg, Gu et al. (1992) reportedweights for ham, loin, shoulder, belly and neck from 6·5 to12·7, 5·2 to 11·0, 2·4 to 4·7, 3·0 to 5·9 and 3·0 to 6·2,respectively. This corresponds with the weight of ham of thepresent study but had substantial higher weight for the loinand lower weight for the shoulder. This may partly due tothe use of different cutting systems. Differences amonggenotypes for lean weight of the primal carcass cuts werefound by Gu et al. (1992). Furthermore, Wagner et al.(1999) reported in a study using five different genotypesthat the effect of genetic population was significant for allcarcass measurements.
Amount of lean tissue in ham as percentage of the totallean tissue in all primal carcass cuts developed substantiallydifferent in pigs studied by Gu et al. (1992) compared withour experimental pigs. In the present serial slaughter trial,lean tissue in ham as percentage of lean tissue in all primalcuts decreased from 41·3 to 10·3% at 20 to 140 kg LW. Incontrast, Gu et al. (1992) reported an increasing percentageof lean in ham on the total lean tissue of the carcass from21·7 to 43·7 at 59 to 127 kg LW, respectively. In the present
study, lean tissue of loin as percentage of the lean tissue inall primal carcass cuts increased from 14·5% at 20 kg to18·5% at 120 kg LW and decreased thereafter to 17·2%. Guet al. (1992) reported for lean tissue of loin on total lean ofcarcass an increase from 23·9 to 25·2% at 59 to 127 kg LW.Gu et al. (1992) obtained a consistent proportion of lean tis-sue of belly on the total lean of the carcass of 13·4% at 59to 127 kg LW, whereas in the present study lean tissue ofbelly as percentage of total lean tissue in the primal cutsincreased from 12·2% at 20 kg to 18·1% at 140 kg LW. Gen-erally, highest growth of primal carcass cuts was obtainedbetween 60 and 90 kg LW except for the loin that showedhighest growth between 90 and 120 kg LW.
Growth of organsAt 140 kg LW, organs had three to six times higher weightsthan at 20 kg LW. During growth, heart (0·4%), spleen(0·2%) and kidney (0·4%) showed an almost constant per-centage of the EBWT. In contrast, percentage of liver andlung of the EBWT decreased from 2·7 to 1·4% and 1·8 to0·8%, respectively.
For 19 to 122 kg EBWT, Doornenbal and Tong (1981)reported in Lacombe pigs weights from 94 to 354, 644 to1826, 452 to 1712, 52 to 183 and 116 to 330 g for heart,liver, lung (includes trachea), spleen and kidney weights,respectively. In the present study, all organ weights at114·7 kg EBWT were higher than in the study of Doornenbaland Tong (1981) except for the liver that was 6% heavierthan in our study. The higher organ weights may be due tothe higher protein deposition of the animals examined inthis study. For animals at 109 kg LW, Ketels (1997) obtainedweights of 357, 1682, 848, 170 and 661 g for heart, liver,lung, spleen and trachea, respectively. The correspondingresults of the present study were 370, 1560, 850, 200 and670 g for heart, liver, lung, spleen and trachea, respectively.Differences may be due to the different genotypes and/orthe presence or absence of blood in the organs, e.g. in thisstudy the heart was cut to empty it of blood. Leaf fatincreased exponentially above 120 kg and was associatedwith high variance among animals.
Chemical body compositionDifferent genetic potential of protein deposition and foodintake capacity may be the reason for the high variation oflipid content among animals in particular at high weight.Growing animals above their normal slaughter weight maylikely the reason for the high variation in lipid content. In astress-free environment and with adequate supply of essen-tial nutrients, the protein deposition depends on the energyintake above the maintenance. The protein depositionincreases with increase in energy intake up to a geneticdetermined maximum (PDmax; Whittemore and Fawcett,1976; Moughan and Verstegen, 1988). When this geneticdetermined PDmax was reached, additional absorbed feed-ing energy was used to deposit lipid (Mohn and De Lange,1998). Therefore, depending on genetic determined PDmax
and food intake capacity, the lipid deposition is expected todiffer substantially among animals. This was shown in thepresent study especially for higher weights.
Table 15 Estimated allometric growth functions† relating weights ofchemical components of the fractions soft tissue, bones and theiraccumulated value as well as viscera to empty body weight
Fraction Component log a s.e. b s.e. r RSD‡ (kg)
Softtissue
Water 20·725 0·044 0·984 0·016 0·98 1·457
Lipid 22·799 0·083 1·851 0·053 0·96 1·523Protein 21·577 0·029 1·147 0·023 0·99 0·360Ash 22·657 0·035 1·027 0·021 0·99 0·018
Bones Water 20·671 0·034 0·610 0·024 0·97 0·266Lipid 22·496 0·051 1·250 0·026 0·98 0·095Protein 21·493 0·042 0·794 0·019 0·98 0·105Ash 22·093 0·035 1·058 0·027 0·97 0·110
Softtissue þ
Bones Water 20·489 0·029 0·906 0·023 0·98 1·623Lipid 22·545 0·071 1·750 0·044 0·97 1·566Protein 21·315 0·033 1·063 0·015 0·99 0·383Ash 21·985 0·041 1·052 0·023 0·98 0·118
Viscera Water 20·395 0·037 0·622 0·019 0·96 0·598Lipid 23·300 0·103 1·822 0·055 0·93 0·650Protein 21·289 0·044 0·695 0·021 0·96 0·122Ash 22·399 0·061 0·666 0·032 0·88 0·014
† Allometric functions were fitted by linearizing the functions as log10
Y ¼ log10 a þ b log10 X.‡ RSD ¼ residual standard deviation.
Landgraf, Susenbeth, Knap, Looft, Plastow, Kalm and Roehe
896

For five different genotypes, Wagner et al. (1999) found anincrease in protein content as percentage of the EBWTfrom 13·8 to 14·7% at 25 to 45 kg LW and thereafter a con-tinuous decrease to 13·2% at 120 kg LW. In present study,protein content of the empty body increased in the firstgrowth phase (20 to 30 kg) from 15·9 to 17·3% and there-after decreased to 15·9% at 140 kg LW. This increase inprotein content can be explained by the development of pro-tein content in the fat-free substance in comparison to thedevelopment of lipid content of the entire empty body.During the entire growth period, percentage of protein of fatfree substance increased from 17·9 to 22·2%. Duringgrowth from 20 to 30 kg LW, the increase in protein accre-tion of fat-free substance was substantially higher than theaccretion of lipid so that the protein content relative tothe EBWT increased. After 30 kg LW, protein accretion inthe fat-free substance was lower than lipid accretion. Thisresulted in a decreasing protein accretion in relation to theempty body in the growth phase from 30 to 140 kg LW. Theincreasing protein content was not found by Susenbeth(1984) but the development of the other chemical com-ponents of empty body composition was similar as in thisstudy. Lipid content increased from 8 to 28%, water contentdecreased from 71 to 53% and protein content from 17 to15% between 20 and 115 kg EBWT (Susenbeth, 1984).However, the high percentage of lipid and low percentageof water was obtained at a much lower EBWT than in thepresent study. This indicates the high emphasis of selectionon lean content in the analysed population based on Pie-train sire. The increase in fat deposition seems to be onlypostponed to higher weight. In the present study, emptybody lipid content increased from 7·0 to 22·9% duringgrowth from 20 to 120 kg LW, whereas water contentdecreased from 74·1 to 60·7%. In comparison, Wagner et al.(1999) reported substantial higher lipid contents from 13·4to 32·8% between 25 and 129 kg LW and lower water con-tent from 66·5 to 49·3%. For semi-ad libitum fed LargeWhite pigs, slaughtered at 70 kg LW, Mohn and De Lange(1998) reported lipid, protein and water contents of 21·5,16·5 and 59·3%, respectively. This was similar to the valuesat 90 kg LW in the present study.
Allometric growth of physical body compositionAllometric coefficients for lean growth rate presented in theliterature ranged from b ¼ 0·75 to 1·06 and for fat growthrate from b ¼ 1·16 to 1·65 (Davis, 1974; Cole et al., 1976;Davis and Kallweit, 1979; Fortin et al., 1985 and 1987). Inthe present study an allometric growth coefficient of b ¼ 1·14was estimated for the soft tissue fraction. The allometricgrowth rate of lean tissue of all primal cuts was only slightlylower than those of fat tissue. This showed that the allometricfunction was not able to reflect the extreme increase of fattissue at 120 to 140 kg LW. Schinckel and de Lange (1996)discussed an augmented allometric function in order to bemore flexible in fitting relative relationship of growth.Trimmed primal carcass cuts showed allometric b valuesclose to 1 for lean growth in accordance with the literature(Kempster and Evans, 1979; Rook et al., 1987). Only loinand belly and their trimmed parts grew relatively faster(b ¼ 1·1 to 1·3) than the EBWT. There was high variation inallometric b values of fat deposition among primal carcass
cuts ranging from b ¼ 0·62 (belly rind) to 1·79 (backfat). Fortrimmed carcass cuts nearly the same allometric growth ratewas estimated as for the complete carcass cuts, except forbelly and loin, for which the trimmed part grew faster orlower, respectively, than the complete belly or loin. Thislower growth of the trimmed component of the loin was dueto rapid growth in backfat (b ¼ 1·79). Interestingly, the allo-metric growth rate of backfat (b ¼ 1·79) and leaf fat(b ¼ 1·87) was similar to the allometric growth rate of lipid ofthe entire empty body (b ¼ 1·75). These two carcass cutscan therefore be used as indicator cuts for the developmentof lipid deposition. The high association between backfatthickness and lipid deposition may be expected because ofits high part-whole correlation but not those of leaf fat andlipid deposition. Allometric growth rates of lean tissue andbones were higher in the primal carcass cuts loin and bellythan in ham, shoulder and neck. This corresponds withresults presented by Kempster and Evans (1979) who esti-mated allometric growth rates of lean tissue and bones incarcass cuts in relation to the total tissue weight for rumpback of b ¼ 1·05 and 1·06, for rib back of b ¼ 1·15 and 1·10,for rib streak of b ¼ 0·98 and 0·91, for ham of b ¼ 0·97 and0·93, and for shoulder of b ¼ 0·96 and 0·95, for collar ofb ¼ 1·03 and 1·07, respectively. Growth of ham trimmed(b ¼ 1·07) showed similar allometric growth rate in relation toEBWT than those of lean tissue growth in the entire body(b ¼ 1·12) and growth of ham rind (b ¼ 1·26) was similar tothose of fat tissue growth in the entire body (b ¼ 1·19).Therefore, the components of the ham can be used as goodindicator for lean and fat tissue growth of the entire body.
Of all body fractions, the lowest growth coefficient was esti-mated for bones, indicating that this fraction was the ear-liest maturing tissue and thus decreased as proportion ofcarcass side weight during growth (Fortin et al., 1987). Forgrowth of bones, Davis (1974), Cole et al. (1976), Davisand Kallweit (1979), Fortin et al. (1985 and 1987) esti-mated allometric b values from b ¼ 0·63 to 0·92 in relationto the carcass side weight; Davis (1983), Gu et al. (1992)estimated allometric b values from b ¼ 0·60 to 0·76 inrelation to carcass weight and Whittemore et al. (1988)and Whittemore (1993) estimated allometric b values inLarge White pigs of b ¼ 0·83 to 0·84 in relation to EBWT.In the present study, allometric growth coefficient of boneswas estimated also in relation to EBWT but its magnitudewas substantially lower with b ¼ 0·71 than given by the lat-ter authors. There may be genotype differences, becauseWhittemore (1993) analysed purebred Large White,whereas in the present study crosses between Pietrain anda crossbred dam line were used. This corresponds withresults of Fortin et al. (1987), who also obtained signifi-cantly lower allometric growth of bones for Pietrain than forLarge White. This also indicates that different breedsreached maturity at different LW.
In this study, for viscera a growth coefficient of b ¼ 0·73was estimated, which was similar to those (b ¼ 0·69) ofTess et al. (1986). All visceral organs grew slower than theempty body as indicated by allometric b values substantiallyless than 1. Doornenbal and Tong (1981) estimated thatheart (b ¼ 0·75), lung (b ¼ 0·80) and spleen (b ¼ 0·74)grew, in relation to LW, faster than kidney (b ¼ 0·69), liver
Growth of pigs: physical and chemical body composition
897

(b ¼ 0·66) and empty intestinal tract (b ¼ 0·66). In the pre-sent study, allometric growth rates were in general lowerexcept for the spleen and empty intestinal tract. In particu-lar, lung growth rate was substantially lower with b ¼ 0·62.This lung growth rate corresponds well with the rateobtained for a lowfat Duroc-Yorkshire line (b ¼ 0·61), butnot with the rate of highfat Beltsville line (b ¼ 0·44) reportedby Tess et al. (1986) and are slightly higher than the esti-mates of Rook et al. (1987) for Large White (b ¼ 0·58).Doornenbal and Tong (1981) obtained correlations for thefitted allometric growth functions between r ¼ 0·93 (spleen)to 0·99 (heart), whereas in the present study similar highcorrelations were obtained for trachea, liver and kidney(r ¼ 0·94 to 0·96), but lower correlations for lung, spleen,and heart (r ¼ 0·83 to 0·85).
Allometric growth of chemical body compositionWith increasing percentage of lipid in the empty body, adecrease in the percentage of water was almost inverselyproportional (slightly higher increase in percentage of lipid).Based on the allometric relationship of these components toEBWT, accretion rate for lipid showed the highest deviationfrom 1, which was highly significant (P , 0·001). In contrast,allometric accretion rates of protein and ash were almost 1and non-significant different from 1 (P . 0·5). In a weightrange from 20 to 200 LW, Whittemore et al. (1988) estimatedfor Large White £ Landrace pigs allometric b values forfemales of b ¼ 0·93, 0·83, 1·63 and 0·92 and for castratedmales of b ¼ 0·85, 0·78, 1·67 and 0·90 for protein, water,lipid and ash, respectively, in relation to EBWT. While thewater accretion rate was almost equal in both studies, pro-tein and ash accretion were slightly higher, and lipid accre-tion substantially higher in the present study. Accretion rateof protein of the total body was almost equal to the growth ofthe EBWT, however, the accretion rates of protein in thefractions soft tissue, bones and viscera varied substantiallybetween b ¼ 0·70 to 1·15. Interestingly, the accretion rate oflipid of the viscera fraction was almost as high as the accre-tion rate of lipid in the soft tissue. Although, the accretionrate of ash in total body (b ¼ 1·02) is almost equal to thegrowth rate of the EBWT, there was substantial sloweraccretion of ash in the viscera fraction (b ¼ 0·66).
General conclusionIn conclusion, the results indicate that lean tissue weightgain of the primal cuts per kg gain of the left carcass weightonly slightly increased from 517 g/kg at 30 to 60 kg to579 g/kg at 90 to 120 kg LW, but decreased to 398 g/kg at120 to 140 kg LW. This decrease was associated with anextreme increase in fat tissue growth. This early change inbody composition may indicate a very early maturity of thesecrossbred animals, which was sired by Pietrain. The resultsalso showed that there is a necessity to estimate the growthrate of different carcass cuts separately because there was asubstantial difference in growth rate, e.g. the fat tissue allo-metric growth rate was b ¼ 0·62 for belly fat but b ¼ 1·79 forbackfat above the m. longissumus dorsi. The allometricgrowth rates of ham trimmed and ham rind were similar torates of lean and fat tissue of the entire empty body, respect-ively, and thus, most usable as indicator cuts. Also, the
growth of bones of the entire empty body was most appropri-ately reflected by the allometric growth rate of bones of theham. As indicator cuts for accretion rate of lipid, protein andash of the entire empty body, backfat above the m. longissu-mus dorsi or leaf fat, the trimmed ham and the loin bones,respectively, were most appropriate. However, lipid did notgrow allometrically to EBWT above 120 kg. Generally, theestimated allometric growth rates of primal carcass cuts,body tissue and chemical body composition are essentialinput parameters of a pig growth model in order to estimatefor example nutritional requirements of very lean pigs, theoptimal slaughter weights based on the change of carcasscuts during growth, the determination of selection goals con-cerning lean tissue growth and food intake capacity as wellas other issues to improve the efficiency of the entire pig pro-duction system (De Lange et al., 2003; Knap et al., 2003;Pomar et al., 2003). These relationships can be substantiallyinfluenced by the type of the pig (as difference in leanness)and has to be monitored in each line of interest. Therefore,the obtained estimates for growth of body composition areespecially of interest for pigs highly selected for lean content.
AcknowledgementsWe wish to thank the Landwirtschaftskammer Schleswig-Holsteinfor using their performance test station as well as PIC-Germany forproviding the animals. This work was supported by Deutsche For-schungsgemeinschaft (DFG) and Sygen International.
ReferencesAkridge, J. T., Brorsen, B. W., Whipker, L. D., Forrest, J. C.,Kuei, C. H. and Schinckel, A. P. 1992. Evaluation of alternativetechniques to determine pork carcass value. Journal of AnimalScience 70: 18-28.
Berg, R. T., Andersen, B. B. and Liboriussen, T. 1978. Growth ofbovine tissues. 1. Genetic influences on growth patterns of muscle,fat and bone in young bulls. Animal Production 26: 245-258.
Brody, S. 1945. Bioenergetics and growth. Reinhold PublishingCorp., New York.
Cole, D. J. A., White, M. R., Hardy, B. and Carr, J. R. 1976.Tissue growth in the pig. Animal Production 22: 341-350.
Davis, A. S. 1974. A comparison of tissue development in Pietrainand Large White pigs from birth to 64 kg live weight 2. Growthchanges in muscle distribution. Animal Production 19: 377-387.
Davis, A. S. 1983. Growth and development in pigs: a reanalysis ofthe effects of nutrition on body composition. Journal of AgriculturalScience, Cambridge 100: 681-687.
Davis, A. S. and Kallweit, E. 1979. The effect of body weight andmaturity on the carcass composition in pig. Zeitschrift fur Zuch-tungskunde und Zuchtungsbiologie 96: 6-17.
Davis, A. S. and Pryor, W. J. 1977. Growth changes in the distri-bution of dissectable and intramuscular fat in pigs. Journal of Agri-cultural Science, Cambridge 89: 257-266.
De Lange, C. F. M., Morel, P. C. H. and Birkett, S. H. 2003. Mod-eling chemical and physical body composition of the growing pig.Journal of Animal Science 81: (suppl. 2) E159-E165.
Doedt, H. 1997. Qualitative und wirtschaftliche Aspekte derSchweineproduktion unter Berucksichtigung von Handelswert undGesundheitsstatus. Doctoral thesis, University Kiel, Germany.
Doornenbal, H. and Tong, A. K. W. 1981. Growth, developmentand chemical composition of the pig. IV. Relative growth of visceralorgans. Growth 45: 279-285.
Evans, D. G. and Kempster, A. J. 1979. The effect of genotype,sex and feeding regimen on pig carcass development. 1. Primary
Landgraf, Susenbeth, Knap, Looft, Plastow, Kalm and Roehe
898

components, tissues and joints. Journal of Agricultural Science,Cambridge 93: 339-347.
Fortin, A., Wood, J. D. and Wehlehan, O. P. 1987. Breed andsex effects on the development and proportions of muscle, fatand bone in pigs. Journal of Agricultural Science, Cambridge108: 39-45.
Fortin, A., Wood, J. D. and Wehlehan, O. P. 1985. Develop-ment of carcass tissues in entire male and female Large White,Pietrain and Iron Age pigs. Animal Production 40: 541-542(abstr.).
Fujii, J., Otsu, K., Zorzato, F., de Leon, S., Khanna, V. K., Wei-ler, J. E., O’Brien, P. J. and Maclennan, D. H. 1991. Identificationof a mutation in porcine ryanodine receptor associated with malig-nant hyperthermia. Science 153: 448-451.
Gu, Y., Schinckel, A. P. and Martin, T. G. 1992. Growth, develop-ment and carcass composition in five genotypes of swine. Journalof Animal Science 70: 1719-1729.
Huxley, J. S. 1932. Problems of relative growth. Methuen, London.
Kempster, A. J. and Evans, D. G. 1979. The effects of genotype,sex and feeding regimen on pig carcass development. 2. Tissueweight distribution and fat partition between depots. Journal of Agri-cultural Science, Cambridge 93: 349-358.
Ketels, O. 1997. Zerlegekalkulation bei Jungbullen und okono-mische Bewertung der Schlachtnebenprodukte bei Jungbullen undMastschweinen. Doctoral thesis, University Kiel, Germany.
Knap, P. W., Roehe, R., Kolstad, K., Pomar, C. and Luiting, P.2003. Characterization of pig genotypes for growth modeling. Jour-nal of Animal Science 81: (suppl.2) E187-E195.
Landgraf, S., Susenbeth, A., Knap, P. W., Looft, H.,Plastow, G. S., Kalm, E. and Roehe, R. 2006. Allometric associ-ation between in vivo estimation of body composition during growthusing deuterium dilution technique and chemical analysis of serialslaughtered pigs. Animal Science 82: 223-231.
Mohn, S. and De Lange, C. F. M. 1998. The effect of body weighton the upper limit to protein deposition in a defined population ofgrowing gilts. Journal of Animal Science 76: 124-133.
Mohrmann, M., Roehe, R., Knap, P. W, Looft, H., Plastow, G. S.and Kalm, E. 2006a. Quantitative trait loci associated with Auto-FOM grading characteristics, carcass cuts and chemical body com-position during growth of Sus scrofa. Animal Genetics (In press).
Mohrmann, M., Roehe, R., Susenbeth, A., Baulain, U.,Knap, P. W., Looft, H., Plastow, G. S. and Kalm, E. 2006b.Association between body composition of growing pigs determinedby magnetic resonance imaging, deuterium dilution technique, andchemical analysis. Meat Science 72: 518-531.
Moughan, P. J. and Verstegen, M. W. A. 1988. The modelling ofgrowth in the pig. Netherlands Journal of Agricultural Science 36:145-166.
Pomar, C., Kyriazakis, I., Emmans, G. C. and Knap, P. W. 2003.Modeling stochasticity: dealing with populations rather than individualpigs. Journal of Animal Science 81: (suppl.2) E178-E186.
Rook, A. J., Ellis, M., Whittemore, C. T. and Phillips, P. 1987.Relationship between whole-body chemical composition, physicallydissected carcass parts and backfat measurements in pigs. AnimalProduction 44: 263-273.
Scheper, J. and Scholz, W. 1985. DLG-Schnittfuhrung fur die Zer-legung der Schlachtkorper von Rind, Kalb, Schwein und Schaf.Arbeitsunterlagen DLG, Frankfurt am Main.
Schinckel, A. P. and de Lange, C. F. M. 1996. Characterization ofgrowth parameters needed as inputs for pig growth models. Journalof Animal Science 74: 2021-2036.
Seebeck, R. M. 1968. Developmental studies of body composition.Animal Breeding Abstracts 36: 167-181.
Statistical Analysis Systems Institute. 1992. SAS user’s guide,version 6. SAS Institute Inc., Cary, NC.
Susenbeth, A. 1984. Berechnung der Korperzusammensetzungvon Schweinen aus dem mit Hilfe von D2O bestimmten Korper-wassser. Doctoral thesis, University Hohenheim, Germany.
Tess, M. W., Dickerson, G. E., Nienaber, J. A. and Ferrell, C. L.1986. Growth, development and body composition in three geneticstocks of swine. Journal of Animal Science 62: 968-979.
Tholen, E., Baulain, U., Henning, M. D. and Schellander, K. 2003.Comparison of different methods to assess the composition of pigbellies in progeny testing. Journal of Animal Science 81: 1177-1184.
Wagner, J. R., Schinckel, A. P., Chen, W., Forrest, J. C. andCoe, B. L. 1999. Analysis of body composition changes of swineduring growth and development. Journal of Animal Science 77:1442-1466.
Whittemore, C. T. 1993. Growth and body composition changesin pigs. In The science and practice of pig production, 2nd ed.pp. 53-86. Blackwell Science Ltd, Oxford.
Whittemore, C. T. and Fawcett, R. H. 1976. Theoretical aspectsof a flexible model to simulate protein and lipid growth in pigs. Ani-mal Production 22: 87-96.
Whittemore, C. T., Tullis, J. B. and Emmans, G. C. 1988. Proteingrowth in pigs. Animal Production 46: 437-445.
(Received 22 September 2005—Accepted 19 July 2006)
Growth of pigs: physical and chemical body composition
899