Decomposition Algorithms with Parametric Gomory Cuts for ...
Upload
khangminh22Category
view
2download
0
i
Revised Draft
Why SAFTA?
Aparna Sawhney*
Rajiv Kumar**
*Associate Professor, Jawaharlal Nehru University, New Delhi, India; E-mail: [email protected] ** Director & Chief Executive Officer, Indian Council for Research on International Economic Relations
(ICRIER), New Delhi, India. Email: [email protected]
This paper is written under a research grant from the Economic Affairs Division of the
Commonwealth Secretarial, London to CUTS International, Jaipur. Views expressed in this
paper are those of the authors and not necessarily reflect those of their institutions and of the Commonwealth Secretariat and CUTS International.

ii

iii
Table of Content
Acronyms and Abbreviations....................................................................................... iv
1. Introduction ................................................................................................................1
2. Intra-Regional and Extra-Regional Trade of South Asia ...........................................3
3. Current State of SAFTA.............................................................................................8
5. SAFTA in the Context of the WTO and Other South Asian FTAs..........................15
6. Potential Areas of Enhanced Cooperation in South Asia.........................................19
7. South Asian Cooperation as a Tool for Development..............................................21
8. Policy Recommendations.........................................................................................23
References ....................................................................................................................25
Annexure ......................................................................................................................28
List of Tables Table 1: Intra-Regional and Total Trade of South Asian
Countries* (in US$mn and percentage share), 1991-2006............................ 4
Table 2: Share of Intra-regional Trade for the SAARC Members, 2005..................... 5
Table 3: Estimated Value of Bilateral Informal Trade in South Asia (in US$mn)...... 7
Table 4: Simple Average MFN Applied Tariff in South Asian Countries, 2005-06 .. 9
Table 5: Major Export Markets of South Asian Countries and Duties Faced............ 10

iv
Acronyms and Abbreviations
ASEAN Association of Southeast Asian Nations
BIMSTEC Bay of Bengal Initiative for Multi-Sectoral Technical and
Economic Cooperation
CGE Computable General Equilibrium
CU Custom Union
DFQF Duty Free Quota Free
EU European Union
GDP Gross Domestic Product
GTAP Global Trade Analysis Project
EU European Union
FTA Free Trade Area
LDCs Lease Developed Countries
NAFTA North American Free Trade Area
NTBs Non-Tariff Barriers
RMGs Readymade Garments
RoO Rules of Origin
RTA Regional Trade Agreement
QRs Quantitative Restrictions
SAARC South Asian Association of Regional Cooperation
SAFTA South Asian Free Trade Area
SAPTA South Asian Preferential Trade Agreement
S&DT Special and Differential Treatment
TLP Trade Liberalisation Programme
WTO World Trade Organisation
1
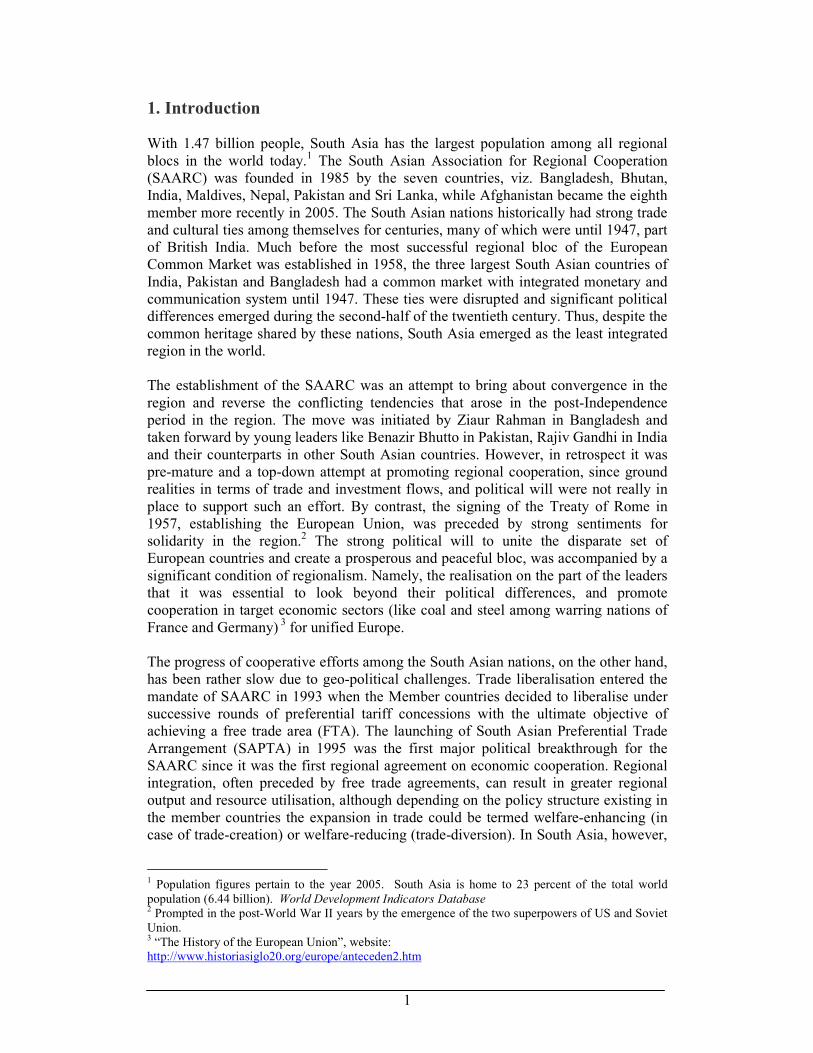
1. Introduction With 1.47 billion people, South Asia has the largest population among all regional blocs in the world today.
1 The South Asian Association for Regional Cooperation
(SAARC) was founded in 1985 by the seven countries, viz. Bangladesh, Bhutan, India, Maldives, Nepal, Pakistan and Sri Lanka, while Afghanistan became the eighth member more recently in 2005. The South Asian nations historically had strong trade and cultural ties among themselves for centuries, many of which were until 1947, part of British India. Much before the most successful regional bloc of the European Common Market was established in 1958, the three largest South Asian countries of India, Pakistan and Bangladesh had a common market with integrated monetary and communication system until 1947. These ties were disrupted and significant political differences emerged during the second-half of the twentieth century. Thus, despite the common heritage shared by these nations, South Asia emerged as the least integrated region in the world. The establishment of the SAARC was an attempt to bring about convergence in the region and reverse the conflicting tendencies that arose in the post-Independence period in the region. The move was initiated by Ziaur Rahman in Bangladesh and taken forward by young leaders like Benazir Bhutto in Pakistan, Rajiv Gandhi in India and their counterparts in other South Asian countries. However, in retrospect it was pre-mature and a top-down attempt at promoting regional cooperation, since ground realities in terms of trade and investment flows, and political will were not really in place to support such an effort. By contrast, the signing of the Treaty of Rome in 1957, establishing the European Union, was preceded by strong sentiments for solidarity in the region.2 The strong political will to unite the disparate set of European countries and create a prosperous and peaceful bloc, was accompanied by a significant condition of regionalism. Namely, the realisation on the part of the leaders that it was essential to look beyond their political differences, and promote cooperation in target economic sectors (like coal and steel among warring nations of France and Germany)
3 for unified Europe.
The progress of cooperative efforts among the South Asian nations, on the other hand, has been rather slow due to geo-political challenges. Trade liberalisation entered the mandate of SAARC in 1993 when the Member countries decided to liberalise under successive rounds of preferential tariff concessions with the ultimate objective of achieving a free trade area (FTA). The launching of South Asian Preferential Trade Arrangement (SAPTA) in 1995 was the first major political breakthrough for the SAARC since it was the first regional agreement on economic cooperation. Regional integration, often preceded by free trade agreements, can result in greater regional output and resource utilisation, although depending on the policy structure existing in the member countries the expansion in trade could be termed welfare-enhancing (in case of trade-creation) or welfare-reducing (trade-diversion). In South Asia, however,
1 Population figures pertain to the year 2005. South Asia is home to 23 percent of the total world population (6.44 billion). World Development Indicators Database 2 Prompted in the post-World War II years by the emergence of the two superpowers of US and Soviet Union. 3 “The History of the European Union”, website: http://www.historiasiglo20.org/europe/anteceden2.htm

2
intra-regional trade failed to pick up pace under the SAPTA due to limited product coverage and tariff preferences (limitations which were built into the agreement), and hence there has been little scope of welfare effects, whether trade-creating or trade diverting. A decade after the preferential trade arrangement (PTA) took effect, the South Asian Free Trade Agreement (SAFTA) was signed in 2004 and came into effect in 2006, replacing the SAPTA. But SAFTA is not an ambitious free trade agreement, given that member nations retain sensitive lists of commodities (not covered for preferential treatment) and services trade is excluded. Investment too has been left out of the ambit of the agreement, with just a notion that contracting members would consider removing barriers to intra-regional investment (under Article 8, SAFTA) even though the members were “convinced” that investment is important in strengthening the regional economy. Even the implementation of SAFTA has faced political hurdles. For instance, the denial of the Most Favoured Nation (MFN) status by Pakistan to India when both are WTO members (representing a clear violation of the WTO charter) is the result of the political divide between India and Pakistan.
4 Consequently,
political issues have overshadowed economic interests in the official corridors, although cultural linkages between the nations remain strong. Thus apprehensions abound as to how effectively the schedules of the SAFTA agreement would actually be implemented. Yet the potential strategic significance of a unified South Asian region is obvious from the keen interest shown by China, Japan, South Korea and US in the SAARC forum. While China and Japan were given observer status at the Dhaka Summit in 2005, the US and South Korea made formal requests to obtain observer status in 2006, and the EU has indicated its interest in a similar status. Most analysts are of the opinion that pure economic gains from freer trade regime that results from regional integration in South Asia will at best be modest. However, the political-strategic implications of South Asian integration and possible economic gains from the emergence of regional production networks and concomitant intra-industry trade within the region could be significant enough to attract the attention of global economic players. This paper analyses the significance of the SAFTA in light of the recent enthusiasm for greater integration among the SAARC members, despite the dismal intra-regional trade pattern observed over the last decade. Although much of the literature on South Asian regional trade has been rather critical of the welfare implications of an FTA, SAFTA was pushed into effect only last year. Considering the fervour with which innumerable PTAs have been implemented across the globe through the 1990s, SAFTA seems to be a South Asian response to this undeniable trend of regionalism. So is SAFTA purely a political statement in a world trading system increasingly dominated by regional trade groups? Or is there any scope of enhancing intra-regional trade in South Asia? The SAFTA Members also party to several other PTAs, which make for a rather complicated system of trade concessions. This essentially raises the question of the prospect of SAFTA in the face of the myriad bilateral, sub-regional and multilateral trade arrangements. This paper looks at the current trading pattern in
4 Based on their continued territorial conflict over the state of Kashmir.
3
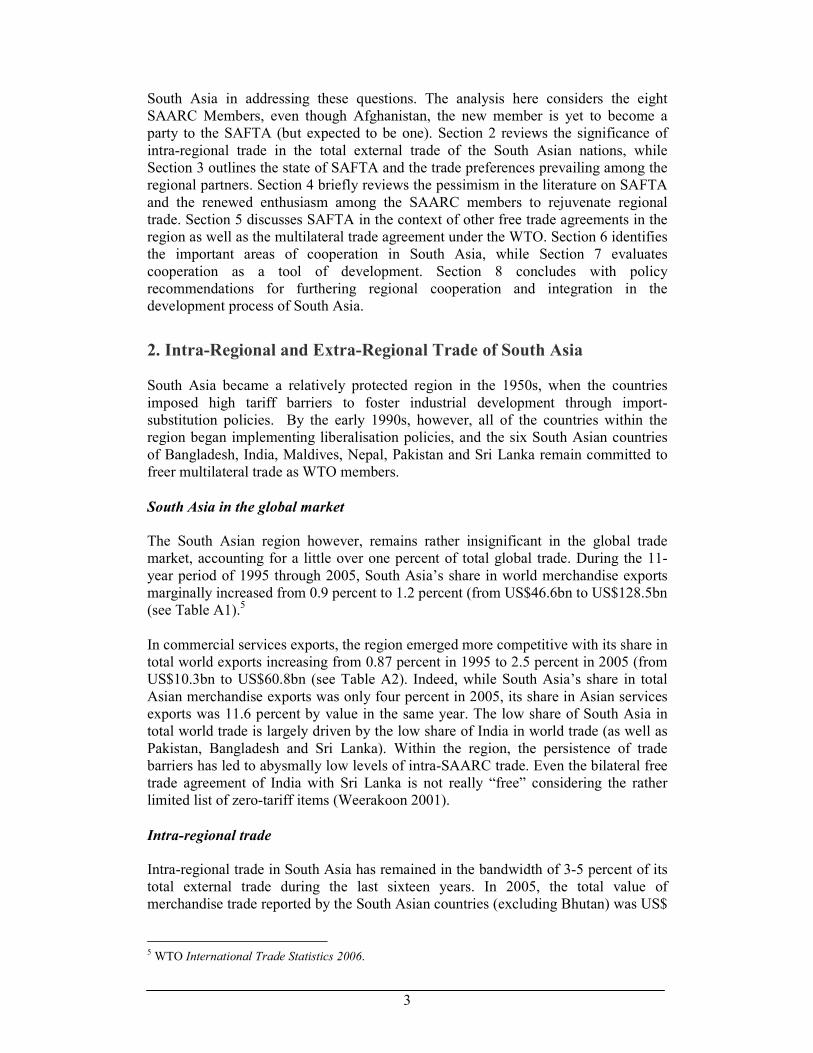
South Asia in addressing these questions. The analysis here considers the eight SAARC Members, even though Afghanistan, the new member is yet to become a party to the SAFTA (but expected to be one). Section 2 reviews the significance of intra-regional trade in the total external trade of the South Asian nations, while Section 3 outlines the state of SAFTA and the trade preferences prevailing among the regional partners. Section 4 briefly reviews the pessimism in the literature on SAFTA and the renewed enthusiasm among the SAARC members to rejuvenate regional trade. Section 5 discusses SAFTA in the context of other free trade agreements in the region as well as the multilateral trade agreement under the WTO. Section 6 identifies the important areas of cooperation in South Asia, while Section 7 evaluates cooperation as a tool of development. Section 8 concludes with policy recommendations for furthering regional cooperation and integration in the development process of South Asia.
2. Intra-Regional and Extra-Regional Trade of South Asia South Asia became a relatively protected region in the 1950s, when the countries imposed high tariff barriers to foster industrial development through import-substitution policies. By the early 1990s, however, all of the countries within the region began implementing liberalisation policies, and the six South Asian countries of Bangladesh, India, Maldives, Nepal, Pakistan and Sri Lanka remain committed to freer multilateral trade as WTO members.
South Asia in the global market The South Asian region however, remains rather insignificant in the global trade market, accounting for a little over one percent of total global trade. During the 11-year period of 1995 through 2005, South Asia’s share in world merchandise exports marginally increased from 0.9 percent to 1.2 percent (from US$46.6bn to US$128.5bn (see Table A1).5 In commercial services exports, the region emerged more competitive with its share in total world exports increasing from 0.87 percent in 1995 to 2.5 percent in 2005 (from US$10.3bn to US$60.8bn (see Table A2). Indeed, while South Asia’s share in total Asian merchandise exports was only four percent in 2005, its share in Asian services exports was 11.6 percent by value in the same year. The low share of South Asia in total world trade is largely driven by the low share of India in world trade (as well as Pakistan, Bangladesh and Sri Lanka). Within the region, the persistence of trade barriers has led to abysmally low levels of intra-SAARC trade. Even the bilateral free trade agreement of India with Sri Lanka is not really “free” considering the rather limited list of zero-tariff items (Weerakoon 2001).
Intra-regional trade Intra-regional trade in South Asia has remained in the bandwidth of 3-5 percent of its total external trade during the last sixteen years. In 2005, the total value of merchandise trade reported by the South Asian countries (excluding Bhutan) was US$
5 WTO International Trade Statistics 2006.

4
318bn, of which only US$16.9bn was destined for regional partners.6 In effect intra-regional trade in South Asia accounted for barely 5.3 percent of its total world trade in 2005. Although in value terms intra-SAARC trade has increased substantially over the last 15 years, from US$1.99bn in 1991 to US$19.6bn in 2006, it remains insignificant as a proportion of the region’s total external trade. Table 1 shows the value of intra-regional trade and total world trade of South Asia from 1991 through 2006.
Table 1: Intra-Regional and Total Trade of South Asian Countries* (in US$mn
and percentage share), 1991-2006 Year Value of intra-
regional trade Value of total trade
with the world % share of intra-regional trade in total trade of South
Asia 1991 1991.71 64071.20 3.11
1992 2607.31 72719.13 3.59
1993 2562.82 73898.11 3.47
1994 3028.86 82315.56 3.68
1995 4364.03 104434.77 4.18
1996 5057.40 111749.30 4.53
1997 5158.42 119510.09 4.32
1998 5533.12 118769.41 4.66
1999 5131.37 129167.55 3.97
2000 5761.15 142259.05 4.05
2001 6390.36 151486.11 4.22
2002 7450.41 157710.60 4.72
2003 10635.93 192430.64 5.53
2004 12982.06 244438.80 5.31
2005 16925.88 318285.68 5.32
2006** 19657.72 410834.30 4.78 Source: IMF DOTS database. Last accessed October 10, 2007.
* The above data covers the seven South Asian countries of Afghanistan, Bangladesh, India, Maldives Nepal, Pakistan, and Sri Lanka. Bhutan does not report its data to the IMF DOTS database. ** Data for 2006 is estimated.
Country pattern of intra-regional merchandise trade: The South Asian bloc is distinct from other regional blocks in the world, since it is dominated by a few large countries (India, Pakistan, Bangladesh and Sri Lanka in terms of total value of external trade) which have had bilateral political conflicts, and which trade largely with the rest of the world rather than their neighbours. The smaller countries like Nepal and Afghanistan are more integrated with the regional economy. India is by far the largest trading country in South Asia, but virtually all of its formal trade is with the rest of the world. Even for Pakistan and Bangladesh, intra-regional trade is not as important as it is for the smaller countries of the region. In 2005, intra-regional trade (exports plus imports) in South Asia was estimated to be US$16.9bn, of which US$6.57bn was reported from India, i.e. a share of 42 percent of the total intra-regional trade. However, for India, trade with other SAARC members constituted
6 Based on IMF DOTS data on exports from Afghanistan, Bangladesh, India, Maldives, Nepal, Pakistan, and Sri Lanka.

5
barely 2.8 percent of its total external trade (see Table 2). Considering the export-import components of India’s trade in the region, intra-regional merchandise exports constituted 5.39 percent of India’s total exports to the world, while imports from the region accounted for only 0.96 percent of India’s total imports from the world (see Table A3 and A4). Similarly, for the second largest country in the region, Pakistan, trade is biased towards the rest of the world, where trade with its SAARC partners constituted only 6 percent of its total external trade in 2005. Intraregional exports constituted 11.2 percent of Pakistan’s total exports to the world, while intra-regional imports constituted only three percent of its total imports from the world. Trade in Bangladesh too is biased towards the rest of the world, although it seems to source a sizeable amount of imports from within the region, about 15 percent (see Table 3A and 4A). Notably, Bangladesh’s trade within the region is dominated by its bilateral trade with India – for both exports and imports. Sri Lanka’s commerce is relatively more integrated with the region, with intraregional trade constituting 17 percent of its total external trade. By contrast, for a small country like Nepal and Afghanistan, intra-regional trade constituted about half of their total external trade in 2005 (see Table 2). The bilateral pattern of export and import among SAARC members (reported in Tables 3A and 4A at the end of the paper) show that Nepal’s trade with the region is driven completely by its trade with India. Indeed India is the largest regional trading partner of the SAARC countries. On the other hand, Afghanistan exports largely to India and Pakistan, and most of its imports are sourced from Pakistan. Table 2 summarises the significance of intra-regional trade of the SAARC members (in terms of the share of intra-regional trade in the country’s total external trade) for the year 2005.
Table 2: Share of Intra-regional Trade for the SAARC Members, 2005
Reporting Country
Trade with SAARC members (US$
million) Total trade with
world (US$ million) Share of intra-regional trade to total trade (%)
Afghanistan 1,451.93 3,240.88 44.80
Bangladesh 2,309.22 22,345.30 10.33
Bhutan − − −
India 6,570.25 232,608.10 2.82
Maldives 146.50 843.62 17.37
Nepal 1,265.27 2,544.95 49.72
Pakistan 2,562.74 41,456.00 6.18
Sri Lanka 2,636.71 15,246.83 17.29
Region Total 16925.88 31.8285.68 5.32 Source: Based on IMF DOTS data (last accessed October 10, 2007).
Significance of informal intra-regional trade A remarkable feature of South Asia is its substantial informal trade. Among certain SAFTA Members, informal trade is rather significant and often greater in value than the official trade reported between countries. For instance, bilateral unofficial trade (exports plus imports) of India with Bhutan, Nepal, Pakistan, and Sri Lanka were

6
estimated to be more than their respective official trade in the 1990s.7 The thriving informal trade has been mainly driven by differences in the tariff structures among the South Asian countries, as well as the incidence of high transactions costs in the formal routes. For example, relatively low tariff rates in Nepal prompted smuggling of foreign merchandise into countries like Bangladesh and India, which had relatively high import tariffs on these products. Similarly, part of the unofficial imports from Sri Lanka into India consists of third country goods that face high import duties in India. Sustained reduction in tariff schedules among the South Asian nations through the 1990s however has not reduced informal trade. A more recent survey (Taneja et al 2005) found that India’s bilateral informal trade with Nepal and Sri Lanka continues to thrive, even after the implementation of free trade agreements. The main factor encouraging informal trade in goods is lower transactions costs, including faster delivery time, absence of procedural delays, absence of paperwork, avoidance of domestic taxes, and faster realisation of payments. In some cases lack of information of newer trade arrangements (e.g. the Indo-Sri Lanka FTA) and ethnic ties were also cited as reasons for informal transactions among traders. However, the incidence of time costs in doing business through the formal channels seems to be an important factor that continues to encourage illegal trade in South Asia. Informal trade in services is also important among South Asian countries, as this sector continues to remain outside the purview of concessions and free trade arrangement. For example, Rahman (2002) estimated that annually 50,000 Bangladeshis visit India for medical treatment and a similar number travel to seek education in Indian academic institutions. Trade in these services remain largely unreported as the Bangladeshis travel on tourist visas in order to avoid transactions costs like documentations required for medical treatment (evidence of treatment and prescription, ability to pay in foreign currency, endorsement of foreign currency by Bank, details of medical services sought in India, etc). Although part of the service import expenditure by Bangladeshis is captured in the formal tourism channel, most of the import of the medical and education services are not reflected in the formal trade flow as funds are transferred through informal routes including hundi and personal cash. While an amount of US$42mn was transferred through official channels from Bangladesh to India through foreign exchange endorsement (however, official endorsement by patients and students going to India was only US$1.54mn, indicating that official endorsements for other services like tourism largely get used for health and education import), an estimated US$58mn was transferred through informal channels (Rahman 2002, page 219). This also indicates the extent of potential revenue loss that informal trade poses to the governments of both countries. Table 3 summarises some of the estimates in the literature on bilateral informal trade among South Asian countries. The value of informal trade among some of the South Asian countries is quite substantial, perhaps even more than the official trade as in the case of India and Nepal.
7 See Taneja (1999) for a good overview of the causes, pattern and extent of informal trade among SAARC countries. The study provides a review of earlier estimates of illegal bilateral trade and also reports trade estimates from a survey done in 1999 among customs officials, chambers of commerce and traders.

7
In closing this section, we observe that if one takes into account the informal trade of the region together with the reported formal trade, the total intra-regional trade would be certainly higher than five percent of the region’s total (world) trade, but it would still remain less than a 10th of the region’s total external trade. The abysmally low levels of intra-regional trade are rooted in restrictive trade agreements and other factors that are responsible for the overall low economic integration in South Asia. The new Indian policy announced in April 2007 to offer unilateral liberalisation to its least developed SAARC partners (including Afghanistan, Bangladesh, Bhutan, Nepal and Maldives) is an initiative to move away from the restrictive and reciprocal trade arrangement in the region.
8
Table 3: Estimated Value of Bilateral Informal Trade in South Asia (in US$mn)
Countries Trade (US$
milln) (Informal/Formal)x100 Year Survey study
Commodity Trade
Indo-Nepal 368-408 103%@ 2000-01 Taneja et al (2005)
Indo-Sri Lanka
205-208 30-31% 2000-01 Taneja et al (2005)
Indo-Pakistan 500-2,000 - 2005, 1996
Khan et al (2005) and Taneja (2007)
Service Trade
Indo-Bangladesh#
100 138%* 1998-99 Rahman (2002)
@ Considering the formal trade reported by India. Considering the higher official trade reported by Nepal, the ratio of informal trade to formal trade would reduce to 38 percent. # only imports from India to Bangladesh of medical and education services. * Computed as a ratio of unofficial transfer of funds to the official transfer of funds by patients and students from Bangladesh to India.
8 At the 14th SAARC Summit in April 2007, the Indian Prime Minister Dr Manmohan Singh declared that India would prune the list of sensitive items (which face MFN tariffs) from SAARC least developed countries, and also unilaterally liberalize visas for students, professors, tourists, journalists, and patients from SAARC countries.

8
3. Current State of SAFTA Remarkably enough, much of the low level of intra-regional trade observed in South Asia stems from the restrictions directly imposed within the agreements, first SAPTA and now SAFTA. The liberalisation in merchandise trade as envisioned in SAFTA is much less ambitious compared to the autonomous trade liberalisation adopted by South Asian countries since the early 1990s.
9 The trade integration observed in South
Asia today is the result of the PTA, i.e. SAPTA implemented in the 1990s whose limitations in the form of restrictive rules of origin (RoO), and destination (port restrictions) and product coverage effectively reduced the scope of the arrangement was inherited by the SAFTA agreement which was implemented in July 2006.
Restrictive rules of origin and destination South Asian countries specify the port of entry sometimes for all products or for selective products. While this approach has been implemented to curb illegal flow, it also seems to be driven by inadequate administrative capacity. The port-specific restrictions have increased transactions costs of trading across border, and sometimes led to a virtual blockage of imports. For instance, India allows the entry of tea from Sri Lanka through four specified ports excluding Chennai one of the closest ports! Similarly, it limits the entry of drugs and chemicals from Bangladesh through three land customs stations only, excluding Kolkata port and Petrapole land custom station – the two major trading points for Indo-Bangladesh trade. Other Members use port entry restrictions as well. In general, RoO in preferential or free trade agreements help determine the products for tariff preferences but tighter RoO sometimes reflect protectionist intention.
Negative lists of products and relatively high MFN tariffs The SAFTA tariff liberalisation programme also allows Members (as in the SAPTA) to retain a sensitive or negative list of items that are not offered for concessional treatment. The limited product coverage and the existence of negative list, effectively reduce the scope of intra-regional trade in South Asia. It is estimated that almost 53 percent of the total import trade in SAFTA members has been subject to the negative lists of the respective countries (Weerakoon and Thenakoon 2006). Among the large member countries, India and Sri Lanka have restricted up to 38 and 52 percents respectively of their total imports by value from the SAFTA members under the
9 Liberalisation can be pursued by a country either unilaterally (i.e. on a non-reciprocity basis) or multilaterally (i.e. based on reciprocity under the multilateral trading system of GATT/WTO. When unilateral liberalisation is offered on a non-discriminatory basis to all countries, it is termed autonomous. Indeed unilateral autonomous trade reforms accounted for approximately 66 percent of the tariff reductions among all developing countries between 1983 and 2003, while multilateral agreements and regional (discriminatory) agreements accounted for 25 and 10 percent of the tariff reductions. (World Bank 2005: page 42). Pakistan’s trade reforms in the late 1990s fall in the category of autonomous liberalisation; similarly India has made dramatic reductions in average tariffs autonomously since 1991. On the other hand, the reduction of sensitive products (that have faced MFN tariffs, but will now be offered preferential treatment) announced by India in April 2007, would fall under the category of unilateral discriminatory liberalisation since it is offered only to SAARC least developed countries.

9
sensitive list category (ibid). The negative lists thus continue to significantly limit the scope of the South Asian “Free Trade” regime. Although India has the lowest number of items on the negative list for non-LDCs, a sector-wise distribution of these items indicates that India has the largest proportion of tariff lines in categories like vegetable products (20.2 percent) and textile products (34.2 percent). These two items are of particular export interest to South Asian countries, and India’s imports of these two product categories from SAARC partners accounts for only 12 percent of its world imports (Taneja and Sawhney 2007). Under the SAFTA, it is understood that over time the sensitive list of commodities will be reduced to ensure a more open trading system in the region. Until then the SAFTA members retain the MFN tariff rates for the items included in their respective sensitive list, and these are often quite significant, especially for agricultural products. Since agricultural products dominate the export baskets of South Asian countries, high tariff rates on these items seriously inhibit intra-regional trade. Table 4 shows the average MFN tariff rates applied in the eight South Asian countries for 2006 (2005 for those countries where 2006 data was not available).
Table 4: Simple Average MFN Applied Tariff in South Asian Countries, 2005-06
Country WTO membership
Year Total average tariff
Agricultural Non-Agricultural
Afghanistan Non-member 2006 5.7 5.5 5.7
Bhutan Non-member 2005 22.1 41.3 19.2
Bangladesh Member 2006 15.2 17.3 14.9
India Member 2005 19.2 37.6 16.4
Maldives Member 2006 20.2 18.4 20.5
Nepal Member 2005 13.9 14.9 13.7
Pakistan Member 2006 14.3 16.3 14.0
Sri Lanka Member 2006 11.2 23.8 9.2 Source: Compiled from WTO (2007).
The South Asian region as a whole has been a relatively protected region in the world. In particular, India is considered to be the least open in terms of the average applied tariff rate. For instance, in 2005 India’s applied MFN import tariff in agricultural products was 37.6 percent (see Table 4). This significantly reduces intra-regional trade, given that India is the largest country market in the region (which could thus boost exports of its neighbours) and agricultural commodities form the bulk of the export basket of South Asian countries.
Limited duty-free imports among SAFTA members As noted earlier, South Asian countries send the bulk of their exports outside the region; especially to developed country markets like EC, US, Canada and Japan. This is especially marked for the large countries of India and Pakistan. For the small LDCs, including Afghanistan, Bhutan and Nepal, however, India is a leading destination market. Yet the India maintains the highest applied MFN tariffs on the traded goods within the region compared to other markets (see Table 5), and only a small share of the bilateral imports (by value) from the regional partners are duty-

10
free in India. For example, India is the second largest export market for Afghanistan, but imports from Afghanistan face a weighted average MFN tariff of 45.5 percent in India and only 17.8 percent Afghan imports into India were duty-free. Although on paper, India has a PTA with Afghanistan, a few items get preferential treatment. On the other hand, the Indo-Nepal free trade agreement is probably the most liberal of all, yet the weighted average MFN on Nepalese imports is 22.4 percent, and only 14.7 percent of these imports into India are duty-free. The only exception is observed in the bilateral imports into India from Sri Lanka, where 93 percent of the imports by value was duty-free in 2004, following the bilateral free trade agreement between these countries that took effect in 2000.
Table 5: Major Export Markets of South Asian Countries and Duties Faced Country Major markets (by
bilateral imports)
Year Value of imports
(mlln US$)
MFN weighted
avg of traded TL
Value of duty free-
imports (%)
Afghanistan Pakistan 2005 53 15.3 0.0 India 2004 46 45.5 23.0 European
Communities 2005 30 1.2 99.6
United States 2005 8 1.0 98.3
India 2004 66 18.2 17.8
Hong Kong, China 2005 19 0.0 100.0
Mexico 2005 6 0.2 98.8
Bhutan
Pakistan 2005 1 14.4 0.0
European Communities
2005 5,085 11.6 99.9
United States 2005 2,860 15.0 8.0
Canada 2005 404 17.1 100.0
Bangladesh
Japan 2005 145 23.9 99.8
European Communities
2005 22,970 5.3 56.5
United States 2005 16,490 4.7 66.4
China 2005 9,740 3.4 58.7
India
Hong Kong, China 2005 4,584 0.0 100.0
Thailand 2005 45 5.0 0.0
European Communities
2005 40 20.4 99.9
Japan 2005 21 3.9 7.1
Maldives
Sri Lanka 2004 20 11.0 20.9
Nepal India 2004 333 22.4 14.7 European
Communities 2005 114 10.5 94.5
United States 2005 111 9.4 37.6 Canada 2005 10 12.3 100.0
Pakistan European Communities
2005 3,770 8.7 21.3
United States 2005 3,374 10.5 8.1 China 2005 833 6.4 3.5 Hong Kong, China 2005 584 0.0 100.0
Sri Lanka United States 2005 2,124 14.0 15.1 European
Communities 2005 1,739 8.3 99.6
India 2004 360 22.8 93.4 Japan 2005 178 5.7 49.5
Source: Compiled from the country pages, WTO (2007).

11
Specific duties and para-tariffs While all South Asian countries are reducing tariffs, India is the only country that imposes specific duties on a wide range of textile fabric and readymade garments (RMGs). The duties are compound, i.e. the higher of an amount calculated using an ad valorem rate or the specific amount. The specific component is in Rs per square meter or per kilo or per item. The basis for choosing the products protected by specific duties are not known, but it appears that it is imposed on products of low value that are likely to have a huge domestic demand.10 The imposition of specific duties has drawn immense criticism from Member countries, and the removal of these duties would improve market access for SAARC Member countries into India. The regulatory infrastructure poses several non-tariff barriers (NTBs) in South Asia including para-tariffs, which are imposed in addition to the basic customs duties. Para tariffs refer to duties and taxes that are over and above the ‘border tariffs’. Normally, these include domestic taxes charged either by the Central Government or the State Governments. These could, for instance, be the countervailing duty of 16.3 percent levied by India on most goods to adjust for the Central Excise Duty and the special countervailing duty of 4 percent that compensates for the Central Sales Tax and another 2 percent to cover the education cess. Other SAARC Members also impose similar para-tariffs. Strictly, these should not be included under NTBs because these charges are levied to bring import prices at par with domestic prices. However, quite often the base prices on which these para-tariffis are levied are different from domestic prices and also they are charged in a cumulative manner which leads to a cascading effect on import prices, making them higher than actually warranted. These also provide a scope for bureaucratic discretion, which often becomes a source of NTBs. It is difficult to actually estimate the actual level of para-tariffs charged by SAARC member countries as some of these are quite non-transparent and require detailed investigation.11
4. Pessimism in the SAFTA Literature vis-a-vis the Current
Enthusiasm Much of the economic literature on free-trade arrangement in South Asia has argued that the potential gains are insignificant since the economies are small, exhibit similar comparative advantage in merchandise trade, and maintain relatively high tariff and NTBs. Regional trade agreements (RTAs) can be welfare reducing when it results in substantial trade diversion, and given the relatively high levels of protection in the region, most analysts predicted that trade diversion would be a dominant effect of SAFTA. Despite the pervading pessimism, there is much enthusiasm in reviving and promoting regional integration in South Asia. This new turn in the policy approach is rooted both in the skepticism of the literature as well as the rise of PTAs across the globe and the near demise of the current round of multilateral negotiations.
10 World Bank (2006a) 11 ICRIER is currently undertaking a detailed enquiry in to these para-tariffs for the SAARC region and results are expected later in 2007.
12
Minimal gains predicted in the SAFTA literature Several analyses of regional free trade in South Asia have demonstrated minimal gains from trade expansion in the framework of a regional free trade agreement, given the prospect of trade diversion and unequal sharing of benefits (Bandara and Yu 2003, Pitigala 2005). Bandara and Yu (2003) used a computable general equilibrium (CGE) model to show that gains under SAFTA are skewed with only India gaining substantially, while Pitigala (2005) and Baysan, Panagariya and Pitigala (2006) argued that given the level of protection in South Asia, vis-a-vis the rest of the world, risk of trade-diversion is rather high. Thus the epitaph for SAFTA had already been written even before it came into effect in 2006. Hirantha (2003) was a notable exception, in which the gravity model indicated significant trade creation among the South Asian countries under SAPTA with no evidence of trade diversion effect with the rest of the world. Another gravity model analysis indicated that India’s bilateral trade potential remains untapped with some of her South Asian partners, particularly with Pakistan (Batra 2004), and regional trade can be expected to increase significantly if free trade is implemented. It is pertinent, however, to remember the shortcomings of the modeling exercises which predicted a poor regional trade outcome in South Asia. To begin with, CGE models like that of Bandra and Yu (2003) estimate the changes in production, consumption, and trade at the sector level and also the accompanying welfare changes following liberalisation policies. However, since the CGE exercise uses a specific model structure (e.g. distinction of the different economic sectors, parametric values) and a base year from which the changes are calculated, it fails to incorporate the trading arrangement characteristics like RoO, and new products that become tradable following an FTA. Thus, the CGE model results can be indicative, but cannot be taken too seriously. On the other hand, gravity models predict bilateral trade flows based on the size (by GDP) and distance of the trading partners, on the premise that larger the countries trade more and geographical proximity also increase trade between countries. An augmented gravity model, as used by Batra (2004), also used other natural and cultural characteristics like population, common language, land-lockedness, etc., to predict quantum of bilateral trade. But here too, there are problems that analysts need to remember, especially in context of South Asian trade – namely, geographical proximity has not translated into lower transport or transactions costs for the SAARC countries (Taneja 2006). Indeed the reason for the thriving informal trade is rooted in the high transactions costs in the region. Thus results and predictions from the general equilibrium models as well as the gravity models cannot be taken too seriously, but seen as an indicative exercise of some economic and natural parameters. Other studies have highlighted the fact that the South Asian region consists of a rather small number of small countries. In particular, South Asia has only seven countries (Afghanistan is expected to increase the number to eight soon) compared to more than 20 in East Asia and Latin America, coupled with the dominance of a large country namely India, which tends to trade less as a share of GDP (Newfarmer 2004). While the North American Free Trade Agreement (NAFTA) has even a lower number of members (only three) than SAFTA, and is dominated by its large member country

13
US (like India in SAFTA), the difference lies in the fact that NAFTA was driven by the US aggressively in the move towards its regional integration. By sharp contrast, India has been relatively passive South Asian integration. The lack of a more aggressive role on India’s part may be rooted in the absence of economic confidence as compared to the US. The US, with a far more mature capital-abundant economy compared to its labour-abundant Mexican partner, tailored a mutually beneficial regional agreement . South Asian nations do not exhibit such stark differences in levels of economic development, although in recent years India’s sustained economic growth seems to have lent some level of confidence and a willingness to take the region forward together. Trade analysis of South Asia indicates that the countries have almost identical pattern of revealed comparative advantage in a narrow range of products like agriculture and textile (which they produce relatively cheaply compared to other countries)
12. Given
the limited range of products in the export baskets of the South Asian economies, the low level of intra-regional trade seems inevitable (Newfarmer 2004, Kemal 2005). For instance, agricultural commodities, textile and clothing (T&C) remain significant in the export basket of most South Asian countries, and they often view themselves as competitors in the international market. However, the scope for intra-industry trade may still exist for otherwise similar economies (in terms of factor abundance and relative productivity in sectors) due to differences in skill specialisation in the otherwise similar economies. Considering South Asia is yet to exploit such a possibility, the scope for an augmented SAFTA may be much more than predicted by the literature, and is discussed in Section 6 later.
Potential unexploited gains and current enthusiasm for SAFTA While it is true that the South Asian economies have similar product comparative advantage in trade and estimates of trade complementarity are dismal, they only reflect the status quo and cannot capture potential advantages that are hitherto unexploited. As Srinivasan (2002) observed, the low indices of trade complementarity “reflects in part the barriers that countries have imposed on their trade, which were intended to change the trade pattern away from what would emerge were they to allow their true comparative advantage to dictate their trade.” Moreover, such indices are static, as they are based on historic data, and fail reflect the potential dynamic trade gains. It is noteworthy that the Association of Southeast Asian Nations (ASEAN) members too faced a similar challenge, in terms of small nations exporting similar product baskets. However, the cooperative model followed by ASEAN promoted the different stages of production of a good to be established across different countries to better exploit cost and market advantages. Indeed, total intra-ASEAN trade increased substantially since the mid-1970s through the 1990s due to greater intra-industry trade. Among the five founding ASEAN-members
13, by 1996 intra-industry trade
12 For computational purposes, however, this is often measured as the ratio of the share of a given product in a country’s exports to another country or region to the share of the same product in that country or region’s total exports. 13 Namely, Indonesia, Malaysia, the Philippines, Singapore and Thailand.

14
constituted 60 percent of total intra-ASEAN trade (Hurley 2003). Of course, the vertical and horizontal integration of production was driven by foreign direct investment (FDI), but it would not have emerged without supportive national policies encouraging deeper economic integration for ASEAN region. Such supportive economic policies to exploit efficiency gains through production networks/intra-industry investment has been particularly lacking in South Asian nations, which also exhibit comparative advantage in similar products. The economic case for greater merchandise trade still holds, not withstanding the dismal findings of studies that highlight rather small gains from SAFTA: for instance, contrary to findings of quantitative models, trade between India and Sri-Lanka increased significantly following their bilateral free trade agreement, even though gravity model analysis indicated that bilateral trade potential was low. For example, the gravity model analysis of Batra (2004) found that India’s bilateral trade with Sri Lanka and Nepal has gone far beyond the level of trade predicted on the basis of natural factors (distance, landlockedness, population, and income) based on 2000 database. Actual trade between India and Sri Lanka expanded substantially during 2000-02 due to the increase in trade of new products that were not earlier traded and could not thereby be captured in the modeling exercises.14 Similarly, products that were previously never exported by India to Bangladesh witnessed expansion in the post-SAPTA era since 1996-97. All quantitative exercises (based either on Gravity or Computable General Equilibrium type of models) yield very limited gains from regional cooperation in South Asia. The usual explanation for such limited gains accruing from cooperation is that these are competing economies with similar production and export structures and so potential for regional trade and exchange are rather limited. These rather discouraging results from quantitative exercises/models are understandable because they only take into account the cross border merchandise trade and seldom include trade in services and invisibles. But more importantly, by their very nature, they cannot account for more dynamic impact of increasing cross border investment flows that generate both direct and indirect gains for both partners. This is amply demonstrated by the sharp in increase in bilateral investment flows from India to Sri Lanka after the implementation of the FTA between the two countries. Since 2001, India has featured among the top 10 countries for cumulative FDI in Sri Lanka. The cumulative FDI in Sri Lanka from India increased from US$53mn in 2001 to US$115mn in 2003 as large Indian companies have been encouraged to locate in Sri Lanka (Kelegama and Mukherji 2007: 17). Since the bilateral FTA provides for a duty-free buy back into India (especially southern India), products are often manufactured for the Indian market. We could expect a similar increase in cross border investment flows across SAARC in the wake of stronger regional cooperation. Possibilities of expansion in intra-industry trade are also ignored in models used for quantifying gains from regional cooperation. These often follow increase in FDI and are part of emerging production networks that extend across borders. For both these reasons it may be important to undertake micro, firm level analysis of potential gains from regional cooperation as these may well emerge to be significantly higher than those generated by more macro enquiries.
14 How much of this trade expansion represents trade diversion or trade creation is still an open question. Baysan, Panagariya and Pitigala (2006).

15
The motivation for greater integration in the South Asian region follows from four distinct factors: first, pure economic gains through efficient use of capital and labour as well as distribution of goods and services across borders: second, other non-traditional gains from greater regional integration like increased flow of FDI: third, strategic gains when the South Asian countries negotiate as a unified group in multilateral for a; and fourth, developmental and environmental efficiency gains arising from adopting a regionally integrated approach towards provision of regional public goods like environment, water conservation and other natural resources including the regional ecosystem and related biodiversity. These regional issues cannot be effectively addressed individually and are best addressed in a cooperative framework. Finally, lack of cooperation within the region implies higher costs and consumer prices for imports from neighbouring countries, leading to replacement of neighbouring suppliers by those from distant countries. For example, a poor transport facilitation system within the region increases time costs for trade within South Asia – it takes an Indian importer the same time to receive a shipment of fabric from Pakistan as it does from Europe. Another reason for higher costs of imports from the region is the re-routing of imports through third countries (e.g. auto tires from India supplied to Pakistan market via Dubai) that surely results in costs/price escalation. All these costs of third country diverted trade can be avoided through stronger regional cooperation that will consequently yield direct benefits to the consumers in the region. The interest in reviving intra-regional trade in South Asia has grown in tandem with the overall policies of economic liberalization through the nineties. While otherwise critical of SAFTA, even Baysan, Panagariya and Pitigala (2006) contended that a persuasive case for SAFTA could be made if the countries in the region lower their overall tariff down to 5 percent, and the restrictive RoO are relaxed.
5. SAFTA in the Context of the WTO and Other South Asian FTAs The emergence of successful Northern blocs like the EU and NAFTA, and increasing discrimination towards Asian developing countries in these developed blocs has also pushed the South Asia towards greater regional and bilateral cooperation. Regional trade agreements have become more prolific over the last 10 years as the progress in the ongoing Doha Round of multilateral negotiations is seen to be unsatisfactory.15 In South Asia, six countries including Bangladesh, India, Maldives, Nepal, Pakistan and Sri Lanka are committed to liberalisation under the multilateral trading system and have undertaken significant steps in unilateral reduction of tariffs in the past decade. So deepening regional integration could be a continuing move towards openness, without regressing on openness for non-members. To the extent regional integration is pursued along with autonomous and multilateral liberalisation in South Asia, the incidence of trade-diversion effects will be minimal.
15 As of September 15, 2006, WTO website http://www.wto.org/english/tratop_e/region_e/summary_e.xls, accessed December 06, 2006.

16
Surge of regional trade agreements across the globe A total of 211 regional trade agreements for goods and services are in force today.
16
While 124 regional trade agreements for goods were notified in the GATT (some no longer in force) during 1948-94, more than 130 agreements covering trade in goods and services have been notified since 1995 under the WTO. Political and security considerations have been significant in the recent surge of regional free trade agreements: governments often seek to consolidate peace and increase regional security with their RTA partners, or to increase their bargaining power in multilateral negotiations by securing commitments on a regional basis, or as a means to demonstrate good governance and to prevent backsliding on political and economic reforms (Crawford and Fiorentino 2005: 16). Moreover, large countries use free trade agreements to build new geopolitical alliances and diplomatic ties, and the political support is rewarded through increased discriminatory access to the large market (ibid). On the other hand, small countries through participation in regional trade agreements learn how to effectively deal with larger trading blocs in multilateral negotiations. The large country-small country dynamics is particularly significant for South Asia, given India’s preponderance economically and in the share of the population. India accounts for about nearly 80 percent of South Asian GDP and also for nearly two thirds of the FDI received in the region. This predominance understandably causes a degree of insecurity amongst India’s neighbours who look to external partners, either multilateral or bilateral to provide a degree of comfort. However, this has changed in the past few years as India has changed her stance and is adopting more accommodative and open positions vis-a-vis its neighbours. This has provided the opportunity to countries like Sri Lanka to enter into FTA with India in 1998, which has benefited both economies and has seen a near doubling of bilateral trade. During 1999-2005, Sri Lanka’s exports to India increased from 1 percent to 9 percent of its total exports, while imports from India increased from 8.5 percent to 20.7 percent of total imports (Kelegama and Mukherji 2007).
Bilateral and other free trade agreements among SAARC countries The South Asian countries are party to several other preferential agreements, including FTAs, within the region as well as outside the region, and continue to engage in developing new trade treaties. With trade under SAFTA yet to take off dramatically, the members have continued to follow the momentum of seeking bilateral and extra-regional preferential trade treaties. The concurrency of all these different PTAs/FTAs of the SAFTA Members (some where memberships overlap with SAFTA partners) makes the application of duty preferences for country partners rather complicated. Consider the case of India: Besides SAFTA, India has separate preferential and bilateral FTAs with the South Asian countries, including Bhutan (FTA), Nepal (FTA), Sri Lanka (FTA) and Afghanistan (PTA). These agreements provide preferential tariff
16 As of September 15, 2006.

17
treatment to specific products and/or retain negative lists of products that do not get preferential treatment (i.e. MFN tariff applies). For example, in the PTA with Afghanistan, India offers a margin of preference of 50 percent over the MFN (e.g. raisins) and of 100 percent (e.g. apricots, walnuts, pistachios, mulberries) to a total of 38 items. On the other hand, in the Indo-Nepal agreement, India has a few quota-restrictions with otherwise free trade, so the Indian sensitive list for LDCs under SAFTA (applying to Nepal as well) seems to be redundant (or in direct conflict) with the bilateral agreement! India is also a party to Bay of Bengal Initiative for Multi Sectoral Technical and Economic Cooperation (BIMSTEC), which includes four other SAFTA Members, namely Bangladesh, Bhutan, Nepal and Sri Lanka; and two ASEAN Members Myanmar and Thailand.17 BIMSTEC is considered to be a bridging link between the two regional groups of ASEAN and SAARC. The BIMSTEC free trade agreement scheduled for 2006 is yet to be implemented. India has also negotiated preferential trade agreements with Chile, and is now engaged in negotiations for preferential trade/comprehensive economic cooperation agreements with the ASEAN, EU, Gulf Cooperation Council (GCC), Malaysia, Mauritius, South Africa and Thailand.
18
Prospect of SAFTA in light of involvement in other preferential agreements Two aspects are particularly relevant in the persistence and growth of such sub-regional trade agreements of SAFTA Members. First, as negotiations under the multilateral trading system continue to stall, emerging developing countries (Brazil, China and India) give more significance to other regional forum. While this political-economic strategy is true of increasing regionalism in general in the world, this has immediate implications for the South Asian region, since India’s actions in the world economic forum affects the strategy of the other SAFTA members. When one large SAFTA member engages in seeking economic alliance outside the region, it prompts the other SAFTA partners to also seek alliance outside the region. For instance, Pakistan has bilateral FTAs with China, Kazakhstan, Malaysia and Sri Lanka, and engaged in preferential trade negotiations with Mauritius and MERCOSUR. The current trend in bilateral and sub-regional negotiations of the South Asian countries, as well as others in the world, is inefficient, as it is a waste of resources (considering lobbying to be a rent-seeking unproductive activity, a la Bhagwati). However, whether the existence and growth of a multiplicity of PTAs necessarily undermines the prospect of SAFTA is not obvious. The dramatic growth of global trade over the last century has taken place despite forebodings of its demise in the 1980s, and has been further strengthened institutionally with the establishment of the WTO. This has occurred simultaneously with persistent and even more remarkable growth of regionalism across the globe, for example, the EU, the NAFTA, and the ASEAN Free Trade Agreement (AFTA). Similarly, the current enthusiasm among South Asian policy makers to revive the
17 The genesis of the BIMSTEC is the 1994 initiative to establish Bangladesh-India-Sri Lanka-Thailand Economic Cooperation at the sub-regional level among contiguous countries of South East and South Asia. Myanmar joined the group in 1997, while Bhutan and Nepal became members in 2004. 18 See the Ministry of Commerce and Industry website for details: http://www.commerce.nic.in/trade/international_ta_current_details.asp
18
regional forum is akin to a realisation that strengthening and integrating the regional economy has significance for the growth and development of each of the SAFTA members. In particular, India’s emergence in the world economy is not possible without a stable regional economy. Hence, despite the engagement in various sub-regional and bilateral trade agreements, the success of SAFTA remains a key goal. For the other SAFTA Members, especially the LDCs among them, which are more dependent on intra-regional trade than India (as discussed in Section 2 before), the interest in promoting intra-regional trade continues to be a major developmental factor (to the extent trade enhances output, productivity, and consumption).
Is SAFTA a stepping-stone or stumbling block in global integration for SAARC countries? Apart from Afghanistan and Bhutan, all the other six SAARC members are committed to promoting multilateral trade as WTO members. Bhutan’s accession application to the WTO in 1999 has progressed well and the country is likely to become a member of the WTO in the near future, while Afghanistan applied for WTO accession more recently in 2004. For the small South Asian countries, SAPTA or SAFTA have certainly not been stumbling blocks in their attempts to integrate with the global economy. Indeed, as noted above, the engagement of larger SAFTA members outside the region has encouraged other members to seek trade alliances outside of SAFTA. The full implementation of SAFTA is likely to help all the members in committing to multilateral liberalisation. A regional treaty typically helps to lock-in a country’s trade reforms and signals to domestic and international investors that reforms are permanent and helps in the process of liberalisation (Fernandez 1997, Hossain and Duncan 1998). Indeed, liberalising regional investment and services trade in an augmented SAFTA would be a good implementation strategy before South Asia commits to liberalisation of investment and services multilaterally. Globally, the emergence of regional blocs has allowed for enhanced bargaining power for countries which negotiate as a unit at the multilateral trading forum. Most prominent among these is the European Commission (EC), where the group of 27 country members negotiate as a single entity at the WTO. Thus, besides the institutional and structurally adjustment benefits for some smaller South Asian countries from regional cooperation discussed above that would help them in the multilateral trading system, the political-economic benefits of greater regional cohesion accrue to all the South Asian countries in the multilateral forum. While the South Asian nations have not ever negotiated as a group at GATT or WTO, their interests and concerns are similar at the global forum, particularly in terms of improved market access for their products and removal of trade-distortionary subsidies in the developed countries. Regional cooperation and enhanced trade among the SAARC countries can then help them to align their interests and concerns for the multilateral trade negotiations. Indeed, objective (g) of the SAARC charter aims: “to strengthen cooperation among themselves in international forums on matters of common interest”, except that such strong cooperation is yet to emerge. Thus SAFTA (or SAARC in general) does not seem to pose any threat to the integration of South Asian countries with the global economy. The

19
structural/institutional benefits for small SAARC countries from regional integration, and political-economy benefits for all countries from greater regional cooperation can be considered as stepping stones in the integration process, and as a means of increasing bargaining power in a highly polarised multilateral negotiation system. Moreover, since each of the South Asian countries are increasingly looking outward (both for multilateral and regional treaties), greater intra-regional trade will occur simultaneously and not as a substitute for extra-regional integration.
6. Potential Areas of Enhanced Cooperation in South Asia It is observed in the previous sections, the low level of intra-regional trade in South Asia has been driven by a gamut of restrictive policies maintained by the SAARC nations that restrict the flow of goods, services, labour and capital. While SAPTA and now SAFTA has attempted to liberalise the flow of selected product groups (the sensitive products mostly in textiles and food being kept out of the liberalisation), the potential for enhancing trade in other areas has not been taken into account as yet. However, the de facto flow of informal services and labour across the borders (besides informal trade in goods) in the region indicates that economic integration can indeed be enhanced and formalised. This section briefly discusses a few of the potential areas for cooperation to enhance regional output, efficiency, trade and employment.
Intra-industry trade and production networks In South Asia, the scope for intra-industry trade can be quite significant, since these countries have not yet exploited synergies in production across the borders in sectors where they have comparative advantage. Considering the SAARC partner countries have comparative advantage in several common sectors, like agriculture and textiles, further liberalisation would increase competition in these sectors and lead to geographical specialisation across the region in specific segments within these sectors (like production chain in the value-addition of agricultural output based on costs and availability of technology). An analysis of the export structures of Bangladesh, India, Nepal, Pakistan, and Sri Lanka in the 1990s showed that these countries exhibit comparative advantage in food and various manufactured goods including leather articles, textile yarn, articles and clothing (Kemal et al 2002). Yet even within the similar product range, these countries could potentially expand trade amongst themselves. For example, Bangladesh had scope to increase exports of fish, vegetables, jute and fertilizer to its neighbours; India could potentially export food items, machinery and transport equipment; Nepal could export oilseeds and oleaginous fruits; Pakistan could export sugar, molasses, honey, cotton, and surgical instruments; while Sri Lanka could export synthetic rubber, rubber articles, raw/processed textile fibres, wood manufactures, electric power machinery and parts, etc. The analysis highlights that although the SAFTA nations have comparative advantage in agricultural/food and manufacturing sector, there is potential for trade in distinct items within these sectors. Even within a specific industry, for example, in the textile and clothing (T&C) industry there is scope for the SAFTA countries to specialise in different stages of manufacturing through production networks.

20
The intra-industry trade is typically driven by differences in the levels of technology and skill in a particular sector, as well as regional production sharing arrangements. Regional production networks emerge due to a combination of factors including lower tariffs, wage differentials, low transportation costs, and favourable government policies (Kemal et al 2002). While intra-industry trade has emerged in South Asia over time in various manufactured products, there has not been any sustained effort to encourage this trend. Kemal et al (2002) observed that the historical pattern of intra-industry trade among South Asian countries has been rather erratic and intra-industry trade has occurred in a sustained manner only in a few items: in leather products, T&C and some basic machinery and tills, but the proportion of intra-industry trade has been very low. Yet intra-industry trade can play a critical role in enhancing economic integration in South Asia, since such trade can flourish even when countries lack production and trade complementarities. South Asian countries can specialise in different lines of production within a particular industry and achieve benefits of specialisation and scale economies with the supportive government policies (ibid: 260-61). For instance, in the apparel industry, production networks could be established with specialisation in supply of fibre, manufacturing of yarn and fabric, and garment factories across the countries based on the skill and cost advantages of labour and raw material, as experienced in Southeast Asia. The traditional T&C sector has become increasingly capital and knowledge intensive, and there is scope for productivity gains through industrial restructuring among the SAARC countries (Das 2004). Intra-regional trade gains can be reaped more effectively through parallel investment liberalisation. Mukherji (2004) suggested that intra-industry commerce between India and her SAARC partners can be potentially exploited through joint ventures or wholly owned subsidiaries in apparel, paper, and plastic products. The actual size of gains from such intra-industry trade in South Asia would of course depend upon the investors’ response to the regional investment regulations and market expectations. As in the case of South East Asia, this response both from foreign and regional investors can be very significant if the economies of scale can be realised and new capacities are created on the basis of a larger market size. It will be useful to capture these welfare gains in models that can quantify potential gains from improvements in the region’s investment climate and from better availability of non-traded goods and services.
Freeing service trade Conspicuous by omission in SAFTA is the trade in services, especially considering that the region as a whole is emerging as a stronger exporter of commercial services worldwide (as evident from its increasing share in global commercial service exports (see Table 2A). Most of the South Asian countries have been negotiating liberalisation of the services sector under the WTO, and a liberalisation exercise at the regional level would have been a good testing ground for this dynamic sector. While all the South Asian countries are labour-intensive, the skill level is quite different across the region. The evidence of informal import of health and education services by Bangladeshis from India (discussed in Section 2) serves as an indicator of the difference in skill availability across the region. If the investment is encouraged in
21
the region (Mode 3), it is likely to help in the development of the service sector in the smaller countries of the region. The existence of informal trade in services in South Asia indicates that there is significant trade potential in this sector. Moreover, liberalisation of service trade within the region will immediately move much of the financial flows from informal channels to the formal channels. Thus, the benefits would accrue not just to consumers in the region, but to the government coffers too. It is likely that India stands to gain most from liberal services trade in South Asia in various sectors, like health, education, IT, professional, etc. India is the leading exporter of commercial services in the region, accounting for 92 percent of South Asia’s total service exports to the world, followed by Pakistan and Sri Lanka accounting for 3 and 2.5 percent of the total South Asian service exports respectively (see Table A2). Regional cooperation and integration could help South Asia develop as a services hub where the differential skill availability in the different countries would allow for differential specialisation.
Regional management of natural resources The South Asian subcontinent is an integrated geo-ecological system. In this context, public goods and services like energy, water management and conservation, and prevention against pandemics are best provided on a regional basis. Managing these regional public goods and services on an individual country basis would imply much higher costs and worse still the suboptimal exploitation of natural resources. The gains from regional integration in the EU, ASEAN and NAFTA were amplified by cross-border cooperation in water, and energy.19 In South Asia too, a regional ecosystem based approach to development in harvesting water and natural resources will lead to resource efficiency gains, given the capacity and availability of state-of-the-art technology. The other main driver of economic integration in South Asia is the need for greater energy security. All these countries are heavily dependent on energy imports and even more specifically on hydrocarbon imports from West Asia. Energy trade in the region can also be seen as a confidence-building measure and a lock-in mechanism for irreversible economic interdependence (Pandian 2005). The imperative for energy security requires that SAARC economies can offer a unified market for hydrocarbon imports from Central and West Asian gas and oil fields by overland pipelines and that the regions hydrocarbon resources are exploited on a regional basis.
7. South Asian Cooperation as a Tool for Development Regional integration encompasses much more than trade in goods and services, and thus gains from integration includes not just trade expansion, but also enhanced competition, increased returns to scale with greater production in certain sectors, and increased resource efficiency. Indeed, for a complete integration of the South Asian region it would be important to liberalise labour, capital and services markets.
19 “A Chance to Eliminate Poverty in Our Lifetime: Scaling Up Development Assistance in South Asia”, South Asia Region, World Bank, March 2006. Indeed gains from integrated-regional development programmes in Asia has also encouraged the Asian Development Bank to move away from piece-meal project financing to evolve new strategies
22
Considering the rapid expansion of the services sector, and its increasing share in the GDP of the South Asian economies, any trade liberalisation would be incomplete without including this sector. While the small South Asian countries gain through access to the largest consumer market in the region, namely that of India, the latter gains through exports of both products and professional services to partner countries. Regional cooperation and FTAs could also stimulate investment flows both between its constituent member countries and from outside the region due to the larger market created and reduction in production distortions (Fernandez, 1997). Depending on the nature and depth of regional trade agreements and the consequent national policies adopted, they can reduce market uncertainties and enhance credibility for increased investment in the region. South Asian economies have scope to cooperatively signal a stable and conducive business environment to attract more investment, i.e. an environment characterised by stability, minimal conflicts, moving towards an integrated regional market and free flow of factors across borders – conditions essential for the region to emerge as a global production hub that can be best provided with greater regional cooperation. In recent years, FDI inflow in South Asia has increased rapidly, with gross FDI reaching US$10bn in 2005-06, but continues to be below the potential especially considering India’s economic performance and policy change (UNCTAD 2006). Since actual performance of FDI in the region remains below the potential, there is scope for enhancing investment to the region if the eight countries can signal a more stable and open business environment, i.e. an environment characterised by stability, minimal conflicts, moving towards an integrated regional market and free flow of factors across borders – conditions essential for the region to emerge as a global production hub that can be best provided with greater regional cooperation. Integrated resource management, especially of water, energy and land, will provide benefits to all the South Asian countries, as the developmental challenges are similar for each. Some of the developmental challenges faced by the region’s larger (Bangladesh, India, Pakistan, Sri Lanka) and smaller economies (Afghanistan, Bhutan, Maldives, Nepal) are identical, including alleviation of poverty, and provision of clean water and energy.
What undermines integration in South Asia? South Asia has emerged as one of the least integrated regions in the world due to a combination of political, institutional and economic factors: first, the existence of bilateral political differences among SAARC nations, most apparent in the current denial of MFN status to India by Pakistan under SAFTA. Second, economic factors have also been as important. Given that all the SAARC Members are relatively labour-abundant capital-deficient developing countries, during the last two decades these countries have considered themselves to be largely competitors in the global market for their export products as well as capital import. These two reasons have also been responsible for the crafting of restrictive PTAs/FTAs of SAPTA and then SAFTA. Finally, apart from the high levels of protection in the region, institutional and infrastructure deficiencies have undermined the economic integration in the region.

23
Procedural delays stemming from institutional requirements have inhibited trade and business across borders. In particular, South Asia ranks second last among regions across the world in terms of ease of trading across borders (the last being Sub-Saharan Africa).
20 In particular, India ranks abysmally low in “ease of trading across borders”
at 139 compared to China’s rank of 38 in the world. India’s low ranking relative to other emerging countries reflects the excessive number of documents required by exporters and importers, the time delays in exports and imports and the high costs per value per container. Poor port and transport infrastructure, regulatory environment and service-sector infrastructure in South Asia has been an obstacle to growth for the region as well as its integration (De 2005). Delays in transit due to road or port congestion, and customs procedures (NTBs) raise the costs for exporters. The limitations are in both physical (lack of cargo/ship handling equipment) as well as non-physical infrastructure (excessive and cumbersome border procedures).
8. Policy Recommendations The most important step to be taken at this stage for promoting regional cooperation in South Asia is to give primacy to economic development, growth and poverty reduction and push political issues and problems to the background. In this respect, South Asian political leaderships will do well to learn from both South East Asian and European experience where countries with long standing political differences kept them aside to push regional cooperation, which generated benefits for all participants. The following policy recommendations could well be given weight while pushing forward the regional cooperation among the South Asian countries:
• To give primacy to economic considerations, it may be useful to establish a formal forum of SAARC Finance Ministers, (rather than the informal system under which the Ministers met for the SAARC Development Fund). This will contribute to a better appreciation of existing macro-economic linkages and promote efforts to further strengthen them.
• Undertaking infrastructure development projects in the region to enhance connectivity and transport would help in the overall economic growth and also help in reducing costs of intra-regional commerce and investment. A recent study estimated that if South Asia’s infrastructure capacity is increased even halfway to East Asia’s level, then intra-regional trade can increase by 60 percent (Wilson and Ostuki 2005).
• India, with her economic dominance in the region and central geographic position, can play a significant strategic role in promoting regional cooperation in South Asia by unilaterally liberalising its trade within the region. To this effect, India’s recent pronouncements (as the new Chair of SAARC) in April 2007 are promising. India’s declaration for unilateral liberalisation of duty free imports from LDCs in the region, and liberalising visas for students, professors, journalists and patients from other SAARC
20 “Ease of Doing Business 2006”. Website: http://www.doingbusiness.org/EconomyRanking accessed January 12, 2007.

24
countries, signals the commitment to regional integration.21 More of such unilateral initiatives on part of India would help to signal its commitment to regional integration, and diffuse the existing bilateral (political) standoff.
• A South Asian Commerce Ministers’ Forum could also be established with the aim of fostering greater trade integration and ensuring the follow up of decision taken in SAARC summits. This will strengthen the institutional mechanism and demonstrate the leaderships’ commitment to the regional cooperation process.
• Specific barriers to intra-regional trade need to be addressed: including tariff liberalisation, enlarging products for liberalisation (i.e. slashing the sensitive/ negative list), reducing multiplicity of standards and regulatory procedures (which increases transactions costs) and port restrictions, in order to enhance commerce in South Asia. These need to be undertaken simultaneously along with the liberalisation programmes (unilateral and multilateral) being pursued by each of the countries (particularly the large ones like India, Pakistan, Sri Lanka and Bangladesh) in order to minimise the risk of trade diversion in the process.
• Smaller countries can also play an important role in identifying new initiatives and taking them forward through the Secretariat and in the Summits. A similar role was played by Belgium and Luxembourg in the EU and by Singapore in ASEAN as initiatives launched by smaller countries have a greater chance for consensus. Most importantly, smaller countries now need to shed their ‘fear of the large neighbours’ especially in the context of both and India and Pakistan having now adopted a more accommodative attitude toward the involvement of external multilateral and bilateral agencies in regional projects in South Asia. This will go a long way in improving the overall environment for regional cooperation.
• SAFTA in its current form is not an ambitious agreement, since it has kept services trade and investment out of its ambit. Yet, it is evident that informal intraregional trade in services, especially health and education, continues to thrive in the area. Formalising services trade will boost consumer welfare, as well as service providers’ and government revenues. Similarly, intra-regional investment will encourage the growth of intra-industry trade and differential service specialisation of the otherwise similar countries in the region.
21 This will greatly help to reduce the insecurities often expressed by India’s neighbours in pushing the regional cooperation agenda forward.

25
References
Bandara, Jayatilleke S. and Wusheng Yu, (2003). “How Desirable is the South Asian Free Trade Area? A Quantitative Economic Assessment”, World Economy, Volume 26: pp. 1293-1322.
Batra, Amita (2004). “India’s Global Trade Potential: The Gravity Model Approach”, ICRIER Working Paper 151, New Delhi.
Baysan, Tercan, Arvind Panagariya and Nihal Pitigala, (2006). “Preferential Trading in South Asia”, World Bank Policy Research Working Paper 3813, World Bank, Washington, DC.
Crawford, Jo Ann and Roberto V. Fiorentino (2005). “The Changing Landscape of Regional Trade Agreements”, WTO Discussion Paper 8, World Trade Organisation, Geneva.
Das, Ram Upendra (2004). “Industrial Restructuring and Competitiveness of the Textile and Clothing Sector in SAARC in the Context of MFA Phase-out”, Discussion Paper 85, RIS, New Delhi.
De, Prabir (2005). “Cooperation in the regional transportation infrastructure sector in South Asia”, Contemporary South Asia 14(3): pp.267-87.
Fernandez, Raquel (1997). “Returns to Regionalism: An Evaluation of Non-Traditional Gains from RTAs”, NBER Working Paper 5970, NBER, Cambridge, MA.
Ghani, Ejaz and Musleh-ud Din, (2006). “Regional Trade Integration in South Asia: Rationale, Impediments and the Way Forward”, ARTNeT Policy Brief No. 7, UNESCAP.
Hossain, M. Manir and Ronald C. Duncan, (1998). “The Political Economy of Regionalism in South Asia”, Economic Division Working Paper SA 98/1, National Centre for Development Studies, Australian National University.
Hufbauer, Gary Clyde and Yee Wong, (2005). “Prospects for Regional Trade in Asia”, Working Paper Series 05-12, Institute for International Economics, Washington, DC.
Hurley, Dene (2003). “Horizontal and Vertical Intra-industry trade: The Case of ASEAN Trade in Manufactures”, International Economic Journal, Volume 17, Issue 4.
International Monetary Fund, (2006). Direction of Trade Statistics.
Kelegama, Saman and Indra Nath Mukherji, (2007). “India-Sri Lanka Bilateral Free Trade Agreement: Six Years Performance and Beyond”, RIS Discussion Paper 119, Research and Information System for Developing Countries.
Kemal, A.R., (2005). “SAFTA and Economic Cooperation”, web address: http://www.southasianmedia.net/conference/Regional_Conference/safta.htm.
Kemal, A.R., M. Din, K. Abbas and U Qadir, (2002). “A Plan to Strengthen Regional Trade Cooperation in South Asia”, in T. N. Srinivasan ed. Trade, Finance and Investment in South Asia, Social Science Press, New Delhi: 239-319.
Khan, Shaheen Rafi, M. Yusuf, S. Bokhari and S. Aziz, (2005). Quantifying Informal Trade Between Pakistan and India, Sustainable Development Policy Institute, Islamabad.

26
http://www.sdpi.org/tkn/Quantifying%20Informal%20Trade%20Between%20Pakistan%20and%20India.pdf
Mukherji, Indra Nath, (2004), Towards a Free Trade Area in South Asia: Charting a Feasible Course for Trade Liberalisation with reference to India’s Role”, Discussion Paper 86, RIS, New Delhi.
Newfarmer, Richard, (2004). South Asia Free Trade Area: Promise and Pitfalls of Preferential Trade Arrangements, World Bank, Washington DC.
Pandian, S.G., (2005). “Energy trade as a confidence-building measure between India and Pakistan: a study of the Indo-Iran trans-Pakistan pipeline project”, Contemporary South Asia 14(3): 307-20.
Pitigala, Nihal, (2005). “What Does Regional Trade in South Asia Reveal about Future Trade Integration?: Some Empirical Evidence”, World Bank Policy
Research Working Paper 3497, World Bank, Washington, DC.
Rahman, Mustafizur, (2002). Bangladesh-India Bilateral Trade: An Investigation into Trade in Services”, in T. N. Srinivasan ed. Trade, Finance and Investment in South Asia, Social Science Press, New Delhi: 183-238.
Srinivasan, T. N. (2002) “Preferential Trade Agreements with Special Reference to Asia”, mimeo, Economic Growth Center, Yale University.
Taneja, Nisha and Aparna Sawhney, (2007). “Revitalizing SAARC Trade”, Economic Political Weekly, Volume 42, Number 13, March 31, 2007: 1081-1084.
Taneja, Nisha, (2006). “India Pakistan Trade”, Working Paper 182, Indian Council for Research on International Economic Relations, New Delhi.
Taneja, Nisha, M. Sarvananthan, B. K. Karmacharya, and S. Pohit, (2005). “Informal Trade in India, Nepal and Sri Lanka” in Mohsin Khan ed. Economic Development in South Asia, Tata McGraw-Hill Publishing Company Limited, New Delhi: pp.54-114.
Taneja, Nisha, (1999.) “Informal Trade in the SAARC Region”, Working Paper No.
47, Indian Council for Research on International Economic Relations, New Delhi.
USAID, (2005). South Asian Free Trade Area: Opportunities and Challenges, United States Agency for International Development.
UNCTAD, (2006). World Investment Report 2006- FDI from Developing and
Transition Economies: Implications for Development, UNCTAD, Geneva.
UNCTAD, (2005). Developing Countries in International Trade 2005: Trade and Development Index, UNCTAD, Geneva.
Weerakoon, Dushni and Jayanthi Thennakoon, (2006). “SAFTA Myth of Free Trade”, Economic and Political Weekly, September 16, 2006: pp.3920-23.
Weerakoon, Dushni, (2001). “Indo-Sri Lanka Free Trade Agreement: How Free is It?”, Economic and Political Weekly, Volume 34, Number 8: pp.627-29.
Wilson, John S. and Tsunehiro Ostuki, (2005). “Trade Facilitation and Regional Integration in South Asia: Accelerating the Gains to Trade with Capacity Building”, South Asia Region, The World Bank, Washington DC.
World Bank, (2006). “A Chance to Eliminate Poverty in Our Lifetime: Scaling Up Development Assistance in South Asia”, South Asia Region, World Bank. http://siteresources.worldbank.org/INTSOUTHASIA/Resources/SARRegionalStrategyMarch06.pdf

27
World Bank, (2006a). ‘Studies on India-Bangladesh Trade: Trade Policies and Potential FTA’, Report No. 37863-BD.
World Bank, (2005). Global Economic Prospects: Trade, Regionalism, and
Development, World Bank, Washington DC.
WTO, (2007). World Tariff Profiles 2006, WTO and ITC, UNCTAD, Geneva.
WTO, (2006). International Trade Statistics 2006, World Trade Organization, Geneva.

28
Annexure Table A1. Value of Total Merchandise Exports from South Asian Countries ( in US$mn), 1995-2005
Country 1995 1996 1997 1998 1999 2000 2001 2002 2003 2004 2005
Afghanistan 156 173 201 209 167 185 100 250 350 420 560
Bangladesh 3,501 4,249 4,832 5,121 5497 6389 6080 6149 6990 8305 9294 Bhutan 103 100 118 108 116 103 106 113 133 183 250 India 30,630 33,105 35,008 33,437 35667 42379 43361 49250 57085 75562 95096 Maldives 85 80 90 96 91 109 110 132 149 181 162 Nepal 345 385 406 474 602 804 737 568 662 756 850 Pakistan 8,029 9,365 8,758 8,514 8424 9028 9238 9913 11930 13379 15917 Sri Lanka 3,798 4,095 4,639 4,809 4594 5430 4816 4699 5125 5757 6347
South Asia total 46,647 51,552 54,052 52,768 55158 64427 64548 71074 82424 104543 128475
Asiaa 1,446,800 1,464,900 1,546,500 1,450,000 1547200 1836200 1673500 1806800 2136100 2650500 3050900
World a 5,164,000 5,401,000 5589000 5,499,000 5709000 6452000 6186000 6486000 7578000 9203000 10431000
Share in Asia 3.22 3.52 3.50 3.64 3.57 3.51 3.86 3.93 3.86 3.94 4.21
Share in world 0.90 0.95 0.97 0.96 0.97 1.00 1.04 1.10 1.09 1.14 1.23 a includes significant re-exports.
Source: Compiled from Appendix Table A6, WTO (2006) International Trade Statistics.
Table A.2 Value of Commercial Service Exports from South Asian Countries (in US$mn), 1995-2005
Country 1995 1996 1997 1998 1999 2000 2001 2002 2003 2004 2005
Bangladesh 469 223 267 252 266 283 243 305 398 420 477 Bhutan 15 10 16 15 18 18 31 29 25 31 46 India 6763 7179 8926 11067 14006 16030 16799 19125 23092 38544 56094 Maldives 230 286 309 329 340 345 351 360 429 504 315 Nepal 592 680 795 433 454 410 303 192 302 356 267 Pakistan 1432 1546 1446 1303 1264 1284 1302 1496 1476 1719 2042 Sri Lanka 800 741 850 892 940 915 1334 1247 1389 1506 1518
South Asia total 10301 10665 12609 14291 17288 19285 20363 22754 27111 43080 60759
Asia 257800 281500 292700 262900 276900 309500 305900 331100 363600 459300 525300
World 1185100 1270700 1319600 1349700 1405300 1491000 1492900 1600500 1828200 2185800 2414300
Share in Asia 4.00 3.79 4.31 5.44 6.24 6.23 6.66 6.87 7.46 9.38 11.57
Share in world 0.87 0.84 0.96 1.06 1.23 1.29 1.36 1.42 1.48 1.97 2.52
Source: Compiled from Appendix Table A8, WTO (2006) International Trade Statistics.

29
Table A3. Pattern of Intra-regional Merchandise Exports of South Asian Countries (inUS$mn), 2005
Exports
to
From
Afghanistn Bangladesh Bhutan India Maldives Nepal Pakistan Sri
Lanka
Exports to
South Asian
countries
Exports
to world
% share of
intra-regional
X to total Xs
Afghanistn 3.05 0.00 50.63 - 0.00 48.36 0.11 102.15 238.70 42.79
Bangladesh 0.84 3.30 118.88 0.00 3.48 52.00 8.81 187.31 8494.40 2.21
Bhutan
India 143.92 1632.11 95.50 62.30 830.34 641.65 1867.16 5272.98 97918.10 5.39
Maldives - 0.00 - 1.00 0.00 0.00 16.16 17.16 98.72 17.38
Nepal 0.00 2.67 - 337.66 0.00 3.24 0.10 343.67 628.33 54.70
Pakistan 1065.06 234.36 0.24 337.39 2.93 3.60 153.74 1797.32 16046.00 11.20
Sri Lanka 2.04 15.77 - 566.41 27.27 0.40 43.56 655.45 6383.65 10.27
Exports of South Asian countries 8376.04 129807.90 6.45
Table A4. Pattern of Intra-regional Merchandise Imports of South Asian Countries (in US$mn), 2005
Imports
from Into
Afghanistn Bangladesh Bhutan India Maldives Nepal Pakistan Sri
Lanka
Imports from
South Asian countries
Imports
from world
% share of
intra-regional M to total Ms
Afghanistn 0.92 158.31 0.00 1171.57 2.24 1333.04 3002.18 44.40
Bangladesh 3.35 10.44 1951.24 0.00 2.94 143.89 10.05 2121.91 13850.90 15.32
Bhutan
India 55.69 103.91 84.39 1.64 371.43 156.85 523.36 1297.27 134690.00 0.96
Maldives 0.01 83.86 0.01 2.88 42.58 129.34 744.90 17.36
Nepal 0.00 3.83 913.37 0.00 3.96 0.44 921.60 1916.62 48.08
Pakistan 53.20 68.11 0.57 577.40 3.44 3.56 59.14 765.42 25410.00 3.01
Sri Lanka 0.12 8.87 1835.43 21.09 0.11 115.64 1981.26 8863.18 22.35
Imports of South Asian countries 8549.84 188477.78 4.54
Note: The trade values in the above table correspond to the values of the reporting country. The blank row for the trade figures of Bhutan indicates that the country does not report its trade statistics to the IMF. Although there is no reported export or import from Bhutan (row data missing), exports to Bhutan and imports from Bhutan are reported by other SAFTA Members, thus some column entries reported. Source: Compiled from IMF DOTS, (Accessed on 10/10/2007).
Copyright © 2022 FDOKUMEN