A guide to the online BovIS carcass benchmarking application ...
64
1 A guide to the online BovIS carcass benchmarking application using worked examples.
-
Upload
khangminh22 -
Category
Documents
-
view
1 -
download
0
Transcript of A guide to the online BovIS carcass benchmarking application ...
1
A guide to the online BovIS carcass benchmarking application using worked examples.
2
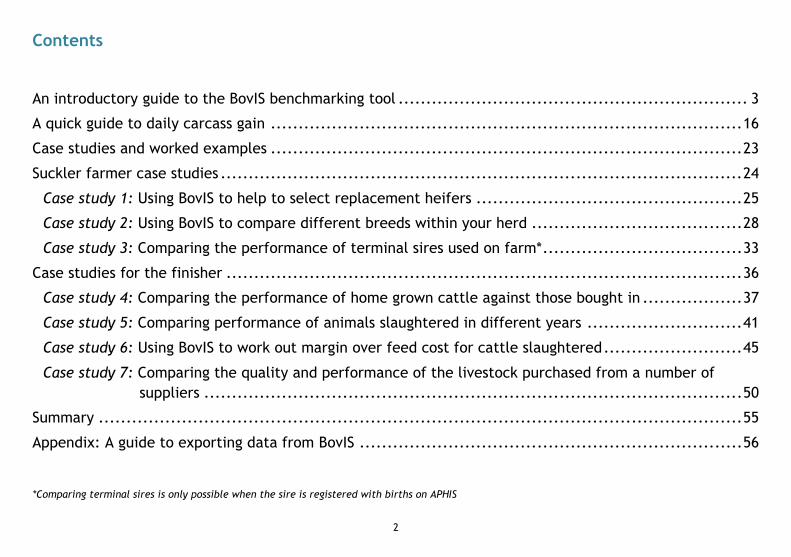
Contents
An introductory guide to the BovIS benchmarking tool ............................................................... 3
A quick guide to daily carcass gain ..................................................................................... 16
Case studies and worked examples ..................................................................................... 23
Suckler farmer case studies .............................................................................................. 24
Case study 1: Using BovIS to help to select replacement heifers ................................................ 25
Case study 2: Using BovIS to compare different breeds within your herd ...................................... 28
Case study 3: Comparing the performance of terminal sires used on farm* .................................... 33
Case studies for the finisher ............................................................................................. 36
Case study 4: Comparing the performance of home grown cattle against those bought in .................. 37
Case study 5: Comparing performance of animals slaughtered in different years ............................ 41
Case study 6: Using BovIS to work out margin over feed cost for cattle slaughtered ......................... 45
Case study 7: Comparing the quality and performance of the livestock purchased from a number of suppliers ................................................................................................. 50
Summary .................................................................................................................... 55
Appendix: A guide to exporting data from BovIS ..................................................................... 56
*Comparing terminal sires is only possible when the sire is registered with births on APHIS

3
An introductory guide to the BovIS benchmarking tool
What BovIS is and why this guide has been developed
Accessing BovIS through online services
Accessing the benchmarking application
Interpreting the summary pages of the BovIS benchmarking application

4
What is BovIS?
The Bovine Information System (BovIS) was developed by the Agri-food and Biosciences Institute
(AFBI) through funding from DARD and AgriSearch. BovIS incorporates carcass information from seven
of the main Northern Ireland abattoirs (accounting for 90 % of the annual kill) and animal information
from APHIS (Animal & Public Health Information System). The BovIS applications and database are
hosted within the NICS secure network environment.
This booklet was developed to provide a practical guide to the BovIS carcass tool and, using worked
examples, demonstrate the use of the application to inform management decisions. The case studies
within this guide are fictitious, but bear resemblance to the main production systems in Northern
Ireland. Each provides a short background on the farm’s production system and how the BovIS carcass
online application was used to help inform the decision making process.
5
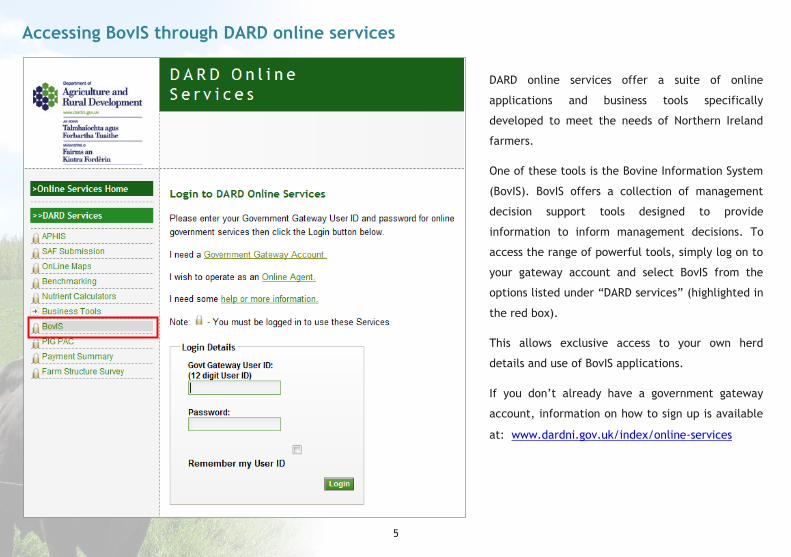
Accessing BovIS through DARD online services
DARD online services offer a suite of online
applications and business tools specifically
developed to meet the needs of Northern Ireland
farmers.
One of these tools is the Bovine Information System
(BovIS). BovIS offers a collection of management
decision support tools designed to provide
information to inform management decisions. To
access the range of powerful tools, simply log on to
your gateway account and select BovIS from the
options listed under “DARD services” (highlighted in
the red box).
This allows exclusive access to your own herd
details and use of BovIS applications.
If you don’t already have a government gateway
account, information on how to sign up is available
at: www.dardni.gov.uk/index/online-services

6
Accessing the benchmarking application
Once you have logged on and selected the BovIS benchmarking application, you will be presented with the benchmarking home
page (below). On the right hand side of the screen is the “Recent Factory Visits” menu. By clicking the “View Records” button, a
list of all your cattle killed at that abattoir on that date will be listed by ear tag, alongside further information including each
animal’s date of birth, type, breed, age at slaughter, carcass weight, conformation grade, fat class and daily carcass gain. To the
left is the “Benchmark My Data” heading, which links to the benchmarking application. (Please note: there is up to a 2 week delay
between slaughter date and data becoming available on BovIS).
Click the “Benchmark
My Data” link to run a
benchmarking report
for your herd.
(For more information
on how to generate a
benchmarking report,
please see page 8)
To view details of
individuals
slaughtered on a
specific date, click
the “View Records”
button.
(Please see overleaf)
7
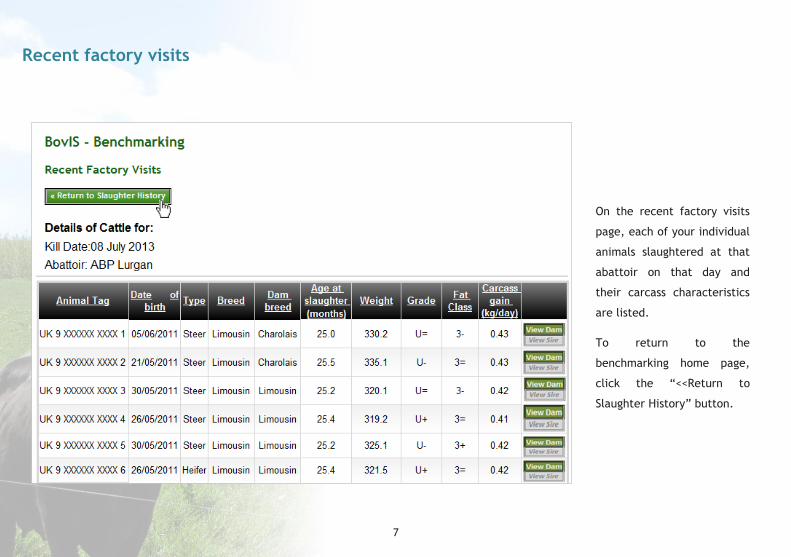
Recent factory visits
On the recent factory visits
page, each of your individual
animals slaughtered at that
abattoir on that day and
their carcass characteristics
are listed.
To return to the
benchmarking home page,
click the “<<Return to
Slaughter History” button.

8
Selecting animals to generate a benchmarking report
Once you have accessed the
“Benchmark My Data” page (see page
6 for instructions); two simple steps
generate the benchmarking report.
1. “Select Report Date Range” (the
date range refers to the
slaughter dates of the cattle)
2. “Select Report Animal Type”
(only one animal type can be
chosen per report)
In this example a report of all steers
slaughtered between 1st March 2013
and 30th April 2013 will be
generated.

9
Interpreting the summary
Once a report has been generated, the first page of the report is the summary. In this example, the performance of steers of all
breeds and categories slaughtered between 1st March 2013 and 30th April 2013 is reported.
This shows the
number of each
animal type
slaughtered in the
reporting period; in
this example, 3
heifers and 23 steers.
This is the date range
in which the animals
were slaughtered.
This lists the “Animal
Type” selected in the
second step when
generating a
benchmarking report.
In this example
“Steers” of “All Breed
Categories” and “All
Breeds” are shown.
The “Summary of
Your Performance”
table shows a
breakdown of carcass
characteristics of the
animals reported on
by breed category.
10
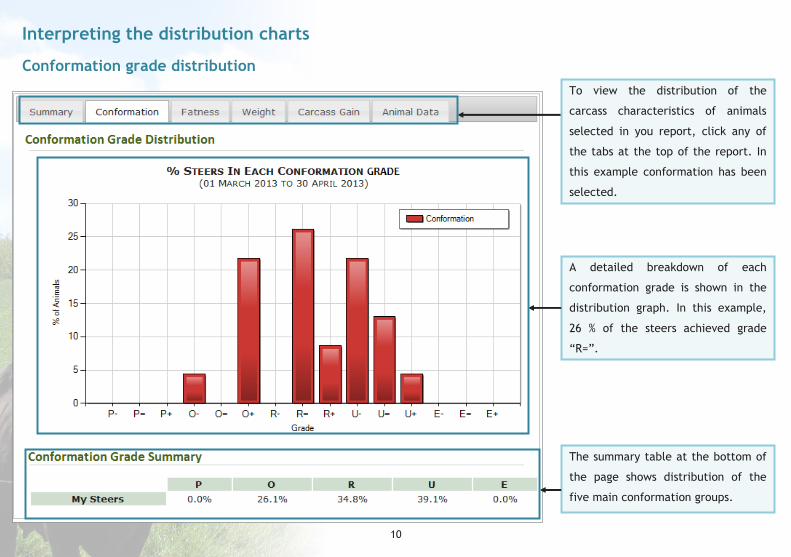
Interpreting the distribution charts
Conformation grade distribution
The summary table at the bottom of
the page shows distribution of the
five main conformation groups.
A detailed breakdown of each
conformation grade is shown in the
distribution graph. In this example,
26 % of the steers achieved grade
“R=”.
To view the distribution of the
carcass characteristics of animals
selected in you report, click any of
the tabs at the top of the report. In
this example conformation has been
selected.

11
Fat class distribution
Similar to the conformation
grade distribution on the
previous page, a clear
distribution of the fat class
is shown both across the 5
fat bands and then further
broken down in the chart
across the 15 classes.
In this example, over 78 %
of animals achieve a fat
class 3.

12
Carcass weight distribution
The carcass weight summary is
split over weight ranges 0-280 kg,
280-380 kg, and 380 kg and above;
corresponding to below, within and
above current in-spec weight
requirements. The current in-spec
weight range is also shown in blue
on the graph.
In this example, 91 % of steers
were slaughtered within the in-
spec weight range.

13
Daily carcass gain distribution
Daily carcass gain is automatically
calculated from the cattle’s age and
weight, in this example all cattle fall
within the 0.4 to 0.6 kg/day daily carcass
gain band.
For a guide to daily carcass gain specific
to breed type, please refer to page 16 of
this booklet.

14
Analysis at an individual animal level
The distribution of conformation, fat class, weight and carcass gain shown in the previous pages are useful for an
overview of performance. A more in depth look at how individual animals performed can be found on the “Animal
Data” tab.
Detailed carcass characteristics are provided for each individual animal, dam and sire (if recorded at time of birth)
and the option to “Export to CSV” which allows the user to download the data and manipulate it (please see
Appendix, page 56).

15
Comparing your cattle to other producers’ cattle
To benchmark your data against other producers’ cattle it is necessary to choose a breed or breed category for comparison. In the
example below, the breed category “Pure Dairy” has been selected. The summary of your performance table then compares your kill in
the selected time period to the average of the top 10 % of producers and the average of all producers. (Top 10 % is calculated on daily
carcass gain, this is discussed further in pages 16-22).
The “Summary of Your
Performance” table
shows a breakdown of
carcass characteristics of
the animals reported and
the average of the top 10
% of producers and the
NI average.
(Please note the top 10 %
is based on carcass gain
and may not represent
the most profitable
production method).
Select a specific breed or
breed category then
click “View report”

16
A quick guide to daily carcass gain
How does BovIS calculate daily carcass gain (DCG)?
BovIS calculates the DCG of cattle slaughtered by dividing the weight at slaughter by the animal
age in days. This assumes 0 kg carcass weight at birth.
How to interpret the daily carcass gain values
BovIS offers the opportunity to compare your performance to both the overall average of
producers and the top 10 % of producers. The top 10 % are calculated by the daily carcass gain
(DCG), however to achieve the highest DCG may not be the most profitable production method.
Typical DCGs required to achieve in-spec weight requirements for a range of cattle types and
production systems are provided in pages 17-22.
17
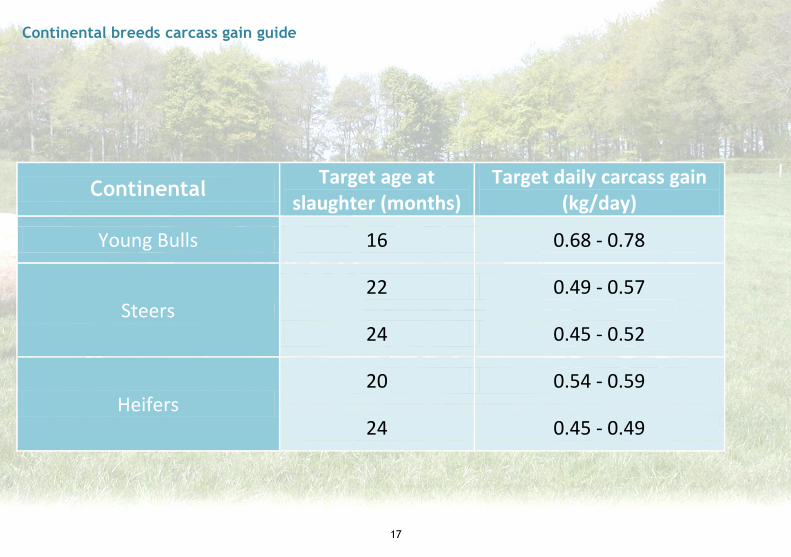
Continental breeds carcass gain guide
Continental Target age at slaughter (months)
Target daily carcass gain (kg/day)
Young Bulls 16 0.68 - 0.78
Steers 22 0.49 - 0.57
24 0.45 - 0.52
Heifers 20 0.54 - 0.59
24 0.45 - 0.49
18
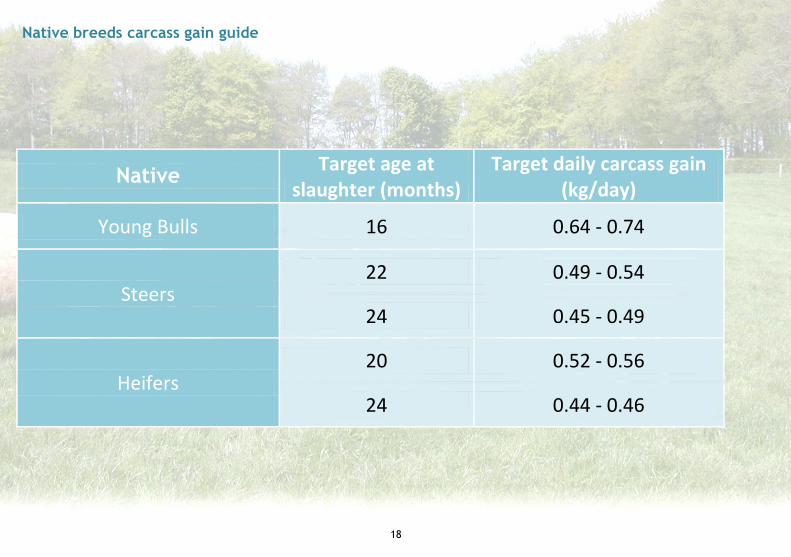
Native breeds carcass gain guide
Native Target age at slaughter (months)
Target daily carcass gain (kg/day)
Young Bulls 16 0.64 - 0.74
Steers 22 0.49 - 0.54
24 0.45 - 0.49
Heifers 20 0.52 - 0.56
24 0.44 - 0.46

19
Dairy breeds carcass gain guide
Pure Dairy Target age at slaughter (months)
Target daily carcass gain (kg/day)
Young Bulls 16 0.61 - 0.68
Steers
22 0.48 - 0.51
24 0.44 - 0.46

20
Continental x dairy carcass gain guide
Continental x dairy Target age at slaughter (months)
Target daily carcass gain (kg/day)
Young Bulls 16 0.66 - 0.76
Steers 22 0.48 - 0.54
24 0.44 - 0.49
Heifers 20 0.52 - 0.56
24 0.44 - 0.46

21
Continental x native carcass gain guide
Continental x native Target age at slaughter (months)
Target daily carcass gain (kg/day)
Young Bulls 16 0.68 - 0.78
Steers 22 0.49 - 0.55
24 0.45 - 0.51
Heifers 20 0.56 - 0.59
24 0.46 - 0.49

22
Continental x dairy carcass gain guide
Native x dairy Target age at slaughter (months)
Target daily carcass gain (kg/day)
Young Bulls 16 0.66 - 0.72
Steers 22 0.48 - 0.52
24 0.44 - 0.48
Heifers 20 0.51 - 0.54
24 0.42 - 0.45

23
Case studies and worked examples
Case studies for the suckler farmer (page 24)
This section includes examples of how the BovIS benchmarking application can be used
by suckler farmers. The fictional case studies show examples of how the commercial
farmer can use the programme to help when: selecting replacement heifers, comparing
different breeds within the herd and comparing terminal sires.
Case studies for the finishing farmer (page 36)
This section includes examples of how the BovIS benchmarking application can be used
by farmers who are finishing beef cattle. The fictional case studies show examples of
how the commercial farmer can use the programme to help when: comparing the
performance of home-grown and bought in cattle, comparing animals slaughtered over
different date ranges, calculating a margin over feed cost, and comparing livestock
purchased from different suppliers.

24
Suckler farmer case studies
How the BovIS carcass benchmarking tool can
be used by the commercial suckler farmer to-
Help select replacement heifers
Compare different breeds within the herd
Compare terminal sires used on farm

25
Case study 1: Using BovIS to help to select replacement heifers
Mr Graham wants to breed replacement heifers. His main priority is to breed replacements which
will have a high milk yield to support calf needs. Alongside using a proven sire which has high
estimated breeding values (EBV) for milk yield, he wants to examine the performance of dams to
see which produced higher quantities of milk. Each year, the dams were served by the same bull
and progeny were reared in groups subject to the same finishing diet and slaughtered at 22
months. Working on the assumption that dams which produce more milk will produce progeny with
a higher daily carcass gain, Mr Graham uses BovIS to help select which dams to breed replacement
heifers from.
26
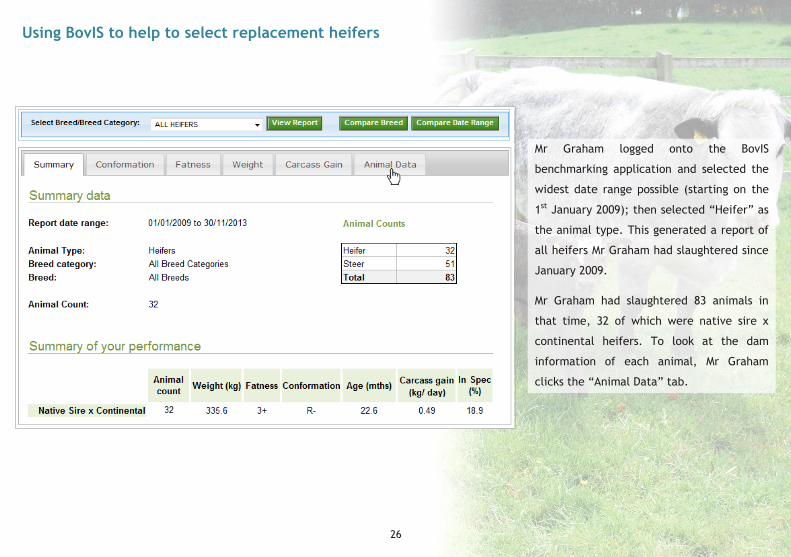
Using BovIS to help to select replacement heifers
Mr Graham logged onto the BovIS
benchmarking application and selected the
widest date range possible (starting on the
1st January 2009); then selected “Heifer” as
the animal type. This generated a report of
all heifers Mr Graham had slaughtered since
January 2009.
Mr Graham had slaughtered 83 animals in
that time, 32 of which were native sire x
continental heifers. To look at the dam
information of each animal, Mr Graham
clicks the “Animal Data” tab.

27
Using BovIS to help to select replacement heifers
Mr Graham selected “View Dam Records”, this brought up the dam information of the animals reported on (in this
example: all the heifers that had been slaughtered since 2009). The dams are listed by “Animal Tag” with a note if the
cow had been killed through a BovIS plant. Mr Graham then sorted the data by average carcass gain, and identified the
cows with the highest average calf carcass gain. Assuming these cows had higher milk yield, the extracted data can
help Mr Graham to make an informed choice of which cows would be most suitable to breed with a maternal sire with
the aim of breeding suitable replacement heifers.
“View Dam Records”
is selected by
clicking this heading.
Once selected, the
heading turns grey.
By clicking the
heading on any of
these columns the
data is sorted in
ascending order; if
clicked twice the
information is
sorted in
descending order.

28
Case study 2: Using BovIS to compare different breeds within your herd
The Johnson family have 36 Limousin cows. Each year, 18 were served to a native breed (Breed N)
and the other 18 were served to a continental breed (Breed C). Mr Johnson is curious to see the
impact that sire choice had on the proportion of his steers meeting in-spec requirements.

29
Using BovIS to compare different breeds within your herd
Mr Johnson selected January 2009 to July 2013 (his last slaughter date) and “Steer” as the animal type. The Johnson family had slaughtered
81 steers in this time, 45 were sired by Breed N (native sire x continental) and 36 were sired by Breed C (pure continental).
The summary shows that a higher proportion of the Breed N (native sire x continental) progeny were meeting in-spec requirements. Mr
Johnson wants to compare the two breeds in more depth, so he selected the breed category “Native x continental”, and then clicked “View
Report”. Once the report was generated he clicked on the “Compare Breed” button.
When using BovIS to
compare two different
breeds within your
herd, it is necessary to
select a breed or breed
category which will be
the basis of the
comparison.
Once a report has
been generated on a
specific breed or
breed category, they
can be compared to
other breed/ breed
categories within
your herd.
30
Using BovIS to compare different breeds within your herd
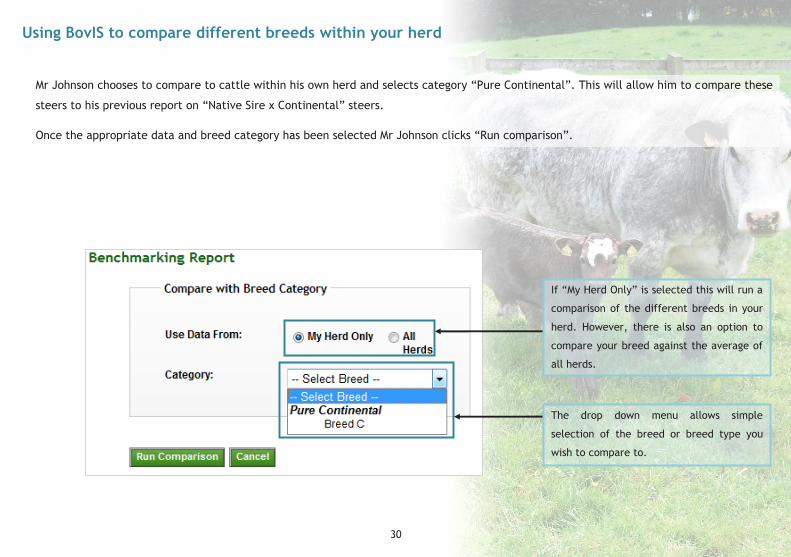
Mr Johnson chooses to compare to cattle within his own herd and selects category “Pure Continental”. This will allow him to compare these
steers to his previous report on “Native Sire x Continental” steers.
Once the appropriate data and breed category has been selected Mr Johnson clicks “Run comparison”.
If “My Herd Only” is selected this will run a
comparison of the different breeds in your
herd. However, there is also an option to
compare your breed against the average of
all herds.
The drop down menu allows simple
selection of the breed or breed type you
wish to compare to.
31
Using BovIS to compare different breeds within your herd
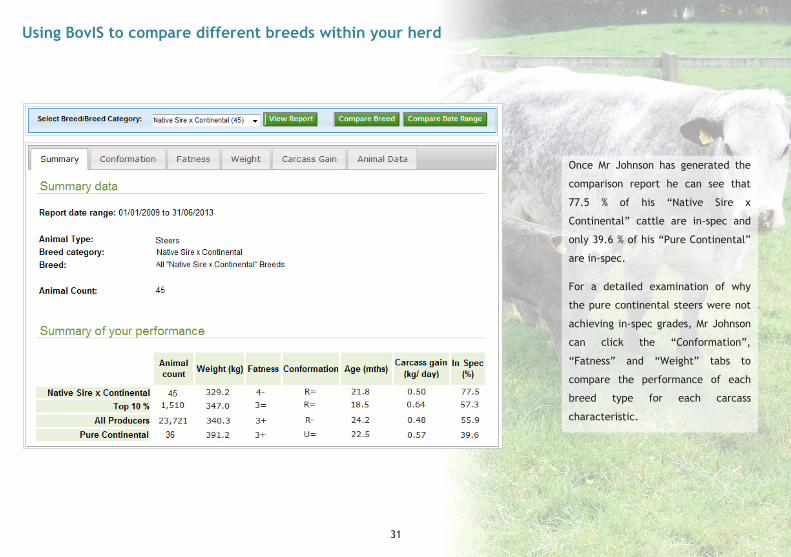
Once Mr Johnson has generated the
comparison report he can see that
77.5 % of his “Native Sire x
Continental” cattle are in-spec and
only 39.6 % of his “Pure Continental”
are in-spec.
For a detailed examination of why
the pure continental steers were not
achieving in-spec grades, Mr Johnson
can click the “Conformation”,
“Fatness” and “Weight” tabs to
compare the performance of each
breed type for each carcass
characteristic.
32
Using BovIS to compare different breeds within your herd
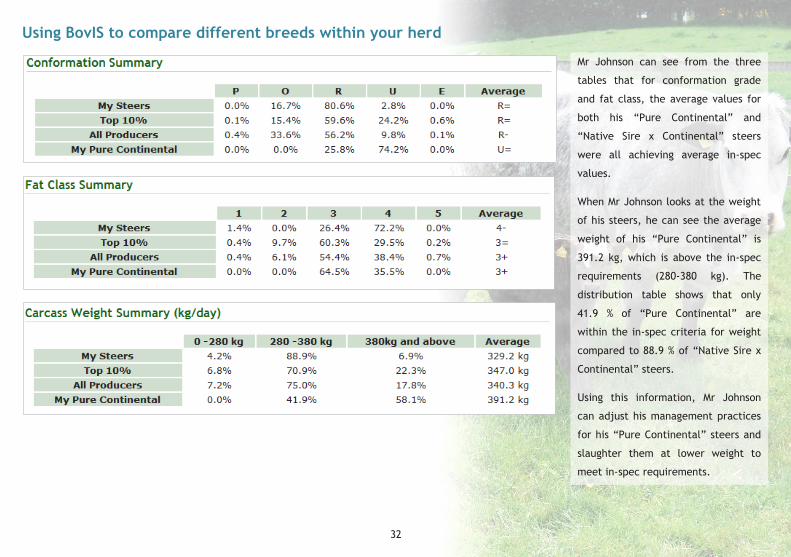
Mr Johnson can see from the three
tables that for conformation grade
and fat class, the average values for
both his “Pure Continental” and
“Native Sire x Continental” steers
were all achieving average in-spec
values.
When Mr Johnson looks at the weight
of his steers, he can see the average
weight of his “Pure Continental” is
391.2 kg, which is above the in-spec
requirements (280-380 kg). The
distribution table shows that only
41.9 % of “Pure Continental” are
within the in-spec criteria for weight
compared to 88.9 % of “Native Sire x
Continental” steers.
Using this information, Mr Johnson
can adjust his management practices
for his “Pure Continental” steers and
slaughter them at lower weight to
meet in-spec requirements.

33
Case study 3: Comparing the performance of terminal sires used on farm*
Mr Thompson has a herd of 100 Limousin x Holstein cows purchased as heifer calves from five dairy
farms. He uses three sires: an early maturing native breed selected for calving ease (Breed N), and
has two bulls of a late maturing, continental breed selected for growth and carcass weight (Breed
X). Breed N is used with heifers and Breed X is used with mature cows. The progeny of both Breed
X sires are managed together and subject to the same finishing regime. Using BovIS, Mr Thompson
wants to compare the performance of progeny from the two Breed X sires.

34
Comparing the performance terminal sires used on farm*
Mr Thompson selected the date range January to December 2012 and steers as the animal type. This gave Mr Thompson a summary of all
the steers slaughtered in 2012. As shown below, Mr Thompson selected the “Pure Continental” breed type (highlighted in the red box).
To compare the performance of the two pure continental sires, Mr Thompson clicks the Animal Data tab to view the sire records.
As expected, heifers crossed
with the native bull produced
progeny with an average carcass
weight lower than the progeny
of mature cows crossed with the
continental bulls.
Mr Thompson is only interested in
the performance of his pure
continental cattle, so he selects
“Pure continental” in the breed
category drop down menu then
clicks “View Report”.

35
Comparing the performance terminal sires used on farm*
Mr Thompson had recorded the sires of calves when registering births on APHIS so he could easily view and compare bulls. To
compare individual progeny of the two Breed X bulls (SIRE 1 and SIRE 2), Mr Thompson clicked the “ ” box beside the desired bull
to expand the information. This details progeny performance for each Breed X bull showing the weight, age, conformation grade, fat
class, and daily carcass gain for each animal and the overall progeny average for each. All progeny were subject to the same
production system (finishing diet and period). Mr Thompson saw that the SIRE 2 was producing progeny with higher carcass weight
and better conformation grade and was able to use this data to inform breeding decisions.
*This information is only available to Mr Thompson because he records sire information when registering calves on APHIS
The “ ”expands the record and shows the individual progeny records.
Once expanded, the sire record
turns green and a table
displaying the progeny of that
animal is displayed.
These links allow you select from Animal/ Dam/ or Sire records

36
Case studies for the finisher
How the BovIS carcass benchmarking tool can be used by the commercial finisher to-
Compare the performance of home grown cattle against those bought in
Compare performance of animals slaughtered over date ranges
Calculate a margin over feed cost Compare the quality and performance of
livestock

37
Case study 4: Comparing the performance of home grown cattle against those bought in
Mrs O’Hara has a herd of 100 cows producing cattle for finishing. In 2012, she slaughtered 36
home bred heifers and 59 home bred steers. In addition to home bred cattle, she bought in
100 steers for finishing. Using BovIS she compared the performance of home grown steers
against the performance of those bought in.
38
Comparing the performance of home grown cattle against those bought in
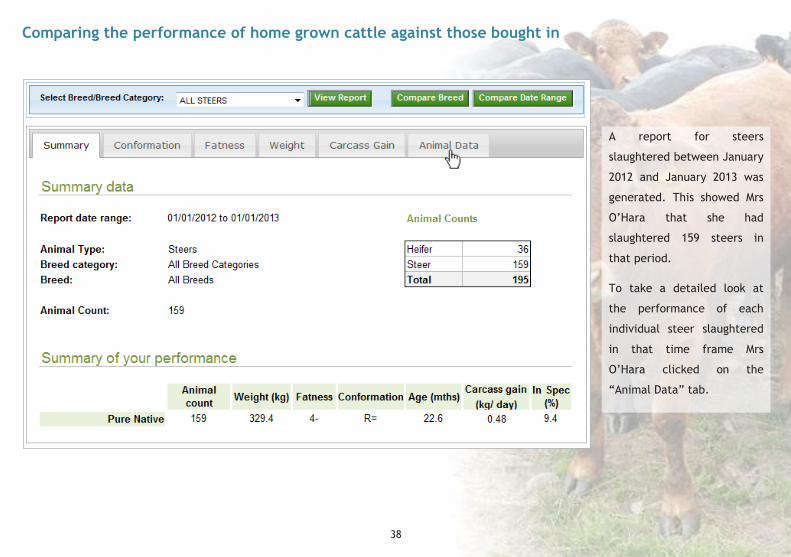
A report for steers
slaughtered between January
2012 and January 2013 was
generated. This showed Mrs
O’Hara that she had
slaughtered 159 steers in
that period.
To take a detailed look at
the performance of each
individual steer slaughtered
in that time frame Mrs
O’Hara clicked on the
“Animal Data” tab.

39
Comparing the performance of home grown cattle against those bought in
On the Animal data page, Mrs O’Hara used the “Export to CSV” button* (located above the carcass gain list), and saved the document to
her computer.
*For more information and a guide to exporting data from BovIS please refer to page 56.
Clicking the
headings of any of
the columns will
sort that data into
numerical/
alphabetical order
The “Export to
CSV” button
allows data to be
saved to your
computer
40
Comparing the performance of home grown cattle against those bought in
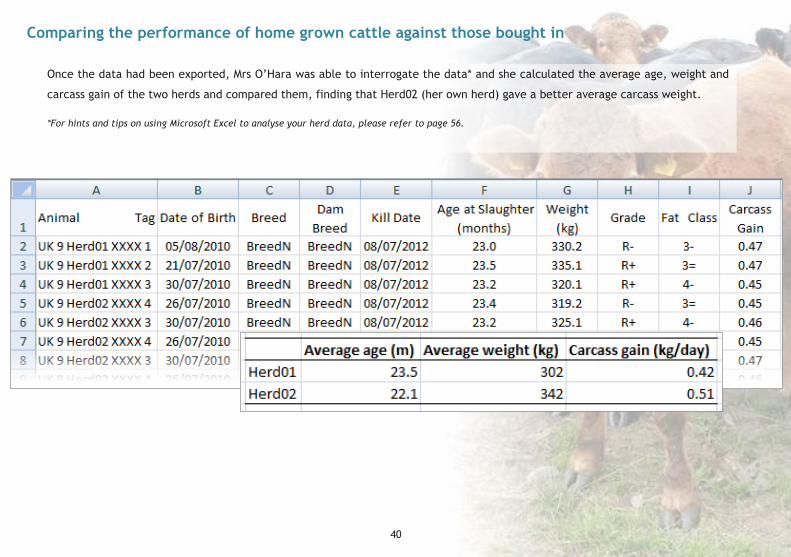
Once the data had been exported, Mrs O’Hara was able to interrogate the data* and she calculated the average age, weight and
carcass gain of the two herds and compared them, finding that Herd02 (her own herd) gave a better average carcass weight.
*For hints and tips on using Microsoft Excel to analyse your herd data, please refer to page 56.

41
Case study 5: Comparing performance of animals slaughtered in different years
In 2011, Mrs Cole offered steers grass silage which was harvested in late June and had a D-value
of 60 and offered 5 kg concentrates per day. Mrs Cole changed her management practice to
harvest grass in mid May 2012 producing higher quality grass silage with a D-value of 70. Mrs
Cole continued to feed 5 kg concentrates. Using BovIS Mrs Cole compared the performance of
steers slaughtered in early 2012 with steers slaughtered in early 2013.
42
Comparing two date ranges
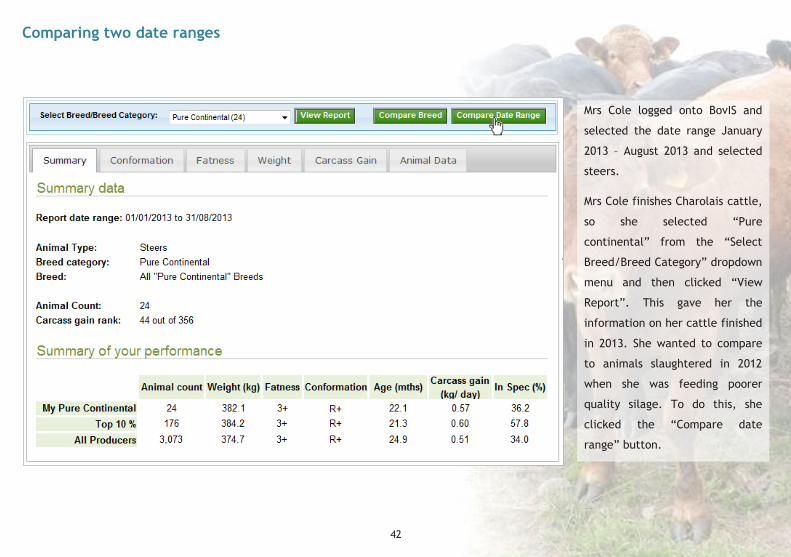
Mrs Cole logged onto BovIS and
selected the date range January
2013 – August 2013 and selected
steers.
Mrs Cole finishes Charolais cattle,
so she selected “Pure
continental” from the “Select
Breed/Breed Category” dropdown
menu and then clicked “View
Report”. This gave her the
information on her cattle finished
in 2013. She wanted to compare
to animals slaughtered in 2012
when she was feeding poorer
quality silage. To do this, she
clicked the “Compare date
range” button.

43
Comparing two date ranges
Once the “Compare date range” button had
been pressed, Mrs Cole was taken to the
“Compare with alternative date range” page,
which allowed her to choose a range of dates
to compare with the range selected in the
current report.
Mrs Cole viewed the data for January 2013 to
August 2013, so for a direct comparison from
the previous year, she selected January 2012
to August 2012, then clicked “Run
comparison” and a report comparing pure
continental cattle slaughtered in the two date
ranges is generated (overleaf).
44
Comparing two date ranges
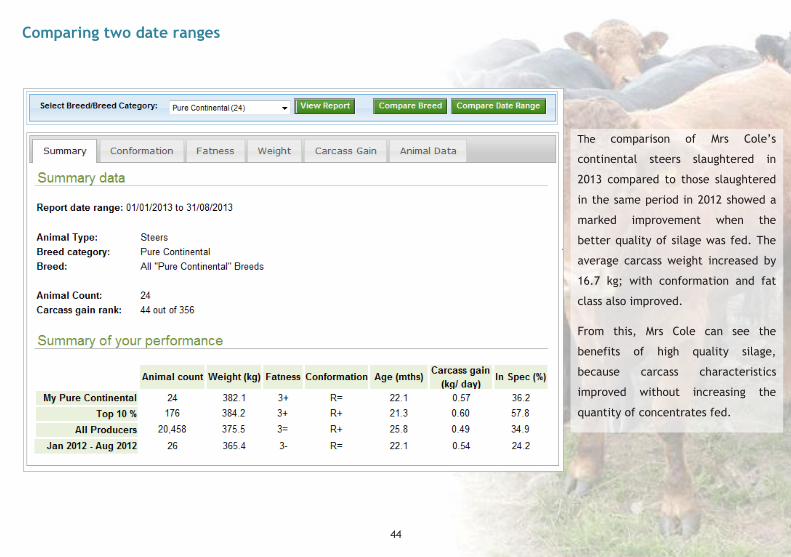
The comparison of Mrs Cole’s
continental steers slaughtered in
2013 compared to those slaughtered
in the same period in 2012 showed a
marked improvement when the
better quality of silage was fed. The
average carcass weight increased by
16.7 kg; with conformation and fat
class also improved.
From this, Mrs Cole can see the
benefits of high quality silage,
because carcass characteristics
improved without increasing the
quantity of concentrates fed.
45
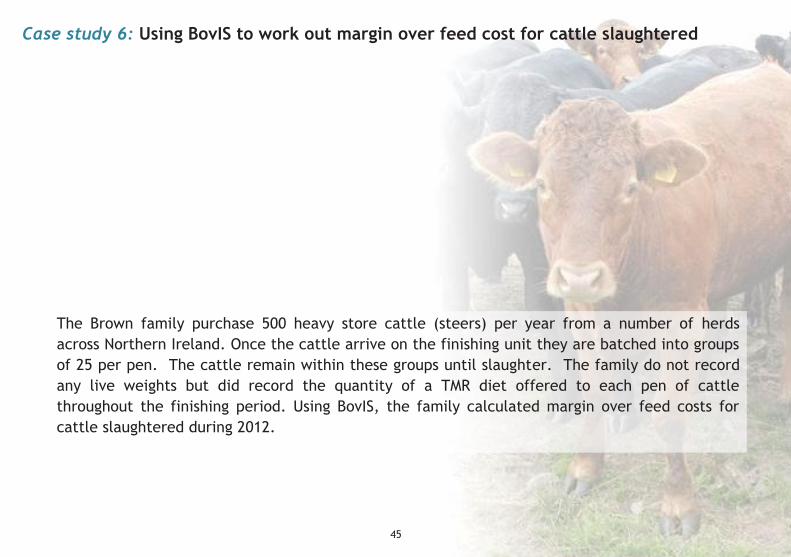
Case study 6: Using BovIS to work out margin over feed cost for cattle slaughtered
The Brown family purchase 500 heavy store cattle (steers) per year from a number of herds across Northern Ireland. Once the cattle arrive on the finishing unit they are batched into groups of 25 per pen. The cattle remain within these groups until slaughter. The family do not record any live weights but did record the quantity of a TMR diet offered to each pen of cattle throughout the finishing period. Using BovIS, the family calculated margin over feed costs for cattle slaughtered during 2012.

46
Calculating margin over feed
Mrs Brown wanted to know specifically
about steers slaughtered in 2012, so
selected a date range of January 2012-
December 2012 and generated a report.
Then Mrs Brown selected “Pure
Continental” as the Breed type/
Category and clicked view Report.
The “Summary of your performance”
report showed 500 cattle had been
slaughtered in this time, and they had
similar carcass characteristics to the
average of all pure continental steers
slaughtered at BovIS plants during this
time, although they were slaughtered at
a slightly younger age.
The Brown family’s cattle are
predominantly made up of two breeds,
and they would like to compare
performance and feed utilisation of the
breeds.

47
Exporting animal data The Brown family have on farm records of each animal including which batch it belonged to and how much that batch was fed.
The Browns also have records of when each animal was bought and how much it cost. Using this information and the
information from BovIS, the Browns can easily work out the average feed consumed per animal within each group and the
margin over feed costs.
Mrs Brown navigated to the “Animal data” tab which listed the 500 cattle slaughtered in 2012. She clicked “Export to CSV” and
saves the file to her computer. She then used the information from BovIS and the information she already has to calculate her
profit margins per animal.
48
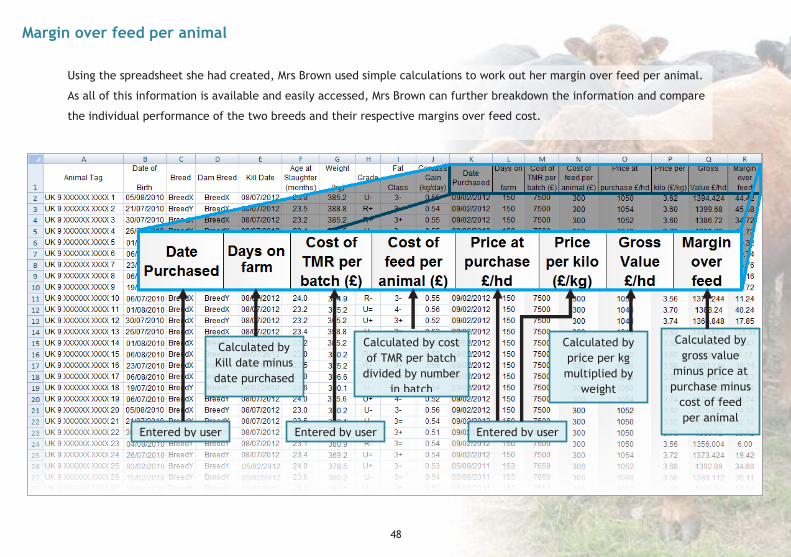
Margin over feed per animal
Using the spreadsheet she had created, Mrs Brown used simple calculations to work out her margin over feed per animal.
As all of this information is available and easily accessed, Mrs Brown can further breakdown the information and compare
the individual performance of the two breeds and their respective margins over feed cost.
Entered by user
Calculated by Kill date minus date purchased
Calculated by cost of TMR per batch
divided by number in batch
Calculated by price per kg multiplied by
weight
Calculated by gross value
minus price at purchase minus
cost of feed per animal
Entered by user Entered by user
49
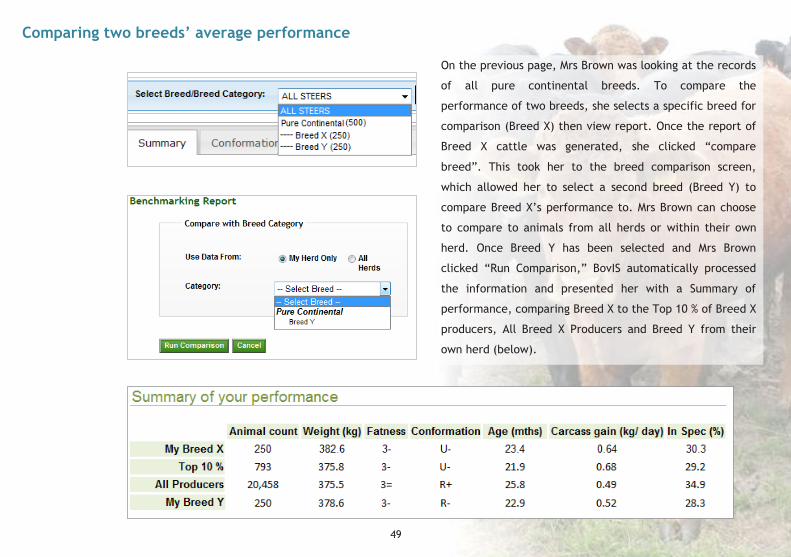
Comparing two breeds’ average performance
On the previous page, Mrs Brown was looking at the records
of all pure continental breeds. To compare the
performance of two breeds, she selects a specific breed for
comparison (Breed X) then view report. Once the report of
Breed X cattle was generated, she clicked “compare
breed”. This took her to the breed comparison screen,
which allowed her to select a second breed (Breed Y) to
compare Breed X’s performance to. Mrs Brown can choose
to compare to animals from all herds or within their own
herd. Once Breed Y has been selected and Mrs Brown
clicked “Run Comparison,” BovIS automatically processed
the information and presented her with a Summary of
performance, comparing Breed X to the Top 10 % of Breed X
producers, All Breed X Producers and Breed Y from their
own herd (below).

50
Case study 7: Comparing the quality and performance of the livestock purchased from a number of suppliers
Mr and Mrs Smith, who own a beef rearing enterprise, purchase 100 weaned Holstein Friesian bull calves between February and March each year. Calves are purchased from three dairy farms at 10-12 weeks of age. The calves are reared as bulls and are intended for slaughter at 16 months of age with a carcass weight of 300 kg. Mr and Mrs Smith have always thought there was large variation in the performance of the bulls and using BovIS have compared the performance of the bulls sourced from the three suppliers.
51
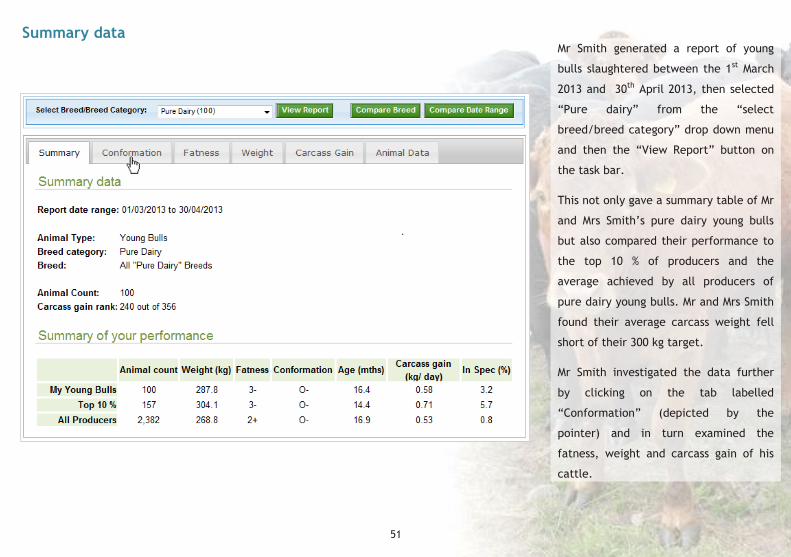
Summary data
Mr Smith generated a report of young
bulls slaughtered between the 1st March
2013 and 30th April 2013, then selected
“Pure dairy” from the “select
breed/breed category” drop down menu
and then the “View Report” button on
the task bar.
This not only gave a summary table of Mr
and Mrs Smith’s pure dairy young bulls
but also compared their performance to
the top 10 % of producers and the
average achieved by all producers of
pure dairy young bulls. Mr and Mrs Smith
found their average carcass weight fell
short of their 300 kg target.
Mr Smith investigated the data further
by clicking on the tab labelled
“Conformation” (depicted by the
pointer) and in turn examined the
fatness, weight and carcass gain of his
cattle.
52
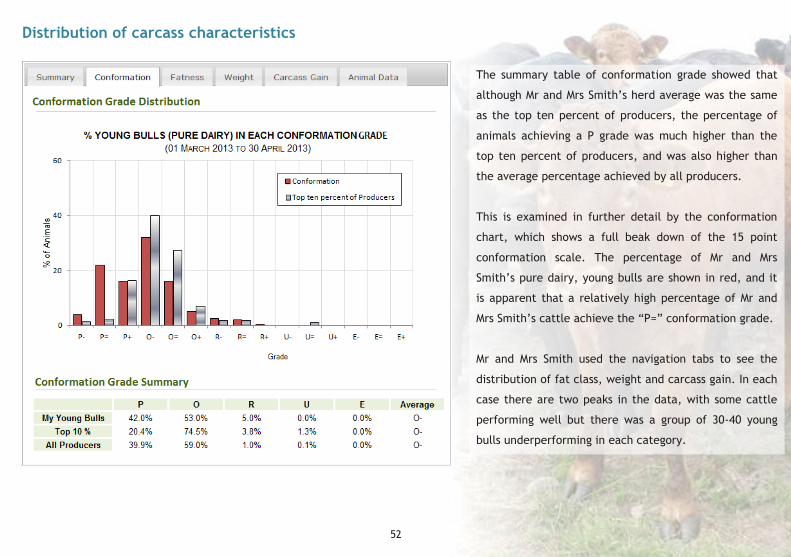
Distribution of carcass characteristics
The summary table of conformation grade showed that
although Mr and Mrs Smith’s herd average was the same
as the top ten percent of producers, the percentage of
animals achieving a P grade was much higher than the
top ten percent of producers, and was also higher than
the average percentage achieved by all producers.
This is examined in further detail by the conformation
chart, which shows a full beak down of the 15 point
conformation scale. The percentage of Mr and Mrs
Smith’s pure dairy, young bulls are shown in red, and it
is apparent that a relatively high percentage of Mr and
Mrs Smith’s cattle achieve the “P=” conformation grade.
Mr and Mrs Smith used the navigation tabs to see the
distribution of fat class, weight and carcass gain. In each
case there are two peaks in the data, with some cattle
performing well but there was a group of 30-40 young
bulls underperforming in each category.
53
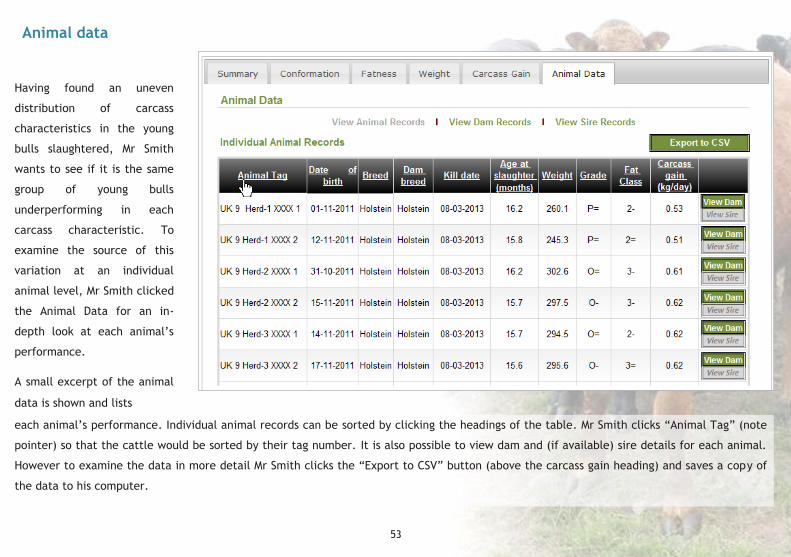
Animal data
Having found an uneven
distribution of carcass
characteristics in the young
bulls slaughtered, Mr Smith
wants to see if it is the same
group of young bulls
underperforming in each
carcass characteristic. To
examine the source of this
variation at an individual
animal level, Mr Smith clicked
the Animal Data for an in-
depth look at each animal’s
performance.
A small excerpt of the animal
data is shown and lists
each animal’s performance. Individual animal records can be sorted by clicking the headings of the table. Mr Smith clicks “Animal Tag” (note
pointer) so that the cattle would be sorted by their tag number. It is also possible to view dam and (if available) sire details for each animal.
However to examine the data in more detail Mr Smith clicks the “Export to CSV” button (above the carcass gain heading) and saves a copy of
the data to his computer.
54
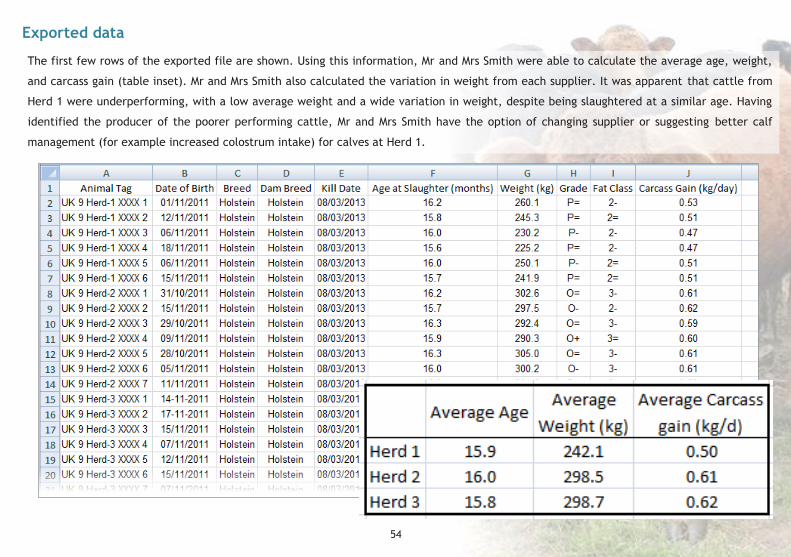
Exported data
The first few rows of the exported file are shown. Using this information, Mr and Mrs Smith were able to calculate the average age, weight,
and carcass gain (table inset). Mr and Mrs Smith also calculated the variation in weight from each supplier. It was apparent that cattle from
Herd 1 were underperforming, with a low average weight and a wide variation in weight, despite being slaughtered at a similar age. Having
identified the producer of the poorer performing cattle, Mr and Mrs Smith have the option of changing supplier or suggesting better calf
management (for example increased colostrum intake) for calves at Herd 1.
55
Summary
The BovIS online carcass benchmarking tool is one of a range of BovIS applications available for free
to the Northern Ireland producer. The application provides information automatically to help inform
breeding and management decisions.
Existing tools will continue to evolve and new applications will be developed to further assist
producers in making informed management decisions.
If you have any queries about BovIS or suggestions, please contact your local CAFRE advisor or email:
56
Appendix: A guide to exporting data from BovIS
The following pages provide a short
introduction to exporting data from BovIS
and how to use Microsoft Excel to analyse
the data. This is a short guide to-
Exporting data from BovIS
Working with exported data
Useful tools on MS excel

57
How to export data from BovIS
Step 1-
Step 2-
In these examples we will be using Microsoft Excel (2007), however the
file downloaded from BovIS is in the “comma separated values” (.csv)
format and as such can be read by most spreadsheet programs.
Step 1- Once you have generated a report on the desired animals,
navigate to the “Animal Data” tab and select to view animal, dam or sire
records. Once the records you want to manipulate are on screen, click
the “Export to CSV” button.
Step 2- A prompt will appear, giving the option to “Open”, “Save”, or
“Cancel”. Click “Save” then select where you want to save the exported
data on your computer. The default name for all exports is
“CattleRecords.csv”, so it is advisable to save the file with a name you
will remember (for example the report date range and animal type). Once
it has saved a copy on your computer you will be able to open the file and
interrogate the data.
58
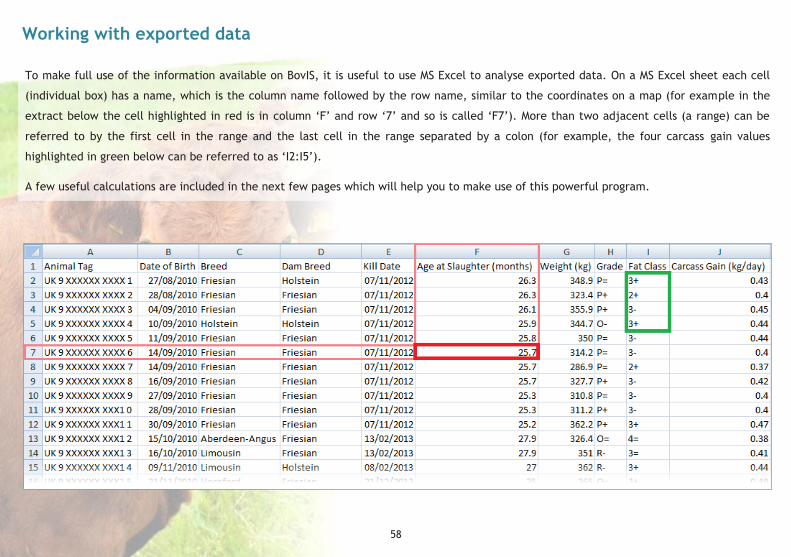
Working with exported data
To make full use of the information available on BovIS, it is useful to use MS Excel to analyse exported data. On a MS Excel sheet each cell
(individual box) has a name, which is the column name followed by the row name, similar to the coordinates on a map (for example in the
extract below the cell highlighted in red is in column ‘F’ and row ‘7’ and so is called ‘F7’). More than two adjacent cells (a range) can be
referred to by the first cell in the range and the last cell in the range separated by a colon (for example, the four carcass gain values
highlighted in green below can be referred to as ‘I2:I5’).
A few useful calculations are included in the next few pages which will help you to make use of this powerful program.
A few useful calculations are included below, but there are many free online courses for MS Excel which will teach you how to filter, sort and make the most out of this powerful program.

59
Useful tools on MS Excel
Filtering
When you are interrogating the BovIS data, you may wish to filter the data. In excel, filtering means setting one or more conditions on the data, and any rows which do not meet the criteria will be hidden.
This is done by clicking on the “Sort and Filter” button and selecting filter. Once the filter is in place, an arrow ( ) will appear in the cell heading each column. In the example below, “Fat Class” is being filtered for in-spec animals.
60
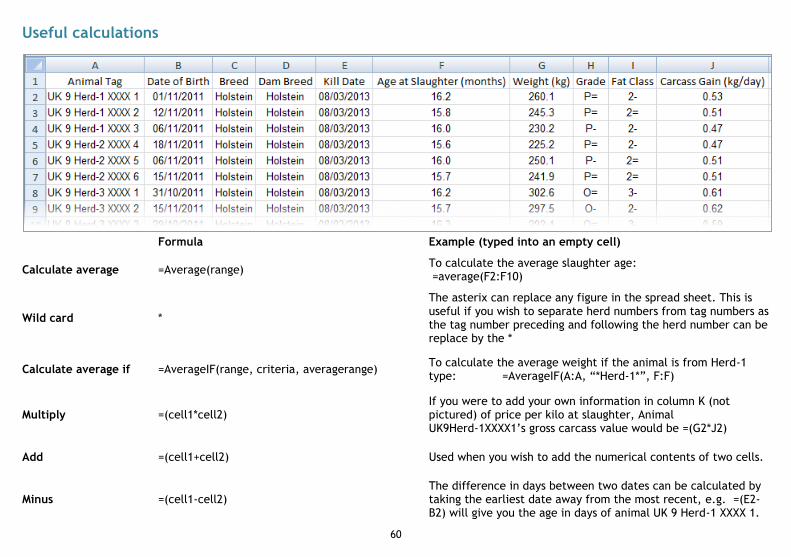
Useful calculations
Formula Example (typed into an empty cell)
Calculate average =Average(range) To calculate the average slaughter age: =average(F2:F10)
Wild card *
The asterix can replace any figure in the spread sheet. This is useful if you wish to separate herd numbers from tag numbers as the tag number preceding and following the herd number can be replace by the *
Calculate average if =AverageIF(range, criteria, averagerange) To calculate the average weight if the animal is from Herd-1 type: =AverageIF(A:A, “*Herd-1*”, F:F)
Multiply =(cell1*cell2) If you were to add your own information in column K (not pictured) of price per kilo at slaughter, Animal UK9Herd-1XXXX1’s gross carcass value would be =(G2*J2)
Add =(cell1+cell2) Used when you wish to add the numerical contents of two cells.
Minus =(cell1-cell2) The difference in days between two dates can be calculated by taking the earliest date away from the most recent, e.g. =(E2-B2) will give you the age in days of animal UK 9 Herd-1 XXXX 1.

61
Notes

62
Notes

63
Notes
64