benchmarking of irrigation projects in maharashtra state
181
WATER RESOURCES DEPARTMENT GOVERNMENT OF MAHARASHTRA, INDIA BENCHMARKING OF IRRIGATION PROJECTS IN MAHARASHTRA STATE 18 th Annual Report 2018-2019
-
Upload
khangminh22 -
Category
Documents
-
view
0 -
download
0
Transcript of benchmarking of irrigation projects in maharashtra state

WATER RESOURCES DEPARTMENT
GOVERNMENT OF MAHARASHTRA, INDIA
BENCHMARKING OF
IRRIGATION PROJECTS
IN MAHARASHTRA STATE
18th
Annual
Report
2018-2019

*
* * *
* * * *
REPORT ON BENCHMARKING OF IRRIGATION PROJECTS IN
MAHARSHTRA STATE
YEAR 2018-19
WATER RESOURCES DEPARTMENT GOVERNMENT OF MAHARASHTRA
FEBRUARY 2021
This report is also available on www.wrd.maharashtra.gov.in

[Benchmarking Report 2018-19]
FOREWORD Water is the most precious resource on which the wellbeing of future generations depends. It is one of the most important input to the agricultural industry, drinking purpose, power generation, industrialization and urbanization. As such, water resources development is a major activity contributing to the overall development of the nation and its increasing population.
Need of the hour is to ensure sufficient quantity of water as and when required for the developmental purpose as there will be two-fold growth in the demand, and drastic reduction in per capita water availability by 2025.
Government of Maharashtra has made a large investment in Water Resources Projects. These are multipurpose projects. Increase in demand of domestic and industrial use due to growth of urbanization and industrialization has resulted into lesser availability of water for irrigation. As irrigation use entails about 70 percent of the total storage, a marginal improvement in the efficiency of water use in irrigation will result in saving substantial quantity, resulting in enhanced food and fodder production. Increasing water use efficiency and reducing the water losses is the need of the hour and is being achieved in a phased manner through benchmarking of Irrigation Projects.
Benchmarking in irrigation sector is a more complex task, as it is subject to site specific characteristics. It has now become a part of strategic management of the department. In order to comply with the commitment in State Water Policy about transparency in water use and to identify the areas of problems in seeking objective set in the project planning, benchmarking of selected projects in the State was in practice since last 17 years.
For this (18th) eighteenth Consecutive Benchmarking Report, Major Projects are grouped with respect to their five various corporations & benchmarking has been done project wise as per recent instructions by CWC, Delhi for selected indicators of state and from various regions of the State, representing various agro-climatic zones.
The benchmarking report of the year 2018-19 of 53 major projects and 187 medium projects are based on 14 indicators with data collected and analyzed in office of, “The Chief Auditor, Water and Irrigation, Maharashtra State, Aurangabad.”
Lastly, I appeal all project authorities to use benchmarking as an effective management tool to improve the current performance level of the irrigation projects.
I encourage & appreciate sincere efforts taken by Chief Auditor, Water and Irrigation, Maharashtra State, Aurangabad and his team for preparation of this report.
Comments & suggestions on this report will be appreciated.
(S K. Ghanekar)
Secretary (WRM &CAD)

[Benchmarking Report 2018-19]
From the Chief Auditor’s Desk
Benchmarking is a proven and globally accepted technique for improving performance, increasing efficiency and productivity of the projects. Maharashtra is the pioneer state in India to introduce the benchmarking technique for irrigation projects. Government of Maharashtra has started the benchmarking exercise since 2001-2002.
This is 18th consecutive report of Benchmarking of Irrigation projects in the state with 240 projects. The Benchmarking of irrigation project is coupled with annual water audit of that respective projects. The data Collected for water audit serves as input data for benchmarking exercise. The consecutive five-year data and current year data is required for comparisons and analysis.
As per discussed in the 9th meeting of CWC, Delhi held on 12th Dec 2017, the new approach was introduced in report since report-year 2012-13 and same methodology is retained for future reports. Since year 2012-13 to up till previous year 2017-18, the analyzation and evaluation was carried out by corporation wise, plan group wise, domain wise with consecutive five-year data with 12 indicators. From this year 2018-19, as per GR CDA-2010/ (543/10) DT- 22/01/2013, the new two indicators are included with same analyzation and evaluation approach in the report. For each irrigation corporation, Performance of major projects in a particular plan group is graphically represented for selected six indicators, which shows internal and external progress. BM results of all 14 indicators for 53 major projects & 187 medium projects are annexure in the report.
It’s a matter of great pleasure for me to publish this report in a ‘New Form’ which will provide a platform for the project authorities and engineers to improve the irrigation system.
I take this opportunity to invite comments and suggestions especially from field officers so that effective benchmarking can be achieved, which may include modern methodologies and innovative technologies to improve in future. Hereby I extend my gratitude to the Benchmarking Team of this office for the sincere & consistent efforts to prepare this Benchmarking Report in a ‘New Form’.
(D. D. Tawar) Chief Auditor
Water & Irrigation Maharashtra State
Aurangabad

[Benchmarking Report 2018-19]
Chief Auditor, Water and Irrigation, Maharashtra State, Aurangabad
Team Associated with Benchmarking Report 2018-19 Chief Auditor Shri T.N. Munde/Shri. D. D. Tawar Executive Engineer Smt. V.M. Bhavsar (Add.C) Assistant Engineer Grade I Smt. R.S. Pujari (Add.C) Sub Divisional Officer Shri. J.N. Bisen (Retd.) Assistant Engineer Grade II Smt. R.D. Virulkar Typist Shri. P. K. Jadhav Team Associated with Administration, Water Cess, ISR and Water Audit Report 2018-19 Executive Engineer Smt. S.J. More (Add.C) Assistant Engineer Grade I Smt. R.S. Pujari Assistant Engineer Grade II Smt. R.D. Virulkar Sectional Engineer Shri. K.K. Barbind Junior Engineer Ku. R.A. Wadekar Team Associated with Godavari Marathwada Irrigation Development Corporation (GMIDC), Aurangabad Executive Engineer Smt. V.M. Bhavsar Sub Divisional Officer Smt. M.A. Kulkarni Sub Divisional Engineer Shri. S.S. Pimpalkar Assistant Engineer Grade II Shri. R.S. Puri Junior Engineer Ku. D.A. Jarange Junior Engineer Shri. B.R. Kadam/ Shri. R.N. Deshmukh Team Associated with Konkan Irrigation Development Corporation (KIDC), Thane Executive Engineer Smt. S.J. More Sub Divisional Officer Shri. V.S. Kadam Sectional Engineer Shri. A.S. Mahalinge Junior Engineer Ku. P.D. Mene Team Associated with Maharashtra Krishna Valley Development Corporation (MKVDC), Pune Executive Engineer Smt. S.J. More (Add.C) Sub Divisional Engineer Smt. U.V. Khamkar Sub Divisional Officer Shri. A.V. Shilwant Sectional Engineer Shri. A.J. Pawar Team Associated with Tapi Irrigation Development Corporation (TIDC), Jalgaon Executive Engineer Shri. P.G. Yenkure (Add.C) Sub Divisional Engineer Shri. P.G. Yenkure Sectional Engineer Shri. V.C. Kulkarni Team Associated with Vidarbha Irrigation Development Corporation (VIDC), Nagpur Executive Engineer Shri. Nandkumar Bhamre Sub Divisional Engineer Smt. S.S. Borade Sub Divisional Officer Shri P.R. Manthekar Sectional Engineer Shri. C.N. Nehate

[Benchmarking Report 2018-19]
AIC A’bad Aurangabad Irrigation Circle, Aurangabad.
AIC Akola Akola Irrigation Circle, Akola
Avg Per Average performance
BCM Billion Cubic Metre
BIPC Buldhana BuldhanaIrrigation Project Circle, Buldhana
CADA Command Area Development Authority
CAWIMSA Chief Auditor, Water & Irrigation, Maharashtra State,Aurangabad
CBIP Central Board of Irrigation & Power
CCA Culturable Command Area
CIPC Chandrapur Irrigation Project Circle, Chandrapur
CR Canal Regulator
CRT Converted Regular Temporary
CWC Central Water Commission
DIRD Directorate of Irrigation Research & Development
DY Distributory
FAO Food & Agriculture Organisation
FY Avg Five year average
GCA Gross Command Area
GMIDC Godavari Marathwada Irrigation Development Corporation
GOI Government of India
GOM Government of Maharashtra
Ha Hectare
HR Head Regulator
HW Hot Weather
I Irrigation
ICID International Commission on Irrigation & Drainage
IMD Indian Meteorological Department
INCID Indian National Committee on Irrigation & Drainage
IPTRID International Programme for Technology and Research in Irrigation and Drainage
ISP Irrigation System Performance
IWMI International Water Management Institute
JIPC Jalgaon Jalgaon Irrigation Project Circle, Jalgaon
KIC Kolhapur Kolhapur Irrigation Circle, Kolhapur
KIC Ratnagiri Konkan Irrigation Circle, Ratnagiri
LBC Left Bank Canal
LY Last Year
m Metre
M cum/ Mm3 Million Cubic Metre
ABBREVATIONS

[Benchmarking Report 2018-19]
Mha Million Hectare
MKVDC Maharashtra Krishna Valley Development Corporation
mm Millimetre
MMISF ACT Maharashtra Management of Irrigation Systems by Farmers Act, 2005
MWIC Maharashtra Water & Irrigation Commission
MWSIP Maharashtra Water Sector Improvement programme
NI Non-Irrigation
NIC Nagpur Nagpur Irrigation Circle, Nagpur
NIC Nanded Nanded Irrigation Circle, Nanded
NIPC Dhule Nashik Irrigation Project Circle, Dhule
NKIPC Thane North Konkan Irrigation Project Circle, Thane
NLBC Neera Left Bank Canal
NRBC Neera Right Bank Canal
O & M Operation & Maintenance
Past Max Maximum value observed in Past five years
Past Min Miniimum value observed in Past five years
PIC Pune Pune Irrigation Circle, Pune
PIM Participatory Irrigation Management
PIM INDEX Participatory Irrigation Management Index
PIP Preliminary Irrigation Programme
PLBC Paithan Left Bank Canal
PRBC Paithan Right Bank Canal
PWD Public Works Department
RBC Right Bank Canal
SIC Sangli Sangli Irrigation Circle, Sangli
Sq Km Square Kilo meter
State Tar State Target
TIC Thane Thane Irrigation Circle, Thane
TIDC Tapi Irrigation Development Corporation
TY This Year
UWPC Amravati Upper Wardha Project Circle, Amravati
VIDC Vidarbha Irrigation Development Corporation
WALMI Water and Land Management Institute, Aurangabad
WB World Bank
WIC Washim Washim Irrigation Circle Washim
WRD Water Resources Department
WUA Water Users’ Association
YIC Yavatmal Yavatmal Irrigation Circle, Yavatmal

[Benchmarking Report 2018-19]
Contents
Foreword………………………………………………………………………………………………. i From the Chief Auditor’s Desk………………………………………………………………………… ii Team of CAWIMS……………………………………………………………………………………… iii Abbreviations………………………………………………………………………………………….. iV Chapter 1. Introduction – Maharashtra at a glance…………………………………………… 1
1.1 Physiography………………………………………………………………............ 2
1.2 Agroclimatic Zones of Maharashtra………………………………………............. 4
1.3 River Basin of Maharashtra……………………………………………………….. 4
1.4 Subbasin wise Planning…………………………………………………………… 6
1.5 Area under Modern irrigation method…………………………………………….. 6
1.6 Climate…………………………………………………………….......................... 6
1.7 Rainfall………………………………………………………………….................. 7
1.8 Rainfall of the State……………………………………………………………….. 8
1.9 Supply System…………………………………………………………………….. 8
1.10 Crops Irrigated…………………………………………………………………….. 9
1.11 Management of System…………………………………………………................ 9
Chapter 2. Benchmarking of Irrigation Projects……………………………………………… 10
2.1 Introduction………………………………………………………………………... 10
2.2 What is Benchmarking?............................................................................................ 10
2.3 Necessity of Benchmarking………………………………….................................. 10
2.4 Performance Indicators……………………………………………………............. 10
2.4.1 System Performance……………………………………………................. 11
2.4.2 Agricultural Productivity………………………………………………….. 11
2.4.3 Financial Performance……………………………………………………. 12
2.4.4 Social Aspects……………………………………………………………. 14
2.5 Methodology………………………………………………………….................... 14
2.6 Fixing State Target ……………………………………………………………….. 15
Chapter 3. Performance of Benchmarking in Maharashtra State…………………….............. 18
3.1 Evolution of Benchmarking………………………………………………………. 18
3.2 Current year Performance ………………………………………………………… 19
Chapter 4. Visual Depiction of Major Projects………………………………………............ 22

[Benchmarking Report 2018-19]
GMIDC- Deficit………………………………………………………………….. 23
Normal…………………………………………………………………. 31
KIDC- Abundant…………………………………………………………………. 39
MKVDC- Highly Deficit …………………………………………………............ 43
Normal ………………………………………………………………… 47
Abundant ………………………………………………………………. 55
TIDC – Deficit…………………………………………………………………….. 59
Normal…………………………………………………………………….. 63
VIDC – Deficit …………………………………………………………………… 67
Normal …………………………………………………….……………... 71
Surplus…………………………………………………………………….. 75
Abundant …………………………………………………………………. 79
Chapter 5. Special Investigation of Irrigation Projects………………………………............. 83
Annexure ……………………………………………………………………………………... 97
Major Project Annexure ……………………………………………………………... 98
Medium Project Annexure ……………………………………………………………. 113

Introduction [Benchmarking Report 2018-19]
CHAPTER-1
Introduction – Maharashtra at a glance
1

Introduction [Benchmarking Report 2018-19]
Chapter 1 - Introduction: Maharashtra at a Glance
Maharashtra occupies main portion of the Indian Sub-continent. The geographical location of the State is bounded between latitude 16.4oto 22.1oN and longitude 72.6oto 80.9oE and has an area of 307.71 thousand sq. km, which is about 9.4 percent of the total geographical area of India. The State has 720 Km long coastline along Arabian Sea. The western hill ranges are almost parallel to this coastline. The State is divided into two physiographic regions of Konkan and rest of the State (Deccan Plateau). The Deccan Plateau spread over the east of Ghats has west-east slope. In general, the altitude of the plateau varies between 300 to 600 m. Maharashtra is bounded by Gujarat, Dadra & Nagar Haveli on north-west, Madhya Pradesh on north, Chhattisgarh on east and Andhra Pradesh, Karnataka and Goa on south.
1.1 Physiography- The State is divided into five major regions 1) Konkan Strip: The narrow strip of land extending from Damanganga basin in north to the
border of Goa State in south is the Konkan. It has Sahyadri ranges on east and Arabian Sea on west. The Konkan strip is about 53 to 60 km wide and 500 km long along north-south. The widest stretch is about 100 km. Width decreases as one proceeds towards south. It is hilly and altitude increases from the east coastline.
2) Sahyadri Ranges: These continuous mountain ranges extend almost parallel to the western coastline. It is known as Western Ghats. The average height of Sahyadri in Maharashtra is 900 m. It is more in the north and decreases towards south.
3) Eastern Plateau Region (Deccan Plateau): The height of this plateau goes on decreasing from 600 m on western side to 300 m in the Wainganga basin on east. This region is formed from lava of igneous rocks. All the districts of Khandesh, Marathwada, Western Maharashtra and the western districts of Vidarbha fall in this region. Satpuda Ranges and Tapi – Purna basin on North. Satpuda hill ranges lie on the northern boundary & is spread over in the districts of Amravati, Akola, Jalgaon and Dhule.
4) Eastern Region Consisting of Wainganga basin: Eastern region comprises of eastern side of the State and flat paddy field region lies along both the banks of the river at an elevation of about 300 m. On the eastern side of this flat region along the Maharashtra - Chhattisgarh boundary are the hills of different geological formations other than the Deccan Trap. Many eastern tributaries of Wainganga originate from this hill range. The height of this hilly plateau is around 800 m
2

Introduction [Benchmarking Report 2018-19]
MAP SHOWING RIVER BASINS OF MAHARASHTA STATE
3

Introduction [Benchmarking Report 2018-19]
1.2 Agroclimatic zones of Maharashtra
Maharashtra has been divided into nine agroclimatic zones on the basis of its rainfall soil type, vegetation & cropping pattern. They are -
South Konkan coastal zone
North Konkan coastal zone
Western Ghat zone
Transition zone - 1
Transition zone - 2
Scarcity zone
Assured rainfall zone
Moderate rainfall zone
Eastern Vidarbha Zone
1.3 River Basins of Maharashtra
The State is mainly covered by the basins of Godavari, Krishna and Tapi except the west-flowing rivers of Konkan strip. A small portion on north comes under Narmada basin. There are in all 380 rivers in the State and their total length is 19269 km. Most of the land is undulating and hilly. Comparatively, continuous hilly plateau lands are very few. Because of this, flow canal systems in Maharashtra are very expensive.
Number of rivers originate from Sahyadri at about 500 to 700 m elevation and flow westward to Arabian Sea through the Konkan strip. Damanganga, Surya, Vaitarna, Ulhas, Karla, Kundalika, Kal, Savitri, Vashishthi, Shastri, Gad, Karli, Tillari and Terekhol are the prominent
4

Introduction [Benchmarking Report 2018-19]
rivers. These rivers are of shorter length holding fair amount of water during monsoon but run totally dry during summer.
Sr. No.
Basin Geographical Area (Mha)
Culturable Area
(Mha)
Avg. Annual Availability
(BCM)
75% Dependable
Yield (BCM)
Permissible Use as Per Tribunal
Award (BCM)
1 Godavari 15.43 11.256 50.88 37.3 34.185
2 Krishna 7.01
5.627 34.032 28.371 16.818
3 Narmada 0.16 0.064 0.58 0.315 0.308
4 Tapi 5.12 3.731 9.118 6.977 5.415
5 W.F. R 3.16 1.864 69.21 58.599 69.21
Total: 30.88 22.542 163.82 131.562 125.936
*W.F. R = West Flowing River
The natural calamities such as land erosion, salt water intrusion, land subsistence etc. are often inflicted upon Konkan. Tapi and Narmada are the two west-flowing rivers coming from Madhya Pradesh and flowing down to Gujarat State through Maharashtra. Narmada forms 54 km long common boundary of the State along northern border. Total length of Tapi in Maharashtra is 208 km. These rivers and tributaries have rendered the land of Khandesh fertile. Wainganga flows in north-south direction. The length of Wainganga in Maharashtra is 476 km. Godavari is the principal east-flowing and longest river in Maharashtra (968 km).
South-East flowing Bhīma & North-South flowing Krishna are the major rivers of South Maharashtra. The length of Bhīma in Maharashtra is 451 km. It joins Krishna on the Karnataka-
Basin Wise Water Availability per ha of Culturable Area
8335
2957
2131
2820
4644
3218 3595
8293
1811 21
22
3112
6332 90
63
1197
6768
5809
2374
0
2000
4000
6000
8000
10000
12000
14000
16000
Uppe
r God
avar
i
Lowe
r God
avar
i
Purn
a Dud
hana
Man
jra
Rem
aining
God
avar
i
Paing
anga
War
dha
Midd
le W
aing
anga
Lowe
r Wain
gang
a
Purn
a Tap
i
Girn
a
Panjr
a
Midd
le Ta
pi
Narm
ada
Uppe
r Kris
hna
(W)
Uppe
r Kris
hna
(E)
Uppe
r Bhim
a
Rem
aining
Bhim
a
Sina
-Bor
i-Ben
itura
Dam
anga
nga-
par
North
Kon
kan
Midd
le Ko
nkan
Vash
isthi
Sout
h Ko
nkan
Tere
khol
-Tilla
ri
cum
Subbasin
Availabil ity per ha.of CCA Avail 1500 Avail 3000 Avail 8000 Avail 12000
Values Exceeding 16000
5

Introduction [Benchmarking Report 2018-19]
Andhra Pradesh boundary near Raichur. Krishna rises near Mahabaleshwar. Krishna is 282 km long in the State.
1.4 Sub-Basin wise Planning
The objectives of the Maharashtra State Water Policy are to ensure the sustainable development and optimal use and management of the State’s water resources, to provide the greatest economic and social benefit for the people of the State of Maharashtra and to maintain important ecological values within rivers and adjoining lands.
The Maharashtra State Water Policy mentions, ‘To adopt an integrated and multi-sectoral approach to the water resources planning, development and management on a sustainable basis taking river basin/sub basin as a unit.
The geographical area of the State is 308 lakh ha and cultivable area is 225 lakh ha. This geographical area is divided mainly into five major river basins of Godavari, Krishna, Narmada, Tapi and basin groups in Konkan. There are 22 narrow basins of west flowing rivers in Konkan.
The Maharashtra Water and Irrigation Commission has proposed delineation of five river basins basically into 25 distinct sub basins for planning of water resources development in the State. The categorization of sub basins proposed is solely on the basis of natural availability of water. The basic characteristics of sub basins are dictated by the hydrological regime, which in turn, is a function of climate, rainfall distribution and the draining area.
Sub basins on basis of naturally available quantum of water is given below:
Sr. No. Plan Group Per ha availability (m3) % of cultivable area of State
i) Highly Deficit Area Below 1500 13
ii) Deficit area 1501-3000 32
iii) Normal area 3001-8000 34
iv) Surplus area 8001-12000 06
v) Abundant area Above 12000 15
1.5 Area under modern irrigation methods
The modern Irrigation methods such as Sprinkler and Drip irrigation systems economize use of water for Irrigation. Area under Sprinkler and drip irrigation in the State by March 2019 was 6.90 L Ha and Lakh 17.30 L Ha respectively. (Ref: ISR 2018-19-Chp-3. Pg. 38)
1.6 Climate
Maharashtra is having mostly a seasonal climate. Four distinct seasons are noticeable in a year viz. (1) Monsoon: The rains start with the south - west winds. Mainly it rains during the four months from June to September, but it often extends up to October. (2) Post-monsoon season: October to mid-December is a fair-weather season with meagre rains. These are the initial months of the post-monsoon, Rabi crops and the condition of later depends upon the weather during these
6

Introduction [Benchmarking Report 2018-19]
months. (3) Winter: It is generally a period of two or two-and-a-half months, from mid-December until end of February. Most of the Rabi crops are harvested during these months. (4) Summer: It lasts for at least three months - March to May.
There is considerable variation in weather and rainfall among the five different geographical regions of Maharashtra.
The coastal districts of Konkan experience heavy rains but mild winter. The weather, however, is mostly humid throughout the year.
The maximum and minimum temperatures here range between 270C to 400C and 140C to 270C respectively. The relative humidity is 81% to 95% during June to August while 30% to 65% during January - February.
The western parts of Nashik, Pune, Satara and Kolhapur districts show a steep reduction in rainfall from the mountainous regions towards the East. The maximum temperature ranges between 260C to 390C and the minimum temperature between 80C to 230C. The relative humidity is 81% to 99 % in August and only 20% to 39% in March.
The eastern part of the above four districts together with Ahmednagar, Sangli, Solapur, Aurangabad, Jalna, Beed and Osmanabad districts fall under the rain shadow of Sahyadri Mountains and therefore the beginning and end of the rainy season is quite uncertain in these parts. The rainfall is also meagre. The climate is extreme. The summer temperature is high (maximum temperature 360C to 410C) but winter temperature is low (minimum temperature. 100C to 160C). The relative humidity in August is between 82% to 84% but only 19% to 26% in April. The rainfall increases as we go towards east viz. Parbhani, Nanded and Yavatmal. Many a times the eastern winds during the end of monsoon cause precipitation here.
Likewise, the Tapi basin, the southern parts of Satpuda ranges and Dhule-Jalgaon districts towards west is low rainfall part like that of rain shadow region. But towards east Buldhana, Akola and Amravati districts experience a heavy rainfall. Summer temperature in this region is quite high (390C to 430C) and minimum winter temperature is found to be 120C to 150C. Relative humidity between May to August is 82% to 87% whereas in March-April it is 12% to 31%.
The Wainganga basin on east of Maharashtra and the hilly region still farther east is, on the whole, a zone having good rainfall, but as it is somewhat low-lying area, the climate is even more extreme. The summer temperature is very high (390C to 450C) while it is cooler in winter as compared to other regions (120C to140C)
1.7 Rainfall
Maharashtra gets rain both from the south-west and the north-east monsoon winds. The proportion of the rainfall derived from the north-east monsoon increases towards east. The average rainfall of the State is approximately 1360 mm. nearly 88% of the total average rainfall occurs between June to September, while nearly 8% occurs between October to December and 4% after December. There is a considerable variation in the reliability of the rains in different parts of the State.
7

Introduction [Benchmarking Report 2018-19]
The steep decline in the rainfall to east of Sahyadri is strikingly noticeable. In the 30 to 50 km wide belt the average rainfall is observed to be less than 650 mm (as low as only 500 mm at some places). Thereafter, the rainfall increases steadily towards east and the average rainfall in the easternmost districts is observed to be 1400 mm. The number of average annual rainy days is maximum 95 in Konkan, 55 in Vidarbha, 51 in Western Maharashtra and the minimum 46 in Marathwada. Out of the total cultivable land in Maharashtra about 53% is under Kharif and about 30% is under Rabi crops. These mostly comprise of food grains and oilseeds.
The rainfall during June to September affects both the Kharif and the Rabi crops. That is why the regularity of rainfall during this period is of importance. But it is seen that there is considerable fluctuation in the number of rainy days as well as the amount of rainfall from year to year. The fluctuation in rainfall is observed to be 25%, 40% and in between 20% to 30% in Konkan, Central Maharashtra and Vidarbha respectively. Crop management on fields during this period thereby becomes quite difficult.
1.8 Rainfall of the State (June to Oct 2018)
The seasonal rain arrived in the state on June 8 2018, in South Konkan, South Central Maharashtra, Marathwada and some part of Vidarbha region. In Year 2018, Rainfall is 73.6% of average rainfall. As compared to the average rainfall, state has received about 106.5%, 85.1%, 76.3%, 28.2% & 19.0% in the months of June, July, August, September & October respectively.
Out of 355 Talukas in the state (except Mumbai & Mumbai Suburban District), 9 Talukas received sporadic rainfall, 183 Talukas (51.5%) received insufficient rainfall, 138 Talukas average whereas 25 Talukas witnessed excess rainfall. Among the districts receiving rainfall in Nagpur region, Pune region, Nashik region, Amravati region, Aurangabad region & Konkan region are 948.1 mm, 730.3 mm, 457.7 mm, 632.8 mm, 494.5 mm & 2897.4 mm. (Reference: Maharashtra Economic Survey 2018-19)
1.9 Supply System
Generally, supply of water for irrigation is through distribution network of canals off-taking either from dam or from pick-up-weir. The distribution network consists of main canal, branch canal, distributary, minor and field channels. The open canals are either lined or unlined, but mostly the systems are unlined. Recently water is also supplied for irrigation through piped distribution network in some projects.
Water is supplied to irrigators, individuals as well as WUA via distribution network through outlets. In addition, there are individual, co-operative, Govt. owned lifts on reservoirs, rivers and canals. In most of the projects, major area is under gravity irrigation and small part under lift irrigation. Some projects are specially lift irrigation projects with storage reservoir or storage in the form of barrages or series of Kolhapur type weirs downstream of reservoir. In most of the Major& Medium irrigation projects, water reserved for non-irrigation (domestic and industrial) varies from 15 % to 25 %.
8

Introduction [Benchmarking Report 2018-19]
The supply of water for domestic and industrial purpose is mostly made through pipeline either from reservoir, main canal or from river.
The projects selected for Benchmarking are having major area under flow irrigation with small percent under lift irrigation. The lifts are on main canals as well as reservoirs. Most of the medium projects supply irrigation water for eight monthly cropping patterns i.e., Kharif & Rabbi and very small quantum for Hot Weather or perennial crops. There is a tendency amongst farmers to use the water saved in Kharif and Rabbi Season for Hot Weather or Perennial crops.
The performance of a circle (herein called service provider) very much depends upon the availability of water, which in turn is governed by the type of sub-basin in which the project is located. Some circles are having projects located in more than one category of plan group of sub-basins. Therefore, these circles will appear more than once, in graphical representation of indicators.
1.10 Crops Irrigated
There is significant variation in crops within the regions & in projects under a region. Principal crops grown in different regions and plan group wise are as below-
Region Plan group Principal crops grown
Eastern Vidarbha Abundant & Surplus Kharif Paddy, HW Paddy
Western Vidarbha Normal Cotton, Wheat, Gram, Sunflower, Orange
Marathwada Normal & Deficit Cotton, Wheat, Rabi Jawar, Gram, Sunflower, Soyabean, Groundnut, Sugarcane, Banana
North Maharashtra Normal RabiJawar, Maize, Wheat, Bajra, Cotton, Vegetables, Grapes, Sugarcane, Banana
Western Maharashtra Normal & Abundant Maize, Wheat Wheat, Vegetables,
Pomegranates, Sugarcane
Konkan Abundant Paddy, Vegetables, Mango
1.11 Management of Systems
GOM has taken a policy decision to supply water for irrigation through Water Users’ Associations only. Accordingly, the MMISF Act was passed by the Government in year 2005. Irrigation management of area under jurisdiction of WUA is being transferred to them. Waghad Project in North Maharashtra region was handed over to Federation of WUA for irrigation management.
The process of handing over the culturable command area (6,68,850 Ha) of selected 286 projects to the WUA within stipulated time frame, Maharashtra Water Sector Improvement Project has been taken up with the help of World Bank.
9

[Benchmarking Report 2018-19]
Chapter 2-Benchmarking of Irrigation Projects
2.1 Introduction
Benchmarking of Irrigation project is a joint international initiative of the WB, IPTRID, ICID, IWMI AND FAO. It was adopted from year 2000 and now widely accepted all over the world.
Government of Maharashtra, India has also undertaken the benchmarking performance in irrigation system since year 2000-2001 as per the guidelines issued by INCID. Maharashtra is the pioneer state in India to introduction the benchmarking technique for irrigation projects. Based on our practice and experience, CWC follow-up all the state to carry forward the exercise of benchmarking of Irrigation projects for the benefits of farmers as it improves the project performance, increase its efficiency and enhance the agricultural productivity.
2.2 What is Benchmarking?
Benchmarking is a very powerful management tool for analyzing and improving the performance of Water Resources Projects. It has also broad application in problem solving, planning, goal setting, process improvement and in various another context.
According to Malano & Burton (IPTRID-2001), Benchmarking can be defined as-
“A systematic process for securing continual improvement through comparison with relevant and achievable internal or external norms and standards.”
It implies comparison – internally with previous performance and desired future targets and externally against similar projects. It also determines the performance gap between current practice and best practice to improve at the higher standard of performance. Selected best practice can be suitably adopted.
2.3 Necessity of Benchmarking
Increasing demand on the irrigation sector to produce more food for growing populations. Coupled with the pressure on available water resources, this result in the “more crop per drop” initiative promoted by IWMI and FAO (as per IPTRID)
Increasing interest by the wider community in productivity and efficient water resources use.
To achieve financial sustainability of irrigation scheme and phase out state subsidy.
Increasing need for accountability to both department and water users in respect of water resource use and price paid for water.
2.4 Performance Indicators
An idea about indicators relevant with the four domains that are System Performance, Agricultural Productivity, Financial Aspects and Social Aspects.
10

[Benchmarking Report 2018-19]
2.4.1 System Performance
Providing facility of water for irrigation and other purposes is the main function of the project authorities. The water distribution system is influenced by physical, climatic, economic and other factors. In particular, the prevailing climatic conditions largely determine both, the available water resources and the crop water requirements in any season. The main task of the project in-charge is to manage the system so as to optimize the use of available resources in order to meet sanctioned quota in an effective and efficient manner.
Indicator I - Annual Irrigation Water Supply per Unit Irrigated Area (Mm3/Ha)
Annual irrigation water supply per unit irrigated area is the total quantity of water supplied for irrigation in all the seasons of a year compared to the total area irrigated in Kharif, Rabi & HW on canal, reservoir and river during irrigation year.
Annual irrigation water supply per unit irrigated area varies with water availability, cropping pattern, climate, soil type, system conditions, system management etc. As a measure of efficiency of irrigation system, State target of 7692 cum/ha is set for major and medium projects and 6667 cum/ha for minor projects.
Indicator I (a) - Annual Area irrigated per unit of water supplied (Ha/Mm3)
Area irrigated per unit of water supplied during Rabbi Season as 150 Ha/Mm3 and during H/W season is 110 Ha/Mm3 is set as target. Hence state target is the Mathematical Average = 130 Ha/Mm3.
Indicator II - Potential Utilized & Created –
This is the ratio of potential utilized (crop area measured) to created irrigation potential of the project. Crop area irrigated on canal, reservoir, wells, river in the command area is considered as potential utilization. The irrigation potential created through large investments should be fully utilized. However, the utilization is governed by the availability of water in the reservoirs. Therefore, calculation of effective irrigation potential is made proportionate to availability of water for irrigation in that year
Indicator XIII - Water Delivery Capacity Index
This indicator is split up into two parts i.e., Water Delivery Capacity index of left bank canal and right bank canal. It is the ratio of maximum discharge let out through LBC/RBC to the design discharge of LBC/RBC.
2.4.2 Agricultural Productivity
In Maharashtra, more than 55% population depends on Agriculture, thus production per unit area as well as per unit water is vital for State’s economy.
For this domain the indicators chosen are
Indicator III- Output per Unit Irrigated Area
Output per unit irrigated area is the output in rupees of agricultural production from irrigated area in hectares. Here the area irrigated means potential utilized. As the population grows,
11
[Benchmarking Report 2018-19]
the land holding per capita goes on reducing. Secondly, there are some constraints to bring additional lands under irrigation. Thus, it is important that the output per unit area has to be increased with efficient water and land management, improved seeds and adoption of latest agricultural technology.
The efforts have to be made to increase output by diversification of cropping pattern, better farm practices and judging the market needs. However, water is the only input in agriculture on which service provider has control. Therefore, to have an idea about trend of production in the command, which depends upon timely supply of water in adequate quantity, this indicator has been adopted. The yield data for the year of various crops is collected from agriculture department. The market prices are obtained from ‘Agricultural Produce Market Committees’ located in each taluka. In respect of sugarcane, prices are obtained from sugar factories in the command area and for prices of cotton, from ‘Cotton Federation’. The prices of 1998-99 are considered as base prices for all the remaining years & output is worked out accordingly.
Indicator IV- Output per Unit Irrigation Water Supply
Output per unit irrigation water supply is value in ‘Rupees’ of agricultural production from irrigated area compared to total quantity of water supplied for irrigation. The output per unit irrigation water supply is an indicator of optimal use of water.
2.4.3 Financial Performance
Any system is to be termed as economically self-sustainable, if the annual O & M expenditure incurred on the project is met from its own revenue.
In Maharashtra, the water charges are recovered for all uses to encourage efficient water use. Presently, the practice of volumetric supply is in use for WUA, Domestic and Industrial water supply.
The indicators chosen for financial performance are given below.
(i) Cost Recovery Ratio
(ii) Total O&M Cost per unit area
(iii) Total O&M Cost per unit Volume of Water Supplied
(iv) Revenue per unit water supplied
(v) Assessment Recovery Ratio (Irrigation & Non-Irrigation)
Indicator V- Cost Recovery Ratio
It is the ratio of recovery of water charges to the cost of providing the service. Recovery of water charges and O&M cost incurred during the period of irrigation year is considered. Secondly the operation cost includes the salary of technical & ministerial staff working on irrigation management respective of its establishment type (i.e. Regular Temporary/Converted Regular Temporary/Work Charged/Daily rated). It is imperative to devise water rates and mechanism for recovery of water charges for irrigation use in such a manner to meet, at least, annual cost of
12

[Benchmarking Report 2018-19]
management, O&M of system and recovery of some portion of capital investment on the projects in order to make the system self-sustainable. Then critically the cost recovery ratio should be at least equal to one.
Indicator VI-Total O&M Cost per Unit Area
Total O&M cost per unit area is the ratio of total O & M cost incurred for management of the system and area irrigated (potential utilized) during the irrigation year. The total O&M cost includes cost of maintenance as well as all types of establishment charges. The annual maintenance cost incurred does not include cost of modernization and special repairs. Establishment charges include salary paid to staff working up to a management section.
The O&M cost per unit area should be as minimum as possible. GOM has prescribed yearly O&M norms per hectare excluding establishment cost. The O&M cost per unit area is more in projects where there is less irrigation compared to created potential.
Indicator VII- Total O & M Cost per Unit Water Supplied:
Total O&M cost per unit water supplied is obtained by dividing total O&M cost by total quantity of water supplied for irrigation and non-irrigation use during the year.
Total O&M cost per unit volume of water supplied should be as minimum as possible to achieve economy in supply.
Indicator VIII- Revenue per Unit Water Supplied
It is the ratio of total revenue and quantity of water supplied for irrigation &non irrigation use during the irrigation year.
Revenue per unit volume of water supplied is very important measure as every drop of water is to be used efficiently and economically. The ratio also gives an idea about revenue realized against actual water supplied. The indicator will have more importance once the water is supplied on volumetric basis.
Indicator XII- Assessment Recovery Ratio
This indicator is split up into two components viz.
a) Irrigation (XII (I))
b) Non-Irrigation (XII (NI))
In case of both the uses, there are arrears of water charges in many projects due to some or other reasons, one of the reasons being post pavement of recovery during draught years.
It is the ratio of recovery of water charges during the irrigation year 2017-18 and assessment of charges for Kharif & Rabbi of 2018-19 for irrigation and for Hot-Weather of 2017-18. For non-irrigation purpose assessment for water used during the year 2018-19is considered.
The purpose of introducing this indicator is to check whether the water charges assessed during the irrigation year (1 July to 30 June) are totally recovered or not. For this indicator, recovery of arrears is not considered.
13

[Benchmarking Report 2018-19]
2.4.4 Social Aspects
Indicator XI: - Equity Performance
Most of the schemes are gravity systems with canals and distribution system. The command area is divided equally as head, middle & tail reaches. Equity performance means ratio of sum of actual area irrigated in all three seasons (canal flow and lifts on canal) to projected irrigable command area & is expressed as percentage. This indicator gives clear picture as to whether or not the irrigation facility is provided equitably to head; middle & tail reach farmers in command area.
The benefit of irrigation should be given to the beneficiaries in head, middle &tail reach equitably. Ideally for equity, this ratio should be equal to one for head, middle as well as tail reached. The head, middle and tail reaches is decided based on dividing the command in to three equal parts.
Indicator XIV – Participatory Irrigation Management Index
This is the ratio of total area handed over to water users association to the irrigation potential created.
2.5 Methodology
The data presented in this report is based on information collected from each of the circle-in-charge of the project. Irrigation projects of different categories viz.
I. Major Projects have (CCA more than 10000Ha),
II. Medium Projects have (CCA more than 2000 Ha and below 10000 Ha)
Following process was used in developing the report-
Data is collected in template files (Data sheet & Analysis Sheet) in a formulated Excel Spread Sheet from the concerned project authorities and analyzed in CAWIMS Office. An explanatory note containing detailed instructions about working out the figures of different indicators was issued to field officers.
The data about water use and area irrigated is co-related with water accounts of the current year of relevant projects.
The presentation for every indicator is done with past five-year average, recent past and present year, in order to compare the performance with predecessors as well as own performance of last year as shown in annexure.
The draft report is scrutinized & finalized in CAWIMS, Aurangabad.
For financial indicator of output per unit irrigated area and output per unit irrigation water supply, prices of year 1998-99 are considered to obviate effect of price rise.
14
[Benchmarking Report 2018-19]
Fixing State Target Values:
The State targets set for indicators were introduced from the year 2002-03 and are decided based on studies and past performance. It is obvious that project size, available water storage in reservoir and agro-climatic, geographical, social conditions are different for different regions. Therefore, there will be difference in performance of irrigation projects but to improve overall State performance and for simplicity, single target for each indicator for the State is defined. Performance of projects in a circle against each indicator is collective performance.
In 2003-04, the values of some of the indicators are revised and for financial indicator of output per unit irrigated area and output per unit irrigation water supply, fixed prices of 1998-99 are considered to obviate effect of price rise. Also, for better monitoring and looking to the number of projects, the analysis is carried out considering irrigation circle as a unit and projects therein within similar plan groups of Sub-basins.
The State target values set for Indicator I, III & IV are different; for different categories of the projects viz. (a) major & medium. For other Indicators, the targets are uniform for all types of projects.
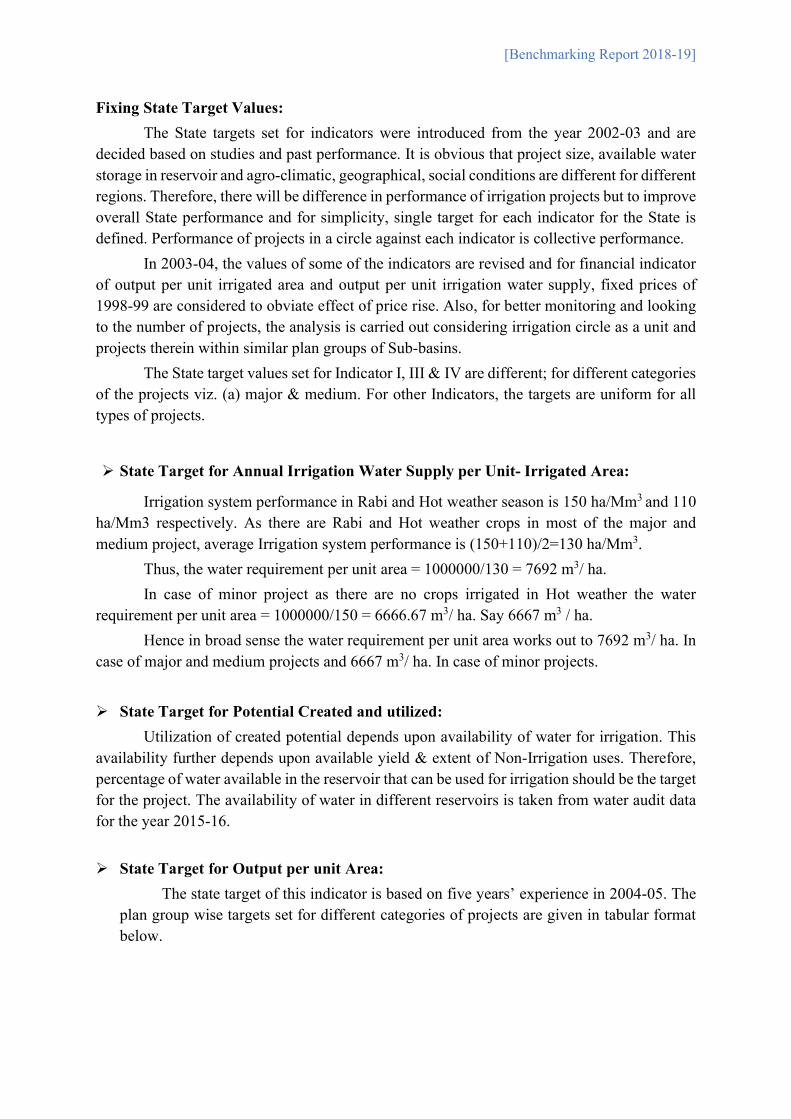
State Target for Annual Irrigation Water Supply per Unit- Irrigated Area:
Irrigation system performance in Rabi and Hot weather season is 150 ha/Mm3 and 110 ha/Mm3 respectively. As there are Rabi and Hot weather crops in most of the major and medium project, average Irrigation system performance is (150+110)/2=130 ha/Mm3.
Thus, the water requirement per unit area = 1000000/130 = 7692 m3/ ha.
In case of minor project as there are no crops irrigated in Hot weather the water requirement per unit area = 1000000/150 = 6666.67 m3/ ha. Say 6667 m3 / ha.
Hence in broad sense the water requirement per unit area works out to 7692 m3/ ha. In case of major and medium projects and 6667 m3/ ha. In case of minor projects.
State Target for Potential Created and utilized:
Utilization of created potential depends upon availability of water for irrigation. This availability further depends upon available yield & extent of Non-Irrigation uses. Therefore, percentage of water available in the reservoir that can be used for irrigation should be the target for the project. The availability of water in different reservoirs is taken from water audit data for the year 2015-16.
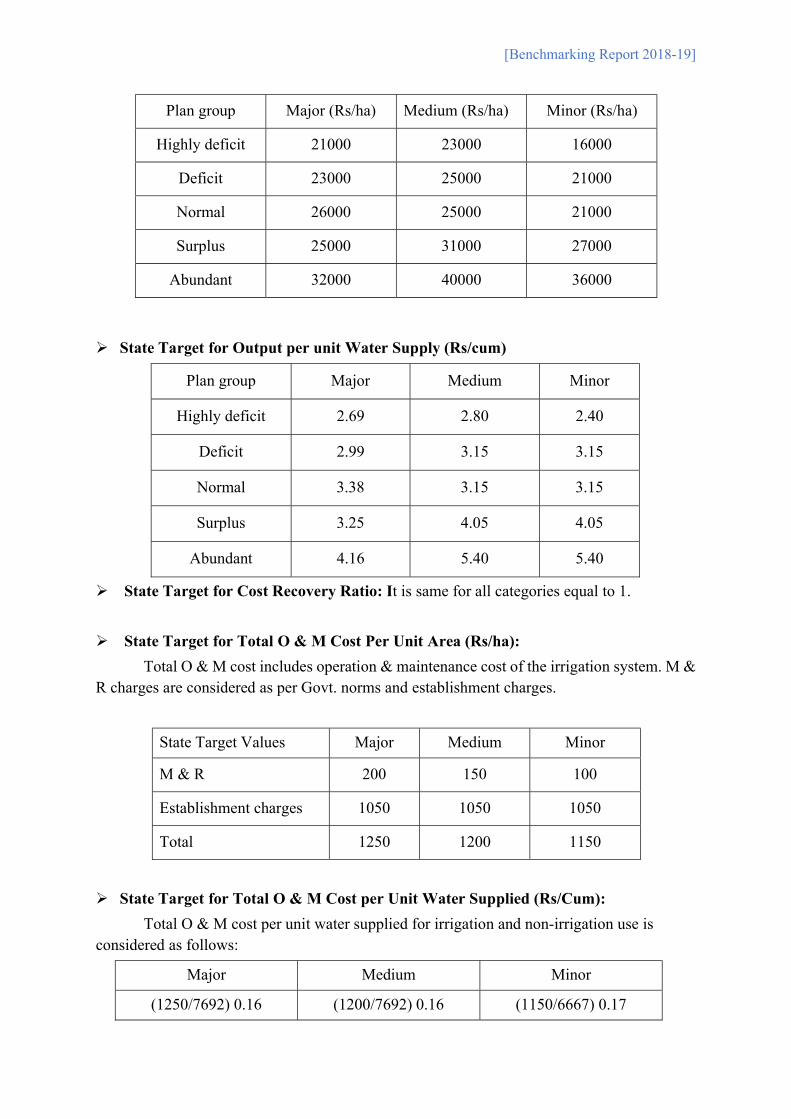
State Target for Output per unit Area:
The state target of this indicator is based on five years’ experience in 2004-05. The plan group wise targets set for different categories of projects are given in tabular format below.
15
[Benchmarking Report 2018-19]
Plan group Major (Rs/ha) Medium (Rs/ha) Minor (Rs/ha)
Highly deficit 21000 23000 16000
Deficit 23000 25000 21000
Normal 26000 25000 21000
Surplus 25000 31000 27000
Abundant 32000 40000 36000
State Target for Output per unit Water Supply (Rs/cum)
Plan group Major Medium Minor
Highly deficit 2.69 2.80 2.40
Deficit 2.99 3.15 3.15
Normal 3.38 3.15 3.15
Surplus 3.25 4.05 4.05
Abundant 4.16 5.40 5.40
State Target for Cost Recovery Ratio: It is same for all categories equal to 1.
State Target for Total O & M Cost Per Unit Area (Rs/ha):
Total O & M cost includes operation & maintenance cost of the irrigation system. M & R charges are considered as per Govt. norms and establishment charges.
State Target Values Major Medium Minor
M & R 200 150 100
Establishment charges 1050 1050 1050
Total 1250 1200 1150
State Target for Total O & M Cost per Unit Water Supplied (Rs/Cum):
Total O & M cost per unit water supplied for irrigation and non-irrigation use is considered as follows:
Major Medium Minor
(1250/7692) 0.16 (1200/7692) 0.16 (1150/6667) 0.17
16

[Benchmarking Report 2018-19]
State Target for Revenue per Unit of Water Supplied (Rs/Cum)
The targets are fixed 10 percent more than O & M cost per unit of water supplied.
Major Medium Minor
0.18 0.18 0.19
The State targets for Revenue per unit of water supplied for irrigation is kept as Rs. 0.18/m3, however, for NI use the target is Rs. 0.9/ m3 as charges of NI use are higher than irrigation use.
State Target for Assessment Recovery Ratio (Irrigation) It is same for all categories equal to 1.
State Target for Assessment Recovery Ratio (Non-Irrigation) It is same for all categories equal to 1.
State Target for Water Delivery Capacity Index- It is same for all categories equal to 1.
State Target for Participatory Irrigation Management Index - It is same for all categories equal to 1.
17
[Benchmarking Report 2018-19]
Chapter 3-Performance of Benchmarking in Maharashtra State
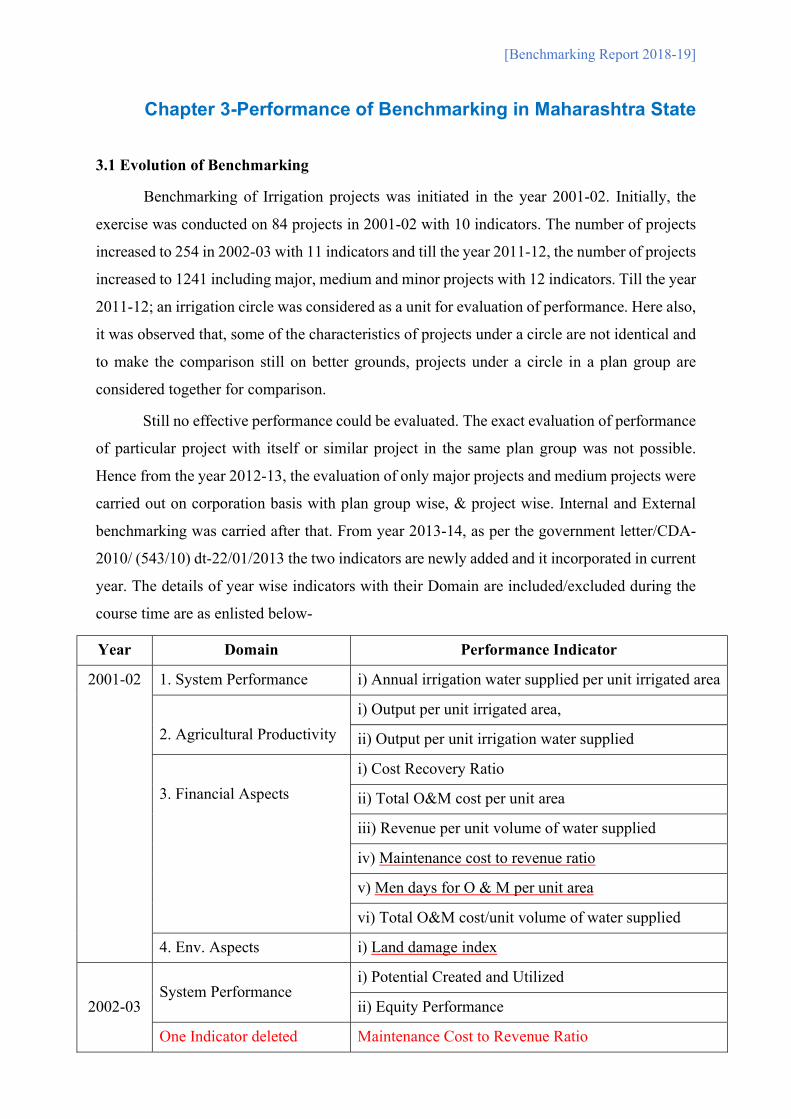
3.1 Evolution of Benchmarking
Benchmarking of Irrigation projects was initiated in the year 2001-02. Initially, the
exercise was conducted on 84 projects in 2001-02 with 10 indicators. The number of projects
increased to 254 in 2002-03 with 11 indicators and till the year 2011-12, the number of projects
increased to 1241 including major, medium and minor projects with 12 indicators. Till the year
2011-12; an irrigation circle was considered as a unit for evaluation of performance. Here also,
it was observed that, some of the characteristics of projects under a circle are not identical and
to make the comparison still on better grounds, projects under a circle in a plan group are
considered together for comparison.
Still no effective performance could be evaluated. The exact evaluation of performance
of particular project with itself or similar project in the same plan group was not possible.
Hence from the year 2012-13, the evaluation of only major projects and medium projects were
carried out on corporation basis with plan group wise, & project wise. Internal and External
benchmarking was carried after that. From year 2013-14, as per the government letter/CDA-
2010/ (543/10) dt-22/01/2013 the two indicators are newly added and it incorporated in current
year. The details of year wise indicators with their Domain are included/excluded during the
course time are as enlisted below-
Year Domain Performance Indicator
2001-02 1. System Performance i) Annual irrigation water supplied per unit irrigated area
2. Agricultural Productivity
i) Output per unit irrigated area,
ii) Output per unit irrigation water supplied
3. Financial Aspects
i) Cost Recovery Ratio
ii) Total O&M cost per unit area
iii) Revenue per unit volume of water supplied
iv) Maintenance cost to revenue ratio
v) Men days for O & M per unit area
vi) Total O&M cost/unit volume of water supplied
4. Env. Aspects i) Land damage index
2002-03 System Performance
i) Potential Created and Utilized
ii) Equity Performance
One Indicator deleted Maintenance Cost to Revenue Ratio
18

[Benchmarking Report 2018-19]
Year Domain Performance Indicator
2003-04 Financial Aspects Assessment Recovery Ratio
a. Irrigation; b. Non-irrigation
2006-07 One Indicator deleted Men days per unit area
2008-09 System Performance I (a) Annual area irrigated per unit water Supplied.
2011-12 One Indicator deleted Land damage index
2013-14 System Performance i.) Water delivery Capacity Index
Social Aspects ii.) Participatory Irrigation Management PIM Index.
3.2 Current year Performance
This is the 18th consecutive Benchmarking Report introduce with new two indicators
categorized under two domains – System Performance and Social Aspects. As per government
approval, from year 2013-14 the parameters of indicators - “Water Delivery Capacity Index
(LBC/RBC)” and “Participatory Irrigation Management Index” are incorporated into the BM
Template to collect the data of projects. Because of the requirement of previous consecutive
five years data, the internal or external comparison of the projects are done from this year. The
selected indicators for benchmarking are as given below-
Sr.no Titles of Indicators
1 Indicator I - Annual Irrigation Water Supply Per Unit Irrigated Area
2 Indicator Ia - Annual Area Irrigated per unit of water Supplied
3 Indicator II - Potential Created and Utilized
4 Indicator III - Output (Agricultural Production) Per Unit Irrigated Area
5 Indicator IV - Output (Agricultural Production) Per Unit Irrigation Water Supply
6 Indicator V - Cost Recovery Ratio
7 Indicator VI - Total O&M Cost Per Unit Area
8 Indicator VII - Total O&M Cost Per Unit Volume of Water Supplied
9 Indicator VIII - Revenue Per Unit Volume of Water Supplied
10 Indicator XI - Equity Performance
11 Indicator XII(I) - Assessment Recovery Ratio Irrigation
12 Indicator XII(NI) - Assessment Recovery Ratio Non-Irrigation
13 Indicator XIII(a) - Water Delivery Capacity Index (LBC)
14 Indicator XIII(b) - Water Delivery Capacity Index (RBC)
15 Indicator XIV - participatory Irrigation Management Index
19

[Benchmarking Report 2018-19]
In accordance with CWC, the new approach was introduced in analyzation of the
projects from report year 2012-13 and same methodology is retained till now. The evaluation
and analyzation of all projects are done on basis of corporation wise, Plan group wise and
Project wise with selected six indicators. The plan group wise number of projects benchmarked
for this year are as follows-
Sr.no Plan group/
Type of Projects
Highly
Deficit
Deficit
Normal
Surplus
Abundant
Total
1 Major 1 14 25 3 10 53
2 Medium 29 68 49 26 15 187
Total 29 82 74 29 25 240
The number of projects benchmarked with number of indicators and year of publication
are given as below -
Year
No. of Projects Benchmarked No. of Indicators
Year of publication Major Medium
2001-02 30 26 10 March - 2003
2002-03 49 142 11 March - 2004
2003-04 49 143 12 March - 2005
2004-05 49 144 12 February - 2006
2005-06 49 144 12 March - 2007
2006-07 49 144 11 March - 2008
2007-08 48 145 11 March - 2009
2008-09 48 145 11 March - 2010
2009-10 50 166 11 April - 2011
2010-11 50 171 12 September - 2012
2011-12 48 160 12 December- 2015
2012-13 51 175 12 September - 2018
2013-14 51 175 12 November - 2018
2014-15 51 175 12 December - 2018
2015-16 50 175 12 December - 2018
2016-17 53 175 12 April - 2019
20

[Benchmarking Report 2018-19]
Year No. of Projects Benchmarked No. of
Indicators Year of
publication Major Medium
2017-18 53 175 12 May – 2019
2018-19 53 187 14 February – 2021
21

[Benchmarking Report 2018-19]
Chapter 4 - Visual Depiction of Major Projects
These chapter includes the graphical represent of major projects. The Major Projects are grouped with respect to their five various irrigation corporations. They are as follow -
I. Godavari Marathwada Irrigation Development Corporation, Aurangabad
II. Konkan Irrigation Development Corporation, Thane
III. Maharashtra Krishna Valley Irrigation Development Corporation, Pune
IV. Tapi Irrigation Development Corporation, Jalgaon
V. Vidarbha Irrigation Development Corporation, Nagpur
The visualization of major projects data has been done corporation wise, plan group wise, project wise, domain wise and it also included consecutive five-year data for internal and external comparison and analysis of performance of projects. The above whole analysis has been done for selected indicators of state as per instructions given by CWC, Delhi. The selected Indicators with their domains are as given below –
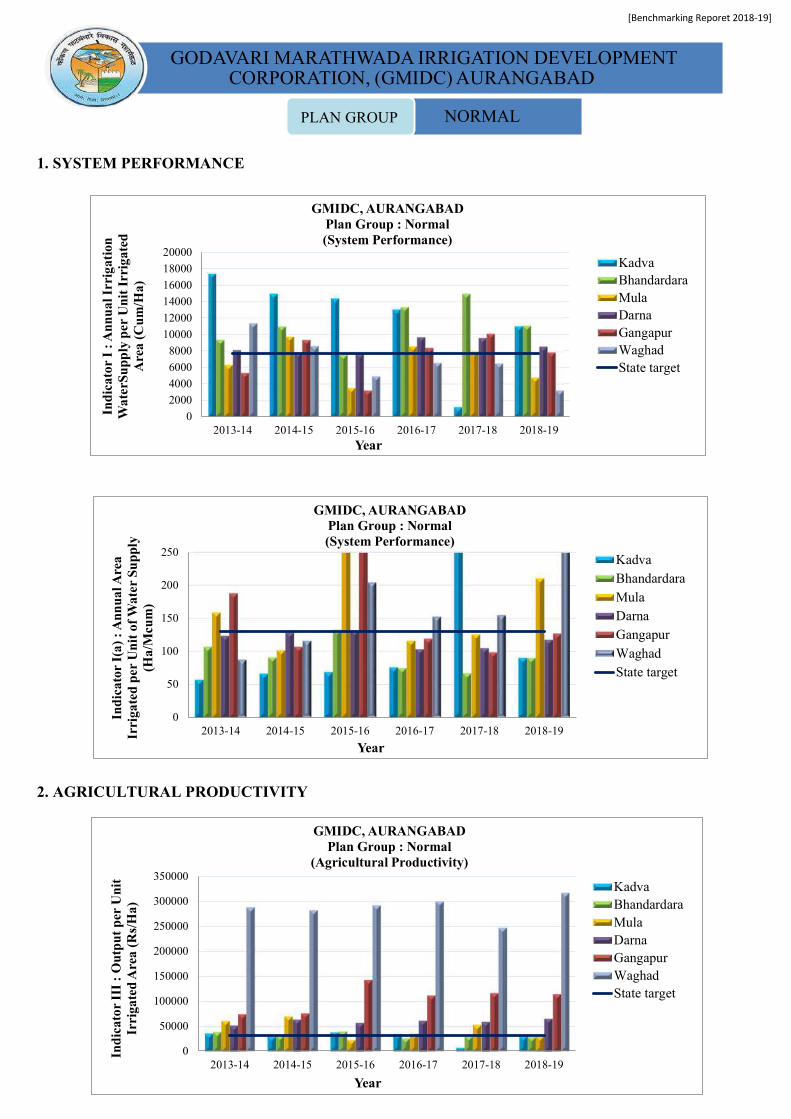
A. System Performance
i. Indicator I – Annual Irrigation Water Supply per Unit Irrigated Area (Cum/Ha)
ii. Indicator IA – Annual Irrigated Area per Unit of Water Supply (Ha/Mcum)
B. Agricultural Productivity
iii. Indicator III - Output per Unit Irrigated Area (Rs/Ha)
iv. Indicator IV - Output per Unit Irrigation Water Supply (RS/Cum)
C. Financial Aspect
v. Indicator XII(I) – Assessment Recovery Ratio (Irrigation)
vi. Indicator XII(NI) – Assessment Recovery Ratio (Non-Irrigation)
The corporation wise visual depictions are further incorporated based on the above selected indicators. The related data in tabular format and after visualization the Findings/observations are also incorporate in this chapter.
22

[Benchmarking Report 2018-19]
1. SYSTEM PERFORMANCE
2. AGRICULTURAL PRODUCTIVITY
0
50000
100000
150000
200000
250000
300000
2013-14 2014-15 2015-16 2016-17 2017-18 2018-19
Indi
cato
r II
I :
Out
put
per
Un
it
Irri
gate
d A
rea
(Rs/
Ha)
Year
GMIDC, AURANGABADPlan Group : Deficit
(Agricultural Productivity) Jayakwadi (PLBC)
Jayakwadi PRBC
Majalgaon
Manjra
Lower Terna
State target
0
2000
4000
6000
8000
10000
12000
14000
16000
18000
20000
2013-14 2014-15 2015-16 2016-17 2017-18 2018-19
Indi
cato
r I
: An
nual
Irr
igat
ion
Wat
erSu
pply
per
Un
it I
rrig
ated
A
rea
(Cu
m/H
a)
Year
GMIDC, AURANGABADPlan Group : Deficit
(System Performance)
Jayakwadi (PLBC)Jayakwadi PRBCMajalgaonManjraLower TernaState target
0
50
100
150
200
250
2013-14 2014-15 2015-16 2016-17 2017-18 2018-19
Ind
icat
or I
(a)
: An
nual
Are
a Ir
riga
ted
per
Uni
t of
Wat
er S
uppl
y
(Ha/
Mcu
m)
Year
GMIDC, AURANGABADPlan Group : Deficit
(System Performance)
Jayakwadi (PLBC)
Jayakwadi PRBC
Majalgaon
Manjra
Lower Terna
State target
GODAVARI MARATHWADA IRRIGATION DEVELOPMENT CORPORATION, (GMIDC) AURANGABAD
DEFICITPLAN GROUP
23

[Benchmarking Report 2018-19]
3. FINANCIAL ASPECT
0.0
5.0
10.0
15.0
20.0
25.0
30.0
35.0
40.0
2013-14 2014-15 2015-16 2016-17 2017-18 2018-19
Ind
icat
or I
V :
Ou
tpu
t p
er U
nit
Irri
gati
on W
ater
Su
pply
(R
s/C
um
)
Year
GMIDC, AURANGABADPlan Group : Deficit
(Agricultural Productivity)
Jayakwadi (PLBC)Jayakwadi PRBCMajalgaonManjraLower TernaState target
0.0
0.3
0.6
0.9
1.2
2013-14 2014-15 2015-16 2016-17 2017-18 2018-19Ind
icat
or X
II(I
) : A
sses
men
t R
ecov
ery
Rat
io I
rrig
atio
n (R
atio
)
Year
GMIDC, AURANGABADPlan Group : Deficit(Financial Aspect)
Jayakwadi (PLBC)Jayakwadi PRBCMajalgaonManjraLower TernaState target
0.0
0.3
0.6
0.9
1.2
2013-14 2014-15 2015-16 2016-17 2017-18 2018-19
Indi
cato
r X
II(N
I) :
Ass
esm
ent
Rec
over
y R
atio
Non
Irr
igat
ion
(Rat
io)
Year
GMIDC, AURANGABADPlan Group : Deficit(Financial Aspect)
Jayakwadi (PLBC)
Jayakwadi PRBC
Majalgaon
Manjra
Lower Terna
State target
24

[Benchmarking Report 2018-19]
Godavari Marathwada Irrigation Development Coorporation, Aurangabad(CADA Nashik, CADA A'bad, CADA Beed, NIC Nanded, AIC A'bad, BIPC Beed)
Yr 2018-19 Data including last five yr (2013-14 to 2018-19)
Ind I Ind I(a) Ind III Ind IV Ind XII-I Ind XII-NIMajor Deficit CADA Abad 2013-14 Jayakwadi (PLBC) 2841 352.00 30396 37.90 0.00 0.13Major Deficit CADA Abad 2014-15 Jayakwadi (PLBC) 0 0.00 0 0.00 0.00 0.00Major Deficit CADA Abad 2015-16 Jayakwadi (PLBC) 0 0.00 0 0.00 0.00 0.00Major Deficit CADA Abad 2016-17 Jayakwadi (PLBC) 30717 32.56 119058 7.50 0.28 0.90Major Deficit CADA Abad 2017-18 Jayakwadi (PLBC) 32613 30.66 0 0.00 0.00 0.57Major Deficit CADA Abad 2018-19 Jayakwadi (PLBC) 13838 72.26478 74123.81 9.28 0.04 0.25Major Deficit CADA Beed 2013-14 Jayakwadi PRBC 1335 0.00 6622 1.02 0.41 0.06Major Deficit CADA Beed 2014-15 Jayakwadi PRBC 3685 271.37 27528 3.29 0.42 0.00Major Deficit CADA Beed 2015-16 Jayakwadi PRBC 0 0.00 0 0.00 0.00 0.70Major Deficit CADA Beed 2016-17 Jayakwadi PRBC 6091 164.18 41225 1.80 0.36 0.24Major Deficit CADA Beed 2017-18 Jayakwadi PRBC 21730 46.02 11778 1.66 12.98 0.00Major Deficit CADA Beed 2018-19 Jayakwadi PRBC 8501 117.6332 37621.97 2.12 0.22 0.13Major Deficit CADA Beed 2013-14 Majalgaon 2312 432.56 244101 17.69 0.00 0.00Major Deficit CADA Beed 2014-15 Majalgaon 2342 426.98 270977 17.88 0.00 0.00Major Deficit CADA Beed 2015-16 Majalgaon 0 0.00 2 0.00 0.00 0.01Major Deficit CADA Beed 2016-17 Majalgaon 29542 33.85 96249..42 3.95 0.00 0.25Major Deficit CADA Beed 2017-18 Majalgaon 22545 44.36 53 0.01 0.00 0.04Major Deficit CADA Beed 2018-19 Majalgaon 6842 146.1561 0 5.8 0 0.65Major Deficit CADA Beed 2013-14 Manjra 0 0.00 0 0.00 0.00 0.00Major Deficit CADA Beed 2014-15 Manjra 0 0.00 0 0.00 0.00 0.00Major Deficit CADA Beed 2015-16 Manjra 0 0.00 0 0.00 0.00 0.01Major Deficit CADA Beed 2016-17 Manjra 11907 83.98 35502 5.35 0.17 0.00Major Deficit CADA Beed 2017-18 Manjra 10613 94.22 43129 4.08 0.04 0.02Major Deficit CADA Beed 2018-19 Manjra 4463 224.0645 61199 13.71 0.16 0.16Major Deficit CADA Beed 2013-14 Lower Terna 16429 60.87 29265 1.78 0.00 0.00Major Deficit CADA Beed 2014-15 Lower Terna 0 0.00 0 0.00 0.00 0.53Major Deficit CADA Beed 2015-16 Lower Terna 0 0.00 0 0.00 0.00 0.90Major Deficit CADA Beed 2016-17 Lower Terna 5998 166.72 19239 5.30 0.00 0.30Major Deficit CADA Beed 2017-18 Lower Terna 4675 213.90 14633 3.47 0.00 1.00Major Deficit CADA Beed 2018-19 Lower Terna 7292 137.1366 17508.77 2.34 0 0.63
Agricultural Financial AspectType Plangroup Circle
Irrigation Year
ProjectSystem
25

Visual Depiction [Benchmarking Report 2018-19]
Observations (GMIDC, A’bad: plan group – Deficit)
A. System performance
Indicator 1- Annual Irrigation Water Supply Per Unit Irrigated Area (Cum/Ha)
Jayakwadi (PLBC), (PRBC), Majalgaon and manjra projects has minimum water supply per unit irrigated area as compared with last year.
Indicator 1a- Annual Area Irrigated Per Unit of Water Supply (Ha/Mcum)
Lower Terna project has decrement in area irrigated per unit of water supply as compared with last year.
B. Agricultural productivity
Indicator III- Output Per Unit Irrigated Area (Rs/Ha)
In current year, Jayakwadi (PLBC), Manjra project shows maximum output per unit irrigated area as compared with other projects.
Indicator IV- Output Per Unit Irrigation Water Supply (Rs/Cum)
1. Manjra project has maximum output per unit water supply. 2. Jayakwadi (PRBC), project does not have increment in agricultural output since last three
years.
C. Financial Aspect
Indicator XII(I)- Assessment Recovery Ratio (Irrigation)
In year 2018-19, the revenue collection performance was very low for all projects, it does not satisfy the state target.
Indicator XII(NI)- Assessment Recovery Ratio (Non-Irrigation)
In year 2018-19 Lower Terna project has minimum assessment recovery ratio as compare with previous year.
26

[Benchmarking Report 2018-19]
1. SYSTEM PERFORMANCE
2. AGRICULTURAL PRODUCTIVITY
0
20000
40000
60000
80000
100000
120000
140000
160000
2013-14 2014-15 2015-16 2016-17 2017-18 2018-19
Indi
cato
r II
I :
Out
pu
t pe
r U
nit
Ir
riga
ted
Are
a (R
s/H
a)
Year
GMIDC, AURANGABADPlan Group : Deficit
(Agricultural Productivity)
Chanakapur
Vishnupuri
Manar
Purna
State target
0
2000
4000
6000
8000
10000
12000
14000
16000
18000
20000
2013-14 2014-15 2015-16 2016-17 2017-18 2018-19
Ind
icat
or I
: A
nnu
al I
rrig
atio
n
Wat
erS
upp
ly p
er U
nit
Irr
igat
ed
Are
a (C
um
/Ha)
Year
GMIDC, AURANGABADPlan Group : Deficit
(System Performance)
ChanakapurVishnupuriManarPurnaState target
0
50
100
150
200
250
2013-14 2014-15 2015-16 2016-17 2017-18 2018-19
Ind
icat
or I
(a)
: Ann
ual
Are
a Ir
riga
ted
per
Uni
t of
Wat
er S
upp
ly
(Ha/
Mcu
m)
Year
GMIDC, AURANGABADPlan Group : Deficit
(System Performance)
ChanakapurVishnupuriManarPurnaState target
GODAVARI MARATHWADA IRRIGATION DEVELOPMENT CORPORATION, (GMIDC) AURANGABAD
DEFICITPLAN GROUP
27

[Benchmarking Report 2018-19]
3. FINANCIAL ASPECT
0.0
5.0
10.0
15.0
20.0
25.0
2013-14 2014-15 2015-16 2016-17 2017-18 2018-19
Ind
icat
or I
V :
Out
pu
t pe
r U
nit
Ir
riga
tion
Wat
er S
up
ply
(Rs/
Cu
m)
Year
GMIDC, AURANGABADPlan Group : Deficit
(Agricultural Productivity)
ChanakapurVishnupuriManarPurnaState target
0.0
0.3
0.6
0.9
1.2
2013-14 2014-15 2015-16 2016-17 2017-18 2018-19
Ind
icat
or X
II(I
) : A
sses
men
t R
ecov
ery
Rat
io I
rrig
atio
n (R
atio
)
Year
GMIDC, AURANGABADPlan Group : Deficit(Financial Aspect)
Chanakapur
Vishnupuri
Manar
Purna
State target
0.0
0.3
0.6
0.9
1.2
2013-14 2014-15 2015-16 2016-17 2017-18 2018-19
Ind
icat
or X
II(N
I) :
Ass
esm
ent
Rec
over
y R
atio
Non
Irr
igat
ion
(R
atio
)
Year
GMIDC, AURANGABADPlan Group : Deficit(Financial Aspect)
ChanakapurVishnupuriManarPurnaState target
28

[Benchmarking Report 2018-19]
Godavari Marathwada Irrigation Development Coorporation, Aurangabad(CADA Nashik, CADA A'bad, CADA Beed, NIC Nanded, AIC A'bad, BIPC Beed)
Year 2018-19 Data including consecutive year (2013-14 to 2018-19)
Ind I Ind I(a) Ind III Ind IV Ind XII-I Ind XII-NIMajor Deficit CADA Nashik 2013-14 Chanakapur 3159 316.52 27374 28.98 2.30 0.68Major Deficit CADA Nashik 2014-15 Chanakapur 3540 282.49 28597 19.35 1.60 0.92Major Deficit CADA Nashik 2015-16 Chanakapur 0 0.00 14472 0.00 0.15 0.75Major Deficit CADA Nashik 2016-17 Chanakapur 773 1293.66 18967 184.81 0.00 1.01Major Deficit CADA Nashik 2017-18 Chanakapur 2925 341.88 18744 37.37 1.52 1.50Major Deficit CADA Nashik 2018-19 Chanakapur 0 0 14549.93 0 0.41 0.9Major Deficit NIC Nanded 2013-14 Vishnupuri 8580.442 116.54 27646 4.05 0.01 0.90Major Deficit NIC Nanded 2014-15 Vishnupuri 5441.54 183.77 14759 2.23 0.05 0.71Major Deficit NIC Nanded 2015-16 Vishnupuri 5035.64 198.58 28532 5.67 0.03 0.73Major Deficit NIC Nanded 2016-17 Vishnupuri 6433.25 155.44 30178 8.02 0.37 0.89Major Deficit NIC Nanded 2017-18 Vishnupuri 7785.14 128.45 33399 6.87 0.72 1.25Major Deficit NIC Nanded 2018-19 Vishnupuri 4060 246.305 26208.28 7.79 0.11 0.52Major Deficit NIC Nanded 2013-14 Manar 5553 200.47 22821 4.11 0.25 0.72Major Deficit NIC Nanded 2014-15 Manar 5553 180.08 631 0.11 1.40 0.50Major Deficit NIC Nanded 2015-16 Manar 5553 180.09 22821 4.11 0.25 0.72Major Deficit NIC Nanded 2016-17 Manar 7042 142.01 22751 4.04 0.49 0.71Major Deficit NIC Nanded 2017-18 Manar 5996 166.78 31475 5.27 0.76 0.35Major Deficit NIC Nanded 2018-19 Manar 7513 133.103 32394 4.31 0.25 0.23Major Deficit NIC Nanded 2013-14 Purna 1943 514.68 18818 7.66 0.31 0.38Major Deficit NIC Nanded 2014-15 Purna 11893 84.08 34044 4.36 0.36 0.14Major Deficit NIC Nanded 2015-16 Purna 18109 55.22 80843 11.41 0.04 0.09Major Deficit NIC Nanded 2016-17 Purna 9820 101.83 105256 18.58 0.06 0.09Major Deficit NIC Nanded 2017-18 Purna 5377 185.98 143946 43.26 0.03 0.00Major Deficit NIC Nanded 2018-19 Purna 7064 141.563 114526.5 50.13 0.27 0.17
Agricultural Productivity
Financial AspectType Plangroup Circle
Irrigation Year
ProjectSystem
Performance
29

Visual Depiction [Benchmarking Report 2018-19]
Observations (GMIDC, A’bad: plan group – Deficit)
A. System performance
Indicator 1- Annual Irrigation Water Supply Per Unit Irrigated Area (Cum/Ha)
Vishnupuri project shows minimum water supply per unit irrigated area as compared with last year.
Indicator 1a- Annual Area Irrigated Per Unit of Water Supply (Ha/Mcum)
Manar and Purna project has decrement in area irrigated per unit of water supply as compared with last year.
B. Agricultural productivity
Indicator III- Output Per Unit Irrigated Area (Rs/Ha)
In current year, Purna project shows maximum output as compared with other projects but does decrease than previous year 2017-18.
Indicator IV- Output Per Unit Irrigation Water Supply (Rs/Cum)
1. Purna project has maximum output per unit water supply. 2. vishnupuri and manar project does not have increment in agricultural output since last three
years.
C. Financial Aspect
Indicator XII(I)- Assessment Recovery Ratio (Irrigation)
1. In year 2018-19, the revenue collection performance was very low for all projects. 2. Purna projects show increase in the revenue collection as compared with previous one but
Manar and vishnupuri projects have decrement in the recovery ratio as compared with last years.
Indicator XII(NI)- Assessment Recovery Ratio (Non-Irrigation)
In year 2018-19 the assessment recovery ratio for all project does not satisfy this state targets.
30
[Benchmarking Reporet 2018-19]
1. SYSTEM PERFORMANCE
2. AGRICULTURAL PRODUCTIVITY
0
50000
100000
150000
200000
250000
300000
350000
2013-14 2014-15 2015-16 2016-17 2017-18 2018-19
Ind
icat
or I
II :
Out
put
per
Uni
t Ir
riga
ted
Are
a (R
s/H
a)
Year
GMIDC, AURANGABADPlan Group : Normal
(Agricultural Productivity)
KadvaBhandardaraMulaDarnaGangapurWaghadState target
0
2000
4000
6000
8000
10000
12000
14000
16000
18000
20000
2013-14 2014-15 2015-16 2016-17 2017-18 2018-19
Ind
icat
or I
: A
nnu
al I
rrig
atio
n
Wat
erSu
pply
per
Uni
t Ir
riga
ted
A
rea
(Cum
/Ha)
Year
GMIDC, AURANGABADPlan Group : Normal(System Performance)
KadvaBhandardaraMulaDarnaGangapurWaghadState target
0
50
100
150
200
250
2013-14 2014-15 2015-16 2016-17 2017-18 2018-19
Ind
icat
or I
(a)
: Ann
ual A
rea
Irri
gate
d p
er U
nit
of
Wat
er S
upp
ly
(Ha/
Mcu
m)
Year
GMIDC, AURANGABADPlan Group : Normal(System Performance)
KadvaBhandardaraMulaDarnaGangapurWaghadState target
GODAVARI MARATHWADA IRRIGATION DEVELOPMENT CORPORATION, (GMIDC) AURANGABAD
NORMALPLAN GROUP
31

[Benchmarking Reporet 2018-19]
3. FINANCIAL ASPECT
0.0
10.0
20.0
30.0
40.0
50.0
60.0
70.0
80.0
2013-14 2014-15 2015-16 2016-17 2017-18 2018-19
Ind
icat
or I
V :
Out
put
per
Un
it
Irri
gati
on W
ater
Sup
ply
(Rs/
Cum
)
Year
GMIDC, AURANGABADPlan Group : Normal
(Agricultural Productivity)
KadvaBhandardaraMulaDarnaGangapurWaghadState target
0.0
0.3
0.6
0.9
1.2
2013-14 2014-15 2015-16 2016-17 2017-18 2018-19
Ind
icat
or X
II(I
) : A
sses
men
t R
ecov
ery
Rat
io I
rrig
atio
n (R
atio
)
Year
GMIDC, AURANGABADPlan Group : Normal
(Financial Aspect)
KadvaBhandardaraMulaDarnaGangapurWaghadState target
0.0
0.3
0.6
0.9
1.2
2013-14 2014-15 2015-16 2016-17 2017-18 2018-19
Ind
icat
or X
II(N
I) :
Ass
esm
ent
Rec
over
y R
atio
Non
Irr
igat
ion
(R
atio
)
Year
GMIDC, AURANGABADPlan Group : Normal
(Financial Aspect)
KadvaBhandardaraMulaDarnaGangapurWaghadState target
32

[Benchmarking Report 2018-19]
Godavari Marathwada Irrigation Development Coorporation, Aurangabad(CADA Nashik, CADA A'bad, CADA Beed, NIC Nanded, AIC A'bad, BIPC Beed)
Year 2018-19 Data including consecutive year (2013-14 to 2018-19)
Ind I Ind I(a) Ind III Ind IV Ind XII-I Ind XII-NIMajor Normal CADA Nashik 2013-14 Kadva 17435 57.36 35497 4.61 1.07 0.00Major Normal CADA Nashik 2014-15 Kadva 14961 66.84 29796 6.45 0.58 0.96Major Normal CADA Nashik 2015-16 Kadva 14422 69.34 37790 6.64 0.59 0.06Major Normal CADA Nashik 2016-17 Kadva 13046 76.65 33906 7.24 0.60 0.03Major Normal CADA Nashik 2017-18 Kadva 1152 868.06 7040 7.02 0.56 1.91Major Normal CADA Nashik 2018-19 Kadva 11001 90.9008 30342.47 6.46 0.66 0.02Major Normal CADA Nashik 2013-14 Bhandardara 9353 106.92 38627 6.75 1.02 0.67Major Normal CADA Nashik 2014-15 Bhandardara 10982 91.06 31010 4.81 1.01 1.40Major Normal CADA Nashik 2015-16 Bhandardara 7536 132.69 39400 10.30 0.44 0.55Major Normal CADA Nashik 2016-17 Bhandardara 13346 74.93 26154 4.02 0.45 0.48Major Normal CADA Nashik 2017-18 Bhandardara 14958 66.85 30072 4.80 0.58 0.64Major Normal CADA Nashik 2018-19 Bhandardara 11080 90.2527 28477.18 6.87 1.00 1.00Major Normal CADA Nashik 2013-14 Mula 6278 159.28 60738 8.60 0.69 0.72Major Normal CADA Nashik 2014-15 Mula 9741 102.66 69733 14.15 0.84 1.90Major Normal CADA Nashik 2015-16 Mula 3489 286.60 22948 12.66 0.23 0.60Major Normal CADA Nashik 2016-17 Mula 8550 116.96 35218 7.28 0.45 0.49Major Normal CADA Nashik 2017-18 Mula 7919 126.28 52725 12.64 0.33 0.53Major Normal CADA Nashik 2018-19 Mula 4741 210.926 30226.85 11.35 0.27 0.79Major Normal CADA Nashik 2013-14 Darna 8101 123.44 51474 12.17 0.94 0.62Major Normal CADA Nashik 2014-15 Darna 7768 128.73 63489 17.04 0.26 0.67Major Normal CADA Nashik 2015-16 Darna 7626 131.13 56755 30.50 0.28 0.12Major Normal CADA Nashik 2016-17 Darna 9674 103.37 61129 18.58 0.98 0.45Major Normal CADA Nashik 2017-18 Darna 9557 104.64 59123 19.20 0.46 0.68Major Normal CADA Nashik 2018-19 Darna 8503 117.606 65328.83 24.78 0.57 0.83Major Normal CADA Nashik 2013-14 Gangapur 5313 188.23 74557 44.39 2.10 0.74Major Normal CADA Nashik 2014-15 Gangapur 9323 107.27 76370 43.31 1.69 0.64Major Normal CADA Nashik 2015-16 Gangapur 3173 315.16 143373 134.09 0.44 0.29Major Normal CADA Nashik 2016-17 Gangapur 8355 119.69 111727 34.51 0.91 0.24Major Normal CADA Nashik 2017-18 Gangapur 10092 99.09 116345 30.83 0.80 0.64Major Normal CADA Nashik 2018-19 Gangapur 7834 127.649 114557.51 33.58 0.24 0.65Major Normal CADA Nashik 2013-14 Waghad 11347 88.121 287961.57 81.74 1.00 1.00Major Normal CADA Nashik 2014-15 Waghad 8574 116.635 282352.63 70.85 0.47 0.72Major Normal CADA Nashik 2015-16 Waghad 4890 204.517 292139.82 161.93 0.69 0.92Major Normal CADA Nashik 2016-17 Waghad 6537 152.975 300007.47 83.49 1.26 0.67Major Normal CADA Nashik 2017-18 Waghad 6446 155.135 247239.04 72.09 0.48 0.96Major Normal CADA Nashik 2018-19 Waghad 3158 316.656 317066.54 98.82 1.00 1.00
Agricultural Productivity
Financial AspectType Plangroup Circle
Irrigation Year
ProjectSystem
Performance
33

Visual Depiction [Benchmarking Report 2018-19]
Observations (GMIDC, A’bad: plan group – Normal)
A. System performance
Indicator 1- Annual Irrigation Water Supply Per Unit Irrigated Area (Cum/Ha)
1. In current year, Kadva, Bhandardara and Darna projects have maximum water supply per unit irrigated area.
2. Mula and waghad project has minimum water supply as compared with last year.
Indicator 1a- Annual Area Irrigated Per Unit of Water Supply (Ha/Mcum)
1. Mula and waghad project have maximum area irrigated then previous year.
B. Agricultural productivity
Indicator III- Output Per Unit Irrigated Area (Rs/Ha)
1. Darna, Gangapur and waghad projects has maximum agricultural output per unit irrigated area.
2. Mula project has maximum water supply but still shows minimum output per unit irrigated area.
Indicator IV- Output Per Unit Irrigation Water Supply (Rs/Cum)
1. Kadva, Bhandardara and Mula project have minimum agriculture output as compared with Darna, Gangapur and waghad project.
2. In current year waghad project has maximum output per unit irrigation water supply.
C. Financial Aspect
Indicator XII(I)- Assessment Recovery Ratio (Irrigation)
1. In current year, Bhandardara and Waghad projects shows maximum recovery ratio. 2. In year 2018 -19, Darna and Kadva projects does has increment in revenue collection than
last year whereas, Gangapur and Mula project has a minimum revenue collection than last years.
Indicator XII(NI)- Assessment Recovery Ratio (Non-Irrigation)
1. The Kadva project has only 0.02 assessment recovery ratio. 2. The Bhandardara project and waghad project satisfy the recovery ratio, it is nearly equal to
States target.
34

[Benchmarking Report 2018-19]
1. SYSTEM PERFORMANCE
2. AGRICULTURAL PRODUCTIVITY
0
50000
100000
150000
200000
250000
300000
350000
2013-14 2014-15 2015-16 2016-17 2017-18 2018-19
Ind
icat
or I
II :
Out
put
per
Uni
t Ir
riga
ted
Are
a (R
s/H
a)
Year
GMIDC, AURANGABADPlan Group : Normal
(Agricultural Productivity)
UGC OzerkhedPalkhedUGC(Punegaon)UGC(Tisgaon)Upper PengangaNMC Express MukaneState target
0
2000
4000
6000
8000
10000
12000
14000
16000
18000
20000
2013-14 2014-15 2015-16 2016-17 2017-18 2018-19
Indi
cato
r I
: Ann
ual I
rrig
atio
n W
ater
Sup
ply
per
Uni
t Ir
riga
ted
Are
a (C
um/H
a)
Year
GMIDC, AURANGABADPlan Group : Normal(System Performance)
UGC Ozerkhed
Palkhed
UGC(Punegaon)
UGC(Tisgaon)
Upper Penganga
NMC Express Mukane
State target
0
50
100
150
200
250
2013-14 2014-15 2015-16 2016-17 2017-18 2018-19
Ind
icat
or I
(a)
: Ann
ual A
rea
Irri
gate
d p
er U
nit
of
Wat
er
Supp
ly (
Ha/
Mcu
m)
Year
GMIDC, AURANGABADPlan Group : Normal(System Performance)
UGC OzerkhedPalkhedUGC(Punegaon)UGC(Tisgaon)Upper PengangaNMC Express MukaneState target
GODAVARI MARATHWADA IRRIGATION DEVELOPMENT CORPORATION, (GMIDC) AURANGABAD
NORMALPLAN GROUP
35

[Benchmarking Report 2018-19]
3. FINANCIAL ASPECT
0.0
5.0
10.0
15.0
20.0
25.0
30.0
35.0
40.0
2013-14 2014-15 2015-16 2016-17 2017-18 2018-19
Indi
cato
r IV
: O
utp
ut p
er U
nit
Ir
riga
tion
Wat
er S
uppl
y (R
s/C
um)
Year
GMIDC, AURANGABADPlan Group : Normal
(Agricultural Productivity)
UGC OzerkhedPalkhedUGC(Punegaon)UGC(Tisgaon)Upper PengangaNMC Express MukaneState target
0.0
0.3
0.6
0.9
1.2
2013-14 2014-15 2015-16 2016-17 2017-18 2018-19
Indi
cato
r X
II(I
) : A
sses
men
t R
ecov
ery
Rat
io I
rrig
atio
n (R
atio
)
Year
GMIDC, AURANGABADPlan Group : Normal
(Financial Aspect)
UGC OzerkhedPalkhedUGC(Punegaon)UGC(Tisgaon)Upper PengangaNMC Express MukaneState target
0.0
0.3
0.6
0.9
1.2
2013-14 2014-15 2015-16 2016-17 2017-18 2018-19Indi
cato
r X
II(N
I) :
Ass
esm
ent
Rec
over
y R
atio
Non
Irr
igat
ion
(Rat
io)
Year
GMIDC, AURANGABADPlan Group : Normal
(Financial Aspect)
UGC OzerkhedPalkhedUGC(Punegaon)UGC(Tisgaon)Upper PengangaNMC Express MukaneState target
36

[Benchmarking Report 2018-19]
Godavari Marathwada Irrigation Development Coorporation, Aurangabad(CADA Nashik, CADA A'bad, CADA Beed, NIC Nanded, AIC A'bad, BIPC Beed)
Year 2018-19 Data including consecutive year (2013-14 to 2018-19)
Ind I Ind I(a) Ind III Ind IV Ind XII-I Ind XII-NI
Major Normal CADA Nashik 2013-14 UGC Ozerkhed 8461 118.19 258999 102.12 0.41 0.98
Major Normal CADA Nashik 2014-15 UGC Ozerkhed 6885 145.24 267977 114.52 0.60 0.88
Major Normal CADA Nashik 2015-16 UGC Ozerkhed 4913 203.54 246102 437.25 0.80 0.98
Major Normal CADA Nashik 2016-17 UGC Ozerkhed 9215 108.52 240489 69.44 1.01 0.95
Major Normal CADA Nashik 2017-18 UGC Ozerkhed 7998 125.03 201869 66.82 0.86 0.86
Major Normal CADA Nashik 2018-19 UGC Ozerkhed 2735 365.631 214624.81 78.48 0.72 1
Major Normal CADA Nashik 2013-14 Palkhed 9088 110.04 185446 52.71 1.00 0.85
Major Normal CADA Nashik 2014-15 Palkhed 10214 97.91 187209 67.08 0.49 0.66
Major Normal CADA Nashik 2015-16 Palkhed 7153 139.80 221894 264.50 0.32 0.58
Major Normal CADA Nashik 2016-17 Palkhed 9384 106.56 208382 88.19 0.17 0.66
Major Normal CADA Nashik 2017-18 Palkhed 7113 104.59 151546 74.41 0.75 0.56
Major Normal CADA Nashik 2018-19 Palkhed 2490 401.606 116474.74 46.377 0.93 0.78
Major Normal CADA Nashik 2013-14 UGC(Punegaon) 4998 200.08 241105 61.41 1.00 0.00
Major Normal CADA Nashik 2014-15 UGC(Punegaon) 3978 251.38 189627 61.32 0.00 0.00
Major Normal CADA Nashik 2015-16 UGC(Punegaon) 2429 411.69 137157 82.61 0.71 0.00
Major Normal CADA Nashik 2016-17 UGC(Punegaon) 7315 136.71 191429 35.03 0.90 0.92
Major Normal CADA Nashik 2017-18 UGC(Punegaon) 6233 160.44 196720 41.57 1.00 1.36
Major Normal CADA Nashik 2018-19 UGC(Punegaon) 4303 232.396 236303.59 54.91 0.68 0.92
Major Normal CADA Nashik 2013-14 UGC(Tisgaon) 5239 190.89 244009 46.58 0.36 0.00
Major Normal CADA Nashik 2014-15 UGC(Tisgaon) 5043 198.29 219827 43.59 0.32 1.00
Major Normal CADA Nashik 2015-16 UGC(Tisgaon) 4099 243.95 145329 40.31 0.52 1.00
Major Normal CADA Nashik 2016-17 UGC(Tisgaon) 8100 123.46 150337 22.78 0.76 0.66
Major Normal CADA Nashik 2017-18 UGC(Tisgaon) 6684 149.61 171924 31.98 0.76 0.66
Major Normal CADA Nashik 2018-19 UGC(Tisgaon) 3805 262.812 220417.09 57.93 0.79 1
Major Normal NIC Nanded 2013-14 Upper Penganga 14972 66.79 25161 3.75 0.09 0.08
Major Normal NIC Nanded 2014-15 Upper Penganga 15400 64.94 25099 3.25 0.19 0.10
Major Normal NIC Nanded 2015-16 Upper Penganga 4632 215.90 17309 6.33 0.37 0.08
Major Normal NIC Nanded 2016-17 Upper Penganga 11257 88.83 157751 4.30 0.17 0.00
Major Normal NIC Nanded 2017-18 Upper Penganga 4263 234.59 11814 10.71 0.00 0.05
Major Normal NIC Nanded 2018-19 Upper Penganga 15077.16 66.3255 17633.02 3.27 0 0.04
Major Normal AIC Abad 2012-13 NMC Express Mukane 12019.56 83.1977 20670.395 2.712845 0.883362 0
Major Normal AIC Abad 2013-14 NMC Express Mukane 5720 174.82 320841.65 56.09 1 1
Major Normal AIC Abad 2014-15 NMC Express Mukane 0 0 0 0 0 0
Major Normal AIC Abad 2015-16 NMC Express Mukane 7324 136.53 283731.35 38.74 0.94 1
Major Normal AIC Abad 2016-17 NMC Express Mukane 5725 174.672 34919.64 8.1 0.99 0.85
Major Normal AIC Abad 2017-18 NMC Express Mukane 5762 173.551 47375.14 12.09 0.92 0.77
Major Normal AIC Abad 2018-19 NMC Express Mukane 2931.47 341.126 40302.64 13.75 1 0.96
Agricultural Productivity
Financial AspectType Plangroup Circle
Irrigation Year
ProjectSystem
Performance
37

Visual Depiction [Benchmarking Report 2018-19]
Observations (GMIDC, A’bad: plan group – Normal)
A. System performance
Indicator 1- Annual Irrigation Water Supply Per Unit Irrigated Area (Cum/Ha)
The Upper Penganga project has maximum water supply per unit irrigated area than previous year.
Indicator 1a- Annual Area Irrigated Per Unit of Water Supply (Ha/Mcum)
The Upper Penganga project has minimum area irrigated per unit of water supply then previous year.
B. Agricultural productivity
Indicator III- Output Per Unit Irrigated Area (Rs/Ha)
Upper Penganga and NMC Express Mukane projects have minimum output per unit irrigated area then previous year.
Indicator IV- Output Per Unit Irrigation Water Supply (Rs/Cum)
The output per unit irrigation water supply of Upper Penganga project was minimum as compared with last year. For other remaining projects the agricultural output were maximum, they are above the state target
C. Financial Aspect
Indicator XII(I)- Assessment Recovery Ratio (Irrigation)
In current year 2018-19, NMC Express Mukane and Palkhed has satisfactory recovery ratio. It reaches nearly to the state target.
The recovery ratio of UGC(Ozerkhed) and UGC (Punegaon) were minimum than previous year 2017-18.
The Upper Penganga project shows 0.05 recovery ratio, it has very low performance.
Indicator XII(NI)- Assessment Recovery Ratio (Non-Irrigation)
The Upper Penganga project has very low revenue collection since last five years.
UGC (Tisgaon) and UGC (ozerkhed) has maximum recovery ratio. They satisfy the state target.
Palkhed project has increment in revenue collection as compared with previous year.
38

[Benchmarking Report 2018-19]
2. AGRICULTURAL PRODUCTIVITY
1. SYSTEM PERFORMANCE
0
5000
10000
15000
20000
25000
30000
35000
40000
2013-14 2014-15 2015-16 2016-17 2017-18 2018-19
Ind
icat
or I
II :
Ou
tput
per
Un
it
Irri
gate
d A
rea
(Rs/
Ha)
Year
KIDC, THANEPlan Group : Abundant
(Agricultural Productivity)
BhatsaSuryaState target
0
2000
4000
6000
8000
10000
2013-14 2014-15 2015-16 2016-17 2017-18 2018-19
Ind
icat
or I
: A
nn
ual I
rrig
atio
n
Wat
erS
upp
ly p
er U
nit
Irr
igat
ed
Are
a (C
um/H
a)
Year
KIDC, THANEPlan Group : Abundant(System Performance)
BhatsaSuryaState target
0
30
60
90
120
150
2013-14 2014-15 2015-16 2016-17 2017-18 2018-19
Ind
icat
or I
(a)
: Ann
ual
Are
a Ir
riga
ted
per
Uni
t of
Wat
er
Sup
ply
(H
a/M
cum
)
Year
KIDC, THANEPlan Group : Abundant(System Performance)
BhatsaSuryaState target
KOKAN IRRIGATION DEVELOPMENT CORPORATION, (KIDC) THANE
ABUNDANTPLAN GROUP
39

[Benchmarking Report 2018-19]
3. FINANCIAL ASPECT
0.0
0.5
1.0
1.5
2.0
2.5
3.0
3.5
4.0
4.5
2013-14 2014-15 2015-16 2016-17 2017-18 2018-19
Ind
icat
or I
V :
Out
put
per
Un
it
Irri
gati
on W
ater
Su
pp
ly (
Rs/
Cu
m)
Year
KIDC, THANEPlan Group : Abundant
(Agricultural Productivity)
Bhatsa
Surya
State target
0.0
0.3
0.6
0.9
1.2
2013-14 2014-15 2015-16 2016-17 2017-18 2018-19
Indi
cato
r X
II(I
) : A
sses
men
t R
ecov
ery
Rat
io I
rrig
atio
n (R
atio
)
Year
KIDC, THANEPlan Group : Abundant
(Financial Aspect)
Bhatsa
Surya
State target
0.0
0.3
0.6
0.9
1.2
2013-14 2014-15 2015-16 2016-17 2017-18 2018-19Ind
icat
or X
II(N
I) :
Ass
esm
ent
Rec
over
y R
atio
Non
Irr
igat
ion
(Rat
io)
Year
KIDC, THANEPlan Group : Abundant
(Financial Aspect)
Bhatsa
Surya
State target
40

[Benchmarking Report 2018-19]
Kokan Irrigation Development Coorporation, Thane(TIC, Thane; KIC Ratnagiri; NKIPC KALWA Thane; SKIPC OROS )
Year 2018-19 Data including consecutive year (2013-14 to 2018-19)
Ind I Ind I(a) Ind III Ind IV Ind XII-I Ind XII-NIMajor Abundant TIC Thane 2013-14 Bhatsa 111702 8.95 226859.05 2.03 0.86 0.99Major Abundant TIC Thane 2014-15 Bhatsa 41760 23.9466 34633.78 0.83 0.95 1.00Major Abundant TIC Thane 2015-16 Bhatsa 21426 46.67 56901.5 2.66 0.94 0.37Major Abundant TIC Thane 2016-17 Bhatsa 7578.919 131.945 23781.3002 3.14 1.00 1.00Major Abundant TIC Thane 2017-18 Bhatsa 6422 155.715 15981 2.49 1.00 1.00Major Abundant TIC Thane 2018-19 Bhatsa 7689 130.056 92.05 0.01 1.00 1.00Major Abundant TIC Thane 2013-14 Surya 54412 18.37 55955.06 1.03 1.35 1.00Major Abundant TIC Thane 2014-15 Surya 50747 19.7056 47453.09 0.94 0.50 1.00Major Abundant TIC Thane 2015-16 Surya 20016 49.96 18493.67 0.92 0.26 1.00Major Abundant TIC Thane 2016-17 Surya 14733.38 67.8731 526.809362 0.04 0.26 1.00Major Abundant TIC Thane 2017-18 Surya 13686 73.0674 15113 1.10 0.15 1.00Major Abundant TIC Thane 2018-19 Surya 11452 87.321 873.3 0.08 0.01 1.00
Agricultural Financial AspectType Plangroup Circle
Irrigation Year
ProjectSystem
41

Visual Depiction [Benchmarking Report 2018-19]
Observations (KIDC, Thane: plan group – Abundant)
A. System performance
Indicator 1- Annual Irrigation Water Supply Per Unit Irrigated Area (Cum/Ha)
1. The Surya project has exceptionally high value i.e. water supply per unit irrigated area is maximum.
2. From year 2016-17 to 2018-19, the project has minimum water supply. Its values are slightly below the state target specially in year 2017-18.
Indicator 1a- Annual Area Irrigated Per Unit of Water Supply (Ha/Mcum)
1. The Surya project shows the exceptionally minimum value, it is below the state target. 2. The Bhatsa project has minimum area irrigated per unit of water supply as compared with
last year.
B. Agricultural productivity
Indicator III- Output Per Unit Irrigated Area (Rs/Ha)
1. The Surya project has exceptionally low value in year 2016-17 and 2018-19. 2. From year 2016-17, Bhatsa projects has exceptionally low output.
Indicator IV- Output Per Unit Irrigation Water Supply (Rs/Cum)
1. Surya and bhatsa project have minimum output per unit irrigation water supply.
C. Financial Aspect
Indicator XII(I)- Assessment Recovery Ratio (Irrigation)
1. Bhatsa project has 100% achievement in revenue collection form year 2016-17, while Surya project has minimum recovery ratio its value is below state target.
Indicator XII(NI)- Assessment Recovery Ratio (Non-Irrigation)
1. From year 2016-17 and onwards the Bhatsa and Surya projects shows the satisfactory recovery ratio.
42

[Benchmarking Report 2018-19]
2. AGRICULTURAL PRODUCTIVITY
1. SYSTEM PERFORMANCE
0
50000
100000
150000
200000
250000
2013-14 2014-15 2015-16 2016-17 2017-18 2018-19
Ind
icat
or I
II :
Ou
tput
per
Uni
t Ir
riga
ted
Are
a (R
s/H
a)
Year
MKVDC, PUNEPlan Group : Highly Deficit(Agricultural Productivity)
BhimaState target
0
2000
4000
6000
8000
10000
2013-14 2014-15 2015-16 2016-17 2017-18 2018-19
Ind
icat
or I
: A
nnu
al I
rrig
atio
n
Wat
erSu
pply
per
Uni
t Ir
riga
ted
A
rea
(Cum
/Ha)
Year
MKVDC, PUNEPlan Group : Highly Deficit
(System Performance)
Bhima
State target
0
50
100
150
200
250
2013-14 2014-15 2015-16 2016-17 2017-18 2018-19
Ind
icat
or I
(a)
: Ann
ual A
rea
Irri
gate
d p
er U
nit
of W
ater
Su
pply
(H
a/M
cum
)
Year
MKVDC, PUNEPlan Group : Highly Deficit
(System Performance)
Bhima
State target
MAHARASHTRA KRISHNA VALLEY DEVELOPMENT CORPORATION, (MKVDC) PUNE
HIGHLY DEFICITPLAN GROUP
43

[Benchmarking Report 2018-19]
3. FINANCIAL ASPECT
0.0
5.0
10.0
15.0
20.0
25.0
30.0
35.0
2013-14 2014-15 2015-16 2016-17 2017-18 2018-19Ind
icat
or I
V :
Out
put
per
Uni
t Ir
riga
tion
Wat
er S
upp
ly (
Rs/
Cu
m)
Year
MKVDC, PUNEPlan Group : Highly Deficit(Agricultural Productivity)
Bhima
State target
0.0
0.3
0.6
0.9
1.2
2013-14 2014-15 2015-16 2016-17 2017-18 2018-19
Indi
cato
r X
II(I
) : A
sses
men
t R
ecov
ery
Rat
io I
rrig
atio
n (R
atio
)
Year
MKVDC, PUNEPlan Group : Highly Deficit
(Financial Aspect)
Bhima
State target
0.0
0.3
0.6
0.9
1.2
2013-14 2014-15 2015-16 2016-17 2017-18 2018-19
Indi
cato
r X
II(N
I) :
Ass
esm
ent
Rec
over
y R
atio
Non
Irr
igat
ion
(Rat
io)
Year
MKVDC, PUNEPlan Group : Highly Deficit
(Financial Aspect)
Bhima
State target
44

[Benchmarking Report 2018-19]
Maharashtra Krishna Valley Development Coorporation, Pune(PIC-Pune, SIC-Satara, SIC- Sangali, KIC-kolhapur, Kukadi IC-Pune, SIPC-Satara,CADA-Solapur),
Year 2018-19 Data including consecutive year (2013-14 to 2018-19)
Ind I Ind I(a) Ind III Ind IV Ind XII-I Ind XII-NI
Major Highly Deficit CADA Solapur 2013-14 Bhima 6942 144.05 54463 6.70 0.39 0.88
Major Highly Deficit CADA Solapur 2014-15 Bhima 6333 157.89 54588 7.26 0.45 0.73
Major Highly Deficit CADA Solapur 2015-16 Bhima 7398 135.16 57332 8.91 0.18 0.35
Major Highly Deficit CADA Solapur 2016-17 Bhima 6744 148.28 38468 5.80 0.55 0.44
Major Highly Deficit CADA Solapur 2017-18 Bhima 6361 157.20 146828 20.15 0.34 0.16
Major Highly Deficit CADA Solapur 2018-19 Bhima 4740 210.97 228545 29.92 0.22 0.36
Agricultural Productivity
Financial AspectType Plangroup Circle
Irrigation Year
ProjectSystem
Performance
45

Visual Depiction [Benchmarking Report 2018-19]
Observations (MKVDC, Pune: plan group – Highly Deficit)
A. System performance
Indicator 1- Annual Irrigation Water Supply Per Unit Irrigated Area (Cum/Ha)
Bhima project has minimum water supply per unit irrigated area for year 2018-19 than previous year.
Indicator 1a- Annual Area Irrigated Per Unit of Water Supply (Ha/Mcum)
The maximum area is irrigated per unit of water supply in current year as compared with previous year and its value is above the state target.
B. Agricultural productivity
Indicator III- Output Per Unit Irrigated Area (Rs/Ha)
The agricultural output per unit irrigated area is increased from previous year.
Indicator IV- Output Per Unit Irrigation Water Supply (Rs/Cum)
Bhima project has maximum agricultural productivity in Year 2018-19.
C. Financial Aspect
Indicator XII(I)- Assessment Recovery Ratio (Irrigation)
The overall observations of last five years shows an irregular performance of the project.
Indicator XII(NI)- Assessment Recovery Ratio (Non-Irrigation)
Bhima project has an increment in the ratio as compare with previous year.
46

[Benchmarking Report 2018-19]
2. AGRICULTURAL PRODUCTIVITY
1. SYSTEM PERFORMANCE
0
20000
40000
60000
80000
100000
120000
140000
160000
180000
200000
2013-14 2014-15 2015-16 2016-17 2017-18 2018-19
Ind
icat
or I
II :
Ou
tpu
t p
er U
nit
Irri
gate
d A
rea
(Rs/
Ha)
Year
MKVDC, PUNEPlan Group : Normal
(Agricultural Productivity)
NLBCNRBCKhadakwaslaPawanaChaskmanState target
0
2000
4000
6000
8000
10000
12000
14000
16000
18000
20000
2013-14 2014-15 2015-16 2016-17 2017-18 2018-19
Ind
icat
or I
: A
nnu
al I
rrig
atio
n
Wat
erSu
pply
per
Uni
t Ir
riga
ted
A
rea
(Cu
m/H
a)
Year
MKVDC, PUNEPlan Group : Normal(System Performance)
NLBC
NRBCKhadakwasla
Pawana
ChaskmanState target
0
50
100
150
200
250
2013-14 2014-15 2015-16 2016-17 2017-18 2018-19
Indi
cato
r I(
a) :
Ann
ual
Are
a Ir
riga
ted
per
Un
it o
f W
ater
S
upp
ly (
Ha/
Mcu
m)
Year
MKVDC, PUNEPlan Group : Normal(System Performance)
NLBCNRBCKhadakwaslaPawanaChaskmanState target
MAHARASHTRA KRISHNA VALLEY DEVELOPMENT CORPORATION, (MKVDC) PUNE
NORMALPLAN GROUP
47

[Benchmarking Report 2018-19]
3. FINANCIAL ASPECT
0.0
5.0
10.0
15.0
20.0
25.0
30.0
2013-14 2014-15 2015-16 2016-17 2017-18 2018-19
Ind
icat
or I
V :
Ou
tput
per
Un
it
Irri
gati
on W
ater
Su
pp
ly (
Rs/
Cu
m)
Year
MKVDC, PUNEPlan Group : Normal
(Agricultural Productivity)
NLBCNRBCKhadakwaslaPawanaChaskmanState target
0.0
0.3
0.6
0.9
1.2
2013-14 2014-15 2015-16 2016-17 2017-18 2018-19
Ind
icat
or X
II(I
) : A
sses
men
t R
ecov
ery
Rat
io I
rrig
atio
n (R
atio
)
Year
MKVDC, PUNEPlan Group : Normal
(Financial Aspect)
NLBCNRBCKhadakwaslaPawanaChaskmanState target
0.0
0.3
0.6
0.9
1.2
2013-14 2014-15 2015-16 2016-17 2017-18 2018-19
Ind
icat
or X
II(N
I) :
Ass
esm
ent
Rec
over
y R
atio
Non
Irr
igat
ion
(Rat
io)
Year
MKVDC, PUNEPlan Group : Normal
(Financial Aspect)
NLBCNRBCKhadakwaslaPawanaChaskmanState target
48

[Benchmarking Report 20108-19]
Maharashtra Krishna Valley Development Coorporation, Pune(PIC-Pune, SIC-Satara, SIC- Sangali, KIC-kolhapur, Kukadi IC-Pune, SIPC-Satara,CADA-Solapur),
Year 2018-19 Data including consecutive year (2013-14 to 2018-19)
Ind I Ind I(a) Ind III Ind IV Ind XII-I Ind XII-NIMajor Normal PIC Pune 2013-14 NLBC 10210 97.84 98068 15.94 0.32 0.88Major Normal PIC Pune 2014-15 NLBC 9356 106.89 76207 14.88 0.41 0.95Major Normal PIC Pune 2015-16 NLBC 8879 112.62 80829 14.18 0.49 0.84Major Normal PIC Pune 2016-17 NLBC 10681 93.62 92043 18.54 0.54 0.46Major Normal PIC Pune 2017-18 NLBC 12839 77.89 59161 16.70 0.43 0.40Major Normal PIC Pune 2018-19 NLBC 9667 103.445 77091.02 21.96 0.68 0.78Major Normal PIC Pune 2013-14 NRBC 7747 129.08 33120 10.31 0.39 0.71Major Normal PIC Pune 2014-15 NRBC 7496 133.40 34331 11.00 0.75 0.93Major Normal PIC Pune 2015-16 NRBC 7250 137.93 41742 10.34 1.24 0.93Major Normal PIC Pune 2016-17 NRBC 9420 106.59 58886 15.13 0.94 0.69Major Normal PIC Pune 2017-18 NRBC 6271 159.47 57955 17.75 0.87 0.51Major Normal PIC Pune 2018-19 NRBC 7151 139.841 109192.26 29.72 1.00 0.91Major Normal PIC Pune 2013-14 Khadakwasla 30060 33.27 114367 14.05 0.65 0.87Major Normal PIC Pune 2014-15 Khadakwasla 25147 39.76 42765 6.54 0.74 0.82Major Normal PIC Pune 2015-16 Khadakwasla 20048 32.04 44179 12.28 0.44 0.79Major Normal PIC Pune 2016-17 Khadakwasla 7774 128.64 459976 66.79 0.52 0.74Major Normal PIC Pune 2017-18 Khadakwasla 24979 40.04 64323 10.19 0.76 0.88Major Normal PIC Pune 2018-19 Khadakwasla 13749 72.7326 59765.61 8.48 0.67 1.00Major Normal PIC Pune 2013-14 Pawana 5491 24.61 113529 24.68 0.45 0.70Major Normal PIC Pune 2014-15 Pawana 6217 20.92 106674 15.97 0.92 0.84Major Normal PIC Pune 2015-16 Pawana 6545 209.24 83868 13.30 0.86 0.94Major Normal PIC Pune 2016-17 Pawana 4981 200.77 60834 12.21 0.96 0.90Major Normal PIC Pune 2017-18 Pawana 7525 132.88 55443 7.37 0.93 0.96Major Normal PIC Pune 2018-19 Pawana 7359 135.888 56754 7.71 1.00 0.99Major Normal PIC Pune 2013-14 Chaskman 15737 63.5445 27307.57 2.68 0.84 1.00Major Normal PIC Pune 2014-15 Chaskman 12698 78.7526 29928.65 3.41 0.93 0.76Major Normal PIC Pune 2015-16 Chaskman 10243 97.6276 32838.98 4.92 0.73 0.24Major Normal PIC Pune 2016-17 Chaskman 16107 62.0848 33852.67 3.64 1.00 1.00Major Normal PIC Pune 2017-18 Chaskman 17758 56.3126 45742.56 8.39 0.84 1.09Major Normal PIC Pune 2018-19 Chaskman 9632 103.821 44404.33 8.59 0.53 1.00
Agricultural Productivity
Financial AspectType Plangroup Circle
Irrigation Year
ProjectSystem
Performance
49

Visual Depiction [Benchmarking Report 2018-19]
Observations (MKVDC, Pune: plan group – Normal)
A. System performance
Indicator 1- Annual Irrigation Water Supply Per Unit Irrigated Area (Cum/Ha)
1. Khadakwasla, NLBC and Chaskaman projects have maximum water supply per unit irrigated area in current year 2018-19.
Indicator 1a- Annual Area Irrigated Per Unit of Water Supply (Ha/Mcum)
1. In current year, Khadakwasla, NLBC and Chaskaman projects have minimum area irrigated per unit of water supply. It means maximum water is supplied but minimum area got irrigated.
2. NRBC project shows that, they satisfy the state target but area irrigated per unit of water supply was minimum has compared with last year 2017-18.
B. Agricultural productivity
Indicator III- Output Per Unit Irrigated Area (Rs/Ha)
1. In current year, NRBC project shows maximum agricultural output per unit irrigated area amongst all other project.
2. Khadakwasla project show slightly less output as compared with last year 2017-18.
Indicator IV- Output Per Unit Irrigation Water Supply (Rs/Cum)
1. Chaskaman projects was improving its agricultural productivity since last two years. 2. NRBC project shows highest output per unit water supply in year 2018-19. 3. Pawna project has minimum agricultural productivity since last two years. 4. NLBC project shows improvement in productivity output.
C. Financial Aspect
Indicator XII(I)- Assessment Recovery Ratio (Irrigation)
1. Chaskaman and Khadakwasla project has minimum irrigation revenue collection as compared to previous years
2. NLBC has an improvement in recovery ratio.
Indicator XII(NI)- Assessment Recovery Ratio (Non-Irrigation)
1. Chaskaman, Pawana and Khadakwasla project has satisfy the state target. They show appreciable NI revenue collections.
2. NRBC and NLBC project shows the increment in revenue collection as compared to previous year but not reach up to the state target.
50

[Benchmarking Report 2018-19]
2. AGRICULTURAL PRODUCTIVITY
1. SYSTEM PERFORMANCE
0
5000
10000
15000
20000
25000
30000
35000
40000
45000
2013-14 2014-15 2015-16 2016-17 2017-18 2018-19
Indi
cato
r II
I :
Out
pu
t p
er U
nit
Ir
riga
ted
Are
a (R
s/H
a)
Year
MKVDC, PUNEPlan Group : Normal
(Agricultural Productivity)
KukadiGhodState target
0
2000
4000
6000
8000
10000
2013-14 2014-15 2015-16 2016-17 2017-18 2018-19
Indi
cato
r I
: Ann
ual
Irr
igat
ion
W
ater
Sup
ply
per
Un
it I
rrig
ated
A
rea
(Cu
m/H
a)
Year
MKVDC, PUNEPlan Group : Normal(System Performance)
KukadiGhodState target
0
50
100
150
200
250
2013-14 2014-15 2015-16 2016-17 2017-18 2018-19
Indi
cato
r I(
a) :
An
nua
l Are
a Ir
riga
ted
per
Un
it o
f W
ater
Su
pply
(H
a/M
cum
)
Year
MKVDC, PUNEPlan Group : Normal(System Performance)
Kukadi
Ghod
State target
MAHARASHTRA KRISHNA VALLEY DEVELOPMENT CORPORATION, (MKVDC) PUNE
NORMALPLAN GROUP
51

[Benchmarking Report 2018-19]
3. FINANCIAL ASPECT
0.0
1.0
2.0
3.0
4.0
5.0
6.0
7.0
8.0
9.0
10.0
2013-14 2014-15 2015-16 2016-17 2017-18 2018-19
Indi
cato
r IV
: O
utpu
t p
er U
nit
Ir
riga
tion
Wat
er S
uppl
y (R
s/C
um)
Year
MKVDC, PUNEPlan Group : Normal
(Agricultural Productivity)
KukadiGhodState target
0.0
0.3
0.6
0.9
1.2
2013-14 2014-15 2015-16 2016-17 2017-18 2018-19
Indi
cato
r X
II(I
) : A
sses
men
t R
ecov
ery
Rat
io I
rrig
atio
n (R
atio
)
Year
MKVDC, PUNEPlan Group : Normal
(Financial Aspect)
KukadiGhodState target
0.0
0.3
0.6
0.9
1.2
2013-14 2014-15 2015-16 2016-17 2017-18 2018-19
Ind
icat
or X
II(N
I) :
Ass
esm
ent
Rec
over
y R
atio
Non
Irr
igat
ion
(Rat
io)
Year
MKVDC, PUNEPlan Group : Normal
(Financial Aspect)
KukadiGhodState target
52

[Benchmarking Report 2018-19]
Maharashtra Krishna Valley Development Coorporation, Pune(PIC-Pune, SIC-Satara, SIC- Sangali, KIC-kolhapur, Kukadi IC-Pune, SIPC-Satara,CADA-Solapur),
Year 2018-19 Data including consecutive year (2013-14 to 2018-19)
Ind I Ind I(a) Ind III Ind IV Ind XII-I Ind XII-NI
Major Normal CADA Pune 2013-14 Kukadi 7592 131.72 39976 8.67 1.00 0.26
Major Normal CADA Pune 2014-15 Kukadi 6349 157.51 33624 8.73 0.95 1.00
Major Normal CADA Pune 2015-16 Kukadi 4421 226.19 19492 7.05 0.77 0.33
Major Normal CADA Pune 2016-17 Kukadi 8293 120.59 22775 4.65 1.00 0.34
Major Normal CADA Pune 2017-18 Kukadi 9600 104.16 33789 6.11 0.88 0.95
Major Normal CADA Pune 2018-19 Kukadi 6469 154.583 23110.62 5.56 0.76 1.00
Major Normal CADA Pune 2012-13 Ghod 7478 133.73 31169 6.75 1.00 0.64
Major Normal CADA Pune 2013-14 Ghod 7009 142.67 30763 6.54 0.69 0.94
Major Normal CADA Pune 2015-16 Ghod 5367 186.32 29265 8.54 0.62 0.84
Major Normal CADA Pune 2016-17 Ghod 7572 132.05 30496 6.96 1.00 1.00
Major Normal CADA Pune 2017-18 Ghod 7933 126.05 30794 5.33 0.77 1.00
Major Normal CADA Pune 2018-19 Ghod 8475 117.994 28144.94 4.99 0.55 0.84
Agricultural Productivity
Financial AspectType Plangroup Circle
Irrigation Year
ProjectSystem
Performance
53

Visual Depiction [Benchmarking Report 2018-19]
Observations (MKVDC, Pune: plan group – Normal)
A. System performance
Indicator 1- Annual Irrigation Water Supply Per Unit Irrigated Area (Cum/Ha)
1. The Kukadi project has minimum water supply per unit irrigated area in current year 2018-19 as compared with last year.
2. The Ghod project has slightly maximum water supply per unit irrigated area than previous year.
Indicator 1a- Annual Area Irrigated Per Unit of Water Supply (Ha/Mcum)
1. The Kukadi project has maximum area irrigated per unit water supply in year 2018-19.
2. The Ghod project has slightly less area irrigated as compared with last year.
B. Agricultural productivity
Indicator III- Output Per Unit Irrigated Area (Rs/Ha)
1. Kukadi and Ghod projects have minimum agricultural output per unit irrigated area as compared with last year 2017-18.
2. Ghod project has less output from previous consecutive year.
Indicator IV- Output Per Unit Irrigation Water Supply (Rs/Cum)
1. Kukadi projects are observed to be an ideally satisfying the state target.
C. Financial Aspect
Indicator XII(I)- Assessment Recovery Ratio (Irrigation)
1. In year 2016-17, Kukadi and Ghod projects have a good revenue collection. But, in year 2017 18 and 18 19 the recovery ratio goes on decreasing.
Indicator XII(NI)- Assessment Recovery Ratio (Non-Irrigation)
1. In current year, Kukadi project shows slightly high ratio as compared to previous year. 2. Ghod project has minimum revenue collection as compared to previous year.
54

[Benchmarking Report 2018-19]
2. AGRICULTURAL PRODUCTIVITY
1. SYSTEM PERFORMANCE
0
10000
20000
30000
40000
50000
60000
70000
80000
90000
2013-14 2014-15 2015-16 2016-17 2017-18 2018-19
Ind
icat
or I
II :
Ou
tpu
t p
er U
nit
Ir
riga
ted
Are
a (R
s/H
a)
Year
MKVDC, PUNEPlan Group : Abundant
(Agricultural Productivity)
Krishna
Radhanagari
Tulashi
Warna
Dudhganga
State target
0
2000
4000
6000
8000
10000
12000
14000
16000
18000
20000
2013-14 2014-15 2015-16 2016-17 2017-18 2018-19
Ind
icat
or I
: A
nn
ual
Irr
igat
ion
Wat
erS
upp
ly p
er U
nit
Irri
gate
d A
rea
(Cu
m/H
a)
Year
MKVDC, PUNEPlan Group : Abundant(System Performance)
Krishna
Radhanagari
Tulashi
Warna
Dudhganga
State target
0
50
100
150
200
250
2013-14 2014-15 2015-16 2016-17 2017-18 2018-19
Ind
icat
or I
(a)
: Ann
ual A
rea
Irri
gate
d p
er U
nit
of W
ater
S
upp
ly (
Ha/
Mcu
m)
Year
MKVDC, PUNEPlan Group : Abundant(System Performance)
Krishna
Radhanagari
Tulashi
Warna
Dudhganga
State target
MAHARASHTRA KRISHNA VALLEY DEVELOPMENT CORPORATION, (MKVDC) PUNE
ABUNDANTPLAN GROUP
55

[Benchmarking Report 2018-19]
3. FINANCIAL ASPECT
0.0
2.0
4.0
6.0
8.0
10.0
12.0
14.0
2013-14 2014-15 2015-16 2016-17 2017-18 2018-19
Ind
icat
or I
V :
Ou
tput
per
Un
it
Irri
gati
on W
ater
Sup
ply
(R
s/C
um)
Year
MKVDC, PUNEPlan Group : Abundant
(Agricultural Productivity)
Krishna
Radhanagari
Tulashi
Warna
Dudhganga
State target
0.0
0.3
0.6
0.9
1.2
2013-14 2014-15 2015-16 2016-17 2017-18 2018-19
Ind
icat
or X
II(I
) : A
sses
men
t R
ecov
ery
Rat
io I
rrig
atio
n (R
atio
)
Year
MKVDC, PUNEPlan Group : Abundant
(Financial Aspect)
Krishna
Radhanagari
Tulashi
Warna
Dudhganga
State target
0.0
0.3
0.6
0.9
1.2
2013-14 2014-15 2015-16 2016-17 2017-18 2018-19
Ind
icat
or X
II(N
I) :
Ass
esm
ent
Rec
over
y R
atio
Non
Irr
igat
ion
(R
atio
)
Year
MKVDC, PUNEPlan Group : Abundant
(Financial Aspect)
Krishna
Radhanagari
Tulashi
Warna
Dudhganga
State target
56

Benchmarking Report 2018-19]
Maharashtra Krishna Valley Development Coorporation, Pune(PIC-Pune, SIC-Satara, SIC- Sangali, KIC-kolhapur, Kukadi IC-Pune, SIPC-Satara,CADA-Solapur),
Year 2018-19 Data including consecutive year (2013-14 to 2018-19)
Ind I Ind I(a) Ind III Ind IV Ind XII-I Ind XII-NIMajor Abundant CADA Pune 2013-14 Krishna 14215 70.34 25056 4.98 0.48 0.74Major Abundant CADA Pune 2014-15 Krishna 13830 72.31 25186 5.45 0.54 0.91Major Abundant CADA Pune 2015-16 Krishna 9510 105.15 18153 6.29 0.92 1.21Major Abundant CADA Pune 2016-17 Krishna 13985 71.50 41209 7.88 0.85 0.82Major Abundant CADA Pune 2017-18 Krishna 11191 89.35 26240 5.90 0.48 0.87Major Abundant CADA Pune 2018-19 Krishna 14215 70.34822 25056 4.98 0.48 0.74Major Abundant SIC Sangli 2013-14 Radhanagari 6549 152.69 45157 4.45 0.75 0.72Major Abundant CADA Pune 2014-15 Radhanagari 6322 158.18 30041 4.73 0.77 0.43Major Abundant CADA Pune 2015-16 Radhanagari 7240 138.13 30415 4.26 0.91 0.49Major Abundant CADA Pune 2016-17 Radhanagari 12847 77.84 29928 3.64 1.32 1.25Major Abundant CADA Pune 2017-18 Radhanagari 10825 92.38 30023 4.33 0.62 0.72Major Abundant CADA Pune 2018-19 Radhanagari 12757 78.38834 30790.51 3.68 1.00 0.85Major Abundant SIC Sangli 2013-14 Tulashi 10750 93.00 63915 3.95 1.09 1.00Major Abundant CADA Pune 2014-15 Tulashi 9620 104.00 27173 3.38 0.87 1.00Major Abundant CADA Pune 2015-16 Tulashi 5027 199.00 26722 4.15 0.82 0.61Major Abundant CADA Pune 2016-17 Tulashi 6969 143.48 47840 3.78 0.95 1.00Major Abundant CADA Pune 2017-18 Tulashi 7042 142.01 47933 3.75 1.23 1.78Major Abundant CADA Pune 2018-19 Tulashi 7697 129.9207 47933.3 3.43 1.00 1.00Major Abundant SIC Sangli 2013-14 Warna 7211 138.68 7080 7.06 0.40 0.87Major Abundant CADA Pune 2014-15 Warna 6729 148.62 36411 6.80 0.67 1.07Major Abundant CADA Pune 2015-16 Warna 5492 182.08 4633 6.94 0.80 0.87Major Abundant CADA Pune 2016-17 Warna 5957 167.85 81363 10.55 0.85 1.17Major Abundant CADA Pune 2017-18 Warna 3632 275.30 43857 12.01 1.16 0.76Major Abundant CADA Pune 2018-19 Warna 5080 196.8504 61191.83 8.63 1.00 0.76Major Abundant SIC Sangli 2013-14 Dudhganga 10975 91.11 52439 3.23 0.33 1.00Major Abundant CADA Pune 2014-15 Dudhganga 9909 100.92 52306 3.58 0.52 0.93Major Abundant CADA Pune 2015-16 Dudhganga 6706 149.13 36171 4.00 0.62 0.58Major Abundant CADA Pune 2016-17 Dudhganga 14536 68.79 35225 4.67 1.08 1.15Major Abundant CADA Pune 2017-18 Dudhganga 10974 91.12 67504 4.89 0.62 0.58Major Abundant CADA Pune 2018-19 Dudhganga 11657 85.78537 65183.32 4.36 0.55 1.13
Agricultural Productivity
Financial AspectType Plangroup Circle
Irrigation Year
ProjectSystem
Performance
57

Visual Depiction [Benchmarking Report 2018-19]
Observations (MKVDC, Pune: plan group – Abundant)
A. System performance
Indicator 1- Annual Irrigation Water Supply Per Unit Irrigated Area (Cum/Ha)
1. Tulashi project is observed to be an ideal satisfy the state target. 2. In current year, Warrna project has minimum water supply per unit irrigated area. 3. Krishna Projects has increment in water supply as compare with last year.
Indicator 1a- Annual Area Irrigated Per Unit of Water Supply (Ha/Mcum)
1. Warna project has irrigated maximum area with respect to minimum water supply. 2. Tulashi project is reached up to state target but shows minimum area irrigated as compared
with previous year. 3. Dudhganga, Radhanagri and Krishna projects shows minimum area irrigated per unit of
water supply since last two years.
B. Agricultural productivity
Indicator III- Output Per Unit Irrigated Area (Rs/Ha)
1. Radhanagari project has minimum agricultural output per unit irrigated area and it shows same performance since last four years.
2. Warna project shows gradually increment in agricultural output has compared with previous year.
3. The agricultural output of Tulashi project has remained constant since last three year where as Dudhganga project got slightly decrement in their performance has compared with back year 2017-18.
4. Krishna project has minimum agricultural output per unit irrigated area.
Indicator IV- Output Per Unit Irrigation Water Supply (Rs/Cum)
1. Warna project shows the maximum output per unit water supply in current year but has decrement in productivity as compared with previous year.
2. In current year, Radhanagari, Tulashi projects shows minimum agriculture productivity per unit of water supply.
C. Financial Aspect
Indicator XII(I)- Assessment Recovery Ratio (Irrigation)
1. Dudhganga and Krishna projects have minimum recovery ratio.
Indicator XII(NI)- Assessment Recovery Ratio (Non-Irrigation)
1. Radhanagari project has increment in revenue collection of NI as compared with previous year 2017-18.
2. Dudhganga project shows drastically high values because of collection of arrears of previous year.
58

[Benchmarking Report 2018-19]
2. AGRICULTURAL PRODUCTIVITY
1. SYSTEM PERFORMANCE
0
10000
20000
30000
40000
50000
60000
2013-14 2014-15 2015-16 2016-17 2017-18 2018-19
Indi
cato
r II
I :
Ou
tpu
t p
er U
nit
Ir
riga
ted
Are
a (R
s/H
a)
Year
TIDC, JALGAONPlan Group : Deficit
(Agricultural Productivity)
Girna
State target
0
2000
4000
6000
8000
10000
2013-14 2014-15 2015-16 2016-17 2017-18 2018-19
Ind
icat
or I
: A
nnua
l Irr
igat
ion
W
ater
Supp
ly p
er U
nit
Irr
igat
ed
Are
a (C
um
/Ha)
Year
TIDC, JALGAONPlan Group : Deficit
(System Performance)
Girna
State target
0
50
100
150
200
250
2013-14 2014-15 2015-16 2016-17 2017-18 2018-19
Indi
cato
r I(
a) :
Ann
ual
Are
a Ir
riga
ted
per
Un
it o
f W
ater
Su
pply
(H
a/M
cum
)
Year
TIDC, JALGAONPlan Group : Deficit
(System Performance)
Girna
State target
TAPI IRRIGATION DEVELOPMENT CORPORATION, (TIDC) JALGAON
DEFICITPLAN GROUP
59

[Benchmarking Report 2018-19]
3. FINANCIAL ASPECT
0.02.04.06.08.0
10.012.014.016.018.020.022.024.0
2013-14 2014-15 2015-16 2016-17 2017-18 2018-19
Indi
cato
r IV
: O
utpu
t p
er U
nit
Irri
gati
on W
ater
Su
ppl
y (R
s/C
um
)
Year
TIDC, JALGAONPlan Group : Deficit
(Agricultural Productivity)
Girna
State target
0.0
0.3
0.6
0.9
1.2
2014-15 2015-16 2016-17 2017-18 2018-19
Ind
icat
or X
II(I
) : A
sses
men
t R
ecov
ery
Rat
io I
rrig
atio
n (R
atio
)
Year
TIDC, JALGAON Plan Group : Deficit(Financial Aspect)
Girna
State target
0.0
0.3
0.6
0.9
1.2
2013-14 2014-15 2015-16 2016-17 2017-18 2018-19
Indi
cato
r X
II(N
I) :
Ass
esm
ent
Rec
over
y R
atio
Non
Irr
igat
ion
(R
atio
)
Year
TIDC, JALGAON Plan Group : Deficit(Financial Aspect)
Girna
State target
60

[Benchmarking Report 2018-19]
Tapi Irrigation Development Corporation, Jalgaon(CADA, Jalgaon; DIPC, Dhule ; JIC, Jalgaon)
Year 2018-19 Data including consecutive year (2013-14 to 2018-19)
Ind I Ind I(a) Ind III Ind IV Ind XII-I Ind XII-NI
Major Deficit CADA Jalgaon 2013-14 Girna 7116 140.52 24148 15.44 0.01 1.10
Major Deficit CADA Jalgaon 2014-15 Girna 7574 132.03 35195 21.20 0.17 0.72
Major Deficit CADA Jalgaon 2015-16 Girna 2632 379.89 54525 325.98 0.01 0.72
Major Deficit CADA Jalgaon 2016-17 Girna 15103 66.21 33615 8.91 0.09 0.64
Major Deficit CADA Jalgaon 2017-18 Girna 11555 86.5426 42426.99 15.17 0.19 0.32
Major Deficit CADA Jalgaon 2018-19 Girna 5542 180.44 35062.23 163.84 0.00 0.48
Agricultural Productivity
Financial AspectType Plangroup Circle
Irrigation Year
ProjectSystem
Performance
61

Observations (TIDC, Jalgaon : plan group – Deficit)
A. System performance
Indicator 1- Annual Irrigation Water Supply Per Unit Irrigated Area (Cum/Ha)
Girna project has maximum water supply for unit irrigated area in year 2016-17 and 2017-18.
Indicator 1a- Annual Area Irrigated Per Unit of Water Supply (Ha/Mcum)
In your 2018-19, Girna project has maximum area irrigated per unit of water supply as compared with previous two years.
B. Agricultural productivity
Indicator III- Output Per Unit Irrigated Area (Rs/Ha)
The output per unit irrigated area was slightly less than last year.
Indicator IV- Output Per Unit Irrigation Water Supply (Rs/Cum)
Girna project has maximum output per unit irrigation of water supply as compared to previous two years.
C. Financial Aspect
Indicator XII(I)- Assessment Recovery Ratio (Irrigation)
Girna project has too less revenue collections.
Indicator XII(NI)- Assessment Recovery Ratio (Non-Irrigation)
Non-irrigation revenue collection for Girna project has slightly more than last year. But still the ratio was minimum, they have less revenue collection.
62
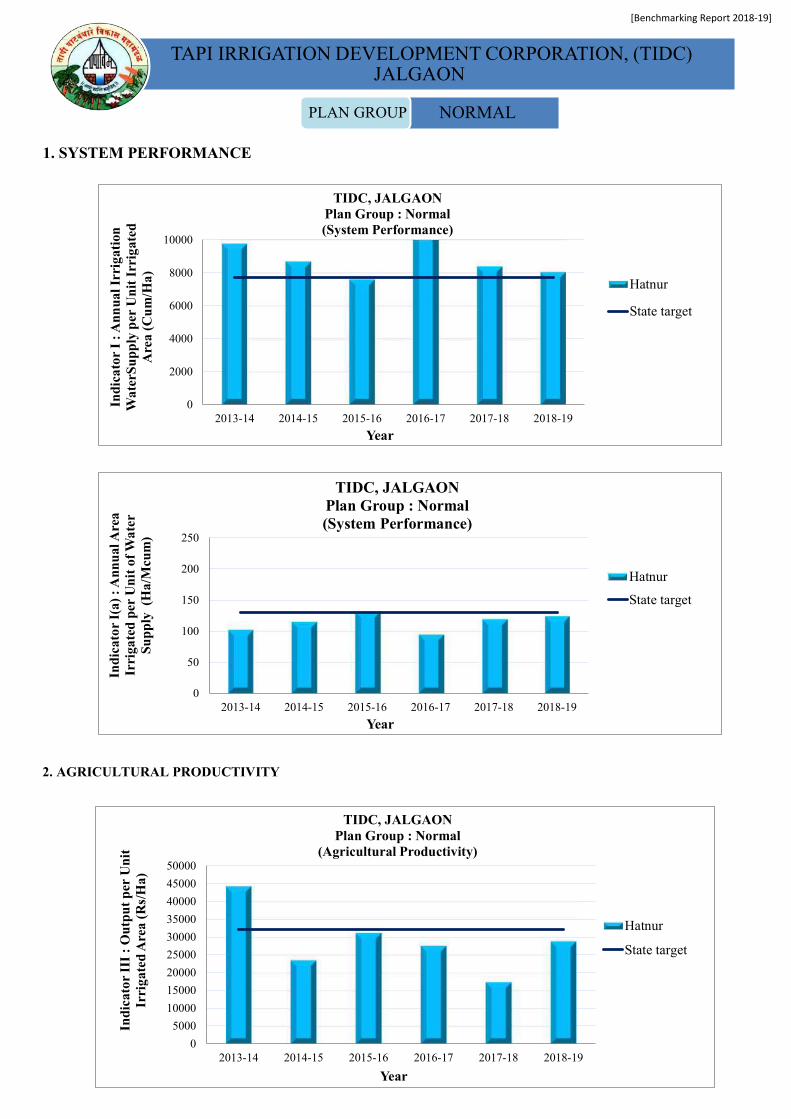
[Benchmarking Report 2018-19]
2. AGRICULTURAL PRODUCTIVITY
1. SYSTEM PERFORMANCE
0
5000
10000
15000
20000
25000
30000
35000
40000
45000
50000
2013-14 2014-15 2015-16 2016-17 2017-18 2018-19
Indi
cato
r II
I :
Out
put
per
Un
it
Irri
gate
d A
rea
(Rs/
Ha)
Year
TIDC, JALGAONPlan Group : Normal
(Agricultural Productivity)
Hatnur
State target
0
2000
4000
6000
8000
10000
2013-14 2014-15 2015-16 2016-17 2017-18 2018-19
Indi
cato
r I
: Ann
ual I
rrig
atio
n
Wat
erS
upp
ly p
er U
nit
Irr
igat
ed
Are
a (C
um
/Ha)
Year
TIDC, JALGAONPlan Group : Normal(System Performance)
Hatnur
State target
0
50
100
150
200
250
2013-14 2014-15 2015-16 2016-17 2017-18 2018-19
Indi
cato
r I(
a) :
Ann
ual
Are
a Ir
riga
ted
per
Un
it o
f W
ater
Su
pp
ly (
Ha/
Mcu
m)
Year
TIDC, JALGAONPlan Group : Normal(System Performance)
Hatnur
State target
TAPI IRRIGATION DEVELOPMENT CORPORATION, (TIDC) JALGAON
NORMALPLAN GROUP
63

[Benchmarking Report 2018-19]
3. FINANCIAL ASPECT
0.0
5.0
10.0
15.0
20.0
25.0
30.0
2013-14 2014-15 2015-16 2016-17 2017-18 2018-19
Indi
cato
r IV
: O
utpu
t pe
r U
nit
Ir
riga
tion
Wat
er S
uppl
y (R
s/C
um)
Year
TIDC, JALGAONPlan Group : Normal
(Agricultural Productivity)
Hatnur
State target
0.0
0.3
0.6
0.9
1.2
2013-14 2014-15 2015-16 2016-17 2017-18 2018-19
Indi
cato
r X
II(I
) : A
sses
men
t R
ecov
ery
Rat
io I
rrig
atio
n (R
atio
)
Year
TIDC, JALGAON Plan Group : Normal
(Financial Aspect)
Hatnur
State target
0.0
0.3
0.6
0.9
1.2
2013-14 2014-15 2015-16 2016-17 2017-18 2018-19
Indi
cato
r X
II(N
I) :
Ass
esm
ent
Rec
over
y R
atio
Non
Irr
igat
ion
(Rat
io)
Year
TIDC, JALGAON Plan Group : Normal
(Financial Aspect)
Hatnur
State target
64

[Benchmarking Report 2018-19]
Tapi Irrigation Development Corporation, Jalgaon(CADA, Jalgaon; DIPC, Dhule ; JIC, Jalgaon)
Year 2018-19 Data including consecutive year (2013-14 to 2018-19)
Ind I Ind I(a) Ind III Ind IV Ind XII-I Ind XII-NI
Major Normal CADA Jalgaon 2013-14 Hatnur 9770 102.36 44331 12.25 0.32 0.40
Major Normal CADA Jalgaon 2014-15 Hatnur 8692 115.04 23532 7.77 0.45 0.48
Major Normal CADA Jalgaon 2015-16 Hatnur 7607 131.45 31178 12.90 0.42 0.96
Major Normal CADA Jalgaon 2016-17 Hatnur 10559 94.71 27572 12.24 0.48 0.72
Major Normal CADA Jalgaon 2017-18 Hatnur 8391 119.18 17381 9.13 1.90 1.09
Major Normal CADA Jalgaon 2018-19 Hatnur 8049 124.24 28876 28.52 0.87 1.00
Agricultural Productivity
Financial AspectType Plangroup Circle
Irrigation Year
ProjectSystem
Performance
65

Observations (TIDC, Jalgaon: plan group – Normal)
A. System performance
Indicator 1- Annual Irrigation Water Supply Per Unit Irrigated Area (Cum/Ha)
The Hatnur Project has maximum water supply per unit of irrigated area. It is above the state target.
Indicator 1a- Annual Area Irrigated Per Unit of Water Supply (Ha/Mcum)
The area irrigated per unit of water supply is below the state target.
B. Agricultural productivity
Indicator III- Output Per Unit Irrigated Area (Rs/Ha)
The agricultural output is increased as compare to last two years, but it’s values are below the state target.
Indicator IV- Output Per Unit Irrigation Water Supply (Rs/Cum)
In current year, Hatnur project has maximum agricultural output per unit irrigation of water supply as compared to previous year.
C. Financial Aspect
Indicator XII(I)- Assessment Recovery Ratio (Irrigation)
In current year, Hatnur project has nearly satisfied revenue collection. In year 2017-18, the ratio is above the state target.
Indicator XII(NI)- Assessment Recovery Ratio (Non-Irrigation)
In year 2017-18, Hatnur project has recovery ratio above the state target. It means, it included the revenue areas of previous year.
66

[Benchmarking Report 2018-19]
2. AGRICULTURAL PRODUCTIVITY
1. SYSTEM PERFORMANCE
0
20000
40000
60000
80000
100000
120000
140000
160000
180000
200000
2013-14 2014-15 2015-16 2016-17 2017-18 2018-19
Indi
cato
r II
I :
Out
put
per
Un
it
Irri
gate
d A
rea
(Rs/
Ha)
Year
VIDC, NAGPURPlan Group : Deficit
(Agricultural Productivity)
KatepurnaNalgangaWan (Amravati)KhadakpurnaState target
0
2000
4000
6000
8000
10000
2013-14 2014-15 2015-16 2016-17 2017-18 2018-19
Indi
cato
r I
: Ann
ual I
rrig
atio
n
Wat
erS
uppl
y p
er U
nit
Irr
igat
ed
Are
a (C
um
/Ha)
Year
VIDC, NAGPURPlan Group : Deficit
(System Performance)
KatepurnaNalgangaWan (Amravati)KhadakpurnaState target
0
50
100
150
200
250
2013-14 2014-15 2015-16 2016-17 2017-18 2018-19
Indi
cato
r I(
a) :
An
nual
Are
a Ir
riga
ted
per
Un
it o
f Wat
er
Supp
ly (
Ha/
Mcu
m)
Year
VIDC, NAGPURPlan Group : Deficit
(System Performance)
KatepurnaNalgangaWan (Amravati)KhadakpurnaState target
VIDARBHA IRRIGATION DEVELOPMENT CORPORATION, (VIDC) NAGPUR
DEFICITPLAN GROUP
67

[Benchmarking Report 2018-19]
3. FINANCIAL ASPECT
0.0
2.0
4.0
6.0
8.0
10.0
2013-14 2014-15 2015-16 2016-17 2017-18 2018-19
Ind
icat
or I
V :
Out
put
per
Uni
t Ir
riga
tion
Wat
er S
upp
ly (
Rs/
Cu
m)
Year
VIDC, NAGPURPlan Group : Deficit
(Agricultural Productivity)
KatepurnaNalgangaWan (Amravati)KhadakpurnaState target
0.0
0.3
0.6
0.9
1.2
2013-14 2014-15 2015-16 2016-17 2017-18 2018-19
Indi
cato
r X
II(I
) : A
sses
men
t R
ecov
ery
Rat
io I
rrig
atio
n (R
atio
)
Year
VIDC, NAGPUR Plan Group : Deficit(Financial Aspect)
KatepurnaNalgangaWan (Amravati)KhadakpurnaState target
0.0
0.3
0.6
0.9
1.2
2013-14 2014-15 2015-16 2016-17 2017-18 2018-19
Indi
cato
r X
II(N
I) :
Ass
esm
ent
Rec
over
y R
atio
Non
Irr
igat
ion
(Rat
io)
Year
VIDC, NAGPUR Plan Group : Deficit(Financial Aspect)
KatepurnaNalgangaWan (Amravati)KhadakpurnaState target
68

[Benchmarking Reort 2018-19]
Vidarbha Irrigation Development Coorporation, Nagpur(AIC Akola,UWPC Amravati, BIPC Buldhana, YIC Yavatmal, WIC Washim, CADA Nagpur,CIPC Chandrapur)
Year 2018-19 Data including consecutive year (2013-14 to 2018-19)
Ind I Ind I(a) Ind III Ind IV Ind XII-I Ind XII-NI
Major Deficit AIC Akola 2013-14 Katepurna 4401 227.20 31605 7.18 0.40 0.12
Major Deficit AIC Akola 2014-15 Katepurna 0 0.00 0 0.00 0.14 1.16
Major Deficit AIC Akola 2015-16 Katepurna 12603 79.34 20643 22.07 3.68 1.47
Major Deficit AIC Akola 2016-17 Katepurna 14920 67.02 19700 3.31 0.01 0.13
Major Deficit AIC Akola 2017-18 Katepurna 0 0.00 205392 2.13 0.00 0.72
Major Deficit AIC Akola 2018-19 Katepurna 4289 233.155 23320.69 3.99 0 0.33
Major Deficit AIC Akola 2013-14 Nalganga 5133 194.80 59306 3.83 9.12 0.61
Major Deficit AIC Akola 2014-15 Nalganga 5365 186.40 106013 4.66 0.50 1.28
Major Deficit AIC Akola 2015-16 Nalganga 6399 156.26 98962 4.76 0.91 0.62
Major Deficit AIC Akola 2016-17 Nalganga 5776 173.13 154965 5.04 0.32 0.83
Major Deficit AIC Akola 2017-18 Nalganga 5025 199.02 25159 5.01 0.31 0.72
Major Deficit AIC Akola 2018-19 Nalganga 480 2083.33 0 4.75 0.86 0.89
Major Deficit BIPC Buldhana 2013-14 Wan (Amravati) 11468 87.20 21040 5.59 0.62 0.98
Major Deficit BIPC Buldhana 2014-15 Wan (Amravati) 11184 89.41 56186 9.48 0.72 0.67
Major Deficit BIPC Buldhana 2015-16 Wan (Amravati) 9449 105.83 21193 7.00 0.21 0.80
Major Deficit BIPC Buldhana 2016-17 Wan (Amravati) 14937 66.95 251585 105.32 0.94 0.83
Major Deficit BIPC Buldhana 2017-18 Wan (Amravati) 1151 869.13 42232 36.70 0.62 0.88
Major Deficit BIPC Buldhana 2018-19 Wan (Amravati) 1440 694.444 2094.85 1.45 0.15 0.47
Major Deficit BIPC Buldhana 2013-14 Khadakpurna 7160 139.66 43048 6.27 0.21 0.00
Major Deficit BIPC Buldhana 2014-15 Khadakpurna 4238 235.96 484268 114.25 0.52 0.04
Major Deficit BIPC Buldhana 2015-16 Khadakpurna 11170 89.53 1424358 18.65 1.07 0.70
Major Deficit BIPC Buldhana 2016-17 Khadakpurna 6645 150.49 230400 34.67 0.16 1.00
Major Deficit BIPC Buldhana 2017-18 Khadakpurna 5940 168.35 160000 26.94 0.00 0.32
Major Deficit BIPC Buldhana 2018-19 Khadakpurna 1111 900.09 0 10.51 0 0.71
Agricultural Productivity
Financial AspectType Plangroup Circle
Irrigation Year
ProjectSystem
Performance
69

Visual Depiction [Benchmarking Report 2018-19]
Observations (VIDC, Nagpur: plan group – Deficit)
A. System performance
Indicator I - Annual Irrigation Water Supply Per Unit Irrigated Area (Cum/Ha)
1. wan (Amravati) project shows maximum water supply per unit irrigated area from year 2013-14 to 2016-17 and suddenly dropped in year 2017-18 and 2018-19.
2. Katepurna project has maximum water supply in year 2015-16 and 2016-17. 3. In year 2018-19, there are sudden drop in water supply for all project
Indicator I(a)- Annual Area Irrigated Per Unit of Water Supply (Ha/Mcum)
1. As compared with Indicator I graphs, it is observed that in minimum water supply the maximum area got irritated for year 2017-18 and 2018-19 and vice versa for year 2015-16 and 2016-17.
B. Agricultural productivity
Indicator III- Output Per Unit Irrigated Area (Rs/Ha)
1. From the above graphical representation, it is observed that in year 2018-19 the maximum area got irrigated in minimum water supply but the agricultural productivity has less output.
Indicator IV- Output Per Unit Irrigation Water Supply (Rs/Cum)
1. In year 2018-19 Katepurna, Wan and Khadakpurna projects has minimum productivity per unit of water supply.
2. From previous two-year Katepurna project has less productivity.
C. Financial Aspect
Indicator XII(I)- Assessment Recovery Ratio (Irrigation)
1. In year 2017-18 and 2018-19 Katepurna and khadakpurna project has no recovery ratio. 2. Wan project has minimum recovery ratio as compared to last year.
Indicator XII(NI)- Assessment Recovery Ratio (Non-Irrigation)
1. Katepurna and Wan project has minimum assessment recovery ratio in year 2018-19 as compared with previous year.
70

[Benchmarking Report 2018-19]
2. AGRICULTURAL PRODUCTIVITY
1. SYSTEM PERFORMANCE
0
20000
40000
60000
80000
100000
2013-14 2014-15 2015-16 2016-17 2017-18 2018-19
Ind
icat
or I
II :
Ou
tpu
t p
er U
nit
Irri
gate
d A
rea
(Rs/
Ha)
Year
VIDC, NAGPURPlan Group : Normal
(Agricultural Productivity)
BorLower WunnaPusUpper WardhaArunavatiState target
0
2000
4000
6000
8000
10000
12000
14000
16000
18000
20000
2013-14 2014-15 2015-16 2016-17 2017-18 2018-19
Indi
cato
r I
: An
nual
Irr
igat
ion
W
ater
Supp
ly p
er U
nit
Irri
gate
d A
rea
(Cu
m/H
a)
Year
VIDC, NAGPURPlan Group : Normal(System Performance)
Bor
Lower Wunna
Pus
Upper Wardha
Arunavati
State target
0
50
100
150
200
250
2013-14 2014-15 2015-16 2016-17 2017-18 2018-19
Ind
icat
or I
(a)
: Ann
ual
Are
a Ir
riga
ted
per
Un
it o
f W
ater
S
upp
ly (
Ha/
Mcu
m)
Year
VIDC, NAGPURPlan Group : Normal(System Performance)
Bor
Lower Wunna
Pus
Upper Wardha
Arunavati
State target
VIDARBHA IRRIGATION DEVELOPMENT CORPORATION, (VIDC) NAGPUR
NORMALPLAN GROUP
71

[Benchmarking Report 2018-19]
3. FINANCIAL ASPECT
0.01.02.03.04.05.06.07.08.09.0
10.0
2013-14 2014-15 2015-16 2016-17 2017-18 2018-19
Indi
cato
r IV
: O
utp
ut
per
Un
it
Irri
gati
on W
ater
Sup
ply
(R
s/C
um)
Year
VIDC, NAGPURPlan Group : Normal
(Agricultural Productivity)
BorLower WunnaPusUpper WardhaArunavati
0.0
0.3
0.6
0.9
1.2
2013-14 2014-15 2015-16 2016-17 2017-18 2018-19
Indi
cato
r X
II(I
) : A
sses
men
t R
ecov
ery
Rat
io I
rrig
atio
n (
Rat
io)
Year
VIDC, NAGPUR Plan Group : Normal
(Financial Aspect)
BorLower WunnaPusUpper WardhaArunavatiState target
0.0
0.3
0.6
0.9
1.2
2013-14 2014-15 2015-16 2016-17 2017-18 2018-19
Ind
icat
or X
II(N
I) :
Ass
esm
ent
Rec
over
y R
atio
Non
Irr
igat
ion
(R
atio
)
Year
VIDC, NAGPUR Plan Group : Normal
(Financial Aspect)
Bor
Lower Wunna
Pus
Upper Wardha
Arunavati
State target
72

[Benchmarking Report 2018-19]
Vidarbha Irrigation Development Coorporation, Nagpur(AIC Akola,UWPC Amravati, BIPC Buldhana, YIC Yavatmal, WIC Washim, CADA Nagpur,CIPC Chandrapur)
Year 2018-19 Data including consecutive year (2013-14 to 2018-19)
Ind I Ind I(a) Ind III Ind IV Ind XII-I Ind XII-NIMajor Normal CIPC Chandrapur 2013-14 Bor 13792 72.51 12645 1.37 0.12 0.00Major Normal CIPC Chandrapur 2014-15 Bor 10460 95.60 9266 1.34 0.12 0.00Major Normal CIPC Chandrapur 2015-16 Bor 10727 93.23 12694 1.84 0.13 0.00Major Normal CIPC Chandrapur 2016-17 Bor 12679 78.87 26659 3.35 1.56 0.00Major Normal CIPC Chandrapur 2017-18 Bor 14446 69.22 20170 2.57 0.56 0.00Major Normal CIPC Chandrapur 2018-19 Bor 11789 84.8248 22592.86 4.31 0.06 0.00Major Normal CADA Nagpur 2013-14 Lower Wunna 14701 68.02 19790 2.14 0.15 0.92Major Normal CADA Nagpur 2014-15 Lower Wunna 14950 66.89 29262 2.95 0.57 0.98Major Normal CADA Nagpur 2015-16 Lower Wunna 13862 72.14 29449 3.16 0.34 0.99Major Normal CADA Nagpur 2016-17 Lower Wunna 13914 71.87 1128 0.22 0.21 0.74Major Normal CADA Nagpur 2017-18 Lower Wunna 21394 46.74 14991 2.54 1.00 0.99Major Normal CADA Nagpur 2018-19 Lower Wunna 16175 61.8238 14315.36 1.83 0.36 0.64Major Normal AIC Akola 2013-14 Pus 16927 59.07 20354 2.81 0.04 0.38Major Normal AIC Akola 2014-15 Pus 9169 109.06 41264 2.16 7.10 0.71Major Normal AIC Akola 2015-16 Pus 8545 117.03 38508 2.28 0.41 1.16Major Normal AIC Akola 2016-17 Pus 7074 141.36 37164 2.89 0.99 0.74Major Normal AIC Akola 2017-18 Pus 0 0.00 0 0.00 0.00 0.68Major Normal AIC Akola 2018-19 Pus 6622 151.012 29733 4.49 0.00 1.00Major Normal UWPC Amravati 2013-14 Upper Wardha 13258 75.42 30334 3.24 0.45 1.00Major Normal UWPC Amravati 2014-15 Upper Wardha 9845 101.57 25467 2.59 0.37 0.72Major Normal UWPC Amravati 2015-16 Upper Wardha 8447 118.38 34568 4.09 0.48 0.97Major Normal UWPC Amravati 2016-17 Upper Wardha 2907 344.00 31556 10.85 0.81 1.00Major Normal UWPC Amravati 2017-18 Upper Wardha 7476 133.76 74677 9.99 1.05 1.04Major Normal UWPC Amravati 2018-19 Upper Wardha 1615 619.195 14742.14 9.13 0.79 1.00Major Normal YIC Yavatmal 2013-14 Arunavati 22621 42.20 84444 8.46 0.12 0.05Major Normal YIC Yavatmal 2014-15 Arunavati 12660 78.98 74872 10.44 0.23 0.24Major Normal YIC Yavatmal 2015-16 Arunavati 17450 57.30 62298 9.32 0.00 0.20Major Normal YIC Yavatmal 2016-17 Arunavati 23219 43.07 50482 6.45 0.00 0.62Major Normal YIC Yavatmal 2017-18 Arunavati 5405 185.03 54073 10.00 0.20 2.05Major Normal YIC Yavatmal 2018-19 Arunavati 4992 200.321 3735214.77 748.21 0.00 0.35
Agricultural Productivity
Financial AspectType Plangroup Circle
Irrigation Year
ProjectSystem
Performance
73
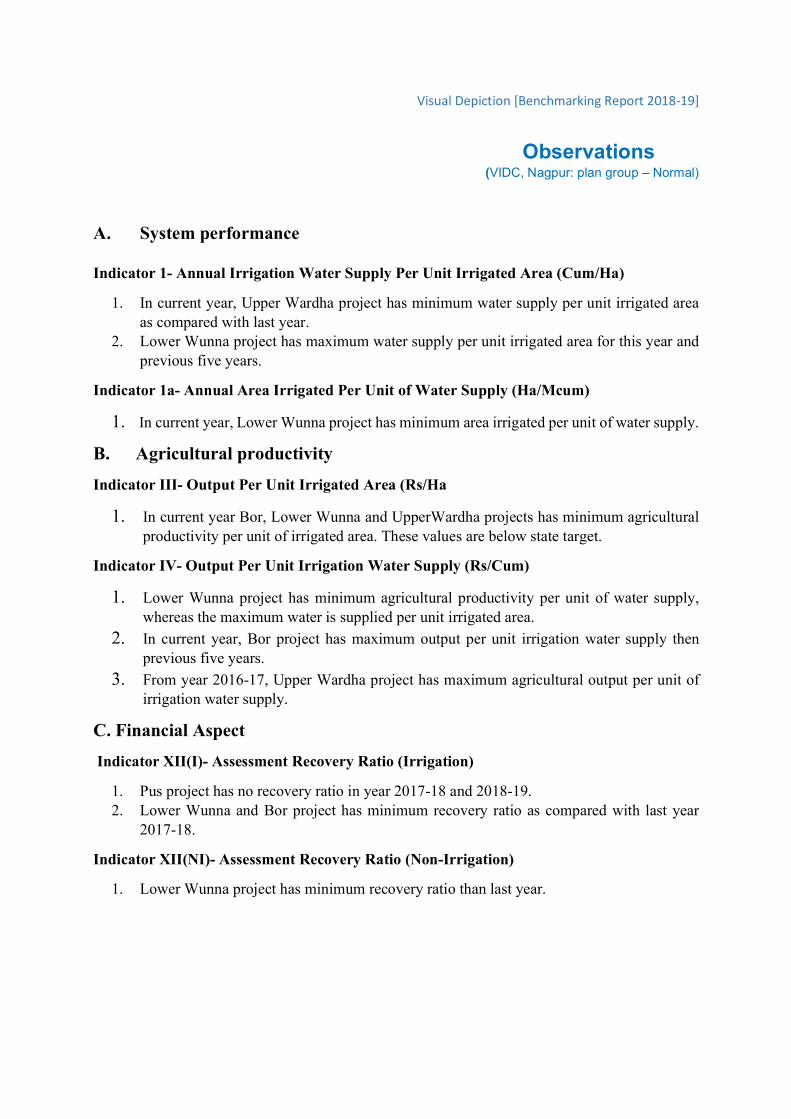
Visual Depiction [Benchmarking Report 2018-19]
Observations (VIDC, Nagpur: plan group – Normal)
A. System performance
Indicator 1- Annual Irrigation Water Supply Per Unit Irrigated Area (Cum/Ha)
1. In current year, Upper Wardha project has minimum water supply per unit irrigated area as compared with last year.
2. Lower Wunna project has maximum water supply per unit irrigated area for this year and previous five years.
Indicator 1a- Annual Area Irrigated Per Unit of Water Supply (Ha/Mcum)
1. In current year, Lower Wunna project has minimum area irrigated per unit of water supply.
B. Agricultural productivity
Indicator III- Output Per Unit Irrigated Area (Rs/Ha
1. In current year Bor, Lower Wunna and UpperWardha projects has minimum agricultural productivity per unit of irrigated area. These values are below state target.
Indicator IV- Output Per Unit Irrigation Water Supply (Rs/Cum)
1. Lower Wunna project has minimum agricultural productivity per unit of water supply, whereas the maximum water is supplied per unit irrigated area.
2. In current year, Bor project has maximum output per unit irrigation water supply then previous five years.
3. From year 2016-17, Upper Wardha project has maximum agricultural output per unit of irrigation water supply.
C. Financial Aspect
Indicator XII(I)- Assessment Recovery Ratio (Irrigation)
1. Pus project has no recovery ratio in year 2017-18 and 2018-19. 2. Lower Wunna and Bor project has minimum recovery ratio as compared with last year
2017-18.
Indicator XII(NI)- Assessment Recovery Ratio (Non-Irrigation)
1. Lower Wunna project has minimum recovery ratio than last year.
74

[Benchmarking Report 2018-19]
2. AGRICULTURAL PRODUCTIVITY
1. SYSTEM PERFORMANCE
0
5000
10000
15000
20000
2013-14 2014-15 2015-16 2016-17 2017-18 2018-19
Ind
icat
or I
: A
nnu
al I
rrig
atio
n W
ater
Su
pply
per
Uni
t Ir
riga
ted
Are
a (C
um/H
a)
Year
VIDC, NAGPURPlan Group : Surplus (System Performance)
Pench
Bagh
Itiahdoh
State target
0
50
100
150
200
250
2013-14 2014-15 2015-16 2016-17 2017-18 2018-19
Indi
cato
r I(
a) :
Ann
ual A
rea
Irri
gate
d p
er U
nit
of W
ater
Su
ppl
y (
Ha/
Mcu
m)
Year
VIDC, NAGPURPlan Group : Surplus (System Performance)
Pench
Bagh
Itiahdoh
State target
0
10000
20000
30000
40000
50000
2013-14 2014-15 2015-16 2016-17 2017-18 2018-19
Indi
cato
r II
I :
Ou
tput
per
Uni
t Ir
riga
ted
Are
a (R
s/H
a)
Year
VIDC, NAGPURPlan Group : Surplus
(Agricultural Productivity)
Pench
Bagh
Itiahdoh
State target
VIDARBHA IRRIGATION DEVELOPMENT CORPORATION, (VIDC) NAGPUR
SURPLUSPLAN GROUP
75

[Benchmarking Report 2018-19]
3. FINANCIAL ASPECT
0.0
2.5
5.0
7.5
10.0
2013-14 2014-15 2015-16 2016-17 2017-18 2018-19Indi
cato
r IV
: O
utp
ut
per
Un
it I
rrig
atio
n
Wat
er S
upp
ly (
Rs/
Cu
m)
Year
VIDC, NAGPURPlan Group : Surplus
(Agricultural Productivity)
Pench
Bagh
Itiahdoh
State target
0.0
0.3
0.6
0.9
1.2
2013-14 2014-15 2015-16 2016-17 2017-18 2018-19
Indi
cato
r X
II(I
) : A
sses
men
t R
ecov
ery
Rat
io I
rrig
atio
n (R
atio
)
Year
VIDC, NAGPUR Plan Group : Surplus
(Financial Aspect)
Pench
Bagh
Itiahdoh
State target
0.0
0.3
0.6
0.9
1.2
2013-14 2014-15 2015-16 2016-17 2017-18 2018-19
Indi
cato
r X
II(N
I) :
Ass
esm
ent
Rec
over
y R
atio
Non
Irr
igat
ion
(Rat
io)
Year
VIDC, NAGPUR Plan Group : Surplus
(Financial Aspect)
Pench
Bagh
Itiahdoh
State target
76

[Benchmarking Report 2018-19]
Vidarbha Irrigation Development Coorporation, Nagpur(AIC Akola,UWPC Amravati, BIPC Buldhana, YIC Yavatmal, WIC Washim, CADA Nagpur,CIPC Chandrapur)
Year 2018-19 Data including consecutive year (2013-14 to 2018-19)
Ind I Ind I(a) Ind III Ind IV Ind XII-I Ind XII-NI
Major Surplus CADA Nagpur 2013-14 Pench 8772 114 2308 0.30 0.47 0.75
Major Surplus CADA Nagpur 2014-15 Pench 9698 103.11 2333 0.28 0.93 0.97
Major Surplus CADA Nagpur 2015-16 Pench 8705 114.87 23691 3.14 0.76 1.00
Major Surplus CADA Nagpur 2016-17 Pench 8237 121.411 23918 3.42 0.93 0.92
Major Surplus CADA Nagpur 2017-18 Pench 3404 293.747 23763 8.37 1.01 0.59
Major Surplus CADA Nagpur 2018-19 Pench 4372 228.728 24880 6.70 1.00 0.75
Major Surplus CADA Nagpur 2013-14 Bagh 9012 110.97 19950 2.41 0.17 0.37
Major Surplus CADA Nagpur 2014-15 Bagh 7073 141.38 15960 1.64 0.12 0.00
Major Surplus CADA Nagpur 2015-16 Bagh 5675 176.21 15960 2.07 0.70 0.92
Major Surplus CADA Nagpur 2016-17 Bagh 10626 94.105 15960 1.26 0.75 0.92
Major Surplus CADA Nagpur 2017-18 Bagh 1878 532.389 15960 5.51 0.55 1.09
Major Surplus CADA Nagpur 2018-19 Bagh 3005 332.779 15960 3.44 1.00 0.77
Major Surplus CADA Nagpur 2013-14 Itiahdoh 9287 107.68 198477 19.88 0.37 0.50
Major Surplus CADA Nagpur 2014-15 Itiahdoh 11452 87.32 15962.3 1.23 0.99 1.16
Major Surplus CADA Nagpur 2015-16 Itiahdoh 5500 181.83 15960 1.74 0.49 1.49
Major Surplus CADA Nagpur 2016-17 Itiahdoh 11809 847.682 15960 1.29 5.15 0.97
Major Surplus CADA Nagpur 2017-18 Itiahdoh 3858 259.216 15960 2.51 0.47 1.60
Major Surplus CADA Nagpur 2018-19 Itiahdoh 9597 104.199 15961.8 1.66 1.00 0.64
Agricultural Productivity
Financial AspectType Plangroup Circle
Irrigation Year
ProjectSystem
Performance
77

Visual Depiction [Benchmarking Report 2018-19]
Observations (VIDC, Nagpur: plan group – Surplus)
A. System performance
Indicator 1- Annual Irrigation Water Supply Per Unit Irrigated Area (Cum/Ha)
1. In current year, Itiahdoh project has maximum water supply per unit irrigated area. Its value is above state target.
2. In year 2017-18, water supply for all projects are less than previous year.
Indicator 1a- Annual Area Irrigated Per Unit of Water Supply (Ha/Mcum)
1. In year 2018-19, Itiahdoh project has minimum area irrigated per unit of water supply.
B. Agricultural productivity
Indicator III- Output Per Unit Irrigated Area (Rs/Ha)
1. The agricultural output per unit irrigated area of Pench, Bagh and Itiahdoh projects were minimum since last five year.
Indicator IV- Output Per Unit Irrigation Water Supply (Rs/Cum)
1. In current year, Pench, Bagh and Itiahdoh projects has minimum output per unit water supply than last year 2017-18.
C. Financial Aspect
Indicator XII(I)- Assessment Recovery Ratio (Irrigation)
1. In current year, Pench, Bagh and Itiahdoh projects reached up to state target.
Indicator XII(NI)- Assessment Recovery Ratio (Non-Irrigation)
1. In year 2017-18 and 2018-19, Pench project has minimum recovery ratio as compared with year 2015 16 and 2016-17.
2. In 2018-19, all projects have minimum recovery ratio of non-irrigation. Their values are below state target.
78

[Benchmarking Report 2018-19]
2. AGRICULTURAL PRODUCTIVITY
1. SYSTEM PERFORMANCE
0
5000
10000
15000
20000
25000
30000
35000
40000
45000
50000
2013-14 2014-15 2015-16 2016-17 2017-18 2018-19
Ind
icat
or I
II :
Ou
tpu
t p
er U
nit
Irri
gate
d A
rea
(Rs/
Ha)
Year
VIDC, NAGPURPlan Group : Abundant
(Agricultural Productivity)
Asola MendhaDinaState target
0
2000
4000
6000
8000
10000
2013-14 2014-15 2015-16 2016-17 2017-18 2018-19
Indi
cato
r I
: Ann
ual I
rrig
atio
n
Wat
erS
upp
ly p
er U
nit
Irri
gate
d A
rea
(Cum
/Ha)
Year
VIDC, NAGPURPlan Group : Abundant (System Performance)
Asola MendhaDinaState target
0
50
100
150
200
250
300
350
400
450
2013-14 2014-15 2015-16 2016-17 2017-18 2018-19
Indi
cato
r I(
a) :
Ann
ual
Are
a Ir
riga
ted
per
Uni
t of
Wat
er
Su
pply
(H
a/M
cum
)
Year
VIDC, NAGPURPlan Group : Abundant (System Performance)
Asola Mendha
Dina
State target
VIDARBHA IRRIGATION DEVELOPMENT CORPORATION, (VIDC) NAGPUR
ABUNDANTPLAN GROUP
79

[Benchmarking Report 2018-19]
3. FINANCIAL ASPECT
0.0
2.0
4.0
6.0
8.0
10.0
12.0
14.0
16.0
2013-14 2014-15 2015-16 2016-17 2017-18 2018-19
Ind
icat
or I
V :
Ou
tput
per
Un
it
Irri
gati
on W
ater
Su
pp
ly (
Rs/
Cu
m)
Year
VIDC, NAGPURPlan Group : Abundant
(Agricultural Productivity)
Asola MendhaDinaState target
0.0
0.3
0.6
0.9
1.2
2013-14 2014-15 2015-16 2016-17 2017-18 2018-19
Indi
cato
r X
II(I
) : A
sses
men
t R
ecov
ery
Rat
io I
rrig
atio
n (R
atio
)
Year
VIDC, NAGPUR Plan Group : Abundant
(Financial Aspect)
Asola MendhaDinaState target
0.0
0.3
0.6
0.9
1.2
2013-14 2014-15 2015-16 2016-17 2017-18 2018-19
Ind
icat
or X
II(N
I) :
Ass
esm
ent
Rec
over
y R
atio
Non
Irr
igat
ion
(R
atio
)
Year
VIDC, NAGPUR Plan Group : Abundant
(Financial Aspect)
Asola Mendha
Dina
State target
80
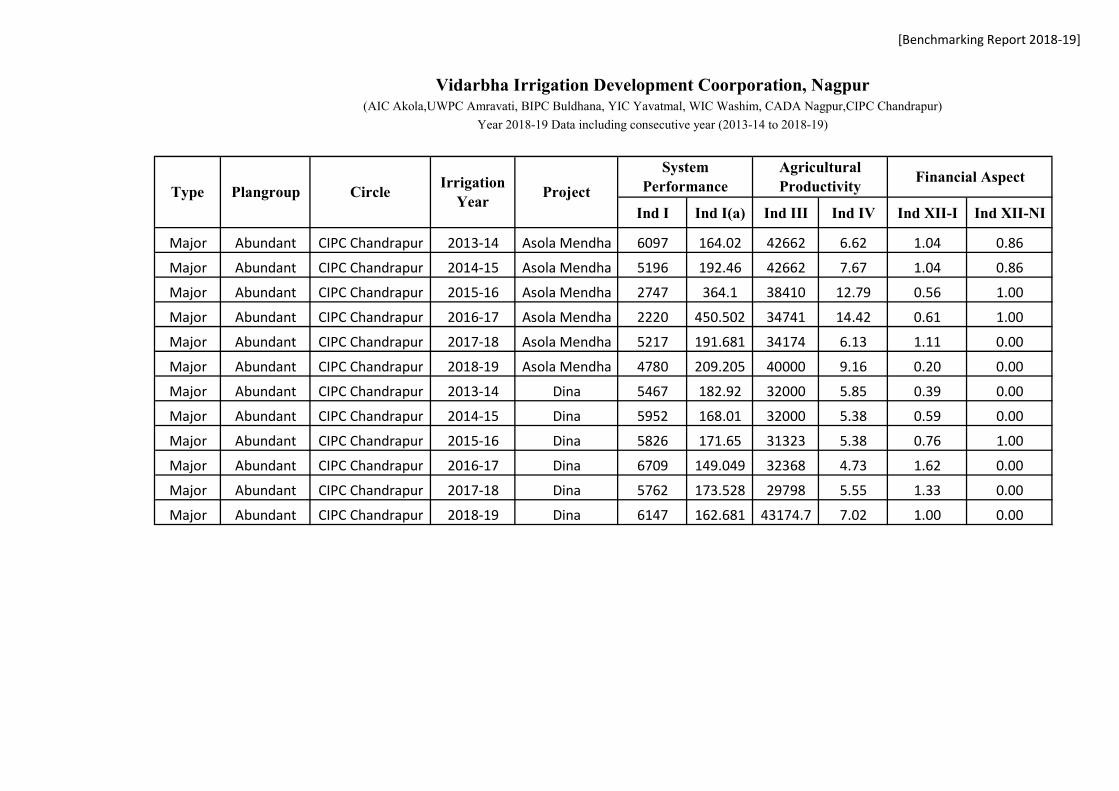
[Benchmarking Report 2018-19]
Vidarbha Irrigation Development Coorporation, Nagpur(AIC Akola,UWPC Amravati, BIPC Buldhana, YIC Yavatmal, WIC Washim, CADA Nagpur,CIPC Chandrapur)
Year 2018-19 Data including consecutive year (2013-14 to 2018-19)
Ind I Ind I(a) Ind III Ind IV Ind XII-I Ind XII-NI
Major Abundant CIPC Chandrapur 2013-14 Asola Mendha 6097 164.02 42662 6.62 1.04 0.86
Major Abundant CIPC Chandrapur 2014-15 Asola Mendha 5196 192.46 42662 7.67 1.04 0.86
Major Abundant CIPC Chandrapur 2015-16 Asola Mendha 2747 364.1 38410 12.79 0.56 1.00
Major Abundant CIPC Chandrapur 2016-17 Asola Mendha 2220 450.502 34741 14.42 0.61 1.00
Major Abundant CIPC Chandrapur 2017-18 Asola Mendha 5217 191.681 34174 6.13 1.11 0.00
Major Abundant CIPC Chandrapur 2018-19 Asola Mendha 4780 209.205 40000 9.16 0.20 0.00
Major Abundant CIPC Chandrapur 2013-14 Dina 5467 182.92 32000 5.85 0.39 0.00
Major Abundant CIPC Chandrapur 2014-15 Dina 5952 168.01 32000 5.38 0.59 0.00
Major Abundant CIPC Chandrapur 2015-16 Dina 5826 171.65 31323 5.38 0.76 1.00
Major Abundant CIPC Chandrapur 2016-17 Dina 6709 149.049 32368 4.73 1.62 0.00
Major Abundant CIPC Chandrapur 2017-18 Dina 5762 173.528 29798 5.55 1.33 0.00
Major Abundant CIPC Chandrapur 2018-19 Dina 6147 162.681 43174.7 7.02 1.00 0.00
Agricultural Productivity
Financial AspectType Plangroup Circle
Irrigation Year
Project
System Performance
81

Visual Depiction [Benchmarking Report 2018-19]
Observations (VIDC, Nagpur: plan group – Abundant)
A. System performance
Indicator 1- Annual Irrigation Water Supply Per Unit Irrigated Area (Cum/Ha)
1. In year 2015-16 and 2016-17, the Asolmendha project has sudden decreases in water supply per unit irrigated area as compare with previous two year and next two year i.e. 2013-14, 2014-15 and 2017-18, 2018-19.
2. It shows that for current year and past five year the water supply per unit irrigated area doesn’t exceed, it’s below the state target.
Indicator 1a- Annual Area Irrigated Per Unit of Water Supply (Ha/Mcum)
1. It is observed that, in year 2015 16 and 2016-17 Asolamendha project has maximum area irrigated. It reached too high above the state target.
2. Dina project shows the satisfactory result and it reached nearly above the state target.
B. Agricultural productivity
Indicator III- Output Per Unit Irrigated Area (Rs/Ha)
1. In middle period, Asolamendha project has minimum agricultural productivity per unit irrigated area and then in year 2018-19, the project has increase in productivity.
2. In year 2018-19, Dina project has maximum productivity as compared to previous all five years.
Indicator IV- Output Per Unit Irrigation Water Supply (Rs/Cum)
1. In year 2015-16 and 2016-17, Asolamendha project has maximum output per unit of water supply.
2. In year 2018-19, there is increase in productivity performance of Dina project as compared with previous five year.
3. Asolamendha project reached slightly above the state target.
C. Financial Aspect
Indicator XII(I)- Assessment Recovery Ratio (Irrigation)
1. In year 2018 19 project has lowest assessment recovery ratio.
Indicator XII(NI)- Assessment Recovery Ratio (Non-Irrigation)
1. Asolamendha and Dina project has no recovery for non-irrigation since last two years. 2. Dina project has only recovery in year 2015-16, it shows a very poor performance.
82

Chapter 5 - Special Investigation of Irrigation Projects
The basic purpose of Special investigation of Irrigation Projects study is to study overall important aspect and find out actual status of irrigation projects. This study covers all important features of irrigation project such as salient features, distribution system, physical condition of canal system, irrigation and non-irrigation details, operation and maintenance cost, major issues faced by project authorities. Major projects – Surya project, Kanher project, Dhom project, Jayakwadi stage I project, Bhandardara project, Shankarraaoji Chavan Vishnupuri project, Khadakwasla Complex project, Girna Project, Upper Wardha Project, Pench Project and medium irrigation projects- Natuwadi project, Wandri project, Malangaon project and Jawalgaon project are selected for this study. Field visits were conducted on these irrigation projects. The numerical data collected from field authorities and observations are recorded by Chief Auditor office team.
The observations on these major and medium projects are tabulated below-
5.1 Major Projects
1. Surya Project-
Sr No Parameters Observations 1. Distribution System a Main canal LBC length-47km (33km lined)
RBC length-65km (65 km lined) b Distributary LBC- 02 nos.- length 14.746 km
RBC-08 nos.-length49 km c Minors LBC- 22 nos.- length 33.405 km
RBC-90 nos.-length147 km 2. Water use (Mm3) 2018-19 a Irrigation Projected = 196.74 Actual = 136.645 b Non irrigation Projected = 72.4 Actual = 72.68
c Evaporation Projected = 22.57 Actual = 21.88 3. Measuring Devices
Main canal/Dy/ Minor Measuring devices are existing on canal system but they are not in working condition.
4. Physical condition of canal system Main canal/Dy/ Minor
Canal lining is damaged, actual C/S of canal is disturbed; siltation and leakage in canal embankment are observed.
5. Status of gates HR/CR/DY/ Minor Gates on main canal /DY /Minor are not properly functioning
6. Last three years Assessment /Recovery/Balance on Irrigation in lakhs
Irrigation Year Assessment Recovery Balance
2016-17 231.342 2.51 228.832 2017-18 239.051 1.484 237.567 2018-19 265.609 0.332 265.277
83

Sr No Parameters Observations 7. Last three years Assessment
/Recovery/Balance on Non irrigation in lakhs
Non irrigation Year Assessment Recovery Balance
2016-17 1883.788 1883.788 0 2017-18 1958.407 1550.445 407.962 2018-19 2782.948 2736.439 46.509
8. Last three years operation /maintenance/ Expenditure cost in lakhs
Year Cost 2016-17 44.25 2017-18 00 2018-19 31.32
9. Overall efficiency of distribution network
Data is not available as no measuring devices are in working condition.
2. Kanher Project- Sr No Parameters Observations
1. Distribution System a Main canal LBC length-212km
RBC length-58 km b Distributary LBC- 14 nos. - length 47.44 km
RBC- 04 nos.- length15.16km c Minors LBC- 74 nos. - length 79.46 km
RBC-46 nos.- length 61.27 km 2. Water use (Mm3) 2018-19 a Irrigation Projected = 266.40 Actual = 251.43 b Non irrigation Projected = 66.55 Actual = 72.68 c Evaporation Projected = 20.11 Actual = 17.27 3. Measuring Devices
Main canal/Dy/ Minor Measuring devices on main canal are not existing and measuring devices present on DY and minor are not properly functioning.
4. Physical condition of canal system Main canal/Dy/ Minor
In some length of canal, lining is damaged, actual C/S of canal is disturbed, siltation is observed leakage in canal embankment at some places is observed in canals.
5. Status of gates HR/CR/DY/ Minor Gates on main canal/DY/Minor are not properly functioning
84

6 Last three years Assessment /Recovery/Balance on Irrigation in lakhs
Irrigation Year Assessment Recovery Balance 2016-17 66.02 46.57 16.25
2017-18 64.31 53.07 11.24 2018-19 17.43 49.63 (-)32.20
7 Last three years Assessment /Recovery/Balance on Non irrigation in lakhs
Non irrigation Year Assessment Recovery Balance 2016-17 3.57 4.82 (-)1.25 2017-18 3.98 1.46 2.52 2018-19 3.85 20.81 (-)16.96
8 Last three years operation /maintenance/ Expenditure cost in lakhs
Year Cost 2016-17 124.85(including Dhom)
2017-18 49.99 2018-19 27.04
9. Overall efficiency of distribution network
Data is not available as no measuring devices are in working condition.
3. Dhom Project-
Sr No Parameters Observations
1. Distribution System a Main canal LBC length-110 km (all lined)
RBC length-66km (all lined) b Distributary LBC 10 nos.- length-82.625 km c Minors LBC- 108 nos.- length 109.725 km
RBC-54 nos.-length 58.22km 2. Water use (Mm3) 2018-19 a Irrigation Projected-214.67 Actual-271.795 b Non irrigation Projected-81.28 Actual-0.601 c Evaporation Projected-27.47 Actual-25.162 3. Measuring Devices
Main canal/Dy/ Minor Measuring devices are existing on canal system but they are not in working condition.
4. Physical condition of canal system Main canal/Dy/ Minor
Canal lining is damaged, actual C/S of canal is disturbed, siltation and leakages in canal embankment are observed.
5. Status of gates HR/CR/DY/ Minor Gates on main canal/DY/minor are not properly functioning.
85

6 Last three years Assessment /Recovery/Balance on Irrigation in lakhs
Irrigation Year Assessment Recovery Balance
2016-17 --- --- --- 2017-18 80.68 65.56 15.12 2018-19 25.17 93.43 -68.26
7 Last three years Assessment /Recovery/Balance on Non irrigation in lakhs
Non irrigation Year Assessment Recovery Balance 2016-17
--- --- ---
2017-18
193.04 204.39 -11.35
2018-19
365.19 468.05 -102.86
8 Last three years operation /maintenance/ Expenditure cost in lakhs
Year Cost 2016-17 --- 2017-18 49.00 2018-19 117.50
9. Overall efficiency of distribution network
Data is not available as no measuring devices are in working condition
4. Jayakwadi Project Stage I-
Sr No Parameters Observations 1. Distribution System a Main canal LBC length-208 km (All Lined)
RBC length- 132 km (All Unlined) b Distributary- 46 nos.- length 285.681 km c Minor 259 nos.- length 672.146 km 2. Water use (Mm3) 2018-19 a Irrigation Projected -1801.59 Actual-1994.151 b Non irrigation Projected - 56.96 Actual- 231.619 c Evaporation Projected - 323.10 Actual-245.636 3. Irrigation a. Canal Projected Actual Kharif 7082 6079 Rabbi 72236 8826 HW 2833 0 T.S. 53114 9125 Perennials 6375 13578
b. Lift Projected Actual Kharif - 678 Rabbi - 5686 HW - 164
86

T.S. - 1811 Perennials - 7986
3. Measuring Devices Main canal/Dy/ Minor
270 no of measuring devices are actually present and only 2 measuring devices are in working condition.
4. Physical condition of canal system Main canal/Dy/ Minor
) Main canal/ Branches: Lining of canal is damaged at many chainages throughout the length of canal and hence discharge is decreased.
100.80 63.71
62.30 28.32
5. Status of gates HR/CR/DY/ Minor 3013
1036 gates are
not working or totally damage.
6 Last three years Assessment /Recovery/Balance on Irrigation in lakhs
Year Assessment Recovery Balance
2016-17 811.73 64.01 7256.22 2017-18 790.86 196.42 7383.92 2018-19 588.06 64.93 7211.95
7 Last three years Assessment /Recovery/Balance on Non irrigation in lakhs
Year Assessment Recovery Balance
2016-17 9141.18 3221.36 17253.99
2017-18 3293.84 3284.01 17415.75
2018-19 29665.33 7394.16 26424.2
87

8 Last three years operation /maintenance/ Expenditure cost in lakhs
Year Cost 2016-17 2604.23 2017-18 2117.65 2018-19 2001.09
9. Overall efficiency of distribution network
Actual efficiency is low due to damage distribution network.
5. Bhandardara Project-
Sr No Parameters Observations 1. Distribution System a Main canal LBC length -76.8 km (7.5 km lined)
RBC length - 44.8 km (04 km lined) b Distributary 23 nos. - length 153.4 km c Minors 33 nos. - length 109.9 km 2. Water use (Mm3) 2018-19 a Irrigation Projected = 33.97 Actual = 243.785 b Non irrigation Projected = 0 Actual = 55.392 c Evaporation Projected = 12.74 Actual =16.92 3. Measuring Devices
Main canal/Dy/ Minor 141 no. of measuring devices are required on Main canal/Dy/ Minor but only 34 no. of measuring devices are existing on the system, out of them 31 are in working condition.
4. Physical condition of canal system Main canal/Dy/ Minor
As canal system is 100 years old the embankment of canal section becomes weak.
5. Status of gates HR/CR/DY/ Minor
Almost Gates on main canal/DY/Minor are properly /moderately functioning, only 3 gates on DY and 24 gates on minor are non-functioning.
6 Last three years Assessment /Recovery/Balance on Irrigation in lakhs
Irrigation Year Assessment Recovery Balance 2016-17 34.7 87.08 327.97 2017-18 61.65 72.41 317.21 2018-19 85.22 113.36 289.07
7 Last three years Assessment /Recovery/Balance on Non irrigation in lakhs
Non irrigation Year Assessment Recovery Balance 2016-17 349.98 324.63 389.44 2017-18 263.30 282.73 370.01 2018-19 445.46 448.94 366.53
88

8 Last three years operation /maintenance/ Expenditure cost in lakhs
Year Cost 2016-17 125.5 2017-18 67.73 2018-19 91.53
9. Overall efficiency of distribution network
Low efficiency is observed due to percolation loss through canal.
6. Shankarraaoji Chavan Vishnupuri project –
Sr No Parameters Observations 1. Distribution System a Main canal RBC length-49 km b Distributary RBC- 13 nos.- length 99.20km c Minor RBC- 65 nos.- length 118.88 km 2. Water use (Mm3) 2018-19 a Irrigation Projected-135.56 Actual-65.439 b Non irrigation Projected-56.96 Actual-32.124 c Evaporation Projected-18.04 Actual-14.458 3. Measuring Devices Main
canal/Dy/ Minor 8 no of measuring devices are existing on canal system Main canal/Dy/ Minor but only 2 no. of measuring devices are in working condition.
4. Physical condition of canal system Main canal/Dy/ Minor
Canal lining is broken at many places, bushes grown up at joints of lining panel, growth of weeds, heavy siltation, heavy leakages through canal structures is observed in Main canal/Dy/ Minor. Canals cannot carry design discharge.
5. Status of gates HR/CR/DY/ Minor
26 no of Gates on main canal/147 no of gates DY/646 no of gates on Minor are properly or moderately functioning and 150 no of gates on above system are not functioning.
6 Last three years Assessment /Recovery/Balance on Irrigation in lakhs
Irrigation Year Assessment Recovery Balance
2016-17 813.36 10.70 802.66 2017-18 841.04 23.22 817.82 2018-19 968.55 16.08 952.47
7 Last three years Assessment /Recovery/Balance on Non irrigation in lakhs
Non irrigation Year Assessment Recovery Balance
2016-17 474.15 135.09 339.06 2017-18 636.53 178.07 458.46 2018-19 837.37 189.69 647.68
89

8 Last three years operation /maintenance/ Expenditure cost in lakhs
Year Cost 2016-17 6.593 2017-18 7.372 2018-19 5.923
9. Overall efficiency of distribution network
79% of Overall efficiency is observed, but due to low efficiency of electric pumps, bad condition of distribution network and unauthorized connections the efficiency of system is reduced.
7. Khadakwasla Complex Project-
Sr No Parameters Observations 1. Distribution System a Main canal LBC ,length-28km (Not in use due to
urbanization) RBC - OMRBC length-111 km (unlined) (Recycled waste water of Pune city is utilized for irrigation) -NMRBC length-202km
b. Branch No.6, length -84.66 km b Distributary/ Minor No.64, length- 413.74km 2. Water use (Mm3) 2018-19 a Irrigation Projected- 638.50 Actual-607.78 b Non irrigation Projected-235.01 Actual-423.276 c Evaporation Projected- 82.69 Actual-45.449 3. Measuring Devices
Main canal/Dy/ Minor Measuring devices are existing on main canal/Dy/ minor but they are not in working condition.
4. Physical condition of canal system Main canal/Dy/ Minor
Unlined canals, damaged outlets, disturbed C/S of canal, growth of vegetation (garbage and debris) is observed on canal system.
5. Status of gates HR/CR/DY/ Minor
Gates on main canal/Dy/Minor are not properly functioning. Unlined outlets need repair and growth of vegetation observed.
6 Last three years Assessment /Recovery/Balance on Irrigation in lakhs
Irrigation Year Assessment Recovery Balance 2016-17 167.18 173.95 938.87 2017-18 289.36 220.08 978.59 2018-19 382.74 254.71 1106.62
90

7 Last three years Assessment /Recovery/Balance on Non irrigation in lakhs
Non irrigation Year Assessment Recovery Balance 2016-17 7656.03 7604.17 4728.87 2017-18 11162.06 10167.09 5495.37 2018-19 15140.04 22127.02 11616.01
8 Last three years operation /maintenance/ Expenditure cost in lakhs
Year Cost 2016-17 246.48 2017-18 454.93 2018-19 594.45
9. Overall efficiency of distribution network
Data is not available as no measuring devices are in working condition.
8. Upper Wardha Project-
Sr No Parameters Observations 1. Distribution System a Main canal LBC length - 42.40 km (All lined)
RBC length - 95.50 km (All lined) b Distributary- 12 nos. - length 261.011km c Minors /Sub-minors 479 nos. - length 827.32 km 2. Water use (Mm3) 2018-19 a Irrigation Projected = 200.20 Actual = 131.79 b Non irrigation Projected = 168.27 Actual = 62.46 c Evaporation Projected = 68.535 Actual = 75.189 3. Measuring Devices
Main canal/Dy/ Minor Measuring devices are existing on canal system but they are not in working condition.
4. Physical condition of canal system Main canal/Dy/ Minor
Distribution network is very old and heavy leakages are observed.
5. Status of gates HR/CR/DY/ Minor
Gates on main canal/DY/Minor are not properly functioning.
6 Last three years Assessment /Recovery/Balance on Irrigation in lakhs
Irrigation Year Assessment Recovery Balance 2016-17 50.436 38.812 123.911 2017-18 58.981 61.327 121.565 2018-19 59.870 48.782 132.653
7 Last three years Assessment /Recovery/Balance on Non irrigation in lakhs
Non irrigation Year Assessment Recovery Balance 2016-17 935.462 926.088 105.830 2017-18 1186.917 1197.765 94.982 2018-19 1507.874 1560.591 42.265
91

8 Last three years operation /maintenance/ Expenditure cost in lakhs
Year Cost 2016-17 44.25 2017-18 40.00 2018-19 190.89
9. Overall efficiency of distribution network
RBC- Rabi-78% LBC- Rabi-79%
9. Pench Project- Sr No Parameters Observations
1. Distribution System a Main canal LBC length- 32.85 km (All lined)
RBC length- 48.40 km (All lined) b Distributary- LBC length 248.81km
RBC length 91.74 km c Minors /Sub minors LBC length 888.45 km
RBC length 215.79 km 2. Water use (Mm3) 2018-19 a Irrigation Projected = 684 Actual = 279.719 b Non irrigation Projected = 195.54 Actual = 226.06 c Evaporation Actual = 91.513 3. Measuring Devices
Main canal/Dy/ Minor All Measuring devices existing on Main canal/Dy/Minor are in working condition.
4. Physical condition of canal system Main canal/Dy/ Minor
All main canals and branches are in good condition. Also Lining work is in progress.
5. Status of gates HR/CR/DY/ Minor
Almost all Gates on main canal/DY/Minor are properly functioning.
6 Last three years Assessment /Recovery/Balance on Irrigation in lakhs
Irrigation Year Assessment Recovery Balance 2016-17 301.94 271.07 616.59 2017-18 183.13 157.54 642.18 2018-19 73.03 101.71 613.50
7 Last three years Assessment /Recovery/Balance on Non irrigation in lakhs
Non irrigation Year Assessment Recovery Balance 2016-17 1827.49 1765.10 356.43 2017-18 2371.78 1848.52 879.69 2018-19 3067.76 2113.32 1936.50
8 Last three years operation /maintenance/ Expenditure cost in lakhs
Year Cost 2016-17 NILL 2017-18 764.06 2018-19 1033.80
9. Overall efficiency of distribution network
RBC- Rabi- 50% LBC- Rabi- 60%
92

5.2 Medium Project
1. Natuwadi Project-
Sr No Parameters Observations 1. Distribution System a Main canal LBC length-12 km (31.70 km lined)
RBC length-24 km (14.50 km lined) b Distributary 02 nos.- length 11.2 km 2. Water use (Mm3) 2018-19 a Irrigation Projected - 27.23 Actual - 14.294 b Non- Irrigation Actual – 0.692 c Evaporation Projected - 2.223 Actual - 0.992 3. Measuring Devices
Main canal/Dy/ Minor 06 Measuring devices are existing on canal system all are in working condition.
4. Physical condition of canal system Main canal/Dy/ Minor
Distribution system is in good condition, no leakages are observed
5. Status of gates HR/CR/DY/ Minor
All gates on main canal/DY/Minor are properly functioning
6 Last three years Assessment /Recovery/Balance on Irrigation in lakhs
Irrigation Year Assessment Recovery Balance
2016-17 0.813 1.779 1.491 2017-18 1.664 1.884 14.690 2018-19 1.797 1.580 14.907
7 Last three years Assessment /Recovery/Balance on Non irrigation in lakhs
Non irrigation Year Assessment Recovery Balance
2016-17 3.193 3.193 00 2017-18 2.850 2.850 00 2018-19 6.526 6.526 00
8 Last three years operation /maintenance/ Expenditure cost in lakhs
Year Cost 2016-17 476.57 2017-18 79.32 2018-19 162.62
9. Overall efficiency of distribution network
Canal are carrying discharge at low capacity.
93

2. Wandri Project-
Sr No Parameters Observations 1. Distribution System a Main canal LBC length-12 km (unlined)
RBC length-8km (unlined) b Minors LBC- 20 nos.- length 21.41 km
RBC-08 nos.-length10.283 km 2. Water use (Mm3) 2018-19 a Irrigation Projected-29.536 Actual-25.255 b Non irrigation Projected- 0 Actual-0 c Evaporation Projected-5.23 Actual-5.23 3. Measuring Devices
Main canal/Dy/ Minor Out of required 39 no of measuring devices on Main canal/Dy/ Minor 02 no of devices are existing on canal system but no measuring device is in working condition.
4. Physical condition of canal system Main canal/Dy/ Minor
Disturbed and unlined canal section, heavy leakages earthen portion and structures are observed
5. Status of gates HR/CR/DY/ Minor
Gates are not present on main canal/DY/Minor
6 Last three years Assessment /Recovery/Balance on Irrigation and non-irrigation in lakhs
Irrigation Year Assessment Recovery Balance
2016-17 65.222 1.791 63.431 2017-18 68.499 1.003 67.496 2018-19 77.702 1.165 76.537
8 Last three years operation /maintenance/ Expenditure cost in lakhs
Year Cost 2016-17 6.46 2017-18 0 2018-19 4.2
9. Overall efficiency of distribution network
Low efficiency is observed due to high porosity through earthen canal field to field irrigation and irrigation use for rice crops.
3. Malangaon Medium Project-
Sr No Parameters Observations
1. Distribution System a Main canal LBC length-25.60 km b Distributary 22 nos. - length 26.45 km 2. Water use (Mm3) 2018-19 a Irrigation Projected-11.33 Actual-3.728
94

b Non irrigation Projected-0 Actual-3.245 c Evaporation Projected-2.293 Actual-4.355 3. Measuring Devices
Main canal/Dy/ Minor 02 no. of measuring devices are required on Main canal/Dy/ Minor Out of that 01 no. of devices are in working condition.
4. Physical condition of canal system Main canal/Dy/ Minor
Canal system is 50 years old so embankment is settled.
5. Status of gates HR/CR/DY/ Minor
Only 02 gate on main canal is properly/moderately functioning. No gates on DY/Minor are not present.
6 Last three years Assessment /Recovery/Balance on Irrigation in lakhs
Irrigation Year Assessment Recovery Balance
2016-17 2.84 2.09 12.66 2017-18 2.44 1.96 13.14 2018-19 2.11 2.03 13.22
7 Last three years Assessment /Recovery/Balance on Non irrigation in lakhs
Non irrigation Year Assessment Recovery Balance
2016-17 12.73 0.7 20.46 2017-18 3.29 4.89 18.86 2018-19 20.13 17.42 21.57
8 Last three years operation /maintenance/ Expenditure cost in lakhs
Year Cost 2016-17 30.15 2017-18 5.25 2018-19 0
9. Overall efficiency of distribution network
Data is not available
4. Jawalgaon Medium Project-
Sr No Parameters Observations 1. Distribution System a Main canal LBC length-31 km (8.8 km lined) b Distributary- LBC 14 nos.- length - 28.385 km c Minors LBC 4 nos. length- 7 km 2. Water use (Mm3) 2018-19 a Irrigation Projected-20.96 Actual-10.61 b Non irrigation Projected-4.25 Actual-0.214 c Evaporation Projected-6.18 Actual-3.338
95

3. Measuring Devices Main canal/Dy/ Minor
Out of required 23 nos. of measuring devices on Main canal/Dy/ Minor 08 number of devices are existing on canal system but no measuring devices are in working condition.
4. Physical condition of canal system Main canal/Dy/ Minor
Due to unlined canals growth of shrubs and bushes are observed.
5. Status of gates HR/CR/DY/ Minor
09 gates on main canal/DY are moderately functioning and 04 gates are not functional.
6 Last three years Assessment /Recovery/Balance on Irrigation in lakhs
Irrigation Year Assessment Recovery Balance 2016-17 8.93 0.61 8.32 2017-18 13.75 12.62 1.13 2018-19 --- --- ----
7 Last three years Assessment /Recovery/Balance on Non irrigation in lakhs
Non irrigation Year Assessment Recovery Balance 2016-17 6.4 0 6.4 2017-18 6.4 0 6.4 2018-19 --- --- ----
8 Last three years operation /maintenance/ Expenditure cost in lakhs
Year Cost 2016-17 10.0 2017-18 14.1 2018-19 17.5
9. Overall efficiency of distribution network
Data is not available
5.3 Findings:
Actual water use on major and medium project is comparatively less than projected water uses and overall efficiency of irrigation project is less and the reasons are listed below –
1. Poor Annual maintenance of canals specially with respect to excessive weed growth, damaged lining, no provision of lining even though critically required.
2. Damaged structures on canal distribution network hindering the full design capacity of canal.
3. Actual water uses available for irrigation use through canal distribution network cannot be calculated due to damaged/ lack of measuring devices.
96

[Benchmarking Report 2018-19]
97
Chapter 6 - Annexure
Methodology: Benchmarking of Major and Medium Project
This report incorporates 53 Major and 187 Medium projects for the year 2018-19 in this
annexure as per the availability of data.
The data presented in this report is based upon information collected from each of the circle
office in-charge the project.
The data about water use and area irrigated is corrected with water accounts of 2018-19 of
relevant projects which is the base for benchmarking calculations.
The presentation for every indicator is done with past (5 year), displaying five years average
values and special comparison with its last year indicator value 2017-18, including the current
year 2018-19 in order to compare the performance with predecessors as well as own
performance.
Based on performance for 2018-19, review has been done for the five-plan group under
consideration (highly deficit, deficit, normal, surplus and abundant as per its water availability)
For financial indicator of output per unit irrigated area and output per unit irrigation water
supply, prices of 1998-99 are considered to obviate effect of price rise.
With due Consideration of previous experience regarding the implementation of
Benchmarking as an effective tool it was decided to do the Benchmarking of Major and
Medium Projects ProjectWise; hence this annexure is added here with only datasheets and its
graphs will not be included henceforth.
Note:
Government of Maharashtra, Water Resources Department vide Letter No. CDA 1004/ (369/2004) CAD (works), Dated
08.11.2004 issued guidelines while preparing Benchmarking Report and Subsequently, additional instructions were issued
vide letter no. CDA 1004/ (369/2004) CAD – works dated 2.9.2005.
As per GR CDA-2010/ (543/10) DT-22/01/2013 the new two indicators are added from this current year, they are
incorporated in Annexure of Major and Medium Projects.
The * values shown in indicators I to Indicator XIV of major and medium projects in annexure are found absurd due to
non-realistic data of that respective project.

[Benchmarking Report 2018-19]
Plan group Circle Project FY Avg LY 2017-18 TY 2018-19 Past Max Past Min State Tar
Highly Deficit CADA Solapur Bhima 6627.00 4003.00 4740.00 7398.37 4003.18 7692.00
CADA Nashik Chanakapur 2637.00 2925 0.00 3539.91 0.00 7692.00
CADA Jalgaon Girna 10388.00 11555.00 5542.00 15103.36 2632.35 7692.00
CADA Abad Jayakwadi (PLBC) 14207.00 16722.00 13838.00 16721.99 10550.89 7692.00
CADA Beed Jayakwadi PRBC 4862.00 7098.00 8501.00 7098.19 0.00 7692.00
AIC Akola Katepurna 5802.00 0.00 4289.00 14920.22 0.00 7692.00
BIPC Buldhana Khadakpurna 6831.00 5940.00 1111.00 11169.84 4238.50 7692.00
CADA Beed Lower Terna 4400.00 4217.00 7292.00 16429.41 0.00 7692.00
CADA Beed Majalgaon 6422.00 9916.00 6842.00 9916.01 0.00 7692.00
NIC Nanded Manar 6885.00 2880.00 7513.00 10000.00 2879.69 7692.00
CADA Beed Manjra 8304.00 10575.00 4463.00 10575.35 0.00 7692.00
AIC Akola Nalganga 5429.00 5025.00 480.00 6399.35 5024.53 7692.00
NIC Nanded Purna 11187.00 2779.00 7064.00 18108.81 2778.78 7692.00
NIC Nanded Vishnupuri 6113.00 7785.00 4060.00 7785.14 5035.64 7692.00
BIPC Buldhana Wan (Amravati) 7046.00 1151.00 1440.00 14936.81 1150.58 7692.00
YIC Yavatmal Arunavati 17750.00 5405.00 4992.00 23219.06 5404.65 7692.00
CADA Nashik Bhandardara 11209.00 14958.00 11080.00 14958.42 7536.31 7692.00
CIPC Chandrapur Bor 11996.00 14446.00 11789.00 14446.21 10460.32 7692.00
PIC Pune Chaskaman 14508.00 17758.00 9632.00 17758.09 10242.93 7692.00
CADA Nashik Darna 8638.00 9557.00 8503.00 9798.74 7626.13 7692.00
CADA Nashik Gangapur 7078.00 10092.00 7834.00 10091.67 3172.97 7692.00
CADA Pune Ghod 7267.00 7933.00 8475.00 7933.12 5366.67 7692.00
CADA Jalgaon Hatnur 8965.00 8391.00 8049.00 10559.18 7607.46 7692.00
CADA Nashik Kadva 4924.00 1152.00 11001.00 17434.73 1152.19 7692.00
PIC Pune Khadakwasla 19556.00 24979.00 13749.00 30060.04 11500.46 7692.00
CADA Pune Kukadi 7525.00 9600.00 6469.00 9600.23 4421.21 7692.00
CADA Nagpur Lower Wunna 15266.00 21394.00 16175.00 21394.28 13861.67 7692.00
CADA Nashik Mula 7231.00 7919.00 4741.00 9741.16 3489.22 7692.00
PIC Pune NLBC 11029.00 12839.00 9667.00 14776.49 8879.17 7692.00
AIC Abad NMC Express Mukane 4682.00 5762.00 2931.00 7323.71 0.00 7692.00
PIC Pune NRBC 7549.00 6271.00 7151.00 9419.83 6270.94 7692.00
CADA Nashik Palkhed 8811.00 7113.00 2490.00 10213.69 7113.47 7692.00
PIC Pune Pawana 8340.00 7525.00 7359.00 47793.58 4778.92 7692.00
AIC Akola Pus 9086.00 0.00 6622.00 16927.26 0.00 7692.00
CADA Nashik UGC Ozerkhed 8010.00 7998.00 2735.00 9215.23 4913.01 7692.00
CADA Nashik UGC(Punegaon) 5264.00 6233.00 4303.00 7314.83 2429.01 7692.00
CADA Nashik UGC(Tisgaon) 5753.00 6684.00 3805.00 8100.25 4099.28 7692.00
NIC Nanded Upper Penganga 10930.00 4263.00 15077.00 15399.78 4262.75 7692.00
UWPC Amravati Upper Wardha 6444.00 7476.00 1615.00 9844.52 2907.24 7692.00
CADA Nashik Waghad 7519.00 6446.00 3158.00 11347.31 4889.58 7692.00
CADA Nagpur Bagh 6758.00 1878.00 3005.00 10626.38 1878.32 7692.00
CADA Nagpur Itiahdoh 8443.00 3858.00 9597.00 11808.77 3857.78 7692.00
CADA Nagpur Pench 7943.00 3404.00 4372.00 9698.36 3404.28 7692.00
CIPC Chandrapur Asola Mendha 4278.00 5217.00 4780.00 6096.88 2219.75 7692.00
TIC Thane Bhatsa 12935.00 6422.00 7689.00 41759.63 6422.43 7692.00
CIPC Chandrapur Dina 5944.00 5762.00 6147.00 6709.17 5467.00 7692.00
SIC Sangli Dudhganga 12171.00 10974.00 11657.00 17618.53 9053.40 7692.00
CADA Pune Krishna 12505.00 11191.00 14215.00 14215.48 9510.25 7692.00
SIC Sangli Radhanagari 8226.00 10825.00 12757.00 12846.74 6345.38 7692.00
TIC Thane Surya 20267.00 13686.00 11452.00 54411.81 13686.40 7692.00
SIC Sangli Tulashi 6888.00 7042.00 7697.00 12213.63 6288.84 7692.00
SIC Sangli Warna 5570.00 3632.00 5080.00 7210.77 3632.43 7692.00
SIC Sangli Warna LIS 5719.00 4939.00 4294.00 6430.08 4938.92 7692.00
Abundant
Indicator IMajor Projects
Annual Irrigation Water Supply per unit Irrigated Area (cum/ha)
Deficit
Normal
Surplus
98

[Benchmarking Report 2018-19]
Plan group Circle Project FY Avg LY 2017-18 TY 2018-19 Past Max Past Min State Tar
Highly Deficit CADA Solapur Bhima 150.90 249.81 210.97 249.80 135.16 130.00
CADA Nashik Chanakapur 379.22 341.88 0.00 1292.86 0.00 130.00
CADA Jalgaon Girna 96.26 86.54 180.44 379.89 66.21 130.00
CADA Abad Jayakwadi (PLBC) 70.39 59.80 72.26 94.78 59.80 130.00
CADA Beed Jayakwadi PRBC 205.68 140.88 117.63 749.08 0.00 130.00
AIC Akola Katepurna 172.35 0.00 233.15 284.93 0.00 130.00
BIPC Buldhana Khadakpurna 146.39 168.35 * 900.09 235.93 89.53 130.00
CADA Beed Lower Terna 227.27 237.14 137.14 277.89 0.00 130.00
CADA Beed Majalgaon 155.71 100.85 146.16 432.56 0.00 130.00
NIC Nanded Manar 145.24 347.22 133.10 347.26 100.00 130.00
CADA Beed Manjra 120.42 94.56 224.06 161.47 0.00 130.00
AIC Akola Nalganga 184.20 199.00 * 2083.33 199.02 156.27 130.00
NIC Nanded Purna 89.39 359.84 141.56 359.87 55.22 130.00
NIC Nanded Vishnupuri 163.59 128.45 246.31 198.58 128.45 130.00
BIPC Buldhana Wan (Amravati) 141.92 * 868.81 * 694.44 869.13 66.95 130.00
YIC Yavatmal Arunavati 56.34 185.01 200.32 185.03 43.07 130.00
CADA Nashik Bhandardara 89.21 66.85 90.25 132.69 66.85 130.00
CIPC Chandrapur Bor 83.36 69.22 84.82 95.60 69.22 130.00
PIC Pune Chaskaman 68.93 56.31 103.82 97.63 56.31 130.00
CADA Nashik Darna 115.77 104.64 117.61 131.13 102.05 130.00
CADA Nashik Gangapur 141.28 99.09 127.65 315.16 99.09 130.00
CADA Pune Ghod 137.61 126.06 117.99 186.34 126.05 130.00
CADA Jalgaon Hatnur 111.54 119.18 124.24 131.45 94.70 130.00
CADA Nashik Kadva 203.09 868.06 90.90 867.91 57.36 130.00
PIC Pune Khadakwasla 51.14 40.03 72.73 86.95 33.27 130.00
CADA Pune Kukadi 132.89 104.17 154.58 226.18 104.16 130.00
CADA Nagpur Lower Wunna 65.51 46.74 61.82 72.14 46.74 130.00
CADA Nashik Mula 138.29 126.28 210.93 286.60 102.66 130.00
PIC Pune NLBC 90.67 77.89 103.44 112.62 67.68 130.00
AIC Abad NMC Express Mukane 213.58 173.55 341.18 232.06 0.00 130.00
PIC Pune NRBC 132.47 159.46 139.84 159.47 106.16 130.00
CADA Nashik Palkhed 113.49 140.59 * 401.61 140.58 97.91 130.00
PIC Pune Pawana 119.90 132.89 135.89 209.25 20.92 130.00
AIC Akola Pus 110.06 0.00 151.01 141.37 0.00 130.00
CADA Nashik UGC Ozerkhed 124.84 125.03 365.63 203.54 108.52 130.00
CADA Nashik UGC(Punegaon) 189.97 160.44 232.40 411.69 136.71 130.00
CADA Nashik UGC(Tisgaon) 173.82 149.61 262.81 243.95 123.45 130.00
NIC Nanded Upper Penganga 91.49 234.58 66.33 234.59 64.94 130.00
UWPC Amravati Upper Wardha 155.18 133.76 * 619.2 343.97 101.58 130.00
CADA Nashik Waghad 133.00 155.13 316.66 204.52 88.13 130.00
CADA Nagpur Bagh 147.97 * 532.48 332.78 532.39 94.11 130.00
CADA Nagpur Itiahdoh 118.44 259.20 104.20 259.22 84.68 130.00
CADA Nagpur Pench 125.90 293.77 228.73 293.75 103.11 130.00
CIPC Chandrapur Asola Mendha 233.75 191.68 209.21 450.50 164.02 130.00
TIC Thane Bhatsa 77.31 155.71 130.06 155.70 23.95 130.00
CIPC Chandrapur Dina 168.24 173.55 162.68 182.92 149.05 130.00
SIC Sangli Dudhganga 82.16 91.12 85.79 110.46 56.76 130.00
CADA Pune Krishna 79.97 89.36 70.35 105.15 70.35 130.00
SIC Sangli Radhanagari 121.57 92.38 78.39 157.60 77.84 130.00
TIC Thane Surya 49.34 73.07 87.32 73.07 18.38 130.00
SIC Sangli Tulashi 145.18 142.01 129.92 159.01 81.88 130.00
SIC Sangli Warna 179.53 275.33 196.85 275.30 138.68 130.00
SIC Sangli Warna LIS 174.86 202.47 232.88 202.47 155.52 130.00
Abundant
Indicator IaMajor Projects
Annual Area Irrigated per unit of Water Supply (ha/Mcum)
Deficit
Normal
Surplus
99

[Benchmarking Report 2018-19]
Plan group Circle Project FY Avg LY 2017-18 TY 2018-19 Past Max Past Min State Tar
Highly Deficit CADA Solapur Bhima 0.81 1.01 0.93 1.07 0.31 1.00
CADA Nashik Chanakapur 1.09 1.79 0.49 1.81 0.22 1.00
CADA Jalgaon Girna 2.39 3.45 0.00 3.45 0.00 1.00
CADA Abad Jayakwadi (PLBC) 0.00 0.00 0.74 0.00 0.00 1.00
CADA Beed Jayakwadi PRBC 0.50 0.21 0.23 0.21 0.00 1.00
AIC Akola Katepurna 0.51 0.01 0.70 4.49 0.00 1.00
BIPC Buldhana Khadakpurna 0.44 0.29 0.00 0.89 0.00 1.00
CADA Beed Lower Terna 0.37 1.00 0.34 1.00 0.00 1.00
CADA Beed Majalgaon 0.57 0.16 0.00 1.72 0.00 1.00
NIC Nanded Manar 0.52 0.10 3.09 1.19 0.00 1.00
CADA Beed Manjra 0.19 0.38 0.03 0.38 0.00 1.00
AIC Akola Nalganga 0.18 0.25 0.00 0.49 0.00 1.00
NIC Nanded Purna 0.63 0.42 0.23 1.69 0.13 1.00
NIC Nanded Vishnupuri 1.25 0.83 0.87 3.55 0.00 1.00
BIPC Buldhana Wan (Amravati) 0.36 0.31 1.24 0.60 0.26 1.00
YIC Yavatmal Arunavati 0.53 0.15 1.00 0.85 0.15 1.00
CADA Nashik Bhandardara 3.12 2.92 3.28 4.68 2.81 1.00
CIPC Chandrapur Bor 0.66 0.43 0.56 0.91 0.43 1.00
PIC Pune Chaskaman 0.65 1.11 1.02 1.11 0.49 1.00
CADA Nashik Darna 3.60 3.68 4.66 6.61 2.75 1.00
CADA Nashik Gangapur 6.28 3.51 5.04 16.07 3.51 1.00
CADA Pune Ghod 1.30 1.40 1.30 1.75 0.74 1.00
CADA Jalgaon Hatnur 3.24 3.34 4.56 3.94 2.54 1.00
CADA Nashik Kadva 2.35 7.75 1.47 7.75 1.01 1.00
PIC Pune Khadakwasla 1.08 1.24 1.46 1.30 0.77 1.00
CADA Pune Kukadi 0.85 1.00 1.64 1.00 0.52 1.00
CADA Nagpur Lower Wunna 1.94 1.35 0.89 134.57 1.35 1.00
CADA Nashik Mula 0.33 0.98 2.47 3.88 0.00 1.00
PIC Pune NLBC 2.61 3.78 3.70 3.78 1.87 1.00
AIC Abad NMC Express Mukane 0.82 0.61 1.00 1.00 0.61 1.00
PIC Pune NRBC 1.47 1.54 5.18 1.66 1.25 1.00
CADA Nashik Palkhed 1.84 2.79 0.63 3.14 1.15 1.00
PIC Pune Pawana 0.79 0.84 2.06 0.84 0.73 1.00
AIC Akola Pus 0.41 0.00 0.79 0.61 0.00 1.00
CADA Nashik UGC Ozerkhed 2.38 1.57 1.11 9.84 1.45 1.00
CADA Nashik UGC(Punegaon) 2.03 1.22 0.55 11.14 1.03 1.00
CADA Nashik UGC(Tisgaon) 1.61 1.65 1.67 2.05 1.41 1.00
NIC Nanded Upper Penganga 1.59 4.46 1.38 6.04 0.87 1.00
UWPC Amravati Upper Wardha 0.63 0.49 1.09 1.24 0.42 1.00
CADA Nashik Waghad 1.61 1.20 1.80 12.25 1.20 1.00
CADA Nagpur Bagh 1.00 1.00 1.00 1.00 1.00 1.00
CADA Nagpur Itiahdoh 1.00 1.00 0.72 1.00 1.00 1.00
CADA Nagpur Pench 1.07 0.92 0.72 1.16 0.92 1.00
CIPC Chandrapur Asola Mendha 0.99 0.94 1.16 1.00 0.94 1.00
TIC Thane Bhatsa 0.46 0.72 0.60 0.72 0.20 1.00
CIPC Chandrapur Dina 0.92 1.07 0.87 1.07 0.87 1.00
SIC Sangli Dudhganga 0.94 0.53 0.56 1.09 0.53 1.00
CADA Pune Krishna 1.28 1.67 1.16 1.67 1.14 1.00
SIC Sangli Radhanagari 1.39 1.69 1.68 1.69 1.08 1.00
TIC Thane Surya 0.41 0.95 0.96 0.95 0.00 1.00
SIC Sangli Tulashi 1.07 0.82 0.78 1.26 0.80 1.00
SIC Sangli Warna 0.72 0.99 0.72 0.99 0.45 1.00
SIC Sangli Warna LIS 1.13 1.14 1.15 1.26 1.06 1.00
Abundant
Indicator IIMajor Projects
Potential Utilised and Created
Deficit
Normal
Surplus
100

[Benchmarking Report 2018-19]
Plan group Circle Project FY Avg LY 2017-18 TY 2018-19 Past Max Past Min State Tar
Highly Deficit CADA Solapur Bhima 48451.00 26066.00 228545.00 57331.60 26065.78 23000.00
CADA Nashik Chanakapur 21224.00 18744 14550.00 28597.39 14472.10 23000.00
CADA Jalgaon Girna 35791.00 42427.00 35062.00 54524.83 24148.29 23000.00
CADA Abad Jayakwadi (PLBC) 0.00 0.00 74124.00 0.00 0.00 23000.00
CADA Beed Jayakwadi PRBC 35933.00 55871.00 37622.00 55871.45 0.00 23000.00
AIC Akola Katepurna 60646.00 205395.00 23321.00 205394.90 19699.66 23000.00
BIPC Buldhana Khadakpurna 351083.00 160000.00 0.00 1424357.84 43047.91 23000.00
CADA Beed Lower Terna 13565.00 8422.00 17509.00 66858.81 0.00 23000.00
CADA Beed Majalgaon 16321.00 101368.00 0.00 270976.97 0.00 23000.00
NIC Nanded Manar 22630.00 18940.00 32394.00 58733.12 18939.60 23000.00
CADA Beed Manjra 69135.00 54974.00 61199.00 100630.24 0.00 23000.00
AIC Akola Nalganga 65643.00 25159.00 0.00 154964.84 25159.47 23000.00
NIC Nanded Purna 63532.00 143946.00 114526.00 143945.89 19526.09 23000.00
NIC Nanded Vishnupuri 21825.00 30722.00 26208.00 30721.67 14758.64 23000.00
BIPC Buldhana Wan (Amravati) 88015.00 42232.00 2095.00 251584.89 21040.06 23000.00
YIC Yavatmal Arunavati 64413.00 54073.00 3735215.00 84443.73 50482.39 26000.00
CADA Nashik Bhandardara 32738.00 30072.00 28477.00 39399.78 26153.94 26000.00
CIPC Chandrapur Bor 15523.00 20170.00 22593.00 26658.97 9265.67 26000.00
PIC Pune Chaskaman 36095.00 45743.00 44404.00 45742.56 27307.57 26000.00
CADA Nashik Darna 56167.00 59123.00 65329.00 61129.54 51473.76 26000.00
CADA Nashik Gangapur 93122.00 116345.00 114558.00 143373.28 74556.95 26000.00
CADA Pune Ghod 30605.00 30794.00 28145.00 31169.04 29265.09 26000.00
CADA Jalgaon Hatnur 28726.00 17381.00 28876.00 44331.41 17380.76 26000.00
CADA Nashik Kadva 20074.00 7040.00 30342.00 37859.62 7040.39 26000.00
PIC Pune Khadakwasla 67558.00 64323.00 59766.00 114367.27 42765.28 26000.00
CADA Pune Kukadi 31057.00 33789.00 23111.00 39976.11 19491.65 26000.00
CADA Nagpur Lower Wunna 18058.00 14991.00 14315.00 29448.86 1128.27 26000.00
CADA Nashik Mula 47719.00 52725.00 30227.00 69732.95 22947.65 26000.00
PIC Pune NLBC 79227.00 59161.00 77091.00 98067.55 59160.88 26000.00
AIC Abad NMC Express Mukane 136463.00 47375.00 40303.00 320841.65 0.00 26000.00
PIC Pune NRBC 45295.00 57955.00 109192.00 58886.34 33119.57 26000.00
CADA Nashik Palkhed 186408.00 151546.00 116475.00 221893.54 151546.40 26000.00
PIC Pune Pawana 83177.00 55443.00 56754.00 113529.01 55443.30 26000.00
AIC Akola Pus 31835.00 0.00 29733.00 41264.41 0.00 26000.00
CADA Nashik UGC Ozerkhed 241466.00 201869.00 214625.00 267977.37 201868.89 26000.00
CADA Nashik UGC(Punegaon) 195710.00 196720.00 236304.00 241104.87 137156.87 26000.00
CADA Nashik UGC(Tisgaon) 178562.00 171924.00 220417.00 244008.65 145328.96 26000.00
NIC Nanded Upper Penganga 20291.00 17740.00 17633.00 25160.62 15750.57 26000.00
UWPC Amravati Upper Wardha 37807.00 74677.00 14742.00 74676.61 25467.05 26000.00
CADA Nashik Waghad 281094.00 247239.00 317067.00 300007.47 247239.04 26000.00
CADA Nagpur Bagh 57427.00 15960.00 15960.00 199500.00 15959.71 25000.00
CADA Nagpur Itiahdoh 60538.00 15960.00 15962.00 198476.90 15959.95 25000.00
CADA Nagpur Pench 15235.00 23763.00 24880.00 23918.26 2308.42 25000.00
CIPC Chandrapur Asola Mendha 38530.00 34174.00 40000.00 42661.86 34174.41 32000.00
TIC Thane Bhatsa 28805.00 15981.00 92.00 77592.22 15980.99 32000.00
CIPC Chandrapur Dina 31450.00 29798.00 43175.00 32367.83 29797.72 32000.00
SIC Sangli Dudhganga 33984.00 67504.00 65183.00 67504.45 24094.38 32000.00
CADA Pune Krishna 27397.00 26240.00 25056.00 41209.03 18153.31 32000.00
SIC Sangli Radhanagari 36182.00 30023.00 30791.00 45156.76 29927.53 32000.00
TIC Thane Surya 15827.00 15113.00 873.00 55954.91 526.77 32000.00
SIC Sangli Tulashi 91497.00 47933.00 47933.00 675075.06 40094.80 32000.00
SIC Sangli Warna 57990.00 43857.00 61192.00 81363.35 43857.46 32000.00
SIC Sangli Warna LIS 165245.00 180529.00 181868.00 182281.23 150614.11 32000.00
Abundant
Indicator IIIMajor Projects
Output per unit Irrigated Area (Rs./ha)
Deficit
Normal
Surplus
101

[Benchmarking Report 2018-19]
Plan group Circle Project FY Avg LY 2017-18 TY 2018-19 Past Max Past Min State Tar
Highly Deficit CADA Solapur Bhima 6.79 7.07 29.92 8.91 5.80 2.69
CADA Nashik Chanakapur 40.08 37.37 0.00 184.81 0.00 2.99
CADA Jalgaon Girna 15.83 15.17 163.84 325.98 8.91 2.99
CADA Abad Jayakwadi (PLBC) 0.00 0.00 9.28 0.00 0.00 2.99
CADA Beed Jayakwadi PRBC 2.10 1.86 2.12 3.29 0.00 2.99
AIC Akola Katepurna 12.40 0.00 3.99 31.86 0.00 2.99
BIPC Buldhana Khadakpurna 41.83 26.94 10.51 114.25 6.27 2.99
CADA Beed Lower Terna 3.77 3.47 2.34 5.30 0.00 2.99
CADA Beed Majalgaon 5.94 3.58 5.80 17.88 0.00 2.99
NIC Nanded Manar 3.58 6.60 4.31 6.60 3.26 2.99
CADA Beed Manjra 4.56 4.08 13.71 5.33 0.00 2.99
AIC Akola Nalganga 4.43 5.01 4.75 5.04 3.83 2.99
NIC Nanded Purna 9.47 83.71 50.13 83.71 2.21 2.99
NIC Nanded Vishnupuri 4.25 6.32 7.79 6.32 2.23 2.99
BIPC Buldhana Wan (Amravati) 28.49 36.70 1.45 105.32 5.59 2.99
YIC Yavatmal Arunavati 8.10 10.00 748.21 10.44 6.45 3.38
CADA Nashik Bhandardara 5.62 4.80 6.87 10.30 4.02 3.38
CIPC Chandrapur Bor 2.03 2.57 4.31 3.35 1.34 3.38
PIC Pune Chaskaman 4.73 8.39 8.59 8.39 2.68 3.38
CADA Nashik Darna 16.64 19.20 24.78 30.50 12.17 3.38
CADA Nashik Gangapur 44.43 30.83 33.58 134.09 30.83 3.38
CADA Pune Ghod 6.52 5.33 4.99 8.45 5.33 3.38
CADA Jalgaon Hatnur 10.85 9.13 28.52 12.90 7.77 3.38
CADA Nashik Kadva 6.35 7.02 6.46 8.08 4.61 3.38
PIC Pune Khadakwasla 10.47 10.19 8.48 14.05 6.54 3.38
CADA Pune Kukadi 6.90 6.11 5.56 8.73 4.65 3.38
CADA Nagpur Lower Wunna 2.36 2.54 1.83 3.16 0.22 3.38
CADA Nashik Mula 10.51 12.64 11.35 14.15 7.28 3.38
PIC Pune NLBC 16.23 16.70 21.96 18.54 14.18 3.38
AIC Abad NMC Express Mukane 32.62 12.09 13.75 56.09 0.00 3.38
PIC Pune NRBC 13.13 17.75 29.72 17.75 10.31 3.38
CADA Nashik Palkhed 75.20 74.41 46.77 264.50 52.71 3.38
PIC Pune Pawana 13.74 7.37 7.71 24.68 7.37 3.38
AIC Akola Pus 2.56 0.00 4.49 2.89 0.00 3.38
CADA Nashik UGC Ozerkhed 95.49 66.82 78.48 437.25 66.82 3.38
CADA Nashik UGC(Punegaon) 49.17 41.57 54.91 82.61 35.03 3.38
CADA Nashik UGC(Tisgaon) 35.05 31.98 57.93 46.58 22.78 3.38
NIC Nanded Upper Penganga 4.31 16.08 3.27 16.08 3.25 3.38
UWPC Amravati Upper Wardha 5.87 9.99 9.13 10.85 2.59 3.38
CADA Nashik Waghad 83.47 72.09 98.82 161.93 70.85 3.38
CADA Nagpur Bagh 6.76 5.51 3.44 24.12 1.26 3.25
CADA Nagpur Itiahdoh 5.72 2.51 1.66 19.88 1.23 3.25
CADA Nagpur Pench 2.22 8.37 6.70 8.37 0.28 3.25
CIPC Chandrapur Asola Mendha 8.38 6.13 9.16 14.42 6.13 4.16
TIC Thane Bhatsa 2.21 2.49 0.01 3.14 0.83 4.16
CIPC Chandrapur Dina 5.35 5.55 7.02 5.85 4.73 4.16
SIC Sangli Dudhganga 4.00 4.89 4.36 4.89 2.98 4.16
CADA Pune Krishna 6.14 5.90 4.98 7.88 4.98 4.16
SIC Sangli Radhanagari 4.25 4.33 3.68 4.73 3.64 4.16
TIC Thane Surya 0.78 1.10 0.08 1.10 0.04 4.16
SIC Sangli Tulashi 9.17 3.75 3.43 41.82 3.75 4.16
SIC Sangli Warna 9.51 12.01 8.63 12.18 6.94 4.16
SIC Sangli Warna LIS 34.69 44.20 51.18 44.20 29.88 4.16
Abundant
Indicator IVMajor Projects
Output per unit Irrigation Water supply (Rs./cum)
Deficit
Normal
Surplus
102

[Benchmarking Report 2018-19]
Plan group Circle Project FY Avg LY 2017-18 TY 2018-19 Past Max Past Min State Tar
Highly Deficit CADA Solapur Bhima 0.69 0.80 1.98 2.31 0.39 1.00
CADA Nashik Chanakapur 0.44 0.93 1.04 0.93 0.24 1.00
CADA Jalgaon Girna 0.17 0.20 0.47 0.22 0.12 1.00
CADA Abad Jayakwadi (PLBC) 0.60 0.69 2.74 0.69 0.53 1.00
CADA Beed Jayakwadi PRBC 0.10 0.10 0.06 0.17 0.02 1.00
AIC Akola Katepurna 0.90 2.13 0.37 2.78 0.33 1.00
BIPC Buldhana Khadakpurna 0.81 0.14 1.74 0.14 0.00 1.00
CADA Beed Lower Terna 0.11 0.13 0.20 0.14 0.06 1.00
CADA Beed Majalgaon 0.00 0.00 0.19 0.01 0.00 1.00
NIC Nanded Manar 0.03 0.04 0.16 0.09 0.01 1.00
CADA Beed Manjra 0.20 0.23 0.60 0.23 0.15 1.00
AIC Akola Nalganga 0.07 0.38 0.20 0.38 0.04 1.00
NIC Nanded Purna 0.11 0.08 0.13 0.18 0.08 1.00
NIC Nanded Vishnupuri 0.31 0.29 0.29 2.28 0.22 1.00
BIPC Buldhana Wan (Amravati) 0.86 1.27 1.45 1.41 0.53 1.00
YIC Yavatmal Arunavati 0.06 0.08 0.03 0.09 0.01 1.00
CADA Nashik Bhandardara 0.40 1.03 0.22 1.30 0.22 1.00
CIPC Chandrapur Bor 0.06 0.04 0.08 0.11 0.03 1.00
PIC Pune Chaskaman 0.09 26.33 0.26 26.33 0.06 1.00
CADA Nashik Darna 0.28 0.14 1.76 0.51 0.00 1.00
CADA Nashik Gangapur 1.77 0.35 7.50 2.66 0.30 1.00
CADA Pune Ghod 0.55 0.38 1.14 3.17 0.18 1.00
CADA Jalgaon Hatnur 2.51 3.13 2.73 3.13 2.00 1.00
CADA Nashik Kadva 0.01 0.03 0.08 0.03 0.00 1.00
PIC Pune Khadakwasla 1.73 2.06 3.85 2.06 1.49 1.00
CADA Pune Kukadi 0.05 0.06 0.11 0.09 0.03 1.00
CADA Nagpur Lower Wunna 1.23 1.08 3.12 4.75 0.58 1.00
CADA Nashik Mula 0.15 0.22 0.31 0.22 0.06 1.00
PIC Pune NLBC 0.48 0.56 0.78 0.57 0.36 1.00
AIC Abad NMC Express Mukane 7.06 3.19 2.21 22.13 0.00 1.00
PIC Pune NRBC 0.74 0.87 1.03 0.91 0.50 1.00
CADA Nashik Palkhed 0.23 0.40 1.23 0.51 0.14 1.00
PIC Pune Pawana 10.02 7.87 19.36 20.86 7.87 1.00
AIC Akola Pus 0.06 0.12 0.22 0.19 0.04 1.00
CADA Nashik UGC Ozerkhed 0.13 0.36 0.46 0.36 0.07 1.00
CADA Nashik UGC(Punegaon) 0.17 0.23 0.24 0.39 0.08 1.00
CADA Nashik UGC(Tisgaon) 0.10 0.09 0.09 0.20 0.04 1.00
NIC Nanded Upper Penganga 0.05 0.01 0.12 0.20 0.01 1.00
UWPC Amravati Upper Wardha 0.91 1.15 0.84 1.65 0.44 1.00
CADA Nashik Waghad 0.07 0.09 0.15 0.09 0.06 1.00
CADA Nagpur Bagh 0.06 0.04 0.08 0.08 0.04 1.00
CADA Nagpur Itiahdoh 0.15 0.09 0.20 0.24 0.09 1.00
CADA Nagpur Pench 0.91 1.29 2.07 1.29 0.66 1.00
CIPC Chandrapur Asola Mendha 0.28 0.31 0.92 0.35 0.20 1.00
TIC Thane Bhatsa 20.35 32.55 10.50 33.73 0.12 1.00
CIPC Chandrapur Dina 0.38 0.48 0.65 0.52 0.26 1.00
SIC Sangli Dudhganga 4.37 3.82 4.80 5.45 3.66 1.00
CADA Pune Krishna 0.26 0.28 0.21 0.28 0.21 1.00
SIC Sangli Radhanagari 2.45 2.35 4.08 3.16 2.06 1.00
TIC Thane Surya 7.69 4.13 7.29 28.56 4.13 1.00
SIC Sangli Tulashi 1.14 0.46 0.62 2.06 0.38 1.00
SIC Sangli Warna 1.30 1.36 1.19 1.67 1.05 1.00
SIC Sangli Warna LIS 2.70 0.00 3.29 4.21 0.00 1.00
Abundant
Indicator VMajor Projects
Cost Recovery Ratio
Deficit
Normal
Surplus
103

[Benchmarking Report 2018-19]
Plan group Circle Project FY Avg LY 2017-18 TY 2018-19 Past Max Past Min State Tar
Highly Deficit CADA Solapur Bhima 1875.45 375.81 841.80 2172.34 375.81 1250.00
CADA Nashik Chanakapur 3417.28 1714.58 5959.11 20726.65 1642.94 1250.00
CADA Jalgaon Girna 2978.50 2325.46 4236.61 6997.90 2325.46 1250.00
CADA Abad Jayakwadi (PLBC) 0.00 0.00 1766.36 0.00 0.00 1250.00
CADA Beed Jayakwadi PRBC 22094.90 14385.07 20479.40 33088.55 0.00 1250.00
AIC Akola Katepurna 3008.12 36221.14 3940.71 36221.14 1925.31 1250.00
BIPC Buldhana Khadakpurna 141.19 838.74 0.00 838.74 0.00 1250.00
CADA Beed Lower Terna 8625.92 2134.37 6073.11 36564.71 0.00 1250.00
CADA Beed Majalgaon *69199539.93 * 855366121.69 0.00 855366121.69 0.00 1250.00
NIC Nanded Manar 6997.25 18885.16 1399.55 141695.65 1574.84 1250.00
CADA Beed Manjra 32139.22 13335.32 67579.35 27091.13 0.00 1250.00
AIC Akola Nalganga 14948.81 1864.61 0.00 41276.55 1864.61 1250.00
NIC Nanded Purna 4565.64 5344.32 9451.10 19627.57 2973.43 1250.00
NIC Nanded Vishnupuri 4080.60 3966.27 3671.70 9233.32 414.57 1250.00
BIPC Buldhana Wan (Amravati) 1684.46 1364.48 572.39 2706.77 1244.88 1250.00
YIC Yavatmal Arunavati 4495.48 12648.06 1871.01 12648.06 2528.72 1250.00
CADA Nashik Bhandardara 1578.76 583.66 4303.49 2853.73 550.71 1250.00
CIPC Chandrapur Bor 2165.22 4085.03 1821.01 4085.03 1084.16 1250.00
PIC Pune Chaskaman 1849.53 4.46 1281.02 3577.65 4.46 1250.00
CADA Nashik Darna 1905.16 1176.57 2103.58 3013.59 0.00 1250.00
CADA Nashik Gangapur 4236.29 5739.73 6548.17 7942.39 2720.12 1250.00
CADA Pune Ghod 1592.72 2302.67 1298.63 3934.24 240.76 1250.00
CADA Jalgaon Hatnur 2879.09 2618.94 3906.20 3388.50 2558.88 1250.00
CADA Nashik Kadva 1741.88 395.09 2564.84 4415.97 395.09 1250.00
PIC Pune Khadakwasla 3857.61 3933.22 6651.62 5075.29 2924.88 1250.00
CADA Pune Kukadi 3114.86 2625.53 2189.95 5073.53 1501.08 1250.00
CADA Nagpur Lower Wunna 3940.63 3438.06 2481.88 6505.98 1305.60 1250.00
CADA Nashik Mula 1858.00 1394.88 1547.34 2883.10 1394.88 1250.00
PIC Pune NLBC 1400.36 1103.57 1002.12 2188.06 1103.57 1250.00
AIC Abad NMC Express Mukane 43.66 90.06 141.45 90.06 0.00 1250.00
PIC Pune NRBC 555.32 520.83 618.73 823.44 417.76 1250.00
CADA Nashik Palkhed 2807.28 959.67 1013.61 8440.72 959.67 1250.00
PIC Pune Pawana 7238.31 9877.58 5289.25 9877.58 2664.01 1250.00
AIC Akola Pus 17090.85 0.00 3542.42 31866.24 0.00 1250.00
CADA Nashik UGC Ozerkhed 2330.12 1068.86 868.24 4735.58 973.96 1250.00
CADA Nashik UGC(Punegaon) 1987.97 1460.49 990.61 3097.44 954.48 1250.00
CADA Nashik UGC(Tisgaon) 3449.33 4410.89 3053.12 4974.27 1947.19 1250.00
NIC Nanded Upper Penganga 7676.71 46602.06 2584.50 46602.06 1901.28 1250.00
UWPC Amravati Upper Wardha 2460.14 3212.25 1917.45 3212.25 1909.81 1250.00
CADA Nashik Waghad 2943.55 1430.41 1507.69 4991.33 1430.41 1250.00
CADA Nagpur Bagh 2505.38 2955.82 2675.59 3155.39 2132.41 1250.00
CADA Nagpur Itiahdoh 3251.10 4789.34 3009.26 4789.34 2437.75 1250.00
CADA Nagpur Pench 2295.52 1666.70 1538.40 2510.54 1666.70 1250.00
CIPC Chandrapur Asola Mendha 612.70 590.58 496.53 827.40 548.24 1250.00
TIC Thane Bhatsa 3267.22 1298.34 6135.11 7812.12 1298.34 1250.00
CIPC Chandrapur Dina 469.82 434.58 497.87 512.35 434.58 1250.00
SIC Sangli Dudhganga 422.65 723.13 1238.53 723.13 355.99 1250.00
CADA Pune Krishna 2305.25 1636.85 2829.73 2829.73 1636.85 1250.00
SIC Sangli Radhanagari 871.92 1014.08 611.24 1014.08 768.86 1250.00
TIC Thane Surya 3879.40 3151.47 3145.66 7271.45 3151.47 1250.00
SIC Sangli Tulashi 1220.27 2159.36 2159.36 2351.16 768.92 1250.00
SIC Sangli Warna 837.88 714.44 1203.31 1446.06 568.30 1250.00
SIC Sangli Warna LIS 497.62 0.00 1394.92 955.09 0.00 1250.00
Abundant
Indicator VIMajor Projects
Operation & Maintenance Cost per unit Area (Rs./ha)
Deficit
Normal
Surplus
104

[Benchmarking Report 2018-19]
Plan group Circle Project FY Avg LY 2017-18 TY 2018-19 Past Max Past Min State Tar
Highly Deficit CADA Solapur Bhima 0.24 0.10 0.10 0.03 0.01 0.16
CADA Nashik Chanakapur 0.65 0.38 0.57 0.13 0.04 0.16
CADA Jalgaon Girna 0.90 0.56 0.81 0.27 0.05 0.16
CADA Abad Jayakwadi (PLBC) 0.10 0.07 0.18 0.02 0.01 0.16
CADA Beed Jayakwadi PRBC 0.69 0.41 0.57 0.19 0.04 0.16
AIC Akola Katepurna 0.21 0.14 0.33 0.03 0.01 0.16
BIPC Buldhana Khadakpurna 0.02 0.11 0.18 0.01 0.00 0.16
CADA Beed Lower Terna 1.80 0.82 0.75 0.69 0.08 0.16
CADA Beed Majalgaon * 16513.52 *26941.48 2.25 2694.15 0.00 0.16
NIC Nanded Manar 0.95 1.94 0.14 0.87 0.03 0.16
CADA Beed Manjra 1.33 0.78 1.25 0.56 0.08 0.16
AIC Akola Nalganga 0.91 0.31 2.30 0.18 0.01 0.16
NIC Nanded Purna 0.55 1.01 1.49 0.11 0.03 0.16
NIC Nanded Vishnupuri 0.51 0.58 0.73 0.09 0.01 0.16
BIPC Buldhana Wan (Amravati) 0.27 0.24 0.19 0.03 0.02 0.16
YIC Yavatmal Arunavati 0.52 1.20 0.36 0.12 0.03 0.16
CADA Nashik Bhandardara 0.23 0.08 0.85 0.05 0.01 0.16
CIPC Chandrapur Bor 0.28 0.52 0.35 0.05 0.02 0.16
PIC Pune Chaskaman 0.24 0.00 0.22 0.05 0.00 0.16
CADA Nashik Darna 0.35 0.23 0.44 0.07 0.00 0.16
CADA Nashik Gangapur 0.45 0.33 0.40 0.06 0.03 0.16
CADA Pune Ghod 0.31 0.38 0.21 0.08 0.01 0.16
CADA Jalgaon Hatnur 0.46 0.45 0.66 0.05 0.04 0.16
CADA Nashik Kadva 0.45 0.28 0.42 0.06 0.03 0.16
PIC Pune Khadakwasla 0.26 0.27 0.44 0.03 0.02 0.16
CADA Pune Kukadi 0.61 0.47 0.38 0.10 0.03 0.16
CADA Nagpur Lower Wunna 0.45 0.49 0.27 0.10 0.01 0.16
CADA Nashik Mula 0.35 0.30 0.42 0.10 0.03 0.16
PIC Pune NLBC 0.28 0.30 0.27 0.04 0.02 0.16
AIC Abad NMC Express Mukane 0.01 0.02 0.04 0.00 0.00 0.16
PIC Pune NRBC 0.15 0.15 0.16 0.02 0.01 0.16
CADA Nashik Palkhed 0.58 0.18 0.19 0.25 0.02 0.16
PIC Pune Pawana 0.15 0.30 0.11 0.03 0.00 0.16
AIC Akola Pus 1.22 3.61 0.47 0.42 0.02 0.16
CADA Nashik UGC Ozerkhed 0.77 0.31 0.27 0.22 0.03 0.16
CADA Nashik UGC(Punegaon) 0.47 0.31 0.23 0.09 0.03 0.16
CADA Nashik UGC(Tisgaon) 0.64 0.81 0.79 0.08 0.04 0.16
NIC Nanded Upper Penganga 1.30 11.59 0.40 1.16 0.02 0.16
UWPC Amravati Upper Wardha 0.32 0.34 0.81 0.07 0.02 0.16
CADA Nashik Waghad 0.83 0.41 0.46 0.22 0.04 0.16
CADA Nagpur Bagh 0.29 0.90 0.49 0.09 0.02 0.16
CADA Nagpur Itiahdoh 0.30 0.68 0.30 0.07 0.02 0.16
CADA Nagpur Pench 0.26 0.32 0.21 0.03 0.02 0.16
CIPC Chandrapur Asola Mendha 0.13 0.09 0.11 0.03 0.01 0.16
TIC Thane Bhatsa 0.03 0.02 0.10 0.01 0.00 0.16
CIPC Chandrapur Dina 0.08 0.08 0.08 0.01 0.01 0.16
SIC Sangli Dudhganga 0.05 0.05 0.08 0.01 0.00 0.16
CADA Pune Krishna 0.50 0.37 0.56 0.07 0.04 0.16
SIC Sangli Radhanagari 0.09 0.12 0.06 0.01 0.01 0.16
TIC Thane Surya 0.12 0.16 0.18 0.02 0.00 0.16
SIC Sangli Tulashi 0.11 0.16 0.12 0.02 0.01 0.16
SIC Sangli Warna 0.13 0.18 0.17 0.02 0.01 0.16
SIC Sangli Warna LIS 0.08 0.00 0.28 0.01 0.00 0.16
Abundant
Indicator VIIMajor Projects
Operation & Maintenance Cost per unit Water Supplied (Rs./cum)
Deficit
Normal
Surplus
105

[Benchmarking Report 2018-19]
Plan group Circle Project FY Avg LY 2017-18 TY 2018-19 Past Max Past Min State Tar
Highly Deficit CADA Solapur Bhima 0.17 0.08 0.19 0.50 0.08 0.18
CADA Nashik Chanakapur 0.29 0.36 0.59 0.36 0.20 0.18
CADA Jalgaon Girna 0.15 0.11 0.38 0.32 0.06 0.18
CADA Abad Jayakwadi (PLBC) 0.06 0.05 0.50 0.08 0.05 0.18
CADA Beed Jayakwadi PRBC 0.07 0.04 0.04 0.18 0.04 0.18
AIC Akola Katepurna 0.19 0.29 0.12 0.64 0.06 0.18
BIPC Buldhana Khadakpurna 0.01 0.02 0.32 0.02 0.00 0.18
CADA Beed Lower Terna 0.19 0.11 0.15 0.95 0.09 0.18
CADA Beed Majalgaon 0.03 0.02 0.42 0.05 0.00 0.18
NIC Nanded Manar 0.03 0.08 0.02 0.12 0.01 0.18
CADA Beed Manjra 0.26 0.18 0.75 1.23 0.18 0.18
AIC Akola Nalganga 0.06 0.12 0.46 0.12 0.03 0.18
NIC Nanded Purna 0.06 0.08 0.20 0.11 0.05 0.18
NIC Nanded Vishnupuri 0.16 0.17 0.21 0.21 0.13 0.18
BIPC Buldhana Wan (Amravati) 0.23 0.30 0.27 0.32 0.16 0.18
YIC Yavatmal Arunavati 0.03 0.09 0.01 0.09 0.01 0.18
CADA Nashik Bhandardara 0.09 0.09 0.19 0.14 0.07 0.18
CIPC Chandrapur Bor 0.02 0.02 0.03 0.02 0.01 0.18
PIC Pune Chaskaman 0.02 0.02 0.06 0.03 0.02 0.18
CADA Nashik Darna 0.10 0.03 0.76 0.36 0.03 0.18
CADA Nashik Gangapur 0.80 0.11 2.98 1.53 0.11 0.18
CADA Pune Ghod 0.17 0.15 0.25 0.28 0.14 0.18
CADA Jalgaon Hatnur 1.16 1.42 1.81 1.42 0.96 0.18
CADA Nashik Kadva 0.01 0.01 0.03 0.01 0.00 0.18
PIC Pune Khadakwasla 0.45 0.56 1.68 0.56 0.35 0.18
CADA Pune Kukadi 0.03 0.03 0.04 0.05 0.03 0.18
CADA Nagpur Lower Wunna 0.55 0.53 0.86 0.59 0.53 0.18
CADA Nashik Mula 0.05 0.07 0.13 0.19 0.01 0.18
PIC Pune NLBC 0.13 0.17 0.21 0.17 0.11 0.18
AIC Abad NMC Express Mukane 0.04 0.06 0.08 0.07 0.01 0.18
PIC Pune NRBC 0.11 0.13 0.16 0.17 0.07 0.18
CADA Nashik Palkhed 0.13 0.07 0.23 0.35 0.07 0.18
PIC Pune Pawana 1.55 2.32 2.05 2.32 0.88 0.18
AIC Akola Pus 0.08 0.42 0.10 0.42 0.03 0.18
CADA Nashik UGC Ozerkhed 0.10 0.11 0.12 0.18 0.07 0.18
CADA Nashik UGC(Punegaon) 0.08 0.07 0.05 0.12 0.03 0.18
CADA Nashik UGC(Tisgaon) 0.06 0.08 0.07 0.08 0.03 0.18
NIC Nanded Upper Penganga 0.07 0.16 0.05 0.16 0.04 0.18
UWPC Amravati Upper Wardha 0.29 0.40 0.68 0.40 0.18 0.18
CADA Nashik Waghad 0.06 0.04 0.07 0.18 0.03 0.18
CADA Nagpur Bagh 0.02 0.04 0.04 0.04 0.01 0.18
CADA Nagpur Itiahdoh 0.04 0.06 0.06 0.06 0.04 0.18
CADA Nagpur Pench 0.23 0.41 0.44 0.41 0.18 0.18
CIPC Chandrapur Asola Mendha 0.04 0.03 0.10 0.07 0.03 0.18
TIC Thane Bhatsa 0.60 0.73 1.03 0.73 0.01 0.18
CIPC Chandrapur Dina 0.03 0.04 0.05 0.04 0.02 0.18
SIC Sangli Dudhganga 0.21 0.19 0.38 0.28 0.16 0.18
CADA Pune Krishna 0.13 0.10 0.12 0.18 0.10 0.18
SIC Sangli Radhanagari 0.21 0.29 0.26 0.29 0.15 0.18
TIC Thane Surya 0.93 0.67 1.31 1.21 0.67 0.18
SIC Sangli Tulashi 0.12 0.07 0.07 0.15 0.06 0.18
SIC Sangli Warna 0.17 0.25 0.20 0.25 0.12 0.18
SIC Sangli Warna LIS 0.22 0.00 0.92 0.36 0.00 0.18
Abundant
Indicator VIIIMajor Projects
Revenue per unit of Water Supplied (Rs./cum)
Deficit
Normal
Surplus
106

[Benchmarking Report 2018-19]
Plan Group Circle Project Head Middle Tail
Highly Deficit CADA Solapur Bhima 0.50 0.37 0.24
CADA Nashik Chanakapur 0.80 0.80 0.80
CADA Jalgaon Girna 0.00 0.00 0.00
CADA Abad Jayakwadi (PLBC) 0.51 0.38 0.13
CADA Beed Jayakwadi PRBC 0.18 0.16 0.41
AIC Akola Katepurna 0.49 0.55 0.51
BIPC Buldhana Khadakpurna 0.00 0.00 0.00
CADA Beed Lower Terna 0.33 0.21 0.00
CADA Beed Majalgaon 0.04 0.03 0.04
NIC Nanded Manar 0.15 0.13 0.09
CADA Beed Manjra 0.00 0.00 0.00
AIC Akola Nalganga 0.00 0.00 0.00
NIC Nanded Purna 0.23 0.23 0.23
NIC Nanded Vishnupuri 0.05 0.05 0.05
BIPC Buldhana Wan (Amravati) 0.14 0.15 0.17
YIC Yavatmal Arunavati 0.67 0.67 0.67
CADA Nashik Bhandardara 0.96 0.94 0.97
CIPC Chandrapur Bor 0.19 0.22 0.20
PIC Pune Chaskaman 0.55 0.55 0.55
CADA Nashik Darna 0.49 0.56 0.46
CADA Nashik Gangapur 0.30 0.38 0.49
CADA Pune Ghod 1.00 1.00 1.00
CADA Jalgaon Hatnur 0.03 0.04 0.05
SIC Sangli Kadva 0.45 0.49 0.48
PIC Pune Khadakwasla 1.00 1.00 1.00
CADA Pune Kukadi 0.84 0.84 0.84
CADA Nagpur Lower Wunna 0.43 0.43 0.43
CADA Nashik Mula 1.00 1.00 1.00
PIC Pune NLBC 1.00 1.00 1.00
AIC Abad NMC Express Mukane 0.84 1.00 0.55
PIC Pune NRBC 1.00 1.00 1.00
CADA Nashik Palkhed 0.68 0.68 0.68
PIC Pune Pawana 0.84 0.84 0.84
AIC Akola Pus 0.69 0.93 0.30
CADA Nashik UGC Ozerkhed 1.00 1.00 1.00
CADA Nashik UGC(Punegaon) 0.83 0.83 0.83
CADA Nashik UGC(Tisgaon) 0.00 0.00 0.00
NIC Nanded Upper Penganga 0.42 0.25 0.20
UWPC Amravati Upper Wardha 0.34 0.73 1.00
CADA Nashik Waghad 1.00 1.00 1.00
CADA Nagpur Bagh 0.65 0.65 0.65
CADA Nagpur Itiahdoh 0.68 0.72 0.87
CADA Nagpur Pench 0.66 0.81 0.69
CIPC Chandrapur Asola Mendha 1.00 1.00 1.00
TIC Thane Bhatsa 0.86 0.23 0.28
CIPC Chandrapur Dina 1.00 1.00 1.00
SIC Sangli Dudhganga 0.37 0.37 0.95
CADA Pune Krishna 0.33 0.39 0.30
SIC Sangli Radhanagari 1.00 1.00 1.00
TIC Thane Surya 1.00 0.89 0.97
SIC Sangli Tulashi 0.64 0.84 0.92
SIC Sangli Warna 0.72 0.72 0.72
SIC Sangli Warna LIS 1.00 1.00 1.00
Surplus
Abundant
Indicator XIMajor Projects
Equity Performance (Ratio)
Deficit
Normal
107

[Benchmarking Report 2018-19]
Plan group Circle Project FY Avg LY 2017-18 TY 2018-19 Past Max Past Min State Tar
Highly Deficit CADA Solapur Bhima 0.35 0.91 0.22 0.91 0.18 1.00
CADA Nashik Chanakapur 1.00 1.00 0.41 1.00 0.00 1.00
CADA Jalgaon Girna 0.13 0.19 0.00 0.19 0.01 1.00
CADA Abad Jayakwadi (PLBC) 0.67 0.00 0.04 0.28 0.00 1.00
CADA Beed Jayakwadi PRBC 0.59 1.00 0.22 1.00 0.00 1.00
AIC Akola Katepurna 0.10 0.00 0.00 1.00 0.00 1.00
BIPC Buldhana Khadakpurna 0.50 0.00 0.00 1.00 0.00 1.00
CADA Beed Lower Terna 0.00 0.00 0.00 0.00 0.00 1.00
CADA Beed Majalgaon 0.00 0.00 0.00 0.00 0.00 1.00
NIC Nanded Manar 0.42 0.76 0.25 1.00 0.25 1.00
CADA Beed Manjra 0.05 0.04 0.16 0.17 0.00 1.00
AIC Akola Nalganga 0.71 0.31 0.86 1.00 0.31 1.00
NIC Nanded Purna 0.22 0.03 0.27 1.00 0.03 1.00
NIC Nanded Vishnupuri 0.17 0.72 0.11 0.72 0.03 1.00
BIPC Buldhana Wan (Amravati) 0.56 0.62 0.15 0.94 0.21 1.00
YIC Yavatmal Arunavati 0.11 0.20 0.00 0.23 0.00 1.00
CADA Nashik Bhandardara 0.74 0.58 1.00 1.00 0.44 1.00
CIPC Chandrapur Bor 0.43 0.56 0.06 1.00 0.12 1.00
PIC Pune Chaskaman 0.85 0.84 0.53 1.00 0.73 1.00
CADA Nashik Darna 0.55 0.46 0.57 0.94 0.28 1.00
CADA Nashik Gangapur 0.96 0.80 0.24 1.00 0.44 1.00
CADA Pune Ghod 0.77 0.77 0.55 1.00 0.62 1.00
CADA Jalgaon Hatnur 0.53 1.00 0.87 1.00 0.32 1.00
CADA Nashik Kadva 0.63 0.56 0.66 1.00 0.56 1.00
PIC Pune Khadakwasla 0.65 0.76 0.67 0.76 0.44 1.00
CADA Pune Kukadi 0.93 0.88 0.76 1.00 0.77 1.00
CADA Nagpur Lower Wunna 0.31 1.00 0.36 1.00 0.15 1.00
CADA Nashik Mula 0.48 0.33 0.27 0.84 0.23 1.00
PIC Pune NLBC 0.42 0.43 0.68 0.54 0.32 1.00
AIC Abad NMC Express Mukane 0.96 0.92 1.00 1.00 0.00 1.00
PIC Pune NRBC 0.77 0.87 1.00 1.00 0.39 1.00
CADA Nashik Palkhed 0.49 0.75 0.93 1.00 0.17 1.00
PIC Pune Pawana 0.83 0.93 1.00 0.96 0.45 1.00
AIC Akola Pus 0.46 0.00 0.00 1.00 0.00 1.00
CADA Nashik UGC Ozerkhed 0.75 0.86 0.72 1.00 0.41 1.00
CADA Nashik UGC(Punegaon) 0.91 1.00 0.68 1.00 0.00 1.00
CADA Nashik UGC(Tisgaon) 0.53 0.76 0.79 0.76 0.32 1.00
NIC Nanded Upper Penganga 0.19 0.00 0.00 0.37 0.00 1.00
UWPC Amravati Upper Wardha 0.72 1.00 0.79 1.00 0.37 1.00
CADA Nashik Waghad 0.62 0.48 1.00 1.00 0.47 1.00
CADA Nagpur Bagh 0.40 0.55 1.00 1.00 0.17 1.00
CADA Nagpur Itiahdoh 0.67 0.47 1.00 1.00 0.37 1.00
CADA Nagpur Pench 0.81 1.00 1.00 1.00 0.47 1.00
CIPC Chandrapur Asola Mendha 0.87 1.00 0.20 1.00 0.56 1.00
TIC Thane Bhatsa 0.95 1.00 1.00 1.00 0.86 1.00
CIPC Chandrapur Dina 0.95 1.00 1.00 1.00 0.39 1.00
SIC Sangli Dudhganga 0.64 0.62 0.55 1.00 0.33 1.00
CADA Pune Krishna 0.64 0.48 0.48 0.92 0.48 1.00
SIC Sangli Radhanagari 0.86 0.62 1.00 1.00 0.62 1.00
TIC Thane Surya 0.42 0.15 0.01 1.00 0.15 1.00
SIC Sangli Tulashi 0.85 1.00 1.00 1.00 0.77 1.00
SIC Sangli Warna 0.70 1.00 1.00 1.00 0.40 1.00
SIC Sangli Warna LIS 0.37 0.00 0.35 0.41 0.00 1.00
Abundant
Indicator XII_IMajor Projects
Assessment Recovery Ratio (Irrigation)
Deficit
Normal
Surplus
108

[Benchmarking Report 2018-19]
Plan group Circle Project FY Avg LY 2017-18 TY 2018-19 Past Max Past Min State Tar
Highly Deficit CADA Solapur Bhima 0.46 1.00 0.36 1.00 0.35 1.00
CADA Nashik Chanakapur 0.99 1 0.90 1.00 0.68 1.00
CADA Jalgaon Girna 0.62 0.32 0.48 1.00 0.32 1.00
CADA Abad Jayakwadi (PLBC) 0.70 0.57 0.25 0.90 0.57 1.00
CADA Beed Jayakwadi PRBC 0.17 0.07 0.13 0.70 0.00 1.00
AIC Akola Katepurna 0.46 0.72 0.33 1.00 0.13 1.00
BIPC Buldhana Khadakpurna 0.47 0.32 0.71 1.00 0.00 1.00
CADA Beed Lower Terna 0.41 1.00 0.63 1.00 0.00 1.00
CADA Beed Majalgaon 0.03 0.04 0.65 0.08 0.00 1.00
NIC Nanded Manar 0.39 0.35 0.23 0.72 0.14 1.00
CADA Beed Manjra 0.02 0.02 0.16 0.04 0.00 1.00
AIC Akola Nalganga 0.82 0.72 0.89 1.00 0.61 1.00
NIC Nanded Purna 0.13 0.00 0.17 0.46 0.00 1.00
NIC Nanded Vishnupuri 0.85 1.00 0.52 1.00 0.71 1.00
BIPC Buldhana Wan (Amravati) 0.83 0.88 0.47 0.98 0.67 1.00
YIC Yavatmal Arunavati 0.71 1.00 0.35 1.00 0.05 1.00
CADA Nashik Bhandardara 0.68 0.64 1.00 1.00 0.48 1.00
CIPC Chandrapur Bor 0.00 0.00 0.00 0.00 0.00 1.00
PIC Pune Chaskaman 0.87 1.00 1.00 1.00 0.24 1.00
CADA Nashik Darna 0.31 0.68 0.83 0.68 0.12 1.00
CADA Nashik Gangapur 0.57 0.64 0.65 0.74 0.29 1.00
CADA Pune Ghod 0.87 1.00 0.84 1.00 0.64 1.00
CADA Jalgaon Hatnur 0.77 1.00 1.00 1.00 0.40 1.00
CADA Nashik Kadva 1.00 1.00 0.02 1.00 0.00 1.00
PIC Pune Khadakwasla 0.83 0.88 1.00 0.88 0.74 1.00
CADA Pune Kukadi 0.50 0.95 1.00 1.00 0.26 1.00
CADA Nagpur Lower Wunna 0.92 0.99 0.64 0.99 0.74 1.00
CADA Nashik Mula 0.69 0.53 0.79 1.00 0.49 1.00
PIC Pune NLBC 0.69 0.64 0.78 0.95 0.46 1.00
AIC Abad NMC Express Mukane 0.84 0.77 0.96 1.00 0.00 1.00
PIC Pune NRBC 0.74 0.51 0.91 0.93 0.51 1.00
CADA Nashik Palkhed 0.67 0.56 0.78 0.85 0.56 1.00
PIC Pune Pawana 0.85 0.00 0.99 0.94 0.00 1.00
AIC Akola Pus 0.76 0.68 1.00 1.00 0.38 1.00
CADA Nashik UGC Ozerkhed 0.92 0.86 1.00 0.98 0.86 1.00
CADA Nashik UGC(Punegaon) 1.00 1.00 0.92 1.00 0.00 1.00
CADA Nashik UGC(Tisgaon) 0.72 0.66 1.00 1.00 0.00 1.00
NIC Nanded Upper Penganga 0.05 0.05 0.04 0.10 0.00 1.00
UWPC Amravati Upper Wardha 0.93 1.00 1.00 1.00 0.72 1.00
CADA Nashik Waghad 0.83 0.96 1.00 1.00 0.67 1.00
CADA Nagpur Bagh 0.71 1.00 0.77 1.00 0.37 1.00
CADA Nagpur Itiahdoh 0.96 1.00 0.64 1.00 0.50 1.00
CADA Nagpur Pench 0.82 0.59 0.75 1.00 0.59 1.00
CIPC Chandrapur Asola Mendha 0.96 0.00 0.00 1.00 0.00 1.00
TIC Thane Bhatsa 0.74 1.00 1.00 1.00 0.37 1.00
CIPC Chandrapur Dina 1.00 0.00 0.00 1.00 0.00 1.00
SIC Sangli Dudhganga 0.82 0.58 1.00 1.00 0.58 1.00
CADA Pune Krishna 0.89 0.87 0.74 1.00 0.74 1.00
SIC Sangli Radhanagari 0.74 0.72 0.85 1.00 0.43 1.00
TIC Thane Surya 1.00 1.00 1.00 1.00 1.00 1.00
SIC Sangli Tulashi 0.44 1.00 1.00 1.00 0.43 1.00
SIC Sangli Warna 0.92 0.76 0.76 1.00 0.76 1.00
SIC Sangli Warna LIS 0.75 0.00 1.00 0.88 0.00 1.00
Abundant
Indicator XII_NIMajor Projects
Assessment Recovery Ratio (Non Irrigation)
Deficit
Normal
Surplus
109

[Benchmarking Report 2018-19]
Plan group Circle Project FY Avg LY 2017-18 TY 2018-19 Past Max Past Min State Tar
Highly Deficit CADA Solapur Bhima 0.70 0.00 0.86 0.86 0.00 0.00
CADA Nashik Chanakapur 0.92 0.95 0.95 0.95 0.85 0.00
CADA Jalgaon Girna 0.36 0.46 0.00 0.50 0.00 0.00
CADA Abad Jayakwadi (PLBC) 0.58 0.59 0.62 0.59 0.56 0.00
CADA Beed Jayakwadi PRBC 0.00 0.00 0.00 0.00 0.00 0.00
AIC Akola Katepurna 0.20 0.00 0.65 0.78 0.00 0.00
BIPC Buldhana Khadakpurna 0.00 0.00 0.00 0.00 0.00 0.00
CADA Beed Lower Terna 0.18 0.46 0.51 0.46 0.00 0.00
CADA Beed Majalgaon 0.00 0.00 0.00 0.00 0.00 0.00
NIC Nanded Manar 0.52 0.00 0.82 0.82 0.00 0.00
CADA Beed Manjra 0.20 0.00 0.00 0.59 0.00 0.00
AIC Akola Nalganga 0.51 0.00 0.00 0.51 0.00 0.00
NIC Nanded Purna 0.65 0.50 0.50 0.93 0.00 0.00
NIC Nanded Vishnupuri 0.00 0.00 0.00 0.00 0.00 0.00
BIPC Buldhana Wan (Amravati) 0.63 0.33 0.49 0.94 0.00 0.00
YIC Yavatmal Arunavati 0.52 0.52 0.52 0.52 0.00 0.00
CADA Nashik Bhandardara 1.01 0.98 1.01 1.03 0.98 0.00
CIPC Chandrapur Bor 0.81 0.81 0.81 0.81 0.81 0.00
PIC Pune Chaskaman 0.63 0.64 0.64 0.64 0.62 0.00
CADA Nashik Darna 0.81 0.81 0.81 0.81 0.00 0.00
CADA Nashik Gangapur 0.66 0.69 0.67 0.69 0.63 0.00
CADA Pune Ghod 0.91 0.91 0.91 0.91 0.00 0.00
CADA Jalgaon Hatnur 0.00 0.00 0.00 0.00 0.00 0.00
CADA Nashik Kadva 0.00 0.00 0.00 0.00 0.00 0.00
PIC Pune Khadakwasla 0.00 0.00 0.00 0.00 0.00 0.00
CADA Pune Kukadi 0.79 0.79 0.78 0.79 0.00 0.00
CADA Nagpur Lower Wunna 2.76 0.67 0.63 4.16 0.67 0.00
CADA Nashik Mula 1.04 1.00 1.00 1.07 1.00 0.00
PIC Pune NLBC 0.88 0.87 0.87 0.88 0.87 0.00
AIC Abad NMC Express Mukane 0.71 0.00 0.78 0.73 0.00 0.00
PIC Pune NRBC 0.00 0.00 0.00 0.00 0.00 0.00
CADA Nashik Palkhed 0.91 0.90 0.90 0.93 0.89 0.00
PIC Pune Pawana 0.00 0.00 0.00 0.00 0.00 0.00
AIC Akola Pus 0.25 0.00 0.00 0.51 0.00 0.00
CADA Nashik UGC Ozerkhed 0.57 0.56 0.56 0.58 0.56 0.00
CADA Nashik UGC(Punegaon) 0.75 0.54 1.05 1.03 0.54 0.00
CADA Nashik UGC(Tisgaon) 0.00 0.00 0.00 0.00 0.00 0.00
NIC Nanded Upper Penganga 0.77 0.88 0.81 0.88 0.00 0.00
UWPC Amravati Upper Wardha 0.82 0.72 0.77 0.91 0.00 0.00
CADA Nashik Waghad 0.67 0.60 0.60 0.80 0.60 0.00
CADA Nagpur Bagh 0.92 0.95 0.95 1.01 0.80 0.00
CADA Nagpur Itiahdoh 0.00 0.00 0.00 0.00 0.00 0.00
CADA Nagpur Pench 0.89 0.85 0.83 0.91 0.85 0.00
CIPC Chandrapur Asola Mendha 1.55 1.60 1.60 1.60 1.54 0.00
TIC Thane Bhatsa 0.00 0.00 0.00 0.00 0.00 0.00
CIPC Chandrapur Dina 0.00 0.00 0.00 0.00 0.00 0.00
SIC Sangli Dudhganga 0.13 0.12 0.15 0.17 0.11 0.00
CADA Pune Krishna 0.70 0.60 0.73 0.75 0.60 0.00
SIC Sangli Radhanagari 0.00 0.00 0.00 0.00 0.00 0.00
TIC Thane Surya 0.60 0.60 0.68 0.60 0.00 0.00
SIC Sangli Tulashi 0.00 0.00 0.00 0.00 0.00 0.00
SIC Sangli Warna 0.34 0.32 0.00 0.37 0.00 0.00
SIC Sangli Warna LIS 0.00 0.00 0.00 0.00 0.00 0.00
Abundant
Indicator XIII_AMajor Projects
Water Delivery Capacity Index - A (Ratio)
Deficit
Normal
Surplus
110

[Benchmarking Report 2018-19]
Plan group Circle Project FY Avg LY 2017-18 TY 2018-19 Past Max Past Min State Tar
Highly Deficit CADA Solapur Bhima 0.50 0.00 0.70 0.67 0.00 0.00
CADA Nashik Chanakapur 0.64 0.67 0.78 0.78 0.56 0.00
CADA Jalgaon Girna 0.00 0.00 0.00 0.00 0.00 0.00
CADA Abad Jayakwadi (PLBC) 0.41 0.41 0.41 0.41 0.41 0.00
CADA Beed Jayakwadi PRBC 0.41 0.44 0.40 0.44 0.00 0.00
AIC Akola Katepurna 0.00 0.00 0.00 0.00 0.00 0.00
BIPC Buldhana Khadakpurna 0.00 0.00 0.00 0.00 0.00 0.00
CADA Beed Lower Terna 0.19 0.46 0.47 0.46 0.00 0.00
CADA Beed Majalgaon 0.30 0.00 0.00 0.50 0.00 0.00
NIC Nanded Manar 0.40 0.00 0.00 0.77 0.00 0.00
CADA Beed Manjra 0.21 0.00 0.00 0.63 0.00 0.00
AIC Akola Nalganga 0.07 0.07 0.00 0.07 0.00 0.00
NIC Nanded Purna 0.00 0.00 0.00 0.00 0.00 0.00
NIC Nanded Vishnupuri 0.19 0.33 0.31 0.33 0.00 0.00
BIPC Buldhana Wan (Amravati) 0.00 0.00 0.00 0.00 0.00 0.00
YIC Yavatmal Arunavati 0.50 0.50 0.48 0.50 0.00 0.00
CADA Nashik Bhandardara 1.06 1.08 1.03 1.08 1.00 0.00
CIPC Chandrapur Bor 0.00 0.00 0.00 0.00 0.00 0.00
PIC Pune Chaskaman 0.59 0.55 0.55 0.61 0.55 0.00
CADA Nashik Darna 0.75 0.75 0.69 0.75 0.00 0.00
CADA Nashik Gangapur 0.00 0.00 0.00 0.00 0.00 0.00
CADA Pune Ghod 0.78 0.78 0.78 0.78 0.00 0.00
CADA Jalgaon Hatnur 5.85 0.17 0.03 18.33 0.17 0.00
CADA Nashik Kadva 0.87 0.93 0.93 0.93 0.75 0.00
PIC Pune Khadakwasla 0.74 0.70 0.70 0.89 0.70 0.00
CADA Pune Kukadi 0.62 0.62 0.62 0.62 0.00 0.00
CADA Nagpur Lower Wunna 0.69 1.02 1.04 1.02 0.43 0.00
CADA Nashik Mula 1.00 1.00 1.00 1.00 1.00 0.00
PIC Pune NLBC 0.00 0.00 0.00 0.00 0.00 0.00
AIC Abad NMC Express Mukane 0.00 0.00 0.00 0.00 0.00 0.00
PIC Pune NRBC 1.01 1.00 1.00 1.03 1.00 0.00
CADA Nashik Palkhed 1.03 0.87 1.18 1.19 0.87 0.00
PIC Pune Pawana 0.00 0.00 0.00 0.00 0.00 0.00
AIC Akola Pus 0.25 0.00 0.00 0.51 0.00 0.00
CADA Nashik UGC Ozerkhed 0.00 0.00 0.00 0.00 0.00 0.00
CADA Nashik UGC(Punegaon) 0.00 0.00 0.00 0.00 0.00 0.00
CADA Nashik UGC(Tisgaon) 0.29 0.30 0.30 0.60 0.00 0.00
NIC Nanded Upper Penganga 0.54 0.49 0.50 0.58 0.00 0.00
UWPC Amravati Upper Wardha 0.84 0.84 0.84 0.86 0.00 0.00
CADA Nashik Waghad 0.86 0.87 0.87 0.90 0.80 0.00
CADA Nagpur Bagh 0.88 0.88 0.97 1.03 0.67 0.00
CADA Nagpur Itiahdoh 0.83 0.82 0.86 0.86 0.79 0.00
CADA Nagpur Pench 0.54 0.35 0.29 0.70 0.35 0.00
CIPC Chandrapur Asola Mendha 0.00 0.00 0.00 0.00 0.00 0.00
TIC Thane Bhatsa 0.26 0.26 0.26 0.26 0.00 0.00
CIPC Chandrapur Dina 0.97 1.04 1.04 1.04 0.93 0.00
SIC Sangli Dudhganga 0.57 0.58 0.58 0.58 0.55 0.00
CADA Pune Krishna 0.97 0.82 1.02 1.03 0.82 0.00
SIC Sangli Radhanagari 0.00 0.00 0.00 0.00 0.00 0.00
TIC Thane Surya 0.52 0.52 0.67 0.52 0.00 0.00
SIC Sangli Tulashi 0.00 0.00 0.00 0.00 0.00 0.00
SIC Sangli Warna 0.17 0.12 0.00 0.12 0.00 0.00
SIC Sangli Warna LIS 0.00 0.00 0.00 0.00 0.00 0.00
Abundant
Indicator XIII_BMajor Projects
Water Delivery Capacity Index - B (Ratio)
Deficit
Normal
Surplus
111

[Benchmarking Report 2018-19]
Plan group Circle Project FY Avg LY 2017-18 TY 2018-19 Past Max Past Min State Tar
Highly Deficit CADA Solapur Bhima 0.14 0.00 0.15 0.14 0.00 0.00
CADA Nashik Chanakapur 0.00 0 0.00 0.00 0.00 0.00
CADA Jalgaon Girna 0.00 0.00 0.00 0.00 0.00 0.00
CADA Abad Jayakwadi (PLBC) 0.00 0.00 0.00 0.00 0.00 0.00
CADA Beed Jayakwadi PRBC 0.00 0.00 0.00 0.00 0.00 0.00
AIC Akola Katepurna 0.41 0.52 1.27 1.20 0.00 0.00
BIPC Buldhana Khadakpurna 0.00 0.00 0.00 0.00 0.00 0.00
CADA Beed Lower Terna 0.00 0.00 0.00 0.00 0.00 0.00
CADA Beed Majalgaon 0.00 0.00 0.00 0.00 0.00 0.00
NIC Nanded Manar 1.37 1.19 2.61 2.19 0.00 0.00
CADA Beed Manjra 0.43 0.00 0.40 0.40 0.00 0.00
AIC Akola Nalganga 0.43 1.00 1.00 1.00 0.00 0.00
NIC Nanded Purna 0.34 0.36 0.00 0.36 0.00 0.00
NIC Nanded Vishnupuri 0.00 0.00 0.00 0.00 0.00 0.00
BIPC Buldhana Wan (Amravati) 0.01 0.00 0.00 0.05 0.00 0.00
YIC Yavatmal Arunavati 0.00 0.00 0.00 0.00 0.00 0.00
CADA Nashik Bhandardara 0.00 0.00 0.00 0.00 0.00 0.00
CIPC Chandrapur Bor 0.00 0.00 0.00 0.00 0.00 0.00
PIC Pune Chaskaman 0.03 0.03 0.04 0.03 0.03 0.00
CADA Nashik Darna 0.01 0.03 0.00 0.03 0.00 0.00
CADA Nashik Gangapur 0.67 0.64 0.81 3.19 0.45 0.00
CADA Pune Ghod 0.00 0.00 0.00 0.00 0.00 0.00
CADA Jalgaon Hatnur 0.63 1.53 2.60 1.95 0.00 0.00
CADA Nashik Kadva 0.00 0.00 0.00 0.00 0.00 0.00
PIC Pune Khadakwasla 0.23 0.23 0.31 0.23 0.22 0.00
CADA Pune Kukadi 0.22 0.54 1.22 0.54 0.00 0.00
CADA Nagpur Lower Wunna 0.00 0.00 0.00 0.00 0.00 0.00
CADA Nashik Mula 0.33 0.78 2.06 4.49 0.09 0.00
PIC Pune NLBC 0.38 0.94 0.94 0.94 0.00 0.00
AIC Abad NMC Express Mukane 0.23 0.00 0.00 0.72 0.00 0.00
PIC Pune NRBC 0.09 0.22 0.79 0.22 0.01 0.00
CADA Nashik Palkhed 2.45 3.07 0.75 8.59 1.40 0.00
PIC Pune Pawana 0.00 0.00 0.00 0.00 0.00 0.00
AIC Akola Pus 0.52 1.29 1.29 1.29 0.00 0.00
CADA Nashik UGC Ozerkhed 2.07 1.16 0.74 7.89 1.16 0.00
CADA Nashik UGC(Punegaon) 0.00 0.00 0.00 0.00 0.00 0.00
CADA Nashik UGC(Tisgaon) 0.00 0.00 0.00 0.00 0.00 0.00
NIC Nanded Upper Penganga 0.53 3.07 0.42 3.07 0.00 0.00
UWPC Amravati Upper Wardha 0.00 0.00 0.00 0.00 0.00 0.00
CADA Nashik Waghad 1.73 1.20 1.61 18.40 1.20 0.00
CADA Nagpur Bagh 0.00 0.00 0.00 0.00 0.00 0.00
CADA Nagpur Itiahdoh 0.95 1.29 0.78 1.30 0.78 0.00
CADA Nagpur Pench 0.96 1.01 0.98 1.01 0.92 0.00
CIPC Chandrapur Asola Mendha 0.00 0.00 0.00 0.00 0.00 0.00
TIC Thane Bhatsa 0.00 0.00 0.00 0.00 0.00 0.00
CIPC Chandrapur Dina 0.00 0.00 0.00 0.00 0.00 0.00
SIC Sangli Dudhganga 0.00 0.00 0.00 0.00 0.00 0.00
CADA Pune Krishna 0.00 0.00 0.00 0.00 0.00 0.00
SIC Sangli Radhanagari 0.00 0.00 0.00 0.00 0.00 0.00
TIC Thane Surya 0.00 0.00 0.00 0.00 0.00 0.00
SIC Sangli Tulashi 0.00 0.00 0.00 0.00 0.00 0.00
SIC Sangli Warna 0.00 0.00 0.00 0.00 0.00 0.00
SIC Sangli Warna LIS 0.00 0.00 0.00 0.00 0.00 0.00
Abundant
Indicator XIVMajor Projects
Participatory Irrigation Management PIM Index (Ratio)
Deficit
Normal
Surplus
112

[Benchmarking Report 2018-19]
Plan group Circle Project FY Avg LY 2017-18 TY 2018-19 Past Max Past Min State TarCADA Beed Banganga 5738.00 4553.00 5950.00 7208.00 0.00 7692.00
SIC Sangli Basappawadi 3585.00 0 26.00 6140.80 0.00 7692.00
CADA Beed Benitura 9379.00 8312.00 0.00 10553.54 0.00 7692.00
CADA Solapur Bori (Solapur) 5291.00 4421.00 6667.00 7730.91 0.00 7692.00
CADA Beed Chandani 9259.00 14668.00 0.00 14667.98 0.00 7692.00
CADA Solapur Ekrukh 7556.00 5897.00 6669.00 9742.65 0.00 7692.00
CADA Beed Harni 8128.00 9806.00 0.00 12060.61 0.00 7692.00
CADA Solapur Hingani (Pangaon) 7622.00 7086.00 0.00 9370.32 7085.96 7692.00
CADA Beed Jakapur 6663.00 7339.00 6166.00 7434.08 0.00 7692.00
CADA Solapur Jawalgaon 5769.00 8478.00 8478.00 8478.44 4173.81 7692.00
CADA Beed Kada 14336.00 8272.00 0.00 130434.78 0.00 7692.00
CADA Beed Kadi 8293.00 7792.00 0.00 8845.40 0.00 7692.00
CADA Beed Kambli 6899.00 6042.00 0.00 7629.50 0.00 7692.00
CADA Pune Khairy 8820.00 8820.00 7125.00 8820.45 8820.45 7692.00
CADA Beed Khandala 10272.00 7983.00 0.00 30681.82 6573.03 7692.00
CADA Beed Khandeshwar 4477.00 6869.00 0.00 6869.20 0.00 7692.00
CADA Beed Khasapur 7198.00 11217.00 0.00 11217.19 0.00 7692.00
CADA Beed Kurnoor 10078.00 9789.00 0.00 14546.23 6567.16 7692.00
CADA Solapur Mangi 8098.00 10140.00 11706.00 33750.00 0.00 7692.00
CADA Beed Mehakari 6380.00 6974.00 0.00 6974.04 0.00 7692.00
PIC Pune Nher 4828.00 6338.00 7050.00 8990.38 1903.62 7692.00
CADA Beed Ramganga 6536.00 4731.00 0.00 8161.38 0.00 7692.00
CADA Beed Rooty 6225.00 5730.00 0.00 6996.35 0.00 7692.00
CADA Beed Sakat 9876.00 12106.00 0.00 12106.06 0.00 7692.00
SIC Sangli Siddhewadi 3868.00 1059.00 0.00 12990.91 0.00 7692.00
CADA Pune Sina 9666.00 11791.00 4242.00 11790.88 6831.33 7692.00
CADA Beed Talwar 7489.00 7191.00 0.00 7818.18 0.00 7692.00
CADA Beed Turori 8309.00 8143.00 6291.00 8458.45 0.00 7692.00
CADA Beed Wagholi 5952.00 5898.00 0.00 5993.49 5898.43 7692.00
CADA Jalgaon Agnawati 6915.00 0.00 5000.00 8225.49 0.00 7692.00
CADA Abad Ajantha Andhari 0.00 0.00 0.00 0.00 0.00 7692.00
CADA Abad Anjana Palashi 13519.00 0.00 0.00 13518.52 0.00 7692.00
CADA Jalgaon Bahula 7540.00 24857.00 0.00 24857.14 0.00 7692.00
CADA Beed Belpara 7460.00 7320.00 0.00 8378.38 0.00 7692.00
CADA Jalgaon Bhokarbari 6729.00 0.00 0.00 6729.41 0.00 7692.00
CADA Beed Bindusara 5061.00 3133.00 0.00 6917.29 0.00 7692.00
CADA Beed Bodhegaon 7609.00 7112.00 0.00 8106.56 0.00 7692.00
CADA Jalgaon Bori 5035.00 0.00 0.00 5427.74 0.00 7692.00
CADA Beed Borna 5213.00 5401.00 0.00 8000.00 4577.29 7692.00
CADA Jalgaon Burai 5499.00 13034.00 9056.00 15178.40 3224.30 7692.00
UWPC Amravati Chandrabhaga (Amravati) 1158.00 675.00 2188.00 66476.17 325.11 7692.00
CADA Beed Devarjan 7140.00 8377.00 6645.00 8376.76 3243.24 7692.00
CADA Abad Dhamna 4095.00 0.00 0.00 4094.96 0.00 7692.00
AIC Akola Dnyanganga 4041.00 3911.00 0.00 5194.42 3596.84 7692.00
CADA Abad Gadadgad 3486.00 3724.00 6245.00 6787.30 2099.45 7692.00
CADA Abad Galhati 2739.00 3505.00 0.00 3504.55 1972.73 7692.00
CADA Beed Gharni 12219.00 12243.00 14650.00 12949.82 11916.75 7692.00
CADA Abad Girja 0.00 0.00 0.00 0.00 0.00 7692.00
CADA Nashik Haranbari 4005.00 3579.00 5276.00 6464.44 0.00 7692.00
CADA Jalgaon Hiwara 5286.00 5000.00 5579.00 6860.12 4599.17 7692.00
CADA Abad Jivrekha 1577.00 2636.00 0.00 2636.36 0.00 7692.00
Indicator IMedium Projects
Annual Irrigation Water Supply per unit Irrigated Area (cum/ha)
Deficit
Highly Deficit
113

[Benchmarking Report 2018-19]
Plan group Circle Project FY Avg LY 2017-18 TY 2018-19 Past Max Past Min State TarCADA Abad Jui 5520.00 4995.00 0.00 6721.78 4995.20 7692.00
CADA Abad Kalyan Girja 8655.00 8778.00 0.00 9215.81 7664.23 7692.00
CADA Jalgaon Kanoli 4359.00 0.00 0.00 8628.57 -611.60 7692.00
NIC Nanded Karadkhed 6481.00 8053.00 2182.00 8052.63 0.00 7692.00
CADA Abad Karpara 7119.00 7510.00 11066.00 7655.37 4428.15 7692.00
CADA Nashik Kelzar 3501.00 5225.00 11683.00 5225.03 1195.29 7692.00
CADA Abad Khelna 1116.00 0.00 0.00 8687.15 0.00 7692.00
NIC Nanded Kudala 7709.00 6156.00 9802.00 10495.05 0.00 7692.00
CADA Beed Kundlika 9517.00 8437.00 9857.00 10597.98 8436.60 7692.00
NIC Nanded Kundrala 6358.00 7824.00 0.00 7824.07 0.00 7692.00
CADA Abad Lahuki 469.00 0.00 0.00 937.50 0.00 7692.00
NIC Nanded Mahalingi 6388.00 4464.00 3568.00 8239.13 0.00 7692.00
CADA Beed Mahasangvi 8554.00 9602.00 0.00 9776.54 0.00 7692.00
CADA Jalgaon Manyad 6698.00 7343.00 3193.00 7342.84 4439.04 7692.00
AIC Akola Mas 5031.00 0.00 0.00 7587.06 0.00 7692.00
CADA Beed Masalga 5324.00 5149.00 5077.00 7819.55 0.00 7692.00
CADA Abad Masoli 5938.00 6182.00 2998.00 7053.98 3598.48 7692.00
AIC Akola Morna (Akola) 5581.00 0.00 3594.00 11394.82 0.00 7692.00
BIPC Buldhana Mun 12532.00 10000.00 0.00 15482.33 9156.21 7692.00
CADA Nashik Nagyasakya 4883.00 3650.00 0.00 6343.47 0.00 7692.00
AIC Akola Nirguna 5992.00 71.00 4459.00 11407.04 70.72 7692.00
AIC Akola Paldhag 5246.00 9018.00 0.00 9017.89 1873.67 7692.00
NIC Nanded Pethwadaj 12188.00 9464.00 9053.00 12441.86 0.00 7692.00
CADA Abad Pir Kalyan 0.00 − 0.00 0.00 0.00 7692.00
UWPC Amravati Purna (Achalpur) 6050.00 5817.00 11621.00 11620.56 1621.73 7692.00
CADA Abad Purna Nevpur 1745.00 830.00 6649.00 14723.93 829.93 7692.00
CADA Beed Raigavan 9997.00 5556.00 0.00 10241.96 0.00 7692.00
CADA Jalgaon Rangawali 4193.00 6739.00 8409.00 6739.43 2882.93 7692.00
CADA Beed Renapur 4439.00 2129.00 0.00 7462.83 0.00 7692.00
CADA Beed Rui 8199.00 9092.00 0.00 10183.25 0.00 7692.00
CADA Beed Sakol 7881.00 9708.00 7103.00 9708.26 4174.14 7692.00
CADA Beed Sangameshwar (Dokewadi) 8239.00 12312.00 0.00 12311.62 6479.03 7692.00
UWPC Amravati Sapan 13779.00 9068.00 5503.00 25629.25 5503.14 7692.00
CADA Beed Saraswati 10427.00 10972.00 0.00 12765.54 4242.42 7692.00
UWPC Amravati Shahanoor 1803.00 821.00 692.00 27679.18 682.19 7692.00
CADA Beed Sindphana 5573.00 5697.00 0.00 5696.97 0.00 7692.00
CADA Abad Sukhna 0.00 − 0.00 0.00 0.00 7692.00
CADA Beed Tawarja 7244.00 8041.00 7754.00 18228.09 0.00 7692.00
CADA Beed Terna 9616.00 10727.00 0.00 10727.16 0.00 7692.00
CADA Beed Tiru 3539.00 4034.00 0.00 4033.92 3036.37 7692.00
CADA Jalgaon Tondapur 5776.00 6881.00 0.00 7559.63 2580.65 7692.00
BIPC Buldhana Torna 12509.00 18375.00 1418.00 18375.00 3866.67 7692.00
AIC Akola Uma 5342.00 2705.00 4456.00 15450.00 2704.95 7692.00
BIPC Buldhana Utawali 7209.00 7003.00 565.00 10956.24 3394.71 7692.00
CADA Beed Wan (Beed) 5352.00 4840.00 0.00 5863.01 4840.18 7692.00
CADA Beed Whati 9518.00 10000.00 0.00 10000.00 0.00 7692.00
CADA Jalgaon Abhora 10064.00 25376.00 21200.00 25376.24 6051.06 7692.00
YIC Yavatmal Adan 13205.00 10212.00 7074.00 16031.67 0.00 7692.00
CADA Nashik Adhala 7577.00 8070.00 5357.00 10660.12 5884.58 7692.00
CADA Nashik Alandi 8048.00 7475.00 7535.00 9485.37 6904.14 7692.00
CIPC Chandrapur Amal Nala 3716.00 0.00 5638.00 5010.09 0.00 7692.00
CADA Abad Ambadi 441.00 0.00 0.00 6666.67 0.00 7692.00
PIC Pune Andhali 5257.00 4608.00 0.00 6124.92 0.00 7692.00
CADA Jalgaon Aner 5295.00 8827.00 5670.00 9143.40 2429.22 7692.00
Deficit
Normal
114

[Benchmarking Report 2018-19]
Plan group Circle Project FY Avg LY 2017-18 TY 2018-19 Past Max Past Min State TarCADA Nashik Bhojapur 5073.00 5423.00 13630.00 5492.74 0.00 7692.00
CADA Abad Bor Dahegaon 2500.00 0.00 0.00 7000.00 0.00 7692.00
AIC Akola Borgaon 3960.00 0.00 2613.00 9845.81 0.00 7692.00
CADA Solapur Budhihal 0.00 0.00 0.00 0.00 0.00 7692.00
CIPC Chandrapur Dham 9697.00 8977.00 9225.00 11972.96 8976.55 7692.00
CADA Abad Dheku 428.00 0.00 0.00 855.46 0.00 7692.00
SIC Sangli Dodda Nalla 2394.00 2556.00 0.00 14342.86 0.00 7692.00
NIC Nanded Dongargaon (Nanded) 6073.00 4526.00 9261.00 8054.05 4526.15 7692.00
CIPC Chandrapur Dongargaon (Wardha) 7366.00 5247.00 16717.00 10043.99 5246.64 7692.00
WIC Washim Ekburji 3267.00 0.00 3595.00 4512.20 0.00 7692.00
CADA Nashik Ghatshil Pargaon 8170.00 6114.00 0.00 19506.00 0.00 7692.00
AIC Akola Goki 5881.00 5181.00 4008.00 20433.38 3644.36 7692.00
CADA Jalgaon Karwand 3870.00 12008.00 6618.00 12008.37 1713.21 7692.00
PIC Pune Kasarsai 3938.00 3302.00 4845.00 5048.91 3301.96 7692.00CADA Abad Kolhi 8109.00 0.00 0.00 8108.91 0.00 7692.00
AIC Akola Koradi 2636.00 3758.00 0.00 3758.21 2004.69 7692.00
NIC Nanded Loni 12205.00 8442.00 5898.00 18880.24 7744.88 7692.00
AIC Akola Lowerpus 5123.00 2497.00 5839.00 18753.41 2496.59 7692.00
CADA Jalgaon Malangaon 2706.00 4400.00 5121.00 5397.94 1970.41 7692.00
CADA Nashik Mand Ohol 7714.00 6250.00 0.00 10982.40 0.00 7692.00
PIC Pune Mhaswad 10406.00 8311.00 0.00 16709.09 7936.51 7692.00
JIPC Jalgaon Mor 3320.00 8021.00 10712.00 10824.74 0.00 7692.00
NIC Nanded Nagzari 10990.00 8904.00 3938.00 17142.86 7601.60 7692.00
CADA Abad Narangi 0.00 0.00 0.00 0.00 0.00 7692.00
YIC Yavatmal Navargaon 9025.00 0.00 1945.00 9344.11 0.00 7692.00
PIC Pune Nazare 5879.00 3817.00 0.00 7313.64 3501.72 7692.00
CADA Jalgaon Panzra 4126.00 14004.00 14092.00 15020.22 0.00 7692.00
BIPC Buldhana Pen Takli 3741.00 2384.00 573.00 8567.81 2383.67 7692.00
CIPC Chandrapur Pothra 7061.00 6997.00 6598.00 9208.66 4685.02 7692.00
PIC Pune Ranand 5933.00 5173.00 8889.00 6796.66 0.00 7692.00
AIC Akola Saikheda 3999.00 2418.00 3647.00 5689.22 2418.27 7692.00
SIC Sangli Sankh 1863.00 3064.00 7079.00 3064.13 0.00 7692.00
PIC Pune Shetphal 7137.00 8965.00 8073.00 9997.67 4469.89 7692.00
WIC Washim Sonal 3560.00 5420.00 5440.00 5419.85 2544.58 7692.00
PIC Pune Sonwad 2441.00 5194.00 2503.00 10818.88 134.45 7692.00
CADA Jalgaon Suki 29766.00 49575.00 46962.00 49574.57 13962.26 7692.00
CADA Abad Tembhapuri 2843.00 0.00 0.00 2843.14 0.00 7692.00
PIC Pune Tisangi 8620.00 7028.00 6371.00 14627.69 6473.68 7692.00
PIC Pune Vadiwale 4396.00 4759.00 5244.00 5000.70 3185.88 7692.00
CADA Pune Visapur 3787.00 4108.00 3052.00 4107.87 3474.47 7692.00
AIC Akola Waghadi 4523.00 256.00 4643.00 18254.96 256.41 7692.00
CADA Nagpur Bagheda 3954.00 4620.00 2478.00 5117.27 1271.21 7692.00
CADA Nagpur Betekar Bothali 2615.00 2535.00 4293.00 3261.12 1949.65 7692.00
CADA Nagpur Bodalkasa 3076.00 3131.00 3250.00 3409.15 2788.19 7692.00
CIPC Chandrapur Chandai 2735.00 448.00 7940.00 3918.95 448.48 7692.00
CADA Nagpur Chandpur 2944.00 1845.00 2654.00 4253.08 1844.75 7692.00
CADA Nagpur Chandrabhaga (Nagpur) 16169.00 14722.00 7246.00 22873.65 12679.16 7692.00
CIPC Chandrapur Chargaon 5069.00 2322.00 6436.00 7174.02 2321.52 7692.00
CADA Nagpur Chorakhmara 2297.00 0.00 2599.00 2703.44 0.00 7692.00
CADA Nagpur Chulband 4565.00 2242.00 2726.00 6262.57 2242.37 7692.00
CADA Nagpur Kanholibara 7635.00 8593.00 7989.00 8857.34 7064.18 7692.00
CADA Nagpur Kesarnala 7304.00 6701.00 6870.00 10702.02 5634.46 7692.00
CADA Nagpur Khairbanda 1621.00 1701.00 2579.00 1900.09 1295.68 7692.00
CADA Nagpur Khekranala 13632.00 9376.00 4034.00 25713.71 7520.44 7692.00
Normal
Surplus
115

[Benchmarking Report 2018-19]
Plan group Circle Project FY Avg LY 2017-18 TY 2018-19 Past Max Past Min State TarCADA Nagpur Kolar 8469.00 8406.00 6134.00 10411.65 6545.21 7692.00
CIPC Chandrapur Labhansarad 5264.00 372.00 7729.00 8026.28 371.90 7692.00
CADA Nagpur Makardhokada-Saiki Complex 5630.00 5453.00 4636.00 6331.64 5115.00 7692.00
CADA Nagpur Managadh 5179.00 1311.00 5903.00 7070.84 1310.81 7692.00
CADA Nagpur Mordham 12047.00 10409.00 7800.00 17509.62 10107.14 7692.00
CIPC Chandrapur Pakadigundam 3740.00 0.00 3959873.00 5625.00 0.00 7692.00
CIPC Chandrapur Panchadhara 12777.00 13352.00 10905.00 13918.67 11798.83 7692.00
CADA Nagpur Pandhrabodi 8230.00 8098.00 9703.00 671936.76 5056.66 7692.00
CADA Nagpur Rengepar 2884.00 3205.00 3710.00 3754.65 1892.89 7692.00
CADA Nagpur Sangrampur 2529.00 1838.00 2224.00 2866.08 1838.47 7692.00
CADA Nagpur Sorna 2995.00 2535.00 6580.00 3202.33 2534.52 7692.00
CADA Nagpur Umri 7490.00 5458.00 4006.00 8626.98 5458.25 7692.00
CADA Nagpur Wunna 15886.00 16847.00 32292.00 21068.38 6197.18 7692.00
SIC Sangli Chikotra 4527.00 3912.00 5080.00 7828.07 3018.13 7692.00
SIC Sangli Chitri 5709.00 6746.00 4562.00 6746.12 4969.96 7692.00
SIC Sangli Ghatprabha (Pathakwadi) 10371.00 6226.00 6469.00 17876.61 6225.77 7692.00
CIPC Chandrapur Ghorazari 4189.00 4447.00 6226.00 6009.46 3135.67 7692.00
SIC Sangli Jangamhatti 6076.00 4047.00 6647.00 10564.34 4046.88 7692.00
SIC Sangli Kadavi 6039.00 4357.00 4520.00 8966.00 4357.09 7692.00
SIC Sangli Kasari 7618.00 6975.00 11291.00 8247.18 6974.77 7692.00
SIC Sangli KC &Khodshi Backwater 10104.00 5007.00 4364.00 15646.67 5006.91 7692.00
SIC Sangli Kumbhi 8499.00 13604.00 12540.00 13603.71 5634.58 7692.00
SIC Sangli Morna (Sangli) 14348.00 15372.00 12192.00 15463.02 12926.90 7692.00
CIPC Chandrapur Naleshwar 2897.00 2383.00 3267.00 3568.76 1993.35 7692.00
SIC Sangli Patgaon 9662.00 8758.00 9572.00 13732.83 8505.16 7692.00
TIC Thane Rajanala 7251.00 8730.00 26039.00 19975.59 0.00 7692.00
TIC Thane Wandri 14717.00 7326.00 8711.00 58400.00 7325.83 7692.00SIC Sangli Yeoti Masoli 4445.00 2767.00 3440.00 6757.41 2766.59 7692.00
Surplus
Abundant
116

[Benchmarking Report 2018-19]
Plan group Circle Project FY Avg LY 2017-18 TY 2018-19 Past Max Past Min State Tar
CADA Beed Banganga 174.28 219.64 168.07 219.62 0.00 130.00
SIC Sangli Basappawadi 278.94 0 38461.54 559.48 0.00 130.00
CADA Beed Benitura 106.62 120.31 0.00 120.31 0.00 130.00
CADA Solapur Bori (Solapur) 189.00 226.19 149.99 226.18 0.00 130.00
CADA Beed Chandani 108.00 68.18 0.00 1385.71 0.00 130.00
CADA Solapur Ekrukh 132.35 169.58 149.95 200.66 0.00 130.00
CADA Beed Harni 123.03 101.98 0.00 170.48 0.00 130.00
CADA Solapur Hingani (Pangaon) 131.20 141.12 0.00 141.12 106.72 130.00
CADA Beed Jakapur 150.08 136.26 162.18 136.26 0.00 130.00
CADA Solapur Jawalgaon 173.34 117.95 117.95 239.59 117.95 130.00
CADA Beed Kada 69.75 120.89 0.00 120.90 0.00 130.00
CADA Beed Kadi 120.58 128.34 0.00 128.33 0.00 130.00
CADA Beed Kambli 144.95 165.51 0.00 165.50 0.00 130.00
CADA Pune Khairy 113.38 113.38 140.35 113.37 113.37 130.00
CADA Beed Khandala 97.35 125.27 0.00 152.14 32.59 130.00
CADA Beed Khandeshwar 223.36 145.58 0.00 330.22 0.00 130.00
CADA Beed Khasapur 138.93 89.15 0.00 319.49 0.00 130.00
CADA Beed Kurnoor 99.23 102.16 0.00 152.27 68.75 130.00
CADA Solapur Mangi 123.49 98.62 85.43 220.18 0.00 130.00
CADA Beed Mehakari 156.74 143.39 0.00 186.04 0.00 130.00
PIC Pune Nher 207.13 157.78 141.84 525.31 111.23 130.00
CADA Beed Ramganga 153.00 211.37 0.00 211.36 0.00 130.00
CADA Beed Rooty 160.64 174.52 0.00 174.52 0.00 130.00
CADA Beed Sakat 101.26 82.60 0.00 820.00 0.00 130.00
SIC Sangli Siddhewadi 258.53 944.29 0.00 944.40 0.00 130.00
CADA Pune Sina 103.46 84.81 235.74 146.38 84.81 130.00
CADA Beed Talwar 133.53 139.06 0.00 139.05 0.00 130.00
CADA Beed Turori 120.35 122.80 158.96 125.00 0.00 130.00
CADA Beed Wagholi 168.01 169.55 0.00 169.54 166.85 130.00
CADA Jalgaon Agnawati 144.61 0.00 200.00 171.81 0.00 130.00
CADA Abad Ajantha Andhari 0.00 0.00 0.00 0.00 0.00 130.00
CADA Abad Anjana Palashi 73.97 0.00 0.00 73.97 0.00 130.00
CADA Jalgaon Bahula 132.63 40.23 0.00 193.70 0.00 130.00
CADA Beed Belpara 134.05 136.61 0.00 282.86 0.00 130.00
CADA Jalgaon Bhokarbari 148.61 0.00 0.00 148.60 0.00 130.00
CADA Beed Bindusara 197.59 319.18 0.00 319.20 0.00 130.00
CADA Beed Bodhegaon 131.42 140.61 0.00 140.61 0.00 130.00
CADA Jalgaon Bori 198.61 0.00 0.00 259.97 0.00 130.00
CADA Beed Borna 191.83 185.15 0.00 218.47 125.00 130.00
CADA Jalgaon Burai 181.85 76.72 110.42 310.14 65.88 130.00
UWPC Amravati Chandrabhaga (Amravati) *863.55 *1481.48 * 457.04 3075.85 15.04 130.00
CADA Beed Devarjan 140.06 119.37 150.49 308.33 119.38 130.00
CADA Abad Dhamna 244.20 0.00 0.00 244.20 0.00 130.00
AIC Akola Dnyanganga 247.46 255.69 0.00 278.02 192.51 130.00
CADA Abad Gadadgad 286.86 268.53 160.13 476.32 147.33 130.00
CADA Abad Galhati 365.10 285.31 0.00 506.91 285.34 130.00
CADA Beed Gharni 81.84 81.68 68.26 83.91 77.22 130.00
CADA Abad Girja 0.00 0.00 0.00 0.00 0.00 130.00
CADA Nashik Haranbari 249.69 279.41 189.54 1954.92 0.00 130.00
CADA Jalgaon Hiwara 189.18 200.00 179.24 217.43 145.77 130.00
CADA Abad Jivrekha *634.11 379.36 0.00 1003.13 0.00 130.00
Highly Deficit
Indicator IaMedium Projects
Annual Area Irrigated per unit of Water Supply (ha/Mcum)
Deficit
117

[Benchmarking Report 2018-19]
Plan group Circle Project FY Avg LY 2017-18 TY 2018-19 Past Max Past Min State Tar
CADA Abad Jui 181.16 200.20 0.00 200.19 148.77 130.00
CADA Abad Kalyan Girja 115.54 113.92 0.00 130.48 108.51 130.00
CADA Jalgaon Kanoli 229.41 0.00 0.00 284.27 0.00 130.00
NIC Nanded Karadkhed 154.30 124.18 458.30 221.77 0.00 130.00
CADA Abad Karpara 140.47 133.16 90.37 225.83 130.63 130.00
CADA Nashik Kelzar 285.63 191.39 85.59 836.62 191.39 130.00
CADA Abad Khelna *896.057 0.00 0.00 115.11 0.00 130.00
NIC Nanded Kudala 129.72 162.44 102.02 162.45 0.00 130.00
CADA Beed Kundlika 105.08 118.53 101.45 118.53 94.36 130.00
NIC Nanded Kundrala 157.28 127.81 0.00 185.90 0.00 130.00
CADA Abad Lahuki *2132.2 0.00 0.00 1066.67 0.00 130.00
NIC Nanded Mahalingi 156.54 224.01 280.27 224.00 0.00 130.00
CADA Beed Mahasangvi 116.90 104.14 0.00 141.09 0.00 130.00
CADA Jalgaon Manyad 149.30 136.18 313.19 225.27 136.19 130.00
AIC Akola Mas 198.77 0.00 0.00 316.40 0.00 130.00
CADA Beed Masalga 187.83 194.21 196.97 218.17 0.00 130.00
CADA Abad Masoli 168.41 161.76 333.56 277.89 141.76 130.00
AIC Akola Morna (Akola) 179.18 0.00 278.24 220.91 0.00 130.00
BIPC Buldhana Mun 79.80 100.00 0.00 109.22 64.59 130.00
CADA Nashik Nagyasakya 204.79 273.97 0.00 273.99 0.00 130.00
AIC Akola Nirguna 166.89 14084.51 224.27 14140.00 87.67 130.00
AIC Akola Paldhag 190.62 110.89 0.00 533.71 110.89 130.00
NIC Nanded Pethwadaj 82.05 105.66 110.46 105.66 0.00 130.00
CADA Abad Pir Kalyan 0.00 − 0.00 0.00 0.00 130.00
UWPC Amravati Purna (Achalpur) 165.29 171.91 86.05 616.63 86.05 130.00
CADA Abad Purna Nevpur *573.06 *1204.82 150.40 1204.92 67.92 130.00
CADA Beed Raigavan 100.03 179.99 0.00 180.00 0.00 130.00
CADA Jalgaon Rangawali 238.49 148.39 118.92 346.87 148.38 130.00
CADA Beed Renapur 225.28 469.70 0.00 469.61 0.00 130.00
CADA Beed Rui 121.97 109.99 0.00 167.05 0.00 130.00
CADA Beed Sakol 126.89 103.01 140.79 239.57 103.01 130.00
CADA Beed Sangameshwar (Dokewadi) 121.37 81.22 0.00 154.34 81.22 130.00
UWPC Amravati Sapan 72.57 110.28 181.72 181.71 39.02 130.00
CADA Beed Saraswati 95.90 91.14 0.00 235.71 78.34 130.00
UWPC Amravati Shahanoor *554.63 *1218.03 *1445.09 1465.86 36.13 130.00
CADA Beed Sindphana 179.44 175.53 0.00 183.38 0.00 130.00
CADA Abad Sukhna 0.00 − 0.00 0.00 0.00 130.00
CADA Beed Tawarja 138.05 124.36 128.97 169.25 0.00 130.00
CADA Beed Terna 103.99 93.22 0.00 113.93 0.00 130.00
CADA Beed Tiru 282.57 247.89 0.00 329.34 247.90 130.00
CADA Jalgaon Tondapur 173.13 145.33 0.00 387.50 132.28 130.00
BIPC Buldhana Torna 79.94 54.42 705.22 258.62 54.42 130.00
AIC Akola Uma 187.20 369.69 224.42 369.69 64.72 130.00
BIPC Buldhana Utawali 138.72 142.80 1769.91 294.58 91.27 130.00
CADA Beed Wan (Beed) 186.85 206.61 0.00 206.60 170.56 130.00
CADA Beed Whati 105.06 100.00 0.00 113.75 0.00 130.00
CADA Jalgaon Abhora 99.36 39.41 47.17 165.26 39.41 130.00
YIC Yavatmal Adan 75.73 97.92 141.36 97.93 0.00 130.00
CADA Nashik Adhala 131.98 123.92 186.67 169.94 93.81 130.00
CADA Nashik Alandi 124.25 133.78 132.71 144.84 105.43 130.00
CIPC Chandrapur Amal Nala 269.11 0.00 177.37 371.52 0.00 130.00
CADA Abad Ambadi *2267.57 0.00 0.00 1270.41 0.00 130.00
PIC Pune Andhali 190.22 217.01 0.00 217.03 0.00 130.00
CADA Jalgaon Aner 188.86 113.29 176.37 411.65 109.37 130.00
Normal
Deficit
118

[Benchmarking Report 2018-19]
Plan group Circle Project FY Avg LY 2017-18 TY 2018-19 Past Max Past Min State Tar
CADA Nashik Bhojapur 197.12 184.40 73.37 222.36 0.00 130.00
CADA Abad Bor Dahegaon 400.00 0.00 0.00 727.27 0.00 130.00
AIC Akola Borgaon 252.53 0.00 382.70 336.66 0.00 130.00
CADA Solapur Budhihal 0.00 0.00 0.00 0.00 0.00 130.00
CIPC Chandrapur Dham 103.12 111.40 108.40 111.40 83.52 130.00
CADA Abad Dheku *2336.44 0.00 0.00 1168.97 0.00 130.00
SIC Sangli Dodda Nalla 417.71 391.24 0.00 391.21 0.00 130.00
NIC Nanded Dongargaon (Nanded) 164.66 220.95 107.98 220.94 124.16 130.00
CIPC Chandrapur Dongargaon (Wardha) 135.76 190.59 59.82 190.60 99.56 130.00
WIC Washim Ekburji 306.09 0.00 278.16 398.66 0.00 130.00
CADA Nashik Ghatshil Pargaon 122.40 163.56 0.00 163.57 0.00 130.00
AIC Akola Goki 170.04 193.01 249.50 274.40 48.94 130.00
CADA Jalgaon Karwand 258.40 83.28 151.10 583.70 83.28 130.00
PIC Pune Kasarsai 253.94 302.85 206.40 302.85 198.06 130.00
CADA Abad Kolhi 123.32 0.00 0.00 123.32 0.00 130.00
AIC Akola Koradi 379.36 266.10 0.00 498.83 266.08 130.00
NIC Nanded Loni 81.93 118.46 169.55 129.12 52.97 130.00
AIC Akola Lowerpus 195.20 400.48 171.26 400.55 53.32 130.00
CADA Jalgaon Malangaon 369.55 227.27 195.27 507.51 185.26 130.00
CADA Nashik Mand Ohol 129.63 160.00 0.00 159.99 0.00 130.00
PIC Pune Mhaswad 96.10 120.32 0.00 126.00 59.85 130.00
JIPC Jalgaon Mor 301.20 124.67 93.35 745.16 0.00 130.00
NIC Nanded Nagzari 90.99 112.31 253.94 131.55 58.33 130.00
CADA Abad Narangi 0.00 0.00 0.00 0.00 0.00 130.00
YIC Yavatmal Navargaon 110.80 0.00 514.14 114.21 0.00 130.00
PIC Pune Nazare 170.10 261.99 0.00 285.57 136.73 130.00
CADA Jalgaon Panzra 242.37 71.41 70.96 377.15 0.00 130.00
BIPC Buldhana Pen Takli 267.31 419.46 1745.20 419.52 116.72 130.00
CIPC Chandrapur Pothra 141.62 142.92 151.56 213.45 108.59 130.00
PIC Pune Ranand 168.55 193.31 112.50 193.31 0.00 130.00
AIC Akola Saikheda 250.06 413.56 274.20 413.52 175.77 130.00
SIC Sangli Sankh *536.77 326.37 141.26 326.36 0.00 130.00
PIC Pune Shetphal 140.11 111.54 123.87 223.72 100.02 130.00
WIC Washim Sonal 280.90 184.50 183.82 392.99 184.51 130.00
PIC Pune Sonwad 409.67 192.53 399.52 7437.50 92.43 130.00
CADA Jalgaon Suki 33.60 20.17 21.29 71.62 20.17 130.00
CADA Abad Tembhapuri 351.74 0.00 0.00 351.72 0.00 130.00
PIC Pune Tisangi 116.01 142.29 156.96 154.47 68.36 130.00
PIC Pune Vadiwale 227.48 210.13 190.69 313.88 199.97 130.00
CADA Pune Visapur 264.06 243.43 327.65 287.81 243.44 130.00
AIC Akola Waghadi 221.09 3906.25 215.38 3900.00 54.78 130.00
CADA Nagpur Bagheda 252.91 216.45 403.55 786.65 195.42 130.00
CADA Nagpur Betekar Bothali 382.41 394.47 232.93 512.91 306.64 130.00
CADA Nagpur Bodalkasa 325.09 319.39 307.69 358.66 293.33 130.00
CIPC Chandrapur Chandai 365.63 *2232.14 125.94 2229.75 255.17 130.00
CADA Nagpur Chandpur 339.67 *542.01 376.78 542.08 235.12 130.00
CADA Nagpur Chandrabhaga (Nagpur) 61.85 67.93 138.01 78.87 43.72 130.00
CIPC Chandrapur Chargaon 197.28 430.66 155.38 430.75 139.39 130.00
CADA Nagpur Chorakhmara *435.35 0.00 384.76 759.66 0.00 130.00
CADA Nagpur Chulband 219.06 446.03 366.84 445.96 159.68 130.00
CADA Nagpur Kanholibara 130.98 116.37 125.17 141.56 112.90 130.00
CADA Nagpur Kesarnala 136.91 149.23 145.56 177.48 93.44 130.00
CADA Nagpur Khairbanda *616.90 *587.88 387.75 771.80 526.29 130.00
CADA Nagpur Khekranala 73.36 106.66 247.89 132.97 38.89 130.00
Normal
Surplus
119

[Benchmarking Report 2018-19]
Plan group Circle Project FY Avg LY 2017-18 TY 2018-19 Past Max Past Min State Tar
CADA Nagpur Kolar 118.08 118.96 163.03 152.78 96.05 130.00
CIPC Chandrapur Labhansarad 189.97 2688.17 129.38 2688.89 124.59 130.00
CADA Nagpur Makardhokada-Saiki Complex 177.62 183.39 215.70 195.50 157.94 130.00
CADA Nagpur Managadh 193.09 762.78 169.41 762.89 141.43 130.00
CADA Nagpur Mordham 83.01 96.07 128.21 98.94 57.11 130.00
CIPC Chandrapur Pakadigundam 267.38 0.00 0.25 335.56 0.00 130.00
CIPC Chandrapur Panchadhara 78.27 74.90 91.70 84.75 71.85 130.00
CADA Nagpur Pandhrabodi 121.51 123.49 103.06 197.76 1.49 130.00
CADA Nagpur Rengepar 346.74 312.01 269.54 528.29 266.34 130.00
CADA Nagpur Sangrampur 395.41 *544.07 *449.64 543.93 348.91 130.00
CADA Nagpur Sorna 333.89 394.47 151.98 394.55 312.27 130.00
CADA Nagpur Umri 133.51 183.22 249.63 183.21 115.92 130.00
CADA Nagpur Wunna 62.95 59.36 30.97 161.36 47.46 130.00
SIC Sangli Chikotra 220.90 255.62 196.85 331.33 127.75 130.00
SIC Sangli Chitri 175.16 148.24 219.20 201.21 148.23 130.00
SIC Sangli Ghatprabha (Pathakwadi) 96.42 160.62 154.58 160.62 55.94 130.00
CIPC Chandrapur Ghorazari 238.72 224.87 160.62 318.91 166.40 130.00
SIC Sangli Jangamhatti 164.58 247.10 150.44 247.10 94.66 130.00
SIC Sangli Kadavi 165.59 229.52 221.24 229.51 111.53 130.00
SIC Sangli Kasari 131.27 143.37 88.57 143.37 121.25 130.00
SIC Sangli KC &Khodshi Backwater 98.97 199.72 229.15 199.72 63.91 130.00
SIC Sangli Kumbhi 117.66 73.51 79.74 177.48 73.51 130.00
SIC Sangli Morna (Sangli) 69.70 65.05 82.02 77.36 64.67 130.00
CIPC Chandrapur Naleshwar 345.18 *419.63 306.09 501.67 280.21 130.00
SIC Sangli Patgaon 103.50 114.18 104.47 117.58 72.82 130.00
TIC Thane Rajanala 137.91 114.55 38.40 283.60 0.00 130.00
TIC Thane Wandri 67.95 136.50 114.80 136.50 17.12 130.00
SIC Sangli Yeoti Masoli 224.97 361.40 290.70 361.46 147.99 130.00
Surplus
Abundant
120

[Benchmarking Report 2018-19]
Plan group Circle Project FY Avg LY 2017-18 TY 2018-19 Past Max Past Min State Tar
CADA Beed Banganga 0.84 1.66 0.00 1.84 0.00 1.00
SIC Sangli Basappawadi 0.44 0.48 0.39 0.53 0.29 1.00
CADA Beed Benitura 0.13 0.33 0.00 0.33 0.00 1.00
CADA Solapur Bori (Solapur) 0.55 0.76 0.28 1.44 0.00 1.00
CADA Beed Chandani 0.99 0.77 0.00 0.89 0.00 1.00
CADA Solapur Ekrukh 0.68 1.40 1.36 3.57 0.13 1.00
CADA Beed Harni 0.35 0.51 0.00 0.56 0.00 1.00
CADA Solapur Hingani (Pangaon) 0.37 0.36 0.00 0.52 0.10 1.00
CADA Beed Jakapur 0.19 0.36 0.24 0.38 0.00 1.00
CADA Solapur Jawalgaon 0.28 0.27 0.27 0.48 0.00 1.00
CADA Beed Kada 0.05 0.09 0.00 0.09 0.00 1.00
CADA Beed Kadi 0.14 0.13 0.00 0.15 0.00 1.00
CADA Beed Kambli 0.13 0.14 0.00 0.14 0.00 1.00
CADA Pune Khairy 0.79 0.79 7.07 0.79 0.79 1.00
CADA Beed Khandala 0.20 0.50 0.00 0.50 0.00 1.00
CADA Beed Khandeshwar 1.11 1.03 0.00 1.05 0.00 1.00
CADA Beed Khasapur 0.88 0.95 0.00 2.06 0.00 1.00
CADA Beed Kurnoor 0.28 0.50 0.00 0.50 0.15 1.00
CADA Solapur Mangi 0.26 0.55 0.03 0.64 0.00 1.00
CADA Beed Mehakari 0.09 0.08 0.00 0.13 0.00 1.00
PIC Pune Nher 0.62 0.93 14.31 1.00 0.00 1.00
CADA Beed Ramganga 1.32 1.66 0.00 1.90 0.00 1.00
CADA Beed Rooty 0.13 0.17 0.00 0.17 0.00 1.00
CADA Beed Sakat 0.78 0.78 0.00 0.78 0.00 1.00
SIC Sangli Siddhewadi 0.50 0.80 0.44 0.80 0.16 1.00
CADA Pune Sina 0.67 0.82 4.29 0.82 0.51 1.00
CADA Beed Talwar 0.13 0.12 0.00 0.13 0.00 1.00
CADA Beed Turori 0.16 0.24 0.07 0.49 0.00 1.00
CADA Beed Wagholi 0.96 0.67 0.00 1.43 0.67 1.00
CADA Jalgaon Agnawati 0.00 0.00 0.00 34.32 0.00 1.00
CADA Abad Ajantha Andhari 0.00 0.00 0.00 0.00 0.00 1.00
CADA Abad Anjana Palashi 0.00 0.00 0.00 0.00 0.00 1.00
CADA Jalgaon Bahula 2.84 0.00 0.00 5.21 0.00 1.00
CADA Beed Belpara 0.03 0.00 0.00 0.05 0.00 1.00
CADA Jalgaon Bhokarbari 2.93 0.00 0.00 0.97 0.00 1.00
CADA Beed Bindusara 0.06 0.07 0.00 0.08 0.00 1.00
CADA Beed Bodhegaon 0.04 0.09 0.00 0.09 0.00 1.00
CADA Jalgaon Bori 1.16 0.00 0.00 1.44 0.00 1.00
CADA Beed Borna 0.00 0.00 0.08 0.00 0.00 1.00
CADA Jalgaon Burai 1.27 2.21 3.10 2.67 0.87 1.00
UWPC Amravati Chandrabhaga (Amravati) 0.55 0.78 0.82 0.91 0.00 1.00
CADA Beed Devarjan 0.25 0.30 0.15 0.34 0.00 1.00
CADA Abad Dhamna 1.83 0.00 0.92 1.83 0.00 1.00
AIC Akola Dnyanganga 0.22 0.18 0.00 0.48 0.00 1.00
CADA Abad Gadadgad 1.54 1.00 1.00 1.00 0.00 1.00
CADA Abad Galhati 1.19 1.12 0.00 1.26 1.12 1.00
CADA Beed Gharni 0.36 0.40 0.34 0.40 0.29 1.00
CADA Abad Girja 0.00 0.00 0.00 0.00 0.00 1.00
CADA Nashik Haranbari 0.82 1.54 0.38 1.54 0.00 1.00
CADA Jalgaon Hiwara *7.79 0.00 *11.4 5.82 0.00 1.00
CADA Abad Jivrekha 1.76 1.23 0.00 2.30 0.00 1.00
Highly Deficit
Indicator IIMedium Projects
Potential Utilised and Created
Deficit
121

[Benchmarking Report 2018-19]
Plan group Circle Project FY Avg LY 2017-18 TY 2018-19 Past Max Past Min State Tar
CADA Abad Jui 4.31 1.75 0.82 2.06 0.00 1.00
CADA Abad Kalyan Girja 1.13 1.01 1.00 1.01 0.00 1.00
CADA Jalgaon Kanoli 1.07 0.00 0.00 1.86 0.00 1.00
NIC Nanded Karadkhed 0.85 6.40 1.36 6.40 0.00 1.00
CADA Abad Karpara 0.96 0.40 0.41 0.51 0.00 1.00
CADA Nashik Kelzar 1.20 1.90 0.93 1.90 0.58 1.00
CADA Abad Khelna 0.00 0.00 0.00 0.00 0.00 1.00
NIC Nanded Kudala 1.95 5.98 2.76 5.98 0.00 1.00
CADA Beed Kundlika 0.21 0.12 0.05 8.91 0.12 1.00
NIC Nanded Kundrala 1.36 1.85 1.00 2.86 0.00 1.00
CADA Abad Lahuki 1.00 0.00 0.00 1.00 0.00 1.00
NIC Nanded Mahalingi 0.88 2.36 0.00 2.36 0.00 1.00
CADA Beed Mahasangvi 0.02 0.02 0.00 0.04 0.00 1.00
CADA Jalgaon Manyad 2.85 4.16 0.00 4.16 0.00 1.00
AIC Akola Mas 0.09 0.00 0.00 0.59 0.00 1.00
CADA Beed Masalga 0.08 0.15 0.07 0.21 0.00 1.00
CADA Abad Masoli 0.96 0.33 0.15 0.58 0.00 1.00
AIC Akola Morna (Akola) 0.56 0.15 0.42 6.04 0.15 1.00
BIPC Buldhana Mun 0.14 0.01 0.00 0.36 0.00 1.00
CADA Nashik Nagyasakya 0.79 1.18 0.00 1.18 0.00 1.00
AIC Akola Nirguna 0.76 0.24 0.54 2.61 0.24 1.00
AIC Akola Paldhag 0.28 0.25 0.00 0.59 0.14 1.00
NIC Nanded Pethwadaj 0.31 0.30 0.79 0.33 0.00 1.00
CADA Abad Pir Kalyan 0.00 − 1.00 0.00 0.00 1.00
UWPC Amravati Purna (Achalpur) 0.62 0.54 0.51 0.72 0.51 1.00
CADA Abad Purna Nevpur *6.42 0.00 0.00 1.00 0.00 1.00
CADA Beed Raigavan 0.56 0.00 0.00 0.54 0.00 1.00
CADA Jalgaon Rangawali 0.97 1.19 0.93 1.19 0.65 1.00
CADA Beed Renapur 0.36 0.00 0.03 0.41 0.00 1.00
CADA Beed Rui 0.36 0.66 0.00 1.24 0.00 1.00
CADA Beed Sakol 0.29 0.26 0.21 0.42 0.18 1.00
CADA Beed Sangameshwar (Dokewadi) 0.65 0.66 0.00 1.56 0.00 1.00
UWPC Amravati Sapan 0.44 0.13 1.00 1.00 0.00 1.00
CADA Beed Saraswati 0.02 0.03 0.03 0.03 0.00 1.00
UWPC Amravati Shahanoor 0.23 0.13 0.59 0.66 0.00 1.00
CADA Beed Sindphana 0.25 0.22 0.00 0.28 0.00 1.00
CADA Abad Sukhna 0.00 − 0.00 0.00 0.00 1.00
CADA Beed Tawarja 0.11 0.21 0.05 0.46 0.00 1.00
CADA Beed Terna 0.68 0.71 0.00 0.79 0.00 1.00
CADA Beed Tiru 0.93 0.60 0.11 1.28 0.60 1.00
CADA Jalgaon Tondapur 2.50 1.89 0.00 5.98 1.89 1.00
BIPC Buldhana Torna 0.23 0.17 0.00 0.48 0.00 1.00
AIC Akola Uma 0.39 0.05 0.50 0.98 0.00 1.00
BIPC Buldhana Utawali 0.16 0.07 0.00 0.32 0.00 1.00
CADA Beed Wan (Beed) 0.01 0.02 0.02 0.02 0.00 1.00
CADA Beed Whati 0.22 0.44 0.03 0.48 0.00 1.00
CADA Jalgaon Abhora 2.64 2.42 2.18 3.01 2.42 1.00
YIC Yavatmal Adan 0.20 0.05 0.65 0.43 0.00 1.00
CADA Nashik Adhala 1.03 1.04 1.29 1.45 0.61 1.00
CADA Nashik Alandi 2.15 2.70 2.38 2.97 1.56 1.00
CIPC Chandrapur Amal Nala 1.06 9.20 1.80 9.20 0.72 1.00
CADA Abad Ambadi 1.07 0.00 0.00 1.00 0.00 1.00
PIC Pune Andhali 0.41 0.55 0.00 0.56 0.23 1.00
CADA Jalgaon Aner 1.28 1.78 1.56 2.22 0.90 1.00
Deficit
Normal
122

[Benchmarking Report 2018-19]
Plan group Circle Project FY Avg LY 2017-18 TY 2018-19 Past Max Past Min State Tar
CADA Nashik Bhojapur 0.64 0.89 0.26 0.89 0.00 1.00
CADA Abad Bor Dahegaon 1.00 0.00 0.00 1.00 0.00 1.00
AIC Akola Borgaon 0.62 0.00 0.70 1.28 0.00 1.00
CADA Solapur Budhihal 0.09 0.17 0.15 0.17 0.00 1.00
CIPC Chandrapur Dham 0.59 0.62 0.38 0.66 0.47 1.00
CADA Abad Dheku 0.00 0.00 0.00 0.00 0.00 1.00
SIC Sangli Dodda Nalla 0.27 0.83 0.40 0.83 0.00 1.00
NIC Nanded Dongargaon (Nanded) 1.23 0.00 0.82 0.87 0.00 1.00
CIPC Chandrapur Dongargaon (Wardha) 0.92 0.72 0.55 1.04 0.72 1.00
WIC Washim Ekburji 1.99 0.00 0.97 3.68 0.00 1.00
CADA Nashik Ghatshil Pargaon 1.61 3.41 0.00 3.41 0.00 1.00
AIC Akola Goki 0.61 0.05 0.78 1.16 0.00 1.00
CADA Jalgaon Karwand 0.69 0.58 0.84 1.00 0.58 1.00
PIC Pune Kasarsai 0.77 0.83 0.83 0.83 0.72 1.00
CADA Abad Kolhi 1.00 0.00 0.00 1.00 0.00 1.00
AIC Akola Koradi 0.58 0.20 0.00 0.89 0.20 1.00
NIC Nanded Loni 0.37 0.57 0.42 0.61 0.20 1.00
AIC Akola Lowerpus 0.66 0.40 0.42 0.94 0.29 1.00
CADA Jalgaon Malangaon 1.79 3.39 2.09 4.51 0.79 1.00
CADA Nashik Mand Ohol 0.99 1.10 0.00 1.10 0.00 1.00
PIC Pune Mhaswad 0.48 0.06 0.00 1.23 0.00 1.00
JIPC Jalgaon Mor 1.34 2.63 0.06 2.63 0.00 1.00
NIC Nanded Nagzari 0.57 0.40 0.50 1.11 0.34 1.00
CADA Abad Narangi 0.00 0.00 0.00 0.00 0.00 1.00
YIC Yavatmal Navargaon 0.25 0.00 0.27 0.55 0.00 1.00
PIC Pune Nazare 1.25 2.54 0.00 2.54 0.97 1.00
CADA Jalgaon Panzra 1.81 2.95 3.17 2.95 0.00 1.00
BIPC Buldhana Pen Takli 0.32 0.64 0.99 0.64 0.00 1.00
CIPC Chandrapur Pothra 0.45 0.58 0.64 0.68 0.30 1.00
PIC Pune Ranand 0.93 1.41 * 11.55 1.41 0.69 1.00
AIC Akola Saikheda 0.97 1.03 1.24 1.11 0.81 1.00
SIC Sangli Sankh 0.26 0.65 0.11 0.65 0.00 1.00
PIC Pune Shetphal 2.05 3.56 0.34 4.65 0.19 1.00
WIC Washim Sonal 1.67 1.00 0.48 3.01 0.66 1.00
PIC Pune Sonwad 1.20 5.84 1.00 5.84 0.64 1.00
CADA Jalgaon Suki 2.94 2.85 2.28 3.24 2.72 1.00
CADA Abad Tembhapuri 1.00 0.00 0.00 1.00 0.00 1.00
PIC Pune Tisangi 0.77 0.70 0.95 1.15 0.00 1.00
PIC Pune Vadiwale 1.24 1.23 1.23 1.26 1.17 1.00
CADA Pune Visapur 1.72 1.52 0.71 1.92 1.52 1.00
AIC Akola Waghadi 0.51 0.05 0.40 1.22 0.00 1.00
CADA Nagpur Bagheda 1.19 1.15 1.07 1.60 0.93 1.00
CADA Nagpur Betekar Bothali 1.01 0.90 0.65 1.86 0.75 1.00
CADA Nagpur Bodalkasa 0.84 0.49 0.86 1.12 0.49 1.00
CIPC Chandrapur Chandai 0.86 2.17 0.84 2.17 0.58 1.00
CADA Nagpur Chandpur 1.46 1.55 1.23 1.64 1.27 1.00
CADA Nagpur Chandrabhaga (Nagpur) 0.55 0.92 0.96 0.92 0.31 1.00
CIPC Chandrapur Chargaon 1.09 1.03 1.11 1.42 1.00 1.00
CADA Nagpur Chorakhmara 1.70 0.00 1.03 2.60 0.00 1.00
CADA Nagpur Chulband 1.05 0.85 1.24 1.19 0.85 1.00
CADA Nagpur Kanholibara 1.12 1.22 0.70 1.23 0.90 1.00
CADA Nagpur Kesarnala 0.99 1.07 1.37 1.65 0.56 1.00
CADA Nagpur Khairbanda 1.06 1.14 1.03 1.41 0.90 1.00
CADA Nagpur Khekranala 0.82 0.99 1.59 1.07 0.46 1.00
Normal
Surplus
123

[Benchmarking Report 2018-19]
Plan group Circle Project FY Avg LY 2017-18 TY 2018-19 Past Max Past Min State Tar
CADA Nagpur Kolar 0.92 0.95 2.92 1.18 0.48 1.00
CIPC Chandrapur Labhansarad 0.82 8.26 0.35 8.26 0.40 1.00
CADA Nagpur Makardhokada-Saiki Complex 0.89 1.02 1.34 1.02 0.77 1.00
CADA Nagpur Managadh 0.47 0.74 0.70 0.74 0.42 1.00
CADA Nagpur Mordham 0.70 1.02 1.21 1.02 0.42 1.00
CIPC Chandrapur Pakadigundam 0.76 16.79 1.96 16.79 0.19 1.00
CIPC Chandrapur Panchadhara 0.56 0.50 0.27 0.78 0.36 1.00
CADA Nagpur Pandhrabodi 2.47 3.58 2.39 3.58 1.88 1.00
CADA Nagpur Rengepar 0.92 0.21 0.80 1.30 0.21 1.00
CADA Nagpur Sangrampur 1.09 0.69 1.72 1.70 0.69 1.00
CADA Nagpur Sorna 1.84 2.43 0.93 2.43 1.43 1.00
CADA Nagpur Umri 1.10 1.53 1.16 1.53 0.90 1.00
CADA Nagpur Wunna 0.10 0.09 0.29 0.21 0.00 1.00
SIC Sangli Chikotra 0.66 0.45 0.45 1.12 0.40 1.00
SIC Sangli Chitri 0.85 0.94 0.90 1.02 0.69 1.00
SIC Sangli Ghatprabha (Pathakwadi) 0.62 0.63 0.75 0.75 0.00 1.00
CIPC Chandrapur Ghorazari 0.99 0.66 1.53 1.48 0.66 1.00
SIC Sangli Jangamhatti 0.80 0.79 0.75 1.00 0.00 1.00
SIC Sangli Kadavi 0.27 0.21 0.21 0.40 0.16 1.00
SIC Sangli Kasari 0.80 0.91 1.02 0.91 0.51 1.00
SIC Sangli KC &Khodshi Backwater 0.72 1.00 1.00 1.00 0.62 1.00
SIC Sangli Kumbhi 0.51 0.64 0.64 0.64 0.39 1.00
SIC Sangli Morna (Sangli) 0.72 0.66 0.75 1.02 0.48 1.00
CIPC Chandrapur Naleshwar 0.86 0.56 0.39 1.00 0.56 1.00
SIC Sangli Patgaon 0.72 0.38 0.38 1.22 0.38 1.00
TIC Thane Rajanala 0.31 0.73 0.24 0.73 0.00 1.00
TIC Thane Wandri 0.47 0.90 0.95 0.99 0.11 1.00
SIC Sangli Yeoti Masoli 0.67 1.03 0.91 1.03 0.37 1.00
Surplus
Abundant
124

[Benchmarking Report 2018-19]
Plan group Circle Project FY Avg LY 2017-18 TY 2018-19 Past Max Past Min State Tar
CADA Beed Banganga 30525.00 24598.00 21216.00 25958.26 0.00 23000.00
SIC Sangli Basappawadi 53985.00 37342 48048.00 81251.63 34164.67 23000.00
CADA Beed Benitura 40339.00 40789.00 0.00 40789.47 0.00 23000.00
CADA Solapur Bori (Solapur) 15221.00 1257.00 35357.00 40492.60 0.00 23000.00
CADA Beed Chandani 98200.00 122588.00 0.00 122588.18 0.00 23000.00
CADA Solapur Ekrukh 18396.00 48.00 210.00 37057.47 48.20 23000.00
CADA Beed Harni 86724.00 101873.00 0.00 187866.35 0.00 23000.00
CADA Solapur Hingani (Pangaon) 42970.00 54268.00 0.00 54267.67 30036.80 23000.00
CADA Beed Jakapur 60524.00 72589.00 0.00 72588.85 0.00 23000.00
CADA Solapur Jawalgaon 41998.00 43255.00 43255.00 49398.97 30225.71 23000.00
CADA Beed Kada 92845.00 49204.00 0.00 134357.14 0.00 23000.00
CADA Beed Kadi 32070.00 36875.00 0.00 36875.00 0.00 23000.00
CADA Beed Kambli 14953.00 12896.00 0.00 17305.08 0.00 23000.00
CADA Pune Khairy 20652.00 20652.00 17540.00 20651.89 20651.89 23000.00
CADA Beed Khandala 99437.00 111187.00 0.00 113268.21 0.00 23000.00
CADA Beed Khandeshwar 79935.00 77934.00 0.00 105738.46 0.00 23000.00
CADA Beed Khasapur 65541.00 63045.00 0.00 63045.05 0.00 23000.00
CADA Beed Kurnoor 65387.00 81327.00 0.00 81326.75 29248.82 23000.00
CADA Solapur Mangi 26030.00 33524.00 42740.00 77625.00 0.00 23000.00
CADA Beed Mehakari 46748.00 50341.00 0.00 50341.39 0.00 23000.00
PIC Pune Nher 33637.00 26202.00 17582.00 41345.24 26202.20 23000.00
CADA Beed Ramganga 32254.00 24408.00 0.00 306129.41 0.00 23000.00
CADA Beed Rooty 43501.00 38531.00 0.00 53040.27 0.00 23000.00
CADA Beed Sakat 92487.00 95982.00 0.00 95981.52 0.00 23000.00
SIC Sangli Siddhewadi 158094.00 131830.00 57706.00 247880.17 48007.50 23000.00
CADA Pune Sina 18948.00 16559.00 10813.00 22784.99 16559.15 23000.00
CADA Beed Talwar 28535.00 32200.00 0.00 32200.00 0.00 23000.00
CADA Beed Turori 48590.00 54009.00 0.00 54008.88 0.00 23000.00
CADA Beed Wagholi 196832.00 64532.00 0.00 297242.13 64532.19 23000.00
CADA Jalgaon Agnawati 23520.00 9007.00 17299.00 54486.86 9006.59 25000.00
CADA Abad Ajantha Andhari 0.00 0.00 0.00 0.00 0.00 25000.00
CADA Abad Anjana Palashi 80399.00 0.00 0.00 80398.52 0.00 25000.00
CADA Jalgaon Bahula 44490.00 52956.00 58080.00 67069.65 0.00 25000.00
CADA Beed Belpara 338017.00 0.00 0.00 111915.25 0.00 25000.00
CADA Jalgaon Bhokarbari 10554.00 10512.00 10488.00 11243.85 9940.26 25000.00
CADA Beed Bindusara 8883.00 9471.00 0.00 9470.59 0.00 25000.00
CADA Beed Bodhegaon 190772.00 95386.00 0.00 95385.96 0.00 25000.00
CADA Jalgaon Bori 32968.00 164318.00 114839.00 164318.45 11363.50 25000.00
CADA Beed Borna 0.00 0.00 41038.00 0.00 0.00 25000.00
CADA Jalgaon Burai 26128.00 2331.00 2675.00 114676.36 0.00 25000.00
UWPC Amravati Chandrabhaga (Amravati) 10055.00 7571.00 40140.00 506692.16 6492.92 25000.00
CADA Beed Devarjan 56660.00 53917.00 58824.00 104940.54 45192.85 25000.00
CADA Abad Dhamna 0.00 0.00 0.00 0.00 0.00 25000.00
AIC Akola Dnyanganga 38548.00 64463.00 0.00 96546.67 14617.62 25000.00
CADA Abad Gadadgad 32622.00 14729.00 32193.00 76980.06 0.00 25000.00
CADA Abad Galhati 0.00 0.00 0.00 0.00 0.00 25000.00
CADA Beed Gharni 47426.00 54741.00 34545.00 54740.61 18925.34 25000.00
CADA Abad Girja 0.00 0.00 0.00 0.00 0.00 25000.00
CADA Nashik Haranbari 20362.00 17824.00 20910.00 28416.34 17716.81 25000.00
CADA Jalgaon Hiwara 15659.00 13435.00 12183.00 20449.65 13434.55 25000.00
CADA Abad Jivrekha 0.00 0.00 0.00 0.00 0.00 25000.00
Highly Deficit
Indicator IIIMedium Projects
Output per unit Irrigated Area (Rs./ha)
Deficit
125

[Benchmarking Report 2018-19]
Plan group Circle Project FY Avg LY 2017-18 TY 2018-19 Past Max Past Min State Tar
CADA Abad Jui 10267.00 0.00 0.00 17742.61 0.00 25000.00
CADA Abad Kalyan Girja 12607.00 0.00 0.00 116140.00 0.00 25000.00
CADA Jalgaon Kanoli 4320.00 8201.00 0.00 8781.26 0.00 25000.00
NIC Nanded Karadkhed 40093.00 38206.00 38399.00 42853.54 0.00 25000.00
CADA Abad Karpara 69546.00 114424.00 78778.00 114423.75 38017.28 25000.00
CADA Nashik Kelzar 21222.00 19069.00 25115.00 25627.64 19069.28 25000.00
CADA Abad Khelna 65394.00 0.00 0.00 65393.52 0.00 25000.00
NIC Nanded Kudala 34375.00 22182.00 40763.00 48566.46 0.00 25000.00
CADA Beed Kundlika 57900.00 0.00 35893.00 137679.39 0.00 25000.00
NIC Nanded Kundrala 71835.00 80092.00 0.00 87888.80 0.00 25000.00
CADA Abad Lahuki 0.00 0.00 0.00 0.00 0.00 25000.00
NIC Nanded Mahalingi 48617.00 63040.00 31746.00 63039.68 0.00 25000.00
CADA Beed Mahasangvi 105526.00 123971.00 0.00 426111.11 0.00 25000.00
CADA Jalgaon Manyad 138990.00 108218.00 181323.00 300272.80 73916.37 25000.00
AIC Akola Mas 36238.00 0.00 0.00 97338.54 0.00 25000.00
CADA Beed Masalga 282519.00 29092.00 47726.00 33545.08 0.00 25000.00
CADA Abad Masoli 133782.00 224260.00 231166.00 224260.42 107620.61 25000.00
AIC Akola Morna (Akola) 20260.00 16191.00 23268.00 28677.11 15926.87 25000.00
BIPC Buldhana Mun 38082.00 18929.00 0.00 104971.73 18928.57 25000.00
CADA Nashik Nagyasakya 23279.00 24978.00 0.00 26807.11 0.00 25000.00
AIC Akola Nirguna 29809.00 17012.00 26944.00 73379.76 15051.44 25000.00
AIC Akola Paldhag 43226.00 15377.00 0.00 143368.88 15377.24 25000.00
NIC Nanded Pethwadaj 43405.00 71279.00 17367.00 71279.41 0.00 25000.00
CADA Abad Pir Kalyan 0.00 − 0.00 0.00 0.00 25000.00
UWPC Amravati Purna (Achalpur) 10355.00 10840.00 10141.00 11014.57 9792.74 25000.00
CADA Abad Purna Nevpur 42168.00 0.00 0.00 49953.14 0.00 25000.00
CADA Beed Raigavan 151311.00 176778.00 0.00 176777.78 0.00 25000.00
CADA Jalgaon Rangawali 55823.00 102941.00 105801.00 166565.16 0.00 25000.00
CADA Beed Renapur 34480.00 14457.00 63938.00 38497.52 14457.22 25000.00
CADA Beed Rui 87109.00 63471.00 0.00 64335.71 0.00 25000.00
CADA Beed Sakol 60555.00 70490.00 53196.00 70489.91 37672.82 25000.00
CADA Beed Sangameshwar (Dokewadi) 80052.00 50536.00 0.00 77277.81 0.00 25000.00
UWPC Amravati Sapan 9041.00 40070.00 9272.00 57645.52 2334.85 25000.00
CADA Beed Saraswati 248088.00 187618.00 70000.00 187617.65 0.00 25000.00
UWPC Amravati Shahanoor 112381.00 283707.00 11812.00 302451.04 69879.57 25000.00
CADA Beed Sindphana 19725.00 23086.00 0.00 23085.94 0.00 25000.00
CADA Abad Sukhna 0.00 − 0.00 0.00 0.00 25000.00
CADA Beed Tawarja 72866.00 55626.00 42953.00 170937.44 0.00 25000.00
CADA Beed Terna 76088.00 90534.00 0.00 90534.09 0.00 25000.00
CADA Beed Tiru 46610.00 31922.00 42382.00 79145.81 11155.73 25000.00
CADA Jalgaon Tondapur 18750.00 26533.00 22865.00 26532.86 10286.09 25000.00
BIPC Buldhana Torna 36879.00 1092.00 0.00 92634.62 1091.67 25000.00
AIC Akola Uma 35707.00 61161.00 32296.00 61161.05 0.00 25000.00
BIPC Buldhana Utawali 28104.00 714.00 0.00 1340583.33 713.90 25000.00
CADA Beed Wan (Beed) 333345.00 166672.00 43553.00 166672.27 0.00 25000.00
CADA Beed Whati 39813.00 41545.00 2881.00 41545.33 0.00 25000.00
CADA Jalgaon Abhora 70047.00 55303.00 140354.00 148222.04 14462.09 25000.00
YIC Yavatmal Adan 57713.00 29770.00 6151007.00 64643.21 0.00 25000.00
CADA Nashik Adhala 56061.00 54576.00 47330.00 64669.33 30354.86 25000.00
CADA Nashik Alandi 152513.00 155133.00 121740.00 195806.20 116760.48 25000.00
CIPC Chandrapur Amal Nala 60805.00 4892.00 20704.00 95157.30 4892.31 25000.00
CADA Abad Ambadi 4076.00 0.00 0.00 65217.39 0.00 25000.00
PIC Pune Andhali 26614.00 31553.00 51150.00 31859.06 12957.84 25000.00
Deficit
Normal
126
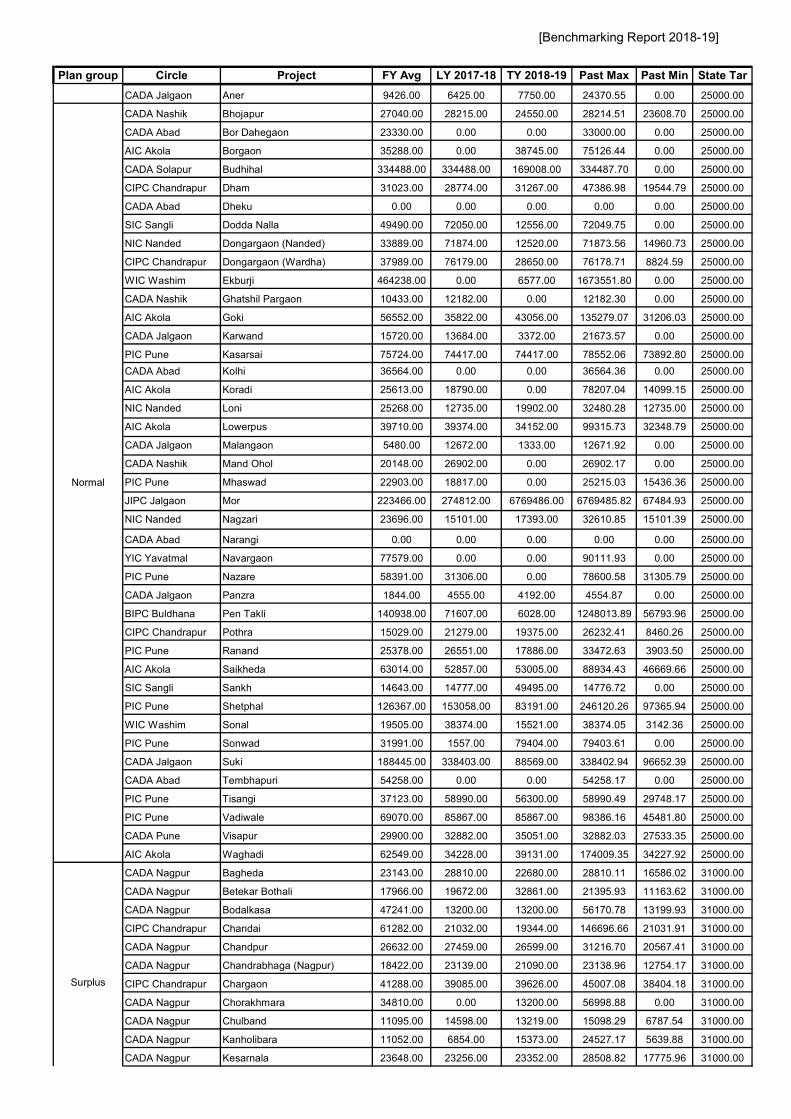
[Benchmarking Report 2018-19]
Plan group Circle Project FY Avg LY 2017-18 TY 2018-19 Past Max Past Min State Tar
CADA Jalgaon Aner 9426.00 6425.00 7750.00 24370.55 0.00 25000.00
CADA Nashik Bhojapur 27040.00 28215.00 24550.00 28214.51 23608.70 25000.00
CADA Abad Bor Dahegaon 23330.00 0.00 0.00 33000.00 0.00 25000.00
AIC Akola Borgaon 35288.00 0.00 38745.00 75126.44 0.00 25000.00
CADA Solapur Budhihal 334488.00 334488.00 169008.00 334487.70 0.00 25000.00
CIPC Chandrapur Dham 31023.00 28774.00 31267.00 47386.98 19544.79 25000.00
CADA Abad Dheku 0.00 0.00 0.00 0.00 0.00 25000.00
SIC Sangli Dodda Nalla 49490.00 72050.00 12556.00 72049.75 0.00 25000.00
NIC Nanded Dongargaon (Nanded) 33889.00 71874.00 12520.00 71873.56 14960.73 25000.00
CIPC Chandrapur Dongargaon (Wardha) 37989.00 76179.00 28650.00 76178.71 8824.59 25000.00
WIC Washim Ekburji 464238.00 0.00 6577.00 1673551.80 0.00 25000.00
CADA Nashik Ghatshil Pargaon 10433.00 12182.00 0.00 12182.30 0.00 25000.00
AIC Akola Goki 56552.00 35822.00 43056.00 135279.07 31206.03 25000.00
CADA Jalgaon Karwand 15720.00 13684.00 3372.00 21673.57 0.00 25000.00
PIC Pune Kasarsai 75724.00 74417.00 74417.00 78552.06 73892.80 25000.00
CADA Abad Kolhi 36564.00 0.00 0.00 36564.36 0.00 25000.00
AIC Akola Koradi 25613.00 18790.00 0.00 78207.04 14099.15 25000.00
NIC Nanded Loni 25268.00 12735.00 19902.00 32480.28 12735.00 25000.00
AIC Akola Lowerpus 39710.00 39374.00 34152.00 99315.73 32348.79 25000.00
CADA Jalgaon Malangaon 5480.00 12672.00 1333.00 12671.92 0.00 25000.00
CADA Nashik Mand Ohol 20148.00 26902.00 0.00 26902.17 0.00 25000.00
PIC Pune Mhaswad 22903.00 18817.00 0.00 25215.03 15436.36 25000.00
JIPC Jalgaon Mor 223466.00 274812.00 6769486.00 6769485.82 67484.93 25000.00
NIC Nanded Nagzari 23696.00 15101.00 17393.00 32610.85 15101.39 25000.00
CADA Abad Narangi 0.00 0.00 0.00 0.00 0.00 25000.00
YIC Yavatmal Navargaon 77579.00 0.00 0.00 90111.93 0.00 25000.00
PIC Pune Nazare 58391.00 31306.00 0.00 78600.58 31305.79 25000.00
CADA Jalgaon Panzra 1844.00 4555.00 4192.00 4554.87 0.00 25000.00
BIPC Buldhana Pen Takli 140938.00 71607.00 6028.00 1248013.89 56793.96 25000.00
CIPC Chandrapur Pothra 15029.00 21279.00 19375.00 26232.41 8460.26 25000.00
PIC Pune Ranand 25378.00 26551.00 17886.00 33472.63 3903.50 25000.00
AIC Akola Saikheda 63014.00 52857.00 53005.00 88934.43 46669.66 25000.00
SIC Sangli Sankh 14643.00 14777.00 49495.00 14776.72 0.00 25000.00
PIC Pune Shetphal 126367.00 153058.00 83191.00 246120.26 97365.94 25000.00
WIC Washim Sonal 19505.00 38374.00 15521.00 38374.05 3142.36 25000.00
PIC Pune Sonwad 31991.00 1557.00 79404.00 79403.61 0.00 25000.00
CADA Jalgaon Suki 188445.00 338403.00 88569.00 338402.94 96652.39 25000.00
CADA Abad Tembhapuri 54258.00 0.00 0.00 54258.17 0.00 25000.00
PIC Pune Tisangi 37123.00 58990.00 56300.00 58990.49 29748.17 25000.00
PIC Pune Vadiwale 69070.00 85867.00 85867.00 98386.16 45481.80 25000.00
CADA Pune Visapur 29900.00 32882.00 35051.00 32882.03 27533.35 25000.00
AIC Akola Waghadi 62549.00 34228.00 39131.00 174009.35 34227.92 25000.00
CADA Nagpur Bagheda 23143.00 28810.00 22680.00 28810.11 16586.02 31000.00
CADA Nagpur Betekar Bothali 17966.00 19672.00 32861.00 21395.93 11163.62 31000.00
CADA Nagpur Bodalkasa 47241.00 13200.00 13200.00 56170.78 13199.93 31000.00
CIPC Chandrapur Chandai 61282.00 21032.00 19344.00 146696.66 21031.91 31000.00
CADA Nagpur Chandpur 26632.00 27459.00 26599.00 31216.70 20567.41 31000.00
CADA Nagpur Chandrabhaga (Nagpur) 18422.00 23139.00 21090.00 23138.96 12754.17 31000.00
CIPC Chandrapur Chargaon 41288.00 39085.00 39626.00 45007.08 38404.18 31000.00
CADA Nagpur Chorakhmara 34810.00 0.00 13200.00 56998.88 0.00 31000.00
CADA Nagpur Chulband 11095.00 14598.00 13219.00 15098.29 6787.54 31000.00
CADA Nagpur Kanholibara 11052.00 6854.00 15373.00 24527.17 5639.88 31000.00
CADA Nagpur Kesarnala 23648.00 23256.00 23352.00 28508.82 17775.96 31000.00
Normal
Surplus
127

[Benchmarking Report 2018-19]
Plan group Circle Project FY Avg LY 2017-18 TY 2018-19 Past Max Past Min State Tar
CADA Nagpur Khairbanda 8660.00 11000.00 11101.00 18747.26 3472.75 31000.00
CADA Nagpur Khekranala 23322.00 25500.00 25351.00 25500.00 20458.82 31000.00
CADA Nagpur Kolar 21240.00 23233.00 23659.00 25531.43 18182.26 31000.00
CIPC Chandrapur Labhansarad 38950.00 1622.00 25820.00 106674.50 1621.50 31000.00
CADA Nagpur Makardhokada-Saiki Complex 15051.00 18872.00 15131.00 23291.24 10395.77 31000.00
CADA Nagpur Managadh 16025.00 11440.00 11088.00 23398.05 11440.37 31000.00
CADA Nagpur Mordham 19949.00 23234.00 21083.00 23234.06 12730.29 31000.00
CIPC Chandrapur Pakadigundam 27030.00 2505.00 15067.00 105511.36 2505.39 31000.00
CIPC Chandrapur Panchadhara 17413.00 27225.00 28649.00 27225.37 8843.61 31000.00
CADA Nagpur Pandhrabodi 47141.00 8274.00 18120.00 124530.98 8274.11 31000.00
CADA Nagpur Rengepar 21948.00 11440.00 11000.00 59199.43 8917.50 31000.00
CADA Nagpur Sangrampur 25462.00 10559.00 11000.00 33599.52 10559.47 31000.00
CADA Nagpur Sorna 18156.00 15371.00 32860.00 22972.83 15371.43 31000.00
CADA Nagpur Umri 24151.00 28626.00 22406.00 29245.59 17390.36 31000.00
CADA Nagpur Wunna 9741.00 6091.00 17264.00 15301.04 6091.17 31000.00
SIC Sangli Chikotra 32930.00 58604.00 52170.00 58604.44 21303.93 40000.00
SIC Sangli Chitri 41375.00 36731.00 27886.00 51142.39 32808.58 40000.00
SIC Sangli Ghatprabha (Pathakwadi) 22290.00 20944.00 18120.00 44431.58 0.00 40000.00
CIPC Chandrapur Ghorazari 41029.00 48474.00 40000.00 49188.57 31920.51 40000.00
SIC Sangli Jangamhatti 29897.00 17557.00 17929.00 39424.32 0.00 40000.00
SIC Sangli Kadavi 36354.00 66448.00 67662.00 66447.69 16609.39 40000.00
SIC Sangli Kasari 24716.00 26878.00 36856.00 64287.19 31.80 40000.00
SIC Sangli KC &Khodshi Backwater 94890.00 107680.00 140593.00 107679.56 88378.53 40000.00
SIC Sangli Kumbhi 28824.00 20230.00 19906.00 43617.00 19003.55 40000.00
SIC Sangli Morna (Sangli) 113949.00 97262.00 104702.00 155780.84 89522.51 40000.00
CIPC Chandrapur Naleshwar 57642.00 57232.00 80924.00 59829.38 57049.76 40000.00
SIC Sangli Patgaon 22089.00 40540.00 41062.00 40539.69 12060.89 40000.00
TIC Thane Rajanala 55771.00 8840.00 41143.00 258729.78 0.00 40000.00
TIC Thane Wandri 13977.00 16029.00 16791.00 16028.66 6436.92 40000.00
SIC Sangli Yeoti Masoli 66016.00 57707.00 56991.00 94384.18 49005.34 40000.00
Surplus
Abundant
128

[Benchmarking Report 2018-19]
Plan group Circle Project FY Avg LY 2017-18 TY 2018-19 Past Max Past Min State Tar
CADA Beed Banganga 5.68 6.52 3.57 6.52 0.00 2.99
SIC Sangli Basappawadi 18.44 0 2354.33 31.66 0.00 2.99
CADA Beed Benitura 6.13 6.67 0.00 6.67 0.00 2.99
CADA Solapur Bori (Solapur) 3.80 0.29 5.30 5.97 0.00 2.99
CADA Beed Chandani 16.72 18.62 0.00 101.24 0.00 2.99
CADA Solapur Ekrukh 5.55 0.01 0.10 17.02 0.00 2.99
CADA Beed Harni 10.17 10.90 0.00 18.62 0.00 2.99
CADA Solapur Hingani (Pangaon) 5.23 3.71 0.00 7.78 3.71 2.99
CADA Beed Jakapur 10.42 13.08 0.00 13.08 0.00 2.99
CADA Solapur Jawalgaon 5.63 2.85 2.85 12.83 2.85 2.99
CADA Beed Kada 0.70 0.94 0.00 1.03 0.00 2.99
CADA Beed Kadi 1.09 1.21 0.00 1.21 0.00 2.99
CADA Beed Kambli 1.06 1.22 0.00 1.22 0.00 2.99
CADA Pune Khairy 3.44 3.44 19.74 3.44 3.44 2.99
CADA Beed Khandala 10.75 16.30 0.00 16.30 3.10 2.99
CADA Beed Khandeshwar 19.07 12.02 0.00 25.36 0.00 2.99
CADA Beed Khasapur 10.75 7.99 0.00 24.68 0.00 2.99
CADA Beed Kurnoor 7.51 10.64 0.00 72.48 1.57 2.99
CADA Solapur Mangi 3.64 3.40 2.15 5.70 0.00 2.99
CADA Beed Mehakari 1.70 1.72 0.00 1.72 0.00 2.99
PIC Pune Nher 14.16 9.80 56.27 21.07 3.94 2.99
CADA Beed Ramganga 7.15 6.28 0.00 14.62 0.00 2.99
CADA Beed Rooty 1.45 1.50 0.00 1.50 0.00 2.99
CADA Beed Sakat 12.10 11.05 0.00 14.20 0.00 2.99
SIC Sangli Siddhewadi 59.92 145.44 0.00 145.44 0.00 2.99
CADA Pune Sina 3.34 2.58 5.75 5.09 2.58 2.99
CADA Beed Talwar 1.03 1.09 0.00 1.09 0.00 2.99
CADA Beed Turori 7.44 10.01 0.00 10.01 0.00 2.99
CADA Beed Wagholi 33.07 10.94 0.00 49.59 10.94 2.99
CADA Jalgaon Agnawati 23.80 0.00 20.76 32.12 0.00 3.15
CADA Abad Ajantha Andhari 0.00 0.00 0.00 0.00 0.00 3.15
CADA Abad Anjana Palashi 18.59 0.00 0.00 18.59 0.00 3.15
CADA Jalgaon Bahula 52.28 419.24 0.00 419.24 0.00 3.15
CADA Beed Belpara 2.79 3.83 0.00 7.86 0.00 3.15
CADA Jalgaon Bhokarbari 10.46 0.00 0.00 3.68 0.00 3.15
CADA Beed Bindusara 1.26 2.01 0.00 2.01 0.00 3.15
CADA Beed Bodhegaon 1.95 2.09 0.00 2.09 0.00 3.15
CADA Jalgaon Bori 15.21 0.00 0.00 45.91 0.00 3.15
CADA Beed Borna 5.32 5.81 0.00 6.44 4.51 3.15
CADA Jalgaon Burai 8.16 0.93 1.68 23.31 0.00 3.15
UWPC Amravati Chandrabhaga (Amravati) 11.09 11.21 18.35 39.51 3.61 3.15
CADA Beed Devarjan 7.94 6.44 8.85 32.36 6.30 3.15
CADA Abad Dhamna 0.00 0.00 0.00 0.00 0.00 3.15
AIC Akola Dnyanganga 5.38 16.48 0.00 16.48 2.73 3.15
CADA Abad Gadadgad 8.83 3.38 7.14 25.28 0.00 3.15
CADA Abad Galhati 0.00 0.00 0.00 0.00 0.00 3.15
CADA Beed Gharni 3.88 4.47 2.36 4.59 1.46 3.15
CADA Abad Girja 0.00 0.00 0.00 0.00 0.00 3.15
CADA Nashik Haranbari 14.15 14.70 5.26 88.67 0.00 3.15
CADA Jalgaon Hiwara 18.18 42.81 6.80 146.26 12.57 3.15
CADA Abad Jivrekha 0.00 0.00 0.00 0.00 0.00 3.15
Indicator IVMedium Projects
Output per unit Irrigation Water supply (Rs./cum)
Deficit
Highly Deficit
129

[Benchmarking Report 2018-19]
Plan group Circle Project FY Avg LY 2017-18 TY 2018-19 Past Max Past Min State Tar
CADA Abad Jui 2.98 0.00 0.00 8.88 0.00 3.15
CADA Abad Kalyan Girja 3.30 0.00 0.00 13.83 0.00 3.15
CADA Jalgaon Kanoli 1.79 0.00 0.00 6.18 0.00 3.15
NIC Nanded Karadkhed 33.63 39.55 17.60 65.21 0.00 3.15
CADA Abad Karpara 8.73 7.22 3.91 26.95 6.58 3.15
CADA Nashik Kelzar 10.91 9.92 7.33 25.59 6.93 3.15
CADA Abad Khelna 18.17 0.00 0.00 18.17 0.00 3.15
NIC Nanded Kudala 4.04 4.30 4.16 4.67 0.00 3.15
CADA Beed Kundlika 1.37 0.00 3.64 2.45 0.00 3.15
NIC Nanded Kundrala 14.37 14.41 0.00 21.49 0.00 3.15
CADA Abad Lahuki 0.00 0.00 0.00 0.00 0.00 3.15
NIC Nanded Mahalingi 7.47 14.12 8.90 14.12 0.00 3.15
CADA Beed Mahasangvi 1.15 1.13 0.00 2.19 0.00 3.15
CADA Jalgaon Manyad 44.16 38.47 263.34 134.50 18.28 3.15
AIC Akola Mas 3.64 0.00 0.00 6.01 0.00 3.15
CADA Beed Masalga 32.90 3.35 9.40 88.00 0.00 3.15
CADA Abad Masoli 25.39 21.57 47.46 73.38 14.34 3.15
AIC Akola Morna (Akola) 6.52 0.00 4.28 12.15 0.00 3.15
BIPC Buldhana Mun 3.46 1.89 0.00 4.53 1.89 3.15
CADA Nashik Nagyasakya 8.01 8.71 0.00 8.71 0.00 3.15
AIC Akola Nirguna 7.45 240.55 3.52 240.55 3.64 3.15
AIC Akola Paldhag 5.79 1.71 0.00 12.20 1.71 3.15
NIC Nanded Pethwadaj 4.23 9.15 1.92 9.15 0.00 3.15
CADA Abad Pir Kalyan 0.00 0.00 0.00 0.00 3.15
UWPC Amravati Purna (Achalpur) 2.36 1.86 1.70 13.08 1.70 3.15
CADA Abad Purna Nevpur 9.84 0.00 0.00 22.21 0.00 3.15
CADA Beed Raigavan 20.67 31.82 0.00 31.82 0.00 3.15
CADA Jalgaon Rangawali 20.16 46.55 39.89 78.14 0.00 3.15
CADA Beed Renapur 7.77 6.79 0.00 6.79 0.00 3.15
CADA Beed Rui 8.28 7.72 0.00 11.80 0.00 3.15
CADA Beed Sakol 7.68 7.26 7.49 9.03 7.26 3.15
CADA Beed Sangameshwar (Dokewadi) 7.34 5.44 0.00 11.03 4.53 3.15
UWPC Amravati Sapan 3.32 4.42 16.25 16.25 0.57 3.15
CADA Beed Saraswati 1.85 1.64 0.00 5.87 1.41 3.15
UWPC Amravati Shahanoor 62.31 345.37 17.07 345.37 7.50 3.15
CADA Beed Sindphana 1.68 1.68 0.00 1.68 0.00 3.15
CADA Abad Sukhna 0.00 0.00 0.00 0.00 3.15
CADA Beed Tawarja 4.47 4.49 5.54 4.58 0.00 3.15
CADA Beed Terna 8.35 9.17 0.00 9.17 0.00 3.15
CADA Beed Tiru 13.17 7.91 0.00 26.07 2.85 3.15
CADA Jalgaon Tondapur 38.10 45.75 0.00 188.46 14.27 3.15
BIPC Buldhana Torna 3.32 0.06 0.03 7.97 0.06 3.15
AIC Akola Uma 7.83 22.61 4.23 22.61 5.41 3.15
BIPC Buldhana Utawali 2.74 0.10 0.02 6.17 0.10 3.15
CADA Beed Wan (Beed) 3.38 3.74 0.00 3.74 3.09 3.15
CADA Beed Whati 4.43 4.56 0.00 4.56 0.00 3.15
CADA Jalgaon Abhora 99.77 53.81 98.82 225.35 17.80 3.15
YIC Yavatmal Adan 4.37 2.92 869.57 5.67 0.00 3.15
CADA Nashik Adhala 8.48 8.34 10.59 11.42 2.96 3.15
CADA Nashik Alandi 53.93 65.40 48.29 96.74 30.34 3.15
CIPC Chandrapur Amal Nala 18.69 0.00 6.62 22.99 0.00 3.15
CADA Abad Ambadi 1.57 0.00 0.00 13.64 0.00 3.15
PIC Pune Andhali 23.16 14.20 0.00 62.40 0.00 3.15
CADA Jalgaon Aner 2.52 2.03 2.79 8.63 0.00 3.15
Deficit
Normal
130

[Benchmarking Report 2018-19]
Plan group Circle Project FY Avg LY 2017-18 TY 2018-19 Past Max Past Min State Tar
CADA Nashik Bhojapur 7.13 6.90 3.39 8.17 0.00 3.15
CADA Abad Bor Dahegaon 9.33 0.00 0.00 15.21 0.00 3.15
AIC Akola Borgaon 8.68 0.00 14.83 10.85 0.00 3.15
CADA Solapur Budhihal 0.00 0.00 0.00 0.00 0.00 3.15
CIPC Chandrapur Dham 5.92 6.69 14.25 8.87 3.60 3.15
CADA Abad Dheku 0.00 0.00 0.00 0.00 0.00 3.15
SIC Sangli Dodda Nalla 21.61 30.30 0.00 30.30 0.00 3.15
NIC Nanded Dongargaon (Nanded) 6.66 15.88 1.80 15.88 2.99 3.15
CIPC Chandrapur Dongargaon (Wardha) 11.10 34.25 3.46 34.25 3.36 3.15
WIC Washim Ekburji 132.14 0.00 1.78 449.59 0.00 3.15
CADA Nashik Ghatshil Pargaon 2.54 6.15 0.00 6.15 0.00 3.15
AIC Akola Goki 7.81 6.91 10.74 10.03 5.00 3.15
CADA Jalgaon Karwand 6.13 5.27 3.10 13.21 0.00 3.15
PIC Pune Kasarsai 15.73 15.36 15.36 18.07 14.30 3.15
CADA Abad Kolhi 4.51 0.00 0.00 4.51 0.00 3.15
AIC Akola Koradi 5.85 5.00 0.00 9.81 4.50 3.15
NIC Nanded Loni 4.17 3.48 3.37 6.83 2.89 3.15
AIC Akola Lowerpus 8.19 15.77 5.85 15.77 6.38 3.15
CADA Jalgaon Malangaon 3.10 10.58 0.76 10.58 0.00 3.15
CADA Nashik Mand Ohol 3.85 5.72 0.00 5.72 0.00 3.15
PIC Pune Mhaswad 10.71 2.26 0.00 21.68 0.92 3.15
JIPC Jalgaon Mor 346.39 451.44 631.95 631.95 122.75 3.15
NIC Nanded Nagzari 4.69 3.74 4.42 6.65 3.74 3.15
CADA Abad Narangi 0.00 0.00 0.00 0.00 0.00 3.15
YIC Yavatmal Navargaon 8.60 0.00 0.00 9.64 0.00 3.15
PIC Pune Nazare 17.74 20.81 0.00 20.81 14.00 3.15
CADA Jalgaon Panzra 0.88 2.86 2.55 2.86 0.00 3.15
BIPC Buldhana Pen Takli 22.59 30.04 23.51 39.95 12.34 3.15
CIPC Chandrapur Pothra 2.61 4.14 4.52 8.20 1.23 3.15
PIC Pune Ranand 13.96 11.40 35.16 23.21 0.00 3.15
AIC Akola Saikheda 13.78 21.86 14.53 21.86 11.62 3.15
SIC Sangli Sankh 8.05 5.02 6.99 5.02 0.00 3.15
PIC Pune Shetphal 46.46 84.60 17.28 84.60 16.42 3.15
WIC Washim Sonal 4.97 7.08 1.37 8.91 0.75 3.15
PIC Pune Sonwad 20.91 1.21 24.86 771.33 0.00 3.15
CADA Jalgaon Suki 211.42 269.36 46.08 284.98 138.58 3.15
CADA Abad Tembhapuri 19.08 0.00 0.00 19.08 0.00 3.15
PIC Pune Tisangi 7.80 8.39 8.84 9.37 6.00 3.15
PIC Pune Vadiwale 14.31 16.37 16.37 17.59 8.82 3.15
CADA Pune Visapur 12.67 11.53 16.48 13.98 11.53 3.15
AIC Akola Waghadi 10.74 133.49 8.43 133.49 7.68 3.15
CADA Nagpur Bagheda 5.90 6.24 9.15 13.05 4.65 4.05
CADA Nagpur Betekar Bothali 6.97 7.76 7.65 10.09 3.82 4.05
CADA Nagpur Bodalkasa 15.36 4.22 4.06 20.15 4.22 4.05
CIPC Chandrapur Chandai 25.85 101.91 5.10 101.91 9.37 4.05
CADA Nagpur Chandpur 9.83 14.88 10.02 14.88 5.28 4.05
CADA Nagpur Chandrabhaga (Nagpur) 3.03 5.76 14.55 5.76 1.79 4.05
CIPC Chandrapur Chargaon 7.66 17.33 7.32 17.33 5.65 4.05
CADA Nagpur Chorakhmara 15.15 0.00 5.08 22.84 0.00 4.05
CADA Nagpur Chulband 2.63 6.51 4.85 6.51 1.29 4.05
CADA Nagpur Kanholibara 2.07 1.73 2.22 3.52 0.96 4.05
CADA Nagpur Kesarnala 6.84 9.96 8.73 9.96 4.19 4.05
CADA Nagpur Khairbanda 5.77 6.47 4.30 12.83 1.90 4.05
CADA Nagpur Khekranala 4.66 10.04 16.39 10.04 2.73 4.05
Normal
Surplus
131

[Benchmarking Report 2018-19]
Plan group Circle Project FY Avg LY 2017-18 TY 2018-19 Past Max Past Min State Tar
CADA Nagpur Kolar 5.86 9.23 12.41 9.23 3.95 4.05
CIPC Chandrapur Labhansarad 9.82 36.03 3.64 36.03 0.21 4.05
CADA Nagpur Makardhokada-Saiki Complex 3.16 3.81 3.73 5.20 2.29 4.05
CADA Nagpur Managadh 3.09 8.73 1.88 8.73 2.16 4.05
CADA Nagpur Mordham 4.32 8.20 15.79 8.20 1.68 4.05
CIPC Chandrapur Pakadigundam 12.17 0.00 0.01 18.76 0.00 4.05
CIPC Chandrapur Panchadhara 3.34 5.30 9.12 5.43 1.68 4.05
CADA Nagpur Pandhrabodi 8.87 1.35 2.33 22.46 1.35 4.05
CADA Nagpur Rengepar 8.06 3.57 2.96 15.77 3.57 4.05
CADA Nagpur Sangrampur 10.07 5.74 4.94 14.18 3.76 4.05
CADA Nagpur Sorna 6.28 6.06 4.99 7.72 4.99 4.05
CADA Nagpur Umri 5.47 9.28 10.29 9.28 3.32 4.05
CADA Nagpur Wunna 1.72 1.29 0.59 10.05 0.92 4.05
SIC Sangli Chikotra 8.10 10.80 6.94 12.99 4.59 5.40
SIC Sangli Chitri 5.71 6.27 4.61 6.44 4.03 5.40
SIC Sangli Ghatprabha (Pathakwadi) 1.75 3.53 2.92 3.53 0.00 5.40
CIPC Chandrapur Ghorazari 7.63 7.20 6.42 10.21 5.32 5.40
SIC Sangli Jangamhatti 3.65 3.39 2.81 5.98 0.00 5.40
SIC Sangli Kadavi 5.16 8.61 8.18 8.61 3.28 5.40
SIC Sangli Kasari 3.97 5.15 5.24 5.15 0.01 5.40
SIC Sangli KC &Khodshi Backwater 12.72 30.56 41.83 30.56 8.88 5.40
SIC Sangli Kumbhi 3.16 3.44 3.64 3.44 2.75 5.40
SIC Sangli Morna (Sangli) 9.90 7.13 9.58 18.19 7.02 5.40
CIPC Chandrapur Naleshwar 9.60 13.34 9.74 13.34 7.65 5.40
SIC Sangli Patgaon 3.12 3.04 2.81 4.28 2.60 5.40
TIC Thane Rajanala 4.28 1.01 1.58 12.94 0.00 5.40
TIC Thane Wandri 0.95 2.19 1.93 2.19 0.11 5.40
SIC Sangli Yeoti Masoli 17.61 24.45 17.13 24.45 13.75 5.40
Surplus
Abundant
132

[Benchmarking Report 2018-19]
Plan group Circle Project FY Avg LY 2017-18 TY 2018-19 Past Max Past Min State Tar
CADA Beed Banganga 0.15 0.17 0.03 0.43 0.05 1.00
SIC Sangli Basappawadi 0.30 0.14 0.01 0.43 0.14 1.00
CADA Beed Benitura 0.09 0.37 2.34 0.37 0.03 1.00
CADA Solapur Bori (Solapur) 0.18 0.15 1.86 0.72 0.07 1.00
CADA Beed Chandani 0.27 0.49 0.50 0.49 0.00 1.00
CADA Solapur Ekrukh 0.28 0.23 0.22 0.72 0.01 1.00
CADA Beed Harni 0.13 0.12 0.11 0.21 0.10 1.00
CADA Solapur Hingani (Pangaon) 0.28 0.64 0.00 0.64 0.18 1.00
CADA Beed Jakapur 0.01 0.01 0.04 0.01 0.00 1.00
CADA Solapur Jawalgaon 0.17 0.21 0.21 0.23 0.10 1.00
CADA Beed Kada 0.01 0.02 0.04 0.02 0.00 1.00
CADA Beed Kadi 0.07 0.18 0.36 0.18 0.00 1.00
CADA Beed Kambli 0.00 0.00 0.01 0.01 0.00 1.00
CADA Pune Khairy 0.17 0.17 0.02 0.17 0.17 1.00
CADA Beed Khandala 0.05 0.12 0.10 0.12 0.00 1.00
CADA Beed Khandeshwar 0.02 0.09 0.05 0.09 0.00 1.00
CADA Beed Khasapur 0.26 0.51 0.30 0.51 0.08 1.00
CADA Beed Kurnoor 0.11 0.83 0.71 0.92 0.01 1.00
CADA Solapur Mangi 0.13 0.21 0.00 0.41 0.03 1.00
CADA Beed Mehakari 0.04 0.06 0.23 0.09 0.00 1.00
PIC Pune Nher 0.66 0.28 0.12 1.88 0.28 1.00
CADA Beed Ramganga 0.08 0.07 0.00 0.17 0.00 1.00
CADA Beed Rooty 0.05 0.08 0.09 0.08 0.00 1.00
CADA Beed Sakat 0.06 0.13 0.08 0.13 0.00 1.00
SIC Sangli Siddhewadi 0.28 0.08 0.00 3.38 0.00 1.00
CADA Pune Sina 0.24 0.12 0.10 0.42 0.12 1.00
CADA Beed Talwar 0.04 0.07 0.00 0.08 0.00 1.00
CADA Beed Turori 0.16 0.11 0.49 0.33 0.10 1.00
CADA Beed Wagholi 0.32 0.30 0.11 0.35 0.30 1.00
CADA Jalgaon Agnawati 0.10 0.00 0.00 0.16 0.00 1.00
CADA Abad Ajantha Andhari 0.00 0.00 0.00 0.00 0.00 1.00
CADA Abad Anjana Palashi 0.00 0.00 0.00 0.00 0.00 1.00
CADA Jalgaon Bahula 0.10 0.07 -0.04 1.84 0.00 1.00
CADA Beed Belpara 0.23 1.25 0.37 1.25 0.00 1.00
CADA Jalgaon Bhokarbari 0.04 0.00 0.08 0.09 0.00 1.00
CADA Beed Bindusara 0.15 0.09 0.11 0.36 0.00 1.00
CADA Beed Bodhegaon 0.03 0.00 0.00 0.01 0.00 1.00
CADA Jalgaon Bori 0.16 0.06 0.05 0.29 0.06 1.00
CADA Beed Borna 0.05 0.11 0.00 0.11 0.00 1.00
CADA Jalgaon Burai 0.15 0.10 0.29 0.20 0.10 1.00
UWPC Amravati Chandrabhaga (Amravati) 0.00 0.00 0.00 0.00 0.00 1.00
CADA Beed Devarjan 0.59 1.10 1.38 1.10 0.33 1.00
CADA Abad Dhamna 0.00 0.00 0.00 0.00 0.00 1.00
AIC Akola Dnyanganga 0.47 1.32 1.54 1.32 0.20 1.00
CADA Abad Gadadgad 0.00 0.00 0.00 0.00 0.00 1.00
CADA Abad Galhati 1.01 0.51 0.00 0.51 0.00 1.00
CADA Beed Gharni 0.13 0.51 0.62 0.51 0.04 1.00
CADA Abad Girja 0.00 0.00 0.00 0.00 0.00 1.00
CADA Nashik Haranbari 0.15 0.33 1.19 0.33 0.07 1.00
CADA Jalgaon Hiwara 0.16 0.13 0.00 0.22 0.13 1.00
CADA Abad Jivrekha 0.00 0.00 0.00 0.00 0.00 1.00
Highly Deficit
Indicator VMedium Projects
Cost Recovery Ratio
Deficit
133

[Benchmarking Report 2018-19]
Plan group Circle Project FY Avg LY 2017-18 TY 2018-19 Past Max Past Min State Tar
CADA Abad Jui *26.44 0.00 0.00 1.00 0.00 1.00
CADA Abad Kalyan Girja 0.00 0.00 0.00 0.00 0.00 1.00
CADA Jalgaon Kanoli 0.16 0.11 0.48 0.47 0.11 1.00
NIC Nanded Karadkhed 0.18 0.41 0.15 0.41 0.15 1.00
CADA Abad Karpara 0.23 0.46 0.01 0.46 0.00 1.00
CADA Nashik Kelzar 0.13 0.25 0.21 0.25 0.05 1.00
CADA Abad Khelna 0.00 0.00 0.00 0.00 0.00 1.00
NIC Nanded Kudala 0.26 0.68 0.11 0.68 0.04 1.00
CADA Beed Kundlika 0.79 0.00 0.00 0.61 0.00 1.00
NIC Nanded Kundrala 0.10 0.14 0.06 0.27 0.02 1.00
CADA Abad Lahuki 0.00 0.00 0.00 0.00 0.00 1.00
NIC Nanded Mahalingi 0.03 0.01 0.07 0.08 0.01 1.00
CADA Beed Mahasangvi 0.16 0.18 0.09 0.62 0.00 1.00
CADA Jalgaon Manyad 0.12 0.07 0.05 0.23 0.07 1.00
AIC Akola Mas 0.04 0.13 0.18 0.13 0.01 1.00
CADA Beed Masalga 0.03 0.06 0.06 0.06 0.01 1.00
CADA Abad Masoli 1.12 0.35 0.12 2.42 0.35 1.00
AIC Akola Morna (Akola) 0.15 0.19 0.07 0.22 0.07 1.00
BIPC Buldhana Mun 0.47 15.14 0.02 15.14 0.23 1.00
CADA Nashik Nagyasakya 0.06 0.14 0.17 0.14 0.02 1.00
AIC Akola Nirguna 1.00 8.27 3.66 8.27 0.03 1.00
AIC Akola Paldhag 0.03 0.10 0.00 0.10 0.01 1.00
NIC Nanded Pethwadaj 0.01 0.04 0.03 0.04 0.01 1.00
CADA Abad Pir Kalyan 0.00 − 0.00 0.00 0.00 1.00
UWPC Amravati Purna (Achalpur) 0.00 0.00 0.00 0.00 0.00 1.00
CADA Abad Purna Nevpur 0.00 0.00 0.00 0.00 0.00 1.00
CADA Beed Raigavan 0.15 0.29 0.16 0.29 0.00 1.00
CADA Jalgaon Rangawali 0.38 0.36 0.25 11.10 0.17 1.00
CADA Beed Renapur 1.12 0.00 1.10 1.59 0.00 1.00
CADA Beed Rui 0.10 0.32 0.37 0.32 0.00 1.00
CADA Beed Sakol 0.17 0.53 0.23 0.53 0.07 1.00
CADA Beed Sangameshwar (Dokewadi) 0.13 0.20 0.09 0.20 0.08 1.00
UWPC Amravati Sapan 0.72 0.92 0.41 1.04 0.00 1.00
CADA Beed Saraswati 0.35 0.00 0.00 0.65 0.00 1.00
UWPC Amravati Shahanoor 0.77 0.43 1.57 1.46 0.28 1.00
CADA Beed Sindphana 0.26 0.38 0.09 0.62 0.00 1.00
CADA Abad Sukhna 0.00 − 0.00 0.00 0.00 1.00
CADA Beed Tawarja 0.33 0.99 0.32 0.99 0.14 1.00
CADA Beed Terna 0.37 0.95 0.90 0.95 0.01 1.00
CADA Beed Tiru 0.13 0.50 0.37 0.50 0.03 1.00
CADA Jalgaon Tondapur 0.32 0.17 0.28 0.92 0.17 1.00
BIPC Buldhana Torna 0.07 0.06 0.03 0.56 0.01 1.00
AIC Akola Uma 0.12 0.19 0.23 0.20 0.06 1.00
BIPC Buldhana Utawali 0.07 0.06 0.10 0.20 0.00 1.00
CADA Beed Wan (Beed) 0.79 1.33 0.00 1.33 0.10 1.00
CADA Beed Whati 0.38 0.71 0.57 0.78 0.00 1.00
CADA Jalgaon Abhora 0.07 0.07 0.19 0.12 0.01 1.00
YIC Yavatmal Adan 0.76 3.69 0.63 3.69 0.08 1.00
CADA Nashik Adhala 0.07 0.17 0.48 0.39 0.04 1.00
CADA Nashik Alandi 0.07 0.00 0.26 0.15 0.00 1.00
CIPC Chandrapur Amal Nala 3.21 1.57 3.82 10.10 1.57 1.00
CADA Abad Ambadi 0.00 0.00 0.00 0.00 0.00 1.00
PIC Pune Andhali 0.52 0.16 0.15 2.17 0.00 1.00
CADA Jalgaon Aner 0.12 0.07 0.07 0.41 0.07 1.00
Deficit
Normal
134

[Benchmarking Report 2018-19]
Plan group Circle Project FY Avg LY 2017-18 TY 2018-19 Past Max Past Min State Tar
CADA Nashik Bhojapur 0.05 0.00 0.28 0.17 0.00 1.00
CADA Abad Bor Dahegaon 0.23 0.00 0.00 0.18 0.00 1.00
AIC Akola Borgaon 0.01 0.01 0.02 0.02 0.01 1.00
CADA Solapur Budhihal 0.68 0.00 0.00 2.51 0.00 1.00
CIPC Chandrapur Dham 1.01 1.42 0.05 1.63 0.71 1.00
CADA Abad Dheku 0.00 0.00 0.00 0.00 0.00 1.00
SIC Sangli Dodda Nalla 0.25 0.69 1.35 0.69 0.09 1.00
NIC Nanded Dongargaon (Nanded) 0.06 0.21 0.02 0.21 0.00 1.00
CIPC Chandrapur Dongargaon (Wardha) 0.02 0.00 0.00 0.06 0.00 1.00
WIC Washim Ekburji 1.11 1.69 4.62 2.09 0.73 1.00
CADA Nashik Ghatshil Pargaon 0.00 0.01 0.07 0.02 0.00 1.00
AIC Akola Goki 0.44 0.40 0.50 0.52 0.34 1.00
CADA Jalgaon Karwand 0.25 0.32 0.23 0.74 0.17 1.00
PIC Pune Kasarsai 0.16 0.16 0.40 0.18 0.12 1.00
CADA Abad Kolhi 0.00 0.00 0.00 0.00 0.00 1.00
AIC Akola Koradi 0.11 0.03 0.28 0.26 0.03 1.00
NIC Nanded Loni 0.01 0.00 0.01 0.02 0.00 1.00
AIC Akola Lowerpus 0.10 0.33 0.08 0.33 0.05 1.00
CADA Jalgaon Malangaon 0.50 0.41 1.16 0.85 0.00 1.00
CADA Nashik Mand Ohol 0.02 0.07 0.08 0.16 0.01 1.00
PIC Pune Mhaswad 0.12 0.04 0.00 0.27 0.04 1.00
JIPC Jalgaon Mor 0.04 0.02 0.00 0.10 0.00 1.00
NIC Nanded Nagzari 0.17 0.18 0.14 0.21 0.09 1.00
CADA Abad Narangi 2.03 0.00 0.00 0.59 0.00 1.00
YIC Yavatmal Navargaon 0.00 0.00 0.00 0.00 0.00 1.00
PIC Pune Nazare 1.96 7.63 *734844.34 7.63 0.00 1.00
CADA Jalgaon Panzra 0.47 0.17 0.33 1.06 0.00 1.00
BIPC Buldhana Pen Takli 0.13 0.50 0.22 0.50 0.05 1.00
CIPC Chandrapur Pothra 0.57 0.04 0.03 2.08 0.01 1.00
PIC Pune Ranand 0.31 0.16 0.24 0.69 0.00 1.00
AIC Akola Saikheda 0.06 0.09 0.09 0.09 0.04 1.00
SIC Sangli Sankh 0.52 0.52 0.85 0.52 0.00 1.00
PIC Pune Shetphal 0.33 0.33 0.00 0.73 0.07 1.00
WIC Washim Sonal 0.20 1.63 0.48 1.63 0.05 1.00
PIC Pune Sonwad 0.15 0.13 0.15 0.21 0.11 1.00
CADA Jalgaon Suki 0.15 0.18 0.34 0.28 0.03 1.00
CADA Abad Tembhapuri 0.00 0.00 0.00 0.00 0.00 1.00
PIC Pune Tisangi 0.30 0.24 0.24 0.54 0.07 1.00
PIC Pune Vadiwale 0.38 0.89 0.89 0.89 0.03 1.00
CADA Pune Visapur 0.43 0.30 0.07 0.64 0.30 1.00
AIC Akola Waghadi 0.07 0.06 0.07 0.49 0.05 1.00
CADA Nagpur Bagheda 0.05 0.18 0.17 0.18 0.01 1.00
CADA Nagpur Betekar Bothali 0.07 0.08 0.13 0.16 0.04 1.00
CADA Nagpur Bodalkasa 0.15 0.11 0.36 0.27 0.10 1.00
CIPC Chandrapur Chandai 0.30 1.47 0.03 1.47 0.02 1.00
CADA Nagpur Chandpur 0.17 0.51 0.35 0.51 0.07 1.00
CADA Nagpur Chandrabhaga (Nagpur) 0.03 0.02 0.03 0.05 0.02 1.00
CIPC Chandrapur Chargaon 0.16 0.10 0.16 0.23 0.10 1.00
CADA Nagpur Chorakhmara 0.08 0.04 0.29 0.11 0.04 1.00
CADA Nagpur Chulband 0.05 0.04 0.20 0.12 0.02 1.00
CADA Nagpur Kanholibara 0.46 0.06 0.03 2.31 0.00 1.00
CADA Nagpur Kesarnala 0.01 0.01 0.03 0.05 0.00 1.00
CADA Nagpur Khairbanda 0.23 0.20 0.44 0.39 0.12 1.00
CADA Nagpur Khekranala 0.13 0.12 0.91 0.65 0.03 1.00
Normal
Surplus
135

[Benchmarking Report 2018-19]
Plan group Circle Project FY Avg LY 2017-18 TY 2018-19 Past Max Past Min State Tar
CADA Nagpur Kolar 0.18 0.17 0.53 0.31 0.12 1.00
CIPC Chandrapur Labhansarad 0.13 0.12 0.15 0.15 0.10 1.00
CADA Nagpur Makardhokada-Saiki Complex 0.18 0.21 0.12 0.45 0.11 1.00
CADA Nagpur Managadh 0.03 0.04 0.02 0.08 0.02 1.00
CADA Nagpur Mordham 0.05 0.04 0.04 0.08 0.04 1.00
CIPC Chandrapur Pakadigundam 0.94 1.53 1.69 1.53 0.75 1.00
CIPC Chandrapur Panchadhara 0.02 0.06 0.02 0.06 0.02 1.00
CADA Nagpur Pandhrabodi 0.22 0.14 0.22 0.45 0.14 1.00
CADA Nagpur Rengepar 0.10 0.06 0.52 0.28 0.06 1.00
CADA Nagpur Sangrampur 0.04 0.00 0.00 0.11 0.00 1.00
CADA Nagpur Sorna 0.11 0.13 0.15 0.18 0.06 1.00
CADA Nagpur Umri 0.04 0.07 0.33 0.16 0.01 1.00
CADA Nagpur Wunna 4.57 3.58 3.71 13.59 0.00 1.00
SIC Sangli Chikotra 0.47 0.33 0.60 0.64 0.33 1.00
SIC Sangli Chitri 1.83 1.57 1.81 2.77 1.57 1.00
SIC Sangli Ghatprabha (Pathakwadi) 0.87 0.73 0.42 1.02 0.69 1.00
CIPC Chandrapur Ghorazari 0.10 0.04 0.11 0.19 0.04 1.00
SIC Sangli Jangamhatti 1.84 1.26 1.39 3.64 0.76 1.00
SIC Sangli Kadavi 0.58 0.75 1.64 0.75 0.39 1.00
SIC Sangli Kasari 0.69 0.59 0.73 1.26 0.45 1.00
SIC Sangli KC &Khodshi Backwater 0.29 0.42 0.61 0.98 0.14 1.00
SIC Sangli Kumbhi 1.14 1.14 1.86 1.40 1.01 1.00
SIC Sangli Morna (Sangli) 0.73 0.89 1.25 0.89 0.61 1.00
CIPC Chandrapur Naleshwar 0.14 0.05 0.10 0.36 0.05 1.00
SIC Sangli Patgaon 0.85 1.36 1.59 1.36 0.66 1.00
TIC Thane Rajanala 0.04 0.02 0.02 0.08 0.00 1.00
TIC Thane Wandri 0.03 0.01 0.02 0.39 0.01 1.00
SIC Sangli Yeoti Masoli 1.22 0.79 1.79 3.04 0.64 1.00
Surplus
Abundant
136

[Benchmarking Report 2018-19]
Plan group Circle Project FY Avg LY 2017-18 TY 2018-19 Past Max Past Min State Tar
CADA Beed Banganga 1774.59 1402.95 10525.18 1402.95 0.00 1200.00
SIC Sangli Basappawadi 1343.08 1352.46 1683.67 2004.05 1073.75 1200.00
CADA Beed Benitura 11111.94 2861.00 0.00 7163.07 0.00 1200.00
CADA Solapur Bori (Solapur) 1847.37 2622.51 13861.90 2790.95 0.00 1200.00
CADA Beed Chandani 1830.81 1185.19 0.00 1967.03 0.00 1200.00
CADA Solapur Ekrukh 3747.31 3649.02 3220.80 7787.36 1133.29 1200.00
CADA Beed Harni 3251.88 3797.65 0.00 4010.96 0.00 1200.00
CADA Solapur Hingani (Pangaon) 2657.94 2608.82 0.00 10592.00 1761.73 1200.00
CADA Beed Jakapur 6624.26 3658.54 4976.30 3658.54 0.00 1200.00
CADA Solapur Jawalgaon 4132.44 4557.47 4557.47 23600.00 1431.02 1200.00
CADA Beed Kada 141616.13 45398.23 0.00 111035.71 0.00 1200.00
CADA Beed Kadi 13946.36 7111.11 0.00 7111.11 0.00 1200.00
CADA Beed Kambli 23161.66 10821.48 0.00 10821.48 0.00 1200.00
CADA Pune Khairy 1943.08 1943.08 20383.69 1943.08 1943.08 1200.00
CADA Beed Khandala 7460.66 5334.95 0.00 8317.46 0.00 1200.00
CADA Beed Khandeshwar 4027.87 1159.37 0.00 11923.08 0.00 1200.00
CADA Beed Khasapur 1772.00 1186.81 0.00 1402.60 0.00 1200.00
CADA Beed Kurnoor 6547.83 1069.08 0.00 24986.86 1069.08 1200.00
CADA Solapur Mangi 3054.61 1225.28 0.00 302500.00 0.00 1200.00
CADA Beed Mehakari 25892.37 9676.74 0.00 14850.00 0.00 1200.00
PIC Pune Nher 473.87 733.80 1196.68 2205.88 94.84 1200.00
CADA Beed Ramganga 2336.56 1759.95 0.00 20729.41 0.00 1200.00
CADA Beed Rooty 20882.76 13374.13 0.00 18000.00 0.00 1200.00
CADA Beed Sakat 2154.04 1676.09 0.00 13829.79 0.00 1200.00
SIC Sangli Siddhewadi 1058.16 800.00 1474.93 4315.20 0.00 1200.00
CADA Pune Sina 705.90 667.48 8025.60 767.61 667.48 1200.00
CADA Beed Talwar 27346.47 12487.50 0.00 12487.50 0.00 1200.00
CADA Beed Turori 11860.05 11094.67 19090.91 56000.00 0.00 1200.00
CADA Beed Wagholi 1069.14 1547.93 0.00 1547.93 705.75 1200.00
CADA Jalgaon Agnawati 2103.80 3046.15 2143.68 3046.15 1690.24 1200.00
CADA Abad Ajantha Andhari 0.00 0.00 0.00 0.00 0.00 1200.00
CADA Abad Anjana Palashi 0.00 0.00 0.00 0.00 0.00 1200.00
CADA Jalgaon Bahula 1642.83 3065.70 7968.86 3065.70 0.00 1200.00
CADA Beed Belpara 38154.24 0.00 0.00 4306.78 0.00 1200.00
CADA Jalgaon Bhokarbari 4399.44 4145.41 6135.29 7659.74 2687.70 1200.00
CADA Beed Bindusara 71278.46 48092.35 0.00 48092.35 0.00 1200.00
CADA Beed Bodhegaon 22789.47 0.00 0.00 0.00 0.00 1200.00
CADA Jalgaon Bori 3932.95 8823.30 12035.43 8823.30 1203.04 1200.00
CADA Beed Borna 0.00 0.00 0.00 0.00 0.00 1200.00
CADA Jalgaon Burai 870.77 626.13 790.08 1100.77 626.13 1200.00
UWPC Amravati Chandrabhaga (Amravati) 0.00 0.00 0.00 0.00 0.00 1200.00
CADA Beed Devarjan 3653.30 2112.68 4395.60 12432.43 2112.68 1200.00
CADA Abad Dhamna 0.00 0.00 0.00 0.00 0.00 1200.00
AIC Akola Dnyanganga 11546.91 4928.10 0.00 82583.97 4630.92 1200.00
CADA Abad Gadadgad 0.00 0.00 0.00 0.00 0.00 1200.00
CADA Abad Galhati 159.09 318.18 0.00 318.18 0.00 1200.00
CADA Beed Gharni 3612.21 1659.39 2202.91 4685.38 1659.39 1200.00
CADA Abad Girja 0.00 0.00 0.00 0.00 0.00 1200.00
CADA Nashik Haranbari 2307.83 1128.30 4263.43 33165.37 1128.30 1200.00
CADA Jalgaon Hiwara 1278.96 1812.23 2694.09 1882.10 936.51 1200.00
CADA Abad Jivrekha 0.00 0.00 0.00 0.00 0.00 1200.00
Indicator VIMedium Projects
Operation & Maintenance Cost per unit Area (Rs./ha)
Deficit
Highly Deficit
137

[Benchmarking Report 2018-19]
Plan group Circle Project FY Avg LY 2017-18 TY 2018-19 Past Max Past Min State Tar
CADA Abad Jui 30.12 0.00 0.00 282.75 0.00 1200.00
CADA Abad Kalyan Girja 0.00 0.00 0.00 0.00 0.00 1200.00
CADA Jalgaon Kanoli 1659.80 3847.73 0.00 3847.73 429.51 1200.00
NIC Nanded Karadkhed 7870.87 1688.24 22260.87 45437.04 0.00 1200.00
CADA Abad Karpara 1528.78 2933.64 2882.31 2933.64 349.37 1200.00
CADA Nashik Kelzar 1729.23 1330.64 3659.52 3638.18 1330.64 1200.00
CADA Abad Khelna 0.00 0.00 0.00 0.00 0.00 1200.00
NIC Nanded Kudala 5534.32 1107.90 10737.33 7382.44 0.00 1200.00
CADA Beed Kundlika 2858.75 0.00 0.00 6797.71 0.00 1200.00
NIC Nanded Kundrala 5452.06 10671.05 36363.64 16045.59 0.00 1200.00
CADA Abad Lahuki 0.00 0.00 0.00 0.00 0.00 1200.00
NIC Nanded Mahalingi 7211.95 6960.32 8591.55 38573.33 0.00 1200.00
CADA Beed Mahasangvi 63601.72 44180.00 0.00 112222.22 0.00 1200.00
CADA Jalgaon Manyad 1625.48 1095.30 6961.15 4226.23 1044.07 1200.00
AIC Akola Mas 17731.54 0.00 0.00 85250.00 0.00 1200.00
CADA Beed Masalga 33195.46 18026.22 42494.48 67725.41 0.00 1200.00
CADA Abad Masoli 1275.33 3004.53 13989.64 3004.53 516.40 1200.00
AIC Akola Morna (Akola) 1747.27 3181.70 3651.51 3181.70 791.22 1200.00
BIPC Buldhana Mun 1540.91 1761.90 0.00 4809.19 916.80 1200.00
CADA Nashik Nagyasakya 5723.71 3690.27 0.00 5060.91 0.00 1200.00
AIC Akola Nirguna 3100.21 3791.37 3920.78 4499.63 2142.41 1200.00
AIC Akola Paldhag 13055.97 5813.01 0.00 40734.87 4364.94 1200.00
NIC Nanded Pethwadaj 14733.51 34955.88 5472.53 34955.88 0.00 1200.00
CADA Abad Pir Kalyan 0.00 − 0.00 0.00 0.00 1200.00
UWPC Amravati Purna (Achalpur) 0.00 0.00 0.00 0.00 0.00 1200.00
CADA Abad Purna Nevpur 0.00 0.00 0.00 0.00 0.00 1200.00
CADA Beed Raigavan 10620.62 89833.33 0.00 89833.33 0.00 1200.00
CADA Jalgaon Rangawali 569.80 579.82 705.43 971.71 31.91 1200.00
CADA Beed Renapur 2087.73 0.00 18750.00 2314.05 0.00 1200.00
CADA Beed Rui 7134.45 3529.41 0.00 3529.41 0.00 1200.00
CADA Beed Sakol 3839.73 2752.29 4195.80 9762.53 1947.31 1200.00
CADA Beed Sangameshwar (Dokewadi) 1203.24 1213.87 0.00 1213.87 0.00 1200.00
UWPC Amravati Sapan 49.61 119.25 26.08 220.66 0.00 1200.00
CADA Beed Saraswati 9588.24 0.00 0.00 4411.76 0.00 1200.00
UWPC Amravati Shahanoor 819.50 989.10 699.15 3649.85 340.85 1200.00
CADA Beed Sindphana 6650.79 5851.56 0.00 5851.56 0.00 1200.00
CADA Abad Sukhna 0.00 − 0.00 0.00 0.00 1200.00
CADA Beed Tawarja 13260.50 2736.98 22184.80 21372.75 0.00 1200.00
CADA Beed Terna 3514.65 1338.64 0.00 1338.64 0.00 1200.00
CADA Beed Tiru 1249.09 1060.07 12751.00 1834.83 561.46 1200.00
CADA Jalgaon Tondapur 2292.72 2707.14 3673.45 4158.75 1520.72 1200.00
BIPC Buldhana Torna 5523.11 11937.50 0.00 11937.50 2156.72 1200.00
AIC Akola Uma 5204.36 10420.31 3824.95 10420.31 0.00 1200.00
BIPC Buldhana Utawali 2982.68 10863.76 0.00 66666.67 1080.47 1200.00
CADA Beed Wan (Beed) 16260.50 9075.63 0.00 9075.63 0.00 1200.00
CADA Beed Whati 4711.57 2974.50 13016.95 2974.50 0.00 1200.00
CADA Jalgaon Abhora 862.53 1078.99 998.21 1078.99 583.98 1200.00
YIC Yavatmal Adan 1643.88 2574.26 782.72 2574.26 0.00 1200.00
CADA Nashik Adhala 5885.35 1987.69 1181.22 9546.53 1939.63 1200.00
CADA Nashik Alandi 1853.88 1022.33 1176.77 2598.80 1022.33 1200.00
CIPC Chandrapur Amal Nala 1711.61 1462.82 1338.72 2447.33 710.26 1200.00
CADA Abad Ambadi 0.00 0.00 0.00 0.00 0.00 1200.00
PIC Pune Andhali 628.74 1221.00 2277.04 1221.00 0.00 1200.00
Deficit
Normal
138

[Benchmarking Report 2018-19]
Plan group Circle Project FY Avg LY 2017-18 TY 2018-19 Past Max Past Min State Tar
CADA Jalgaon Aner 648.66 658.79 786.18 1425.05 136.53 1200.00
CADA Nashik Bhojapur 4498.28 3516.08 6974.03 16458.94 3516.08 1200.00
CADA Abad Bor Dahegaon 9740.00 0.00 0.00 33400.00 0.00 1200.00
AIC Akola Borgaon 10653.73 0.00 3428.59 37470.98 0.00 1200.00
CADA Solapur Budhihal 16066.94 334.70 376.92 334.70 0.00 1200.00
CIPC Chandrapur Dham 4289.19 3240.29 5498.90 5912.63 2578.31 1200.00
CADA Abad Dheku 0.00 0.00 0.00 0.00 0.00 1200.00
SIC Sangli Dodda Nalla 698.27 228.86 473.25 3905.66 0.00 1200.00
NIC Nanded Dongargaon (Nanded) 1985.34 1174.61 6109.39 2666.18 1174.61 1200.00
CIPC Chandrapur Dongargaon (Wardha) 3769.35 2853.04 9860.00 4549.11 2853.04 1200.00
WIC Washim Ekburji 1804.66 0.00 975.02 6675.27 0.00 1200.00
CADA Nashik Ghatshil Pargaon 28137.57 9301.49 0.00 88623.50 0.00 1200.00
AIC Akola Goki 4337.05 44568.25 1869.48 44568.25 1516.11 1200.00
CADA Jalgaon Karwand 1088.18 1510.21 1746.93 1510.21 518.22 1200.00
PIC Pune Kasarsai 1670.27 1852.06 2281.65 1852.06 1414.55 1200.00
CADA Abad Kolhi 0.00 0.00 0.00 0.00 0.00 1200.00
AIC Akola Koradi 3312.68 8975.03 0.00 13007.25 711.97 1200.00
NIC Nanded Loni 8352.04 6907.67 8667.58 24613.92 3315.57 1200.00
AIC Akola Lowerpus 3749.63 3476.37 2802.57 13071.91 2838.81 1200.00
CADA Jalgaon Malangaon 508.43 536.63 787.36 1292.33 0.00 1200.00
CADA Nashik Mand Ohol 20274.16 2565.22 0.00 76072.14 0.00 1200.00
PIC Pune Mhaswad 1103.31 9258.96 0.00 18300.00 488.98 1200.00
JIPC Jalgaon Mor 1217.93 1835.61 0.00 1835.61 0.00 1200.00
NIC Nanded Nagzari 6483.37 10727.63 11296.10 10727.63 4492.91 1200.00
CADA Abad Narangi 0.00 0.00 0.00 0.00 0.00 1200.00
YIC Yavatmal Navargaon 0.00 0.00 0.00 0.00 0.00 1200.00
PIC Pune Nazare 597.65 82.32 0.00 931.88 0.00 1200.00
CADA Jalgaon Panzra 278.24 261.06 295.08 404.99 0.00 1200.00
BIPC Buldhana Pen Takli 3541.81 463.21 266.02 52232.04 463.21 1200.00
CIPC Chandrapur Pothra 3740.43 3079.23 2365.88 5851.30 1102.55 1200.00
PIC Pune Ranand 281.21 519.14 1526.23 519.14 0.00 1200.00
AIC Akola Saikheda 3462.57 2525.58 1836.86 5131.84 2472.88 1200.00
SIC Sangli Sankh 66.52 107.76 657.89 107.76 0.00 1200.00
PIC Pune Shetphal 860.67 707.33 0.00 6891.82 493.00 1200.00
WIC Washim Sonal 1086.60 5427.48 1517.71 5427.48 703.20 1200.00
PIC Pune Sonwad 868.39 327.55 1399.45 1399.45 327.55 1200.00
CADA Jalgaon Suki 559.66 463.10 624.02 698.65 463.10 1200.00
CADA Abad Tembhapuri 0.00 0.00 0.00 0.00 0.00 1200.00
PIC Pune Tisangi 404.29 613.11 4971.43 4531.58 258.06 1200.00
PIC Pune Vadiwale 2007.82 2414.73 2414.73 2414.73 1521.74 1200.00
CADA Pune Visapur 449.69 625.97 2905.67 625.97 309.74 1200.00
AIC Akola Waghadi 5414.81 51282.05 3019.35 51282.05 293.74 1200.00
CADA Nagpur Bagheda 3521.74 865.55 1115.57 11396.22 865.55 1200.00
CADA Nagpur Betekar Bothali 2299.28 1911.01 1257.61 5791.76 1213.41 1200.00
CADA Nagpur Bodalkasa 1328.17 7587.17 1072.70 7587.17 614.60 1200.00
CIPC Chandrapur Chandai 1918.03 1310.03 2315.92 3355.43 167.48 1200.00
CADA Nagpur Chandpur 1178.03 932.06 1363.36 1564.76 932.06 1200.00
CADA Nagpur Chandrabhaga (Nagpur) 5095.30 3114.68 3380.90 10068.81 3114.68 1200.00
CIPC Chandrapur Chargaon 2283.18 1922.17 2556.69 2840.09 1361.01 1200.00
CADA Nagpur Chorakhmara 1563.41 0.00 1547.02 1720.51 0.00 1200.00
CADA Nagpur Chulband 2091.62 2982.10 1481.79 3468.14 1341.54 1200.00
CADA Nagpur Kanholibara 3262.48 2910.90 5195.93 4741.03 1753.03 1200.00
CADA Nagpur Kesarnala 6731.74 2081.44 1333.33 21076.50 2081.44 1200.00
Normal
Surplus
139

[Benchmarking Report 2018-19]
Plan group Circle Project FY Avg LY 2017-18 TY 2018-19 Past Max Past Min State Tar
CADA Nagpur Khairbanda 783.85 1751.84 914.48 1751.84 473.56 1200.00
CADA Nagpur Khekranala 4468.13 2906.25 2438.29 8034.58 2155.53 1200.00
CADA Nagpur Kolar 2350.25 2227.63 1457.73 3481.53 1284.00 1200.00
CIPC Chandrapur Labhansarad 1406.44 948.50 2706.13 2374.22 948.50 1200.00
CADA Nagpur Makardhokada-Saiki Complex 2410.52 2180.93 2135.43 3822.56 916.53 1200.00
CADA Nagpur Managadh 4054.70 3100.59 3840.10 7629.41 2214.22 1200.00
CADA Nagpur Mordham 3907.22 2397.24 2931.53 7128.47 2397.24 1200.00
CIPC Chandrapur Pakadigundam 2655.45 1478.71 535.04 8200.28 1478.71 1200.00
CIPC Chandrapur Panchadhara 3672.55 1116.23 7620.60 8007.87 1116.23 1200.00
CADA Nagpur Pandhrabodi 2370.99 4184.19 7338.62 4184.19 957.64 1200.00
CADA Nagpur Rengepar 769.20 1305.00 318.19 1305.00 169.17 1200.00
CADA Nagpur Sangrampur 2515.33 0.00 0.00 6196.33 0.00 1200.00
CADA Nagpur Sorna 1763.64 1665.48 2895.00 3918.14 914.71 1200.00
CADA Nagpur Umri 6327.68 2199.23 1308.95 15439.72 2199.23 1200.00
CADA Nagpur Wunna 11200.24 14720.80 212735.85 14720.80 6173.01 1200.00
SIC Sangli Chikotra 886.94 1294.70 1280.49 1520.07 586.66 1200.00
SIC Sangli Chitri 630.93 612.67 618.92 784.88 347.01 1200.00
SIC Sangli Ghatprabha (Pathakwadi) 785.92 364.46 824.33 1465.22 0.00 1200.00
CIPC Chandrapur Ghorazari 1723.04 3147.01 2053.91 3147.01 1167.96 1200.00
SIC Sangli Jangamhatti 736.93 706.27 804.41 788.70 0.00 1200.00
SIC Sangli Kadavi 1599.00 1862.35 1942.19 3633.36 1033.26 1200.00
SIC Sangli Kasari 531.64 583.64 733.47 684.34 286.90 1200.00
SIC Sangli KC &Khodshi Backwater 2754.39 1448.98 1768.41 6098.31 729.78 1200.00
SIC Sangli Kumbhi 919.97 834.87 722.78 1347.52 676.71 1200.00
SIC Sangli Morna (Sangli) 1575.99 1567.81 1379.15 2491.96 759.33 1200.00
CIPC Chandrapur Naleshwar 2904.03 4178.32 4178.32 4178.32 933.06 1200.00
SIC Sangli Patgaon 880.52 1478.95 1240.80 1480.36 518.74 1200.00
TIC Thane Rajanala 9140.20 3316.98 15406.38 78759.29 0.00 1200.00
TIC Thane Wandri 4962.00 2556.24 2429.93 33572.31 1045.38 1200.00
SIC Sangli Yeoti Masoli 635.57 576.05 669.34 831.35 408.58 1200.00
Surplus
Abundant
140

[Benchmarking Report 2018-19]
Plan group Circle Project FY Avg LY 2017-18 TY 2018-19 Past Max Past Min State Tar
CADA Beed Banganga 0.29 0.37 1.68 0.09 0.01 0.16
SIC Sangli Basappawadi 0.42 24.75 82.50 2.48 0.02 0.16
CADA Beed Benitura 1.15 0.37 1.76 0.54 0.04 0.16
CADA Solapur Bori (Solapur) 0.34 0.32 0.63 0.08 0.01 0.16
CADA Beed Chandani 0.25 0.14 0.00 0.19 0.00 0.16
CADA Solapur Ekrukh 0.39 0.22 0.19 0.23 0.01 0.16
CADA Beed Harni 0.35 0.40 4.32 0.08 0.01 0.16
CADA Solapur Hingani (Pangaon) 0.30 0.17 0.48 0.09 0.02 0.16
CADA Beed Jakapur 1.14 0.66 0.78 0.07 0.00 0.16
CADA Solapur Jawalgaon 0.54 0.30 0.30 0.45 0.03 0.16
CADA Beed Kada 1.54 0.83 6.36 2.99 0.08 0.16
CADA Beed Kadi 0.47 0.23 0.90 0.02 0.00 0.16
CADA Beed Kambli 1.65 1.02 18.50 0.10 0.00 0.16
CADA Pune Khairy 0.32 0.32 18.38 0.03 0.03 0.16
CADA Beed Khandala 0.69 0.78 1.69 0.08 0.06 0.16
CADA Beed Khandeshwar 0.96 0.18 0.00 0.08 0.00 0.16
CADA Beed Khasapur 0.24 0.12 2.75 0.05 0.00 0.16
CADA Beed Kurnoor 0.55 0.11 0.75 0.42 0.01 0.16
CADA Solapur Mangi 0.27 0.10 0.00 0.07 0.01 0.16
CADA Beed Mehakari 0.94 0.33 2.28 0.06 0.00 0.16
PIC Pune Nher 0.18 0.23 1.62 0.03 0.00 0.16
CADA Beed Ramganga 0.55 0.45 29.20 0.10 0.00 0.16
CADA Beed Rooty 0.71 0.50 2.38 0.05 0.00 0.16
CADA Beed Sakat 0.27 0.18 0.00 0.33 0.00 0.16
SIC Sangli Siddhewadi 0.30 0.80 0.00 0.08 0.00 0.16
CADA Pune Sina 0.12 0.10 3.26 0.02 0.01 0.16
CADA Beed Talwar 0.99 0.42 0.00 0.04 0.00 0.16
CADA Beed Turori 1.00 1.25 1.27 0.18 0.00 0.16
CADA Beed Wagholi 0.18 0.26 0.00 0.03 0.01 0.16
CADA Jalgaon Agnawati 1.13 0.00 0.73 0.43 0.00 0.16
CADA Abad Ajantha Andhari 0.00 0.00 0.00 0.00 0.00 0.16
CADA Abad Anjana Palashi 0.00 0.00 0.00 0.00 0.00 0.16
CADA Jalgaon Bahula 1.36 24.27 0.00 2.43 0.00 0.16
CADA Beed Belpara 0.31 0.10 4.20 0.06 0.00 0.16
CADA Jalgaon Bhokarbari 2.63 11.65 0.00 1.17 0.08 0.16
CADA Beed Bindusara 1.21 0.82 1.26 0.46 0.00 0.16
CADA Beed Bodhegaon 0.23 0.00 0.00 0.04 0.00 0.16
CADA Jalgaon Bori 1.07 2.81 2.96 0.28 0.03 0.16
CADA Beed Borna 0.11 0.09 0.00 0.02 0.00 0.16
CADA Jalgaon Burai 0.26 0.22 0.31 0.04 0.02 0.16
UWPC Amravati Chandrabhaga (Amravati) 0.00 0.00 0.00 0.00 0.00 0.16
CADA Beed Devarjan 0.35 0.24 0.33 0.08 0.02 0.16
CADA Abad Dhamna 0.00 0.00 0.00 0.00 0.00 0.16
AIC Akola Dnyanganga 0.87 0.46 0.59 0.20 0.05 0.16
CADA Abad Gadadgad 0.00 0.00 0.00 0.00 0.00 0.16
CADA Abad Galhati 0.05 0.08 0.00 0.01 0.00 0.16
CADA Beed Gharni 0.28 0.13 0.14 0.04 0.01 0.16
CADA Abad Girja 0.00 0.00 0.00 0.00 0.00 0.16
CADA Nashik Haranbari 0.52 0.38 0.43 0.09 0.04 0.16
CADA Jalgaon Hiwara 0.79 1.44 1.33 0.14 0.05 0.16
CADA Abad Jivrekha 0.00 0.00 48.47 0.00 0.00 0.16
Indicator VIIMedium Projects
Operation & Maintenance Cost per unit Water Supplied (Rs./cum)
Deficit
Highly Deficit
141

[Benchmarking Report 2018-19]
Plan group Circle Project FY Avg LY 2017-18 TY 2018-19 Past Max Past Min State Tar
CADA Abad Jui 0.00 0.00 0.00 0.00 0.00 0.16
CADA Abad Kalyan Girja 0.00 0.00 0.00 0.00 0.00 0.16
CADA Jalgaon Kanoli 0.43 0.00 0.00 0.06 0.00 0.16
NIC Nanded Karadkhed 1.16 0.44 1.39 0.19 0.04 0.16
CADA Abad Karpara 0.17 0.15 0.12 0.02 0.02 0.16
CADA Nashik Kelzar 0.57 0.50 0.70 0.15 0.04 0.16
CADA Abad Khelna 0.00 0.00 0.00 0.00 0.00 0.16
NIC Nanded Kudala 0.52 0.18 0.96 0.30 0.02 0.16
CADA Beed Kundlika 0.06 0.00 0.00 0.01 0.00 0.16
NIC Nanded Kundrala 0.76 0.69 2.00 0.25 0.03 0.16
CADA Abad Lahuki 0.00 0.00 0.00 0.00 0.00 0.16
NIC Nanded Mahalingi 1.09 1.56 2.41 0.77 0.00 0.16
CADA Beed Mahasangvi 0.44 0.35 11.25 0.11 0.03 0.16
CADA Jalgaon Manyad 0.50 0.38 7.60 0.16 0.03 0.16
AIC Akola Mas 1.63 3.50 51.34 0.50 0.04 0.16
CADA Beed Masalga 3.84 2.04 7.87 1.38 0.00 0.16
CADA Abad Masoli 0.18 0.21 0.77 0.02 0.01 0.16
AIC Akola Morna (Akola) 0.50 1.46 0.57 0.15 0.04 0.16
BIPC Buldhana Mun 0.11 0.01 5.02 0.02 0.00 0.16
CADA Nashik Nagyasakya 1.10 0.90 2.60 0.25 0.07 0.16
AIC Akola Nirguna 0.62 0.37 0.48 0.08 0.04 0.16
AIC Akola Paldhag 1.41 0.62 15.24 0.33 0.06 0.16
NIC Nanded Pethwadaj 0.99 3.39 0.58 2.03 0.04 0.16
CADA Abad Pir Kalyan 0.00 − 0.00 0.00 0.00 0.16
UWPC Amravati Purna (Achalpur) 0.00 0.00 0.00 0.00 0.00 0.16
CADA Abad Purna Nevpur 0.00 0.00 0.00 0.00 0.00 0.16
CADA Beed Raigavan 0.77 0.74 4.01 0.07 0.00 0.16
CADA Jalgaon Rangawali 0.19 0.22 0.25 0.05 0.00 0.16
CADA Beed Renapur 0.23 0.00 0.23 0.04 0.00 0.16
CADA Beed Rui 0.37 0.24 6.61 0.14 0.00 0.16
CADA Beed Sakol 0.42 0.27 0.51 0.11 0.02 0.16
CADA Beed Sangameshwar (Dokewadi) 0.11 0.13 5.18 0.01 0.01 0.16
UWPC Amravati Sapan 0.01 0.01 0.01 0.00 0.00 0.16
CADA Beed Saraswati 0.07 0.00 0.00 0.07 0.00 0.16
UWPC Amravati Shahanoor 0.08 0.06 0.17 0.01 0.00 0.16
CADA Beed Sindphana 0.55 0.41 0.00 0.04 0.00 0.16
CADA Abad Sukhna 0.00 − 0.00 0.00 0.00 0.16
CADA Beed Tawarja 0.59 0.20 1.74 0.20 0.02 0.16
CADA Beed Terna 0.26 0.10 0.45 0.63 0.01 0.16
CADA Beed Tiru 0.29 0.23 2.01 0.05 0.01 0.16
CADA Jalgaon Tondapur 0.89 1.19 2.00 0.12 0.07 0.16
BIPC Buldhana Torna 0.47 0.62 2.92 0.07 0.02 0.16
AIC Akola Uma 0.90 1.53 0.46 0.17 0.05 0.16
BIPC Buldhana Utawali 0.28 1.07 1.94 0.11 0.01 0.16
CADA Beed Wan (Beed) 0.10 0.12 0.00 0.01 0.01 0.16
CADA Beed Whati 0.49 0.31 1.25 0.80 0.01 0.16
CADA Jalgaon Abhora 1.23 1.05 0.70 0.16 0.10 0.16
YIC Yavatmal Adan 0.11 0.18 0.09 0.02 0.00 0.16
CADA Nashik Adhala 0.85 0.29 0.25 0.14 0.02 0.16
CADA Nashik Alandi 0.66 0.43 0.47 0.08 0.04 0.16
CIPC Chandrapur Amal Nala 0.43 1.57 0.32 0.16 0.02 0.16
CADA Abad Ambadi 0.00 0.00 0.00 0.00 0.00 0.16
PIC Pune Andhali 0.31 0.45 2.79 0.05 0.00 0.16
CADA Jalgaon Aner 0.15 0.20 0.26 0.03 0.00 0.16
Deficit
Normal
142
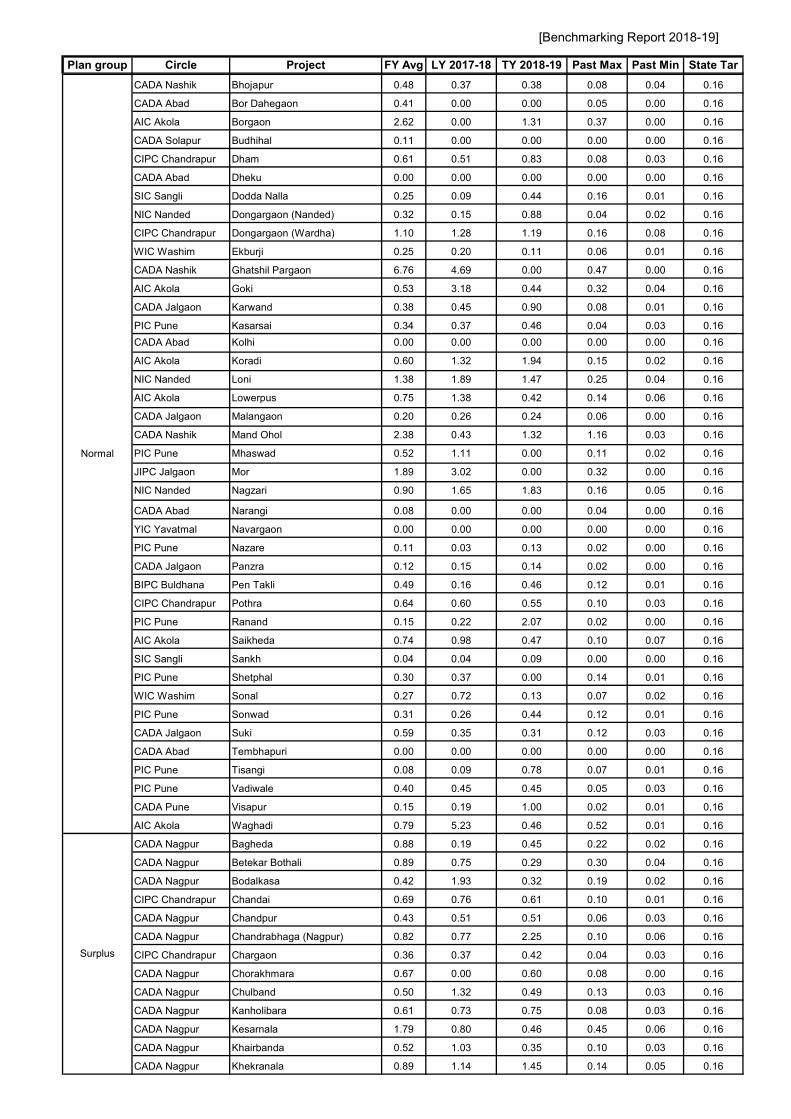
[Benchmarking Report 2018-19]
Plan group Circle Project FY Avg LY 2017-18 TY 2018-19 Past Max Past Min State Tar
CADA Nashik Bhojapur 0.48 0.37 0.38 0.08 0.04 0.16
CADA Abad Bor Dahegaon 0.41 0.00 0.00 0.05 0.00 0.16
AIC Akola Borgaon 2.62 0.00 1.31 0.37 0.00 0.16
CADA Solapur Budhihal 0.11 0.00 0.00 0.00 0.00 0.16
CIPC Chandrapur Dham 0.61 0.51 0.83 0.08 0.03 0.16
CADA Abad Dheku 0.00 0.00 0.00 0.00 0.00 0.16
SIC Sangli Dodda Nalla 0.25 0.09 0.44 0.16 0.01 0.16
NIC Nanded Dongargaon (Nanded) 0.32 0.15 0.88 0.04 0.02 0.16
CIPC Chandrapur Dongargaon (Wardha) 1.10 1.28 1.19 0.16 0.08 0.16
WIC Washim Ekburji 0.25 0.20 0.11 0.06 0.01 0.16
CADA Nashik Ghatshil Pargaon 6.76 4.69 0.00 0.47 0.00 0.16
AIC Akola Goki 0.53 3.18 0.44 0.32 0.04 0.16
CADA Jalgaon Karwand 0.38 0.45 0.90 0.08 0.01 0.16
PIC Pune Kasarsai 0.34 0.37 0.46 0.04 0.03 0.16
CADA Abad Kolhi 0.00 0.00 0.00 0.00 0.00 0.16
AIC Akola Koradi 0.60 1.32 1.94 0.15 0.02 0.16
NIC Nanded Loni 1.38 1.89 1.47 0.25 0.04 0.16
AIC Akola Lowerpus 0.75 1.38 0.42 0.14 0.06 0.16
CADA Jalgaon Malangaon 0.20 0.26 0.24 0.06 0.00 0.16
CADA Nashik Mand Ohol 2.38 0.43 1.32 1.16 0.03 0.16
PIC Pune Mhaswad 0.52 1.11 0.00 0.11 0.02 0.16
JIPC Jalgaon Mor 1.89 3.02 0.00 0.32 0.00 0.16
NIC Nanded Nagzari 0.90 1.65 1.83 0.16 0.05 0.16
CADA Abad Narangi 0.08 0.00 0.00 0.04 0.00 0.16
YIC Yavatmal Navargaon 0.00 0.00 0.00 0.00 0.00 0.16
PIC Pune Nazare 0.11 0.03 0.13 0.02 0.00 0.16
CADA Jalgaon Panzra 0.12 0.15 0.14 0.02 0.00 0.16
BIPC Buldhana Pen Takli 0.49 0.16 0.46 0.12 0.01 0.16
CIPC Chandrapur Pothra 0.64 0.60 0.55 0.10 0.03 0.16
PIC Pune Ranand 0.15 0.22 2.07 0.02 0.00 0.16
AIC Akola Saikheda 0.74 0.98 0.47 0.10 0.07 0.16
SIC Sangli Sankh 0.04 0.04 0.09 0.00 0.00 0.16
PIC Pune Shetphal 0.30 0.37 0.00 0.14 0.01 0.16
WIC Washim Sonal 0.27 0.72 0.13 0.07 0.02 0.16
PIC Pune Sonwad 0.31 0.26 0.44 0.12 0.01 0.16
CADA Jalgaon Suki 0.59 0.35 0.31 0.12 0.03 0.16
CADA Abad Tembhapuri 0.00 0.00 0.00 0.00 0.00 0.16
PIC Pune Tisangi 0.08 0.09 0.78 0.07 0.01 0.16
PIC Pune Vadiwale 0.40 0.45 0.45 0.05 0.03 0.16
CADA Pune Visapur 0.15 0.19 1.00 0.02 0.01 0.16
AIC Akola Waghadi 0.79 5.23 0.46 0.52 0.01 0.16
CADA Nagpur Bagheda 0.88 0.19 0.45 0.22 0.02 0.16
CADA Nagpur Betekar Bothali 0.89 0.75 0.29 0.30 0.04 0.16
CADA Nagpur Bodalkasa 0.42 1.93 0.32 0.19 0.02 0.16
CIPC Chandrapur Chandai 0.69 0.76 0.61 0.10 0.01 0.16
CADA Nagpur Chandpur 0.43 0.51 0.51 0.06 0.03 0.16
CADA Nagpur Chandrabhaga (Nagpur) 0.82 0.77 2.25 0.10 0.06 0.16
CIPC Chandrapur Chargaon 0.36 0.37 0.42 0.04 0.03 0.16
CADA Nagpur Chorakhmara 0.67 0.00 0.60 0.08 0.00 0.16
CADA Nagpur Chulband 0.50 1.32 0.49 0.13 0.03 0.16
CADA Nagpur Kanholibara 0.61 0.73 0.75 0.08 0.03 0.16
CADA Nagpur Kesarnala 1.79 0.80 0.46 0.45 0.06 0.16
CADA Nagpur Khairbanda 0.52 1.03 0.35 0.10 0.03 0.16
CADA Nagpur Khekranala 0.89 1.14 1.45 0.14 0.05 0.16
Normal
Surplus
143

[Benchmarking Report 2018-19]
Plan group Circle Project FY Avg LY 2017-18 TY 2018-19 Past Max Past Min State Tar
CADA Nagpur Kolar 0.63 0.86 0.67 0.09 0.03 0.16
CIPC Chandrapur Labhansarad 0.33 1.30 0.36 0.13 0.02 0.16
CADA Nagpur Makardhokada-Saiki Complex 0.46 0.37 0.46 0.07 0.02 0.16
CADA Nagpur Managadh 0.78 2.37 0.65 0.24 0.04 0.16
CADA Nagpur Mordham 0.82 0.84 2.13 0.14 0.06 0.16
CIPC Chandrapur Pakadigundam 0.79 1.81 0.00 0.18 0.05 0.16
CIPC Chandrapur Panchadhara 0.70 0.22 2.43 0.11 0.02 0.16
CADA Nagpur Pandhrabodi 0.39 0.60 0.83 0.08 0.02 0.16
CADA Nagpur Rengepar 0.28 0.41 0.09 0.04 0.01 0.16
CADA Nagpur Sangrampur 0.99 0.00 0.00 0.26 0.00 0.16
CADA Nagpur Sorna 0.61 0.66 0.44 0.13 0.03 0.16
CADA Nagpur Umri 1.43 0.71 0.60 0.28 0.05 0.16
CADA Nagpur Wunna 0.31 0.45 1.66 0.05 0.01 0.16
SIC Sangli Chikotra 0.21 0.23 0.17 0.03 0.02 0.16
SIC Sangli Chitri 0.08 0.09 0.09 0.01 0.00 0.16
SIC Sangli Ghatprabha (Pathakwadi) 0.06 0.05 0.13 0.01 0.00 0.16
CIPC Chandrapur Ghorazari 0.31 0.41 0.33 0.04 0.02 0.16
SIC Sangli Jangamhatti 0.08 0.13 0.12 0.01 0.00 0.16
SIC Sangli Kadavi 0.22 0.24 0.23 0.03 0.02 0.16
SIC Sangli Kasari 0.08 0.11 0.10 0.01 0.01 0.16
SIC Sangli KC &Khodshi Backwater 0.37 0.41 0.52 0.07 0.01 0.16
SIC Sangli Kumbhi 0.09 0.13 0.11 0.01 0.01 0.16
SIC Sangli Morna (Sangli) 0.13 0.11 0.12 0.02 0.01 0.16
CIPC Chandrapur Naleshwar 0.46 0.81 0.49 0.08 0.01 0.16
SIC Sangli Patgaon 0.12 0.11 0.08 0.02 0.01 0.16
TIC Thane Rajanala 0.65 0.38 0.86 0.23 0.00 0.16
TIC Thane Wandri 0.34 0.35 0.28 0.06 0.00 0.16
SIC Sangli Yeoti Masoli 0.16 0.22 0.19 0.02 0.01 0.16
Surplus
Abundant
144

[Benchmarking Report 2018-19]
Plan group Circle Project FY Avg LY 2017-18 TY 2018-19 Past Max Past Min State Tar
CADA Beed Banganga 0.04 0.06 0.06 0.16 0.01 0.18
SIC Sangli Basappawadi 0.12 3.55 1.00 3.55 0.07 0.18
CADA Beed Benitura 0.11 0.14 4.12 0.29 0.03 0.18
CADA Solapur Bori (Solapur) 0.06 0.05 1.17 0.24 0.03 0.18
CADA Beed Chandani 0.07 0.07 0.00 0.24 0.00 0.18
CADA Solapur Ekrukh 0.11 0.05 0.04 0.56 0.02 0.18
CADA Beed Harni 0.04 0.05 0.47 0.15 0.01 0.18
CADA Solapur Hingani (Pangaon) 0.08 0.11 0.00 0.17 0.05 0.18
CADA Beed Jakapur 0.01 0.01 0.03 0.01 0.00 0.18
CADA Solapur Jawalgaon 0.09 0.06 0.06 0.57 0.06 0.18
CADA Beed Kada 0.02 0.02 0.23 0.24 0.00 0.18
CADA Beed Kadi 0.03 0.04 0.32 0.04 0.00 0.18
CADA Beed Kambli 0.00 0.00 0.10 0.00 0.00 0.18
CADA Pune Khairy 0.06 0.06 0.29 0.06 0.06 0.18
CADA Beed Khandala 0.04 0.10 0.17 0.10 0.00 0.18
CADA Beed Khandeshwar 0.02 0.02 0.00 0.02 0.00 0.18
CADA Beed Khasapur 0.06 0.06 0.82 0.14 0.00 0.18
CADA Beed Kurnoor 0.06 0.09 0.54 0.09 0.01 0.18
CADA Solapur Mangi 0.03 0.02 0.03 0.07 0.02 0.18
CADA Beed Mehakari 0.03 0.02 0.52 0.06 0.00 0.18
PIC Pune Nher 0.12 0.06 0.20 0.64 0.04 0.18
CADA Beed Ramganga 0.04 0.03 0.00 0.06 0.00 0.18
CADA Beed Rooty 0.04 0.04 0.21 0.04 0.00 0.18
CADA Beed Sakat 0.02 0.02 0.00 0.02 0.00 0.18
SIC Sangli Siddhewadi 0.08 0.07 0.00 0.11 0.00 0.18
CADA Pune Sina 0.03 0.01 0.34 0.07 0.01 0.18
CADA Beed Talwar 0.04 0.03 0.13 0.03 0.00 0.18
CADA Beed Turori 0.16 0.13 0.63 0.19 0.00 0.18
CADA Beed Wagholi 0.06 0.08 0.00 0.08 0.04 0.18
CADA Jalgaon Agnawati 0.11 0.00 0.00 0.23 0.00 0.18
CADA Abad Ajantha Andhari *14965.51 *37427.86 0.67 37427.86 2.41 0.18
CADA Abad Anjana Palashi *11122.2 *73255.8 0.54 73255.80 0.04 0.18
CADA Jalgaon Bahula 0.13 1.68 0.00 1.68 0.00 0.18
CADA Beed Belpara 0.07 0.13 1.57 0.19 0.00 0.18
CADA Jalgaon Bhokarbari 0.10 0.05 0.00 0.24 0.05 0.18
CADA Beed Bindusara 0.19 0.07 0.13 1.68 0.00 0.18
CADA Beed Bodhegaon 0.01 0.01 0.00 0.01 0.00 0.18
CADA Jalgaon Bori 0.17 0.16 0.15 0.47 0.03 0.18
CADA Beed Borna 0.01 0.01 0.34 0.01 0.00 0.18
CADA Jalgaon Burai 0.04 0.02 0.09 0.07 0.02 0.18
UWPC Amravati Chandrabhaga (Amravati) 0.07 0.10 0.06 0.11 0.03 0.18
CADA Beed Devarjan 0.20 0.26 0.45 0.26 0.14 0.18
CADA Abad Dhamna 0.11 0.18 0.00 0.18 0.03 0.18
AIC Akola Dnyanganga 0.41 0.61 0.90 0.61 0.21 0.18
CADA Abad Gadadgad *5969.99 *5268.32 0.21 11178.99 0.15 0.18
CADA Abad Galhati 0.05 0.04 0.64 0.07 0.04 0.18
CADA Beed Gharni 0.04 0.07 0.09 0.07 0.01 0.18
CADA Abad Girja 0.00 0.00 0.00 0.00 0.00 0.18
CADA Nashik Haranbari 0.08 0.12 0.51 0.17 0.03 0.18
CADA Jalgaon Hiwara 0.13 0.19 0.01 0.21 0.09 0.18
CADA Abad Jivrekha 0.07 0.06 0.00 0.09 0.05 0.18
Indicator VIIIMedium Projects
Revenue per unit of Water Supplied (Rs./cum)
Deficit
Highly Deficit
145

[Benchmarking Report 2018-19]
Plan group Circle Project FY Avg LY 2017-18 TY 2018-19 Past Max Past Min State Tar
CADA Abad Jui 0.13 0.10 0.32 0.24 0.02 0.18
CADA Abad Kalyan Girja 0.01 0.00 0.00 0.02 0.00 0.18
CADA Jalgaon Kanoli 0.07 0.00 0.00 0.09 0.00 0.18
NIC Nanded Karadkhed 0.20 0.18 0.20 0.30 0.16 0.18
CADA Abad Karpara 0.04 0.07 0.00 0.07 0.00 0.18
CADA Nashik Kelzar 0.07 0.12 0.14 0.17 0.03 0.18
CADA Abad Khelna *6393.99 *169512.22 0.29 169512.22 0.09 0.18
NIC Nanded Kudala 0.13 0.12 0.11 0.86 0.03 0.18
CADA Beed Kundlika 0.05 0.03 1.96 0.07 0.03 0.18
NIC Nanded Kundrala 0.08 0.10 0.12 0.15 0.06 0.18
CADA Abad Lahuki *34859.92 *45511.54 0.00 45511.54 0.00 0.18
NIC Nanded Mahalingi 0.03 0.01 0.16 0.07 0.00 0.18
CADA Beed Mahasangvi 0.07 0.06 0.96 0.16 0.00 0.18
CADA Jalgaon Manyad 0.06 0.03 0.37 0.11 0.03 0.18
AIC Akola Mas 0.07 0.46 9.02 0.46 0.02 0.18
CADA Beed Masalga 0.12 0.12 0.46 0.12 0.00 0.18
CADA Abad Masoli 0.20 0.07 0.10 0.45 0.07 0.18
AIC Akola Morna (Akola) 0.07 0.27 0.04 0.27 0.03 0.18
BIPC Buldhana Mun 0.05 0.20 0.11 0.20 0.02 0.18
CADA Nashik Nagyasakya 0.07 0.12 0.44 0.17 0.03 0.18
AIC Akola Nirguna 0.61 3.02 1.76 3.02 0.02 0.18
AIC Akola Paldhag 0.04 0.06 0.08 0.06 0.02 0.18
NIC Nanded Pethwadaj 0.01 0.12 0.02 0.23 0.00 0.18
CADA Abad Pir Kalyan 0.00 − 0.00 0.00 0.00 0.18
UWPC Amravati Purna (Achalpur) 0.04 0.02 0.05 0.05 0.02 0.18
CADA Abad Purna Nevpur 0.06 0.05 0.14 0.12 0.03 0.18
CADA Beed Raigavan 0.12 0.22 0.64 0.22 0.00 0.18
CADA Jalgaon Rangawali 0.07 0.08 0.06 0.09 0.04 0.18
CADA Beed Renapur 0.26 0.12 0.26 0.31 0.12 0.18
CADA Beed Rui 0.04 0.08 2.46 0.08 0.00 0.18
CADA Beed Sakol 0.07 0.14 0.12 0.14 0.02 0.18
CADA Beed Sangameshwar (Dokewadi) 0.01 0.03 0.45 0.03 0.01 0.18
UWPC Amravati Sapan 0.01 0.01 0.00 0.06 0.00 0.18
CADA Beed Saraswati 0.03 0.03 0.00 0.03 0.01 0.18
UWPC Amravati Shahanoor 0.06 0.03 0.27 0.10 0.03 0.18
CADA Beed Sindphana 0.14 0.15 0.00 0.15 0.00 0.18
CADA Abad Sukhna 2.11 − 0.34 2.11 2.11 0.18
CADA Beed Tawarja 0.20 0.20 0.56 0.65 0.12 0.18
CADA Beed Terna 0.10 0.10 0.40 1.42 0.01 0.18
CADA Beed Tiru 0.04 0.11 0.74 0.11 0.01 0.18
CADA Jalgaon Tondapur 0.29 0.20 0.57 0.63 0.16 0.18
BIPC Buldhana Torna 0.03 0.04 0.08 0.13 0.00 0.18
AIC Akola Uma 0.11 0.29 0.11 0.29 0.06 0.18
BIPC Buldhana Utawali 0.02 0.06 0.20 0.06 0.00 0.18
CADA Beed Wan (Beed) 0.08 0.16 0.29 0.16 0.01 0.18
CADA Beed Whati 0.18 0.22 0.71 0.29 0.00 0.18
CADA Jalgaon Abhora 0.09 0.07 0.13 0.19 0.01 0.18
YIC Yavatmal Adan 0.08 0.67 0.06 0.67 0.01 0.18
CADA Nashik Adhala 0.06 0.05 0.12 0.07 0.05 0.18
CADA Nashik Alandi 0.04 0.00 0.12 0.09 0.00 0.18
CIPC Chandrapur Amal Nala 1.37 2.47 1.23 2.47 0.93 0.18
CADA Abad Ambadi 0.66 1.43 0.63 1.43 0.46 0.18
PIC Pune Andhali 0.16 0.07 0.41 0.46 0.00 0.18
CADA Jalgaon Aner 0.02 0.01 0.02 0.05 0.01 0.18
Deficit
Normal
146

[Benchmarking Report 2018-19]
Plan group Circle Project FY Avg LY 2017-18 TY 2018-19 Past Max Past Min State Tar
CADA Nashik Bhojapur 0.02 0.00 0.11 0.14 0.00 0.18
CADA Abad Bor Dahegaon 0.10 0.00 0.00 0.05 0.00 0.18
AIC Akola Borgaon 0.03 0.00 0.03 0.03 0.00 0.18
CADA Solapur Budhihal 0.08 0.00 0.00 0.08 0.00 0.18
CIPC Chandrapur Dham 0.62 0.72 0.04 0.72 0.54 0.18
CADA Abad Dheku 0.07 0.08 0.00 0.53 0.03 0.18
SIC Sangli Dodda Nalla 0.06 0.06 0.60 0.27 0.03 0.18
NIC Nanded Dongargaon (Nanded) 0.02 0.03 0.02 0.03 0.00 0.18
CIPC Chandrapur Dongargaon (Wardha) 0.02 0.00 0.00 0.09 0.00 0.18
WIC Washim Ekburji 0.28 0.33 0.51 0.43 0.08 0.18
CADA Nashik Ghatshil Pargaon 0.03 0.03 0.00 0.03 0.00 0.18
AIC Akola Goki 0.23 1.28 0.22 1.28 0.13 0.18
CADA Jalgaon Karwand 0.10 0.15 0.21 0.15 0.06 0.18
PIC Pune Kasarsai 0.05 0.06 0.18 0.06 0.04 0.18
CADA Abad Kolhi 0.10 0.10 0.00 0.10 0.00 0.18
AIC Akola Koradi 0.06 0.04 0.54 0.11 0.04 0.18
NIC Nanded Loni 0.01 0.00 0.02 0.02 0.00 0.18
AIC Akola Lowerpus 0.08 0.46 0.03 0.46 0.03 0.18
CADA Jalgaon Malangaon 0.10 0.11 0.28 0.16 0.04 0.18
CADA Nashik Mand Ohol 0.04 0.03 0.11 0.12 0.03 0.18
PIC Pune Mhaswad 0.06 0.04 0.00 0.10 0.04 0.18
JIPC Jalgaon Mor 0.08 0.06 0.09 0.15 0.00 0.18
NIC Nanded Nagzari 0.15 0.30 0.25 0.30 0.06 0.18
CADA Abad Narangi 0.15 0.13 0.00 0.22 0.00 0.18
YIC Yavatmal Navargaon 0.23 0.61 0.21 0.61 0.06 0.18
PIC Pune Nazare 0.22 0.19 *94640.35 0.43 0.15 0.18
CADA Jalgaon Panzra 0.06 0.03 0.04 0.11 0.00 0.18
BIPC Buldhana Pen Takli 0.06 0.08 0.10 0.09 0.02 0.18
CIPC Chandrapur Pothra 0.37 0.02 0.02 1.28 0.01 0.18
PIC Pune Ranand 0.05 0.03 0.50 0.07 0.00 0.18
AIC Akola Saikheda 0.05 0.09 0.04 0.09 0.03 0.18
SIC Sangli Sankh 0.02 0.02 0.08 0.02 0.00 0.18
PIC Pune Shetphal 0.10 0.12 0.16 0.23 0.02 0.18
WIC Washim Sonal 0.05 1.17 0.06 1.17 0.01 0.18
PIC Pune Sonwad 0.05 0.03 0.07 0.16 0.02 0.18
CADA Jalgaon Suki 0.09 0.06 0.11 0.32 0.03 0.18
CADA Abad Tembhapuri 0.36 0.00 0.00 0.02 0.00 0.18
PIC Pune Tisangi 0.03 0.02 0.18 0.07 0.01 0.18
PIC Pune Vadiwale 0.15 0.40 0.40 0.40 0.01 0.18
CADA Pune Visapur 0.07 0.06 0.07 0.07 0.06 0.18
AIC Akola Waghadi 0.06 0.33 0.03 0.33 0.04 0.18
CADA Nagpur Bagheda 0.04 0.03 0.08 0.10 0.02 0.18
CADA Nagpur Betekar Bothali 0.06 0.06 0.04 0.11 0.05 0.18
CADA Nagpur Bodalkasa 0.06 0.22 0.12 0.22 0.05 0.18
CIPC Chandrapur Chandai 0.21 1.12 0.02 1.12 0.02 0.18
CADA Nagpur Chandpur 0.07 0.26 0.18 0.26 0.03 0.18
CADA Nagpur Chandrabhaga (Nagpur) 0.03 0.02 0.07 0.04 0.02 0.18
CIPC Chandrapur Chargaon 0.06 0.04 0.07 0.08 0.04 0.18
CADA Nagpur Chorakhmara 0.06 0.00 0.17 0.09 0.00 0.18
CADA Nagpur Chulband 0.02 0.05 0.10 0.05 0.01 0.18
CADA Nagpur Kanholibara 0.28 0.04 0.02 1.45 0.00 0.18
CADA Nagpur Kesarnala 0.02 0.01 0.01 0.04 0.00 0.18
CADA Nagpur Khairbanda 0.12 0.21 0.15 0.21 0.07 0.18
CADA Nagpur Khekranala 0.11 0.14 1.32 0.31 0.03 0.18
Normal
Surplus
147

[Benchmarking Report 2018-19]
Plan group Circle Project FY Avg LY 2017-18 TY 2018-19 Past Max Past Min State Tar
CADA Nagpur Kolar 0.11 0.15 0.35 0.15 0.08 0.18
CIPC Chandrapur Labhansarad 0.04 0.16 0.05 0.16 0.03 0.18
CADA Nagpur Makardhokada-Saiki Complex 0.08 0.08 0.05 0.11 0.08 0.18
CADA Nagpur Managadh 0.03 0.09 0.02 0.09 0.01 0.18
CADA Nagpur Mordham 0.04 0.04 0.09 0.05 0.03 0.18
CIPC Chandrapur Pakadigundam 0.74 2.76 0.00 2.76 0.38 0.18
CIPC Chandrapur Panchadhara 0.02 0.01 0.04 0.02 0.01 0.18
CADA Nagpur Pandhrabodi 0.09 0.09 0.18 0.14 0.06 0.18
CADA Nagpur Rengepar 0.03 0.02 0.04 0.04 0.02 0.18
CADA Nagpur Sangrampur 0.04 0.05 0.08 0.06 0.01 0.18
CADA Nagpur Sorna 0.07 0.08 0.07 0.08 0.06 0.18
CADA Nagpur Umri 0.05 0.05 0.19 0.11 0.02 0.18
CADA Nagpur Wunna 1.39 1.60 6.15 1.85 0.00 0.18
SIC Sangli Chikotra 0.10 0.08 0.10 0.13 0.08 0.18
SIC Sangli Chitri 0.14 0.13 0.17 0.18 0.11 0.18
SIC Sangli Ghatprabha (Pathakwadi) 0.05 0.04 0.05 0.09 0.03 0.18
CIPC Chandrapur Ghorazari 0.03 0.02 0.04 0.05 0.02 0.18
SIC Sangli Jangamhatti 0.16 0.17 0.17 0.23 0.08 0.18
SIC Sangli Kadavi 0.13 0.18 0.38 0.18 0.11 0.18
SIC Sangli Kasari 0.06 0.07 0.07 0.07 0.05 0.18
SIC Sangli KC &Khodshi Backwater 0.11 0.17 0.31 0.17 0.08 0.18
SIC Sangli Kumbhi 0.11 0.15 0.21 0.15 0.08 0.18
SIC Sangli Morna (Sangli) 0.10 0.10 0.15 0.13 0.06 0.18
CIPC Chandrapur Naleshwar 0.07 0.04 0.05 0.09 0.04 0.18
SIC Sangli Patgaon 0.10 0.15 0.13 0.15 0.08 0.18
TIC Thane Rajanala 0.03 0.01 0.01 0.11 0.00 0.18
TIC Thane Wandri 0.01 0.00 0.00 0.01 0.00 0.18
SIC Sangli Yeoti Masoli 0.20 0.18 0.34 0.43 0.15 0.18
Surplus
Abundant
148

[Benchmarking Report 2018-19]
Plan Group Circle Project Head Middle Tail
CADA Beed Banganga 0.23 0.23 0.00
SIC Sangli Basappawadi 0.44 0.39 0.34
CADA Beed Benitura 0.00 0.00 0.00
CADA Solapur Bori (Solapur) 0.00 0.00 0.00
CADA Beed Chandani 0.00 0.00 0.00
CADA Solapur Ekrukh 0.00 0.00 0.00
CADA Beed Harni 0.00 0.00 0.00
CADA Solapur Hingani (Pangaon) 0.00 0.00 0.00
CADA Beed Jakapur 0.00 0.00 0.00
CADA Solapur Jawalgaon 0.05 0.05 0.00
CADA Beed Kada 0.00 0.00 0.00
CADA Beed Kadi 0.00 0.00 0.00
CADA Beed Kambli 0.00 0.00 0.00
CADA Pune Khairy 1.00 0.00 0.00
CADA Beed Khandala 0.00 0.00 0.00
CADA Beed Khandeshwar 0.00 0.00 0.00
CADA Beed Khasapur 0.00 0.00 0.00
CADA Beed Kurnoor 0.00 0.00 0.00
CADA Solapur Mangi 0.00 0.00 0.00
CADA Beed Mehakari 0.16 0.00 0.00
PIC Pune Nher 0.91 0.66 0.22
CADA Beed Ramganga 0.00 0.00 0.00
CADA Beed Rooty 0.00 0.00 0.00
SIC Sangli Sakat 0.00 0.00 0.00
SIC Sangli Siddhewadi 1.00 0.00 0.00
CADA Pune Sina 0.31 0.31 0.31
CADA Beed Talwar 0.00 0.00 0.00
CADA Beed Turori 0.00 0.00 0.00
CADA Beed Wagholi 0.00 0.00 0.00
CADA Jalgaon Agnawati 0.00 0.00 0.00
CADA Abad Ajantha Andhari 0.00 0.00 0.00
CADA Abad Anjana Palashi 0.00 0.00 0.00
CADA Jalgaon Bahula 0.00 0.00 0.00
CADA Beed Belpara 0.00 0.00 0.00
CADA Jalgaon Bhokarbari 0.00 0.00 0.00
CADA Beed Bindusara 0.00 0.00 0.00
CADA Beed Bodhegaon 0.00 0.00 0.00
CADA Jalgaon Bori 0.00 0.00 0.00
CADA Beed Borna 0.23 0.00 0.00
CADA Jalgaon Burai 0.13 0.18 0.18
UWPC Amravati Chandrabhaga (Amravati) 0.89 0.77 0.81
CADA Beed Devarjan 0.00 0.00 0.00
CADA Abad Dhamna 0.00 0.00 0.00
AIC Akola Dnyanganga 0.00 0.00 0.00
CADA Abad Gadadgad 0.21 0.26 0.29
CADA Abad Galhati 0.00 0.00 0.00
CADA Beed Gharni 0.37 0.37 0.37
CADA Abad Girja 0.00 0.00 0.00
CADA Nashik Haranbari 1.00 1.00 1.00
CADA Jalgaon Hiwara 0.00 0.00 0.00
CADA Abad Jivrekha 0.00 0.00 0.00
CADA Abad Jui 0.00 0.00 0.00
CADA Abad Kalyan Girja 0.00 0.00 0.00
CADA Jalgaon Kanoli 0.00 0.00 0.00
NIC Nanded Karadkhed 0.00 0.00 0.00
CADA Abad Karpara 0.67 0.33 0.18
CADA Nashik Kelzar 0.83 0.83 0.83
CADA Abad Khelna 0.00 0.00 0.00
NIC Nanded Kudala 0.44 0.22 0.17
CADA Beed Kundlika 0.07 0.07 0.00
NIC Nanded Kundrala 0.00 0.00 0.00
CADA Abad Lahuki 0.00 0.00 0.00
Highly Deficit
Deficit
Indicator XIMedium Projects
Equity Performance (Ratio)
149

[Benchmarking Report 2018-19]
Plan Group Circle Project Head Middle Tail
NIC Nanded Mahalingi 0.00 0.00 0.00
CADA Beed Mahasangvi 0.00 0.00 0.00
CADA Jalgaon Manyad 0.00 0.00 0.00
AIC Akola Mas 0.00 0.00 0.00
CADA Beed Masalga 0.00 0.00 0.00
CADA Abad Masoli 0.54 0.34 0.13
AIC Akola Morna (Akola) 0.39 0.47 0.38
BIPC Buldhana Mun 0.00 0.00 0.00
CADA Nashik Nagyasakya 0.55 0.55 0.55
AIC Akola Nirguna 0.48 0.57 0.57
AIC Akola Paldhag 0.00 0.00 0.00
NIC Nanded Pethwadaj 0.35 0.20 0.13
CADA Abad Pir Kalyan 0.00 0.00 0.00
UWPC Amravati Purna (Achalpur) 0.97 1.00 0.44
CADA Abad Purna Nevpur 0.00 0.00 0.00
CADA Beed Raigavan 0.00 0.00 0.00
CADA Jalgaon Rangawali 0.24 0.38 0.36
CADA Beed Renapur 0.00 0.00 0.00
CADA Beed Rui 0.00 0.00 0.00
CADA Beed Sakol 0.00 0.00 0.00
CADA Beed Sangameshwar (Dokewadi) 0.00 0.00 0.00
UWPC Amravati Sapan 0.06 0.06 0.00
CADA Beed Saraswati 0.06 0.04 0.00
UWPC Amravati Shahanoor 0.79 0.53 0.46
CADA Beed Sindphana 0.00 0.00 0.00
CADA Abad Sukhna 0.00 0.00 0.00
CADA Beed Tawarja 0.00 0.00 0.00
CADA Beed Terna 0.00 0.00 0.00
CADA Beed Tiru 0.00 0.00 0.00
CADA Jalgaon Tondapur 0.00 0.00 0.00
BIPC Buldhana Torna 0.00 0.00 0.00
AIC Akola Uma 0.53 0.52 0.46
BIPC Buldhana Utawali 0.00 0.00 0.00
CADA Beed Wan (Beed) 0.03 0.02 0.00
CADA Beed Whati 0.00 0.00 0.00
CADA Jalgaon Abhora 0.11 0.13 0.16
YIC Yavatmal Adan 1.00 1.00 0.27
CADA Nashik Adhala 0.71 0.67 0.78
CADA Nashik Alandi 0.42 0.33 0.41
CIPC Chandrapur Amal Nala 0.55 0.55 0.55
CADA Abad Ambadi 0.00 0.00 0.00
PIC Pune Andhali 0.40 0.40 0.26
CADA Jalgaon Aner 0.60 0.53 0.46
CADA Nashik Bhojapur 0.08 0.08 0.06
CADA Abad Bor Dahegaon 0.00 0.00 0.00
AIC Akola Borgaon 0.00 0.00 0.00
CADA Solapur Budhihal 0.00 0.00 0.00
CIPC Chandrapur Dham 0.06 0.12 0.09
CADA Abad Dheku 0.00 0.00 0.00
SIC Sangli Dodda Nalla 0.55 0.51 0.21
NIC Nanded Dongargaon (Nanded) 0.93 1.00 0.36
CIPC Chandrapur Dongargaon (Wardha) 0.25 0.36 0.21
WIC Washim Ekburji 0.00 0.00 0.00
CADA Nashik Ghatshil Pargaon 0.00 0.00 0.00
AIC Akola Goki 0.00 0.00 0.00
CADA Jalgaon Karwand 0.13 0.09 0.08
PIC Pune Kasarsai 0.00 0.00 0.00
CADA Abad Kolhi 0.00 0.00 0.00
AIC Akola Koradi 0.00 0.00 0.00
NIC Nanded Loni 0.32 0.41 0.00
AIC Akola Lowerpus 0.27 0.27 0.27
CADA Jalgaon Malangaon 0.48 0.34 0.64
CADA Nashik Mand Ohol 0.00 0.00 0.00
PIC Pune Mhaswad 0.00 0.00 0.00
JIPC Jalgaon Mor 0.03 0.00 0.00
Deficit
Normal
150

[Benchmarking Report 2018-19]
Plan Group Circle Project Head Middle Tail
NIC Nanded Nagzari 0.31 0.58 0.00
CADA Abad Narangi 0.00 0.00 0.00
YIC Yavatmal Navargaon 0.30 0.30 0.00
PIC Pune Nazare 0.00 0.00 0.00
CADA Jalgaon Panzra 0.20 0.23 0.19
BIPC Buldhana Pen Takli 0.00 0.00 0.00
CIPC Chandrapur Pothra 0.64 0.64 0.64
PIC Pune Ranand 0.68 0.68 0.36
AIC Akola Saikheda 0.71 0.71 0.70
SIC Sangli Sankh 0.18 0.10 0.06
PIC Pune Shetphal 0.00 0.00 0.00
WIC Washim Sonal 1.00 0.62 0.45
PIC Pune Sonwad 1.00 1.00 1.00
CADA Jalgaon Suki 0.08 0.10 0.12
CADA Abad Tembhapuri 0.00 0.00 0.00
PIC Pune Tisangi 0.99 0.84 0.21
PIC Pune Vadiwale 0.00 0.00 0.00
CADA Pune Visapur 1.00 1.00 1.00
AIC Akola Waghadi 0.00 0.00 0.00
CADA Nagpur Bagheda 1.00 1.00 1.00
CADA Nagpur Betekar Bothali 0.83 0.85 0.86
CADA Nagpur Bodalkasa 0.91 0.93 0.36
CIPC Chandrapur Chandai 0.84 0.84 0.84
CADA Nagpur Chandpur 0.95 0.96 0.96
CADA Nagpur Chandrabhaga (Nagpur) 0.09 0.07 0.07
CIPC Chandrapur Chargaon 1.00 1.00 1.00
CADA Nagpur Chorakhmara 0.94 0.33 0.00
CADA Nagpur Chulband 0.97 0.95 0.60
CADA Nagpur Kanholibara 0.71 0.58 0.86
CADA Nagpur Kesarnala 0.23 0.68 0.23
CADA Nagpur Khairbanda 1.00 1.00 0.87
CADA Nagpur Khekranala 0.48 0.67 0.77
CADA Nagpur Kolar 0.20 0.35 0.24
CIPC Chandrapur Labhansarad 0.35 0.35 0.35
CADA Nagpur Makardhokada-Saiki Complex 1.00 1.00 0.97
CADA Nagpur Managadh 1.00 0.76 1.00
CADA Nagpur Mordham 0.09 0.07 0.07
CIPC Chandrapur Pakadigundam 0.51 0.51 0.51
CIPC Chandrapur Panchadhara 0.08 0.08 0.07
CADA Nagpur Pandhrabodi 1.00 1.00 1.00
CADA Nagpur Rengepar 1.00 1.00 1.00
CADA Nagpur Sangrampur 1.00 1.00 1.00
CADA Nagpur Sorna 0.88 0.90 0.92
CADA Nagpur Umri 0.56 0.30 0.15
CADA Nagpur Wunna 0.00 0.00 0.00
SIC Sangli Chikotra 1.00 1.00 1.00
SIC Sangli Chitri 0.92 0.92 0.87
SIC Sangli Ghatprabha (Pathakwadi) 1.00 1.00 1.00
CIPC Chandrapur Ghorazari 1.00 1.00 1.00
SIC Sangli Jangamhatti 0.93 0.93 0.93
SIC Sangli Kadavi 0.37 0.35 0.40
SIC Sangli Kasari 0.39 0.46 0.92
SIC Sangli KC &Khodshi Backwater 1.00 0.01 0.75
SIC Sangli Kumbhi 0.26 0.31 0.62
SIC Sangli Morna (Sangli) 0.97 1.00 1.00
CIPC Chandrapur Naleshwar 1.00 1.00 1.00
SIC Sangli Patgaon 1.00 1.00 1.00
TIC Thane Rajanala 0.14 0.55 0.24
TIC Thane Wandri 0.79 0.98 0.30
SIC Sangli Yeoti Masoli 1.00 0.97 0.85
Normal
Surplus
Abundant
151

[Benchmarking Report 2018-19]
Plan group Circle Project FY Avg LY 2017-18 TY 2018-19 Past Max Past Min State Tar
CADA Beed Banganga 0.00 0.00 0.72 0.00 0.00 1.00
SIC Sangli Basappawadi 1.00 0 0.00 1.00 0.00 1.00
CADA Beed Benitura 0.00 0.00 0.00 0.00 0.00 1.00
CADA Solapur Bori (Solapur) 0.69 0.63 0.00 0.90 0.00 1.00
CADA Beed Chandani 0.00 0.00 0.00 0.00 0.00 1.00
CADA Solapur Ekrukh 0.91 0.94 1.00 1.00 0.16 1.00
CADA Beed Harni 0.06 0.00 0.00 1.00 0.00 1.00
CADA Solapur Hingani (Pangaon) 0.14 0.06 0.00 0.55 0.00 1.00
CADA Beed Jakapur 0.00 0.00 0.00 0.00 0.00 1.00
CADA Solapur Jawalgaon 0.22 0.09 0.09 0.97 0.07 1.00
CADA Beed Kada 0.21 0.00 0.00 0.42 0.00 1.00
CADA Beed Kadi 0.40 0.00 0.00 0.80 0.00 1.00
CADA Beed Kambli 0.00 0.00 0.00 0.00 0.00 1.00
CADA Pune Khairy 1.00 1.00 1.00 1.00 1.00 1.00
CADA Beed Khandala 0.08 0.00 0.00 0.55 0.00 1.00
CADA Beed Khandeshwar 0.00 0.00 0.00 0.00 0.00 1.00
CADA Beed Khasapur 0.03 0.00 0.00 0.22 0.00 1.00
CADA Beed Kurnoor 0.04 0.00 0.00 0.11 0.00 1.00
CADA Solapur Mangi 0.20 0.21 0.00 0.86 0.00 1.00
CADA Beed Mehakari 0.50 0.00 0.00 1.00 0.00 1.00
PIC Pune Nher 1.00 0.92 1.00 1.00 0.92 1.00
CADA Beed Ramganga 0.13 0.00 0.00 0.69 0.00 1.00
CADA Beed Rooty 0.38 0.00 0.00 0.76 0.00 1.00
CADA Beed Sakat 0.00 0.00 0.00 0.00 0.00 1.00
SIC Sangli Siddhewadi 0.86 1.00 0.00 1.00 0.00 1.00
CADA Pune Sina 1.00 1.00 1.00 1.00 1.00 1.00
CADA Beed Talwar 0.49 0.00 0.00 0.98 0.00 1.00
CADA Beed Turori 0.00 0.00 0.00 0.00 0.00 1.00
CADA Beed Wagholi 0.23 0.45 0.00 0.45 0.00 1.00
CADA Jalgaon Agnawati 0.44 0.15 0.00 0.94 0.00 1.00
CADA Abad Ajantha Andhari 1.00 0.00 0.00 0.02 0.00 1.00
CADA Abad Anjana Palashi 0.00 0.00 0.00 0.00 0.00 1.00
CADA Jalgaon Bahula 0.63 0.02 0.00 0.02 0.00 1.00
CADA Beed Belpara 0.52 0.00 0.00 1.00 0.00 1.00
CADA Jalgaon Bhokarbari 0.00 0.00 0.00 0.00 0.00 1.00
CADA Beed Bindusara 0.47 0.00 0.00 0.95 0.00 1.00
CADA Beed Bodhegaon 0.00 0.00 0.00 0.00 0.00 1.00
CADA Jalgaon Bori 0.31 0.00 0.00 0.90 0.00 1.00
CADA Beed Borna 0.07 0.08 0.00 0.08 0.00 1.00
CADA Jalgaon Burai 0.70 0.60 1.00 1.00 0.25 1.00
UWPC Amravati Chandrabhaga (Amravati) 0.99 1.00 0.70 1.00 0.09 1.00
CADA Beed Devarjan 0.88 1.00 0.72 1.00 0.18 1.00
CADA Abad Dhamna 0.00 0.00 0.00 0.00 0.00 1.00
AIC Akola Dnyanganga 0.76 0.93 0.00 0.93 0.00 1.00
CADA Abad Gadadgad 1.00 1.00 1.00 1.00 1.00 1.00
CADA Abad Galhati 1.00 1.00 0.00 1.00 1.00 1.00
CADA Beed Gharni 0.30 0.28 0.48 0.69 0.16 1.00
CADA Abad Girja 1.00 0.00 0.00 0.02 0.00 1.00
CADA Nashik Haranbari 0.80 0.84 0.75 1.00 0.00 1.00
CADA Jalgaon Hiwara 0.37 0.00 0.00 0.96 0.00 1.00
CADA Abad Jivrekha 0.00 0.00 0.00 0.00 0.00 1.00
Indicator XII_IMedium Projects
Assessment Recovery Ratio (Irrigation)
Deficit
Highly Deficit
152

[Benchmarking Report 2018-19]
Plan group Circle Project FY Avg LY 2017-18 TY 2018-19 Past Max Past Min State Tar
CADA Abad Jui 1.00 0.00 0.00 1.00 0.00 1.00
CADA Abad Kalyan Girja 1.00 0.00 0.00 0.44 0.00 1.00
CADA Jalgaon Kanoli 1.00 1.00 1.00 1.00 0.20 1.00
NIC Nanded Karadkhed 0.53 0.91 0.07 0.91 0.00 1.00
CADA Abad Karpara 0.11 0.01 0.12 0.24 0.00 1.00
CADA Nashik Kelzar 0.86 0.84 1.00 1.00 0.67 1.00
CADA Abad Khelna 1.00 0.00 0.00 0.62 0.00 1.00
NIC Nanded Kudala 0.30 0.31 0.15 0.31 0.00 1.00
CADA Beed Kundlika 0.00 0.00 0.00 0.00 0.00 1.00
NIC Nanded Kundrala 0.08 0.00 0.03 0.06 0.00 1.00
CADA Abad Lahuki 1.00 0.00 0.00 1.00 0.00 1.00
NIC Nanded Mahalingi 1.00 0.17 1.00 1.00 0.00 1.00
CADA Beed Mahasangvi 0.25 0.00 0.00 0.49 0.00 1.00
CADA Jalgaon Manyad 0.09 0.00 0.00 0.31 0.00 1.00
AIC Akola Mas 1.00 0.07 0.00 1.00 0.07 1.00
CADA Beed Masalga 0.30 0.81 0.00 0.81 0.00 1.00
CADA Abad Masoli 0.09 0.00 0.54 0.05 0.00 1.00
AIC Akola Morna (Akola) 0.70 0.00 0.17 1.00 0.00 1.00
BIPC Buldhana Mun 1.00 0.00 0.00 1.00 0.00 1.00
CADA Nashik Nagyasakya 0.53 0.88 0.77 0.90 0.00 1.00
AIC Akola Nirguna 0.54 1.00 0.40 1.00 0.37 1.00
AIC Akola Paldhag 0.42 0.47 0.67 0.47 0.00 1.00
NIC Nanded Pethwadaj 1.00 1.00 0.26 1.00 0.00 1.00
CADA Abad Pir Kalyan 0.25 − 0.00 0.25 0.25 1.00
UWPC Amravati Purna (Achalpur) 0.18 0.03 0.00 0.49 0.00 1.00
CADA Abad Purna Nevpur 0.95 1.00 0.06 1.00 0.90 1.00
CADA Beed Raigavan 0.00 0.00 0.00 0.00 0.00 1.00
CADA Jalgaon Rangawali 0.41 0.40 0.12 0.58 0.33 1.00
CADA Beed Renapur 0.16 0.88 0.00 0.88 0.02 1.00
CADA Beed Rui 0.12 0.00 0.00 0.45 0.00 1.00
CADA Beed Sakol 0.49 1.00 0.52 1.00 0.21 1.00
CADA Beed Sangameshwar (Dokewadi) 0.09 0.00 0.00 0.44 0.00 1.00
UWPC Amravati Sapan 0.56 0.58 0.42 0.69 0.42 1.00
CADA Beed Saraswati 0.00 0.00 0.00 0.00 0.00 1.00
UWPC Amravati Shahanoor 0.48 0.36 1.00 0.80 0.35 1.00
CADA Beed Sindphana 0.50 0.00 0.00 1.00 0.00 1.00
CADA Abad Sukhna 0.00 − 0.00 0.00 0.00 1.00
CADA Beed Tawarja 0.03 0.00 0.00 0.07 0.00 1.00
CADA Beed Terna 0.04 0.00 0.00 0.00 0.00 1.00
CADA Beed Tiru 0.20 0.20 0.00 0.29 0.19 1.00
CADA Jalgaon Tondapur 0.31 0.59 0.31 0.82 0.00 1.00
BIPC Buldhana Torna 1.00 0.23 0.00 1.00 0.00 1.00
AIC Akola Uma 0.76 0.00 0.00 0.90 0.00 1.00
BIPC Buldhana Utawali 0.10 0.00 0.00 0.17 0.00 1.00
CADA Beed Wan (Beed) 1.00 1.00 0.00 1.00 0.00 1.00
CADA Beed Whati 1.00 1.00 0.00 1.00 0.00 1.00
CADA Jalgaon Abhora 0.72 1.00 1.00 1.00 0.13 1.00
YIC Yavatmal Adan 0.23 0.00 1.00 1.00 0.00 1.00
CADA Nashik Adhala 0.79 0.57 0.75 1.00 0.57 1.00
CADA Nashik Alandi 1.00 1.00 1.00 1.00 0.48 1.00
CIPC Chandrapur Amal Nala 1.00 0.00 0.40 0.96 0.00 1.00
CADA Abad Ambadi 0.75 1.00 0.00 1.00 0.10 1.00
PIC Pune Andhali 1.00 0.75 0.00 1.00 0.00 1.00
CADA Jalgaon Aner 0.35 0.14 0.41 0.96 0.14 1.00
Deficit
Normal
153

[Benchmarking Report 2018-19]
Plan group Circle Project FY Avg LY 2017-18 TY 2018-19 Past Max Past Min State Tar
CADA Nashik Bhojapur 0.87 1.00 0.02 1.00 0.67 1.00
CADA Abad Bor Dahegaon 1.00 1.00 1.00 1.00 0.00 1.00
AIC Akola Borgaon 1.00 0.00 0.55 1.00 0.00 1.00
CADA Solapur Budhihal 1.00 1.00 0.00 1.00 0.00 1.00
CIPC Chandrapur Dham 0.54 1.00 0.18 1.00 0.14 1.00
CADA Abad Dheku 0.00 0.00 0.00 0.00 0.00 1.00
SIC Sangli Dodda Nalla 0.47 0.49 0.00 0.49 0.00 1.00
NIC Nanded Dongargaon (Nanded) 1.00 1.00 0.36 1.00 0.00 1.00
CIPC Chandrapur Dongargaon (Wardha) 0.09 0.00 0.00 0.41 0.00 1.00
WIC Washim Ekburji 0.67 0.00 0.06 0.72 0.00 1.00
CADA Nashik Ghatshil Pargaon 0.35 0.00 0.00 0.97 0.00 1.00
AIC Akola Goki 0.29 0.54 1.00 1.00 0.00 1.00
CADA Jalgaon Karwand 0.79 0.35 1.00 1.00 0.35 1.00
PIC Pune Kasarsai 0.75 0.93 1.00 0.93 0.64 1.00
CADA Abad Kolhi 0.00 0.00 0.00 0.00 0.00 1.00
AIC Akola Koradi 0.67 0.04 0.00 1.00 0.04 1.00
NIC Nanded Loni 0.31 0.00 0.64 0.13 0.00 1.00
AIC Akola Lowerpus 1.00 0.00 0.00 0.65 0.00 1.00
CADA Jalgaon Malangaon 0.79 0.80 0.96 1.00 0.44 1.00
CADA Nashik Mand Ohol 0.49 0.00 0.00 1.00 0.00 1.00
PIC Pune Mhaswad 1.00 1.00 0.00 1.00 1.00 1.00
JIPC Jalgaon Mor 0.80 0.00 0.89 1.00 0.00 1.00
NIC Nanded Nagzari 0.00 0.00 0.38 0.00 0.00 1.00
CADA Abad Narangi 0.00 0.00 1.00 0.00 0.00 1.00
YIC Yavatmal Navargaon 0.00 0.00 0.00 0.00 0.00 1.00
PIC Pune Nazare 0.21 1.00 1.00 1.00 0.21 1.00
CADA Jalgaon Panzra 0.78 0.78 1.00 1.00 0.00 1.00
BIPC Buldhana Pen Takli 0.59 0.27 0.00 0.27 0.00 1.00
CIPC Chandrapur Pothra 0.43 0.70 0.28 0.72 0.16 1.00
PIC Pune Ranand 0.74 0.32 1.00 1.00 0.00 1.00
AIC Akola Saikheda 0.45 0.73 0.20 1.00 0.00 1.00
SIC Sangli Sankh 0.38 0.38 1.00 0.38 0.00 1.00
PIC Pune Shetphal 0.04 0.53 0.00 0.53 0.00 1.00
WIC Washim Sonal 0.58 0.38 0.03 1.00 0.03 1.00
PIC Pune Sonwad 0.79 0.86 1.00 1.00 0.15 1.00
CADA Jalgaon Suki 1.00 1.00 1.00 1.00 0.43 1.00
CADA Abad Tembhapuri 0.00 0.00 0.00 0.00 0.00 1.00
PIC Pune Tisangi 0.70 0.49 0.49 1.00 0.28 1.00
PIC Pune Vadiwale 0.87 0.92 0.92 1.00 0.79 1.00
CADA Pune Visapur 1.00 1.00 0.48 1.00 1.00 1.00
AIC Akola Waghadi 0.43 1.00 0.42 1.00 0.00 1.00
CADA Nagpur Bagheda 0.41 0.02 0.21 1.00 0.02 1.00
CADA Nagpur Betekar Bothali 0.50 0.50 0.59 0.58 0.39 1.00
CADA Nagpur Bodalkasa 0.86 0.75 0.14 1.00 0.75 1.00
CIPC Chandrapur Chandai 1.00 1.00 1.00 1.00 0.55 1.00
CADA Nagpur Chandpur 0.47 1.00 1.00 1.00 0.36 1.00
CADA Nagpur Chandrabhaga (Nagpur) 0.29 0.27 1.00 0.56 0.03 1.00
CIPC Chandrapur Chargaon 1.00 0.91 0.64 1.00 0.91 1.00
CADA Nagpur Chorakhmara 0.48 0.11 0.03 0.67 0.11 1.00
CADA Nagpur Chulband 0.44 0.65 0.10 0.65 0.25 1.00
CADA Nagpur Kanholibara 0.22 0.55 0.00 0.55 0.01 1.00
CADA Nagpur Kesarnala 0.02 0.00 0.23 0.04 0.00 1.00
CADA Nagpur Khairbanda 0.42 0.12 0.28 1.00 0.12 1.00
CADA Nagpur Khekranala 0.08 0.57 0.16 0.57 0.00 1.00
Normal
Surplus
154

[Benchmarking Report 2018-19]
Plan group Circle Project FY Avg LY 2017-18 TY 2018-19 Past Max Past Min State Tar
CADA Nagpur Kolar 0.07 0.19 0.01 0.19 0.01 1.00
CIPC Chandrapur Labhansarad 0.68 1.00 1.00 1.00 0.45 1.00
CADA Nagpur Makardhokada-Saiki Complex 0.47 0.65 0.40 0.65 0.19 1.00
CADA Nagpur Managadh 0.75 0.60 0.03 1.00 0.51 1.00
CADA Nagpur Mordham 0.29 0.15 0.26 1.00 0.06 1.00
CIPC Chandrapur Pakadigundam 1.00 0.00 0.43 1.00 0.00 1.00
CIPC Chandrapur Panchadhara 0.63 1.00 0.11 1.00 0.22 1.00
CADA Nagpur Pandhrabodi 0.60 1.00 0.37 1.00 0.40 1.00
CADA Nagpur Rengepar 0.75 1.00 0.25 1.00 0.10 1.00
CADA Nagpur Sangrampur 0.68 1.00 0.11 1.00 0.15 1.00
CADA Nagpur Sorna 0.44 0.39 0.46 0.60 0.36 1.00
CADA Nagpur Umri 0.25 0.66 0.04 0.66 0.03 1.00
CADA Nagpur Wunna 0.75 1.00 1.00 1.00 0.34 1.00
SIC Sangli Chikotra 0.53 0.38 0.44 0.78 0.38 1.00
SIC Sangli Chitri 0.79 0.80 0.80 0.80 0.76 1.00
SIC Sangli Ghatprabha (Pathakwadi) 0.69 0.64 0.64 0.92 0.64 1.00
CIPC Chandrapur Ghorazari 0.94 1.00 0.44 1.00 0.53 1.00
SIC Sangli Jangamhatti 0.48 0.23 0.36 1.00 0.23 1.00
SIC Sangli Kadavi 0.64 0.78 0.86 0.86 0.33 1.00
SIC Sangli Kasari 0.71 0.83 0.62 0.90 0.45 1.00
SIC Sangli KC &Khodshi Backwater 0.88 0.79 0.83 1.00 0.63 1.00
SIC Sangli Kumbhi 0.98 1.00 1.00 1.00 0.79 1.00
SIC Sangli Morna (Sangli) 0.80 0.72 1.00 1.00 0.64 1.00
CIPC Chandrapur Naleshwar 0.83 0.78 0.47 1.00 0.44 1.00
SIC Sangli Patgaon 0.86 1.00 1.00 1.00 0.40 1.00
TIC Thane Rajanala 0.53 0.26 0.23 1.00 0.00 1.00
TIC Thane Wandri 0.46 0.20 0.09 0.88 0.20 1.00
SIC Sangli Yeoti Masoli 0.95 0.56 0.68 1.00 0.56 1.00
Surplus
Abundant
155

[Benchmarking Report 2018-19]
Plan group Circle Project FY Avg LY 2017-18 TY 2018-19 Past Max Past Min State Tar
CADA Beed Banganga 0.58 0.00 0.00 0.83 0.00 1.00
SIC Sangli Basappawadi 1.00 0.56 1.00 1.00 0.00 1.00
CADA Beed Benitura 0.13 0.26 0.25 1.00 0.00 1.00
CADA Solapur Bori (Solapur) 0.24 0.21 0.74 1.00 0.04 1.00
CADA Beed Chandani 0.92 0.84 0.00 1.00 0.00 1.00
CADA Solapur Ekrukh 0.55 0.38 0.32 1.00 0.38 1.00
CADA Beed Harni 0.96 1.00 0.00 1.00 0.00 1.00
CADA Solapur Hingani (Pangaon) 0.86 0.64 0.64 1.00 0.30 1.00
CADA Beed Jakapur 0.00 0.00 0.00 0.00 0.00 1.00
CADA Solapur Jawalgaon 0.48 0.00 0.00 1.00 0.00 1.00
CADA Beed Kada 0.42 0.00 0.00 1.00 0.00 1.00
CADA Beed Kadi 1.00 0.00 1.00 1.00 0.00 1.00
CADA Beed Kambli 1.00 0.00 1.00 1.00 0.00 1.00
CADA Pune Khairy 1.00 1.00 0.00 1.00 1.00 1.00
CADA Beed Khandala 0.03 0.00 0.00 0.18 0.00 1.00
CADA Beed Khandeshwar 0.00 0.00 0.00 0.00 0.00 1.00
CADA Beed Khasapur 0.05 1.00 1.00 1.00 0.00 1.00
CADA Beed Kurnoor 0.00 0.00 0.24 0.00 0.00 1.00
CADA Solapur Mangi 1.00 1.00 0.83 1.00 1.00 1.00
CADA Beed Mehakari 0.00 0.00 1.00 0.00 0.00 1.00
PIC Pune Nher 0.68 1.00 1.00 1.00 0.00 1.00
CADA Beed Ramganga 0.00 0.00 0.00 0.00 0.00 1.00
CADA Beed Rooty 0.04 0.00 1.00 1.00 0.00 1.00
CADA Beed Sakat 0.00 0.00 0.00 0.00 0.00 1.00
SIC Sangli Siddhewadi 0.24 0.00 0.00 0.71 0.00 1.00
CADA Pune Sina 1.00 0.00 0.00 1.00 0.00 1.00
CADA Beed Talwar 0.00 0.00 1.00 0.00 0.00 1.00
CADA Beed Turori 0.65 0.00 0.00 1.00 0.00 1.00
CADA Beed Wagholi 0.00 0.00 0.00 0.00 0.00 1.00
CADA Jalgaon Agnawati 0.93 0.00 0.00 1.00 0.00 1.00
CADA Abad Ajantha Andhari 0.89 0.82 1.00 1.00 0.82 1.00
CADA Abad Anjana Palashi 1.00 1.00 1.00 1.00 0.88 1.00
CADA Jalgaon Bahula 1.00 1.00 1.00 1.00 0.00 1.00
CADA Beed Belpara 0.00 0.00 0.00 0.00 0.00 1.00
CADA Jalgaon Bhokarbari 0.57 0.00 0.00 1.00 0.00 1.00
CADA Beed Bindusara 0.07 0.00 0.21 1.00 0.00 1.00
CADA Beed Bodhegaon 1.00 1.00 1.00 1.00 0.00 1.00
CADA Jalgaon Bori 0.62 0.05 0.41 1.00 0.04 1.00
CADA Beed Borna 1.00 1.00 1.00 1.00 0.00 1.00
CADA Jalgaon Burai 0.42 1.00 0.25 1.00 0.00 1.00
UWPC Amravati Chandrabhaga (Amravati) 0.85 0.51 0.52 1.00 0.37 1.00
CADA Beed Devarjan 1.00 1.00 1.00 1.00 1.00 1.00
CADA Abad Dhamna 0.05 0.00 0.00 0.05 0.00 1.00
AIC Akola Dnyanganga 0.89 0.99 1.00 0.99 0.84 1.00
CADA Abad Gadadgad 1.00 1.00 1.00 1.00 0.97 1.00
CADA Abad Galhati 0.00 0.00 0.00 0.00 0.00 1.00
CADA Beed Gharni 0.24 1.00 0.33 1.00 0.07 1.00
CADA Abad Girja 0.39 0.25 1.00 0.56 0.25 1.00
CADA Nashik Haranbari 0.60 1.00 1.00 1.00 0.05 1.00
CADA Jalgaon Hiwara 0.81 1.00 0.00 1.00 0.47 1.00
CADA Abad Jivrekha 0.07 0.00 0.20 0.07 0.00 1.00
Indicator XII_NIMedium Projects
Assessment Recovery Ratio (Non Irrigation)
Deficit
Highly Deficit
156

[Benchmarking Report 2018-19]
Plan group Circle Project FY Avg LY 2017-18 TY 2018-19 Past Max Past Min State Tar
CADA Abad Jui 1.00 0.00 0.00 1.00 0.00 1.00
CADA Abad Kalyan Girja 0.00 0.00 0.00 0.00 0.00 1.00
CADA Jalgaon Kanoli 0.27 0.03 1.00 1.00 0.03 1.00
NIC Nanded Karadkhed 0.74 0.69 0.55 0.92 0.58 1.00
CADA Abad Karpara 1.00 1.00 0.00 1.00 0.00 1.00
CADA Nashik Kelzar 0.91 1.00 1.00 1.00 0.39 1.00
CADA Abad Khelna 0.88 0.85 0.44 1.00 0.16 1.00
NIC Nanded Kudala 0.99 0.89 1.00 1.00 0.13 1.00
CADA Beed Kundlika 0.93 0.00 0.93 0.93 0.00 1.00
NIC Nanded Kundrala 0.75 0.46 0.39 1.00 0.46 1.00
CADA Abad Lahuki 0.84 0.66 1.00 1.00 0.66 1.00
NIC Nanded Mahalingi 0.06 0.00 0.00 1.00 0.00 1.00
CADA Beed Mahasangvi 0.39 0.77 1.00 1.00 0.00 1.00
CADA Jalgaon Manyad 1.00 0.00 0.00 1.00 0.00 1.00
AIC Akola Mas 1.00 0.90 1.00 1.00 0.21 1.00
CADA Beed Masalga 0.00 0.01 1.00 0.01 0.00 1.00
CADA Abad Masoli 0.89 0.21 0.33 1.00 0.21 1.00
AIC Akola Morna (Akola) 0.99 1.00 0.94 1.00 0.67 1.00
BIPC Buldhana Mun 1.00 1.00 1.00 1.00 1.00 1.00
CADA Nashik Nagyasakya 0.88 1.00 1.00 1.00 0.04 1.00
AIC Akola Nirguna 0.50 0.50 1.00 1.00 0.00 1.00
AIC Akola Paldhag 1.00 1.00 0.58 1.00 1.00 1.00
NIC Nanded Pethwadaj 1.00 1.00 0.00 1.00 0.00 1.00
CADA Abad Pir Kalyan 0.00 − 0.00 0.00 0.00 1.00
UWPC Amravati Purna (Achalpur) 0.66 0.58 0.00 0.85 0.00 1.00
CADA Abad Purna Nevpur 1.00 1.00 0.79 1.00 1.00 1.00
CADA Beed Raigavan 0.02 0.00 0.00 0.05 0.00 1.00
CADA Jalgaon Rangawali 1.00 0.85 0.65 1.00 0.30 1.00
CADA Beed Renapur 0.93 0.00 1.00 1.00 0.00 1.00
CADA Beed Rui 0.05 0.00 0.00 0.00 0.00 1.00
CADA Beed Sakol 0.71 0.44 1.00 0.44 0.00 1.00
CADA Beed Sangameshwar (Dokewadi) 0.35 0.58 0.00 0.58 0.00 1.00
UWPC Amravati Sapan 1.00 0.00 1.00 1.00 0.00 1.00
CADA Beed Saraswati 1.00 1.00 0.00 1.00 0.00 1.00
UWPC Amravati Shahanoor 0.56 0.13 0.57 0.88 0.13 1.00
CADA Beed Sindphana 1.00 0.00 0.00 1.00 0.00 1.00
CADA Abad Sukhna 0.87 − 1.00 0.87 0.87 1.00
CADA Beed Tawarja 0.50 0.35 0.29 0.51 0.00 1.00
CADA Beed Terna 0.23 0.00 0.00 1.00 0.00 1.00
CADA Beed Tiru 0.03 0.03 1.00 0.10 0.00 1.00
CADA Jalgaon Tondapur 1.00 1.00 1.00 1.00 0.73 1.00
BIPC Buldhana Torna 1.00 1.00 1.00 1.00 1.00 1.00
AIC Akola Uma 0.63 1.00 0.93 1.00 0.00 1.00
BIPC Buldhana Utawali 1.00 1.00 1.00 1.00 0.00 1.00
CADA Beed Wan (Beed) 0.84 1.00 0.00 1.00 0.05 1.00
CADA Beed Whati 0.79 1.00 1.00 1.00 0.00 1.00
CADA Jalgaon Abhora 0.00 0.00 0.00 0.00 0.00 1.00
YIC Yavatmal Adan 0.59 0.00 1.00 1.00 0.00 1.00
CADA Nashik Adhala 0.75 1.00 0.56 1.00 0.00 1.00
CADA Nashik Alandi 1.00 1.00 1.00 1.00 1.00 1.00
CIPC Chandrapur Amal Nala 0.84 0.17 0.94 1.00 0.17 1.00
CADA Abad Ambadi 0.84 1.00 1.00 1.00 0.51 1.00
PIC Pune Andhali 0.97 1.00 1.00 1.00 0.72 1.00
CADA Jalgaon Aner 0.24 0.00 0.05 1.00 0.00 1.00
Deficit
Normal
157

[Benchmarking Report 2018-19]
Plan group Circle Project FY Avg LY 2017-18 TY 2018-19 Past Max Past Min State Tar
CADA Nashik Bhojapur 0.59 0.43 0.02 1.00 0.43 1.00
CADA Abad Bor Dahegaon 0.00 0.00 0.00 0.00 0.00 1.00
AIC Akola Borgaon 1.00 0.00 0.00 1.00 0.00 1.00
CADA Solapur Budhihal 0.00 0.00 0.00 0.00 0.00 1.00
CIPC Chandrapur Dham 0.96 1.00 0.95 1.00 0.86 1.00
CADA Abad Dheku 0.92 1.00 1.00 1.00 0.84 1.00
SIC Sangli Dodda Nalla 0.88 0.64 1.00 1.00 0.64 1.00
NIC Nanded Dongargaon (Nanded) 0.00 0.00 0.00 0.00 0.00 1.00
CIPC Chandrapur Dongargaon (Wardha) 0.00 0.00 0.00 0.00 0.00 1.00
WIC Washim Ekburji 0.89 0.00 0.00 1.00 0.00 1.00
CADA Nashik Ghatshil Pargaon 0.00 0.00 0.00 0.00 0.00 1.00
AIC Akola Goki 0.99 0.95 0.74 1.00 0.95 1.00
CADA Jalgaon Karwand 0.56 0.76 0.50 0.78 0.32 1.00
PIC Pune Kasarsai 0.51 0.32 0.54 1.00 0.00 1.00
CADA Abad Kolhi 0.74 1.00 0.88 1.00 0.07 1.00
AIC Akola Koradi 0.90 0.23 1.00 1.00 0.23 1.00
NIC Nanded Loni 1.00 0.00 0.00 1.00 0.00 1.00
AIC Akola Lowerpus 1.00 1.00 0.13 1.00 0.93 1.00
CADA Jalgaon Malangaon 0.59 1.00 0.87 1.00 0.05 1.00
CADA Nashik Mand Ohol 0.72 0.52 1.00 1.00 0.00 1.00
PIC Pune Mhaswad 0.00 0.00 0.00 0.00 0.00 1.00
JIPC Jalgaon Mor 0.00 0.00 0.00 0.00 0.00 1.00
NIC Nanded Nagzari 1.00 1.00 1.00 1.00 0.03 1.00
CADA Abad Narangi 1.00 1.00 0.00 1.00 1.00 1.00
YIC Yavatmal Navargaon 0.85 0.92 0.45 1.00 0.25 1.00
PIC Pune Nazare 0.89 1.00 1.00 1.00 0.88 1.00
CADA Jalgaon Panzra 0.74 0.08 0.20 1.00 0.00 1.00
BIPC Buldhana Pen Takli 1.00 0.80 0.46 1.00 0.71 1.00
CIPC Chandrapur Pothra 0.77 0.00 0.00 1.00 0.00 1.00
PIC Pune Ranand 0.85 0.85 1.00 0.85 0.00 1.00
AIC Akola Saikheda 0.71 0.47 0.84 1.00 0.42 1.00
SIC Sangli Sankh 0.00 0.00 0.00 0.00 0.00 1.00
PIC Pune Shetphal 1.00 0.00 1.00 1.00 0.00 1.00
WIC Washim Sonal 0.17 0.13 0.00 0.32 0.00 1.00
PIC Pune Sonwad 1.00 0.00 0.34 1.00 0.00 1.00
CADA Jalgaon Suki 1.00 1.00 1.00 1.00 0.45 1.00
CADA Abad Tembhapuri 0.96 1.00 1.00 1.00 0.00 1.00
PIC Pune Tisangi 0.00 0.00 0.00 0.00 0.00 1.00
PIC Pune Vadiwale 0.71 0.60 0.60 1.00 0.00 1.00
CADA Pune Visapur 0.08 0.07 0.28 0.17 0.07 1.00
AIC Akola Waghadi 0.75 0.51 0.84 1.00 0.51 1.00
CADA Nagpur Bagheda 1.00 1.00 1.00 1.00 0.00 1.00
CADA Nagpur Betekar Bothali 0.00 0.00 0.00 0.00 0.00 1.00
CADA Nagpur Bodalkasa 1.00 1.00 1.00 1.00 0.00 1.00
CIPC Chandrapur Chandai 0.00 0.00 0.00 0.00 0.00 1.00
CADA Nagpur Chandpur 0.29 0.38 0.05 1.00 0.12 1.00
CADA Nagpur Chandrabhaga (Nagpur) 0.94 0.67 1.00 1.00 0.67 1.00
CIPC Chandrapur Chargaon 1.00 0.00 1.00 1.00 0.00 1.00
CADA Nagpur Chorakhmara 1.00 1.00 1.00 1.00 0.00 1.00
CADA Nagpur Chulband 0.22 1.00 1.00 1.00 0.00 1.00
CADA Nagpur Kanholibara 1.00 0.00 0.00 1.00 0.00 1.00
CADA Nagpur Kesarnala 0.53 0.04 0.03 1.00 0.00 1.00
CADA Nagpur Khairbanda 1.00 1.00 1.00 1.00 0.00 1.00
CADA Nagpur Khekranala 0.80 1.00 0.99 1.00 0.00 1.00
Normal
Surplus
158

[Benchmarking Report 2018-19]
Plan group Circle Project FY Avg LY 2017-18 TY 2018-19 Past Max Past Min State Tar
CADA Nagpur Kolar 0.90 1.00 0.70 1.00 0.65 1.00
CIPC Chandrapur Labhansarad 1.00 0.00 1.00 1.00 0.00 1.00
CADA Nagpur Makardhokada-Saiki Complex 0.88 0.53 0.66 1.00 0.53 1.00
CADA Nagpur Managadh 1.00 1.00 1.00 1.00 1.00 1.00
CADA Nagpur Mordham 0.50 0.15 1.00 1.00 0.00 1.00
CIPC Chandrapur Pakadigundam 1.00 1.00 1.00 1.00 1.00 1.00
CIPC Chandrapur Panchadhara 0.00 0.00 0.00 0.00 0.00 1.00
CADA Nagpur Pandhrabodi 0.75 1.00 0.54 1.00 0.41 1.00
CADA Nagpur Rengepar 0.00 0.00 0.00 0.00 0.00 1.00
CADA Nagpur Sangrampur 0.00 0.00 1.00 0.00 0.00 1.00
CADA Nagpur Sorna 0.00 0.00 0.00 0.00 0.00 1.00
CADA Nagpur Umri 1.00 0.00 0.99 1.00 0.00 1.00
CADA Nagpur Wunna 1.00 1.00 1.00 1.00 1.00 1.00
SIC Sangli Chikotra 1.00 0.48 0.48 1.00 0.00 1.00
SIC Sangli Chitri 0.77 0.65 0.89 1.00 0.65 1.00
SIC Sangli Ghatprabha (Pathakwadi) 1.00 0.00 0.00 1.00 0.00 1.00
CIPC Chandrapur Ghorazari 0.00 0.00 0.00 0.00 0.00 1.00
SIC Sangli Jangamhatti 1.00 1.00 1.00 1.00 1.00 1.00
SIC Sangli Kadavi 0.53 0.59 1.00 1.00 0.10 1.00
SIC Sangli Kasari 0.54 1.00 1.00 1.00 0.00 1.00
SIC Sangli KC &Khodshi Backwater 0.84 1.00 1.00 1.00 0.58 1.00
SIC Sangli Kumbhi 1.00 1.00 1.00 1.00 0.89 1.00
SIC Sangli Morna (Sangli) 0.54 1.00 0.95 1.00 0.24 1.00
CIPC Chandrapur Naleshwar 0.44 0.00 0.00 1.00 0.00 1.00
SIC Sangli Patgaon 0.97 1.00 1.00 1.00 0.75 1.00
TIC Thane Rajanala 0.00 0.00 0.00 0.00 0.00 1.00
TIC Thane Wandri 0.00 0.00 0.00 0.00 0.00 1.00
SIC Sangli Yeoti Masoli 0.88 1.00 1.00 1.00 0.69 1.00
Surplus
Abundant
159

[Benchmarking Report 2018-19]
Plan group Circle Project FY Avg LY 2017-18 TY 2018-19 Past Max Past Min State Tar
CADA Beed Banganga 0.00 0.00 0.00 0.00 0.00 1.00
SIC Sangli Basappawadi 0.00 0 0.00 0.00 0.00 1.00
CADA Beed Benitura 0.00 0.00 0.00 0.00 0.00 1.00
CADA Solapur Bori (Solapur) 0.00 0.00 0.00 0.00 0.00 1.00
CADA Beed Chandani 0.23 0.57 0.00 0.57 0.00 1.00
CADA Solapur Ekrukh 0.00 0.00 0.00 0.00 0.00 1.00
CADA Beed Harni 0.30 0.56 0.00 0.56 0.00 1.00
CADA Solapur Hingani (Pangaon) 0.41 0.53 0.00 0.66 0.00 1.00
CADA Beed Jakapur 0.00 0.00 0.00 0.00 0.00 1.00
CADA Solapur Jawalgaon 0.22 0.44 0.44 0.44 0.00 1.00
CADA Beed Kada 0.18 0.45 0.00 0.45 0.00 1.00
CADA Beed Kadi 0.00 0.00 0.00 0.00 0.00 1.00
CADA Beed Kambli 0.16 0.48 0.00 0.48 0.00 1.00
CADA Pune Khairy 0.00 0.00 0.00 0.00 0.00 1.00
CADA Beed Khandala 0.28 0.56 0.00 0.56 0.00 1.00
CADA Beed Khandeshwar 0.00 0.00 0.00 0.00 0.00 1.00
CADA Beed Khasapur 0.30 0.51 0.00 0.51 0.00 1.00
CADA Beed Kurnoor 0.00 0.00 0.00 0.00 0.00 1.00
CADA Solapur Mangi 0.14 0.00 0.00 0.71 0.00 1.00
CADA Beed Mehakari 0.17 0.48 0.00 0.48 0.00 1.00
PIC Pune Nher 0.19 0.38 0.00 0.38 0.00 1.00
CADA Beed Ramganga 0.45 0.59 0.00 0.59 0.00 1.00
CADA Beed Rooty 0.17 0.48 0.00 0.48 0.00 1.00
CADA Beed Sakat 0.00 0.00 0.00 0.00 0.00 1.00
SIC Sangli Siddhewadi 0.33 0.00 0.00 0.72 0.00 1.00
CADA Pune Sina 0.98 0.98 0.98 0.98 0.98 1.00
CADA Beed Talwar 0.00 0.00 0.00 0.00 0.00 1.00
CADA Beed Turori 0.00 0.00 0.00 0.00 0.00 1.00
CADA Beed Wagholi 0.00 0.00 0.00 0.00 0.00 1.00
CADA Jalgaon Agnawati 0.00 0.00 0.00 0.00 0.00 1.00
CADA Abad Ajantha Andhari 0.00 0.00 0.00 0.00 0.00 1.00
CADA Abad Anjana Palashi 0.00 0.00 0.00 0.00 0.00 1.00
CADA Jalgaon Bahula 0.00 0.00 0.00 0.00 0.00 1.00
CADA Beed Belpara 0.09 0.00 0.00 0.43 0.00 1.00
CADA Jalgaon Bhokarbari 0.20 0.00 0.00 0.78 0.00 1.00
CADA Beed Bindusara 0.14 0.40 0.00 0.40 0.00 1.00
CADA Beed Bodhegaon 0.51 0.51 0.00 0.51 0.00 1.00
CADA Jalgaon Bori 0.50 0.00 0.00 1.00 0.00 1.00
CADA Beed Borna 0.00 0.00 0.00 0.00 0.00 1.00
CADA Jalgaon Burai 0.60 0.60 0.60 0.60 0.60 1.00
UWPC Amravati Chandrabhaga (Amravati) 0.40 0.00 0.23 1.00 0.00 1.00
CADA Beed Devarjan 0.00 0.00 0.00 0.00 0.00 1.00
CADA Abad Dhamna 0.00 0.00 0.00 0.00 0.00 1.00
AIC Akola Dnyanganga 0.00 0.00 0.00 0.00 0.00 1.00
CADA Abad Gadadgad 0.65 0.65 0.65 0.65 0.00 1.00
CADA Abad Galhati 0.00 0.00 0.00 0.00 0.00 1.00
CADA Beed Gharni 0.37 0.00 0.73 0.56 0.00 1.00
CADA Abad Girja 0.00 0.00 0.00 0.00 0.00 1.00
CADA Nashik Haranbari 0.46 0.60 0.40 1.00 0.00 1.00
CADA Jalgaon Hiwara 0.30 0.00 0.00 0.61 0.00 1.00
CADA Abad Jivrekha 0.00 0.00 0.00 0.00 0.00 1.00
Indicator XIII_AMedium Projects
Water Delivery Capacity Index - A (Ratio)
Deficit
Highly Deficit
160

[Benchmarking Report 2018-19]
Plan group Circle Project FY Avg LY 2017-18 TY 2018-19 Past Max Past Min State Tar
CADA Abad Jui 0.17 0.35 0.00 0.35 0.00 1.00
CADA Abad Kalyan Girja 1.00 1.00 1.00 1.00 0.00 1.00
CADA Jalgaon Kanoli 0.00 0.00 0.00 0.00 0.00 1.00
NIC Nanded Karadkhed 0.23 0.00 0.00 0.70 0.00 1.00
CADA Abad Karpara 0.00 0.00 0.00 0.00 0.00 1.00
CADA Nashik Kelzar 0.46 0.44 0.44 0.56 0.31 1.00
CADA Abad Khelna 0.00 0.00 0.00 0.00 0.00 1.00
NIC Nanded Kudala 0.51 0.77 0.77 0.77 0.00 1.00
CADA Beed Kundlika 0.60 0.60 0.00 0.60 0.60 1.00
NIC Nanded Kundrala 0.26 0.00 0.00 0.77 0.00 1.00
CADA Abad Lahuki 0.39 0.00 0.00 0.78 0.00 1.00
NIC Nanded Mahalingi 0.22 0.00 0.00 0.65 0.00 1.00
CADA Beed Mahasangvi 0.00 0.00 0.00 0.00 0.00 1.00
CADA Jalgaon Manyad 0.00 0.00 0.00 0.00 0.00 1.00
AIC Akola Mas 0.25 0.00 0.00 0.50 0.00 1.00
CADA Beed Masalga 0.00 0.00 0.00 0.00 0.00 1.00
CADA Abad Masoli 0.58 0.57 0.00 0.60 0.00 1.00
AIC Akola Morna (Akola) 0.62 0.00 0.62 0.62 0.00 1.00
BIPC Buldhana Mun 0.00 0.00 0.00 0.00 0.00 1.00
CADA Nashik Nagyasakya 0.41 0.63 0.00 0.63 0.00 1.00
AIC Akola Nirguna 0.00 0.00 0.00 0.00 0.00 1.00
AIC Akola Paldhag 0.76 0.93 0.00 0.93 0.00 1.00
NIC Nanded Pethwadaj 0.17 0.00 0.56 0.50 0.00 1.00
CADA Abad Pir Kalyan 0.00 − 0.00 0.00 0.00 1.00
UWPC Amravati Purna (Achalpur) 0.00 0.00 0.00 0.00 0.00 1.00
CADA Abad Purna Nevpur 0.00 0.00 0.00 0.00 0.00 1.00
CADA Beed Raigavan 0.20 0.50 0.00 0.50 0.00 1.00
CADA Jalgaon Rangawali 0.60 0.60 0.60 0.60 0.60 1.00
CADA Beed Renapur 0.00 0.00 0.00 0.00 0.00 1.00
CADA Beed Rui 0.00 0.00 0.00 0.00 0.00 1.00
CADA Beed Sakol 0.00 0.00 0.00 0.00 0.00 1.00
CADA Beed Sangameshwar (Dokewadi) 0.00 0.00 0.00 0.00 0.00 1.00
UWPC Amravati Sapan 0.76 0.00 0.76 0.76 0.00 1.00
CADA Beed Saraswati 0.37 0.37 0.00 0.37 0.37 1.00
UWPC Amravati Shahanoor 0.00 0.00 0.00 0.00 0.00 1.00
CADA Beed Sindphana 0.18 0.47 0.00 0.47 0.00 1.00
CADA Abad Sukhna 0.00 − 0.00 0.00 0.00 1.00
CADA Beed Tawarja 0.18 0.50 0.00 0.50 0.00 1.00
CADA Beed Terna 0.16 0.40 0.00 0.40 0.00 1.00
CADA Beed Tiru 0.25 0.00 0.00 0.75 0.00 1.00
CADA Jalgaon Tondapur 0.42 0.12 0.00 0.66 0.00 1.00
BIPC Buldhana Torna 0.74 0.69 0.69 0.83 0.00 1.00
AIC Akola Uma 0.50 0.00 0.88 0.84 0.00 1.00
BIPC Buldhana Utawali 0.00 0.00 0.00 0.00 0.00 1.00
CADA Beed Wan (Beed) 0.40 0.40 0.00 0.40 0.40 1.00
CADA Beed Whati 0.00 0.00 0.00 0.00 0.00 1.00
CADA Jalgaon Abhora 0.00 0.00 0.00 0.00 0.00 1.00
YIC Yavatmal Adan 0.00 0.00 0.00 0.00 0.00 1.00
CADA Nashik Adhala 1.05 1.09 1.09 1.09 1.00 1.00
CADA Nashik Alandi 0.68 0.74 0.74 0.74 0.63 1.00
CIPC Chandrapur Amal Nala 0.00 0.00 0.00 0.00 0.00 1.00
CADA Abad Ambadi 0.00 0.00 0.00 0.00 0.00 1.00
PIC Pune Andhali 0.20 0.00 0.00 0.98 0.00 1.00
CADA Jalgaon Aner 0.70 0.70 0.70 0.70 0.70 1.00
Deficit
Normal
161

[Benchmarking Report 2018-19]
Plan group Circle Project FY Avg LY 2017-18 TY 2018-19 Past Max Past Min State Tar
CADA Nashik Bhojapur 0.70 0.70 0.60 0.80 0.54 1.00
CADA Abad Bor Dahegaon 0.00 0.00 0.00 0.00 0.00 1.00
AIC Akola Borgaon 0.33 0.00 0.71 0.66 0.00 1.00
CADA Solapur Budhihal 0.11 0.00 0.00 0.57 0.00 1.00
CIPC Chandrapur Dham 0.00 0.00 0.00 0.00 0.00 1.00
CADA Abad Dheku 0.00 0.00 0.00 0.00 0.00 1.00
SIC Sangli Dodda Nalla 0.00 0.00 0.00 0.00 0.00 1.00
NIC Nanded Dongargaon (Nanded) 0.00 0.00 0.00 0.00 0.00 1.00
CIPC Chandrapur Dongargaon (Wardha) 1.00 1.00 1.00 1.00 1.00 1.00
WIC Washim Ekburji 0.24 0.00 0.00 0.65 0.00 1.00
CADA Nashik Ghatshil Pargaon 0.19 0.00 0.00 0.95 0.00 1.00
AIC Akola Goki 0.00 0.00 0.00 0.00 0.00 1.00
CADA Jalgaon Karwand 0.00 0.00 0.00 0.00 0.00 1.00
PIC Pune Kasarsai 0.00 0.00 0.00 0.00 0.00 1.00
CADA Abad Kolhi 0.30 0.00 0.00 0.60 0.00 1.00
AIC Akola Koradi 0.49 0.49 0.00 0.49 0.00 1.00
NIC Nanded Loni 0.83 0.81 0.71 0.85 0.00 1.00
AIC Akola Lowerpus 0.62 0.64 0.64 0.64 0.00 1.00
CADA Jalgaon Malangaon 0.48 0.60 0.60 0.60 0.00 1.00
CADA Nashik Mand Ohol 0.00 0.00 0.00 0.00 0.00 1.00
PIC Pune Mhaswad 0.24 0.00 0.00 0.61 0.00 1.00
JIPC Jalgaon Mor 0.00 0.00 0.00 0.00 0.00 1.00
NIC Nanded Nagzari 0.00 0.00 0.00 0.00 0.00 1.00
CADA Abad Narangi 0.00 0.00 0.00 0.00 0.00 1.00
YIC Yavatmal Navargaon 0.27 0.00 0.00 0.53 0.00 1.00
PIC Pune Nazare 1.00 0.00 0.00 1.00 0.00 1.00
CADA Jalgaon Panzra 0.60 0.60 0.60 0.60 0.60 1.00
BIPC Buldhana Pen Takli 0.00 0.00 0.00 0.00 0.00 1.00
CIPC Chandrapur Pothra 0.49 0.52 0.49 0.52 0.41 1.00
PIC Pune Ranand 0.48 0.62 0.00 0.88 0.00 1.00
AIC Akola Saikheda 0.50 0.50 0.32 0.50 0.00 1.00
SIC Sangli Sankh 0.00 0.00 0.00 0.00 0.00 1.00
PIC Pune Shetphal 1.00 0.00 0.00 1.00 0.00 1.00
WIC Washim Sonal 0.61 0.00 0.00 0.84 0.00 1.00
PIC Pune Sonwad 0.00 0.00 0.60 0.00 0.00 1.00
CADA Jalgaon Suki 0.23 0.24 0.43 0.29 0.19 1.00
CADA Abad Tembhapuri 0.00 0.00 0.00 0.00 0.00 1.00
PIC Pune Tisangi 0.92 1.08 1.08 1.26 0.00 1.00
PIC Pune Vadiwale 0.00 0.00 0.00 0.00 0.00 1.00
CADA Pune Visapur 0.74 0.74 0.74 0.74 0.74 1.00
AIC Akola Waghadi 0.00 0.00 0.00 0.00 0.00 1.00
CADA Nagpur Bagheda 0.00 0.00 0.00 0.00 0.00 1.00
CADA Nagpur Betekar Bothali 0.00 0.00 0.00 0.00 0.00 1.00
CADA Nagpur Bodalkasa 1.00 1.00 1.00 1.00 1.00 1.00
CIPC Chandrapur Chandai 0.52 0.30 0.57 0.58 0.30 1.00
CADA Nagpur Chandpur 1.00 1.00 1.00 1.00 1.00 1.00
CADA Nagpur Chandrabhaga (Nagpur) 0.00 0.00 0.00 0.00 0.00 1.00
CIPC Chandrapur Chargaon 0.00 0.00 0.00 0.00 0.00 1.00
CADA Nagpur Chorakhmara 0.80 0.00 0.50 1.00 0.00 1.00
CADA Nagpur Chulband 0.00 0.00 0.00 0.00 0.00 1.00
CADA Nagpur Kanholibara 0.00 0.00 0.00 0.00 0.00 1.00
CADA Nagpur Kesarnala 0.64 0.72 0.74 0.72 0.59 1.00
CADA Nagpur Khairbanda 0.96 0.82 0.82 1.02 0.82 1.00
CADA Nagpur Khekranala 0.89 0.82 0.85 0.91 0.82 1.00
Normal
Surplus
162

[Benchmarking Report 2018-19]
Plan group Circle Project FY Avg LY 2017-18 TY 2018-19 Past Max Past Min State Tar
CADA Nagpur Kolar 0.67 0.53 0.55 0.71 0.53 1.00
CIPC Chandrapur Labhansarad 0.81 0.06 0.08 1.00 0.06 1.00
CADA Nagpur Makardhokada-Saiki Complex *1.31 *2.6 0.63 2.60 0.99 1.00
CADA Nagpur Managadh 0.00 0.00 0.00 0.00 0.00 1.00
CADA Nagpur Mordham 0.00 0.00 0.00 0.00 0.00 1.00
CIPC Chandrapur Pakadigundam 0.00 0.00 0.00 0.00 0.00 1.00
CIPC Chandrapur Panchadhara 0.00 0.00 1.00 0.00 0.00 1.00
CADA Nagpur Pandhrabodi *2.91 *10.54 0.54 10.54 1.00 1.00
CADA Nagpur Rengepar 0.00 0.00 0.00 0.00 0.00 1.00
CADA Nagpur Sangrampur 0.00 0.00 0.00 0.00 0.00 1.00
CADA Nagpur Sorna 1.00 1.00 1.00 1.00 1.00 1.00
CADA Nagpur Umri 0.70 0.81 0.80 0.81 0.65 1.00
CADA Nagpur Wunna 0.00 0.00 0.00 0.00 0.00 1.00
SIC Sangli Chikotra 0.00 0.00 0.00 0.00 0.00 1.00
SIC Sangli Chitri 0.00 0.00 0.00 0.00 0.00 1.00
SIC Sangli Ghatprabha (Pathakwadi) 0.00 0.00 0.00 0.00 0.00 1.00
CIPC Chandrapur Ghorazari 0.94 0.72 0.72 1.00 0.72 1.00
SIC Sangli Jangamhatti 0.00 0.00 0.00 0.00 0.00 1.00
SIC Sangli Kadavi 0.00 0.00 0.00 0.00 0.00 1.00
SIC Sangli Kasari 0.00 0.00 0.00 0.00 0.00 1.00
SIC Sangli KC &Khodshi Backwater 0.38 0.40 0.44 0.40 0.35 1.00
SIC Sangli Kumbhi 0.00 0.00 0.00 0.00 0.00 1.00
SIC Sangli Morna (Sangli) 0.00 0.00 0.00 0.00 0.00 1.00
CIPC Chandrapur Naleshwar 0.93 0.00 0.00 0.97 0.00 1.00
SIC Sangli Patgaon 0.00 0.00 0.00 0.00 0.00 1.00
TIC Thane Rajanala 0.77 1.00 0.88 1.00 0.00 1.00
TIC Thane Wandri 0.73 0.74 0.74 0.74 0.00 1.00
SIC Sangli Yeoti Masoli 0.72 0.72 0.72 0.72 0.72 1.00
Surplus
Abundant
163

[Benchmarking Report 2018-19]
Plan group Circle Project FY Avg LY 2017-18 TY 2018-19 Past Max Past Min State Tar
CADA Beed Banganga 0.33 0.58 0.29 0.58 0.00 1.00
SIC Sangli Basappawadi 0.00 0 0.00 0.00 0.00 1.00
CADA Beed Benitura 0.00 0.00 0.00 0.00 0.00 1.00
CADA Solapur Bori (Solapur) 0.00 0.00 0.00 0.00 0.00 1.00
CADA Beed Chandani 0.00 0.00 0.00 0.00 0.00 1.00
CADA Solapur Ekrukh 0.00 0.00 0.00 0.00 0.00 1.00
CADA Beed Harni 0.44 0.89 0.00 0.89 0.00 1.00
CADA Solapur Hingani (Pangaon) 0.00 0.00 0.00 0.00 0.00 1.00
CADA Beed Jakapur 0.00 0.00 0.00 0.00 0.00 1.00
CADA Solapur Jawalgaon 0.00 0.00 0.00 0.00 0.00 1.00
CADA Beed Kada 0.00 0.00 0.00 0.00 0.00 1.00
CADA Beed Kadi 0.18 0.50 0.00 0.50 0.00 1.00
CADA Beed Kambli 0.00 0.00 0.00 0.00 0.00 1.00
CADA Pune Khairy 0.00 0.00 0.00 0.00 0.00 1.00
CADA Beed Khandala 0.00 0.00 0.00 0.00 0.00 1.00
CADA Beed Khandeshwar 0.20 0.50 0.50 0.50 0.00 1.00
CADA Beed Khasapur 0.30 0.49 0.00 0.50 0.00 1.00
CADA Beed Kurnoor 0.31 0.46 0.00 0.65 0.00 1.00
CADA Solapur Mangi 0.17 0.00 0.00 0.84 0.00 1.00
CADA Beed Mehakari 0.19 0.49 0.00 0.49 0.00 1.00
PIC Pune Nher 0.19 0.38 0.00 0.38 0.00 1.00
CADA Beed Ramganga 0.00 0.00 0.00 0.00 0.00 1.00
CADA Beed Rooty 0.00 0.00 0.00 0.00 0.00 1.00
CADA Beed Sakat 0.27 0.55 0.00 0.55 0.00 1.00
SIC Sangli Siddhewadi 0.00 0.00 0.00 0.00 0.00 1.00
CADA Pune Sina 0.79 0.79 0.79 0.79 0.79 1.00
CADA Beed Talwar 0.18 0.52 0.00 0.52 0.00 1.00
CADA Beed Turori 0.00 0.00 0.00 0.00 0.00 1.00
CADA Beed Wagholi 0.00 0.00 0.00 0.00 0.00 1.00
CADA Jalgaon Agnawati 0.16 0.00 0.00 0.41 0.00 1.00
CADA Abad Ajantha Andhari 0.00 0.00 0.00 0.00 0.00 1.00
CADA Abad Anjana Palashi 0.00 0.00 0.00 0.00 0.00 1.00
CADA Jalgaon Bahula 0.37 0.00 0.00 0.37 0.00 1.00
CADA Beed Belpara 0.07 0.00 0.00 0.34 0.00 1.00
CADA Jalgaon Bhokarbari 0.00 0.00 0.00 0.00 0.00 1.00
CADA Beed Bindusara 0.00 0.00 0.00 0.00 0.00 1.00
CADA Beed Bodhegaon 0.00 0.00 0.00 0.00 0.00 1.00
CADA Jalgaon Bori 0.25 0.00 0.00 0.76 0.00 1.00
CADA Beed Borna 0.00 0.00 0.00 0.00 0.00 1.00
CADA Jalgaon Burai 0.60 0.60 0.60 0.60 0.60 1.00
UWPC Amravati Chandrabhaga (Amravati) 0.76 0.00 0.00 0.76 0.00 1.00
CADA Beed Devarjan 0.00 0.00 0.00 0.00 0.00 1.00
CADA Abad Dhamna 0.00 0.00 0.00 0.00 0.00 1.00
AIC Akola Dnyanganga 0.33 0.31 0.00 0.34 0.00 1.00
CADA Abad Gadadgad 0.64 0.64 0.64 0.64 0.00 1.00
CADA Abad Galhati *1.94 1.00 0.00 33.50 1.00 1.00
CADA Beed Gharni 0.68 0.68 0.60 0.68 0.00 1.00
CADA Abad Girja 0.00 0.00 0.00 0.00 0.00 1.00
CADA Nashik Haranbari 0.61 0.53 0.45 0.89 0.00 1.00
CADA Jalgaon Hiwara 0.26 0.00 0.00 0.69 0.00 1.00
CADA Abad Jivrekha 0.00 0.00 0.00 0.00 0.00 1.00
Indicator XIII_BMedium Projects
Water Delivery Capacity Index - B (Ratio)
Deficit
Highly Deficit
164
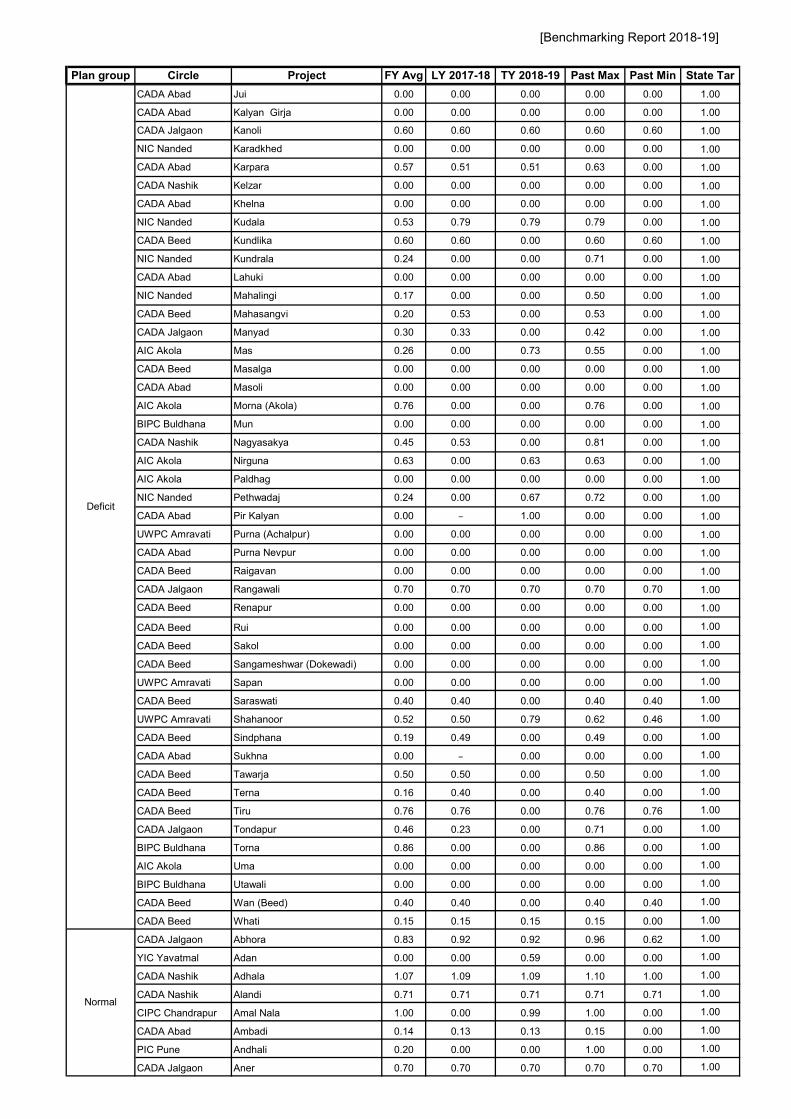
[Benchmarking Report 2018-19]
Plan group Circle Project FY Avg LY 2017-18 TY 2018-19 Past Max Past Min State Tar
CADA Abad Jui 0.00 0.00 0.00 0.00 0.00 1.00
CADA Abad Kalyan Girja 0.00 0.00 0.00 0.00 0.00 1.00
CADA Jalgaon Kanoli 0.60 0.60 0.60 0.60 0.60 1.00
NIC Nanded Karadkhed 0.00 0.00 0.00 0.00 0.00 1.00
CADA Abad Karpara 0.57 0.51 0.51 0.63 0.00 1.00
CADA Nashik Kelzar 0.00 0.00 0.00 0.00 0.00 1.00
CADA Abad Khelna 0.00 0.00 0.00 0.00 0.00 1.00
NIC Nanded Kudala 0.53 0.79 0.79 0.79 0.00 1.00
CADA Beed Kundlika 0.60 0.60 0.00 0.60 0.60 1.00
NIC Nanded Kundrala 0.24 0.00 0.00 0.71 0.00 1.00
CADA Abad Lahuki 0.00 0.00 0.00 0.00 0.00 1.00
NIC Nanded Mahalingi 0.17 0.00 0.00 0.50 0.00 1.00
CADA Beed Mahasangvi 0.20 0.53 0.00 0.53 0.00 1.00
CADA Jalgaon Manyad 0.30 0.33 0.00 0.42 0.00 1.00
AIC Akola Mas 0.26 0.00 0.73 0.55 0.00 1.00
CADA Beed Masalga 0.00 0.00 0.00 0.00 0.00 1.00
CADA Abad Masoli 0.00 0.00 0.00 0.00 0.00 1.00
AIC Akola Morna (Akola) 0.76 0.00 0.00 0.76 0.00 1.00
BIPC Buldhana Mun 0.00 0.00 0.00 0.00 0.00 1.00
CADA Nashik Nagyasakya 0.45 0.53 0.00 0.81 0.00 1.00
AIC Akola Nirguna 0.63 0.00 0.63 0.63 0.00 1.00
AIC Akola Paldhag 0.00 0.00 0.00 0.00 0.00 1.00
NIC Nanded Pethwadaj 0.24 0.00 0.67 0.72 0.00 1.00
CADA Abad Pir Kalyan 0.00 − 1.00 0.00 0.00 1.00
UWPC Amravati Purna (Achalpur) 0.00 0.00 0.00 0.00 0.00 1.00
CADA Abad Purna Nevpur 0.00 0.00 0.00 0.00 0.00 1.00
CADA Beed Raigavan 0.00 0.00 0.00 0.00 0.00 1.00
CADA Jalgaon Rangawali 0.70 0.70 0.70 0.70 0.70 1.00
CADA Beed Renapur 0.00 0.00 0.00 0.00 0.00 1.00
CADA Beed Rui 0.00 0.00 0.00 0.00 0.00 1.00
CADA Beed Sakol 0.00 0.00 0.00 0.00 0.00 1.00
CADA Beed Sangameshwar (Dokewadi) 0.00 0.00 0.00 0.00 0.00 1.00
UWPC Amravati Sapan 0.00 0.00 0.00 0.00 0.00 1.00
CADA Beed Saraswati 0.40 0.40 0.00 0.40 0.40 1.00
UWPC Amravati Shahanoor 0.52 0.50 0.79 0.62 0.46 1.00
CADA Beed Sindphana 0.19 0.49 0.00 0.49 0.00 1.00
CADA Abad Sukhna 0.00 − 0.00 0.00 0.00 1.00
CADA Beed Tawarja 0.50 0.50 0.00 0.50 0.00 1.00
CADA Beed Terna 0.16 0.40 0.00 0.40 0.00 1.00
CADA Beed Tiru 0.76 0.76 0.00 0.76 0.76 1.00
CADA Jalgaon Tondapur 0.46 0.23 0.00 0.71 0.00 1.00
BIPC Buldhana Torna 0.86 0.00 0.00 0.86 0.00 1.00
AIC Akola Uma 0.00 0.00 0.00 0.00 0.00 1.00
BIPC Buldhana Utawali 0.00 0.00 0.00 0.00 0.00 1.00
CADA Beed Wan (Beed) 0.40 0.40 0.00 0.40 0.40 1.00
CADA Beed Whati 0.15 0.15 0.15 0.15 0.00 1.00
CADA Jalgaon Abhora 0.83 0.92 0.92 0.96 0.62 1.00
YIC Yavatmal Adan 0.00 0.00 0.59 0.00 0.00 1.00
CADA Nashik Adhala 1.07 1.09 1.09 1.10 1.00 1.00
CADA Nashik Alandi 0.71 0.71 0.71 0.71 0.71 1.00
CIPC Chandrapur Amal Nala 1.00 0.00 0.99 1.00 0.00 1.00
CADA Abad Ambadi 0.14 0.13 0.13 0.15 0.00 1.00
PIC Pune Andhali 0.20 0.00 0.00 1.00 0.00 1.00
CADA Jalgaon Aner 0.70 0.70 0.70 0.70 0.70 1.00
Deficit
Normal
165

[Benchmarking Report 2018-19]
Plan group Circle Project FY Avg LY 2017-18 TY 2018-19 Past Max Past Min State Tar
CADA Nashik Bhojapur 0.00 0.00 0.00 0.00 0.00 1.00
CADA Abad Bor Dahegaon 0.00 0.00 0.00 0.00 0.00 1.00
AIC Akola Borgaon 0.34 0.00 0.70 0.68 0.00 1.00
CADA Solapur Budhihal 0.00 0.00 0.00 0.00 0.00 1.00
CIPC Chandrapur Dham 0.85 0.00 0.79 1.00 0.00 1.00
CADA Abad Dheku 0.00 0.00 0.00 0.00 0.00 1.00
SIC Sangli Dodda Nalla 0.00 0.00 0.00 0.00 0.00 1.00
NIC Nanded Dongargaon (Nanded) 0.41 0.26 0.65 0.80 0.00 1.00
CIPC Chandrapur Dongargaon (Wardha) 0.00 0.00 0.00 0.00 0.00 1.00
WIC Washim Ekburji 0.17 0.00 0.00 0.48 0.00 1.00
CADA Nashik Ghatshil Pargaon 0.13 0.00 0.00 0.65 0.00 1.00
AIC Akola Goki 0.00 0.00 0.00 0.00 0.00 1.00
CADA Jalgaon Karwand 0.60 0.60 0.60 0.60 0.60 1.00
PIC Pune Kasarsai 0.00 0.00 0.00 0.00 0.00 1.00
CADA Abad Kolhi 0.00 0.00 0.00 0.00 0.00 1.00
AIC Akola Koradi 0.00 0.00 0.95 0.00 0.00 1.00
NIC Nanded Loni 0.00 0.00 0.00 0.00 0.00 1.00
AIC Akola Lowerpus 0.00 0.00 0.00 0.00 0.00 1.00
CADA Jalgaon Malangaon 0.00 0.00 0.00 0.00 0.00 1.00
CADA Nashik Mand Ohol 0.42 0.64 0.00 0.76 0.00 1.00
PIC Pune Mhaswad 0.00 0.00 0.00 0.00 0.00 1.00
JIPC Jalgaon Mor 0.00 0.00 0.00 0.00 0.00 1.00
NIC Nanded Nagzari 0.94 0.93 0.82 0.94 0.00 1.00
CADA Abad Narangi 0.00 0.00 0.00 0.00 0.00 1.00
YIC Yavatmal Navargaon 0.00 0.00 0.00 0.00 0.00 1.00
PIC Pune Nazare 0.32 0.64 0.00 0.64 0.00 1.00
CADA Jalgaon Panzra 0.60 0.60 0.60 0.60 0.60 1.00
BIPC Buldhana Pen Takli 0.00 0.00 0.00 0.00 0.00 1.00
CIPC Chandrapur Pothra 0.78 0.75 0.75 0.82 0.75 1.00
PIC Pune Ranand 0.58 0.62 0.00 0.80 0.00 1.00
AIC Akola Saikheda 0.54 0.60 0.46 0.60 0.00 1.00
SIC Sangli Sankh 0.00 0.00 0.00 0.00 0.00 1.00
PIC Pune Shetphal 1.05 0.98 0.00 1.47 0.98 1.00
WIC Washim Sonal 0.00 0.00 0.00 0.00 0.00 1.00
PIC Pune Sonwad 0.00 0.00 0.00 0.00 0.00 1.00
CADA Jalgaon Suki 0.44 0.58 0.34 0.58 0.32 1.00
CADA Abad Tembhapuri 0.00 0.00 0.00 0.00 0.00 1.00
PIC Pune Tisangi 0.00 0.00 0.00 0.00 0.00 1.00
PIC Pune Vadiwale 0.00 0.00 0.00 0.00 0.00 1.00
CADA Pune Visapur 0.00 0.00 0.00 0.00 0.00 1.00
AIC Akola Waghadi 0.00 0.00 0.67 0.00 0.00 1.00
CADA Nagpur Bagheda 1.01 1.01 1.01 1.01 1.01 1.00
CADA Nagpur Betekar Bothali 1.00 1.00 1.00 1.00 1.00 1.00
CADA Nagpur Bodalkasa 0.87 1.00 1.00 1.00 0.35 1.00
CIPC Chandrapur Chandai 0.00 0.00 0.00 0.00 0.00 1.00
CADA Nagpur Chandpur 1.00 1.00 1.00 1.00 1.00 1.00
CADA Nagpur Chandrabhaga (Nagpur) 0.91 0.80 0.32 0.94 0.80 1.00
CIPC Chandrapur Chargaon 0.57 0.46 0.58 0.62 0.46 1.00
CADA Nagpur Chorakhmara 0.80 0.00 0.82 1.00 0.00 1.00
CADA Nagpur Chulband 0.65 0.48 0.48 0.79 0.48 1.00
CADA Nagpur Kanholibara 0.82 0.00 1.02 1.03 0.00 1.00
CADA Nagpur Kesarnala 0.00 0.00 0.00 0.00 0.00 1.00
CADA Nagpur Khairbanda 1.00 0.89 0.89 1.11 0.89 1.00
CADA Nagpur Khekranala 0.00 0.00 0.00 0.00 0.00 1.00
Normal
Surplus
166

[Benchmarking Report 2018-19]
Plan group Circle Project FY Avg LY 2017-18 TY 2018-19 Past Max Past Min State Tar
CADA Nagpur Kolar 0.00 0.00 0.00 0.00 0.00 1.00
CIPC Chandrapur Labhansarad 0.00 0.00 0.00 0.00 0.00 1.00
CADA Nagpur Makardhokada-Saiki Complex 0.00 0.00 0.00 0.00 0.00 1.00
CADA Nagpur Managadh 0.76 0.77 0.77 0.84 0.70 1.00
CADA Nagpur Mordham 0.72 0.29 0.00 0.83 0.29 1.00
CIPC Chandrapur Pakadigundam 1.00 0.00 0.00 1.00 0.00 1.00
CIPC Chandrapur Panchadhara 1.00 1.00 0.00 1.00 1.00 1.00
CADA Nagpur Pandhrabodi 2.27 7.46 0.17 7.46 0.99 1.00
CADA Nagpur Rengepar 0.94 1.00 1.00 1.00 0.88 1.00
CADA Nagpur Sangrampur 0.90 1.00 1.00 1.00 0.78 1.00
CADA Nagpur Sorna 1.00 1.00 1.00 1.00 1.00 1.00
CADA Nagpur Umri 0.00 0.00 0.00 0.00 0.00 1.00
CADA Nagpur Wunna 0.56 0.37 0.67 0.76 0.37 1.00
SIC Sangli Chikotra 0.00 0.00 0.00 0.00 0.00 1.00
SIC Sangli Chitri 0.00 0.00 0.00 0.00 0.00 1.00
SIC Sangli Ghatprabha (Pathakwadi) 0.00 0.00 0.00 0.00 0.00 1.00
CIPC Chandrapur Ghorazari 0.00 0.00 0.00 0.00 0.00 1.00
SIC Sangli Jangamhatti 0.00 0.00 0.00 0.00 0.00 1.00
SIC Sangli Kadavi 0.00 0.00 0.00 0.00 0.00 1.00
SIC Sangli Kasari 0.00 0.00 0.00 0.00 0.00 1.00
SIC Sangli KC &Khodshi Backwater 0.00 0.00 0.00 0.00 0.00 1.00
SIC Sangli Kumbhi 0.00 0.00 0.00 0.00 0.00 1.00
SIC Sangli Morna (Sangli) 0.00 0.00 0.00 0.00 0.00 1.00
CIPC Chandrapur Naleshwar 0.72 0.89 0.89 0.89 0.68 1.00
SIC Sangli Patgaon 0.00 0.00 0.00 0.00 0.00 1.00
TIC Thane Rajanala 0.32 1.00 0.00 1.00 0.00 1.00
TIC Thane Wandri 0.71 0.74 0.74 0.74 0.00 1.00
SIC Sangli Yeoti Masoli 0.00 0.00 0.00 0.00 0.00 1.00
Surplus
Abundant
167

[Benchmarking Report 2018-19]
Plan group Circle Project FY Avg LY 2017-18 TY 2018-19 Past Max Past Min State Tar
CADA Beed Banganga 1.26 1.85 0.00 1.85 0.00 1.00
SIC Sangli Basappawadi 0.00 0 0.00 0.00 0.00 1.00
CADA Beed Benitura 1.00 1.00 1.00 1.00 1.00 1.00
CADA Solapur Bori (Solapur) 0.00 0.00 0.00 0.00 0.00 1.00
CADA Beed Chandani 1.45 0.57 0.00 0.60 0.00 1.00
CADA Solapur Ekrukh 0.00 0.00 0.00 0.00 0.00 1.00
CADA Beed Harni 1.50 1.44 1.16 1.83 1.44 1.00
CADA Solapur Hingani (Pangaon) 0.27 0.00 0.00 0.45 0.00 1.00
CADA Beed Jakapur 0.00 0.00 0.00 0.00 0.00 1.00
CADA Solapur Jawalgaon 0.15 0.00 0.00 0.37 0.00 1.00
CADA Beed Kada 0.00 0.00 0.00 0.00 0.00 1.00
CADA Beed Kadi 0.00 0.00 0.00 0.00 0.00 1.00
CADA Beed Kambli 1.64 0.66 0.66 0.66 0.00 1.00
CADA Pune Khairy 0.00 0.00 0.00 0.00 0.00 1.00
CADA Beed Khandala 0.31 0.36 0.21 0.61 0.22 1.00
CADA Beed Khandeshwar 0.58 0.24 0.00 0.24 0.00 1.00
CADA Beed Khasapur 0.00 0.00 0.00 0.00 0.00 1.00
CADA Beed Kurnoor 0.25 0.25 0.18 0.25 0.25 1.00
CADA Solapur Mangi 0.51 0.51 0.51 0.51 0.51 1.00
CADA Beed Mehakari 0.00 0.00 0.00 0.00 0.00 1.00
PIC Pune Nher 0.00 0.00 0.00 0.00 0.00 1.00
CADA Beed Ramganga 2.08 1.64 0.00 1.97 0.00 1.00
CADA Beed Rooty 0.00 0.00 0.00 0.00 0.00 1.00
CADA Beed Sakat 1.99 1.00 0.00 1.00 0.00 1.00
SIC Sangli Siddhewadi 0.00 0.00 0.00 0.00 0.00 1.00
CADA Pune Sina 0.00 0.00 0.00 0.00 0.00 1.00
CADA Beed Talwar 0.00 0.00 0.00 0.00 0.00 1.00
CADA Beed Turori 0.00 0.00 0.00 0.00 0.00 1.00
CADA Beed Wagholi 0.30 0.24 0.00 0.39 0.24 1.00
CADA Jalgaon Agnawati 0.00 0.00 0.00 0.00 0.00 1.00
CADA Abad Ajantha Andhari 0.00 0.00 0.00 0.00 0.00 1.00
CADA Abad Anjana Palashi 0.00 0.00 0.00 0.00 0.00 1.00
CADA Jalgaon Bahula 0.00 0.00 0.00 0.00 0.00 1.00
CADA Beed Belpara 0.00 0.00 0.00 0.00 0.00 1.00
CADA Jalgaon Bhokarbari 0.00 0.00 0.00 0.00 0.00 1.00
CADA Beed Bindusara 0.00 0.00 0.00 0.00 0.00 1.00
CADA Beed Bodhegaon 0.00 0.00 0.00 0.00 0.00 1.00
CADA Jalgaon Bori 0.00 0.00 0.00 0.00 0.00 1.00
CADA Beed Borna 0.00 0.00 0.00 0.00 0.00 1.00
CADA Jalgaon Burai 0.10 0.16 0.28 0.18 0.06 1.00
UWPC Amravati Chandrabhaga (Amravati) 0.21 0.00 1.04 1.04 0.00 1.00
CADA Beed Devarjan 0.00 0.00 0.00 0.00 0.00 1.00
CADA Abad Dhamna 0.00 0.00 0.00 0.00 0.00 1.00
AIC Akola Dnyanganga 0.23 1.00 1.00 1.00 0.00 1.00
CADA Abad Gadadgad 0.00 0.00 0.00 0.00 0.00 1.00
CADA Abad Galhati 1.52 1.44 0.00 1.61 1.44 1.00
CADA Beed Gharni 0.05 0.00 0.20 0.20 0.00 1.00
CADA Abad Girja 0.00 0.00 0.00 0.00 0.00 1.00
CADA Nashik Haranbari 0.00 0.00 0.00 0.00 0.00 1.00
CADA Jalgaon Hiwara 0.00 0.00 0.00 0.00 0.00 1.00
CADA Abad Jivrekha 0.00 0.00 0.00 0.00 0.00 1.00
Indicator XIVMedium Projects
Participatory Irrigation Management PIM Index (Ratio)
Deficit
Highly Deficit
168

[Benchmarking Report 2018-19]
Plan group Circle Project FY Avg LY 2017-18 TY 2018-19 Past Max Past Min State Tar
CADA Abad Jui 0.00 0.00 0.00 0.00 0.00 1.00
CADA Abad Kalyan Girja 0.00 0.00 0.00 0.00 0.00 1.00
CADA Jalgaon Kanoli 1.16 0.00 0.00 1.17 0.00 1.00
NIC Nanded Karadkhed 0.00 0.00 15.69 0.00 0.00 1.00
CADA Abad Karpara 1.12 1.12 1.12 1.12 0.00 1.00
CADA Nashik Kelzar 0.00 0.00 0.00 0.00 0.00 1.00
CADA Abad Khelna 0.00 0.00 0.00 0.00 0.00 1.00
NIC Nanded Kudala 0.00 0.00 0.00 0.00 0.00 1.00
CADA Beed Kundlika 0.00 0.00 0.00 0.00 0.00 1.00
NIC Nanded Kundrala *1.97 *15.41 *23 15.41 0.00 1.00
CADA Abad Lahuki 0.00 0.00 0.00 0.00 0.00 1.00
NIC Nanded Mahalingi 0.00 0.00 0.00 0.00 0.00 1.00
CADA Beed Mahasangvi 0.15 0.00 0.00 0.25 0.00 1.00
CADA Jalgaon Manyad 0.00 0.00 0.00 0.00 0.00 1.00
AIC Akola Mas 0.00 0.00 0.00 0.00 0.00 1.00
CADA Beed Masalga 0.00 0.00 0.00 0.00 0.00 1.00
CADA Abad Masoli 0.00 0.00 0.00 0.00 0.00 1.00
AIC Akola Morna (Akola) 0.08 0.00 0.37 0.13 0.00 1.00
BIPC Buldhana Mun 0.02 0.05 0.51 0.05 0.00 1.00
CADA Nashik Nagyasakya 0.00 0.00 0.00 0.00 0.00 1.00
AIC Akola Nirguna 0.13 0.00 0.44 0.36 0.00 1.00
AIC Akola Paldhag 0.42 0.61 0.61 0.76 0.00 1.00
NIC Nanded Pethwadaj *2.37 *8.64 *3.43 8.64 0.00 1.00
CADA Abad Pir Kalyan 0.00 − 0.00 0.00 0.00 1.00
UWPC Amravati Purna (Achalpur) 0.00 0.00 0.00 0.00 0.00 1.00
CADA Abad Purna Nevpur 0.00 0.00 0.00 0.00 0.00 1.00
CADA Beed Raigavan 0.00 0.00 0.00 0.00 0.00 1.00
CADA Jalgaon Rangawali 1.33 1.54 1.46 1.56 1.09 1.00
CADA Beed Renapur 0.00 0.00 0.00 0.00 0.00 1.00
CADA Beed Rui 0.00 0.00 0.00 0.00 0.00 1.00
CADA Beed Sakol 0.00 0.00 0.00 0.00 0.00 1.00
CADA Beed Sangameshwar (Dokewadi) 0.23 0.20 0.00 0.31 0.20 1.00
UWPC Amravati Sapan 0.00 0.00 0.00 0.00 0.00 1.00
CADA Beed Saraswati 0.00 0.00 0.00 0.00 0.00 1.00
UWPC Amravati Shahanoor 0.05 0.13 0.13 0.13 0.00 1.00
CADA Beed Sindphana 0.00 0.00 0.00 0.00 0.00 1.00
CADA Abad Sukhna 0.00 − 0.00 0.00 0.00 1.00
CADA Beed Tawarja 0.00 0.00 0.00 0.00 0.00 1.00
CADA Beed Terna 0.20 0.10 0.00 0.41 0.00 1.00
CADA Beed Tiru 0.75 0.75 0.36 0.75 0.75 1.00
CADA Jalgaon Tondapur 0.00 0.00 0.00 0.00 0.00 1.00
BIPC Buldhana Torna 0.70 1.83 0.43 1.83 0.00 1.00
AIC Akola Uma 0.05 0.05 0.12 0.12 0.00 1.00
BIPC Buldhana Utawali 0.00 0.00 0.86 0.00 0.00 1.00
CADA Beed Wan (Beed) 0.00 0.00 0.00 0.00 0.00 1.00
CADA Beed Whati 0.00 0.00 0.00 0.00 0.00 1.00
CADA Jalgaon Abhora 0.00 0.00 0.00 0.00 0.00 1.00
YIC Yavatmal Adan 0.00 0.00 0.00 0.00 0.00 1.00
CADA Nashik Adhala 0.00 0.00 0.00 0.00 0.00 1.00
CADA Nashik Alandi 0.00 0.00 0.00 0.00 0.00 1.00
CIPC Chandrapur Amal Nala 0.00 0.00 0.00 0.00 0.00 1.00
CADA Abad Ambadi 0.00 0.00 0.00 0.00 0.00 1.00
PIC Pune Andhali 0.00 0.00 0.00 0.00 0.00 1.00
CADA Jalgaon Aner 1.16 1.70 1.77 1.70 0.97 1.00
Deficit
Normal
169

[Benchmarking Report 2018-19]
Plan group Circle Project FY Avg LY 2017-18 TY 2018-19 Past Max Past Min State Tar
CADA Nashik Bhojapur 0.00 0.00 0.00 0.00 0.00 1.00
CADA Abad Bor Dahegaon 0.00 0.00 0.00 0.00 0.00 1.00
AIC Akola Borgaon 0.00 0.00 0.00 0.00 0.00 1.00
CADA Solapur Budhihal 0.00 0.00 0.00 0.00 0.00 1.00
CIPC Chandrapur Dham 0.00 0.00 0.00 0.00 0.00 1.00
CADA Abad Dheku 0.00 0.00 0.00 0.00 0.00 1.00
SIC Sangli Dodda Nalla 0.00 0.00 0.00 0.00 0.00 1.00
NIC Nanded Dongargaon (Nanded) 0.26 0.00 0.00 0.00 0.00 1.00
CIPC Chandrapur Dongargaon (Wardha) 1.00 1.00 1.00 1.00 1.00 1.00
WIC Washim Ekburji 0.00 0.00 0.00 0.00 0.00 1.00
CADA Nashik Ghatshil Pargaon *4.75 *5.47 0.00 5.47 0.00 1.00
AIC Akola Goki 0.00 0.00 0.00 0.00 0.00 1.00
CADA Jalgaon Karwand 1.15 1.27 2.12 1.28 0.93 1.00
PIC Pune Kasarsai 0.00 0.00 0.00 0.00 0.00 1.00
CADA Abad Kolhi 0.00 0.00 0.00 0.00 0.00 1.00
AIC Akola Koradi 0.86 1.27 1.27 1.27 0.00 1.00
NIC Nanded Loni 0.00 0.00 0.00 0.00 0.00 1.00
AIC Akola Lowerpus 0.00 0.00 0.00 0.00 0.00 1.00
CADA Jalgaon Malangaon *1.48 *2.91 *2.64 3.75 0.93 1.00
CADA Nashik Mand Ohol 0.00 0.00 0.00 0.00 0.00 1.00
PIC Pune Mhaswad 0.00 0.00 0.00 0.00 0.00 1.00
JIPC Jalgaon Mor 0.00 0.00 0.00 0.00 0.00 1.00
NIC Nanded Nagzari 0.00 0.00 0.00 0.00 0.00 1.00
CADA Abad Narangi 0.00 0.00 0.00 0.00 0.00 1.00
YIC Yavatmal Navargaon 0.00 0.00 0.00 0.00 0.00 1.00
PIC Pune Nazare 0.00 0.00 0.00 0.00 0.00 1.00
CADA Jalgaon Panzra *1.5 *1.76 *2.14 1.76 0.00 1.00
BIPC Buldhana Pen Takli 0.00 0.00 0.68 0.00 0.00 1.00
CIPC Chandrapur Pothra 0.00 0.00 0.00 0.00 0.00 1.00
PIC Pune Ranand 0.00 0.00 0.00 0.00 0.00 1.00
AIC Akola Saikheda 0.00 0.00 0.00 0.00 0.00 1.00
SIC Sangli Sankh 0.00 0.00 0.00 0.00 0.00 1.00
PIC Pune Shetphal 0.00 0.00 0.00 0.00 0.00 1.00
WIC Washim Sonal 0.13 1.08 0.00 1.08 0.08 1.00
PIC Pune Sonwad 0.00 0.00 1.14 0.00 0.00 1.00
CADA Jalgaon Suki 0.00 0.00 0.00 0.00 0.00 1.00
CADA Abad Tembhapuri 0.00 0.00 0.00 0.00 0.00 1.00
PIC Pune Tisangi 0.00 0.00 0.00 0.00 0.00 1.00
PIC Pune Vadiwale 0.00 0.00 0.00 0.00 0.00 1.00
CADA Pune Visapur 0.00 0.00 0.00 0.00 0.00 1.00
AIC Akola Waghadi 0.00 0.00 0.00 0.00 0.00 1.00
CADA Nagpur Bagheda 0.37 0.35 0.42 0.49 0.35 1.00
CADA Nagpur Betekar Bothali 0.00 0.00 0.00 0.00 0.00 1.00
CADA Nagpur Bodalkasa 0.00 0.00 0.00 0.00 0.00 1.00
CIPC Chandrapur Chandai 0.00 0.00 0.00 0.00 0.00 1.00
CADA Nagpur Chandpur 0.26 0.29 0.24 0.30 0.21 1.00
CADA Nagpur Chandrabhaga (Nagpur) 0.00 0.00 0.00 0.00 0.00 1.00
CIPC Chandrapur Chargaon 0.00 0.00 0.00 0.00 0.00 1.00
CADA Nagpur Chorakhmara 0.00 0.00 0.00 0.00 0.00 1.00
CADA Nagpur Chulband 0.00 0.00 0.00 0.00 0.00 1.00
CADA Nagpur Kanholibara 1.57 1.51 1.17 1.93 1.45 1.00
CADA Nagpur Kesarnala 0.00 0.00 0.00 0.00 0.00 1.00
CADA Nagpur Khairbanda 0.00 0.00 0.00 0.00 0.00 1.00
CADA Nagpur Khekranala 0.00 0.00 0.00 0.00 0.00 1.00
Normal
Surplus
170

[Benchmarking Report 2018-19]
Plan group Circle Project FY Avg LY 2017-18 TY 2018-19 Past Max Past Min State Tar
CADA Nagpur Kolar 0.00 0.00 0.00 0.00 0.00 1.00
CIPC Chandrapur Labhansarad 0.00 0.00 0.00 0.00 0.00 1.00
CADA Nagpur Makardhokada-Saiki Complex 0.00 0.00 0.00 0.00 0.00 1.00
CADA Nagpur Managadh 0.00 0.00 0.00 0.00 0.00 1.00
CADA Nagpur Mordham 0.00 0.00 0.00 0.00 0.00 1.00
CIPC Chandrapur Pakadigundam 0.00 0.00 0.00 0.00 0.00 1.00
CIPC Chandrapur Panchadhara 0.00 0.00 0.00 0.00 0.00 1.00
CADA Nagpur Pandhrabodi 0.00 0.00 0.00 0.00 0.00 1.00
CADA Nagpur Rengepar 1.44 1.19 0.95 1.96 1.19 1.00
CADA Nagpur Sangrampur 0.67 1.12 1.72 1.12 0.00 1.00
CADA Nagpur Sorna 0.00 0.00 0.00 0.00 0.00 1.00
CADA Nagpur Umri 0.00 0.00 0.00 0.00 0.00 1.00
CADA Nagpur Wunna 0.00 0.00 0.00 0.00 0.00 1.00
SIC Sangli Chikotra 0.00 0.00 0.00 0.00 0.00 1.00
SIC Sangli Chitri 0.00 0.00 0.00 0.00 0.00 1.00
SIC Sangli Ghatprabha (Pathakwadi) 0.00 0.00 0.00 0.00 0.00 1.00
CIPC Chandrapur Ghorazari 0.16 0.62 0.00 0.62 0.00 1.00
SIC Sangli Jangamhatti 0.00 0.00 0.00 0.00 0.00 1.00
SIC Sangli Kadavi 0.00 0.00 0.00 0.00 0.00 1.00
SIC Sangli Kasari 0.00 0.00 0.00 0.00 0.00 1.00
SIC Sangli KC &Khodshi Backwater 0.00 0.00 0.00 0.00 0.00 1.00
SIC Sangli Kumbhi 0.00 0.00 0.00 0.00 0.00 1.00
SIC Sangli Morna (Sangli) 0.00 0.00 0.00 0.00 0.00 1.00
CIPC Chandrapur Naleshwar 0.00 0.00 0.37 0.00 0.00 1.00
SIC Sangli Patgaon 0.00 0.00 0.00 0.00 0.00 1.00
TIC Thane Rajanala 0.00 0.00 0.00 0.00 0.00 1.00
TIC Thane Wandri 0.00 0.00 0.00 0.00 0.00 1.00
SIC Sangli Yeoti Masoli 0.00 0.00 0.00 0.00 0.00 1.00
Surplus
Abundant
171

Publication: February 2021
Copyright@2020 CAWIMS A’BAD. All Rights Reserved
Office: Chief Auditor, Water and Irrigation, Maharashtra State, Aurangabad WALMI Campus, Kanchanwadi, Aurangabad Ph. No: (0240)2379153
Email Id: [email protected] [email protected]