Tools for big data analysis - IS MUNI
80
Masaryk University Faculty of Informatics Tools for big data analysis Master’s Thesis Bc. Martin Macák Brno, Spring 2018
-
Upload
khangminh22 -
Category
Documents
-
view
2 -
download
0
Transcript of Tools for big data analysis - IS MUNI
Masaryk UniversityFaculty of Informatics
Tools for big data analysis
Master’s Thesis
Bc. Martin Macák
Brno, Spring 2018


Replace this page with a copy of the official signed thesis assignment and acopy of the Statement of an Author.

Declaration
Hereby I declare that this paper is my original authorial work, whichI have worked out on my own. All sources, references, and literatureused or excerpted during elaboration of this work are properly citedand listed in complete reference to the due source.
Bc. Martin Macák
Advisor: doc. Ing. RNDr. Barbora Bühnová, Ph.D.
i

Acknowledgements
I would like to thank my supervisor, doc. Ing. RNDr. Barbora Bühnová,Ph.D. for offering me to work on this thesis. Her support, guidance,and patience greatly helped me to finish it. I would also like to thankher for introducing me to the great team of people in the CERIT-SCBig Data project. From this team, I would like to especially thankRNDr. Tomáš Rebok, Ph.D., who had many times found time for me,to provide me useful advice, and Bruno Rossi, PhD, who had givenme the opportunity to present the results of this thesis in LaSArISseminar.
I would also like to express my gratitude for the support of myfamily, my parents, Jana and Alexander, and the best sister, Nina.
My thanks also belong to my supportive friends, mainly Bc. TomášMilo, Bc. Peter Kelemen, Bc. Jaroslav Davídek, Bc. Štefan Bojnák, andMgr. Ondřej Gasior.
Lastly, I would like to thank my girlfriend, Bc. Iveta Vidová for herpatience and support.
iii

Abstract
This thesis focuses on the design of a Big Data tool selection diagram,which can help to choose the right open source tools for a given BigData problem. The thesis includes the tool classification into compo-nents and proposes the Big Data tool architecture for a general BigData problem, which illustrates the communication between thosecomponents. This thesis has chosen some of those components and hasresearched them in more detail, creating an overview of the actual BigData tools. Based on this overview, the initial version of the Big Datatool selection diagram, which contains storage and processing tools,is created. Then the thesis proposes the process of diagram validationand provides a set of tests as examples. Those tests are implementedby comparing the relevant results of the solution using a tool that ischosen by a diagram and the solution using another tool.
iv
Keywords
Big Data, Big Data tools, Big Data architecture, Big Data storage, BigData processing
v

Contents
1 Introduction 1
2 Big Data 32.1 Characteristics . . . . . . . . . . . . . . . . . . . . . . . . 32.2 Big Data system requirements . . . . . . . . . . . . . . . . 4
2.2.1 Scalability . . . . . . . . . . . . . . . . . . . . . . 42.2.2 Distribution models . . . . . . . . . . . . . . . . 42.2.3 Consistency . . . . . . . . . . . . . . . . . . . . . 6
3 State of the Art in Big Data Tools 7
4 Big Data Tools Architecture 94.1 Related work . . . . . . . . . . . . . . . . . . . . . . . . . . 94.2 Classification . . . . . . . . . . . . . . . . . . . . . . . . . 94.3 Proposed architecture . . . . . . . . . . . . . . . . . . . . . 10
5 Big Data Storage Systems 135.1 Relational database management systems . . . . . . . . . . 13
5.1.1 Data warehouse databases . . . . . . . . . . . . . 145.1.2 NewSQL database management systems . . . . 155.1.3 Summary . . . . . . . . . . . . . . . . . . . . . . 17
5.2 NoSQL database management systems . . . . . . . . . . . . 175.2.1 Key-value stores . . . . . . . . . . . . . . . . . . 185.2.2 Document stores . . . . . . . . . . . . . . . . . . 215.2.3 Column-family stores . . . . . . . . . . . . . . . 255.2.4 Graph databases . . . . . . . . . . . . . . . . . . 265.2.5 Multi-model databases . . . . . . . . . . . . . . . 295.2.6 Summary . . . . . . . . . . . . . . . . . . . . . . 31
5.3 Time-series database management systems . . . . . . . . . . 325.3.1 InfluxDB . . . . . . . . . . . . . . . . . . . . . . . 335.3.2 Riak TS . . . . . . . . . . . . . . . . . . . . . . . . 335.3.3 OpenTSDB . . . . . . . . . . . . . . . . . . . . . . 345.3.4 Druid . . . . . . . . . . . . . . . . . . . . . . . . . 345.3.5 SiriDB . . . . . . . . . . . . . . . . . . . . . . . . 355.3.6 TimescaleDB . . . . . . . . . . . . . . . . . . . . 355.3.7 Prometheus . . . . . . . . . . . . . . . . . . . . . 35
vii
5.3.8 KairosDB . . . . . . . . . . . . . . . . . . . . . . 365.3.9 Summary . . . . . . . . . . . . . . . . . . . . . . 36
5.4 Distributed file systems . . . . . . . . . . . . . . . . . . . . 375.4.1 Hadoop Distributed File System . . . . . . . . . 385.4.2 SeaweedFS . . . . . . . . . . . . . . . . . . . . . . 385.4.3 Perkeep . . . . . . . . . . . . . . . . . . . . . . . 395.4.4 Summary . . . . . . . . . . . . . . . . . . . . . . 39
6 Big Data Processing Systems 416.1 Batch processing systems . . . . . . . . . . . . . . . . . . . 41
6.1.1 Apache Hadoop MapReduce . . . . . . . . . . . 416.1.2 Alternatives . . . . . . . . . . . . . . . . . . . . . 43
6.2 Stream processing systems . . . . . . . . . . . . . . . . . . 436.2.1 Apache Storm . . . . . . . . . . . . . . . . . . . . 436.2.2 Alternatives . . . . . . . . . . . . . . . . . . . . . 44
6.3 Graph processing systems . . . . . . . . . . . . . . . . . . . 446.3.1 Apache Giraph . . . . . . . . . . . . . . . . . . . 456.3.2 Alternatives . . . . . . . . . . . . . . . . . . . . . 46
6.4 High-level representation tools . . . . . . . . . . . . . . . . 466.4.1 Apache Hive . . . . . . . . . . . . . . . . . . . . 466.4.2 Apache Pig . . . . . . . . . . . . . . . . . . . . . 476.4.3 Summingbird . . . . . . . . . . . . . . . . . . . . 476.4.4 Alternatives . . . . . . . . . . . . . . . . . . . . . 48
6.5 General-purpose processing systems . . . . . . . . . . . . . 496.5.1 Apache Spark . . . . . . . . . . . . . . . . . . . . 496.5.2 Apache Flink . . . . . . . . . . . . . . . . . . . . 506.5.3 Alternatives . . . . . . . . . . . . . . . . . . . . . 51
6.6 Summary . . . . . . . . . . . . . . . . . . . . . . . . . . . 51
7 Tool Selection Diagram 537.1 Validation . . . . . . . . . . . . . . . . . . . . . . . . . . . 55
8 Attachments 57
9 Conclusion 599.1 Future directions . . . . . . . . . . . . . . . . . . . . . . . 59
Bibliography 61
viii

List of Tables
5.1 Basic summary of relational database managementsystems 17
5.2 Basic summary of NoSQL database managementsystems 32
5.3 Basic summary of time-series database managementsystems 37
5.4 Basic summary of distributed file systems 396.1 Basic summary of processing systems 527.1 Results of the first test 567.2 Results of the second test 567.3 Results of the extended second test 56
ix

1 Introduction
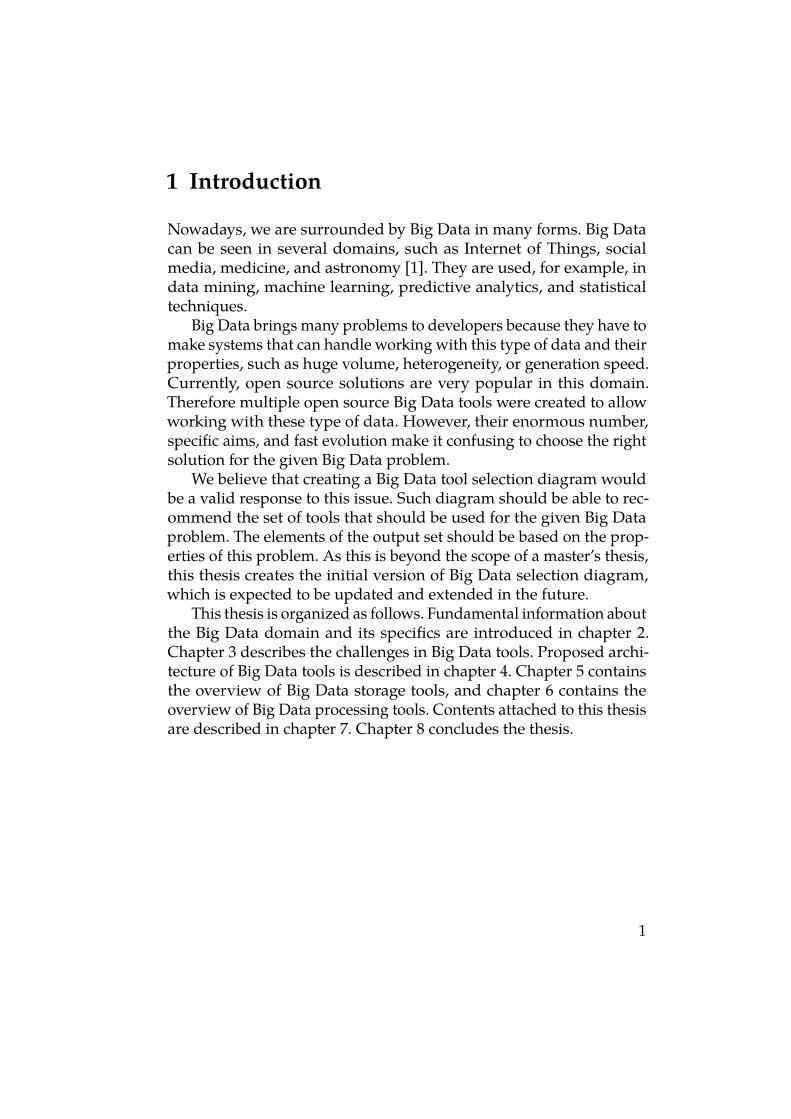
Nowadays, we are surrounded by Big Data in many forms. Big Datacan be seen in several domains, such as Internet of Things, socialmedia, medicine, and astronomy [1]. They are used, for example, indata mining, machine learning, predictive analytics, and statisticaltechniques.
Big Data brings many problems to developers because they have tomake systems that can handle working with this type of data and theirproperties, such as huge volume, heterogeneity, or generation speed.Currently, open source solutions are very popular in this domain.Therefore multiple open source Big Data tools were created to allowworking with these type of data. However, their enormous number,specific aims, and fast evolution make it confusing to choose the rightsolution for the given Big Data problem.
We believe that creating a Big Data tool selection diagram wouldbe a valid response to this issue. Such diagram should be able to rec-ommend the set of tools that should be used for the given Big Dataproblem. The elements of the output set should be based on the prop-erties of this problem. As this is beyond the scope of a master’s thesis,this thesis creates the initial version of Big Data selection diagram,which is expected to be updated and extended in the future.
This thesis is organized as follows. Fundamental information aboutthe Big Data domain and its specifics are introduced in chapter 2.Chapter 3 describes the challenges in Big Data tools. Proposed archi-tecture of Big Data tools is described in chapter 4. Chapter 5 containsthe overview of Big Data storage tools, and chapter 6 contains theoverview of Big Data processing tools. Contents attached to this thesisare described in chapter 7. Chapter 8 concludes the thesis.
1

2 Big Data
This chapter contains the fundamental information about the BigData domain. It should give the reader a necessary knowledge tounderstand the following chapters.
2.1 Characteristics
Big Data are typically defined by five properties, called as "5 Vs of BigData" [2].
∙ Volume: Used data have such a large size that they cannot fitinto a single server, or the performance of analysis on thosedata on a single server is low. The relevant factor is also a datagrowth in time. Therefore, the systems that want to work withBig Data has to be scalable.
∙ Variety: Structure of the used data can be heterogeneous. Datacan be classified by their structure into these three categories:structured data with a defined structure, for example, CSV files,and spreadsheets, semi-structured data with a flexible structure,for example, JSON, and XML, and unstructured data without astructure, for example, images, and videos [3].
∙ Velocity: Data sources generate real-time data at a fast rate.For example, on Facebook, 136,000 photos are uploaded everyminute [4]. So the system has to be able to handle lots of dataat a reasonable speed.
∙ Veracity: Some data may have worse quality, and they cannotbe considered trustworthy. So technologies should handle thiskind of data too.
∙ Value: This property refers to the ability to extract a value fromthe data. Therefore systems have to provide useful benefitsfrom the acquired data.
Many other definitions emerged, including five parts definition [5],7 Vs [6], 10Vs [7, 8], and 42 Vs [9] definition. However, the 5 Vs defini-tion is still considered as a popular standard.
3
2. Big Data
2.2 Big Data system requirements
2.2.1 Scalability
Scalability is the ability of the system to manage increased demands.This ability is very relevant, because of the Big Data volume. The scal-ability can be categorized into the vertical or horizontal scaling [10].
Vertical scaling involves adding more processors, memory or fasterhardware, typically, into a single server. Most of the software canthen benefit from it. However, vertical scaling requires high financialinvestments, and there is a certain limit of this scaling.
Horizontal scaling means adding more servers into a group ofcooperating servers, called a cluster. These servers may be cheap com-modity machines, so the financial investment is relatively less. Whenthis method is used, the system can scale as much as needed. However,it brings many complexities that software has to handle, which reflectson the limited number of software that can run on these systems.
2.2.2 Distribution models
Distribution model may bring many essential benefits when workingwith Big Data. The system can store more data, handle more read orwrite operations per time, and provide availability even when thereare network problems or a server crashes. However, distribution bringscomplexity to the system, so is not recommended when those benefitsare not needed [11].
Although many Big Data tools are designed to run on a cluster,there is a possibility that for some use cases distribution is not neededand a single server is sufficient. If it is not, then there are three options:use sharding, replication, or combine them and use both.
Sharding is a technique that puts different parts of the data ontodifferent servers. This technique improves read and write effectiveness,therefore is very valuable for system performance. Theoretically, if, forexample, five servers are used, and the data are appropriately sharded,each server has to handle 20% of the total read and write operationsbecause in the ideal case, each user only has to communicate with oneserver.
4
2. Big Data
However, this ideal case cannot be simply achieved. Data that arecommonly accessed together should be stored together on one server.Also, there should be the effort to keep the same percentual handlingof operations for each server. It does not necessarily mean to distributethe data evenly, because there may be other factors that can affect it,for example, physical location or some domain specific rules.
Replication is a technique that copies the data over multiple servers.When a server crashes, the data is lost without this method. Replicationcan have two forms: master-slave and peer-to-peer. Both bring theproblems with consistency of data, which will be presented in 2.2.3.
1. Master-slave replication declares one server as the master. Thisserver is responsible for any updates of the data. Its data isreplicated to the other servers, which are called slaves. Slavescannot handle write requests, but they can be used for process-ing read requests. If the data in the master changes, then slaveshave to be updated. With this technique, the cluster can handlemore read requests. However, write requests are still handledby a single server.
This technique provides availability for read operations. Whenthere is a problem with a slave, the user can read from anotherone. Even when there is a problem with a master, the user canstill read the data. However, the crash of a master disables thehandling of write operations, so a user has to wait until themaster is restored or a new master is appointed. Because ofthat, the master is considered a single point of failure.
2. Peer-to-peer replication solves the problem of master-slave repli-cation by not having a single point of failure. All servers in acluster are equal, they all handle write and read operations.After a write operation on one server, others are trying to syn-chronize. When some server crashes, a user can still access hisdata from another one.
Sharding and replication can be used together. Sharding increasesthe performance, while replication adds reliability and availability.
5
2. Big Data
2.2.3 Consistency
When the replication is used, it provides many benefits. On the otherhand, it brings problems with consistency. When two users updatethe same data at the same time, each on a different server, they createa write-write conflict [12]. This action can happen only in peer-to-peer replication because master-slave has only one server that handleswrite operations. Pessimistic or optimistic approaches can solve thisproblem.
There is also a possibility of read-write conflict, where the user’swrite was still not synchronized to all servers, and another user readsdata from one of those servers [12]. This inconsistency may last a shorttime, but eventually, all servers will be updated.
Inconsistencies above can be solved by two methods: strong con-sistency and eventual consistency. The choosing, whether the systemshould support strong consistency or eventual consistency dependson a specific use case. The strong consistency is not always desired. Itis because Brewer’s CAP theorem [13] declares that the stronger theconsistency, the smaller the availability of the system. It states that anynetworked shared-data system can have at most two of the followingproperties:
∙ consistency
∙ availability
∙ tolerance of network partitions
This theorem was formally proven two years later [14]. In Brewer’s laterpaper [15] was suggested that the tradeoff between consistency andavailability has to be considered only when the network is partitioned.Generally, the tolerance of network partitions cannot be forfeited inwide-area systems. Therefore, in the majority of Big Data solutions,designers have to balance between the consistency and availability.For example, when storing financial data, strong consistency shouldbe chosen. When storing statuses of some social network, eventualconsistency is sufficient.
6
3 State of the Art in Big Data Tools
This chapter contains challenges and problems of Big Data open sourcetools that were identified by the process of research in this domain.
Each Big Data tool focuses only on a specific field of a Big Datausage. For example, Kibana aims at visualization, and HDFS targetsstorage. Although some tools focus on multiple fields, no such toolaims at them all. Therefore, the solution of a specific Big Data problemmay consist of a set of tools that have to be used. So the solutionimplementer has to have practical experience with all of the chosentools.
In each field, tools can be specialized to some specific use cases,and for each use case, there can be several different approaches ofrealization. This fact results in another issue: the enormous numberof Big Data tools. Each of these tools has some advantages and someweaknesses [16], so the choice of the right tool in a specific field is anon-trivial act. Big Data architect has to have theoretical knowledgeabout all available tools and must be able to decide, which tool fitsthe problem the best. Since the solution of a Big Data problem mayconsist of a set of tools, choosing the right solution is even harder.
Actual weaknesses of Big Data tools are caused mainly because oftheir immaturity. The majority of Big Data tools was released no morethan 15 years ago. This immaturity results in the rapid improvements.The issue it brings is a constant need to seek out the actualities aboutall of them. In addition, there are still many new tools emerging, sobesides that, there is also a need to seek out them.
The next complication is that the development of many tools wasstopped, and those tools died. It may happen because of various rea-sons, for example, the company or the community lost interest in itsdevelopment, or there was not proper documentation and support,which caused not sufficient desire to use that tool. This fact results inthe mandatory filtering of not actual tools from the previous surveys.
7

4 Big Data Tools Architecture
This chapter describes a proposed classification of Big Data tools intothe components. The chapter also contains the proposed architectureof tools for general Big Data problem, that is based on this classification.The architecture illustrates communication between its componentsand helps to visualize the solution of a general Big Data problem.
4.1 Related work
Multiple studies have proposed the architecture of Big Data system.Big Data analytics architecture in healthcare domain is proposedin [17]. This study [18] describes a reference architecture for Big Datasystems in the national security application domain. The architecturefor IoT Big Data analytics is proposed in [19]. This study [20] intro-duces a software reference architecture for semantic-aware Big Datasystems. Big Data analytics architecture for an Agro advisory systemis presented in [21]. This study [22] describes the architecture of across-sectorial Big Data platform for the process industry domain.All of these studies are only focused on the specific Big Data domain.Moreover, many of them are too detailed and complicated, whichcan have a negative impact on visualization of the specific Big Datasolution.
Still, there were found this studies [23, 24], that present a generalreference architecture for Big Data systems. However, we have decidedto propose an architecture, which we believe is more straightforward,illustrative, and suitable for the general Big Data solution visualization.
4.2 Classification
The proposed classification consists of 7 components, each with aspecific purpose. Their detailed description can be found in 4.3. Thecomponents are:
∙ transferring,
∙ resource management,
9
4. Big Data Tools Architecture
∙ storage,
∙ processing,
∙ advanced analytics,
∙ orchestration,
∙ presentation.Every relevant Big Data tool can be classified into one of these compo-nents. Some tools can also be classified into more components, becauseof their features. For example, Redis can be used as a storage, but alsoas a transferring tool.
The Big Data solution does not have to consist of the tools from allcomponents, they are optional, and their presence is based on the usecase. Also, the Big Data solution does not have to consist only of onetool from a component, it is possible to have more of them.
For example, in 2008 was the first time mentioned the choosing ofmultiple persistence tools based on the task, and combining them inone solution. This act is called the polyglot persistence1. For example,in some information system, there can be one database for storing theuser information, one database for storing the user sessions, and onefor storing financial data.
There is also another term polyglot processing – using multipleprocessing tools in one solution – which applies to data processing.Lambda architecture2 is a leading example of polyglot processing.However, it was criticised because of the need to maintain code intwo different processing tools, so the Kappa architecture3 was pro-posed [25].
In Big Data transferring component, it is common to use multipletools too, for example, the combination of Flume and Kafka [26].
4.3 Proposed architecture
The proposed architecture was designed to be simple and clear. Itcontains seven tool components and data sources. The architecture
1. http://www.sleberknight.com/blog/sleberkn/entry/polyglot_persistence2. http://lambda-architecture.net/3. http://kappa-architecture.com/
10

4. Big Data Tools Architecture
can be seen in figure 4.1, and detailed description of components isbelow.
Data storeDistributedfile system
Memory
Presentation
Transferring
Storage
Processing
Orc
hest
rati
on
Advancedanalytics
Reso
urc
e m
an
ag
em
en
tData sources
Figure 4.1: The proposed architecture for general Big Data problem
∙ Transferring component is responsible for moving the datafrom sink to source. It means that we can transfer the data fromexternal data source to the internal system, but also move thedata between two internal storage systems. Many of those toolscan filter or transform the data. Some of the popular transfor-mation tools are Sqoop, Flume, Kafka, or NiFi.
∙ Storage component is responsible for storing the data. In batchprocessing, data is stored persistently in a data store or file sys-tem, that is typically distributed. When the stream processing
11

4. Big Data Tools Architecture
is used, the use case may not need persistent storage, and onlymemory is utilized. Some of the popular distributed file sys-tems are HDFS and QFS, and some of the popular data storesare MongoDB, Cassandra, VoltDB, and Redis.
∙ Resource management component is responsible for runningthe task across the whole cluster. It manages CPU, memory,and storage. So it has to evaluate, how and where to run thegiven task. Some of the popular resource management toolsare YARN and Mesos.
∙ Orchestration component takes care of scheduling of repeatedoperations, for example, transformation, transferring, or pro-cessing. It is responsible for the right order of operations at thegiven time. Some of the popular orchestration tools are Oozieand Azkaban.
∙ Processing component process the given data. It can pre-processthe data, which means to detect some errors or incomplete data.Also, it can transform the data and save them back to storage.Alternatively, it can process the data, and then give the resultto the visualization component. It can also be extended by theadvanced analytics tool. Some of the popular processing toolsare Hadoop MapReduce, Spark, or Storm.
∙ Advanced analytics component handles advanced tasks, forexample, machine learning, deep learning, and predictive mod-eling. Often this component is realized by a library, for example,Deeplearning4J and MLlib, but there are also tools, such as Ma-hout or ELKI.
∙ Presentation component takes care of presenting the results ofgiven task. It also handles receiving the given tasks. It may bea visualization tool, which represents the result in graphicalformats, like Kibana or Apache Zeppelin, but it can also beREST API or command line.
12
5 Big Data Storage Systems
This chapter classifies available Big Data storage options into groups.Every group is described, including the typical use cases, where thetools from it can be used. Several groups have introduced subgroups,and then in each group, there is an overview of its open source tools.Every tool has the latest commit on GitHub in 2018. At the momentof the writing of this thesis, it is at most four months, so they areall considered actual. This chapter reviews the storage tools that arehigh-level. The base structure of the tool review is:
1. basic information (creation date, implementation language, de-velopers),
2. important internal or external features which affect the usabil-ity,
3. suggested special use cases,
4. companies that use this tool.
If some property of the specific tool was not identified, it is omitted inthe text. At the end of each section, a table can be found. This tablecontains the summary of important factors that were identified in thisthesis for each tool.
5.1 Relational database management systems
Relational database management system (RDBMS) is a technologythat was designed to support data management of all types regardlessthe format. It stores data in a set of relations (tables). Each relationhas tuples (rows), and each tuple represents an entity. This entityis described through attributes (columns), each attribute contains asingle value for each entity. This value may refer to another tuple inthe same or other relations, which creates a relationship between thoseentities.
It is a very mature technology. It uses a structured query language(SQL) which allows complex queries such as grouping, aggregates,
13
5. Big Data Storage Systems
or joins. It provides ACID properties. The most common traditionalopen source RDBMSs are PostgreSQL1, MySQL2, and MariaDB3. Theirtypical use case is to handle structured transactional data, that can fitinto a single machine, for example, in the accounting system.
The main drawback of RDBMSs is the need to have a predefinedschema before these databases can store the data. Because of that, theycan efficiently store only structured data, and any following schemachanges may be difficult to handle. The next problem is the increasingneed for scalability, which causes RDBMSs some issues. Althoughthey can scale horizontally, they were not designed to run efficientlyon clusters [27]. To tackle this problem, relational databases for datawarehouse systems were created. However, they targeted only OLAPworkloads [28]. So later, to target OLTP read-write workloads, a scal-able RDBMSs, called NewSQL database management systems, werecreated.
5.1.1 Data warehouse databases
Data warehouse databases provide most of the same features as tradi-tional relational databases. Their advantage is horizontal scalability.They are commonly used in large companies, so they are mostly com-mercial tools.
Mostly, they are not designed for transactional work, they areoptimized for reads, so the querying runs very efficiently, and datacan be analyzed fast. Their typical use case is the process in whichhuge structured data are stored, and then after some time, they areanalyzed.
Greenplum4 was created in 2003 by Greenplum company. From2013, it is a part of the Pivotal Software, and in 2015, it was releasedas open source. It is written in C.
Greenplum is based on PostgreSQL. It can be viewed as severalmodified PostgreSQL instances working together, using the massively
1. https://www.postgresql.org/2. https://www.mysql.com/3. https://mariadb.org/4. https://greenplum.org/
14
5. Big Data Storage Systems
parallel processing (MPP) approach. It can also be used as a key-valuestore or document store.
This database was successfully deployed in, for example, fraudanalytics, financial risk management, and manufacturing optimiza-tion [29]. It is used, for example, by Orange, Comcast, DISH, andFord.
MySQL Cluster5, written in C and C++, was created in 2004. Now,it is supported by Oracle.
MySQL Cluster provides multiple interfaces to the database. Inaddition to standard APIs and common languages, it also providesNoSQL API. This API can be used to bypass the SQL layer of thedatabase and allows faster access to the tables.
It was designed to be highly available. It allows doing schemaupdates, upgrades of servers, and backups, without a downtime.
MySQL Cluster is used, for example, by PayPal, Spotify, and Nokia.
Postgres-XL6 was created in 2012, and it was released as open sourcein 2014. Nowadays, it is supported by 2ndQuadrant. It is written in C.
Like Greenplum, it is a massively parallel database that uses sev-eral PostgreSQL instances. It has similar features as Greenplum, butits advantage is, that is it being developed by the same company asPostgreSQL.
5.1.2 NewSQL database management systems
NewSQL database management systems were designed for OLTPread-write workflows. They can scale horizontally much better thantraditional RDBMSs, maintain ACID properties and support SQL.NewSQL databases typically store the data in memory, allowing betterperformance.
VoltDB7 was released in 2008, developed by VoltDB Inc. It is writtenin Java and C++.
5. https://www.mysql.com/products/cluster/6. https://www.postgres-xl.org/7. https://www.voltdb.com/
15
5. Big Data Storage Systems
Although VoltDB stores the data in memory for fast speed, it canprovide full disk persistence. It can also be used as a key-value storeor document store. It is designed to store and analyze the data in realtime. Therefore it can act as a storage and processing tool at the sametime.
VoltDB is used, for example, by Huawei, Nokia, Orange, and Air-push.
TiDB8 is a NewSQL database, released in 2016 by PingCAP. It iswritten in Go.
It is a hybrid transactional and analytical processing database,which means, it can serve for OLAP and OLTP workloads. It is com-patible with MySQL so that a user can simply replace his MySQLsolution with this database.
TiDB is used, for example, by Mobike, and Yiguo.
CockroachDB9 was released in 2014. Nowadays, is supported byCockroach Labs. It is written in Go.
This database is built on a key-value engine RocksDB. Althoughthe user cannot access this key-value engine directly, CockroachDBcan be used as a key-value store by creating a table with two columns,in which one column is a primary key. Then the operations typicalfor key-value stores will translate into key-value operations instead ofSQL.
CockroachDB has main aim to be highly scalable, transactional, andresilient. Hence, it has worse performance than in-memory NewSQLdatabases.
It is used, for example, by Baidu, Kindred, Tierion, and HeroicLabs.
CrateDB10 is a NewSQL database, released in 2016 by Crate.io, andwritten in Java.
This database does not support ACID. It is consistent only at therow level. CrateDB can be used as a key-value and document store.
8. https://pingcap.com/en/9. https://www.cockroachlabs.com/product/cockroachdb/10. https://crate.io/products/cratedb/
16
5. Big Data Storage Systems
It is also designed to handle time-series data. In a benchmark with atime-series NoSQL database InfluxDB, CrateDB had almost ten timeslarger query throughput [30].
It is used, for example, by Alpla, Clickdrive.io, Clearvoice, andDriveNow.
5.1.3 Summary
Relational database management systems are great for structureddata. They can be divided into three categories: traditional databases,which run best on the single server, data warehouse databases, whichare scalable, mostly older and target OLAP workloads, and NewSQLdatabases, which are scalable, newer tools that focus on OLTP read-write workloads.
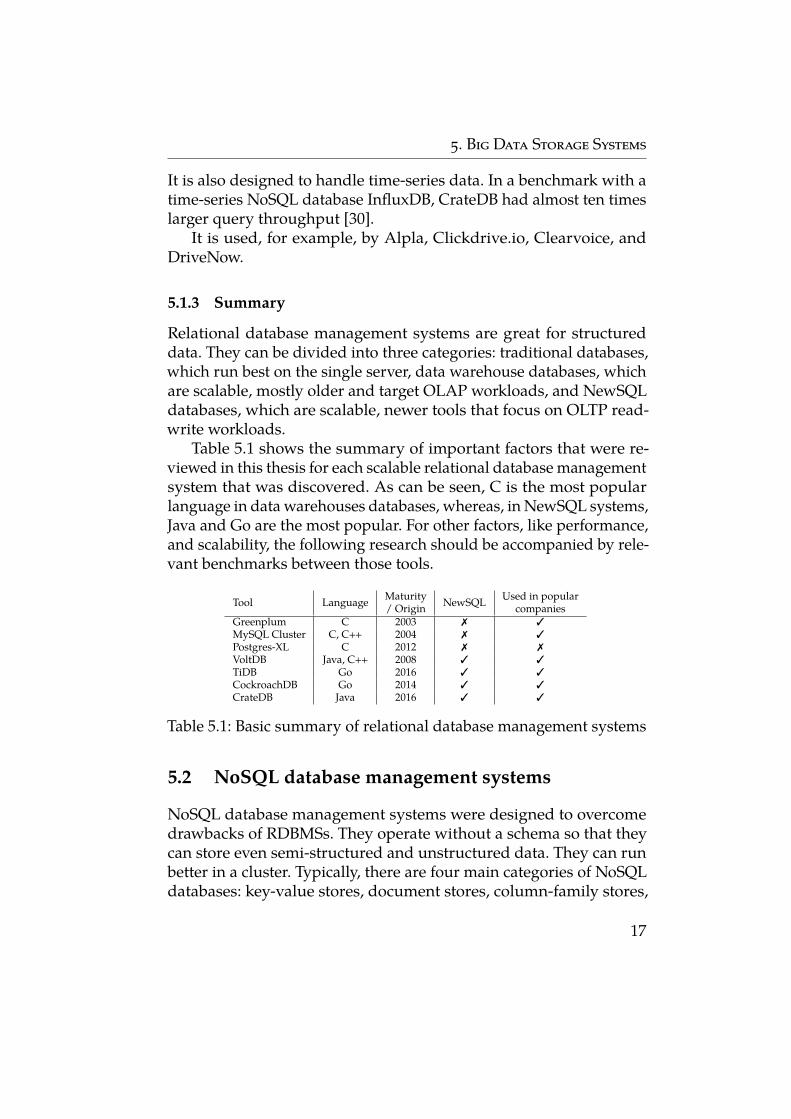
Table 5.1 shows the summary of important factors that were re-viewed in this thesis for each scalable relational database managementsystem that was discovered. As can be seen, C is the most popularlanguage in data warehouses databases, whereas, in NewSQL systems,Java and Go are the most popular. For other factors, like performance,and scalability, the following research should be accompanied by rele-vant benchmarks between those tools.
Tool Language Maturity/ Origin NewSQL Used in popular
companiesGreenplum C 2003 7 3MySQL Cluster C, C++ 2004 7 3Postgres-XL C 2012 7 7VoltDB Java, C++ 2008 3 3TiDB Go 2016 3 3CockroachDB Go 2014 3 3CrateDB Java 2016 3 3
Table 5.1: Basic summary of relational database management systems
5.2 NoSQL database management systems
NoSQL database management systems were designed to overcomedrawbacks of RDBMSs. They operate without a schema so that theycan store even semi-structured and unstructured data. They can runbetter in a cluster. Typically, there are four main categories of NoSQLdatabases: key-value stores, document stores, column-family stores,
17
5. Big Data Storage Systems
and graph databases. However, this research identified a multi-modelcategory as well.
5.2.1 Key-value stores
In this model, each stored value is associated with a unique key andcan be accessed only with this key. Value is typically some blob ofbits, which allows storing anything in the database. Some key-valuestores may allow having a structure in their values to increase thequerying capability. However, typically, there is expected to access thedata using a key. Basic supported operations for all key-value storesare:
∙ put the value for a key
∙ get the value for a key
∙ delete a key-value
The advantage of a key-value data model is its simplicity. Thesestores can provide low latency and high throughput. On the otherhand, if there is a demand for more complex operations, key-valuestores can be ineffective because those operations will have to be per-formed in the application.
Their typical use case is handling any data that are just being storedand retrieved by a key, for example, data caching, session storage, andprofile storage.
Redis11 is an in-memory data store, written in C, and created in2009. Currently, it is supported by Redis Labs.
Although Redis stores data in memory, it can utilize the disk forpersistence. It supports partitioning using the Redis Cluster, transac-tions, and user-defined scripts.
Redis provides more complex data structures for storing the data.Thanks to them, secondary indexing can be used. Redis can set theexpiration date on each key, so after a specified time, the key-value isautomatically deleted.
11. https://redis.io/
18

5. Big Data Storage Systems
This store is being used as a very fast database for simple opera-tions, additionally as a cache. It can also be used as a message brokerthanks to its publish/subscribe feature.
Redis is used, for example, by Github, StackOverflow, Coinbase,Twitter, Uber, Trello, or Slack.
Aerospike12 is a flash-optimized distributed database, created in2010. It was first known as Citrusleaf, but in 2012 was renamed. Thenin 2014, it went open source. It is written in C, created by the companyAerospike.
It uses hybrid memory architecture; it supports DRAM and flashdisks [31]. Typically, indexes are stored in DRAM and data on the flashdisks.
Aerospike has implemented its own system to access flash disksdirectly, bypassing the operating system’s file system. This access isoptimized and parallelized across multiple flash disks, which resultsin better throughput. Aerospike can run only in DRAM, but the hybridarchitecture provides better performance. It also decreases the numberof necessary servers in the cluster because flash disks enable bettervertical scalability than using only DRAM.
It provides complex data types like lists, maps, and geospatialswhich may be used with secondary indices. It supports user-definedfunctions. Aerospike supports two modes, Available mode, and Strongconsistency mode. Thus it is possible to choose which kind of database,according to CAP theorem, to use. It is possible to set data access tousers.
This database is used, for example, by AppNexus, InMobi, AdForm,Yashi, and Curse.
Riak KV13 is a distributed database, written in Erlang. It was cre-ated in 2009 by Basho Technologies. However, in 2017, this companycrashed, and now is Riak supported by Erlang Solutions.
It aims at ensuring data availability and partition tolerance. It usespeer-to-peer replication, making it is easy to add or remove nodesbased on actual needs.
12. https://www.aerospike.com/13. http://basho.com/products/riak-kv/
19

5. Big Data Storage Systems
Riak KV can be used as a document store with many queryingcapabilities thanks to Riak Search and Riak Data Types [32]. Theyintegrate Solr14 for indexing and querying and Riak for storage anddistribution. On the top of Riak KV is built a time-series database,Riak TS.
This database is used, for example, in Uber, Yammer, and Sendy.
GridDB15 is specialized in-memory database optimized for IoT,released in 2016. It is written in C++ by Toshiba.
It extends the basic key-value data model by key-container datamodel. A container can have two types: collection and time-seriescontainer. The collection container is general-purpose, on the otherhand, time-series container is used for time series data. Unlike Riak,GridDB can work with both types in a single installation.
GridDB supports transactions in a single container. Consistencycan be tunable, a database user can choose strong consistency or even-tual consistency. This database can be queried via TQL, but only SE-LECT statement is allowed.
GridDB can be used in situations, where is a need to deal withtime series data. For example as a weather record storage system.
Apache Accumulo16 is a distributed store, written in Java. Origi-nally, it was called Cloudbase, created in 2008 by NSA. Then in 2011 itwas released as open source and renamed to Accumulo. Nowadays, itis backed by Apache Software Foundation.
It stores sorted key-value pairs, which allows fast gets of singlekeys, also of a range of keys. It is used on the top of HDFS. It providescell-based access control. It is the option to grant or refuse the useraccess to a particular key-value; every key consists of a visibility field,which takes care of this.
Infinispan17 is a distributed in-memory key-value data store, cre-ated by RedHat in 2009. It is written in Java.
14. http://lucene.apache.org/solr/15. https://griddb.net/en/16. https://accumulo.apache.org/17. http://infinispan.org/
20

5. Big Data Storage Systems
Infinispan offers advanced functionality. It is fully transactional,but this option can be disabled if the bigger performance is needed.Data can be stored to disk if it is necessary. The maximum number orsize of entries kept in memory can be configured, others are moved toa persistent store. It also supports indexing and querying.
5.2.2 Document stores
Document stores are similar to key-value stores. In this case, the valuecan have a structure. The defined structure of stored data grants moreflexibility in data access. It is expected to get values by a query, al-though it is possible to use only a key. These stores support morecomplex queries and indexes based on the structure of the document.Popular structure formats are XML, JSON, and BSON.
Their typical use case is handling the semi-structured data, whichcan be queried, for example, in e-commerce, blog posts, and userprofile storage.
MongoDB18 is a distributed database, written in C++, developedby 10gen in 2009. In 2013, this company was renamed to MongoDBInc.
This database stores data in collections. Each collection can containdocuments, and each document represents an entity. This entity isdescribed through fields. Data are stored in a binary representationBSON (Binary JSON). Currently, MongoDB is ACID compliant fora single document. But in the newest version MongoDB 4.0 whichis scheduled for summer 2018, this database will add support formulti-document ACID transactions.
It uses its own query language instead of SQL. A query, whichreturns all users who are named Martin, looks like this:
db.users.find( { name: "Martin" } )
MongoDB is general purpose database, it is used, for example, byGoogle, UPS, Facebook, EBay, and Adobe.
18. https://www.mongodb.com/
21
5. Big Data Storage Systems
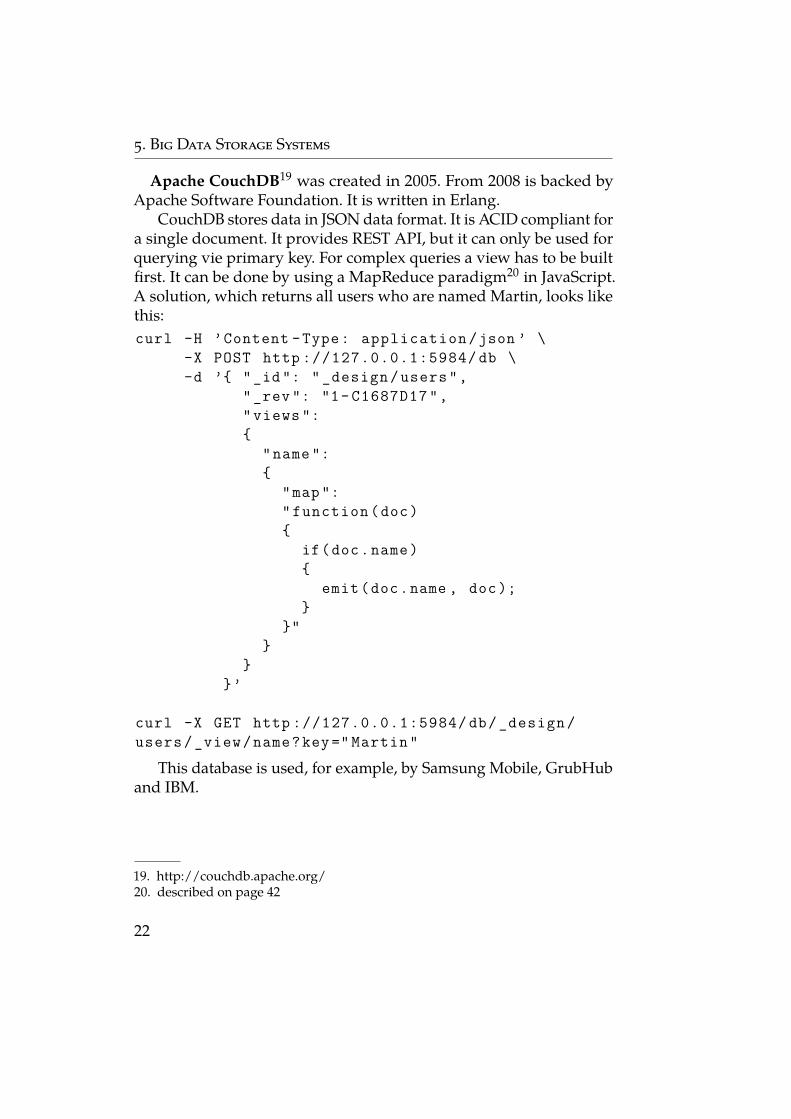
Apache CouchDB19 was created in 2005. From 2008 is backed byApache Software Foundation. It is written in Erlang.
CouchDB stores data in JSON data format. It is ACID compliant fora single document. It provides REST API, but it can only be used forquerying vie primary key. For complex queries a view has to be builtfirst. It can be done by using a MapReduce paradigm20 in JavaScript.A solution, which returns all users who are named Martin, looks likethis:curl -H ’Content -Type: application /json ’ \
-X POST http ://127.0.0.1:5984/ db \-d ’{ "_id ": " _design /users",
"_rev ": "1- C1687D17 ","views ":{
"name ":{
"map ":" function (doc){
if(doc.name){
emit(doc.name , doc );}
}"}
}}’
curl -X GET http ://127.0.0.1:5984/ db/ _design /users/_view/name?key =" Martin"
This database is used, for example, by Samsung Mobile, GrubHuband IBM.
19. http://couchdb.apache.org/20. described on page 42
22
5. Big Data Storage Systems
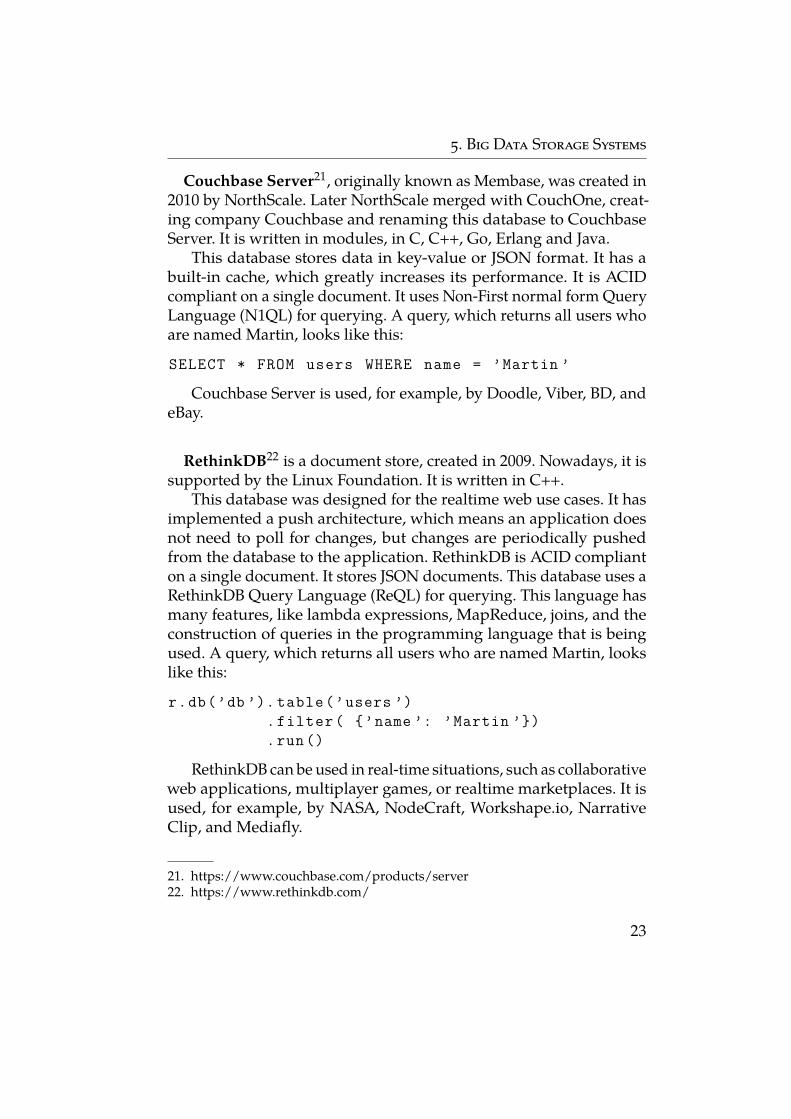
Couchbase Server21, originally known as Membase, was created in2010 by NorthScale. Later NorthScale merged with CouchOne, creat-ing company Couchbase and renaming this database to CouchbaseServer. It is written in modules, in C, C++, Go, Erlang and Java.
This database stores data in key-value or JSON format. It has abuilt-in cache, which greatly increases its performance. It is ACIDcompliant on a single document. It uses Non-First normal form QueryLanguage (N1QL) for querying. A query, which returns all users whoare named Martin, looks like this:
SELECT * FROM users WHERE name = ’Martin ’
Couchbase Server is used, for example, by Doodle, Viber, BD, andeBay.
RethinkDB22 is a document store, created in 2009. Nowadays, it issupported by the Linux Foundation. It is written in C++.
This database was designed for the realtime web use cases. It hasimplemented a push architecture, which means an application doesnot need to poll for changes, but changes are periodically pushedfrom the database to the application. RethinkDB is ACID complianton a single document. It stores JSON documents. This database uses aRethinkDB Query Language (ReQL) for querying. This language hasmany features, like lambda expressions, MapReduce, joins, and theconstruction of queries in the programming language that is beingused. A query, which returns all users who are named Martin, lookslike this:
r.db(’db ’). table(’users ’).filter( {’name ’: ’Martin ’}).run ()
RethinkDB can be used in real-time situations, such as collaborativeweb applications, multiplayer games, or realtime marketplaces. It isused, for example, by NASA, NodeCraft, Workshape.io, NarrativeClip, and Mediafly.
21. https://www.couchbase.com/products/server22. https://www.rethinkdb.com/
23

5. Big Data Storage Systems
RavenDB was created in 2010, written in C#. Nowadays, it is sup-ported by Hibernating Rhinos.
RavenDB was designed to target .NET ecosystem. It runs nativelyon Windows, which may be problematic for some other databases. Inthe newest version, RavenDB can also be run on Linux, using .NETCore framework. This database is ACID compliant on a single doc-ument. For querying, RavenDB uses Raven Query Language (RQL),but it also supports higher level querying, using Language IntegratedQuery (LINQ). A query, which returns all users who are named Martin,looks like this:// RQLfrom users where name = ’Martin ’
// LINQvar users = session
.Query <User >()
.Where(x => x.name == "Martin ")
.ToList ();
ElasticSearch was released in 2010. It is being developed and sup-ported by Elastic, written in Java.
ElasticSearch is a distributed real-time document store that hasevery field indexed. This fact allows users using it as a real-time full-text search engine. It stores data in JSON format. To define queries,ElasticSearch provides a Query Domain Specific Language (QueryDSL) based on JSON, which is used over REST API. A solution, whichreturns all users who are named Martin, looks like this:
curl -X GET " localhost :9200/ users/ _search " \-H ’Content -Type: application /json ’\-d’{
"query ":{
"match ": { "name ": "Martin" }}
}’
24
5. Big Data Storage Systems
ElasticSearch is used, for example, in eBay, Wikipedia, Facebookand Blizzard.
5.2.3 Column-family stores
Column-family stores are also called wide column stores. The principleof them is the storage in column families as rows that have a row keyand multiple columns. Each column consists of a name and value.This provides the easy way to add new columns to the existing row.They support ACID only at a row level.
Their typical use case is similar to document stores, however,column-family stores typically provide less querying capabilities, butbetter scalability than document stores. They can be used to handledata, for example, in e-commerce, blog posts, and user profile storagesystems.
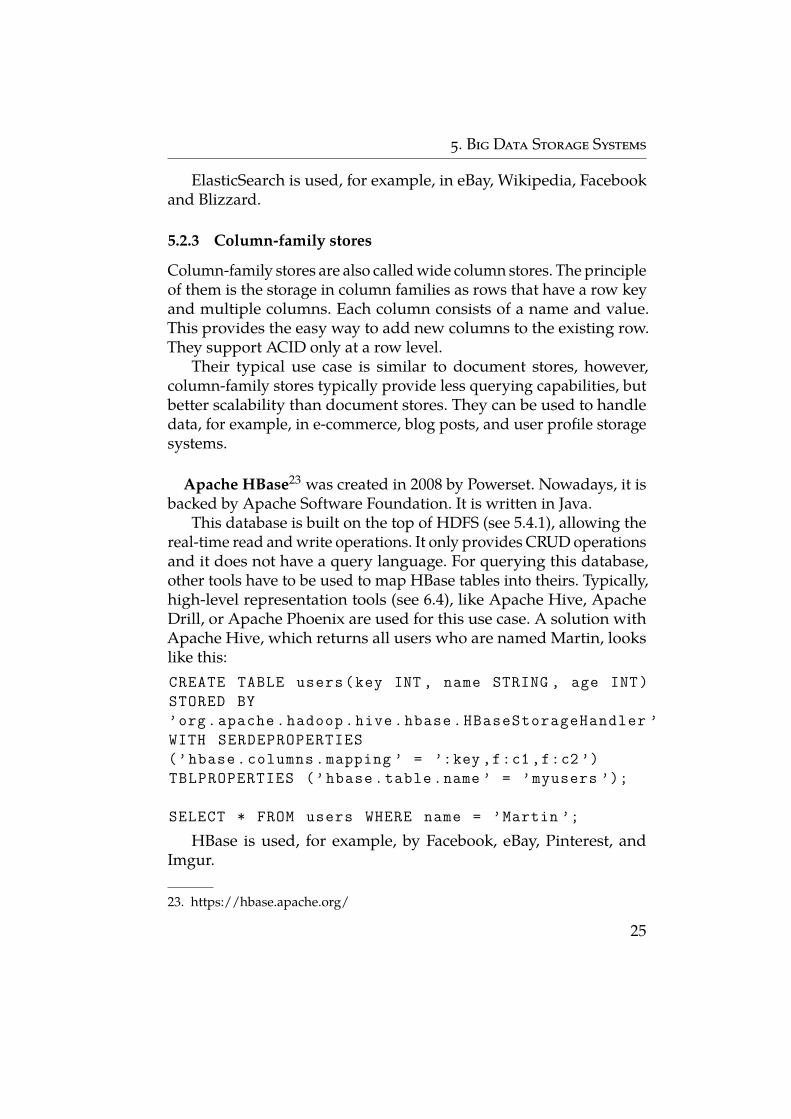
Apache HBase23 was created in 2008 by Powerset. Nowadays, it isbacked by Apache Software Foundation. It is written in Java.
This database is built on the top of HDFS (see 5.4.1), allowing thereal-time read and write operations. It only provides CRUD operationsand it does not have a query language. For querying this database,other tools have to be used to map HBase tables into theirs. Typically,high-level representation tools (see 6.4), like Apache Hive, ApacheDrill, or Apache Phoenix are used for this use case. A solution withApache Hive, which returns all users who are named Martin, lookslike this:CREATE TABLE users(key INT , name STRING , age INT)STORED BY’org.apache.hadoop.hive.hbase. HBaseStorageHandler ’WITH SERDEPROPERTIES(’hbase. columns .mapping ’ = ’:key ,f:c1 ,f:c2 ’)TBLPROPERTIES (’hbase.table.name ’ = ’myusers ’);
SELECT * FROM users WHERE name = ’Martin ’;HBase is used, for example, by Facebook, eBay, Pinterest, and
Imgur.
23. https://hbase.apache.org/
25

5. Big Data Storage Systems
Apache Cassandra24 was developed at Facebook, and released in2008. Nowadays, it is backed by Apache Software Foundation. It iswritten in Java.
Cassandra is a highly available system that is designed to be veryfast, especially with write operations. This database use CassandraQuery Language (CQL) for querying. By default, CQL does not allowto execute queries that involve filtering of columns which are notindexed, because of the performance issues. This behavior can beexplicitly overriden. If a name has a secondary index, then a query,which returns all users who are named Martin, looks like this:
SELECT * FROM users WHERE name = ’Martin ’;
It is used, for example, by Uber, Spotify, eBay, and Netflix.
ScyllaDB25 was released in 2015 by ScyllaDB Inc. This database iswritten in C++.
This database was designed as a replacement for Cassandra. Ithas compatible API with Cassandra, but internally is much improved.Based on many benchmarks, ScyllaDB performs greatly better thanCassandra [33]. This database uses CQL too, so a query, which returnsall users who are named Martin, looks the same as in Cassandra:
SELECT * FROM users WHERE name = ’Martin ’;
It is used, for example, by IBM, Intel, CERN, and Samsung.
5.2.4 Graph databases
Graph databases allow storing entities and relationships of theseentities. Entities can have different types of relationships betweenthem. Each entity and relationship can also have some properties.These databases are specialized to handle highly connected data. Theyare typically used, for example, in a social network, logistics, ande-commerce systems.
24. http://cassandra.apache.org/25. https://www.scylladb.com/
26
5. Big Data Storage Systems
Neo4j26 was created in 2002. It went open source in 2007. Nowadays,it is supported by Neo4j, Inc. It is written in Java.
Neo4j was designed for easy usability and high performance. It hasthe largest community from all graph databases. It is ACID compliant.For querying it supports Gremlin query language, but more supportedoption is Cypher query language, which was created by Neo4j. A querywritten in Cypher, which returns all mutual friends of Martin andTomas, looks like this:MATCH (martin:Person {name :" Martin "})
-[: FRIEND ]-( mutualFriend :Person)-[: FRIEND ]-( tomas:Person {name :" Tomas "})
RETURN mutualFriend
Neo4j is used, for example, by eBay, NASA, Cisco, Microsoft, andOrange.
JanusGraph27 was released in 2017 by the Linux Foundation. It wasforked from Titan database, which is now dead. It is written in Java.
It is a transactional database that can be built on the top of variousstores, such as, Cassandra or HBase. It uses Gremlin query languagefor querying. A query, which returns all mutual friends of Martin andTomas, looks like this:
mutualFriends = g.V(g.V(). has(’name ’,’Martin ’). next ()).both(’friend ’).where(
both(’friend ’). is(
eq( g.V(). has(’name ’,’Tomas ’). next () ))
)
JanusGraph is used, for example, by CELUM, Netflix and G DATA.
26. https://neo4j.com/27. http://janusgraph.org/
27
5. Big Data Storage Systems
Dgraph28 was released in 2016 by Dgraph Labs, Inc. This databaseis written in Go.
It was designed to be a high-performance graph database whichprovides ACID. It handles data natively, so it cannot run on the top ofother databases like JanusGraph. Clients can communicate with thisdatabase by gRPC or HTTP APIs. This database uses GraphQL+- forquerying. It is a modified version of GraphQL, developed by Facebook.Dgraph simplified this language, but also added advanced features tointeract with the graph data. Because all GraphQL+- queries returna subgraph, and nowadays, there is no supported option for the in-tersection, a query, which returns all mutual friends of Martin andTomas has to be divided into two database queries. The first querygets all Martin’s friends and the database return them as JSON.
{martinFriends (func: eq(name , "Martin ")){
friend { name }}
}
Then the application needs to parse that result and put it into thesecond query. The following example illustrates the situation, whenMartin had four friends: Peter, Jane, John, and Kate.
{mutualFriendsWithTomas (func: eq(name , "Tomas ")){
friend@filter(
anyofterms (name , "Peter Jane John Kate ")){ name }
}}
28. https://dgraph.io/
28
5. Big Data Storage Systems
Apache S2Graph29 was released in 2015. It is developed by ApacheSoftware Foundation, currently incubating. It is written in Scala.
This database is built on the top of HBase. It provides HTTP API,but also supports Gremlin for querying. So a query, which returns allmutual friends of Martin and Tomas, looks the same as in JanusGraphdatabase:mutualFriends = g
.V(g.V(). has(’name ’,’Martin ’). next ())
.both(’friend ’)
.where(
both(’friend ’). is(
eq( g.V(). has(’name ’,’Tomas ’). next () ))
)
HyperGraphDB30 was created in 2010 by Kobrix Software. Thisdatabase is written in Java.
It was designed specifically for artificial intelligence and web se-mantic projects. It can store hypergraphs, which are graphs that con-tains edges that can point to more than two nodes. This database alsoextends this definition by allowing an edge to point to another edge. Itsupports ACID but does not have any querying language. It is an em-bedded database. Therefore it comes in the form of a library and canbe queried only via its API from the process that is currently runningin the application.
5.2.5 Multi-model databases
Multi-model databases integrate multiple data models, and the datacan be accessed by only one query language that covers all supporteddata models [34]. This combination of data models in a single databaseallows implementing polyglot persistence without using various databases.
29. https://s2graph.apache.org/30. http://www.hypergraphdb.org/
29
5. Big Data Storage Systems
This approach provides better maintainability and also does not re-quire the knowledge of multiple databases. Typically, these databasessupport key-value, document, and graph data models.
These databases can be used in use cases, which has to deal withmultiple data models in one solution. These use cases include ac-cess management, traffic management, logistics, internet of things,recommendation engine, network infrastructure management, socialnetworks, and e-commerce systems.
ArangoDB31, formerly known as AvocadoDB, was created in 2011by triAGENS. Later, the database and its company renamed to ArangoDB.It is written in C++.
This database uses ArangoDB query language (AQL) for querying.It is similar to SQL, but this language only supports reading andmodifying of data. However, it is modified to support graph queryingtoo. A query, which returns all animal species that live in the cities inGermany, would in SQL look like this:
SELECT species FROMAnimals A, Cities B, Countries CWHERE A.city = B.idAND B. country = C.idAND C.name = ’Germany ’
In ArangoDB, this query looks like this:
FOR a IN AnimalsFOR b IN Cities
FOR c IN CountriesFILTER a.city == b.idFILTER b. country == c.idFILTER c.name == " Germany "
RETURN a. species
ArrangoDB is used, for example, by Thomson Reuters, FlightStats,InfoCamere, and Oxford University.
31. https://www.arangodb.com/
30
5. Big Data Storage Systems
OrientDB32 was created in 2010, written in Java. Nowadays, it isbeing developed by CallidusCloud.
This database supports ACID. Instead of join operations, it can con-nect the entities with links, just like in the graph database. It uses SQLfor querying. This language is extended to manipulate with graphs. Italso provides SQL-Match option, which has similar syntax to Cypher.A query, which returns all animal species that live in the cities inGermany, would in SQL look like this:
SELECT species FROMAnimals A, Cities B, Countries CWHERE A.city = B.idAND B. country = C.idAND C.name = ’Germany ’
In OrientDB, this query can be simplified to this:SELECT species FROM Animals
WHERE city. country .name = ’Germany ’
OrientDB is used, for example, by Comcast, Accenture, Sky, andUnited Nations.
5.2.6 Summary
NoSQL database management systems were designed to be highlyscalable and to operate with semi-structured and unstructured data.They can be divided into five categories based on their data model:
∙ key-value stores that store the data as key-value pairs,
∙ document stores that store the data as key-value pairs, but thevalue can have internal structure,
∙ column-family stores that store the data in column familiesthat provide a flexible structure,
∙ graph databases that store the data as entities and relationshipsbetween them,
∙ multi-model databases that combine multiple data models.
32. https://orientdb.com/
31

5. Big Data Storage Systems
Table 5.2 shows the summary of important factors that were iden-tified in this thesis for each NoSQL database management system thatwas discovered. As can be seen, Java is the most popular language.Also, supporting a query language in NoSQL database managementsystem is a common practice. For other factors, like performance, andscalability, the following research should be accompanied by relevantbenchmarks between those tools.
Tool Language Maturity/ Origin Data model Query language Used in popular
companiesRedis C 2009 key-value 7 3Scalaris Erlang 2008 key-value 7 7Aerospike C 2010 key-value AQL 3Riak KV Erlang 2009 key-value 7 3GridDB C++ 2016 key-value TQL 3Apache Accumulo Java 2008 key-value 7 7Infinispan Java 2009 key-value Ickle 7MongoDB C++ 2009 document 3 3CouchDB Erlang 2005 document 7 3
Couchbase C, C++, Go,Erlang, Java 2010 document N1QL 3
RethinkDB C++ 2009 document ReQL 3RavenDB C# 2010 document RQL 7ElasticSearch Java 2010 document Query DSL 3Apache HBase Java 2008 column-family 7 3Apache Cassandra Java 2008 column-family CQL 3ScyllaDB C++ 2015 column-family CQL 3Neo4j Java 2002 graph Cypher, Gremlin 3JanusGraph Java 2017 graph Gremlin 3Dgraph Go 2016 graph GraphQL+- 7Apache S2Graph Scala 2015 graph Gremlin 7HyperGraphDB Java 2010 graph 7 7ArangoDB C++ 2011 multi-model AQL 3OrientDB Java 2010 multi-model SQL 3
Table 5.2: Basic summary of NoSQL database management systems
5.3 Time-series database management systems
Time-series database management systems are specialized to handletime-series data. Those data typically arrives in time order and isalmost always considered as a new record. They typically contain atimestamp and represent change over time. A timestamp can haveprecision even to nanoseconds. The delete operations are rare, typicallythey only appear in a large range, removing the old data. The updateoperations typically never occur. In this kind of databases, data often
32
5. Big Data Storage Systems
have a period after which it expires. Time-series databases are used,for example, in monitoring, IoT sensors, and real-time analytics.
5.3.1 InfluxDB
InfluxDB33 was created in 2013 by Errplane which was later renamedto InfluxData Inc. It is written in Go.
It stores points in measurements, which is a unit that containsrelated points, for example, water level measurements. Each pointin measurement has a timestamp, a tagset for metadata, and a field-set for measured data. For writes and querying, it provides RESTAPI, but also a querying language InfluxQL. A query, which returnstemperatures from the 7.5.2018 looks like this:
SELECT * FROM " temperature "WHERE time >= ’2018 -05 -07 T00 :00:00Z’
InfluxDB is used, for example, by Cisco, IBM, eBay, and BBOXX.
5.3.2 Riak TS
Riak TS34 was released in 2016 by Basho Technologies. In 2017, thecompany crashed, but now is Riak supported by Erlang Solutions. Itis written in Erlang.
This database stores data similarly to a traditional relational databasein tables with columns and rows. Officially, it is considered as a NoSQLdatabase, but it is disputable, because it not only needs a predefinedschema in its tables, there is also no possibility to alter the created ta-ble [35]. This database is built on top of Riak KV, so each row maps to akey-value pair. It provides REST API and a subset of SQL for querying.A query, which returns temperatures from the 7.5.2018 looks like this:
SELECT * FROM temperatureWHERE time >= ’2018 -05 -07 00:00:00 ’
33. https://www.influxdata.com/time-series-platform/influxdb/34. http://basho.com/products/riak-ts/
33
5. Big Data Storage Systems
5.3.3 OpenTSDB
OpenTSDB35 was released in 2011. The initial development was sup-ported by StumbleUpon, but nowadays Yahoo! is supporting it. It iswritten in Java.
This database is built on HBase. Each data point consists of atimestamp, value, metric name and a set of tags. It provides REST API.A query, which returns temperatures from the 7.5.2018 looks like this:
curl -X GET "http :// localhost :4242/ query/?start =2018/05/07 -00:00:00&m= temperature "
5.3.4 Druid
Druid36 is a column-oriented data store that was released in 2012 byMetamarkets. It is written in Java.
Druid is designed for business intelligence queries on event data.It provides real-time data ingestion, analysis, and fast aggregations.It has to use MySQL or PostgreSQL for metadata. Data consist ofa timestamp, dimensions, which are fields that can be filtered andgrouped by, and metrics, which are fields that can be aggregated.Querying can be made by REST API. In 2017, also an experimentalquery language Druid SQL was added, but nowadays is still stated asexperimental. A query using REST API, which returns temperaturesbetween the 7.5.2018 and 21.5.2018 looks like this:
{" queryType ": " timeseries "," dataSource ": " temperature "," granularity ": "all"," intervals ": [ "2018 -05 -07 T00 :00:00.000
/2018 -05 -21 T00 :00:00.000" ]}
It is used, for example, by eBay, Cisco, Netflix, and Paypal.
35. http://opentsdb.net/36. http://druid.io/
34
5. Big Data Storage Systems
5.3.5 SiriDB
SiriDB37 was created in 2016 by Transceptor Technology. It is writtenin C.
This database stores the data in points as a pair of timestamp andvalue, where value can only be a numeric data type. It provides HTTPAPI for querying, but also its own query language. A query, whichreturns temperatures from the 7.5.2018 looks like this:select * from " temperature " after "2018 -05 -07"
5.3.6 TimescaleDB
TimescaleDB38 is a relational database, that was released in 2017 byTimescale, Inc. This database is written in C.
It is developed as an extension to PostgreSQL, specialized at time-series data. A query, which returns temperatures from the 7.5.2018looks like this:SELECT * FROM temperature
WHERE time > ’2018 -05 -07 ’
5.3.7 Prometheus
Prometheus39 is a monitoring system and a time series database, re-leased in 2014. It is written in Go.
Prometheus is very similar to InfluxDB. This database is more spe-cialized in metrics and has a more powerful built-in query language.However, the queries can be performed only relatively to actual time.Also, Prometheus is relaxing consistency for higher availability thanInfluxDB has. A query, which returns temperatures from the last weeklooks like this:temperature [1w]
It is used, for example, by Docker, SoundCloud, JustWatch, andBranch.
37. http://siridb.net/38. https://www.timescale.com/39. https://prometheus.io/
35

5. Big Data Storage Systems
5.3.8 KairosDB
KairosDB40 is a time-series database, that was released in 2013. It iswritten in Java.
This database is designed on the top of column-family store Cas-sandra. It provides REST API, but in 2017 it also added support forCQL. A query using REST API, which returns temperatures from thelast week looks like this:
{" start_relative ":{" value ":1 ," unit ":" weeks "}," metrics ": [{
"name ": " temperature "}]
}
This database is used, for example, by Proofpoint, Signal, andEnbase.
5.3.9 Summary
Time-series database management systems are specialized to handletime-series data. They are based on relational or NoSQL databasemanagement systems. However, some of them are hard to categorizeinto one of those groups and are mostly referred only as time-seriesdatabase management systems.
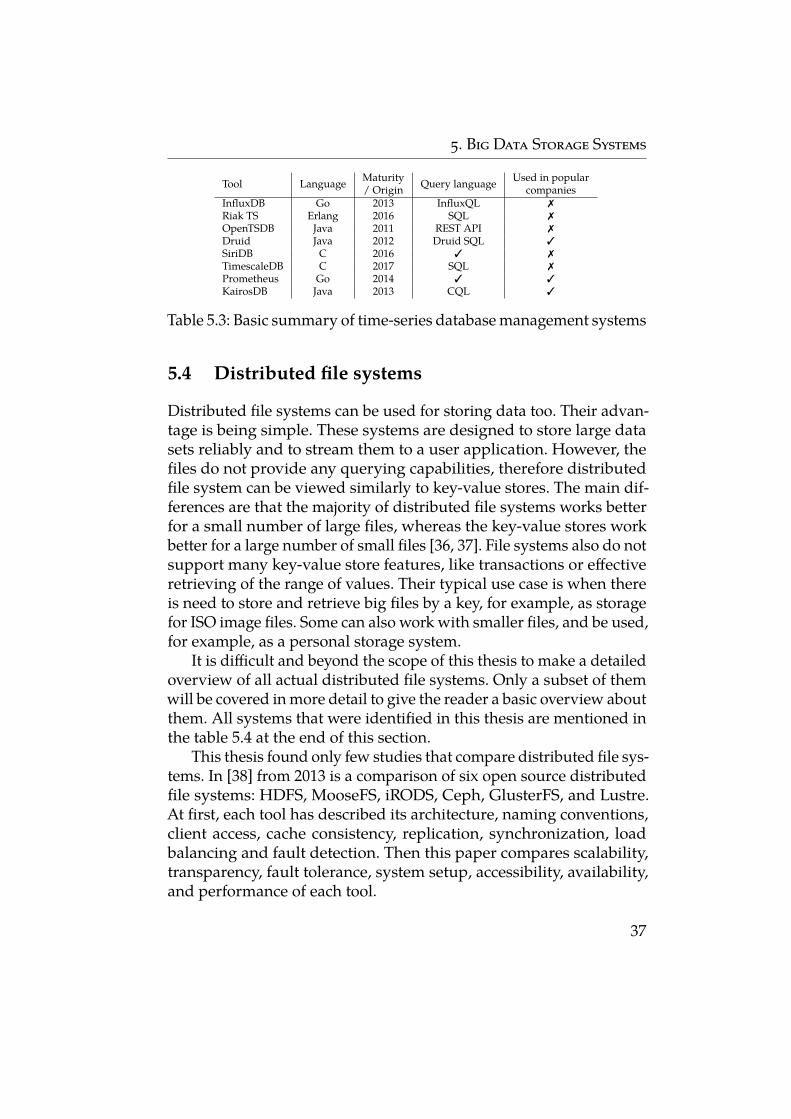
Table 5.3 shows the summary of important factors that were iden-tified in this thesis for each time-series database management systemthat was discovered. As can be seen, most of these tools are only fewyears old, and all of them provides a query language. For other factors,like performance, and scalability, the following research should beaccompanied by relevant benchmarks between those tools.
40. https://kairosdb.github.io/
36
5. Big Data Storage Systems
Tool Language Maturity/ Origin Query language Used in popular
companiesInfluxDB Go 2013 InfluxQL 7Riak TS Erlang 2016 SQL 7OpenTSDB Java 2011 REST API 7Druid Java 2012 Druid SQL 3SiriDB C 2016 3 7TimescaleDB C 2017 SQL 7Prometheus Go 2014 3 3KairosDB Java 2013 CQL 3
Table 5.3: Basic summary of time-series database management systems
5.4 Distributed file systems
Distributed file systems can be used for storing data too. Their advan-tage is being simple. These systems are designed to store large datasets reliably and to stream them to a user application. However, thefiles do not provide any querying capabilities, therefore distributedfile system can be viewed similarly to key-value stores. The main dif-ferences are that the majority of distributed file systems works betterfor a small number of large files, whereas the key-value stores workbetter for a large number of small files [36, 37]. File systems also do notsupport many key-value store features, like transactions or effectiveretrieving of the range of values. Their typical use case is when thereis need to store and retrieve big files by a key, for example, as storagefor ISO image files. Some can also work with smaller files, and be used,for example, as a personal storage system.
It is difficult and beyond the scope of this thesis to make a detailedoverview of all actual distributed file systems. Only a subset of themwill be covered in more detail to give the reader a basic overview aboutthem. All systems that were identified in this thesis are mentioned inthe table 5.4 at the end of this section.
This thesis found only few studies that compare distributed file sys-tems. In [38] from 2013 is a comparison of six open source distributedfile systems: HDFS, MooseFS, iRODS, Ceph, GlusterFS, and Lustre.At first, each tool has described its architecture, naming conventions,client access, cache consistency, replication, synchronization, loadbalancing and fault detection. Then this paper compares scalability,transparency, fault tolerance, system setup, accessibility, availability,and performance of each tool.
37
5. Big Data Storage Systems
A year later, this survey [39] talks about the issues in designing ofdistributed file systems, reviews the taxonomy and makes an overviewof four distributed file systems, from which the only one is open source.
In 2015, Cern published a paper [40] that states how are distributedfile systems used, how has their architecture evolved, what are therelevant techniques in distributed file systems and what are the futurechallenges.
5.4.1 Hadoop Distributed File System
The most popular open source distributed file system is Hadoop Dis-tributed File System41 (HDFS). It was created in 2006 as a part ofApache Hadoop, written in Java. Originally, it was mostly supportedby Yahoo! company [41]. Nowadays, many popular companies42 sup-port Apache Hadoop, for example, Cloudera and Hortonworks.
It has the master-slave architecture [41], where NameNode is mas-ter and DataNodes are slaves. HDFS can detect server failures andrecover automatically.
Many other distributed file systems have similar features to HDFSand have little differences in their usage. For example, Quantcast FileSystem (QFS) was designed as an alternative to HDFS, written in Cand C++, to achieve better performance. This benchmark [42] from2012 states that QFS is faster at writing and reading. HDFS is designedmostly for batch processing, so it aims for high throughput instead oflow latency [43].
HDFS is used, for example, by Yahoo!, Facebook, Twitter, LinkedIn,and Ebay.
5.4.2 SeaweedFS
SeaweedFS43 was created in 2011, and written in Go. It was designedto be fast and simple in usage. It is not POSIX compliant. Although itcan deal with large files, it was designed to handle smaller ones.
SeaweedFS is used by SANMS, Techbay, and ZTO Express.
41. http://hadoop.apache.org/42. https://wiki.apache.org/hadoop/Support43. https://github.com/chrislusf/seaweedfs
38
5. Big Data Storage Systems
5.4.3 Perkeep
Perkeep44 was formerly known as Camlistore, which was created in2011. It is written in Go and JavaScript.
This tool was designed as a reliable personal storage system thatcan store data for a lifetime of the user. Perkeep can store any data andsupports searching, visualization, and sharing of them.
5.4.4 Summary
Distributed file systems are used for storing files that can be distributedacross several servers. They provide reliability but not querying. Ontop of them, many databases can be built.
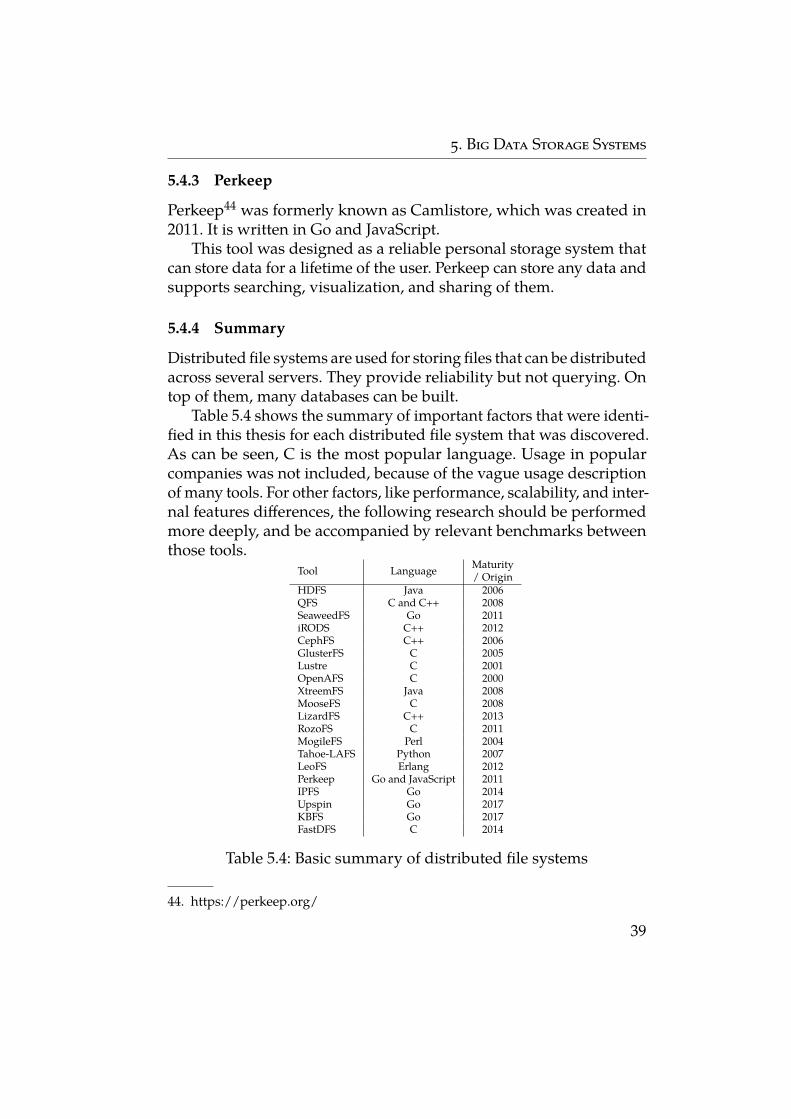
Table 5.4 shows the summary of important factors that were identi-fied in this thesis for each distributed file system that was discovered.As can be seen, C is the most popular language. Usage in popularcompanies was not included, because of the vague usage descriptionof many tools. For other factors, like performance, scalability, and inter-nal features differences, the following research should be performedmore deeply, and be accompanied by relevant benchmarks betweenthose tools.
Tool Language Maturity/ Origin
HDFS Java 2006QFS C and C++ 2008SeaweedFS Go 2011iRODS C++ 2012CephFS C++ 2006GlusterFS C 2005Lustre C 2001OpenAFS C 2000XtreemFS Java 2008MooseFS C 2008LizardFS C++ 2013RozoFS C 2011MogileFS Perl 2004Tahoe-LAFS Python 2007LeoFS Erlang 2012Perkeep Go and JavaScript 2011IPFS Go 2014Upspin Go 2017KBFS Go 2017FastDFS C 2014
Table 5.4: Basic summary of distributed file systems
44. https://perkeep.org/
39

6 Big Data Processing Systems
This chapter classifies available Big Data processing options into groups.Every group is described, including the typical use cases, where thetools from it can be used. Then in each group, there is an overviewof its most popular open source tools. The base structure of the toolreview is:
1. basic information (creation date, implementation language, de-velopers),
2. important internal or external features which affect the usabil-ity,
3. suggested special use cases,
4. companies that use this tool.
If some property of the specific tool was not identified, it is omittedin the text. At the end of this chapter, a table can be found. This tablecontains the summary of important factors that were identified in thisthesis for each tool.
6.1 Batch processing systems
Batch processing systems process the data in tasks which can runwithout the user interaction. Typically, they are performed on largestatic data, called a batch, and can run a significant time [44].
6.1.1 Apache Hadoop MapReduce
Hadoop MapReduce1 was created in 2006 as a part of Apache Hadoop,written in Java. Originally, it was mostly supported by Yahoo! com-pany [41]. Nowadays, many popular companies2 support ApacheHadoop, for example, Cloudera and Hortonworks.
1. http://hadoop.apache.org/2. https://wiki.apache.org/hadoop/Support
41

6. Big Data Processing Systems
It uses MapReduce programming model, which was designed forscalable parallel applications to process a large amount of data. Itsmain advantage is that it can run in parallel on any number of serversand also can be re-executed if a server crashes [45].
MapReduce takes key-value pairs as an input and returns key-value pairs as an output. The computation is expressed by the imple-mentation of Map and Reduce function. Map takes a set of key-valuepairs and produces another set of key-value pairs, based on requiredfunctionality. Then this output is grouped by the key and passed toReduce as a set of key-value pairs where the value consists of the set ofvalues. Reduce takes this as an input and merges the values, based onrequired functionality. This process results in a set of key-value pairs.
Hadoop MapReduce implementation, written in Scala, that takesa set of id-word pairs and returns the set of word-frequency pairs thatstates, how many of each word was in the input, looks like this:
class WordCountMapper extends Mapper [Object ,Text ,Text , IntWritable ]{
overridedef map(key:Object , value :Text ,
context : Mapper [Object ,Text ,Text , IntWritable ]# Context ) ={
value . toString (). split ("\\W+").map(word => context . write (new Text(word), new IntWritable (1)))
}}
class WordCountReducer extends Reducer [Text , IntWritable ,Text , IntWritable ]{
overridedef reduce (key:Text , values :java.lang. Iterable [ IntWritable ],
context : Reducer [Text , IntWritable ,Text , IntWritable ]# Context ) ={
val sum = values . foldLeft (0) { (t,i) => t + i.get }context . write (key , new IntWritable (sum ))
}}
The disadvantage of this programming model is that the output ofeach Map and Reduce has to be stored in the local file system before thecomputation may continue. This process grants fault-tolerance, but itdramatically affects performance. It results in significant ineffective-ness, for example, in join operations, iterative processing, and streamprocessing. The problem is also the dataflow process. Tasks often haveto be non-trivially reimplemented, because of their different dataflow,
42
6. Big Data Processing Systems
for example, join tasks. Also, each operation has to be written in thismanner which may affect reusability of the code [46].
Because of the performance limitations, Hadoop MapReduce ismostly used in batch processing with not many iterations and relation-ships in data. Many popular companies use it, for example, Yahoo!,IBM, Facebook, Twitter, LinkedIn, Spotify, Adobe, and Ebay.
6.1.2 Alternatives
Different open source Big Data tools can be used in batch processing.However all found tools are specialized in a specific usage, thereforeare introduced in other categories.
6.2 Stream processing systems
Stream processing systems process the flowing streams of data, possi-ble from multiple data sources. These systems are typically deployedas running tasks that run until cancelation. They can be used, forexample, in monitoring, smart device applications, and machine learn-ing [47]. Typically, the stream processing tool process much smallerdata than the batch processing system. However, in this case, thelatency is more important.
6.2.1 Apache Storm
Apache Storm3 is a distributed real-time computation system that wascreated in 2011. It is written in Java.
Storm works with streams of data as an infinite sequence of tuples.They can also be processed in parallel. The logic of the application isrepresented as Storm topology, which is a graph of spouts and bolts.Spouts are sources of streams, and bolts are processing units that takestreams as input, and, after processing, can emit multiple streams asan output.
So to implement a Storm application that would take, for example,Twitter posts and return the set of word-frequency pairs that states,
3. http://storm.apache.org/
43
6. Big Data Processing Systems
how many of each word have been used in that posts, these stepsshould be done in order:
1. create a spout that periodically takes Twitter posts and emitsthe stream of text from those posts that were created per time,
2. create a bolt that takes this text of posts, splits it into words,and emits them,
3. create a bolt that takes these words, does a word count on them,and emits the result.
The code sample is not shown because of its complexity.Storm is used, for example, by Yahoo!, Twitter, Spotify, Cerner, and
Groupon.
6.2.2 Alternatives
Other open source Big Data tools are designed for stream processing.Apache Samza4 can be used in the same set of use cases as Storm.Apache Gearpump5 is better in IoT use cases, and in use cases, thatneeds to upgrade the running application without interruption. Rie-mann6 is an event system with a robust stream processing language.There are also tools that were designed as a replacement for Storm,such as Apache Heron7 and JStorm8. They are both backward com-patible with Storm.
The general-purpose processing systems are also designed forstream processing. They are described in section 6.5.
6.3 Graph processing systems
Graph processing systems were designed to solve the performanceproblems of MapReduce on graph datasets. Many graph algorithmsare iterative and require complex joins of data, which are HadoopMapReduce’s weaknesses [46].
4. http://samza.apache.org/5. https://gearpump.apache.org/6. http://riemann.io/7. http://incubator.apache.org/projects/heron.html8. http://jstorm.io/
44
6. Big Data Processing Systems
6.3.1 Apache Giraph
Apache Giraph9 was created in 2012 by Yahoo!, written in Java. It isdesigned for batch processing of large graph data, and runs on thetop of Apache Hadoop, using MapReduce.
Giraph uses Bulk Synchronous Parallel (BSP) programming model.This model uses message-passing interface (MPI) to support scalabilityand parallelism across multiple servers. In BSP programming model,all algorithms are implemented from the point of view of a vertex. Thecomputation is represented as a sequence of supersteps, where eachsuperstep defines what each used vertex has to do. It can, for example,send a message to another vertex, change its state to inactive, andexecute a function. Supersteps run synchronously one after another. Ifthe vertex is inactive, it does not perform computing, but it can becomeactive by receiving a message from another vertex. The program endswhen all vertices are set to inactive.
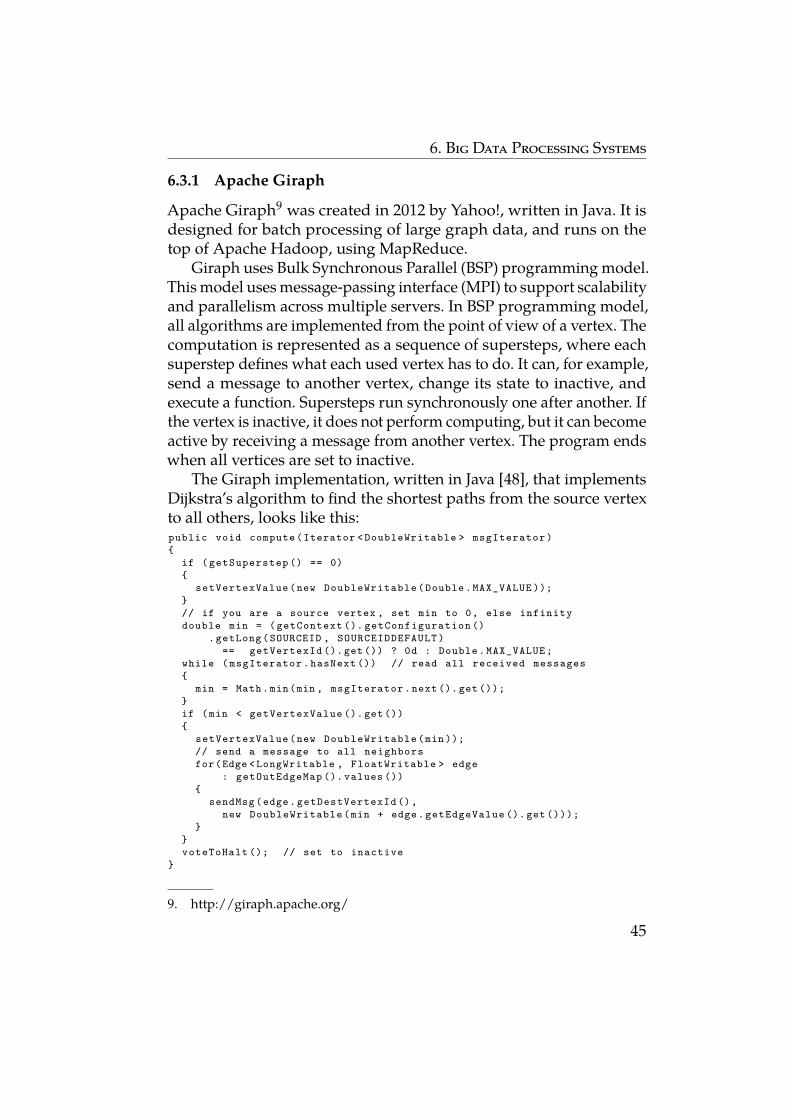
The Giraph implementation, written in Java [48], that implementsDijkstra’s algorithm to find the shortest paths from the source vertexto all others, looks like this:public void compute (Iterator < DoubleWritable > msgIterator ){
if ( getSuperstep () == 0){
setVertexValue (new DoubleWritable ( Double . MAX_VALUE ));}// if you are a source vertex , set min to 0, else infinitydouble min = ( getContext (). getConfiguration ()
. getLong (SOURCEID , SOURCEIDDEFAULT )== getVertexId (). get ()) ? 0d : Double . MAX_VALUE ;
while ( msgIterator . hasNext ()) // read all received messages{
min = Math.min(min , msgIterator .next (). get ());}if (min < getVertexValue (). get ()){
setVertexValue (new DoubleWritable (min ));// send a message to all neighborsfor(Edge < LongWritable , FloatWritable > edge
: getOutEdgeMap (). values ()){
sendMsg (edge. getDestVertexId (),new DoubleWritable (min + edge. getEdgeValue (). get ()));
}}voteToHalt (); // set to inactive
}
9. http://giraph.apache.org/
45
6. Big Data Processing Systems
Giraph is used, for example, by Facebook, Zynga, and The ApacheSoftware Foundation.
6.3.2 Alternatives
Apache Hama10 is a tool that also uses BSP computing model. How-ever, it was designed more generally, not only on graph problems.
The real-time graph processing is providing, for example, a graphprocessing library GraphJet11, which is used as a recommendationsystem in Twitter [49].
The general-purpose processing systems are also designed forgraph processing. They are described in section 6.5.
6.4 High-level representation tools
High-level representation tools are designed to simplify the program-ming in a specific set of tools. The task can be written in a high-levelprogramming language, leaving the optimizations to backend engine.This programming language can improve code reusability, maintain-ability, and allows to implement otherwise non-trivial tasks morequickly, for example, joins in Hadoop MapReduce [46]. However, high-level representation tools can be used only on data with a structure.
6.4.1 Apache Hive
Apache Hive12 is a high-level representation tool, that was created in2009 by Facebook. It is written in Java.
It runs on top of Hadoop and allows to access data with queryinglanguage HiveQL. The query in this language is afterward compiledinto MapReduce. Hive can also be used on the top of some othertechnologies, like HBase database. The query, which returns the set ofword-frequency pairs that states, how many users are from each city,looks like this:
10. https://hama.apache.org/11. https://github.com/twitter/GraphJet12. https://hive.apache.org/
46
6. Big Data Processing Systems
SELECT word , count (1) AS count FROM(SELECT explode (split(cities , ’ ’))
AS word FROM users) tempUsersGROUP BY word
Hive is used, for example, by Facebook, RocketFuel, and Groove-shark.
6.4.2 Apache Pig
Apache Pig13 was created in 2008 by Yahoo! company. It is written inJava.
Pig provides a dataflow programming environment, which can beused on the top of Hadoop MapReduce. It can be used in situations,where the programmer does not want to rely on SQL query optimizerbut want to have greater control over the task. It uses a Pig Latin lan-guage. The program consists of the sequence of operations, where eachoperation represents a single data transformation, for example, join,filter, map, or reduce. Then it is compiled to a sequence of MapReducetasks. The program, which returns the set of word-frequency pairsthat states, how many users are from each city, looks like this:input = LOAD ’/users/cities.txt ’
AS( sentence : Chararray );words = FOREACH input
GENERATE FLATTEN ( TOKENIZE (line ,’ ’)) AS word;grouped = GROUP words BY word;result = FOREACH grouped
GENERATE group , COUNT(words );
Pig is used, for example, by Twitter, MITRE, and LinkedIn.
6.4.3 Summingbird
Summingbird is a library, created in 2013 by Twitter. It is written inScala.
Summingbird provides writing programs as native Scala or Javacollection transformations. These programs can be then executed in
13. https://pig.apache.org/
47
6. Big Data Processing Systems
some batch and stream processing tools, for example, batch processingHadoop MapReduce and stream processing Storm. This option helpsin hybrid systems that use both of these types of technologies for thesame workflow, so the logic of processing is not necessary to write intwo different languages. The program, written in Scala, which returnsthe set of word-frequency pairs that states, how many of each wordwas in the input, looks like this [50]:def wordCount [P <: Platform [P]]
(source: Producer [P, String],store: P#Store[String , Long ]) =
source. flatMap{
sentence => toWords ( sentence ). map(_ -> 1L)}. sumByKey (store)
6.4.4 Alternatives
Many other high-level representation tools are designed for the betterperformance of SQL approach. Tools like, Apache Impala14, Presto15,and Apache Phoenix16 provide similar SQL query language as Hive.However, they do not compile its language to Hadoop MapReduce.Instead, they use its own optimized engine to increase the task perfor-mance.
Apache Drill17 is a tool that supports standard SQL, and providesusers to query semi-structured data directly. It supports more typesof data sources, for example, MongoDB, and cloud storages.
As an alternative to non-SQL high-level representation tools, thereis Cascading18, which provides Java API which can be used to defineworkflows on the top of various tools, for example, Apache Hadoop,and general-purpose Apache Flink. There are many extensions toCascading that extends it with features of other languages, like Clojure,Scala, and Python19.
14. https://impala.apache.org/15. https://prestodb.io/16. https://phoenix.apache.org/17. https://drill.apache.org/18. http://www.cascading.org/projects/cascading/19. http://www.cascading.org/extensions/
48

6. Big Data Processing Systems
There is also Apache Beam20, that provides a unified programmingmodel that can be used for batch and stream processing, and can be runon multiple systems, for example, Gearpump, and general-purposeApache Apex, Apache Flink, and Apache Spark. It has ambitions tounify all data processing systems under one API.
The general-purpose processing systems also support built-in high-level representation languages. They are described in section 6.5.
6.5 General-purpose processing systems
General-purpose processing systems were designed for many typesof data processing scenarios. They shine in complex problems whenthere is a need to use multiple types of processing systems, but thedesire to maintain only one.
6.5.1 Apache Spark
Apache Spark21 was created in 2009 by AMPLab at UC Berkeley22. Itis written in Scala.
Spark improves the performance of Hadoop MapReduce by load-ing the data in distributed memory. It uses the Resilient DistributedDatasets (RDD), which represents a collection of data. Each RDD canbe transformed by functions that process each element in this collec-tion and returns a new RDD with transformed elements. Spark usesa lazy mechanism that loads the data into a memory and processesthem only after an Action function is called, for example, First, thatreturns the first element of the RDD, or Count, which returns the num-ber of elements in the RDD. Used RDD can be cached in memoryfor following operations, so Spark performs very well in iterative usecases.
The implementation, written in Scala, that takes a text file andreturns the set of word-frequency pairs that states, how many of eachword was in the input, looks like this:
20. https://beam.apache.org/21. https://spark.apache.org/22. https://amplab.cs.berkeley.edu/
49
6. Big Data Processing Systems
val counts = textFile. flatMap (_.split ("\\W+")).map(_, 1). reduceByKey (_ + _)
Spark provides many libraries that enhance its capabilities. SparkSQL is a high-level representation tool that allows using SQL querying.Spark can use GraphX for graph processing, and Spark Streaming forstream processing. All those libraries can be combined for a complexproblem.
Spark is used, for example, by eBay, Autodesk, Amazon, and Shopify.
6.5.2 Apache Flink
Apache Flink23, originally called Stratosphere, was created in 2009 byTechnical University of Berlin. It is written in Java.
It was designed as a general-purpose tool that is specialized instream processing. It treats batch processing as a special case of streamprocessing of fixed data. Flink uses the Parallelization Contracts (PACTs)programming model [51]. One PACT contains one second-order func-tion, named Input Contract, that contains one or more datasets as input,and first-order function that should process the input. PACT can alsocontain an optional Output Contract, which contains specific character-istics of the output data, which can be important to the compiler. Theprogram can contain multiple PACTs that are attached in a specificsequence.
The implementation, written in Scala, that takes a text file andreturns the set of word-frequency pairs that states, how many of eachword was in the input, looks like this:
val counts = textFile. flatMap (_.split ("\\W+")).map(_, 1). groupBy (0).sum (1)
23. https://flink.apache.org/
50
6. Big Data Processing Systems
Flink also provides several libraries that allow Flink additionalfuncionalities. Table provides SQL querying, and Gelly is used forgraph processing.
Flink is used, for example, by Uber, Zalando, King, and Mux.
6.5.3 Alternatives
Other open source Big Data tools, that can be categorized into general-purpose processing systems are younger, for example, Apache Apex24
and Onyx25.
6.6 Summary
Processing systems can be categorized into five categories, based onthe type of processing:
∙ batch processing systems that are focused on the analysis oftypically large, static data,
∙ stream processing systems that are focused on the analysis offlowing streams of data,
∙ graph processing systems that are focused on the analysis ofgraph data,
∙ high-level representation tools that are designed to provide ahigh-level programming language on top of other technologies,
∙ general-purpose processing systems that are focused on theanalysis of complex problems that would otherwise need mul-tiple processing tools.
Table 6.1 shows the summary of important factors that were iden-tified in this thesis for each processing system that was discovered.As can be seen, Java is the most popular language. Also, each of thesetools is being used in popular companies. For other factors, like perfor-mance, and scalability, the following research should be accompaniedby relevant benchmarks between those tools.
24. https://apex.apache.org/25. http://www.onyxplatform.org/
51
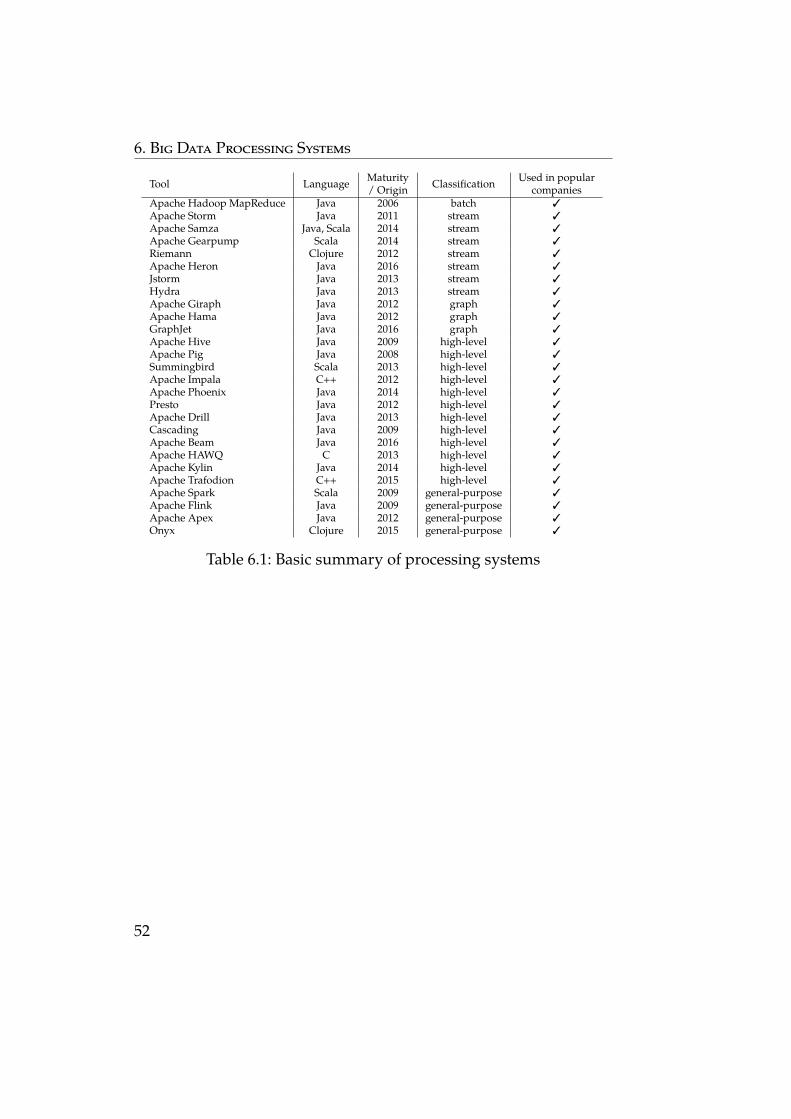
6. Big Data Processing Systems
Tool Language Maturity/ Origin Classification Used in popular
companiesApache Hadoop MapReduce Java 2006 batch 3Apache Storm Java 2011 stream 3Apache Samza Java, Scala 2014 stream 3Apache Gearpump Scala 2014 stream 3Riemann Clojure 2012 stream 3Apache Heron Java 2016 stream 3Jstorm Java 2013 stream 3Hydra Java 2013 stream 3Apache Giraph Java 2012 graph 3Apache Hama Java 2012 graph 3GraphJet Java 2016 graph 3Apache Hive Java 2009 high-level 3Apache Pig Java 2008 high-level 3Summingbird Scala 2013 high-level 3Apache Impala C++ 2012 high-level 3Apache Phoenix Java 2014 high-level 3Presto Java 2012 high-level 3Apache Drill Java 2013 high-level 3Cascading Java 2009 high-level 3Apache Beam Java 2016 high-level 3Apache HAWQ C 2013 high-level 3Apache Kylin Java 2014 high-level 3Apache Trafodion C++ 2015 high-level 3Apache Spark Scala 2009 general-purpose 3Apache Flink Java 2009 general-purpose 3Apache Apex Java 2012 general-purpose 3Onyx Clojure 2015 general-purpose 3
Table 6.1: Basic summary of processing systems
52
7 Tool Selection Diagram
This chapter contains the initial version Big Data open source tool se-lection diagram, which was created based on the knowledge acquiredin this thesis. In the future, the diagram is expected to be updated bythe further research, results of relevant benchmarks, and extended byother categories from the proposed architecture.
This diagram can be used to determine the solution to a given BigData problem. It is designed as the activity diagram with decisionand action nodes. The user can traverse the diagram, and based onthe guard conditions can get to an activity. Each activity representsthe selection of one of the mentioned tools. The guard conditions ineach decision node are not mutually exclusive, so the user can end upwith a set of tools that has to be used as a solution to his problem.
Tests need to be implemented to validate this diagram. In thisthesis, two examples of tests are proposed and then implemented bycomparing the relevant results of the solution using a tool that waschosen by a diagram and the solution using another tool. This toolwas chosen as a popular alternative that may seem suitable and usablefor the given problem. To implement these tests precisely, and validatea specific use case selection, the tester should compare the results ofthe tool chosen by the diagram with the results of every other tool.
In this thesis, the proposed tests are written in PHP language. Theirsource code can found in the attachment.
53
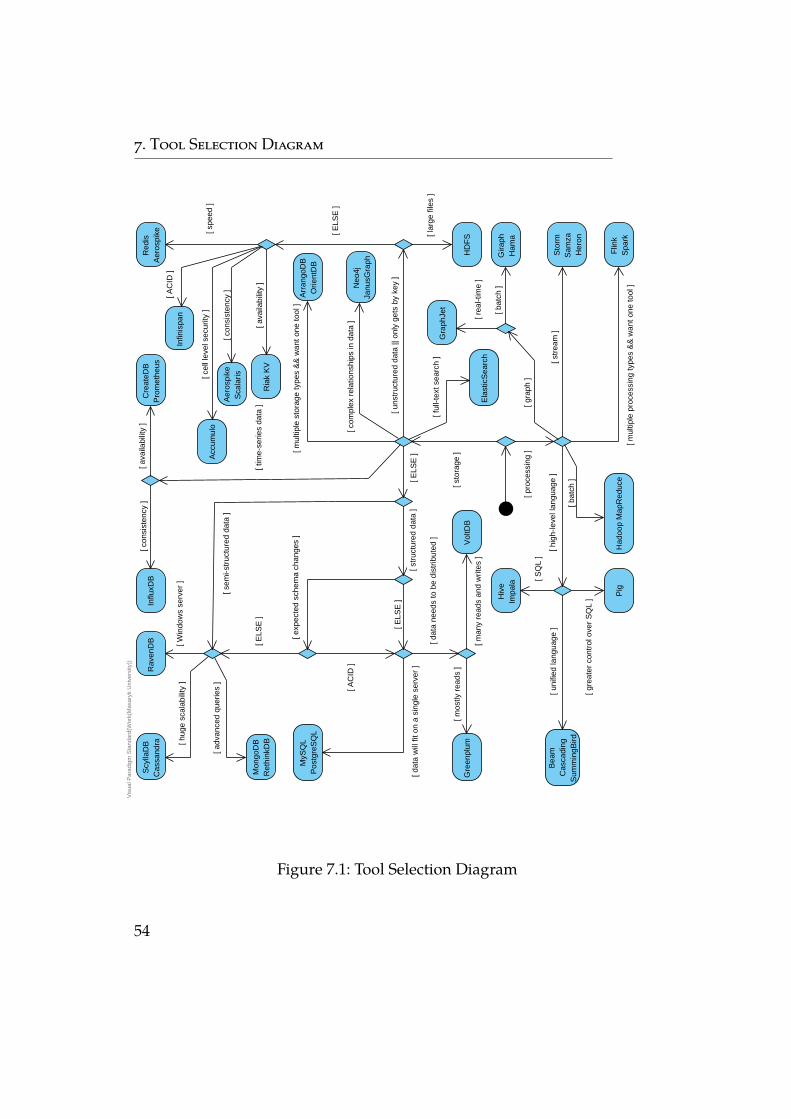
7. Tool Selection Diagram
Hiv
eIm
pala
Bea
mC
asca
ding
Sum
min
gBird
Pig
Gra
phJe
t
Gira
phH
ama
Had
oop
Map
Red
uce
Sto
rmS
amza
Her
on
Flin
kS
park
MyS
QL
Pos
tgre
SQ
L
Gre
enpl
umV
oltD
B
Rav
enD
BS
cylla
DB
Cas
sand
ra
Mon
goD
BR
ethi
nkD
B
HD
FS
Ela
stic
Sea
rch
Neo
4jJa
nusG
raph
Arr
ango
DB
Orie
ntD
B
Influ
xDB
Cre
ateD
BP
rom
ethe
us
Ria
k K
V
Aer
ospi
keS
cala
ris
Acc
umul
o
Infin
ispa
n
Red
isA
eros
pike [ s
peed
]
[ AC
ID ]
[ cel
l lev
el s
ecur
ity ]
[ con
sist
ency
]
[ ava
ilabi
lity
]
[ ELS
E ]
[ ava
ilabi
lity
][ c
onsi
sten
cy ]
[ mul
tiple
sto
rage
type
s &
& w
ant o
ne to
ol ]
[ tim
e-se
ries
data
]
[ com
plex
rel
atio
nshi
ps in
dat
a ]
[ ful
l-tex
t sea
rch
][ l
arge
file
s ]
[ uns
truc
ture
d da
ta ||
onl
y ge
ts b
y ke
y ]
[ AC
ID ]
[ ELS
E ]
[ exp
ecte
d sc
hem
a ch
ange
s ]
[ adv
ance
d qu
erie
s ]
[ hug
e sc
alab
ility
][ W
indo
ws
serv
er ]
[ sem
i-str
uctu
red
data
]
[ man
y re
ads
and
writ
es ]
[ mos
tly r
eads
]
[ dat
a ne
eds
to b
e di
strib
uted
]
[ dat
a w
ill fi
t on
a si
ngle
ser
ver
]
[ ELS
E ]
[ str
uctu
red
data
][ E
LSE
]
[ sto
rage
]
[ mul
tiple
pro
cess
ing
type
s &
& w
ant o
ne to
ol ]
[ str
eam
]
[ bat
ch ]
[ bat
ch ]
[ rea
l-tim
e ]
[ gra
ph ]
[ gre
ater
con
trol
ove
r S
QL
]
[ uni
fied
lang
uage
]
[ SQ
L ]
[ hig
h-le
vel l
angu
age
]
[ pro
cess
ing
]
Vis
ual P
arad
igm
Sta
ndar
d(W
ork(
Mas
aryk
Uni
vers
ity))
Figure 7.1: Tool Selection Diagram
54
7. Tool Selection Diagram
7.1 Validation
The chosen data for validation of proposed diagram hold the informa-tion about the traffic in Plzeň region in 20151. After decompression,their size is 19.98 GB, and they consist of 272,658,647 records. Thosedata are structured and stored in CSV file. To work with this file, I hadto make these transformations:
∙ putting the header from the documentation into the first lineof CSV file so that the tools can obtain the names of the fields,
∙ substituting the vertical bar separator for the comma, becauseMongoDB does not allow to specify separator for CSV import-ing, and the import does not work with a vertical bar as a sepa-rator,
∙ substituting the empty string (1, "", 2) for null (1, , 2), becauseMongoDB’s CSV parser accepts only the data that complieswith RFC 41802, therefore it treats double quotes as an escapedquote [52].
To illustrate the structure of this data, the first fifty records from thistransformed file were put in the attachment.
The proposed diagram has been tested in two different problems:a simple analysis of the whole dataset and a repeated storing andgetting random records of a small subset of the dataset. In both tests,the measurements of results were performed five times. From them,the average values were computed and compared.
First test The first test was a basic analysis of the whole dataset. Inthis test, the desired output from a database is all dates when thedetected vehicle had the speed of 44 km/h. For this problem, thediagram recommends using a traditional RDBMS, so MySQL waschosen. Its analysis time is compared with a document store MongoDB.The results from the table 7.1 show that for querying a structured datathat fit on a single server, MySql is faster than MongoDB.
1. http://doprava.plzensky-kraj.cz/opendata/doprava/rok/2. https://tools.ietf.org/html/rfc4180
55
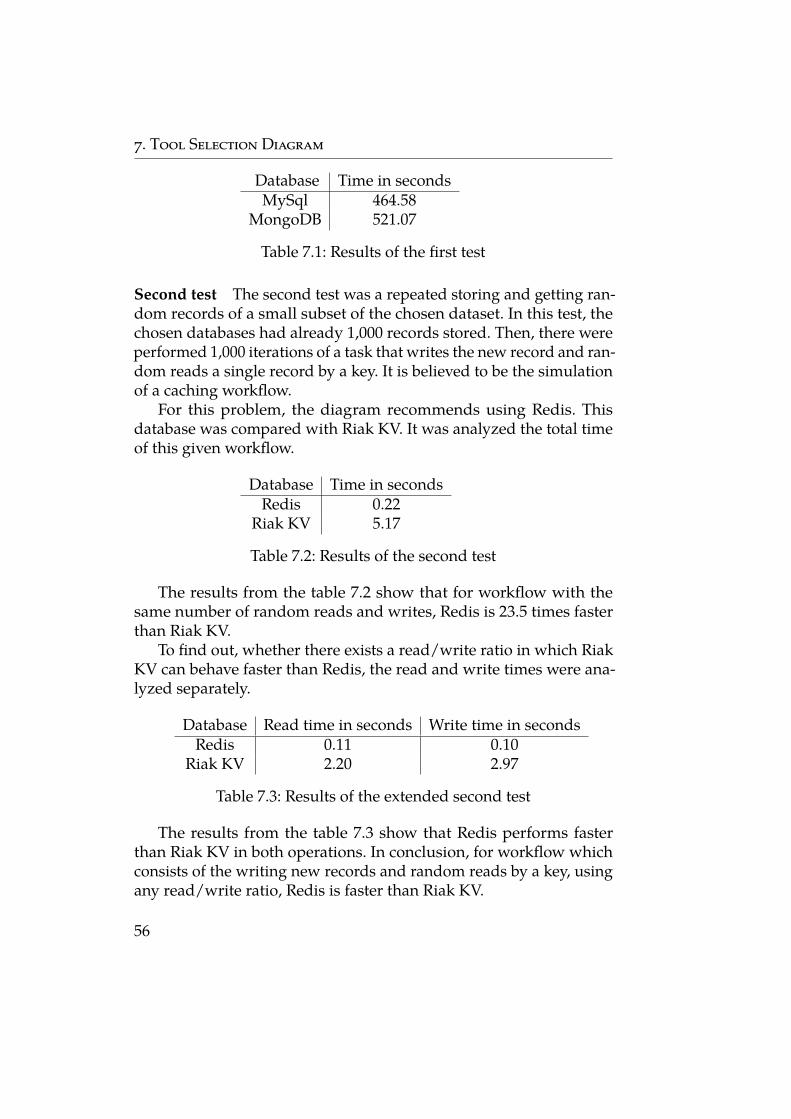
7. Tool Selection Diagram
Database Time in secondsMySql 464.58
MongoDB 521.07
Table 7.1: Results of the first test
Second test The second test was a repeated storing and getting ran-dom records of a small subset of the chosen dataset. In this test, thechosen databases had already 1,000 records stored. Then, there wereperformed 1,000 iterations of a task that writes the new record and ran-dom reads a single record by a key. It is believed to be the simulationof a caching workflow.
For this problem, the diagram recommends using Redis. Thisdatabase was compared with Riak KV. It was analyzed the total timeof this given workflow.
Database Time in secondsRedis 0.22
Riak KV 5.17
Table 7.2: Results of the second test
The results from the table 7.2 show that for workflow with thesame number of random reads and writes, Redis is 23.5 times fasterthan Riak KV.
To find out, whether there exists a read/write ratio in which RiakKV can behave faster than Redis, the read and write times were ana-lyzed separately.
Database Read time in seconds Write time in secondsRedis 0.11 0.10
Riak KV 2.20 2.97
Table 7.3: Results of the extended second test
The results from the table 7.3 show that Redis performs fasterthan Riak KV in both operations. In conclusion, for workflow whichconsists of the writing new records and random reads by a key, usingany read/write ratio, Redis is faster than Riak KV.
56
8 Attachments
To the electronic version of the thesis were attached the following files:
∙ BigDataToolsTestings.zip: The complete set of source files ofthe testings performed in this thesis.
∙ PlzenData.csv: The first fifty records from the used transformedfile in the CSV format.
∙ lshwOutput.html: The hardware specification of the server thatwas used for testing.
57

9 Conclusion
This thesis was focused on the design of a Big Data tool selectiondiagram, which can help to choose the right tools for a given Big Dataproblem. The thesis included the tool classification into componentsand proposed the Big Data tool architecture for a general Big Dataproblem, which illustrates the communication between them.
The storage and processing components were chosen, and theoverview of the actual Big Data tools from these components wasmade. This overview further classified the tools, presented their typicaluse cases, and described the identified tools in more detail. It alsoproposed the relevant factors of these tools, which can help to choosebetween them.
Based on the knowledge gained from this overview, the initialversion of the Big Data tool selection diagram was created. At thetime of writing this thesis, it contains the storage and processing tools.However, it is expected to be extended in the future.
It the end, the thesis proposed the process of diagram validationand provided a set of tests as examples. They compared the relevantresults of the solution of a specific problem using a tool that waschosen by a diagram and the solution using another tool.
9.1 Future directions
As this thesis initiates a longer project that is to be continued, thereare numerous directions for future work.
∙ The analysis of other categories from the proposed architecturecan improve the knowledge of open source tools that were notcovered in this thesis. This overview can help with the choosingof the right tool from other categories and may result in theextension of the tool selection diagram.
∙ The improvement of the current tool selection diagram is alsopossible. There is a need to validate each transition in it by usingtests that would compare the relevant results of the solutionusing a tool that was chosen by diagram and all other tools.
59
9. Conclusion
This process can result in a more detailed diagram, with moreoptions and transitions. However, it can also reduce their num-ber, because of possible low results of some tools against theothers in the same category. In this case, such tools would bediscarded.
∙ Because the changes in this domain are still quite frequent,there is also a need to make surveys of storage and processingtools again in the future. This thesis makes newer surveys fromthose categories easier because they can check the updates intools stated here, and then only try to find newly developedtools.
∙ In this thesis, the tools were reviewed mainly by their usability,and the survey was focused practically. Further research can in-clude more technical oriented surveys, that would, for example,compare the details of the implementations of those tools.
60
Bibliography
1. AGRAHARI, Anurag; RAO, Dharmaji. A Review paper on BigData: Technologies, Tools and Trends. International Research Jour-nal of Engineering and Technology (IRJET). 2017, vol. 4, pp. 640–649. ISSN 2395-0056. Available also from: https://irjet.net/archives/V4/i10/IRJET-V4I10112.pdf.
2. DEMCHENKO, Y.; GROSSO, P.; LAAT, C. de; MEMBREY, P. Ad-dressing big data issues in Scientific Data Infrastructure. In: 2013International Conference on Collaboration Technologies and Systems(CTS). 2013, pp. 48–55. Available from DOI: 10.1109/CTS.2013.6567203.
3. GANDOMI, Amir; HAIDER, Murtaza. Beyond the hype: Big dataconcepts, methods, and analytics. International Journal of Informa-tion Management. 2015, vol. 35, no. 2, pp. 138. ISSN 0268-4012.Available from DOI: https://doi.org/10.1016/j.ijinfomgt.2014.10.007.
4. How Much Data Is Created on the Internet Each Day? [online] [vis-ited on 2018-05-11]. Available from: https://dzone.com/articles/how-much-data-is-created-on-the-internet-each-day.
5. DEMCHENKO, Y.; LAAT, C. de; MEMBREY, P. Defining architec-ture components of the Big Data Ecosystem. In: 2014 InternationalConference on Collaboration Technologies and Systems (CTS). 2014,pp. 104–112. Available from DOI: 10.1109/CTS.2014.6867550.
6. Understanding Big Data: The Seven V’s [online] [visited on 2018-05-18]. Available from: http://dataconomy.com/2014/05/seven-vs-big-data/.
7. The 10 Vs of Big Data [online] [visited on 2018-05-18]. Availablefrom: https://tdwi.org/articles/2017/02/08/10-vs-of-big-data.aspx.
8. Top 10 Big Data Challenges – A Serious Look at 10 Big Data V’s [on-line] [visited on 2018-05-18]. Available from: https://mapr.com/blog/top-10-big-data-challenges-serious-look-10-big-data-vs/.
61
BIBLIOGRAPHY
9. The 42 V’s of Big Data and Data Science [online] [visited on 2018-05-18]. Available from: https://www.elderresearch.com/blog/42-v-of-big-data.
10. SINGH, Dilpreet; REDDY, Chandan K. A survey on platformsfor big data analytics. Journal of Big Data. 2014, vol. 2, no. 1, pp.3–4. ISSN 2196-1115. Available from DOI: 10.1186/s40537-014-0008-6.
11. SADALAGE, P.J.; FOWLER, M. NoSQL Distilled: A Brief Guideto the Emerging World of Polyglot Persistence. In: Pearson Edu-cation, 2012, chap. 4, pp. 37–45. ISBN 9780133036121.
12. SADALAGE, P.J.; FOWLER, M. NoSQL Distilled: A Brief Guideto the Emerging World of Polyglot Persistence. In: Pearson Edu-cation, 2012, chap. 5, pp. 47–60. ISBN 9780133036121.
13. Towards Robust Distributed Systems. 2000. Available also from: https://people.eecs.berkeley.edu/~brewer/PODC2000.pdf.
14. GILBERT, Seth; LYNCH, Nancy. Brewer’s Conjecture and the Fea-sibility of Consistent, Available, Partition-tolerant Web Services.SIGACT News. 2002, vol. 33, no. 2, pp. 51–59. ISSN 0163-5700.Available from DOI: 10.1145/564585.564601.
15. BREWER, E. CAP twelve years later: How the "rules" have changed.Computer. 2012, vol. 45, no. 2, pp. 23–29. ISSN 0018-9162. Avail-able from DOI: 10.1109/MC.2012.37.
16. AKIDAU, Tyler et al. The Dataflow Model: A Practical Approachto Balancing Correctness, Latency, and Cost in Massive-scale,Unbounded, Out-of-order Data Processing. Proc. VLDB Endow.2015, vol. 8, no. 12, pp. 1792–1793. ISSN 2150-8097. Availablefrom DOI: 10.14778/2824032.2824076.
17. WANG, Yichuan; KUNG, LeeAnn; BYRD, Terry Anthony. Bigdata analytics: Understanding its capabilities and potential ben-efits for healthcare organizations. Technological Forecasting andSocial Change. 2018, vol. 126, pp. 3–13. ISSN 0040-1625. Availablefrom DOI: https://doi.org/10.1016/j.techfore.2015.12.019.
62

BIBLIOGRAPHY
18. KLEIN, John; BUGLAK, Ross; BLOCKOW, David; WUTTKE,Troy; COOPER, Brenton. A Reference Architecture for Big DataSystems in the National Security Domain. In: Proceedings of the2Nd International Workshop on BIG Data Software Engineering. Austin,Texas: ACM, 2016, pp. 51–57. BIGDSE ’16. ISBN 978-1-4503-4152-3. Available from DOI: 10.1145/2896825.2896834.
19. MARJANI, M.; NASARUDDIN, F.; GANI, A.; KARIM, A.; HASHEM,I. A. T.; SIDDIQA, A.; YAQOOB, I. Big IoT Data Analytics: Ar-chitecture, Opportunities, and Open Research Challenges. IEEEAccess. 2017, vol. 5, pp. 5247–5261. Available from DOI: 10.1109/ACCESS.2017.2689040.
20. NADAL, Sergi; HERRERO, Victor; ROMERO, Oscar; ABELLÓ,Alberto; FRANCH, Xavier; VANSUMMEREN, Stijn; VALERIO,Danilo. A software reference architecture for semantic-aware BigData systems. Information and Software Technology. 2017, vol. 90,pp. 75–92. ISSN 0950-5849. Available from DOI: https://doi.org/10.1016/j.infsof.2017.06.001.
21. SHAH, P.; HIREMATH, D.; CHAUDHARY, S. Big Data AnalyticsArchitecture for Agro Advisory System. In: 2016 IEEE 23rd In-ternational Conference on High Performance Computing Workshops(HiPCW). 2016, pp. 43–49. Available from DOI: 10.1109/HiPCW.2016.015.
22. SARNOVSKY, Martin; BEDNAR, Peter; SMATANA, Miroslav.Big Data Processing and Analytics Platform Architecture for Pro-cess Industry Factories. Big Data and Cognitive Computing. 2018,vol. 2, no. 1. ISSN 2504-2289. Available from DOI: 10 . 3390 /bdcc2010003.
23. PÄÄKKÖNEN, Pekka; PAKKALA, Daniel. Reference Architec-ture and Classification of Technologies, Products and Servicesfor Big Data Systems. Big Data Research. 2015, vol. 2, no. 4, pp.166–186. ISSN 2214-5796. Available from DOI: https://doi.org/10.1016/j.bdr.2015.01.001.
24. GÖKALP, Mert; KAYABAY, Kerem; ZAKI, Mohamed; KOÇY-IĞIT, Altan; ERHAN EREN, P; NEELY, Andy. Big-Data Analyt-ics Architecture for Businesses: a comprehensive review on new open-source big-data tools. 2017.
63

BIBLIOGRAPHY
25. Questioning the Lambda Architecture: The Lambda Architecture hasits merits, but alternatives are worth exploring. [online] [visited on2018-05-18]. Available from: https://www.oreilly.com/ideas/questioning-the-lambda-architecture.
26. Flafka: Big Data Solution for Data Silos [online] [visited on 2018-05-18]. Available from: https://www.datasciencecentral.com/profiles/blogs/6448529:BlogPost:541864.
27. SADALAGE, P.J.; FOWLER, M. NoSQL Distilled: A Brief Guideto the Emerging World of Polyglot Persistence. In: Pearson Edu-cation, 2012, chap. 1, pp. 8–9. ISBN 9780133036121.
28. PAVLO, Andrew; ASLETT, Matthew. What’s Really New withNewSQL? SIGMOD Rec. 2016, vol. 45, no. 2, pp. 45–55. ISSN0163-5808. Available from DOI: 10.1145/3003665.3003674.
29. PRESSER, Marshall. Data Warehousing with Greenplum: Open SourceMassively Parallel Data Analytics. 1st. O’Reilly Media, Inc, 2017.
30. CRATE.IO. CrateDB for Time Series: How CrateDB compares to spe-cialized time series data stores. 2017. Technical report.
31. SRINIVASAN, V.; BULKOWSKI, Brian; CHU, Wei-Ling; SAYYA-PARAJU, Sunil; GOODING, Andrew; IYER, Rajkumar; SHINDE,Ashish; LOPATIC, Thomas. Aerospike: Architecture of a Real-time Operational DBMS. Proc. VLDB Endow. 2016, vol. 9, no. 13,pp. 1389–1400. ISSN 2150-8097. Available also from: http://www.vldb.org/pvldb/vol9/p1389-srinivasan.pdf.
32. Implementing a Document Store [online] [visited on 2018-05-18].Available from: https://docs.basho.com/riak/kv/2.2.3/developing/usage/document-store/.
33. ScyllaDB vs Cassandra: Benchmarks [online] [visited on 2018-05-18]. Available from: https : / / www . scylladb . com / product /benchmarks/.
34. ARANGODB. What is a multi-model database and why use it? 2016.Technical report.
35. Riak TS - Data Modeling Basics: Creating a Table [online] [visitedon 2018-05-18]. Available from: https://github.com/cvitter/Riak- TS- Data- Modeling/blob/master/Data%20Modeling%20Basics.md#creating-a-table.
64

BIBLIOGRAPHY
36. SADALAGE, P.J.; FOWLER, M. NoSQL Distilled: A Brief Guideto the Emerging World of Polyglot Persistence. In: Pearson Edu-cation, 2012, chap. 14. ISBN 9780133036121.
37. Small files in Hadoop [online] [visited on 2018-05-18]. Availablefrom: https://medium.com/arabamlabs/small- files- in-hadoop-88708e2f6a46.
38. DEPARDON, Benjamin; LE MAHEC, Gaël; SÉGUIN, Cyril. Anal-ysis of Six Distributed File Systems. 2013. Available also from: https://hal.inria.fr/hal-00789086. Research Report.
39. RANI, L. Sudha; SUDHAKAR, K.; KUMAR, S. Vinay. DistributedFile Systems: A Survey. 2014.
40. BLOMER, J. A Survey on Distributed File System Technology.Journal of Physics: Conference Series. 2015, vol. 608, no. 1, pp. 012039.Available also from: http://stacks.iop.org/1742-6596/608/i=1/a=012039.
41. SHVACHKO, Konstantin; KUANG, Hairong; RADIA, Sanjay;CHANSLER, Robert. The Hadoop Distributed File System. In:Proceedings of the 2010 IEEE 26th Symposium on Mass Storage Sys-tems and Technologies (MSST). Washington, DC, USA: IEEE Com-puter Society, 2010, pp. 1–10. MSST ’10. ISBN 978-1-4244-7152-2.Available from DOI: 10.1109/MSST.2010.5496972.
42. Performance Comparison to HDFS [online] [visited on 2018-05-18].Available from: https://github.com/quantcast/qfs/wiki/Performance-Comparison-to-HDFS.
43. BORTHAKUR, Dhruba. The Hadoop Distributed File System:Architecture and Design. 2007, vol. 11, pp. 21.
44. Big Data Battle : Batch Processing vs Stream Processing [online] [vis-ited on 2018-05-14]. Available from: https : / / medium . com /@gowthamy/big-data-battle-batch-processing-vs-stream-processing-5d94600d8103.
45. SAKR, Sherif. Big Data 2.0 Processing Systems: A Survey. In: 1st.Springer Publishing Company, Incorporated, 2016, pp. 15–19.ISBN 3319387758, 9783319387758.
65
BIBLIOGRAPHY
46. SAKR, Sherif. Big Data 2.0 Processing Systems: A Survey. In:1st. Springer Publishing Company, Incorporated, 2016. ISBN3319387758, 9783319387758.
47. A Gentle Introduction to Stream Processing [online] [visited on 2018-05-18]. Available from: https://medium.com/@srinathperera/what-is-stream-processing-1eadfca11b97.
48. Shortest Paths Example [online] [visited on 2018-05-18]. Availablefrom: https : / / cwiki . apache . org / confluence / display /GIRAPH/Shortest+Paths+Example.
49. SHARMA, Aneesh; JIANG, Jerry; BOMMANNAVAR, Praveen;LARSON, Brian; LIN, Jimmy. GraphJet: Real-time Content Rec-ommendations at Twitter. Proc. VLDB Endow. 2016, vol. 9, no. 13,pp. 1281–1292. ISSN 2150-8097. Available from DOI: 10.14778/3007263.3007267.
50. Summingbird [online] [visited on 2018-05-18]. Available from:https://github.com/twitter/summingbird.
51. ALEXANDROV, Alexander; HEIMEL, Max; MARKL, Volker;BATTRÉ, Dominic; HUESKE, Fabian; NIJKAMP, Erik; EWEN,Stephan; KAO, Odej; WARNEKE, Daniel. Massively Parallel DataAnalysis with PACTs on Nephele. Proc. VLDB Endow. 2010, vol. 3,no. 1-2, pp. 1625–1628. ISSN 2150-8097. Available from DOI: 10.14778/1920841.1921056.
52. MongoDB 3.6 mongoimport [online] [visited on 2018-05-18]. Avail-able from: https://docs.mongodb.com/manual/reference/program/mongoimport/index.html.
66