
Tool-assisted Game Scenario Representation Through Flow ...
10
Tool-assisted Game Scenario Representation Through Flow Charts Maria-Eleni Paschali 1 , Nikolaos Bafatakis 1 , Apostolos Ampatzoglou 1 , Alexander Chatzigeorgiou 2 and Ioannis Stamelos 1 1 Department of Informatics, Aristotle University of Thessaloniki, Thessaloniki, Greece 2 Department of Applied Informatics, University of Macedonia, Thessaloniki, Greece Keywords: Game Development, Game Scenarios, Flow Charts, Case Study. Abstract: Game development is one of the fastest-growing industries in IT. In order for a game to be successful, the game should engage the player through a solid and interesting scenario, which does not only describe the state of the game, but also outlines the main characters and their interactions. By considering the increasing complexity of game scenarios, we seek for existing methods for scenario representation approaches, and based on the most popular one, we provide tool support for assisting the game design process. To evaluate the usefulness of the developed tool, we have performed a case study with the aim to assess the usability of the tool. The results of the case study suggested that after some interaction with end-users the tool has reached a highly usable state that to some extent guarantees its applicability in practice. 1 INTRODUCTION During the last decades, games have become an integral part of young people lives. This observation establishes them not only as a very strong and prof- itable industry, but also as a significant field of re- search (Ampatzoglou A. and Stamelos I., 2010). As the interest of researchers around game development grows, it becomes clearer that game development is nowadays far away from being treated as a soft-skill topic (or a more artistic one), but holds a strong software engineering part. However, we note that game engineering poses different challenges com- pared to traditional software engineering, especially with respect to requirements elicitation and specifi- cation. In particular, games’ success cannot be guar- anteed by just deploying a functional version, but it should also be safeguarded that the game is enter- taining as well, since user satisfaction / enjoyment are major success factors (Callele D. et al., 2006). Therefore, an interesting research direction aims at finding the factors that lead to user satisfaction. To this end, Ham and Lee (Ham H and Lee Y., 2006), and Paschali et al. (Paschali M. et al, 2014), explored the importance of seven high-level charac- teristics (namely Scenario, Graphics, Speed, Sound, Control, Characters, and Community) as parameters of users’ satisfaction. Based on the results of the most recent study Scenario, Character Solidness and Sound have proven to be the most important factors that influence user satisfaction (Paschali M. et al, 2014). Nevertheless, since characters are usually described as part of scenarios, we assume that an interesting scenario is a prominent factor in game design. Additionally, by considering that game scenarios contain quite complex and dynamic structures (i.e., different possible endings based on gamers’ input), there is a need to find an appropriate way to handle the required complexity of scenarios and easily de- pict game dynamics in game design documents. Most of the traditional requirements specification methods that provide textual descriptions of re- quirements (e.g., use cases, user stories, etc.) do not seem to suffice, since the end-results might be too lengthy and inconsistent. Thus, the goal of this paper is two-fold: (a) to review the literature for identify- ing methods for scenario representation, and (b) based on the most popular method, we intent to provide tool support for assisting the game design process and evaluate the usability of the tool. The rest of the paper is organized as follows: in Section 2, we present scenario representation ap- proaches, and in Section 3, the tool that we have developed for supporting the selected approach. We note that since Section 2 provides a solid literature review, we do not include a separate related work section, due to space limitations. Next, in Section 4, Paschali, M., Bafatakis, N., Ampatzoglou, A., Chatzigeorgiou, A. and Stamelos, I. Tool-assisted Game Scenario Representation Through Flow Charts. DOI: 10.5220/0006681402230232 In Proceedings of the 13th International Conference on Evaluation of Novel Approaches to Software Engineering (ENASE 2018), pages 223-232 ISBN: 978-989-758-300-1 Copyright c 2019 by SCITEPRESS – Science and Technology Publications, Lda. All rights reserved 223
-
Upload
khangminh22 -
Category
Documents
-
view
1 -
download
0
Transcript of Tool-assisted Game Scenario Representation Through Flow ...
Tool-assisted Game Scenario Representation Through Flow Charts
Maria-Eleni Paschali1, Nikolaos Bafatakis1, Apostolos Ampatzoglou1, Alexander Chatzigeorgiou2 and Ioannis Stamelos1
1Department of Informatics, Aristotle University of Thessaloniki, Thessaloniki, Greece 2Department of Applied Informatics, University of Macedonia, Thessaloniki, Greece
Keywords: Game Development, Game Scenarios, Flow Charts, Case Study.
Abstract: Game development is one of the fastest-growing industries in IT. In order for a game to be successful, the game should engage the player through a solid and interesting scenario, which does not only describe the state of the game, but also outlines the main characters and their interactions. By considering the increasing complexity of game scenarios, we seek for existing methods for scenario representation approaches, and based on the most popular one, we provide tool support for assisting the game design process. To evaluate the usefulness of the developed tool, we have performed a case study with the aim to assess the usability of the tool. The results of the case study suggested that after some interaction with end-users the tool has reached a highly usable state that to some extent guarantees its applicability in practice.
1 INTRODUCTION
During the last decades, games have become an integral part of young people lives. This observation establishes them not only as a very strong and prof-itable industry, but also as a significant field of re-search (Ampatzoglou A. and Stamelos I., 2010). As the interest of researchers around game development grows, it becomes clearer that game development is nowadays far away from being treated as a soft-skill topic (or a more artistic one), but holds a strong software engineering part. However, we note that game engineering poses different challenges com-pared to traditional software engineering, especially with respect to requirements elicitation and specifi-cation. In particular, games’ success cannot be guar-anteed by just deploying a functional version, but it should also be safeguarded that the game is enter-taining as well, since user satisfaction / enjoyment are major success factors (Callele D. et al., 2006). Therefore, an interesting research direction aims at finding the factors that lead to user satisfaction.
To this end, Ham and Lee (Ham H and Lee Y., 2006), and Paschali et al. (Paschali M. et al, 2014), explored the importance of seven high-level charac-teristics (namely Scenario, Graphics, Speed, Sound, Control, Characters, and Community) as parameters of users’ satisfaction. Based on the results of the most recent study Scenario, Character Solidness and
Sound have proven to be the most important factors that influence user satisfaction (Paschali M. et al, 2014). Nevertheless, since characters are usually described as part of scenarios, we assume that an interesting scenario is a prominent factor in game design.
Additionally, by considering that game scenarios contain quite complex and dynamic structures (i.e., different possible endings based on gamers’ input), there is a need to find an appropriate way to handle the required complexity of scenarios and easily de-pict game dynamics in game design documents. Most of the traditional requirements specification methods that provide textual descriptions of re-quirements (e.g., use cases, user stories, etc.) do not seem to suffice, since the end-results might be too lengthy and inconsistent. Thus, the goal of this paper is two-fold: (a) to review the literature for identify-ing methods for scenario representation, and (b) based on the most popular method, we intent to provide tool support for assisting the game design process and evaluate the usability of the tool.
The rest of the paper is organized as follows: in Section 2, we present scenario representation ap-proaches, and in Section 3, the tool that we have developed for supporting the selected approach. We note that since Section 2 provides a solid literature review, we do not include a separate related work section, due to space limitations. Next, in Section 4,
Paschali, M., Bafatakis, N., Ampatzoglou, A., Chatzigeorgiou, A. and Stamelos, I.Tool-assisted Game Scenario Representation Through Flow Charts.DOI: 10.5220/0006681402230232In Proceedings of the 13th International Conference on Evaluation of Novel Approaches to Software Engineering (ENASE 2018), pages 223-232ISBN: 978-989-758-300-1Copyright c© 2019 by SCITEPRESS – Science and Technology Publications, Lda. All rights reserved
223
we describe the case study design that has been used for its validation, whereas in Section 5 we provide an overview of results, which are discussed in Sec-tion 6. Finally, in Sections 7 and 8 we present threats to validity and conclude the paper, respectively.
2 SCENARIO REPRESENTATION APPROACHES
In literature, one can identify several techniques for effectively representing stories (e.g., books, movies, etc.) for over a hundred years. However, regarding games, representation approaches have only recently attracted the attention of researchers. Specifically, based on the findings of a non-systematic literature review, we have identified seven approaches for scenarios representation (see Table 1).
Table 1: Scenario Representation Approaches.
Name Count Advantages Disadvantages
Character Model
2 Description of characters
Poor description of scenes
Narrative Structure
5
Description of the background and the outline of overall story
Poor description of the transitional scenes. Informal model
Flow Chart 10 Suitable for the flow of the story, event causality, condi-tion
Poor description of characters Use Case
UML diagram
4
Story Beats and Boards
6
Show how the game will appear to the player per scene in a similar way with the one used in films and television
Loss of the interac-tion between the scenario and players. Concentra-tion on artistic interpretations of scenes and loss of story’s continuity and event causality
Petri Net 7
Rich description of quest / event, interactive scenario
Complex repre-sentation Poor description of characters
We note that since the results presented in Table 1, have not been obtained through a systematic litera-ture review, our goal is not to claim which are the most frequent scenario representation approaches, but only to provide a coarse-grain estimation. Next, a brief description of these approaches and their
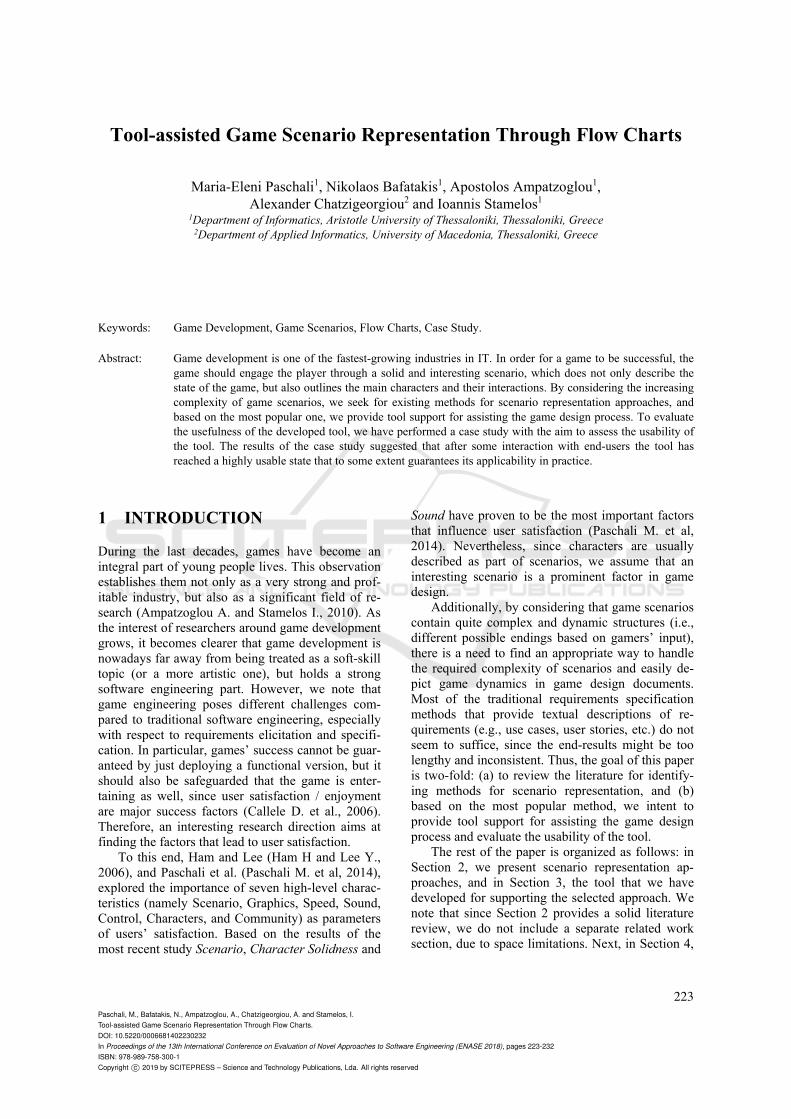
known uses for research purposes is provided. A Character Model (referenced in (Fairclough
C., 2005), (Rolfe B. et al, 2010)) is a diagrammatic representation of the characters that are involved in a story / scene, along with their interactions, as de-scribed by Rolfe et al. (Rolfe B. et al, 2010). For example, in (Rolfe B. et al, 2010) the authors de-scribe a scene from the Medal of Honor game, with the following character model (see Figure 1). The notations of the diagram are the characters of the game (stickmen – e.g., Allied Soldier), their interac-tions (continuous lines – e.g., the Player is fighting with Opponent Axis Soldiers), and their high-level goals (though bubbles – e.g., the goal of the Civil-ians is to be liberated and receive support by allies).
Figure 1: Character Model - Medal of Honor (33).
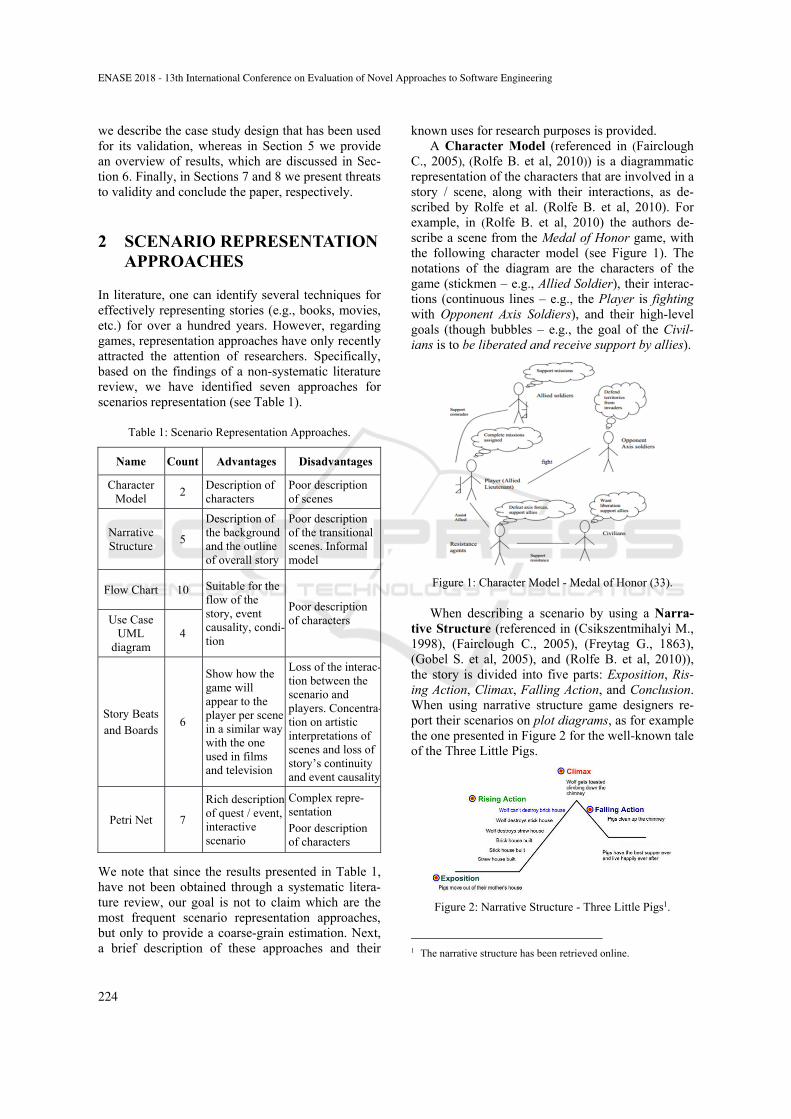
When describing a scenario by using a Narra-tive Structure (referenced in (Csikszentmihalyi M., 1998), (Fairclough C., 2005), (Freytag G., 1863), (Gobel S. et al, 2005), and (Rolfe B. et al, 2010)), the story is divided into five parts: Exposition, Ris-ing Action, Climax, Falling Action, and Conclusion. When using narrative structure game designers re-port their scenarios on plot diagrams, as for example the one presented in Figure 2 for the well-known tale of the Three Little Pigs.
Figure 2: Narrative Structure - Three Little Pigs1.
1 The narrative structure has been retrieved online.
ENASE 2018 - 13th International Conference on Evaluation of Novel Approaches to Software Engineering
224
Flow Charts (referenced in (Hill R. et al, 2001), (Kistler F. et al., 2011), (Koenitz H. and Chen K., 2012), (Lewinski J.S, 1999), (Marne B. et al., 2013), (Medler B. and Magerko B., 2006), (Robertson M., 2007), (Rouse R., 2000), (Ruda I. et al., 2009), (Ryan M., 2001), and (Verbrugge C., 2003)) may often be included as part of the game design docu-ment, similarly to those of traditional software engi-neering. Flow charts are diagrams that represent an algorithm, workflow or process, showing the steps as boxes, and their sequence of execution by con-necting them with arrows. In game development, flowcharts are used to track (Rouse R., 2000): (a) players’ navigation of out-of-game menu options (e.g., starts a new game or loads a saved one), and (b) areas the players progress to and from in the game, particularly in level-based games. Beyond these most obvious applications, flowcharts can be quite useful for visually representing the results of any decision players may take during a game (Rouse R., 2000). In some games genres (e.g., MMOG - Massively Multiplayer On-Line Games) interactivity is a distinguishing feature and an attraction for gam-ers, since participants can change the state of affairs with their actions. In such games, due to the dynam-ic flow of events, gameplay can be resembled to the execution of an algorithm, where elementary actions are defined by game rules, rendering the flowchart a fitting means for their representation (Rouse R., 2000). Additionally, narrative flow graphs, i.e., a simple description format, can lead to story specifi-cation, without representation gaps (Verbrugge C., 2003).
Use Cases (UCs) and Use Case Diagrams (ref-erenced in (Kendra C. et al., 2014), (Longstreet C.S., 2012), and (Taylor M. et al., 2007)) are part of the Unified Modeling Language (UML) (Booch G. et al., 1999) and aim at specifying software require-ments. In game engineering, use case specifications and use case diagrams are used to demonstrate the connection between scenes / actions. Taylor et al. (Taylor M. et al., 2007) suggest that detailed use-case diagrams, enriched with some aspects of deci-sion trees, could be useful for professionals involved in computer game development (e.g., story, level, and character designers, 3-D modelers, artists, ani-mators, and musicians). Specifically, they describe a game-flow design approach that can be used in order to model the individual levels of a computer game. In a similar line of thought, Longstreet et al. (Long-street C.S., 2012) present how tailored UML models (i.e., UML diagrams and UC specifications) with additional features from story boarding techniques (see below) could model serious educational games.
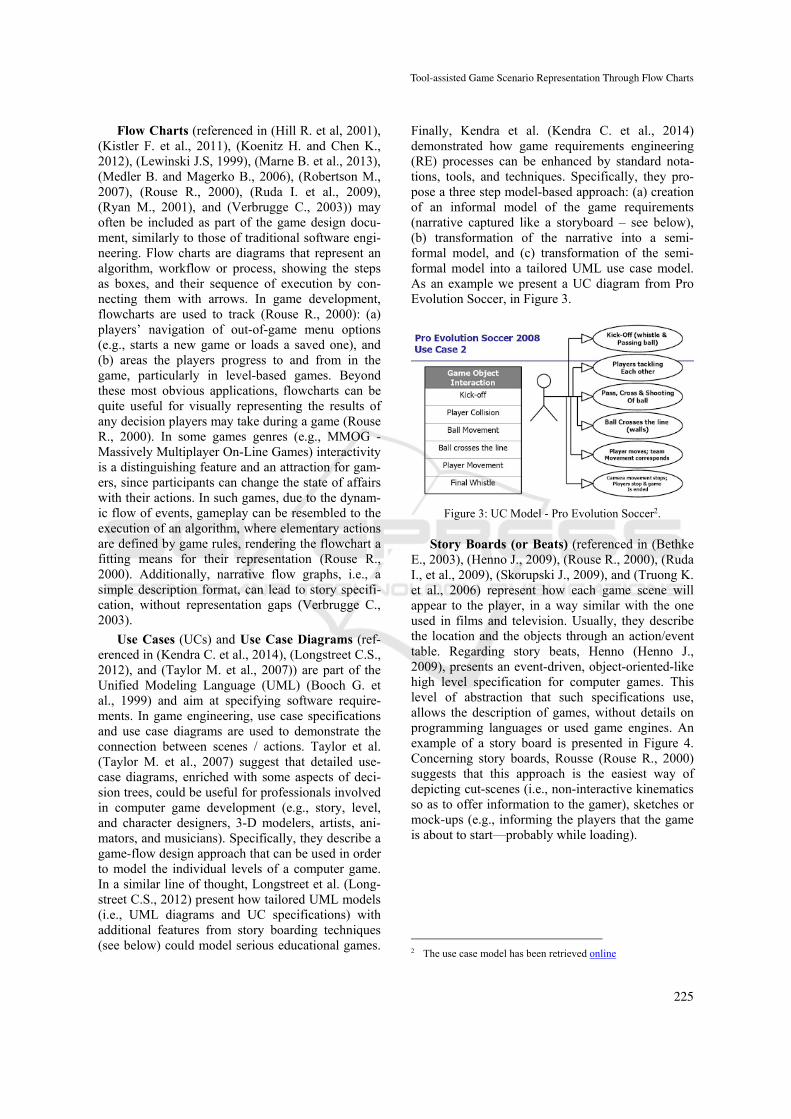
Finally, Kendra et al. (Kendra C. et al., 2014) demonstrated how game requirements engineering (RE) processes can be enhanced by standard nota-tions, tools, and techniques. Specifically, they pro-pose a three step model-based approach: (a) creation of an informal model of the game requirements (narrative captured like a storyboard – see below), (b) transformation of the narrative into a semi-formal model, and (c) transformation of the semi-formal model into a tailored UML use case model. As an example we present a UC diagram from Pro Evolution Soccer, in Figure 3.
Figure 3: UC Model - Pro Evolution Soccer2.
Story Boards (or Beats) (referenced in (Bethke E., 2003), (Henno J., 2009), (Rouse R., 2000), (Ruda I., et al., 2009), (Skorupski J., 2009), and (Truong K. et al., 2006) represent how each game scene will appear to the player, in a way similar with the one used in films and television. Usually, they describe the location and the objects through an action/event table. Regarding story beats, Henno (Henno J., 2009), presents an event-driven, object-oriented-like high level specification for computer games. This level of abstraction that such specifications use, allows the description of games, without details on programming languages or used game engines. An example of a story board is presented in Figure 4. Concerning story boards, Rousse (Rouse R., 2000) suggests that this approach is the easiest way of depicting cut-scenes (i.e., non-interactive kinematics so as to offer information to the gamer), sketches or mock-ups (e.g., informing the players that the game is about to start—probably while loading).
2 The use case model has been retrieved online
Tool-assisted Game Scenario Representation Through Flow Charts
225
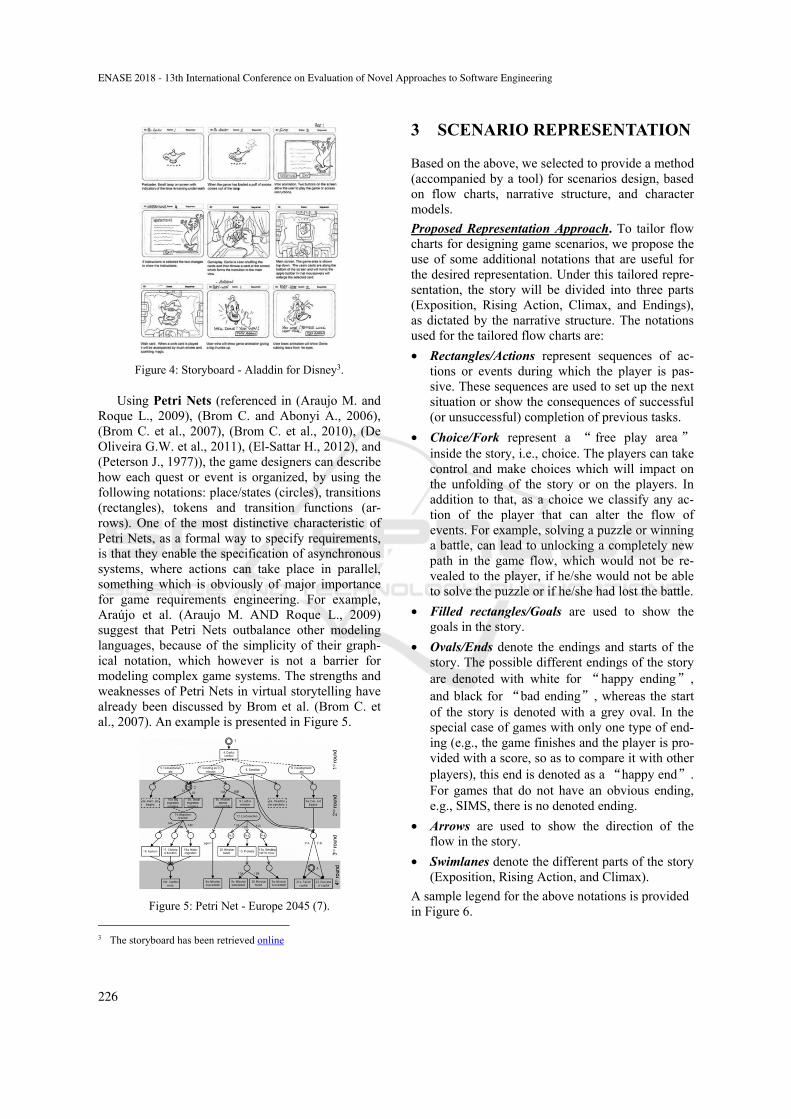
Figure 4: Storyboard - Aladdin for Disney3.
Using Petri Nets (referenced in (Araujo M. and Roque L., 2009), (Brom C. and Abonyi A., 2006), (Brom C. et al., 2007), (Brom C. et al., 2010), (De Oliveira G.W. et al., 2011), (El-Sattar H., 2012), and (Peterson J., 1977)), the game designers can describe how each quest or event is organized, by using the following notations: place/states (circles), transitions (rectangles), tokens and transition functions (ar-rows). One of the most distinctive characteristic of Petri Nets, as a formal way to specify requirements, is that they enable the specification of asynchronous systems, where actions can take place in parallel, something which is obviously of major importance for game requirements engineering. For example, Araújo et al. (Araujo M. AND Roque L., 2009) suggest that Petri Nets outbalance other modeling languages, because of the simplicity of their graph-ical notation, which however is not a barrier for modeling complex game systems. The strengths and weaknesses of Petri Nets in virtual storytelling have already been discussed by Brom et al. (Brom C. et al., 2007). An example is presented in Figure 5.
Figure 5: Petri Net - Europe 2045 (7).
3 The storyboard has been retrieved online
3 SCENARIO REPRESENTATION
Based on the above, we selected to provide a method (accompanied by a tool) for scenarios design, based on flow charts, narrative structure, and character models.
Proposed Representation Approach. To tailor flow charts for designing game scenarios, we propose the use of some additional notations that are useful for the desired representation. Under this tailored repre-sentation, the story will be divided into three parts (Exposition, Rising Action, Climax, and Endings), as dictated by the narrative structure. The notations used for the tailored flow charts are:
• Rectangles/Actions represent sequences of ac-tions or events during which the player is pas-sive. These sequences are used to set up the next situation or show the consequences of successful (or unsuccessful) completion of previous tasks.
• Choice/Fork represent a “ free play area ” inside the story, i.e., choice. The players can take control and make choices which will impact on the unfolding of the story or on the players. In addition to that, as a choice we classify any ac-tion of the player that can alter the flow of events. For example, solving a puzzle or winning a battle, can lead to unlocking a completely new path in the game flow, which would not be re-vealed to the player, if he/she would not be able to solve the puzzle or if he/she had lost the battle.
• Filled rectangles/Goals are used to show the goals in the story.
• Ovals/Ends denote the endings and starts of the story. The possible different endings of the story are denoted with white for “happy ending”, and black for “bad ending”, whereas the start of the story is denoted with a grey oval. In the special case of games with only one type of end-ing (e.g., the game finishes and the player is pro-vided with a score, so as to compare it with other players), this end is denoted as a “happy end”. For games that do not have an obvious ending, e.g., SIMS, there is no denoted ending.
• Arrows are used to show the direction of the flow in the story.
• Swimlanes denote the different parts of the story (Exposition, Rising Action, and Climax).
A sample legend for the above notations is provided in Figure 6.
ENASE 2018 - 13th International Conference on Evaluation of Novel Approaches to Software Engineering
226

Figure 6: Sample Notations for Flow Charts.
Tool Support. To assist the popularization of the proposed approach, we have built an online4 Open Source Software (OSS) tool that provides an inte-grated environment for "Game Scenario" design. In particular through the tool, the designer can create a project that includes one or more flow charts related to the story of the game and one or more character models that correspond to the interactions of actors in the scenes. The developed tool reuses components of two other existing OSS projects, namely: Vis.js and Chart.js. The source code of the tool is available in GitHub5. The main functional requirements of the tool have can be summarized as follows (accompa-nied by screenshots).
Generic Functionalities: Create Game Scenario (Project), Create Flow Chart, Create Character Mod-el, Save / Load Project.
Figure 7: Generic Functionalities.
Design Functionalities on Flow Charts: Add Nar-rative Nodes, Edit Nodes, Add Edge Between Nodes, Edit Edges, Overview of Node Details (Ex-pand / Collapse).
4 http://nikompaf.webpages.auth.gr/main.php 5 https://github.com/nickbaf/Umbra-GameScenario-Designer
Figure 8: Designing Flow Charts.
Design Functionalities of Character Models: Add New Character, Edit Character, Add Character In-teraction Edge, Overview of Node Details (Expand / Collapse).
Figure 9: Designing Flow Charts.
4 CASE STUDY DESIGN
In this section we present the case study design. The study has been designed and reported according to the template suggested by Runeson et al. (Runeson P. and Host M., 2009). The high-level goal of this case study is to improve and evaluate the usability of the developed tool. To achieve this goal we have performed two rounds of empirical evaluation, be-tween which we performed maintenance activities. We organized the two rounds as follows: the case study was conducted once for 10 participants and
Tool-assisted Game Scenario Representation Through Flow Charts
227

then based on the feedback taken from the think aloud results we implemented changes to the tool. Next, we repeated the case study with 10 different participants. However, the reporting will be made only for the last version of the tool.
4.1 Research Objectives & Questions
The main objective of the empirical evaluation in terms of the Goal-Question-Metric (GQM) approach (Basili V. et al, 1994) is formulated as follows: ana-lyze the developed tool for the purpose of evalua-tion, with respect to its usability from the point of view of game designers. According to ISO 9241-11, usability can be decomposed to three sub-characteristics: effectiveness, efficiency, and satis-faction (Frokjaer E. et al, 2000). Based on the above, we derived three research questions (RQ): RQ1: What is the effectiveness of the tool? Effectiveness is a measure of how accurately the users can perform a set of tasks. In order to answer this research question, we will provide the subjects a set of tasks to be accomplished, and we will assess their success with qualitative and quantitative analy-sis (see Section 4.3).
RQ2: What is the efficiency of the tool? The efficiency quality attribute measures the timely behavior of users when performing several tasks. The same research setting as RQ1 will be used, in which a well-known approach for assessing the task duration will be used (see Section 4.3).
RQ3: What is the level of satisfaction that the users get from using the tool?
User satisfaction is related to the evaluation of the overall experience of the user. A questionnaire based approach will be used for this assessment using estab-lished data collection methods (see Section 4.3).
4.2 Case and Task Selection
This study is a holistic case study, in which for every case (subject / usability tester) we record one unit of analysis. Each subject has been asked to complete a list of tasks, for which the evaluation and data col-lection has taken place.
Case Selection: According to Charters (Charters E., 2003), a usability test with five users that test the system (by using the think-aloud method (Charters E., 2003)) can identify up to 2/3 of existing usability issues. Therefore, in order to identify an ever larger portion of usability issues, we performed the two rounds of usability testing with 10 different subjects as evaluators (in each round), so as to avoid bias,
and familiarity with the system. Through such a set of evaluators, we expect to find a minimum of 95% of system errors with a probability of 98% (Turner C.W., 2006). The sample we chose mainly come from higher education, i.e. undergraduate, postgrad-uate students and PhD candidates with a level of knowledge in using software applications, and inter-est in game design.
Task Selection: The tasks that the users have been asked to complete are divided into two main catego-ries: (a) observation tasks in which the user is invit-ed to recognize a situation or answer questions about the program (e.g., see T3, T4 from the list below), and (b) action tasks, which the user is called to de-sign-edit on the program. (e.g., see T1-T2). First, the usability testers will be provided with some pre-defined stories6. The tasks that have been used in the usability testing are based on these stories are:
T1. Load the file with the name "archive" T2. Open the history flow chart named "Stage 1" T3. Add a new "bad ending" node. T4. What are the features of the node labeled "30"? T5. Connect with an edge the node that you built
before to the node with the number 30. T6. Edit the node labeled "12" to be part of the
"Rising Action". T7. Edit the figure so that the node labeled "5" is
connected only to the node labeled "9". T8. Delete the node that has been out of use by the
preceding action. T9. How many choices does the story have? T10. Delete the Story Flow Diagram "Stage 3" T11. Create a new character named "Red". T12. Add an edge between "Vincent" and Barret" T13. Delete the "Teddie" character and then the tab. T14. Delete the Character Model
4.3 Data Collection
To measure effectiveness we observed users, while dealing with the assigned tasks, without first having been instructed on how to use the program. During the observation sessions, users should think aloud to implement the think-aloud protocol that is wide-spread in software testing (Charters E., 2003). In order to measure efficiency we ask users to perform the tasks presented in Section 4.2. Efficiency has been measured with the use of Keystroke Level Model (KLM) (11). Additionally, to assess efficien-cy we also used the data from the think-aloud data collection process, so as to record their actions and
6 https://www.dropbox.com/s/7vdq5hwgep6b6fn/Stories.zip?dl=0
ENASE 2018 - 13th International Conference on Evaluation of Novel Approaches to Software Engineering
228
the causes of their wrong choices. Finally, to assess user satisfaction a standard usability questionnaire has been distributed to the participants. The ques-tionnaire, namely System Usability Scale — SUS (Brooke J., 1996) that gives a comprehensive picture of subjective usability assessment.
4.4 Data Analysis
During the execution of tasks the observer notes, which have been executed correctly and which not. Based on this, the overall effectiveness is calculated as the percentage of correctly executed tasks. An average is used to aggregate from the single subject to the sample. Apart from quantifying each quality criterion, a major aspect of this evaluation is the provision of feedback to the development tool. Therefore, by analyzing the transcripts of each ses-sion the identified problems have been divided into the following categories: • Layout problems, the user fails to locate a partic-
ular item on the program’s screen, • Operating problems, the user is unable to under-
stand the function of an element in the program, • Understanding problem, the user fails to under-
stand the data presented by the program. To quantify efficiency, the observer has recorded
the movements of the tester according to KLM and calculated the expected completion time for each task according to the model. Following the case study, the times will be compared to the ones that are actually achieved by the testers. Thus, regarding efficiency, both the completion time of the work according to the KLM model, the errors made and the success or not of work will be used. Similarly to before, aggregation will be performed by using the average function.
With respect to user satisfaction, based on the System Usability Scale questionnaire, we sum up the adjusted result of each response. We note that in SUS, some questions have a negative phrasing and others a positive one. Thus, we follow the prescribed way of handling and grading the answers. Since the SUS results range from 0 to 100 and the optimum satisfaction is achieved with scores higher than 90 (9), we set a goal of average satisfaction > 90%.
5 RESULTS
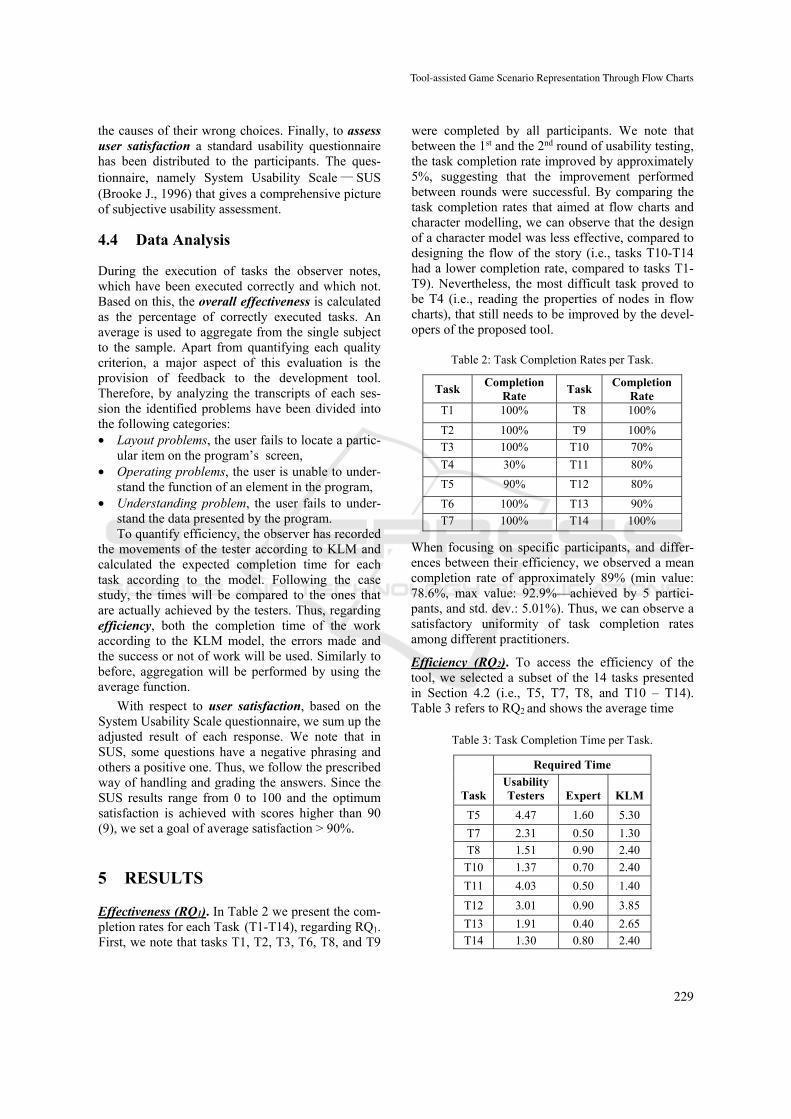
Effectiveness (RQ1). In Table 2 we present the com-pletion rates for each Task (T1-T14), regarding RQ1. First, we note that tasks T1, T2, T3, T6, T8, and T9
were completed by all participants. We note that between the 1st and the 2nd round of usability testing, the task completion rate improved by approximately 5%, suggesting that the improvement performed between rounds were successful. By comparing the task completion rates that aimed at flow charts and character modelling, we can observe that the design of a character model was less effective, compared to designing the flow of the story (i.e., tasks T10-T14 had a lower completion rate, compared to tasks T1-T9). Nevertheless, the most difficult task proved to be T4 (i.e., reading the properties of nodes in flow charts), that still needs to be improved by the devel-opers of the proposed tool.
Table 2: Task Completion Rates per Task.
Task Completion
Rate Task
Completion Rate
T1 100% T8 100%
T2 100% T9 100%
T3 100% T10 70%
T4 30% T11 80%
T5 90% T12 80%
T6 100% T13 90%
T7 100% T14 100%
When focusing on specific participants, and differ-ences between their efficiency, we observed a mean completion rate of approximately 89% (min value: 78.6%, max value: 92.9%—achieved by 5 partici-pants, and std. dev.: 5.01%). Thus, we can observe a satisfactory uniformity of task completion rates among different practitioners.
Efficiency (RQ2). To access the efficiency of the tool, we selected a subset of the 14 tasks presented in Section 4.2 (i.e., T5, T7, T8, and T10 – T14). Table 3 refers to RQ2 and shows the average time
Table 3: Task Completion Time per Task.
Task
Required Time
Usability Testers Expert KLM
T5 4.47 1.60 5.30
T7 2.31 0.50 1.30 T8 1.51 0.90 2.40
T10 1.37 0.70 2.40
T11 4.03 0.50 1.40
T12 3.01 0.90 3.85
T13 1.91 0.40 2.65
T14 1.30 0.80 2.40
Tool-assisted Game Scenario Representation Through Flow Charts
229

that users need to complete each of the aforemen-tioned tasks, the time that an expert (the core devel-oper of the tool) needed to complete the task, and the average required time according to KLM.
The usability testers needed 316% more time compared to the expert user to complete the tasks, reaching a total time of 19.9 seconds compared to the 6.3 seconds required by the skilled user. By comparing the usability testers to the average time required based on KLM, we can observe that the usability testers performed better than expected (approximately 10%), suggesting that the tool can be efficiently used by non-trained users. Thus, the learning curve of the tool is quite steep, since even inexperienced users can perform as average ones —see Figure 10. Similarly to RQ1, the usability testers have found more time consuming to complete the task related to character modelling, compared to flow modelling. In particular, on the one hand re-garding flow modelling, the usability testers were faster than the average KLM user by 15% and slow-er than the expert user by 260%. On the other hand, regarding character modelling, usability testers were 2% faster than the KLM estimation, and 390% slow-er than the expert. Nevertheless, we note that the expert user was 30% faster in character modelling activities compared to flow modelling. This observa-tion suggests that when familiarizing with the tool, character modelling activities are more efficient, but have a smoother learning curve (since novices find them more difficult).
Figure 10: Task Efficiency among Groups.
User Satisfaction (RQ3). On the completion of the tasks presented in Section 4.2, the usability testers were asked to fill in a user satisfaction questionnaire (namely System Usability Scale—SUS). The results on the SUS questionnaire are presented in Table 4. We note that for RQ3, the specifics of the tool (e.g., character vs. flow modeling) cannot be discussed since the SUS instrument treats the system as a whole, without discriminating between different use cases.
Based on the results presented in Table 4, we ob-served a mean user satisfaction of approximately 89.75% (min value: 77.5%, max value: 97.5%, and std. dev.: 8.55%). Additionally, we can observe that the participants can be easily separated into two groups: (a) those with very high satisfaction (i.e., SUS >90%)—7 participants, and (b) those which were less satisfied—3 participants. As a way to explore the reason for those that are dissatisfied, we explored the existence of a relationship between SUS and task completion rate. The results suggest that the completion rate for each user and the rate of satisfaction from the system according to SUS ques-tionnaire. Thus, a direct link between the tasks' completion rate and the users' satisfaction can be observed. The user who successfully completes the tasks feels more comfortable with the behavior of the system, since he/she does not doubt on the knowledge that he/she possesses on the system and how to use it. Therefore, we believe that if in future versions of the system we manage to further increase its effectiveness, the user satisfaction will be in-creased as well.
Table 4: User Satisfaction per Usability Tester.
Participant SUS Participant SUS
P1 77,50 P6 97,50
P2 92,50 P7 97,50
P3 92,50 P8 97,50
P4 72,50 P9 95,00
P5 92,50 P10 82,50
6 DISCUSSION
The results of our case study (i.e., a usability testing procedure with game enthusiasts) suggest that the tool that we have developed for representing scenar-ios is usable and therefore is ready for evaluation by experts (i.e., professional game designers). Howev-er, the results pointed out some weak aspects of the tool that need to be considered for refactoring before we proceed to the next stage. A uniform conclusion that we got by comparing the modelling of charac-ters to modelling the flow of the games, is that char-acter modelling needs further improvement, both in terms of effectiveness of tasks and completion time. These results can be considered quite intuitive in the sense that a flow chart is an established representa-tion in traditional software engineering, and there-fore designers feel more comfortable against it, compared to the completely new notations offered
ENASE 2018 - 13th International Conference on Evaluation of Novel Approaches to Software Engineering
230

by the character model. An additional interesting observation is that all three usability sub-characteristics that we have examined (i.e., effec-tiveness, efficiency, and user satisfaction) appear to be interconnected, in the sense that users that fail a task are dissatisfied with the tools and that also, users that are not time effective are dissatisfied as well. Based on this observation, we can assume that user satisfaction will improve if we manage to de-crease task completion time and failure rates.
Based on the aforementioned discussion, we plan to prompt professional game engineers to use our tool and evaluate, not only its usability, but also its fit-ness in the current processes of game development firms. Also, as part of future work, we plan to inves-tigate the benefits that game development companies get by integrating into their process tool-support for scenario representation. Although we acknowledge that these research questions are very important, we consider the evaluation of usability as a prerequisite for their unbiased answer in an industrial context. Nevertheless, even at this stage we can claim that the tool is fitted for representing scenarios, since the task completion rates are adequate and game devel-opment enthusiasts that participated in the case study are satisfied with the level of assist that it provides.
7 THREATS TO VALIDITY
The results of the usability testing are subject to external validity threats since the study has been performed with 10 participants and a particular sub-set of tasks. However, these threats are mitigated because according to the literature even five users can reveal the majority of usability issues. Concern-ing the coverage of the tool’s functionality, the se-lected tasks exercise representative use cases of a scenario representation tool and thus we believe that effectiveness, efficiency and user satisfaction have been adequately assessed. Another typical threat to construct validity for this kind of studies is the ten-dency of participants to be positive about an approach that offers automation to tasks. However, the think aloud protocol for the study of the first research ques-tion revealed that the usability testers have been neu-tral and identified weaknesses of the tool.
8 CONCLUSIONS
The success of any computer game depends largely on its scenario since these fictional narratives or
diagrammatic representations can be effectively used to discuss and picture the interaction between users and the system. After reviewing existing scenario representation approaches we propose a scenario representation approach accompanied by an online tool, based on flow charts, narrative structure, and character models. The effectiveness, efficiency and user satisfaction have been evaluated by a case study involving 10 participants. The results of the study suggested that the tool enables users to achieve their intended goal with high completion rates, is relative-ly easy to master and is perceived as highly usable by most users. However, it has also identified weak-nesses regarding the support for character modelling which needs to be further improved both in terms of effectiveness of tasks and completion time.
ACKNOWLEDGMENT
This work was financially supported by the action "Strengthening Human Resources Research Poten-tial via Doctorate Research" of the Operational Pro-gram "Human Resources Development Program, Education and Lifelong Learning, 2014-2020", im-plemented from State Scholarship Foundation (IKY) and co-financed by the European Social Fund and the Greek public (National Strategic Reference Framework (NSRF) 2014 – 2020).
REFERENCES
A. Ampatzoglou and I. Stamelos, “Software Engineering Research for Computer Games: A systematic Re-view”, Information and Software Technology, Else-vier, 52 (9), pp. 888-901, September 2010.
M. Araújo and L. Roque, “Modeling Games with Petri Nets”, Digital Games Research Association Confer-ence, London, UK, September 2009.
V.Basili, G. Caldiera and D. Rombach, “The Goal Ques-tion Metric Approach”, Encyclopedia of Software En-gineering. Wiley & Sons, 528-532, 1994.
E. Bethke, “Game Development and Production”, Word-ware Game Developer's Library, 2003.
G. Booch, J. Rumbaugh, and I. Jacobson, “The Unified Modelling Language User Guide”, 1999.
C. Brom, A. Abonyi, “Petri-Nets for Game Plot”, AISB Artificial Intelligence and Simulation Behaviour Con-vention”, Bristol, vol. 3, pp. 6–13, 2006.
C. Brom, V. Sisler and T. Holan,. “Story Manager in 'Europe 2045' Uses Petri Nets”. International Confer-ence on Virtual Storytelling, pages 38-50, 2007.
C. Brom, T. Holan, D. Balas, A.Abonyi, V. Sisler, G. Leo, “Petri nets for representing story plots in serious game”. AISB Journal 2, vol. 1, 2010.
Tool-assisted Game Scenario Representation Through Flow Charts
231
J. Brooke, “SUS - A quick and dirty usability scale,” Usability Eval. Ind., vol. 189, pp. 4–7, 1996.
D. Callele, E. Neufeld, K. Schneider, Emotional require-ments in video games, in: Proceedings of the Interna-tional Conference on Requirements Engineering (RE’06), IEEE Computer Society, Minneapolis, MN, USA, 11–15 September 2006.
Card, S. K, Moran, T. P., Allen, N., "The keystroke-level mo-del for user performance time with interactive systems", Communications of the ACM, 23 (7): 396–410, 1980.
Charters, E., “The Use of Think-aloud Methods in Quali-tative Research An Introduction to Think-aloud Meth-ods”, Brock, 12 (2), pp.68-82, 2003
M. Csikszentmihalyi, “Finding flow: The psychology of engagement with everyday life”, asicBooks, ISBN 0-465-02411-4, 1998.
G.W De Oliveira, S. Julia, S. Passos, "Game modeling using WorkFlow nets," 2011 IEEE International Con-ference on Systems, Man, and Cybernetics (SMC), pp.838-843, 2011
H. El-Sattar, “A Novel Narrative Intelligence Structure for Interactive Drama in Computer Games Workflow”, In-telligent Computer Graphics, 2012
C. Fairclough, “Story Games and the OPIATE System”, thesis Trinity College, 2005.
G. Freytag, “Freytag’s technique of the drama: An exposi-tion of dramatic composition and art”, Scott, For-esman and Company, Chicago, USA, 1863.
E. Frokjaer, M. Hertzum and K.Hornbaek “Measuring Usability: Are Effectiveness, Efficiency, and Satisfac-tion Really Correlated?”, Chi, vol 2, 2000
S. Göbel, F. Becker and A. Felix, “INSCAPE: Story models for Interactive Storytelling and Edutainment Applications”, 3rd International Conference, France, November 30 - December 2. 2005
H. Ham and Y. Lee, “An Empirical Study for Quantitative Evaluation of Game Satisfaction”, 2006 International Conference on Hybrid Information Technology, ACM, pp. 724-729, November 2006.
J. Henno, “Towards Intelligent Engineering and Infor-mation Technology”, Springer Berlin Heidelberg, 243, pp 307-322, 2009
R. Hill, J. Gratch, W. L. Johnson, C. Kyriakakis, C. La-Bore, R. Lindheim, S. Marsella, D. Miraglia, B. Moore, J. Morie, J. Rickel, M. Thiébaux, L. Tuch, R. Whitney, J. Douglas, and W. Swartout.” Toward the holodeck: integrating graphics, sound, character and story”, 5th Int. Conference on Autonomous Agents (AGENTS '01), ACM, pp. 409-416, 2001.
C. Kendra, Nasr E. and C.S Longstreet, “Towards Model-Driven Requirements Engineering for Serious Educa-tional Games: Informal, Semi-formal, and Formal Models”, 20th Int. Working Conference, Essen, Ger-man. Proceedings pp 17-22, 2014
F. Kistler, D. Sollfrank, N. Bee and E. André. “Full Body Gestures Enhancing a Game Book for Interactive Sto-ry Telling”, Fourth International Conference on Inter-active Digital Storytelling, ICIDS 2011, Vancouver, Canada, November 28 – 1 December, 2011, Proceed-ings pp 207-218, 2011.
H. Koenitz and K. Chen, “Genres, Structures and Strate-gies in Interactive Digital Narratives – Analyzing a
Body of Works Created in ASAPS”, 5th International Conference, ICIDS, San Sebastián, Spain, November 12-15, pp 84-95, 2012.
J.S Lewinski, “Developer's Guide to Computer Game Design”, Wordware Publishing Inc., Plano, TX, USA, 1999. 32.
C. S Longstreet, “Towards model-driven game engineer-ing for serious educational games: Tailored use cases for game requirements”, 17th Int. Conference on Com-puter Games, IEEE, pp 208-212, 2012.
B. Marne, T. Carron, J.M Labat,, and M. Schottman, "MoPPLiq: A Model for Pedagogical Adaptation of Serious Game Scenarios", 13th International Confer-ence Advanced Learning Technologies (ICALT), IEEE, pp. 291-293, 2013
B. Medler and B. Magerko, “A Tool for Authoring Event Dri-ven Interactive Drama”, In Third International Confer-ence, TIDSE 2006, pp 139-150, December 4-6, 2006 39.
M. E. Paschali, A. Ampatzoglou, A. Chatzigeorgiou, and I. Stamelos, “Non-functional requirements that influ-ence gaming experience: A survey on gamers satisfac-tion factors”, 18th Academic MindTREK Conference, ACM, 4 – 6 November 2014, Finland.
J. Peterson, “Petri Nets”. ACM, Comput. Surv. 9, vol. 3, pp.223-252, September 1977.
M. Robertson, “Visual Scenario Representation in the Context of a Tool for Interactive Storytelling”, Inter-national Conference on Virtual Storytelling, pp. 3-12, Saint-Malo, France, Springer, 2007.
B. Rolfe, C. Jones and H. Wallace, “Designing dramatic play: story and game structure. 24th BCS Interaction Specialist Group Conference (BCS '10).” British Computer Society, Swinton, UK, 2010.
R. Rouse, “Game Design Theory and Practice (2nd ed.)”, Wordware Publishing Inc., 44, 2000.
I. Ruda, J.Fodor, J. Kacprzyk, “High-Level Specification of Games”, Springer, pp 307-322, 2009,
P. Runeson and M. Host, “Guidelines for conducting and reporting case study research in software engineering,” Empir. Softw. Eng., pp. 131–164, 2009.
M. Ryan, “Narrative as Virtual Reality: Immersion and Interactivity in Literature and Electronic Media”, In John Hopkins University Press, 2001
J. Skorupski, “Storyboard authoring of plan-based interac-tive dramas”. 4th International Conference on Founda-tions of Digital Games (FDG '09). ACM, New York, NY, USA, 349-351, 2009.
M. Taylor, M. Baskett, G. Hughes and S. Wade, “Using soft systems methodology for computer games de-sign”, Systems Research and Behavioral Science, 24, 3, pp. 359—368, 2007.
C. W. Turner, J. R. Lewis, and J. Nielsen, “Determining usability test sample size,” Int. Encycl. Ergon. Hum. Factors, 2nd Ed. pp. 3084–3088, 2006
K. Truong, G. Hayes, and G. Abowd. “Storyboarding: an empirical determination of best practices and effective guidelines”. In Proceedings of the 6th Conference on Designing Interactive systems (DIS '06). ACM, New York, NY, USA, pp 12-21, 2006.
C. Verbrugge, “A Structure for Modern Computer Narra-tives”, Springer Berlin Heidelberg, 2003
ENASE 2018 - 13th International Conference on Evaluation of Novel Approaches to Software Engineering
232