Tonic and phasic release of glutamate and acetylcholine neurotransmission in sub-regions of the rat...
10
Journal of Neuroscience Methods 202 (2011) 199–208 Contents lists available at ScienceDirect Journal of Neuroscience Methods jou rnal h om epa ge: www.elsevier.com/locate/jneumeth Tonic and phasic release of glutamate and acetylcholine neurotransmission in sub-regions of the rat prefrontal cortex using enzyme-based microelectrode arrays Catherine E. Mattinson a,b , Jason J. Burmeister b , Jorge E. Quintero a,b , Francois Pomerleau a,b , Peter Huettl a,b , Greg A. Gerhardt a,b,∗ a Department of Anatomy and Neurobiology, Morris K. Udall Parkinson’s Disease Research Center of Excellence, University of Kentucky, 306 Davis Mills Building, 800 Rose St., Lexington, KY 40536-0098, USA b Center for Microelectrode Technology, University of Kentucky, 306 Davis Mills Building, 800 Rose St., Lexington, KY 40536-0098, USA a r t i c l e i n f o Article history: Received 12 May 2011 Received in revised form 10 August 2011 Accepted 11 August 2011 Keywords: Amperometry Microelectrode array Glutamate Acetylcholine Medial prefrontal cortex a b s t r a c t The medial prefrontal cortex (mPFC) is an area of the brain critical for higher cognitive processes and implicated in disorders of the CNS such as drug addiction, depression and schizophrenia. Glutamate and acetylcholine are neurotransmitters that are essential for cortical functioning, yet little is known about the dynamic function of these neurotransmitters in subregions of the mPFC. In these studies we used a novel microelectrode array technology to measure resting levels (tonic release) of glutamate and acetylcholine as well as KCl-evoked release (stimulated phasic release) in the mPFC of the anesthetized rat to further our understanding of both tonic and phasic neurotransmission in the cingulate cortex, prelimbic cortex, and infralimbic cortex of the mPFC. Studies revealed homogeneity of tonic and phasic signaling among brain subregions for each neurotransmitter. However, resting levels of glutamate were significantly higher as compared to acetylcholine levels in all subregions. Additionally, KCl-evoked acetylcholine release in the cingulate cortex (7.1 M) was significantly greater than KCl-evoked glutamate release in any of the three subregions (Cg1, 2.9 M; PrL, 2.0 M; IL, 1.8 M). Interestingly, the time for signal decay following KCl-evoked acetylcholine release was significantly longer by an average of 240% as compared to KCL- evoked glutamate release for all three brain subregions. Finally, we observed a negative relationship between acetylcholine resting levels and KCl-evoked release in the Cg1. These data suggest a homogenous distribution of both glutamatergic and acetylcholinergic innervation in the mPFC, with alterations in tonic and phasic release regulation accounting for differences between these neurotransmitters. © 2011 Elsevier B.V. All rights reserved. 1. Introduction The medial prefrontal cortex (mPFC) is an area of the brain that is critically involved in higher cognitive processes such as learning, memory, and attention. Glutamate and acetylcholine (ACh) in com- bination with monoamine neurotransmitters (Berger et al., 1976; Brown et al., 1979; de Brabander et al., 1993; Gratton et al., 1989; Perry et al., 2011; Thierry et al., 1983) are essential for prefrontal cortical functioning. The mPFC receives glutamatergic inputs from ∗ Corresponding author at: 306 Davis Mills Building, 800 Rose St., Lexington, KY 40536-0098, USA. Tel.: +1 859 323 4531; fax: +1 859 257 5310. E-mail addresses: [email protected] (C.E. Mattinson), [email protected] (J.J. Burmeister), [email protected] (J.E. Quintero), [email protected] (F. Pomerleau), [email protected] (P. Huettl), [email protected], [email protected] (G.A. Gerhardt). the thalamus (Gigg et al., 1992; Leonard, 1969; Pirot et al., 1994), basal forebrain (Henny and Jones, 2008), hippocampus (Gigg et al., 1994; Jay et al., 1992), and amygdala (McDonald, 1996). This brain area also receives acetylcholine input from the basal forebrain as part of the basal forebrain cortical cholinergic system (Mesulam et al., 1983). The loss or antagonism of these specific glutamatergic and acetylcholinergic afferents has been shown to result in deficits in spatial working memory (Bailey and Mair, 2005; Romanides et al., 1999), passive avoidance tasks (Torres et al., 1994), and atten- tion (McGaughy et al., 1996), highlighting the importance of these neurotransmitter systems in daily cognitive functioning. Dysreg- ulation of the glutamatergic and/or acetylcholinergic circuitry in the mPFC has been implicated in disorders such as schizophrenia (Bauer et al., 2008; Benes et al., 1992; Crook et al., 2001; Olbrich et al., 2008; Oni-Orisan et al., 2008; Sarter et al., 2005; Tsai et al., 1995; Woo et al., 2008; Zmarowski et al., 2009), Alzheimer’s disease (Burbaeva et al., 2005; Francis et al., 1999; Kashani et al., 0165-0270/$ – see front matter © 2011 Elsevier B.V. All rights reserved. doi:10.1016/j.jneumeth.2011.08.020
-
Upload
independent -
Category
Documents
-
view
2 -
download
0
Transcript of Tonic and phasic release of glutamate and acetylcholine neurotransmission in sub-regions of the rat...

Tsa
CPa
Lb
a
ARRA
KAMGAM
1
imbBPc
4
J((
0d
Journal of Neuroscience Methods 202 (2011) 199– 208
Contents lists available at ScienceDirect
Journal of Neuroscience Methods
jou rna l h om epa ge: www.elsev ier .com/ locate / jneumeth
onic and phasic release of glutamate and acetylcholine neurotransmission inub-regions of the rat prefrontal cortex using enzyme-based microelectroderrays
atherine E. Mattinsona,b, Jason J. Burmeisterb, Jorge E. Quinteroa,b, Francois Pomerleaua,b,eter Huettl a,b, Greg A. Gerhardta,b,∗
Department of Anatomy and Neurobiology, Morris K. Udall Parkinson’s Disease Research Center of Excellence, University of Kentucky, 306 Davis Mills Building, 800 Rose St.,exington, KY 40536-0098, USACenter for Microelectrode Technology, University of Kentucky, 306 Davis Mills Building, 800 Rose St., Lexington, KY 40536-0098, USA
r t i c l e i n f o
rticle history:eceived 12 May 2011eceived in revised form 10 August 2011ccepted 11 August 2011
eywords:mperometryicroelectrode arraylutamatecetylcholineedial prefrontal cortex
a b s t r a c t
The medial prefrontal cortex (mPFC) is an area of the brain critical for higher cognitive processes andimplicated in disorders of the CNS such as drug addiction, depression and schizophrenia. Glutamate andacetylcholine are neurotransmitters that are essential for cortical functioning, yet little is known about thedynamic function of these neurotransmitters in subregions of the mPFC. In these studies we used a novelmicroelectrode array technology to measure resting levels (tonic release) of glutamate and acetylcholineas well as KCl-evoked release (stimulated phasic release) in the mPFC of the anesthetized rat to further ourunderstanding of both tonic and phasic neurotransmission in the cingulate cortex, prelimbic cortex, andinfralimbic cortex of the mPFC. Studies revealed homogeneity of tonic and phasic signaling among brainsubregions for each neurotransmitter. However, resting levels of glutamate were significantly higheras compared to acetylcholine levels in all subregions. Additionally, KCl-evoked acetylcholine release inthe cingulate cortex (7.1 �M) was significantly greater than KCl-evoked glutamate release in any of the
three subregions (Cg1, 2.9 �M; PrL, 2.0 �M; IL, 1.8 �M). Interestingly, the time for signal decay followingKCl-evoked acetylcholine release was significantly longer by an average of 240% as compared to KCL-evoked glutamate release for all three brain subregions. Finally, we observed a negative relationshipbetween acetylcholine resting levels and KCl-evoked release in the Cg1. These data suggest a homogenousdistribution of both glutamatergic and acetylcholinergic innervation in the mPFC, with alterations in tonicand phasic release regulation accounting for differences between these neurotransmitters.© 2011 Elsevier B.V. All rights reserved.
. Introduction
The medial prefrontal cortex (mPFC) is an area of the brain thats critically involved in higher cognitive processes such as learning,
emory, and attention. Glutamate and acetylcholine (ACh) in com-ination with monoamine neurotransmitters (Berger et al., 1976;
rown et al., 1979; de Brabander et al., 1993; Gratton et al., 1989;erry et al., 2011; Thierry et al., 1983) are essential for prefrontalortical functioning. The mPFC receives glutamatergic inputs from∗ Corresponding author at: 306 Davis Mills Building, 800 Rose St., Lexington, KY0536-0098, USA. Tel.: +1 859 323 4531; fax: +1 859 257 5310.
E-mail addresses: [email protected] (C.E. Mattinson),[email protected] (J.J. Burmeister), [email protected]. Quintero), [email protected] (F. Pomerleau), [email protected]. Huettl), [email protected], [email protected] (G.A. Gerhardt).
165-0270/$ – see front matter © 2011 Elsevier B.V. All rights reserved.oi:10.1016/j.jneumeth.2011.08.020
the thalamus (Gigg et al., 1992; Leonard, 1969; Pirot et al., 1994),basal forebrain (Henny and Jones, 2008), hippocampus (Gigg et al.,1994; Jay et al., 1992), and amygdala (McDonald, 1996). This brainarea also receives acetylcholine input from the basal forebrain aspart of the basal forebrain cortical cholinergic system (Mesulamet al., 1983). The loss or antagonism of these specific glutamatergicand acetylcholinergic afferents has been shown to result in deficitsin spatial working memory (Bailey and Mair, 2005; Romanideset al., 1999), passive avoidance tasks (Torres et al., 1994), and atten-tion (McGaughy et al., 1996), highlighting the importance of theseneurotransmitter systems in daily cognitive functioning. Dysreg-ulation of the glutamatergic and/or acetylcholinergic circuitry inthe mPFC has been implicated in disorders such as schizophrenia
(Bauer et al., 2008; Benes et al., 1992; Crook et al., 2001; Olbrichet al., 2008; Oni-Orisan et al., 2008; Sarter et al., 2005; Tsai etal., 1995; Woo et al., 2008; Zmarowski et al., 2009), Alzheimer’sdisease (Burbaeva et al., 2005; Francis et al., 1999; Kashani et al.,
2 urosci
2(apsaaw
dtidaataG
(tsnti22ltt
oamIraTsor
FokofceoTo
00 C.E. Mattinson et al. / Journal of Ne
008; Perry et al., 2011; Trabace et al., 2007), and drug addictionArnold et al., 2003; Lu et al., 1999; McFarland et al., 2003; Sofuoglund Mooney, 2009; Williams and Steketee, 2004). The overlap andossible interactions of these two neurotransmitter systems under-cores the importance of understanding both the tonic and phasicspects of glutamate and ACh neurochemical signaling in the mPFCnd could lead to a better understanding of alterations associatedith neuropathologies.
Until recently, microdialysis was unchallenged as the gold stan-ard technique for measuring in vivo levels of neurotransmitters inhe mammalian central nervous system, and the majority of whats known about mPFC glutamate and ACh levels comes from micro-ialysis studies. However, microdialysis is limited in two criticalreas (1) by its temporal resolution (min) (Nandi and Lunte, 2009)nd (2) by its spatial resolution (mm) (Clapp-Lilly et al., 1999). Fur-hermore it has been shown to cause extensive brain damage (mm)round the probe (Clapp-Lilly et al., 1999; Georgieva et al., 1993;rabb et al., 1998).
Our group has worked extensively on a microelectrode arrayMEA) technology that allows for measurements of neurotransmit-er synaptic spillover at rates of 1–4 Hz. With platinum recordingites having a small footprint (15 �m × 333 �m) and measuringeurotransmitters in the nanomolar range, the MEAs allow forhe characterization of specific brain subregions, such as thosen the prefrontal cortex (Bruno et al., 2006; Burmeister et al.,008; Day et al., 2006; Nickell et al., 2005; Stephens et al.,011). mPFC subregions including the cingulate cortex (Cg1), pre-
imbic cortex (PrL) and infralimbic cortex (IL) are measured onhe scale of microns and are readily measured with the MEAechnology.
In this paper, we report experiments that used our MEA technol-gy to gain insight into potential subregional differences in tonicnd phasic release of glutamate and ACh in the rat mPFC. We firsteasured resting neurotransmitter levels within the Cg1, PrL, and
L of the mPFC. Secondly, we examined the dynamics of KCl-evokedelease of glutamate and ACh in the Cg1, PrL and IL to investigatedditional transient or phasic release of these neurotransmitters.
hese experiments provide new information regarding the regionalignaling properties of glutamate and ACh in different subregionsf the mPFC, an area of the brain that is implicated in many neu-opathologies.ig. 1. Configurations of surface coatings for measures of tonic and phasic release of glutaxidase (GluOx) and an inert BSA and glutaraldehyde coating for glutamate detection. Gletoglutarate. When the H2O2 comes into contact with the Pt recording sites the H2O2 is of glutamate. An mPD exclusion layer serves to block potential electroactive interferentrom the glutamate signal generating a self-referenced glutamate signal and resultant gluoated with human recombinant acetylcholinesterase (AChE) and choline oxidase (ChOx)nzyme layers, AChE hydrolyzes ACh into choline and acetate. The choline is in turn oxidxidized at the Pt site producing a signal current that is directly proportional to the conche sentinel ChOx coated sites generate a choline signal, which is subtracted from the cof ACh resting levels.
ence Methods 202 (2011) 199– 208
2. Materials and methods
2.1. Animals
Male Fischer 344 rats (Harlan, Indianapolis, IN), aged 3–6months, were used for all experiments (n = 17). Animals were indi-vidually housed and maintained on a 12 h light:12 h dark cycle(lights on at 06:00 h). Animals had access to food and water ad libi-tum and were monitored by the Department of Laboratory AnimalResources at the University of Kentucky. All protocols used in theexperiments were approved by the Institutional Animal Care andUse Committee.
2.2. Microelectrode arrays
Ceramic based conformal MEAs were made sensitive to andselective for glutamate or ACh detection using enzyme layerscoated onto the surface of platinum (Pt) recording sites (Fig. 1A)(Burmeister et al., 2008; Day et al., 2006). The MEAs used forthese studies were the S2 configuration with Pt recording sites,each measuring 15 �m × 333 �m and arranged in two pairs, with100 �m separating the pairs. Before coating, MEAs were pre-screened through cleaning and preliminary testing to minimizeinherent Pt site differences (MEAs that did not meet criteria werenot used for experiments). Glutamate detecting MEAs were coatedwith a solution of 0.1 units/�L glutamate oxidase, 1% BSA, and0.125% glutaraldehyde on one pair of Pt recording sites, whilethe second pair of recording sites was coated with only theBSA/glutaraldehyde coating matrix solution and allowed to cure aminimum of 48 h before use (Fig. 1A). As glutamate is not inher-ently electroactive, the glutamate oxidase enzyme was used tocatalyze the oxidation of glutamate to �-ketoglutarate and H2O2,an electroactive reporter molecule. To enhance selectivity a sizeexclusion layer of m-phenylenediamine (mPD) was electrode-posited on to the Pt recording sites prior to calibration. The mPDlayer greatly reduces electroactive interferents from coming into
contact with all recording sites. The signal from the pair of record-ing sites with only the coating matrix was subtracted from thesignal produced by the glutamate oxidase-coated sites to allowfor a self-referencing signal subtraction technique (Burmeistermate or ACh. (A) One pair of recordings sites on the MEAS is coated with glutamateutamate comes into contact with the GluOx layer and is oxidized into H2O2 and �-xidized and the resulting electrons generated are proportional to the concentrations such as ascorbic acid (AA). The signal detected at the sentinel sites is subtractedtamate resting level measurement. (B) For the detection of ACh, one pair of sites is, while the other is coated with only ChOx. When ACh comes into contact with theized by the ChOx into H2O2 and betaine. Similar to the glutamate MEA, the H2O2 isentration of choline. mPD is used to exclude electroactive interferents such as AA.mbined ACh/choline signal, resulting in a self-referenced ACh signal for measures

C.E. Mattinson et al. / Journal of Neuroscience Methods 202 (2011) 199– 208 201
Fig. 2. (A) Histological section with cresyl violet staining showing minimal damage produced by the MEA. Histological sections were used to confirm placement in the mPFCCg1, PrL, and IL. (B) Raw current signals from active (upper trace) and sentinel MEA recording sites (lower trace) showing a typical recording of resting and potassium-evokedrelease of glutamate or ACh. In vivo ejection of KCl produces a rapid increase in glutamate or ACh that quickly clears to baseline on the enzyme-coated channel, while thes ction
P , and t
a2
eatcecswcossAmctmcar
mbAsrFfitdStcelasl
d(a
entinel channel does not show a response. This allows for sentinel channel subtraarameters used in data analysis include resting levels, peak amplitudes, T80 values
nd Gerhardt, 2001; Burmeister et al., 2002, 2008; Day et al.,006).
MEAs configured for ACh detection (Fig. 1B) required a dualnzyme coating scheme to produce the H2O2 reporter molecule,s ACh is also non-electroactive. Acetylcholinesterase was usedo hydrolyze ACh into acetate and choline, and then choline wasatalytically oxidized by choline oxidase to produce H2O2 (Brunot al., 2006). MEAs were coated with a solution of 0.2 units/�lholine oxidase, 0.9% BSA and 0.11% glutaraldehyde on all fourites and allowed to cure at 4 ◦C for a minimum of 48 h. MEAsere then coated with 0.83 units/�l human recombinant acetyl-
holinesterase, 0.83% BSA, and 0.10% glutaraldehyde on one pairf sites, and the BSA/glutaraldehyde solution on the other pair ofites to ensure comparable coating thickness between the pairs ofites and to allow for self-referencing (Burmeister et al., 2008).gain, in order to enhance selectivity a size exclusion layer ofPD was electrodeposited on to the Pt recording sites prior to
alibration. Each of the MEA sites were tested to determine selec-ivity vs. dopamine during an in vitro calibration to ensure that the
PD electrodeposited onto sites was uniform. The signal from theholine oxidase-coated sites was subtracted from the combinedcetylcholinesterase/choline oxidase sites to determine the self-eferenced ACh signal.
Glutamate and ACh were recorded with a FAST16mkII instru-ent (Quanteon L.L.C., Nicholasville, KY). Detection was achieved
y amperometric measurements using a potential of +0.7 V vs. ang/AgCl electrode, which detected H2O2 that was oxidized at theurface of the Pt recording sites; the electrons from the oxidationeaction produced a signal that was recorded and digitized by theAST16mkII system. All recordings were performed at a final outputrequency of 1 Hz. Before each experiment, MEAs were calibratedn vitro using stepwise additions to increase concentrations of glu-amate or ACh, as well as, electroactive interferents as previouslyescribed (Burmeister and Gerhardt, 2001; Burmeister et al., 2002).ensitivity, linearity, limit of detection, and selectivity over elec-roactive interferents were calculated for all MEAs using the in vitroalibration data prior to experimentation. MEAs used in glutamatexperiments had an average slope of −4.2 ± 2.0 pA/�M, an averageimit of detection of 0.99 ± 0.9 �M, a linearity R2 > 0.99, and an aver-ge selectivity of 57:1 ± 37. In ACh experiments, MEAs averaged alope of −5.8 ± 2.6 pA/�M, a limit of detection of 0.30 ± 0.44 �M, ainearity R2 > 0.99, and a selectivity of 415:1 ± 716.
A micropipette (10 �m internal diameter) for exogenous KCl-elivery (see below) was affixed to the MEA using sticky waxKerr Corp., Orange, CA). The tip of the micropipette was centeredmong all four recording sites approximately 75 �m away from the
to obtain a self-referenced signal that is the resting level of the neurotransmitter.he k-1 first-order rate constant.
surface of the MEA, allowing for solution delivery during in vivorecordings.
2.3. In vivo recordings
In vivo glutamate and ACh recordings were performed as previ-ously described (Burmeister et al., 2008; Day et al., 2006). Briefly,rats were anesthetized with urethane i.p. (1.25–1.5 g/kg). After theanimal was secured in a stereotaxic frame, a craniotomy was per-formed over the placement site of interest and the dura removed.A hole was also drilled contralateral to the placement for a minia-ture Ag/AgCl reference electrode. The micropipette attached to theMEA was filled with an isotonic KCl solution (70 mM KCl, 79 mMNaCl, 2.5 mM CaCl2·2H2O; pH = 7.4) and connected to a PicospritzerIII (Parker Hannifin Corp, NJ) to allow for local applications of KClinto the extracellular space. The MEA/micropipette assembly waslowered into the mPFC (AP: +3.2 mm; ML: ±0.8 mm; DV: −1.5 to−5 mm; from bregma (Paxinos and Watson, 2004) using a Nar-ishige MO-10 microdrive (Fig. 2A). The MEA assembly was loweredin 0.5 mm increments and recordings were taken at each depthto record glutamate or ACh levels along the dorsal–ventral axis ofthe mPFC. Once lowered into place, basal levels were establishedover 10 min recording durations, and then KCl solution was ejected(75–100 nl) to evoke glutamate or ACh signals: volume of KCl deliv-ered was monitored using a microscope fitted with a calibratedreticule (Friedemann and Gerhardt, 1992). At the end of the exper-iment, animals were euthanized and histology was performed toconfirm MEA placement. Only data collected from confirmed elec-trode placements in the different subregions of the mPFC wereincluded in the final data analysis; data from two animals wereexcluded in these studies.
2.4. Data analysis
Collected data were processed using a custom Matlab®-basedanalysis package. Data parameters analyzed were resting (tonicrelease) neurotransmitter levels (average of the ten data pointsprior to the first ejection at each depth) and data from potassium-evoked release (phasic release) of glutamate or ACh that included:peak amplitude, T80 (time for 80% of the signal to decay to base-line), and k-1, best fit line of first order rate constant of the signalreturn to baseline (Fig. 2B). Glutamate and ACh KCl-evoked peaks
were volume matched (75–100 nL) for data analysis. Outliers wereeliminated from data using a Grubb’s test before analyses wereconducted. As data was not always attainable at every depththroughout the depth profile due to clogging of the tips of the
202 C.E. Mattinson et al. / Journal of Neuroscience Methods 202 (2011) 199– 208
F ) Resting levels of glutamate were homogeneous and not significantly different withins nificantly different within subregions of the mPFC (Cg1 and IL, n = 6; PrL, n = 8).
mApAaip
3
3s
sr(p(tAFw(am
3t
twctwama
wFfpfarrrp
Fig. 4. KCl-evoked glutamate release in the mPFC. (A) Shown are representativesignals from the Cg1, PrL and IL of the mPFC. The arrow marks the ejection of KCl toevoke phasic release of glutamate. (B) Graphs showing the maximum amplitudes ofKCl-evoked release in the different subregions of the mPFC. The average amplitudesof KCl-evoked glutamate release were not significantly different in the three brainregions.
Table 1KCl-evoked glutamate release data.
Subregion Peak amplitude T80 value k-1
Cg1 2.9 ± 0.9 �M 3.2 ± 1.8 s 0.7 ± 0.7 s−1
PrL 2.0 ± 1.1 �M 3.0 ± 1.2 s 0.6 ± 0.9 s−1
IL 1.8 ± 1.1 �M 1.8 ± 0.6 s 0.8 ± 0.9 s−1
ig. 3. Resting or tonic levels of glutamate and ACh in subregions of the mPFC. (Aubregions of the mPFC (n = 7 for all regions). (B) Resting levels of ACh were not sig
icropipettes, occasional data drop out occurred. Thus, a one-wayNOVA with a Bonferroni post hoc test was used to analyze theotassium evoked data and resting levels between glutamate andCh were analyzed using a two-way ANOVA. Correlations werelso performed to compare the log of KCl-evoked data and rest-ng data for each neurotransmitter. Significance was defined as
< 0.05.
. Results
.1. Glutamate and acetylcholine resting levels are stable acrossubregions
Glutamate and ACh recordings in the mPFC focused on threeubregions: the Cg1, PrL, and IL. For both neurotransmitters,esting levels were calculated using the self-referenced signalsFig. 2B). When average resting levels of glutamate were com-ared among brain regions (Fig. 3A), they were found to be similarF(2,18) = 0.069; p = 0.93), with only a 0.7 �M difference betweenhe highest and lowest levels. Interestingly, analyses of averageCh resting levels revealed comparable resting levels (Fig. 3B;(2,17) = 0.47; p = 0.63) of 0.6–1.0 �M for the Cg1, PrL and IL. Thereas a significant main effect between the two neurotransmitters
F(1,35) = 16; p = 0.0003), however, the resting levels of glutamatend ACh were not significantly different within subregions of thePFC.
.2. KCl-evoked glutamate release is similar among subregions inhe mPFC
KCl-evoked release of glutamate was successfully carried out inhe Cg1, PrL and IL subregions of the mPFC. Local application of KClas seen to produce detectable and transient increases in extra-
ellular glutamate that lasted for, on average, 3–5 s. Representativeracings of KCl-induced glutamate release from each brain regionere compared (Fig. 4A) to illustrate the similar peak amplitudes
mong the subregions of the mPFC. The tracings indicate the unifor-ity among signals, with similar peak rise times, peak amplitudes,
nd similar decay profiles.The glutamate peak amplitudes, T80 values, and k-1 values
ere used to characterize KCl-evoked release of glutamate (seeig. 2B). Measures of glutamate release revealed no significant dif-erences in the peak amplitudes of glutamate (Fig. 4B; F(2,15) = 1.8;
= 0.21) or T80 values (Table 1; F(2,16) = 1.9; p = 0.18) in the dif-erent subregions. Glutamate k-1 values were also comparablemong brain regions (Table 1; k-1: F(2,16) = 0.31; p = 0.74). Cor-
elations of the log of KCl-evoked release of glutamate withesting levels of glutamate were not significant for any sub-egion of the mPFC (Fig. 7A–C; Cg1, p = 0.97; PrL, p = 0.12; IL,= 0.20).
Glutamate signal values from subregions of the mPFC. Peak amplitudes, T80 values,and k-1 values for each of the three subregions highlight the homogeneity of themPFC (mean ± SD; Cg1 and IL: n = 6; PrL: peak amplitude, n = 6, T80 value and k-1,n = 7).

C.E. Mattinson et al. / Journal of Neuroscience Methods 202 (2011) 199– 208 203
Fig. 5. KCl-evoked ACh release in subregions of the mPFC. (A) Shown are singletraces of KCl-evoked ACh release from the Cg1, PrL and IL of the mPFC. The arrowmarks the ejection of KCl to evoke phasic release of Ach. (B) Graphs showing averageast
3r
AiAaFisinAfKliweu(F
3r
t
Table 2KCl-evoked acetylcholine release data.
Subregion Peak amplitude T80 value k-1
Cg1 7.1 ± 3.9 �M 6.3 ± 1.7 s 0.3 ± 0.4 s−1
PrL 5.3 ± 2.4 �M 5.7 ± 1.5 s 0.3 ± 0.3 s−1
IL 5.3 ± 2.7 �M 6.0 ± 1.9 s 0.3 ± 0.3 s−1
Acetylcholine signal parameters from subregions of the mPFC. Peak amplitudes, T80
values, and k values for each of the three subregions highlight the homogeneity of
mitters, and found significant differences in decay times betweenglutamate and ACh (F(5,39) = 10.6; p < 0.0001). In the Cg1, AChdecay times were increased 198% as compared to glutamate decay
Fig. 6. Comparison of glutamate and ACh peak amplitudes and T80 values in differ-ent subregions of the mPFC. (A) Significant differences were found between thepotassium-evoked ACh signal amplitudes (orange circles) in the Cg1 (**p < 0.01;*p < 0.05; Glu: n = 6; ACh: Cg1 and PrL, n = 10, IL, n = 9) as compared to glutamate
mplitudes of KCl-evoked ACh release in the 3 subregions of the mPFC. There was noignificant difference in the ACh amplitudes within the different subregions alonghe dorsal–ventral axis of the mPFC (Cg1 and PrL, n = 10; IL, n = 9).
.3. Acetylcholine signaling parameters are similar among brainegions
Studies were carried out to investigate KCl-evoked release ofCh in the subregions of the mPFC. Similar to the glutamate stud-
es, KCl was seen to produce detectable and transient release ofCh lasting 5–10 s in the mPFC. The similarity among ACh releasend uptake from each brain subregion are further illustrated inig. 5A. KCl-evoked ACh peaks rose to peak amplitudes in a sim-lar manner, and decayed at similar rates, resulting in comparableignaling parameters among the Cg1, PrL, and IL. When ACh signal-ng parameters were compared among the three brain subregions,o significant differences were found suggesting homogeneity ofCh neurotransmission in the mPFC. Peak amplitudes showed uni-
ormity, (Fig. 5B; F(2,26) = 1.1; p = 0.35) thus further characterizingCl-induced ACh release among the brain subregions. When the
og of KCl-evoked releases of ACh were correlated with ACh rest-ng levels within each subregion, a significant difference in the Cg1
as found (Fig. 7D; Cg1, p = 0.049). No significance was found inither the PrL (Fig. 7E; p = 0.93) or the IL (Fig. 7F; p = 0.29). AChptake parameters including T80 values were also homogeneousTable 2; F(2,23) = 0.32; p = 0.73), as were k-1 values (Table 2; k-1:(2,26) = 0.096; p = 0.91).
.4. Comparisons of KCl-evoked glutamate and acetylcholine
eveal significant differences between the neurotransmittersWe compared the peak amplitudes of both neurotransmit-ers to contrast mPFC glutamate and ACh KCl-evoked release
-1
the mPFC, and ACh release data (mean ± SD; Cg1 and PrL: peak amplitude and k-1,n = 10, T80 value, n = 9; IL: peak amplitude, and k-1, n = 9, T80, n = 8).
(Fig. 6A). While significant differences were not found within eachneurotransmitter, significant differences did exist between neuro-transmitters. ACh peak amplitude measurements ranged from 5.3to 7.1 �M, and glutamate peak amplitude concentrations measured1.8–2.9 �M. Analyses revealed that the peak levels of ACh in the Cg1were significantly higher than glutamate signals in all subregions(F(5,41) = 5.4; p = 0.0007). As compared to glutamate levels in theCg1, Cg1 ACh levels were greater by 144%. Potassium-evoked AChrelease in the Cg1 was also greater by 255% and 294% compared toglutamate levels in the PrL and IL, respectively.
We also compared T80 values between the two neurotrans-
signaling (green squares) in the three subregions of the mPFC. (B) T80 values differsignificantly between glutamate and ACh in each subregion (***p < 0.001; **p < 0.01;*p < 0.05; Glu: Cg1 and IL, n = 6, PrL, n = 7; ACh: Cg1 and PrL, n = 9, IL, n = 8). (For inter-pretation of the references to color in this figure legend, the reader is referred to theweb version of the article.)

204 C.E. Mattinson et al. / Journal of Neuroscience Methods 202 (2011) 199– 208
F C) Ther -evokt cant c
tPv
4
rsrbtf
ig. 7. Correlations of glutamate and ACh peak amplitudes and resting levels. (A–esting levels were not significant (Cg1 and PrL, n = 5; IL, n = 5). (D–F) The log of KClhe Cg1 subregion of the mPFC (p < 0.05). Other subregions did not show any signifi
imes in the same brain subregion (Fig. 6B). ACh T80 values in therL and IL were increased 189% and 330% as compared to glutamatealues, respectively.
. Discussion
These are the first studies comparing both tonic and phasicelease of glutamate and ACh levels on a second-by-second timecale in individual subregions of the anesthetized rat mPFC. The
esults of our studies demonstrate that we can reliably measureoth tonic and phasic glutamate and ACh release in vivo usinghe MEA technology. The spatial resolution of our MEAs allowedor the measurement of these neurotransmitters in discrete mPFCcorrelations of the log of KCl-evoked glutamate peak amplitudes and glutamateed ACh peak amplitudes and ACh resting levels showed a significant correlation inorrelations (Cg1 and IL, n = 6; PrL, n = 8).
subregions such as the Cg1, PrL, and IL, and the sampling rateoffered the ability to measure individual KCl-induced glutamateand ACh peaks. Interestingly, our data support that the gluta-mate and ACh neurotransmitters systems have tonic and phasicrelease that are uniform within the subregions, but there weresignificant differences in both resting and KCl-evoked releaseof glutamate vs. ACh in the mPFC.
4.1. Resting levels of glutamate and acetylcholine
These studies did not find significant differences in resting glu-tamate levels within the Cg1, PrL, and IL, although there wasmarked variability within each mPFC subregion. We had initially

uroscie
hfmgphngcp2essomeMssptemcaigbs
m(grutpiKatrlaMtt2
eoihintrv(eovwur
C.E. Mattinson et al. / Journal of Ne
ypothesized that we would see differences among the subregionsor glutamate resting levels, as glutamate is tightly regulated in the
PFC (Hascup et al., 2010). Thus, the relative homogeneity of ourlutamate resting levels within the mPFC subregions was unex-ected, but not unprecedented. Previous MEA work within our labas shown that glutamate resting levels in anesthetized animals doot differ greatly between brain regions. We have reported restinglutamate levels in anesthetized rats of 1.6 ± 0.3 �M in the frontalortex and 1.4 ± 0.2 �M in the striatum, and in the hippocam-us, we have measured glutamate concentrations ranging from.5 �M in the CA1 region to 3.4 �M in the dentate gyrus (Stephenst al., 2011). Our glutamate resting levels of 3.7–4.3 �M in mPFCubregions are higher than previously reported levels from MEAtudies in other brain regions, but not unreasonable. Resting levelsf glutamate that have been measured using microdialysis in thePFC have ranged from 0.23 ± 0.061 �M to 3.8 ± 0.4 �M (Del Arco
t al., 1998; Ferraro et al., 2001; Hugues et al., 2007; Karreman andoghaddam, 1996; Lupinsky et al., 2010) and 3.0 ± 0.6 �M in the
triatum (Miele et al., 1996). Compared with microdialysis mea-ures, our resting levels of glutamate are over 600% higher thanreviously reported microdialysis glutamate levels in the mPFC ofhe same strain (Selim and Bradberry, 1996). However, this differ-nce in concentration between MEA technology and microdialysiseasures can be explained because the MEAs sample the extra-
ellular space of the brain directly rather than being separated by membrane containing a net analyte concentration of zero driv-ng diffusion into the microdialysis probe. Also, far less edema orliosis occurs with MEAs than microdialysis probes, allowing foretter estimates of neuronally based release vs. release from otherources.
The Pt recording sites on the MEA only measure neurotrans-itters that come into contact with the surface of the electrode
Burmeister et al., 2000). We have hypothesized that our increasedlutamate resting levels and higher ACh resting levels may be theesult of the enhanced spatial resolution of our MEAs that allowss to be closer to synaptic spillover, as evidenced by studies usingetrodotoxin (Day et al., 2006). Microdialysis probes may be able toick up some spillover, but the size of the probe membranes and the
nherent time constant of the microdialysis membrane (Schultz andennedy, 2008) is prohibitive for measuring neurochemical activityt the level of synapses (Timmerman and Westerink, 1997). Thus,he MEAs measure the concentration of the neurotransmitter thatesides in the extracellular space and do not record a fractionalevel. Our recently reported studies support that this translated to
5–10 fold difference of resting levels of glutamate measured byEAs vs. microdialysis in the awake animal and is largely due to
he direct measurement of the neurotransmitter concentration inhe extracellular space by the MEA technology (see Hascup et al.,010).
In our first paper using MEA technology to measure ACh (Brunot al., 2006), we did not report resting levels. However, in this setf studies we are now able to report for the first time in vivo rest-ng levels of ACh using MEA technology. Similar to our glutamateypothesis, we predicted that we would see significant differences
n ACh resting levels among the subregions of the mPFC. We didot find any significant differences in resting levels of ACh amonghe mPFC subregions, and little variability existed within each sub-egion. Reported resting levels of ACh in the mPFC have widelyaried from 0.58 ± 0.14 nM to 3.0 ± 0.3 �M in microdialysis studiesArnold et al., 2001; Hernandez et al., 2008; Huang et al., 2008; Morkt al., 2009; Neigh-McCandless et al., 2002). Our ACh measurementsf 0.59–0.96 �M fall into the higher end of the range of these pre-
iously reported microdialysis ACh concentrations. Microdialysis,ith its collection times on the scale of several seconds to min-tes, may allow for more ACh hydrolysis by acetylcholinesterase,esulting in lower reported concentrations. Thus, many scientistsnce Methods 202 (2011) 199– 208 205
who use microdialysis for measuring ACh levels also perfuse anacetylcholinesterase inhibitor, such as neostigmine, to prevent AChbreakdown (Nirogi et al., 2010; Ragozzino et al., 1996). However,this technique may artificially affect the measured ACh levels in theextracellular space. The detection of higher levels of both glutamateand ACh can be attributed to the improved spatial and temporalresolution of the MEA.
The present series of studies was carried out in anesthetizedanimals to take advantage of the brain mapping capability of theMEAs to record glutamate and ACh levels in different subregions ofthe mPFC in the same rat. Work from our group has shown that theadministration of urethane anesthesia to awake, freely moving ratsresulted in a 58% decrease in resting glutamate levels (Rutherfordet al., 2007). Thus, it is likely that the anesthetic attenuated gluta-mate resting levels in these studies and possibly affected ACh levelsas well. Even with this possible attenuation, our glutamate restinglevels are still relatively high compared to microdialysis studies,but this likely relates to the aforementioned properties of the MEAmeasurements as compared to microdialysis. By contrast, to datewe do not have any indication that urethane affects KCl-evokedrelease of glutamate based on our work (data not shown). Urethanehas also been shown to enhance the actions of the nicotinic AChreceptor, but only to a small degree (Hara and Harris, 2002). Futurestudies will be carried out in the awake animal to circumvent thepotential effects of anesthesia. It should also be noted that gluta-mate and ACh levels in the mPFC vary with rat strain. For example,glutamate levels in awake rats have been reported from 0.22 �M inSprague-Dawley rats (Ferraro et al., 2001) to 4.2 �M in Wistar-Kingrats (Abekawa et al., 2000). ACh levels in rats exhibit an even greaterrange of resting levels, from 0.58 nM in awake Sprague-Dawleyrats (Huang et al., 2008) to 3.0 �M, also in awake Sprague-Dawleyrats (Mork et al., 2009). Thus, the concentrations reported in thepresent studies were likely affected by anesthesia and were likelydependent on the strain used.
A comparison of our resting levels of glutamate and ACh in mPFCsubregions did not reveal any differences within neurotransmitters,but we did see a significant main effect between neurotransmit-ters, suggesting that the neurotransmitter resting levels do varybetween glutamate and ACh within the mPFC. This may be dueto the differential innervation of the mPFC by these neuronal sys-tems and/or the regulation of these neurons by other neurons andsignaling molecules. Interestingly, our resting levels of ACh wereextremely similar between the PrL and IL subregions, suggestingthat ACh regulation is uniform in these areas. This is supported bymicrodialysis experiments that have sought to characterize subre-gions of the mPFC, and have reported similar resting levels betweenthe prelimbic and infralimbic mPFC (Hedou et al., 2000). However,it should be noted that there was overlap between subregions dueto the spatial resolution of the microdialysis technique.
4.2. Measurements of KCl-evoked release of glutamate and AChin the rat mPFC
Although no significant differences were found in KCl-evokedglutamate release, both the peak amplitudes and the T80 values fol-lowed trends along the dorsal–ventral axis in the mPFC (Table 1).In previous microdialysis studies that used KCl to evoke neuro-transmitter release, the infusion of KCl into the mPFC resultedin an increase in glutamate levels of 90% (Frantz et al., 2002).KCl has also been reported to have no effect on glutamate levels(Welty and Shoblock, 2009). However, these studies were not spe-cific to subregions of the mPFC, and they did not measure rapid
changes in glutamate or ACh. We saw that glutamate peak ampli-tudes decreased ∼38% from the Cg1 to the IL, while T80 values inthe IL were also decreased by 44% as compared to T80 values inthe Cg1. These findings are suggestive of subtle variance in the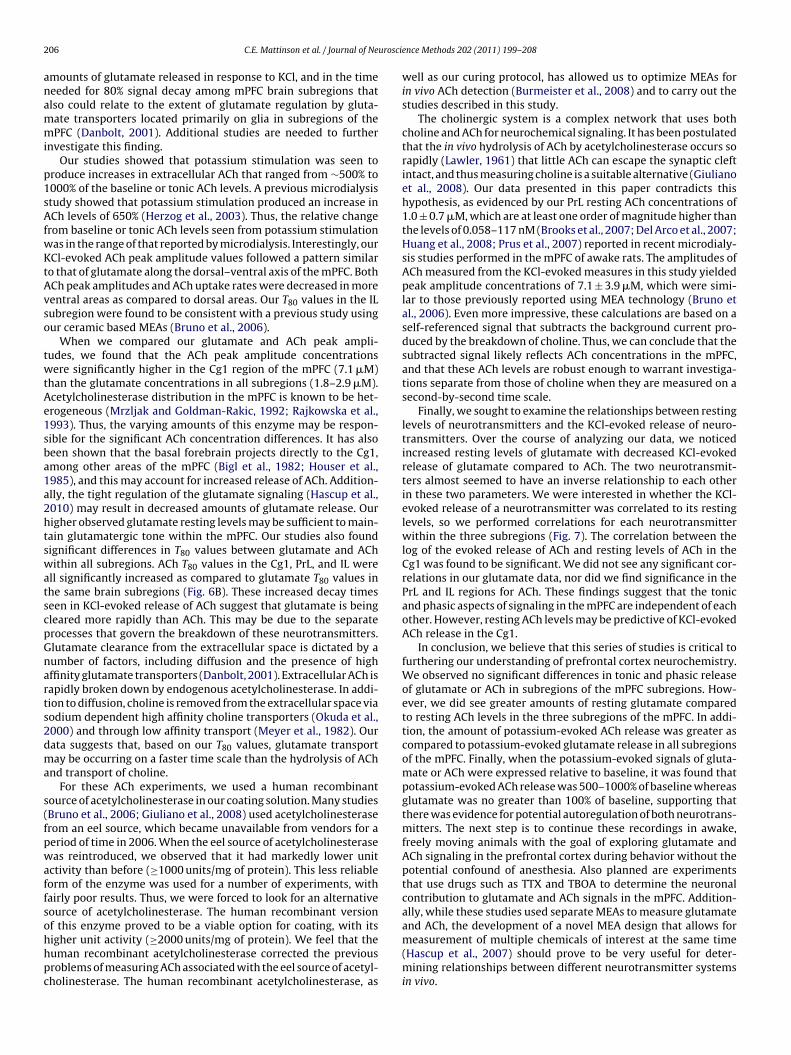
2 urosci
anammi
p1sAfwKtAvso
twtAe1sba1a2htswatscpGnarts2dma
s(fpwaffsohhpc
06 C.E. Mattinson et al. / Journal of Ne
mounts of glutamate released in response to KCl, and in the timeeeded for 80% signal decay among mPFC brain subregions thatlso could relate to the extent of glutamate regulation by gluta-ate transporters located primarily on glia in subregions of thePFC (Danbolt, 2001). Additional studies are needed to further
nvestigate this finding.Our studies showed that potassium stimulation was seen to
roduce increases in extracellular ACh that ranged from ∼500% to000% of the baseline or tonic ACh levels. A previous microdialysistudy showed that potassium stimulation produced an increase inCh levels of 650% (Herzog et al., 2003). Thus, the relative change
rom baseline or tonic ACh levels seen from potassium stimulationas in the range of that reported by microdialysis. Interestingly, ourCl-evoked ACh peak amplitude values followed a pattern similar
o that of glutamate along the dorsal–ventral axis of the mPFC. BothCh peak amplitudes and ACh uptake rates were decreased in moreentral areas as compared to dorsal areas. Our T80 values in the ILubregion were found to be consistent with a previous study usingur ceramic based MEAs (Bruno et al., 2006).
When we compared our glutamate and ACh peak ampli-udes, we found that the ACh peak amplitude concentrationsere significantly higher in the Cg1 region of the mPFC (7.1 �M)
han the glutamate concentrations in all subregions (1.8–2.9 �M).cetylcholinesterase distribution in the mPFC is known to be het-rogeneous (Mrzljak and Goldman-Rakic, 1992; Rajkowska et al.,993). Thus, the varying amounts of this enzyme may be respon-ible for the significant ACh concentration differences. It has alsoeen shown that the basal forebrain projects directly to the Cg1,mong other areas of the mPFC (Bigl et al., 1982; Houser et al.,985), and this may account for increased release of ACh. Addition-lly, the tight regulation of the glutamate signaling (Hascup et al.,010) may result in decreased amounts of glutamate release. Ourigher observed glutamate resting levels may be sufficient to main-ain glutamatergic tone within the mPFC. Our studies also foundignificant differences in T80 values between glutamate and AChithin all subregions. ACh T80 values in the Cg1, PrL, and IL were
ll significantly increased as compared to glutamate T80 values inhe same brain subregions (Fig. 6B). These increased decay timeseen in KCl-evoked release of ACh suggest that glutamate is beingleared more rapidly than ACh. This may be due to the separaterocesses that govern the breakdown of these neurotransmitters.lutamate clearance from the extracellular space is dictated by aumber of factors, including diffusion and the presence of highffinity glutamate transporters (Danbolt, 2001). Extracellular ACh isapidly broken down by endogenous acetylcholinesterase. In addi-ion to diffusion, choline is removed from the extracellular space viaodium dependent high affinity choline transporters (Okuda et al.,000) and through low affinity transport (Meyer et al., 1982). Ourata suggests that, based on our T80 values, glutamate transportay be occurring on a faster time scale than the hydrolysis of ACh
nd transport of choline.For these ACh experiments, we used a human recombinant
ource of acetylcholinesterase in our coating solution. Many studiesBruno et al., 2006; Giuliano et al., 2008) used acetylcholinesteraserom an eel source, which became unavailable from vendors for aeriod of time in 2006. When the eel source of acetylcholinesteraseas reintroduced, we observed that it had markedly lower unit
ctivity than before (≥1000 units/mg of protein). This less reliableorm of the enzyme was used for a number of experiments, withairly poor results. Thus, we were forced to look for an alternativeource of acetylcholinesterase. The human recombinant versionf this enzyme proved to be a viable option for coating, with its
igher unit activity (≥2000 units/mg of protein). We feel that theuman recombinant acetylcholinesterase corrected the previousroblems of measuring ACh associated with the eel source of acetyl-holinesterase. The human recombinant acetylcholinesterase, asence Methods 202 (2011) 199– 208
well as our curing protocol, has allowed us to optimize MEAs forin vivo ACh detection (Burmeister et al., 2008) and to carry out thestudies described in this study.
The cholinergic system is a complex network that uses bothcholine and ACh for neurochemical signaling. It has been postulatedthat the in vivo hydrolysis of ACh by acetylcholinesterase occurs sorapidly (Lawler, 1961) that little ACh can escape the synaptic cleftintact, and thus measuring choline is a suitable alternative (Giulianoet al., 2008). Our data presented in this paper contradicts thishypothesis, as evidenced by our PrL resting ACh concentrations of1.0 ± 0.7 �M, which are at least one order of magnitude higher thanthe levels of 0.058–117 nM (Brooks et al., 2007; Del Arco et al., 2007;Huang et al., 2008; Prus et al., 2007) reported in recent microdialy-sis studies performed in the mPFC of awake rats. The amplitudes ofACh measured from the KCl-evoked measures in this study yieldedpeak amplitude concentrations of 7.1 ± 3.9 �M, which were simi-lar to those previously reported using MEA technology (Bruno etal., 2006). Even more impressive, these calculations are based on aself-referenced signal that subtracts the background current pro-duced by the breakdown of choline. Thus, we can conclude that thesubtracted signal likely reflects ACh concentrations in the mPFC,and that these ACh levels are robust enough to warrant investiga-tions separate from those of choline when they are measured on asecond-by-second time scale.
Finally, we sought to examine the relationships between restinglevels of neurotransmitters and the KCl-evoked release of neuro-transmitters. Over the course of analyzing our data, we noticedincreased resting levels of glutamate with decreased KCl-evokedrelease of glutamate compared to ACh. The two neurotransmit-ters almost seemed to have an inverse relationship to each otherin these two parameters. We were interested in whether the KCl-evoked release of a neurotransmitter was correlated to its restinglevels, so we performed correlations for each neurotransmitterwithin the three subregions (Fig. 7). The correlation between thelog of the evoked release of ACh and resting levels of ACh in theCg1 was found to be significant. We did not see any significant cor-relations in our glutamate data, nor did we find significance in thePrL and IL regions for ACh. These findings suggest that the tonicand phasic aspects of signaling in the mPFC are independent of eachother. However, resting ACh levels may be predictive of KCl-evokedACh release in the Cg1.
In conclusion, we believe that this series of studies is critical tofurthering our understanding of prefrontal cortex neurochemistry.We observed no significant differences in tonic and phasic releaseof glutamate or ACh in subregions of the mPFC subregions. How-ever, we did see greater amounts of resting glutamate comparedto resting ACh levels in the three subregions of the mPFC. In addi-tion, the amount of potassium-evoked ACh release was greater ascompared to potassium-evoked glutamate release in all subregionsof the mPFC. Finally, when the potassium-evoked signals of gluta-mate or ACh were expressed relative to baseline, it was found thatpotassium-evoked ACh release was 500–1000% of baseline whereasglutamate was no greater than 100% of baseline, supporting thatthere was evidence for potential autoregulation of both neurotrans-mitters. The next step is to continue these recordings in awake,freely moving animals with the goal of exploring glutamate andACh signaling in the prefrontal cortex during behavior without thepotential confound of anesthesia. Also planned are experimentsthat use drugs such as TTX and TBOA to determine the neuronalcontribution to glutamate and ACh signals in the mPFC. Addition-ally, while these studies used separate MEAs to measure glutamateand ACh, the development of a novel MEA design that allows for
measurement of multiple chemicals of interest at the same time(Hascup et al., 2007) should prove to be very useful for deter-mining relationships between different neurotransmitter systemsin vivo.
uroscie
A
ss
R
A
A
A
B
B
B
B
B
B
B
B
B
B
B
B
B
C
C
DD
d
D
D
F
F
F
C.E. Mattinson et al. / Journal of Ne
cknowledgements
This work was supported by USPHS grants DA 017186 and salaryupport from a training grant T32 DA016176 for Catherine Mattin-on.
eferences
bekawa T, Ohmori T, Ito K, Koyama T. D1 dopamine receptor activation reducesextracellular glutamate and GABA concentrations in the medial prefrontal cor-tex. Brain Res 2000;867:250–4.
rnold HM, Fadel J, Sarter M, Bruno JP. Amphetamine-stimulated cortical acetyl-choline release: role of the basal forebrain. Brain Res 2001;894:74–87.
rnold HM, Nelson CL, Sarter M, Bruno JP. Sensitization of cortical acetylcholinerelease by repeated administration of nicotine in rats. Psychopharmacology(Berl) 2003;165:346–58.
ailey KR, Mair RG. Lesions of specific and nonspecific thalamic nuclei affect pre-frontal cortex-dependent aspects of spatial working memory. Behav Neurosci2005;119:410–9.
auer D, Gupta D, Harotunian V, Meador-Woodruff JH, McCullumsmith RE. Abnor-mal expression of glutamate transporter and transporter interacting moleculesin prefrontal cortex in elderly patients with schizophrenia. Schizophr Res2008;104:108–20.
enes FM, Sorensen I, Vincent SL, Bird ED, Sathi M. Increased density of glutamate-immunoreactive vertical processes in superficial laminae in cingulate cortex ofschizophrenic brain. Cereb Cortex 1992;2:503–12.
erger B, Thierry AM, Tassin JP, Moyne MA. Dopaminergic innervation of the rat pre-frontal cortex: a fluorescence histochemical study. Brain Res 1976;106:133–45.
igl V, Woolf NJ, Butcher LL. Cholinergic projections from the basal forebrain tofrontal, parietal, temporal, occipital, and cingulate cortices: a combined fluores-cent tracer and acetylcholinesterase analysis. Brain Res Bull 1982;8:727–49.
rooks JM, Sarter M, Bruno JP. D2-like receptors in nucleus accumbens nega-tively modulate acetylcholine release in prefrontal cortex. Neuropharmacology2007;53:455–63.
rown RM, Crane AM, Goldman PS. Regional distribution of monoamines in thecerebral cortex and subcortical structures of the rhesus monkey: concentrationsand in vivo synthesis rates. Brain Res 1979;168:133–50.
runo JP, Gash C, Martin B, Zmarowski A, Pomerleau F, Burmeister J, et al. Second-by-second measurement of acetylcholine release in prefrontal cortex. Eur J Neurosci2006;24:2749–57.
urbaeva G, Boksha IS, Tereshkina EB, Savushkina OK, Starodubtseva LI, TurishchevaMS. Glutamate metabolizing enzymes in prefrontal cortex of Alzheimer’s diseasepatients. Neurochem Res 2005;30:1443–51.
urmeister JJ, Gerhardt GA. Self-referencing ceramic-based multisite microelec-trodes for the detection and elimination of interferences from the measurementof l-glutamate and other analytes. Anal Chem 2001;73:1037–42.
urmeister JJ, Moxon K, Gerhardt GA. Ceramic-based multisite microelectrodes forelectrochemical recordings. Anal Chem 2000;72:187–92.
urmeister JJ, Pomerleau F, Huettl P, Gash CR, Werner CE, Bruno JP, et al. Ceramic-based multisite microelectrode arrays for simultaneous measures of choline andacetylcholine in CNS. Biosens Bioelectron 2008;23:1382–9.
urmeister JJ, Pomerleau F, Palmer M, Day BK, Huettl P, Gerhardt GA. Improvedceramic-based multisite microelectrode for rapid measurements of l-glutamatein the CNS. J Neurosci Methods 2002;119:163–71.
lapp-Lilly KL, Roberts RC, Duffy LK, Irons KP, Hu Y, Drew KL. An ultrastruc-tural analysis of tissue surrounding a microdialysis probe. J Neurosci Methods1999;90:129–42.
rook JM, Tomaskovic-Crook E, Copolov DL, Dean B. Low muscarinic receptor bind-ing in prefrontal cortex from subjects with schizophrenia: a study of Brodmann’sareas 8, 9, 10, and 46 and the effects of neuroleptic drug treatment. Am J Psy-chiatry 2001;158:918–25.
anbolt NC. Glutamate uptake. Prog Neurobiol 2001;65:1–105.ay BK, Pomerleau F, Burmeister JJ, Huettl P, Gerhardt GA. Microelectrode array stud-
ies of basal and potassium-evoked release of l-glutamate in the anesthetized ratbrain. J Neurochem 2006;96:1626–35.
e Brabander JM, van Eden CG, de Bruin JP, Feenstra MG. Monoamine concen-trations in rat prefrontal cortex and other mesolimbocortical structures inresponse to partial neonatal lesions of the medial prefrontal cortex. Brain Res1993;601:20–7.
el Arco A, Martinez R, Mora F. Amphetamine increases extracellular concentrationsof glutamate in the prefrontal cortex of the awake rat: a microdialysis study.Neurochem Res 1998;23:1153–8.
el Arco A, Segovia G, Garrido P, de Blas M, Mora F. Stress, prefrontal cortex andenvironmental enrichment: studies on dopamine and acetylcholine release andworking memory performance in rats. Behav Brain Res 2007;176:267–73.
erraro L, Tomasini MC, Gessa GL, Bebe BW, Tanganelli S, Antonelli T. The cannabi-noid receptor agonist WIN 55,212-2 regulates glutamate transmission in ratcerebral cortex: an in vivo and in vitro study. Cereb Cortex 2001;11:728–33.
rancis PT, Palmer AM, Snape M, Wilcock GK. The cholinergic hypothesis of
Alzheimer’s disease: a review of progress. J Neurol Neurosurg Psychiatry1999;66:137–47.rantz K, Harte M, Ungerstedt U, O’Connor WT. A dual probe characterization ofdialysate amino acid levels in the medial prefrontal cortex and ventral tegmentalarea of the awake freely moving rat. J Neurosci Methods 2002;119:109–19.
nce Methods 202 (2011) 199– 208 207
Friedemann MN, Gerhardt GA. Regional effects of aging on dopaminergic functionin the Fischer-344 rat. Neurobiol Aging 1992;13:325–32.
Georgieva J, Luthman J, Mohringe B, Magnusson O. Tissue and microdialysatechanges after repeated and permanent probe implantation in the striatum offreely moving rats. Brain Res Bull 1993;31:463–70.
Gigg J, Tan AM, Finch DM. Glutamatergic excitatory responses of anterior cingulateneurons to stimulation of the mediodorsal thalamus and their regulation byGABA: an in vivo iontophoretic study. Cereb Cortex 1992;2:477–84.
Gigg J, Tan AM, Finch DM. Glutamatergic hippocampal formation projections toprefrontal cortex in the rat are regulated by GABAergic inhibition and showconvergence with glutamatergic projections from the limbic thalamus. Hip-pocampus 1994;4:189–98.
Giuliano C, Parikh V, Ward JR, Chiamulera C, Sarter M. Increases in cholinergic neuro-transmission measured by using choline-sensitive microelectrodes: enhanceddetection by hydrolysis of acetylcholine on recording sites? Neurochem Int2008;52:1343–50.
Grabb MC, Sciotti VM, Gidday JM, Cohen SA, van Wylen DG. Neurochemical and mor-phological responses to acutely and chronically implanted brain microdialysisprobes. J Neurosci Methods 1998;82:25–34.
Gratton A, Hoffer BJ, Gerhardt GA. In vivo electrochemical studies of monoaminerelease in the medial prefrontal cortex of the rat. Neuroscience 1989;29:57–64.
Hara K, Harris RA. The anesthetic mechanism of urethane: the effects onneurotransmitter-gated ion channels. Anesth Analg 2002;94:313–8 (table ofcontents).
Hascup ER, Hascup KN, Stephens M, Pomerleau F, Huettl P, Gratton A, et al. Rapidmicroelectrode measurements and the origin and regulation of extracellularglutamate in rat prefrontal cortex. J Neurochem 2010;115:1608–20.
Hascup KN, Rutherford EC, Quintero JE, Day BK, Nickell JR, Pomerleau F, Huettl P,Burmeister JJ, Gerhardt GA. Second-by-second measures of l-glutamate andother neurotransmitters using enzyme-based microelectrode arrays. In: MichaelAC, Borland LM, editors. Electrochemical Methods for Neuroscience. Boca Raton(FL): CRC Press; 2007, Chapter 19.
Hedou G, Homberg J, Martin S, Wirth K, Feldon J, Heidbreder CA. Effect ofamphetamine on extracellular acetylcholine and monoamine levels in subterri-tories of the rat medial prefrontal cortex. Eur J Pharmacol 2000;390:127–36.
Henny P, Jones BE. Projections from basal forebrain to prefrontal cortex comprisecholinergic, GABAergic and glutamatergic inputs to pyramidal cells or interneu-rons. Eur J Neurosci 2008;27:654–70.
Hernandez LF, Segovia G, Mora F. Chronic treatment with a dopamine uptake blockerchanges dopamine and acetylcholine but not glutamate and GABA concentra-tions in prefrontal cortex, striatum and nucleus accumbens of the awake rat.Neurochem Int 2008;52:457–69.
Herzog CD, Nowak KA, Sarter M, Bruno JP. Microdialysis without acetyl-cholinesterase inhibition reveals an age-related attenuation in stimulatedcortical acetylcholine release. Neurobiol Aging 2003;24:861–3.
Houser CR, Crawford GD, Salvaterra PM, Vaughn JE. Immunocytochemical localiza-tion of choline acetyltransferase in rat cerebral cortex: a study of cholinergicneurons and synapses. J Comp Neurol 1985;234:17–34.
Huang M, Li Z, Dai J, Shahid M, Wong EH, Meltzer HY. Asenapine increases dopamine,norepinephrine, and acetylcholine efflux in the rat medial prefrontal cortex andhippocampus. Neuropsychopharmacology 2008;33:2934–45.
Hugues S, Garcia R, Lena I. Time course of extracellular catecholamine and gluta-mate levels in the rat medial prefrontal cortex during and after extinction ofconditioned fear. Synapse 2007;61:933–7.
Jay TM, Thierry AM, Wiklund L, Glowinski J. Excitatory amino acid pathway fromthe hippocampus to the prefrontal cortex. Contribution of AMPA receptors inhippocampo-prefrontal cortex transmission. Eur J Neurosci 1992;4:1285–95.
Karreman M, Moghaddam B. Effect of a pharmacological stressor on glutamate effluxin the prefrontal cortex. Brain Res 1996;716:180–2.
Kashani A, Lepicard E, Poirel O, Videau C, David JP, Fallet-Bianco C, et al. Loss ofVGLUT1 and VGLUT2 in the prefrontal cortex is correlated with cognitive declinein Alzheimer disease. Neurobiol Aging 2008;29:1619–30.
Lawler HC. Turnover time of acetylcholinesterase. J Biol Chem 1961;236:2296–301.Leonard CM. The prefrontal cortex of the rat. I. Cortical projection of the mediodorsal
nucleus. II. Efferent connections. Brain Res 1969;12:321–43.Lu W, Monteggia LM, Wolf ME. Withdrawal from repeated amphetamine admin-
istration reduces NMDAR1 expression in the rat substantia nigra, nucleusaccumbens and medial prefrontal cortex. Eur J Neurosci 1999;11:3167–77.
Lupinsky D, Moquin L, Gratton A. Interhemispheric regulation of the medial pre-frontal cortical glutamate stress response in rats. J Neurosci 2010;30:7624–33.
McDonald AJ. Glutamate and aspartate immunoreactive neurons of the rat basolat-eral amygdala: colocalization of excitatory amino acids and projections to thelimbic circuit. J Comp Neurol 1996;365:367–79.
McFarland K, Lapish CC, Kalivas PW. Prefrontal glutamate release into the core of thenucleus accumbens mediates cocaine-induced reinstatement of drug-seekingbehavior. J Neurosci 2003;23:3531–7.
McGaughy J, Kaiser T, Sarter M. Behavioral vigilance following infusions of 192IgG-saporin into the basal forebrain: selectivity of the behavioral impair-ment and relation to cortical AChE-positive fiber density. Behav Neurosci1996;110:247–65.
Mesulam MM, Mufson EJ, Wainer BH, Levey AI. Central cholinergic pathways in the
rat: an overview based on an alternative nomenclature (Ch1–Ch6). Neuroscience1983;10:1185–201.Meyer Jr EM, Engel DA, Cooper JR. Acetylation and phosphorylation of choline fol-lowing high or low affinity uptake by rat cortical synaptosomes. Neurochem Res1982;7:749–59.

2 urosci
M
M
M
N
N
N
N
O
O
O
P
P
P
P
R
R
mission on inhibitory interneurons in the prefrontal cortex in schizophrenia.
08 C.E. Mattinson et al. / Journal of Ne
iele M, Berners M, Boutelle MG, Kusakabe H, Fillenz M. The determination of theextracellular concentration of brain glutamate using quantitative microdialysis.Brain Res 1996;707:131–3.
ork A, Witten LM, Arnt J. Effect of sertindole on extracellular dopamine, acetyl-choline, and glutamate in the medial prefrontal cortex of conscious rats: acomparison with risperidone and exploration of mechanisms involved. Psy-chopharmacology (Berl) 2009;206:39–49.
rzljak L, Goldman-Rakic PS. Acetylcholinesterase reactivity in the frontal cortexof human and monkey: contribution of AChE-rich pyramidal neurons. J CompNeurol 1992;324:261–81.
andi P, Lunte SM. Recent trends in microdialysis sampling integrated with conven-tional and microanalytical systems for monitoring biological events: a review.Anal Chim Acta 2009;651:1–14.
eigh-McCandless G, Kravitz BA, Sarter M, Bruno JP. Stimulation of cortical acetyl-choline release following blockade of ionotropic glutamate receptors in nucleusaccumbens. Eur J Neurosci 2002;16:1259–66.
ickell J, Pomerleau F, Allen J, Gerhardt GA. Age-related changes in the dynamicsof potassium-evoked l-glutamate release in the striatum of Fischer 344 rats. JNeural Transm 2005;112:87–96.
irogi R, Mudigonda K, Kandikere V, Ponnamaneni R. Quantification of acetylcholine,an essential neurotransmitter, in brain microdialysis samples by liquid chro-matography mass spectrometry. Biomed Chromatogr 2010;24:39–48.
kuda T, Haga T, Kanai Y, Endou H, Ishihara T, Katsura I. Identification and charac-terization of the high-affinity choline transporter. Nat Neurosci 2000;3:120–5.
lbrich HM, Valerius G, Rusch N, Buchert M, Thiel T, Hennig J, et al. Frontolimbicglutamate alterations in first episode schizophrenia: evidence from a magneticresonance spectroscopy study. World J Biol Psychiatry 2008;9:59–63.
ni-Orisan A, Kristiansen LV, Haroutunian V, Meador-Woodruff JH, McCullumsmithRE. Altered vesicular glutamate transporter expression in the anterior cingulatecortex in schizophrenia. Biol Psychiatry 2008;63:766–75.
axinos G, Watson C. The rat brain in stereotaxic coordinates. 5th ed. San Diego, CA:Academic Press; 2004.
erry JL, Joseph JE, Jiang Y, Zimmerman RS, Kelly TH, Darna M, et al. Prefrontalcortex and drug abuse vulnerability: translation to prevention and treatmentinterventions. Brain Res Rev 2011;65:124–49.
irot S, Jay TM, Glowinski J, Thierry AM. Anatomical and electrophysiological evi-dence for an excitatory amino acid pathway from the thalamic mediodorsalnucleus to the prefrontal cortex in the rat. Eur J Neurosci 1994;6:1225–34.
rus AJ, Huang M, Li Z, Dai J, Meltzer HY. The neurotensin analog NT69L enhancesmedial prefrontal cortical dopamine and acetylcholine efflux: potentiationof risperidone-, but not haloperidol-, induced dopamine efflux. Brain Res2007;1184:354–64.
agozzino ME, Unick KE, Gold PE. Hippocampal acetylcholine release during
memory testing in rats: augmentation by glucose. Proc Natl Acad Sci USA1996;93:4693–8.ajkowska G, Niewiadomska G, Kosmal A. Regional and laminar variations in acetyl-cholinesterase activity within the frontal cortex of the dog. J Chem Neuroanat1993;6:117–30.
ence Methods 202 (2011) 199– 208
Romanides AJ, Duffy P, Kalivas PW. Glutamatergic and dopaminergic afferents tothe prefrontal cortex regulate spatial working memory in rats. Neuroscience1999;92:97–106.
Rutherford EC, Pomerleau F, Huettl P, Stromberg I, Gerhardt GA. Chronic second-by-second measures of l-glutamate in the central nervous system of freely movingrats. J Neurochem 2007;102:712–22.
Sarter M, Nelson CL, Bruno JP. Cortical cholinergic transmission and cortical infor-mation processing in schizophrenia. Schizophr Bull 2005;31:117–38.
Schultz KN, Kennedy RT. Time-resolved microdialysis for in vivo neurochemicalmeasurements and other applications. Annu Rev Anal Chem (Palo Alto Calif)2008;1:627–61.
Selim M, Bradberry CW. Effect of ethanol on extracellular 5-HT and glutamate in thenucleus accumbens and prefrontal cortex: comparison between the Lewis andFischer 344 rat strains. Brain Res 1996;716:157–64.
Sofuoglu M, Mooney M. Cholinergic functioning in stimulant addiction: implicationsfor medications development. CNS Drugs 2009;23:939–52.
Stephens ML, Quintero JE, Pomerleau F, Huettl P, Gerhardt GA. Age-related changesin glutamate release in the CA3 and dentate gyrus of the rat hippocampus.Neurobiol Aging 2011;32(5):811–20.
Thierry AM, Deniau JM, Chevalier G, Ferron A, Glowinski J. An electrophysiologicalanalysis of some afferent and efferent pathways of the rat prefrontal cortex. ProgBrain Res 1983;58:257–61.
Timmerman W, Westerink BH. Brain microdialysis of GABA and glutamate: whatdoes it signify? Synapse 1997;27:242–61.
Torres EM, Perry TA, Blockland A, Wilkinson LS, Wiley RG, Lappi DA,et al. Behavioural, histochemical and biochemical consequences of selectiveimmunolesions in discrete regions of the basal forebrain cholinergic system.Neuroscience 1994;63:95–122.
Trabace L, Cassano T, Colaianna M, Castrignano S, Giustino A, Amoroso S, et al.Neurochemical and neurobehavioral effects of ganstigmine (CHF2819), a novelacetylcholinesterase inhibitor, in rat prefrontal cortex: an in vivo study. Phar-macol Res 2007;56:288–94.
Tsai G, Passani LA, Slusher BS, Carter R, Baer L, Kleinman JE, et al. Abnormal excita-tory neurotransmitter metabolism in schizophrenic brains. Arch Gen Psychiatry1995;52:829–36.
Welty N, Shoblock JR. The effects of thioperamide on extracellular levels of glu-tamate and GABA in the rat prefrontal cortex. Psychopharmacology (Berl)2009;207:433–8.
Williams JM, Steketee JD. Cocaine increases medial prefrontal cortical gluta-mate overflow in cocaine-sensitized rats: a time course study. Eur J Neurosci2004;20:1639–46.
Woo TU, Kim AM, Viscidi E. Disease-specific alterations in glutamatergic neurotrans-
Brain Res 2008;1218:267–77.Zmarowski A, Wu HQ, Brooks JM, Potter MC, Pellicciari R, Schwarcz R, et al.
Astrocyte-derived kynurenic acid modulates basal and evoked cortical acetyl-choline release. Eur J Neurosci 2009;29:529–38.