Development of a microelectrode array sensing platform for combination electrochemical and...
19
Development of a Microelectrode Array Sensing Platform for Combination Electrochemical and Spectrochemical Aqueous Ion Testing Robert D. Gardner 1 , Anhong Zhou 1,* , and Nephi A. Zufelt 2 1 Department of Biological and Irrigation Engineering, Utah State University, 4105 Old Main Hill, Logan, Utah 84322-4105, U.S.A 2 Department of Mechanical and Aerospace Engineering, Utah State University, 4130 Old Main Hill, Logan, UT 84322-4130, U.S.A Abstract A microelectrode array sensor platform was designed and fabricated to increase diversity, flexibility, and versatility of testing capabilities over that of traditionally reported sensor platforms. These new sensor platforms consist of 18 individual addressable microelectrodes, photolithography fabricated, that employ a glass base substrate and a resist polymer layer that acts as an insulating agent to protect the circuitry and wiring of the sensor from undesired solution interactions. Individually addressable microelectrodes increase diversity by allowing isolated electrochemical testing between electrodes, global array testing, or some combination of electrodes to perform electrochemical methods. Furthermore, because of the optical transparency of the glass base substrate and the resist mask layer, along with the small size of the electrode array, spectrochemical analysis is possible within the sample area that acts as electrochemical cell and cuvette, while the microelectrode array passively resides within the optical path length during spectrochemical testing. This unique arrangement offers improved testing possibilities for various applications, including simultaneous electrochemical and spectrochemical analysis in environmental testing, identification or quantification of possible species for bioavailability in the biotechnology field, and process control in industrial applications. Electrochemical characteristics and spectrochemcial use of the sensor platform are proven with potassium ferricyanide, an electrochemical standard analyte, and electrochemical measurements are compared against a commercially available working electrode of similar size. Additionally, the electrochemical method of differential pulse anodic stripping voltammetry is performed with the sensor platform to detect copper and lead heavy metal ions in aqueous solution, demonstrating the potential for use with environmental samples. Keywords Microelectrode array; potassium ferricyanide; spectrochemical analysis; photolithography; electrochemical cell Primary corresponding author contact: Prof. Anhong Zhou, Department of Biological and Irrigation Engineering, Utah State University, 4105 Old Main Hill, Logan, Utah 84322-4105, U.S.A. Tel: 1-435-797-2863, Fax: 1-435-797-1248, e-mail: [email protected]. Publisher's Disclaimer: This is a PDF file of an unedited manuscript that has been accepted for publication. As a service to our customers we are providing this early version of the manuscript. The manuscript will undergo copyediting, typesetting, and review of the resulting proof before it is published in its final citable form. Please note that during the production process errors may be discovered which could affect the content, and all legal disclaimers that apply to the journal pertain. NIH Public Access Author Manuscript Sens Actuators B Chem. Author manuscript; available in PMC 2010 February 2. Published in final edited form as: Sens Actuators B Chem. 2009 February 2; 136(1): 177. doi:10.1016/j.snb.2008.10.031. NIH-PA Author Manuscript NIH-PA Author Manuscript NIH-PA Author Manuscript
-
Upload
independent -
Category
Documents
-
view
2 -
download
0
Transcript of Development of a microelectrode array sensing platform for combination electrochemical and...
Development of a Microelectrode Array Sensing Platform forCombination Electrochemical and Spectrochemical Aqueous IonTesting
Robert D. Gardner1, Anhong Zhou1,*, and Nephi A. Zufelt21 Department of Biological and Irrigation Engineering, Utah State University, 4105 Old Main Hill,Logan, Utah 84322-4105, U.S.A2 Department of Mechanical and Aerospace Engineering, Utah State University, 4130 Old Main Hill,Logan, UT 84322-4130, U.S.A
AbstractA microelectrode array sensor platform was designed and fabricated to increase diversity, flexibility,and versatility of testing capabilities over that of traditionally reported sensor platforms. These newsensor platforms consist of 18 individual addressable microelectrodes, photolithography fabricated,that employ a glass base substrate and a resist polymer layer that acts as an insulating agent to protectthe circuitry and wiring of the sensor from undesired solution interactions. Individually addressablemicroelectrodes increase diversity by allowing isolated electrochemical testing between electrodes,global array testing, or some combination of electrodes to perform electrochemical methods.Furthermore, because of the optical transparency of the glass base substrate and the resist mask layer,along with the small size of the electrode array, spectrochemical analysis is possible within the samplearea that acts as electrochemical cell and cuvette, while the microelectrode array passively resideswithin the optical path length during spectrochemical testing. This unique arrangement offersimproved testing possibilities for various applications, including simultaneous electrochemical andspectrochemical analysis in environmental testing, identification or quantification of possible speciesfor bioavailability in the biotechnology field, and process control in industrial applications.Electrochemical characteristics and spectrochemcial use of the sensor platform are proven withpotassium ferricyanide, an electrochemical standard analyte, and electrochemical measurements arecompared against a commercially available working electrode of similar size. Additionally, theelectrochemical method of differential pulse anodic stripping voltammetry is performed with thesensor platform to detect copper and lead heavy metal ions in aqueous solution, demonstrating thepotential for use with environmental samples.
KeywordsMicroelectrode array; potassium ferricyanide; spectrochemical analysis; photolithography;electrochemical cell
Primary corresponding author contact: Prof. Anhong Zhou, Department of Biological and Irrigation Engineering, Utah State University,4105 Old Main Hill, Logan, Utah 84322-4105, U.S.A. Tel: 1-435-797-2863, Fax: 1-435-797-1248, e-mail: [email protected]'s Disclaimer: This is a PDF file of an unedited manuscript that has been accepted for publication. As a service to our customerswe are providing this early version of the manuscript. The manuscript will undergo copyediting, typesetting, and review of the resultingproof before it is published in its final citable form. Please note that during the production process errors may be discovered which couldaffect the content, and all legal disclaimers that apply to the journal pertain.
NIH Public AccessAuthor ManuscriptSens Actuators B Chem. Author manuscript; available in PMC 2010 February 2.
Published in final edited form as:Sens Actuators B Chem. 2009 February 2; 136(1): 177. doi:10.1016/j.snb.2008.10.031.
NIH
-PA Author Manuscript
NIH
-PA Author Manuscript
NIH
-PA Author Manuscript

IntroductionTrace chemical species identification and quantification are critical to analytical chemistryexperiments in industrial, environmental, and academic research. Many systems andenvironments require testing for trace levels of ions or molecules that reside, contaminate, ortransform through some reaction. Salinity is an important criterion of water control in bothagricultural and municipal water supplies. Salts are strong electrolytes consisting of metalcations and counter ions that disassociate in aqueous solutions. Metal contaminates such ascopper, lead, zinc, and cadmium can be present in foods, beverages, drinking water, and aquaticenvironments.[1–4] Alternatively, ions can be important trace nutrients for biological speciesgrowth in an aqueous medium, and monitoring their concentrations can improve theinformation derived from laboratory studies. Because charged species have the potential toimprove studies or raise levels of concern, accurately monitoring or quantifying them is ofgreat importance.
Traditionally, environmental or industrial process samples are collected on site and removedto a laboratory facility where electrochemical, chromatographic, and spectroscopic methodsare employed to detect, observe, and quantify ions or ionic species within the sample. Examplesof typical methods utilized include: inductively coupled plasma - mass spectrometry (ICP-MS),differential pulse anodic stripping Voltammetry (DPASV) on mercury based electrodes,graphite furnace atomic absorption spectrometry (GF-AAS), cold vapor atomic absorptionspectrometry (CV-AAS), and cold vapor atomic fluorescence spectrometry (CV-AFS).[5–7]While many of these methods capitalize on low detection abilities and large linear dynamicconcentration test ranges, these test methods can be insensitive to some of the charged speciesof interest and take an undesirably long amount of time to report results. The samples also havea greater chance of exposure to contamination due to the transportation and relocation prior totesting.[1,8] Some advantages of new analytical tools and sensors that are capable of real-timeprocess monitoring or environmental monitoring include: improved process control,minimization of environmental impact, and continuous monitoring capabilities with optionsfor early detection.[1,2] By offering rapid return of results, early action can be initiated whenproblematic issues are detected within systems.
Ions and charged species of interest can be monitored on site with an appropriately designedsensor with the aforementioned capabilities. Additionally, with the advances and trends towardcleaner (green) analytical chemistry, a new sensor system should be capable of monitoring anenvironment without polluting the system or affecting it in any adverse manner.[1]Electrochemical (EC) methods have been proven effective for ion detection. Features likeindependence from an optical path length and high sensitivity approaching that of fluorescence,along with low power requirements, low cost, ability to be miniaturized, and adaptability withadvanced micromachining and microfabrication technologies, all increase the appeal of thistest method.[1] Furthermore, by appropriate design of the sensor platform, the EC system canreside in a quasi-passive manner, allowing traditional spectrochemical (SC) methods to beemployed. New analytical tools that offer greater diversity and flexibility in testing increaseapplication versatility.
Traditionally, EC working electrodes are large electrodes in the centimeter or millimeter scale.However, since the advent of microelectrodes, it is no longer necessary to rely on bulkyelectrodes or difficult electrochemical cells when fast, easy, environmentally friendlyelectrochemical systems can be designed.[1] Additionally, miniaturization of electrodes offersmany practical and fundamental advantages: reduced resistance (ohmic drop), reduced sampleconsumption, ability to incorporate many electrodes in a small area, and increased ability tofacilitate measurements in low-ionic-strength water samples.[1]
Gardner et al. Page 2
Sens Actuators B Chem. Author manuscript; available in PMC 2010 February 2.
NIH
-PA Author Manuscript
NIH
-PA Author Manuscript
NIH
-PA Author Manuscript

The foremost advantage of using this miniaturized electrode is the mass transport enhancementdue to nonlinear diffusion properties, which is further amplified when multiple electrodes areutilized in an array. Nonlinear diffusion occurs at the boundary of the electrode due to theincreased perimeter-to-surface area exhibited by microelectrodes, as compared to largertraditional electrodes. Current density is increased at the electrode boundaries, yielding currentamplification.[3,9–15] Extensive work has been done to show that microdisk designs (circularshaped disk) have hemispherical diffusion patterns and microband designs have hemisphericalor a combination of hemicylindrical-hemispherical diffusion patterns depending on whetherthey are square- or rectangular-shaped, respectively.[3,9,13,15] Furthermore, 3-D(hemispherical) diffusion associated with microelectrodes has a steady state analyte mass fluxto the electrode surface, resulting in sigmoidal cyclic voltammograms instead of the peakshaped voltammograms observed with traditional or non-square microband electrodes.[3,15]With their small size, larger perimeter-to-surface area, and nonlinear radial diffusion throughthe diffusion zones, microelectrodes attain larger response changes and improved signal-to-noise ratios.
By utilizing microelectrodes in an array fashion, one can capitalize on the enhanced propertiesinherent in the smaller microelectrode size. Additionally, a greater diversity of testing ispossible with a sensor platform capable of multiple microelectrode combinations. With the useof a multi-channel potentiostat or a multiplexer, one can simply use all microelectrodesindependently, cycling through each electrode, scanning at different potential ranges; or usethe microelectrodes as a census electrode with all electrodes performing as one to capitalizeon their individual enhancements while allowing greater current flow. This is beneficial dueto the small current (nA–pA) associated with individual microelectrodes. The option also existsfor some situationally unique combinations of the two former scenarios. In these cases, inter-electrode spacing must be such that diffusion zones from the individual microelectrodes do notoverlap to constructively interfere and produce planar diffusion zones like those associatedwith macroelectrodes. Extensive studies comparing inter-electrode spacing with currentresponses have reportedly used or suggested using an inter-electrode spacing of ten times thewidth, or diameter, of the electrode.[2,3,15–17]
As previously mentioned, spectroscopy within the sensor test area can be realized withintelligent design in the base sensor substrates and a complimentary insulation mask layer toisolate circuitry. In the majority of cases, microelectrodes are grown, deposited, or printed onsilicon or silicon carbide base materials; however, glass or polished quartz offer the benefitsof low electrical conductivity and optical transparency. Also, there are a variety of mask layersthat can be utilized in this type of sensor platform including oxide, silicon nitride, or simpleresist coatings.[10,14,17] Based on the 1981 work by Aoki, as well as fabrication simplicity,the resist polymer coating was deemed advantageous over other coatings, although siliconnitride would be less susceptible to corrosion.[10,17] Furthermore, thin resist layers maintaintransparency characteristics which allow spectroscopic measurements to be made, while siliconnitride would not. By using the simplistic fabrication approach of opening holes in the resistmask layer directly above the electrodes and then utilizing plasma etch to clean the electrodesurface, low cost, reliable, and sensitive sensor platforms can be developed. This approach hasbeen performed on a traditional macroelectrode and with silicon based platforms, but aliterature search failed to show where it has been performed on a microelectrode array for usein both EC and SC testing.[10,14] Additionally, the transient current response through recessedmicroelectrodes maintains the current amplification from the enhanced nonlinear diffusion.[9]
This paper is a summary of the work done to develop a low cost, reliable sensor platform thatis sensitive and selective to ions that may act as interesting constituents or contaminates inaqueous systems. This platform utilizes miniaturized microelectrodes that reside in a planar
Gardner et al. Page 3
Sens Actuators B Chem. Author manuscript; available in PMC 2010 February 2.
NIH
-PA Author Manuscript
NIH
-PA Author Manuscript
NIH
-PA Author Manuscript

array design for use in EC test methods that, when coupled with working microelectrodes,allow trace levels of ions to be detected. Additionally, due to the small size of themicroelectrode array (MEA), SC methods may be employed on analyte aqueous solutionswhere the sample container acts as both cuvette and EC cell for SC and EC techniques,respectively. SC methods can add diversity in testing, allowing additional information to beobtained in aqueous systems. This work has demonstrated the capability to simultaneouslyconduct EC and SC measurements of metal ions in an aqueous sample, which provides newopportunities to develop a portable, environmentally friendly, and reliable sensing systems forwater quality monitoring.
ExperimentalMicroelectrode Sensor Design
The MEAs are based on a planar design where 10 μm × 10 μm gold working electrodes arepositioned (1 μm thick) on glass to form arrays. Adequate adherence to glass is accomplishedby a thin (50 nm) layer of titanium between the gold surface and glass support base. Glass waschosen as the support base for its low electrical conductivity and optical transparency. Theexact geometry of these electrodes and arrays is as follows: nine 50 μm × 50 μm base electrodepads with 30 μm circuitry connecting the electrode with outer slide edge electronic connectionpads, utilized for connection to an external electrochemical analyzer, comprise half an array.Two half arrays work together to form an array with connection pads on each side of the glassslide. The three central electrodes in a nine electrode half array have short spans of 10 μmcircuitry for ease in fabrication. A final layer of Shipley photoresist 1813 masks the entire slidewith the exception of the 10 μm × 10 μm holes positioned over the 50 μm × 50 μm pads andthe electronic connection pads on the glass slide edge. Figure 1 shows these half arrays bothbefore and after the final photoresist mask is applied and heat treated. Figure 2 shows a finishedglass slide for electrochemical configuration, with all the individual electrodes comprising thethree arrays, as well as the numbering scheme developed to label each microelectrode. Sensorplatform attachment to a 96-welled plate for spectroscopic measurements is not shown.
Photolithography Fabrication of MEAsSensors were constructed by implementing basic photolithography methodology utilized inintegrated circuit fabrication. Electron beam sputtering was employed to deposit a thin layerof titanium, approximately 50 nm, to the exterior of a glass microscope slide acting as bondingagent between glass elements and a gold layer, approximately 1 μm thick. Layer thicknesseswere monitored with a piezoelectric quartz crystal microbalance thickness monitor. Gold-coated slides were stripped to exact geometries specified for the 54 individually isolatedelectrodes with a photolithography technique, summarized as follows:
A. A. Shipley photoresist 1813 was applied to thickness by spinning 40 seconds at 2000rpm on a spin coater. The photoresist was soft heat set on the slide surface by heatingto 95°C for 90 seconds on a general hot plate.
B. B. The slide was then exposed, on a mask aligner, to light from a mercury lamp at365 nm wavelength for 8 seconds, followed by development and deionized waterrinse.
C. C. The gold layer was removed from everywhere exposed to UV light with an iodinebased gold etch, followed by a buffered oxide etch (BOE) to remove the titaniumlayer. The remaining metal comprised the contact pads, circuitry, and electrode padson the slides.
D. D. A second layer of Shipley photoresist 1813 was spun and heat set at the parameterspreviously reported, followed by UV exposure in a mask aligner with a secondary
Gardner et al. Page 4
Sens Actuators B Chem. Author manuscript; available in PMC 2010 February 2.
NIH
-PA Author Manuscript
NIH
-PA Author Manuscript
NIH
-PA Author Manuscript

mask exposing 10 μm × 10 μm holes over each 50 µm × 50 µm electrode pad as wellas the electronic contact pads on outer slide edge. Once more, development and rinsingwere preformed with the previous parameters.
E. E. Electrode surfaces were cleaned with an evacuated oxygen plasma etch for 1 minuteto remove organic material.
The slides were completed with three arrays per slide, giving a total of 54 individually isolatedworking electrodes per slide. The final step in sensor construction was the adhesion of sterolplastic wells cut from a 96-well plate, or attachment, to the bottom of a 96-well plate forspectroscopic testing. This prototype sensor platform was designed for future application andcoupling with a 96-well plate; herein we report experimental results from wells previously cutout of the plate and adhered to the sensor for EC testing, and platforms attached to the 96-wellplate for SC testing. The attachment was accomplished using a non-conductive, solvent free,urethane epoxy (Royal-Hardman), shown to have no effect on the photoresist mask or theindividual circuitry that comprised the MEA.
Electrochemical Measurements and ReagentsAll electrochemical testing was performed using a CHI 1220 Electrochemical Analyzer (CHInstruments, TX, USA), and all experiments were done in the standard three electrodeconfiguration. The gold electrodes of the MEA, fabricated as aforementioned, or a 10 μm goldwire working electrode (CH Instruments) were utilized as the working electrode, with a silver|silver chloride (Ag|AgCl) reference electrode and platinum wire counter electrode (both fromCH Instruments). Polishing of the 10 μm gold wire working electrode was done by successivepolishing using 1 (bare borundum sanding paper only), 0.3, 0.1, and 0.05 μm alumina slurries,followed by thoroughly rinsing with deionized water. The MEA gold working electrodes wereutilized ‘as is’ after the oxygen plasma etch treatment described earlier.
Cyclic voltammetry testing was performed on concentrations of 0.05, 0.1, 0.3, 0.5, 0.8, and 1mM K3Fe(CN)6 in 0.01 M PBS (both from Sigma-Aldrich) and recorded at the workingelectrode. Differential pulse anodic stripping voltammetry was performed on a 50 ppb Cu and50 ppb Pb mixed analyte solution with HNO3 as counter electrolyte prepared from 1000 ppm,2% HNO3, Cu and Pb standards (Fisher Scientific) and recorded at the working electrode. Thissolution was diluted to exact concentration with 18 MΩ deionized water. The K3Fe(CN)6 in0.01 M PBS solutions and 50 ppb Cu and Pb in deionized H2O were deoxygenated by nitrogenpurge for at least 10 minutes prior to testing. Table 1 shows the experimental parameters forcyclic and differential pulse anodic stripping voltammetry testing.
The electrochemical cell consisted of a sterol plastic well approximately 300 μl volume (cutfrom a Falcon flat bottom 96-well plate) for the MEA working electrode tests, and a 25 mlglass beaker, for the 10 μm gold wire working electrode tests. The counter and referenceelectrodes were inserted through the top opening for the MEA working electrode tests, and allthree electrodes were inserted through the top opening of the glass beaker for the 10 μm Auwire working electrode tests.
Spectrochemical analysis was performed using Multiskan Spectrophotometer (ThermoLabsystems, MA, USA) in 96-well plate configuration utilizing 0.01 M PBS and 1.0 mMK3Fe(CN)6 in a 0.01 M PBS solution. The MEA sensor platform was attached to the bottomof a modified Falcon flat bottom 96-well plate.
Results and DiscussionInitial tests to investigate electrochemical behaviors and to determine if the MEA electrodesare operational were performed using cyclic Voltammetry (CV) measurements on the ferric/
Gardner et al. Page 5
Sens Actuators B Chem. Author manuscript; available in PMC 2010 February 2.
NIH
-PA Author Manuscript
NIH
-PA Author Manuscript
NIH
-PA Author Manuscript

ferrocyanide redox couple. It is essential to verify the operation of each electrode in an arrayformat before more advanced EC testing methods may be employed utilizing these electrodes.Solutions of 0.3 and 0.5 mM K3Fe(CN)6 in 0.01 M PBS were tested on all 18 individual MEAelectrodes within one test site, utilizing the potential range 0.5 to −0.1 V and a scan rate of 10mV/s. Figure 3 shows the individual plots for the 18 electrodes comprising one test site on thesensor platform. Each individual MEA electrode portrays the steady state sigmoidal shape withno transient limited peak indicative of nonlinear diffusion and current density enhancement.Furthermore, the responses are in agreement with CV curves from literature.[3,14,17,18] Theindividual plots for the 18 electrodes tested at 0.5 mM K3Fe(CN)6 in 0.01 M PBS were notincluded in this report but are similar in form to those shown in Figure 3.
The average response, with standard deviation, between the 18 electrodes at both 0.3 and 0.5mM K3Fe(CN)6 in 0.01 M PBS is shown in Figure 4. There is a small amount of variationbetween electrodes at both 0.3 mM and 0.5 mM K3Fe(CN)6 in 0.01 M PBS. The responsesindicate a lower amount of variation at the lower 0.3 mM concentration than that of the higher0.5 mM concentration. A possible reason for the variance may be saturation of the sensor’sability to reduce and oxidize the K3Fe(CN)6 by excess analyte in solution, indicating that thelinear full span output or the linear testing range of the sensor has been surpassed and theresponse has become nonlinear as it approaches some asymptotic current value. Anotherpossible reason for the small variation is in the small circuitry resistive differences betweenthe electrodes comprising an array. At this point, we believe the variation increase in 0.5 mMcompared to that of 0.3 mM to be a product of resistance difference between individualmicroelectrodes.
In spite of the small variation between electrodes, there is significant difference betweenresponses at the tested concentrations. As expected, the higher 0.5 mM analyte concentrationgave a response of approximately 530 pA, compared to approximately 360 pA for the 0.3 mManalyte, as shown in Figure 4. Furthermore, the average responses of the 18 MEA electrodes,with respect to both concentrations, have non-overlapping standard deviation differences.
Repeatability and drift characteristics were investigated by five successive runs with 0.1 mMK3Fe(CN)6 in 0.01 M PBS, 0.5 to −0.1 V with scan rate of 60 mV/s, shown in Figure 5; (a)shows individual 5 cycle voltammograms and (b) shows the average between the cycles andstandard deviation between cycles. Again the sigmoidal steady state curve is present with notransient diffusion limited peaks indicative of the current density and diffusionalenhancements. Results indicate these electrodes have a high degree of repeatability as nosignificant drift is observed over the five runs tested. There was a slight difference with theinitial onset of the reducing path observed on the first cycle tested, but it is negligible becausethe maximum current response is correlated with concentration, which lies at the end of thereducing path at −0.1 V. At this maximum current response, there is almost no differencebetween the five cycles tested, as noted by the standard deviation residing atop the average,shown in red and black, respectively, in Figure 5.
Figure 6 shows CV testing from .5 V to −0.1 V with a scan rate of 10 mV/s on solutions of (a)0.05, 0.1, 0.3, 0.5, 0.8, and 1 mM K3Fe(CN)6 in 0.01 M PBS for a MEA electrode, and (b)0.05, 0.1, 0.3, 0.5, and 1 mM K3Fe(CN)6 in 0.01 M PBS for a 10 μm electrode purchased fromCH Instruments for comparison reasons. The sigmoidal shape curve is observed on all theresponses within the concentration range tested with no transient limited peak formation, forthe MEA electrode. The sigmoidal steady state shape curve is present with concentrationsgreater than and equal to 0.3 mM for the 10 μm CH electrode; however, the low concentrations0.05 mM and 0.1 mM did not have a sigmoidal shape, but rather increased to a maximumcurrent response at −0.1 V. At 0.5 V, the response returned to the initial state, but did not cometo a resolving plateau. This indicates the solution was continuously reduced and oxidized
Gardner et al. Page 6
Sens Actuators B Chem. Author manuscript; available in PMC 2010 February 2.
NIH
-PA Author Manuscript
NIH
-PA Author Manuscript
NIH
-PA Author Manuscript

throughout the entire reducing and oxidizing passes, respectively. In other words, there isimplication that the full extent of combined linear and nonlinear diffusion was not achievedby this commercial 10 μm electrode when tested in these low analyte concentrations.
Peak current response vs. mediator concentration plots were constructed for (c) MEA CVresults and (d) 10 μm CH electrode CV results. There is a strong linear correlation to theconcentration responses for both electrodes tested, where the squared correlation coefficient(R2) equals 0.981 and 0.991, for the MEA electrode and the 10 μm CH electrode, respectively.The span output over the concentrations tested occurred with the highest concentration tested(1.0 mM) and is approximately 1.3 nA and 1.1 nA for the MEA electrode and the 10 μm CHelectrode, respectively. This indicates the MEA electrode is more sensitive to the sameconcentration of K3Fe(CN)6 within the solution ranges tested.
In order to test the MEA sensor platform’s ability to act passively when spectrochemical testsoccur within the electrochemical cell acting as cuvette, a MEA sensor slide was attached to thebottom of a Falcon 96-well spectrophotometric plate. The excitation light passed from the topof the well, through the analyte solution, then through the MEA sensor slide to thephotomultiplier tube. Figure 7 shows the visible absorbance spectrum of 0.01 M PBS, shownin red, and 1 mM K3Fe(CN)6 in 0.01 M PBS, shown in blue, where the microelectrode array(resist polymer coating included) is attached to the bottom of the well. Also included is a controlmeasurement of 1 mM K3Fe(CN)6 in 0.01 M PBS, shown in black, measured within anunaltered well. Absorbance was measured from 350 – 700 nm with a scan increment of 5 nm.Comparison between the 1 mM K3Fe(CN)6 in 0.01 M PBS and 0.01 M PBS responses showa distinct absorbance peak at approximately 410 nm attributed to the K3Fe(CN)6 analyte. Thewavelength is confirmed by comparison with 1 mM K3Fe(CN)6 in 0.01 M PBS tested in anunaltered well, where the same peak formation was observed. There was an increase inabsorbance at 410 nm between the MEA altered and native curves, blue and black, respectively.This increase in sensitivity can be attributed to possible advantageous optical transparencycharacteristics of the glass based MEA sensor substrate as opposed to the native characteristicsof the unaltered plastic 96-well plate holds, or a linear combination of increased absorbancethe MEA slide may impose at 410 nm. However, the significant absorbance signal recorded inthe presence of the MEA sensor platform confirms the ability to passively reside within theoptical path length during spectrochemical analysis, thus adding a new dimension to the testingability of the MEA sensor platform when attached to a 96-well plate.
Although the EC and SC results and discussion have thus far been conducted independently,the very positive results for both types of testing methods drive future research towardsimultaneous SC and EC testing. Thus, the combined sensor platform offers many possibilities,in many fields, to increase the speed and diversity of testing. For instance, environmental watersamples can be taken for both optical density measurements and heavy metal ion analysis. Thissensor platform will allow simultaneous testing for the desired investigations. Toward that end,a MEA electrode was utilized to perform stripping analysis with differential pulse anodicstripping voltammetry (DPASV) in order to demonstrate the EC component of the platformfor such an investigation.
Stripping analysis is a powerful electrochemical technique capable of detecting metals at traceconcentrations.[1–4,6,8,11,18–21] DPASV is essentially a two phase testing technique. Phaseone employs an underpotential held constant for a certain amount of time, effectively reducingand electroplating the electrochemical analyte on the electrode surface. Phase two beginssweeping the potential towards overpotential and the plated analyte is oxidized and strippedoff. Electrochemical analytes (e.g., heavy metal ions) have different oxidation-reductionpotentials specific to the analyte species of interest, and stripping the analyte from the electrodesurface causes a significant change in current at this oxidation-reduction potential. Therefore,
Gardner et al. Page 7
Sens Actuators B Chem. Author manuscript; available in PMC 2010 February 2.
NIH
-PA Author Manuscript
NIH
-PA Author Manuscript
NIH
-PA Author Manuscript

this testing technique can be utilized on individual or mixed analyte systems where analyteconcentrations are correlated to the change in current registered at oxidation-reductionpotentials which will show as peaks on voltammograms recorded during the sweeping phaseof DPASV testing. Speciation is accomplished by correlating oxidation potentials of analytesto peaks of the voltammogram.
DPASV was done on 50 ppb mixed Cu and 50 ppb Pb solutions with HNO3 as the counterelectrolyte. Figure 8 shows the DPASV responses of the 50 ppb analyte solutions, withscanning range of −0.6 V to 0.4 V, 60 s quiescent preconcentration. Both Pb and Cu attributedpeaks are present at the expected ranges, −0.4 V to −0.25 V and 0.2 V to 0.35 V, respectively.These peak potential positions coincide with published literature reports.[3,18,19] Thisindicates that our design for microelectrodes can successfully detect individual current changesassociated with each analyte. The Cu peak is narrow with respect to the Pb peak, and this peaknarrowing could be due to differences in preconcentration effects on the stripping response,diffusion rate differences between Cu and Pb, or non-uniform electroplating of the Cu ions tothe electrode surface. Further investigation into counter electrolyte concentration effect andpreconcentration parameters may shed light on the narrow peak effect. However, for thepurpose of proving the sensor platform for application in heavy metal ion detection by strippinganalysis, these results indicate an excellent ability for heavy metal ion detection.
The use of a multi-channel potentiostat or multiplexer interfacing with our MEA sensorssimplifies these measurement procedures: 1) conducting different electrochemicalmeasurements in each single microelectrode. For example, one microelectrode can run cyclicvoltammetry, and the other one can run ASV or DPASV; 2) any selected microelectrodes canbe conductively connected by simply modifying the lithography procedures. This configurationwould result in higher current responses compared to the single microelectrode.
Figure 8 demonstrates the ability of our MEA sensor to detect multiple heavy metal ions, whichis important in water quality monitoring and management. The application of this sensorplatform to real water samples and the re-configuration of MEA patterns to increase sensorsensitivity are under investigation.
ConclusionA microelectrode array sensor platform was designed and fabricated, by lithographic means,to effectively increase diversity and versatility of testing capabilities over that of traditionallyreported macroelectrode sensors. These MEA sensor platforms consist of 18 individuallyaddressable microelectrodes and employ a resist layer as an insulating layer protecting thecircuitry and wiring of the sensor. The microelectrodes were defined by holes opened in theresist mask layer to exact electrode dimensions. Furthermore, these MEA sensor platformsconsist of planar arrays of gold square microelectrodes with an interelectrode spacing of 100μm, making the interelectrode spacing 10x the width (10 μm × 10 μm square) of the electrode,effectively enhancing the mass transport properties of the electrochemical analyte by allowingnonlinear diffusion around the perimeter of the electrode.
The enhancement of mass transport was checked by cyclic voltammetry on the ferric/ferrocyanide redox couple, and exhibited well defined sigmoidal shaped curves which signify3-D hemispherical diffusion of the electrochemical analytes. Drift was checked by repeatingthe cyclic voltammetry testing 5 times; observations indicated high repeatability. The MEAsensor was compared against a commercially available 10 μm CH electrode in cyclicvoltammetry testing. Evidence suggests that the MEA electrodes perform better than the 10μm CH electrode in both increased sensitivity and better theoretically defined voltammograms.
Gardner et al. Page 8
Sens Actuators B Chem. Author manuscript; available in PMC 2010 February 2.
NIH
-PA Author Manuscript
NIH
-PA Author Manuscript
NIH
-PA Author Manuscript

Additionally, these investigations have demonstrated that, when a glass base substrate with arelatively optically transparent resist mask layer is utilized, spectrochemical analysis is possiblewithin the sample area that would act as the electrochemical cell and cuvette. This capabilityincreases the diversity and versatility of the testing that can be performed with this sensorplatform. The ability of the sensor platform to detect Cu and Pb heavy metal ions in aqueoussolutions was also proven by utilizing the electrochemical method of differential pulse anodicstripping voltammetry.
AcknowledgmentsWe appreciate the financial support from the Utah Water Research Laboratory, Logan, UT, and from USU New FacultyStart-up funds (A.Z.). We are also thankful to the Undergraduate Research and Creative Opportunities (URCO)program supported by USU Vice President for Research Office (R.G. and N.Z.). R.G. is also partially supported byNIH (#ES013688-01A1) (A.Z.) and USU College of Engineering Dean’s Teaching Funds. Special thanks are reservedfor Dr. Brian Baker from the MicroFab Lab at the University of Utah for help with sensor fabrication procedures.
References1. Wang J. Real-Time Electrochemical Monitoring: Toward Green Analytical Chemistry. Accounts of
Chemical Research 2002;35:811–816. [PubMed: 12234211]2. Feeney R, Kounaves SP. Microfabricated Ultramicroelectrode Arrays: Developments, Advances, and
Applications in Environmental Analysis. Electroanalysis 2000;12:677–684.3. Berduque A, Lanyon YH, Beni V, Herzog Ge, Watson YE, Rodgers K, Stam F, Alderman J, Arrigan
DWM. Voltammetric characterisation of silicon-based microelectrode arrays and their application tomercury-free stripping voltammetry of copper ions. Talanta 2007;71:1022–1030. [PubMed:19071408]
4. Wang, J. Stripping Analysis: Principles, Instrumentation, and Applications. VCH Publishers, INC.;Deerfield Beach, Florida: 1985.
5. Piech R, Kubiak WW. Determination of trace arsenic with DDTC-Na by cathodic strippingvoltammetry in presence of copper ions. Journal of Electroanalytical Chemistry 2007;599:59–64.
6. Giacomino A, Abollino O, Malandrino M, Mentasti E. Parameters affecting the determination ofmercury by anodic stripping voltammetry using a gold electrode. Talanta 2008;75:266–273. [PubMed:18371878]
7. Annual Book of ASTM Standards, Section 11, Water and Environmental Technology.8. Forsberg G, O’Laughlin JW, Megargle RG, Koirtyohann SR. Determination of Arsenic by Anodic
Stripping Voltammetry and Differential Pulse Anodic Stripping Voltammetry. Analytical Chemistry1975;47:1586–1592.
9. Alden JA, Booth J, Compton RG, Dryfe RAW, Sanders GHW. Journal of Electroanalytical Chemistry1995;389:45–54.
10. Aoki K, Osteryoung J. Diffusion Controlled Current at a Stationary Finite Disk Electrode. Journal ofElectroanalytical Chemistry 1981;125:315–320.
11. Baranski AS, Quon H. Potentiometric Stripping Determination of Heavy Metals with Carbon Fiberand Gold Microelectrodes. Analytical Chemistry 1986;58:407–412.
12. Cope DK, Tallman DE. Transient behavior at planar microelectrodes: A comparison of diffusioncurrent at ring, band and disk electrodes. Journal of Electroanalytical Chemistry 1990;285:85–92.
13. Kovach PM, Caudill WL, Peters DG, Wightman RM. Faradaic Electrochemistry at Microcylinder,Band, and Tubular Band Electrodes. Journal of Electroanalytical Chemistry 1985;185:285–295.
14. Thormann W, Bosch Pvd, Bond AM. Voltammetry at Linear Gold and Platinum MicroelectrodeArrays Produced by Lithographic Techniques. Analytical Chemistry 1985;57:2764–2770.
15. Wittkampf M, Cammann K, Amrein M, Reichelt R. Characterization of microelectrode arrays bymeans of electrochemical and surface analysis methods, Sensors and Actuators B. Chemical1997;40:79–84.
16. Dunyushkina LA, Lu Y, Adler SB. Microelectrode Array for Isolation of Electrode Polarization onPlanar Solid Electrolytes. Journal of the Electrochemical Society 2005;152:A1668–A1676.
Gardner et al. Page 9
Sens Actuators B Chem. Author manuscript; available in PMC 2010 February 2.
NIH
-PA Author Manuscript
NIH
-PA Author Manuscript
NIH
-PA Author Manuscript

17. Kudera M, Hill HAO, Dobson PJ, Leigh PA, McIntire WS. Electrochemical Characterisation andApplication of Multi Microelectrode Array Devices to Biological Electrochemistry. Sensors2001;1:18–28.
18. Saban SB, Darling RB. Multi-element heavy metal ion sensors for aqueous solutions, Sensors andActuators B. Chemical 1999;61:128–137.
19. Munoz RAA, Oliveira PV, Angnes Lu. Combination of ultrasonic extraction and stripping analysis:An effective and reliable way for the determination of Cu and Pb in lubricating oils. Talanta2006;68:850–856. [PubMed: 18970400]
20. Pereira CF, Gonzaga FB, Guarit’a-Santos AM, SouzaDe JR. Determination of Se(IV) by anodicstripping voltammetry using gold electrodes made from recordable CDs. Talanta 2006;69:877–881.[PubMed: 18970651]
21. Wang J, Tiant B. Mercury-Free Disposable Lead Sensors Based on Potentiometric Stripping Analysisat Gold-Coated Screen-Printed Electrodes. Analytical Chemistry 1993;65:1529–1532. [PubMed:8328670]
Gardner et al. Page 10
Sens Actuators B Chem. Author manuscript; available in PMC 2010 February 2.
NIH
-PA Author Manuscript
NIH
-PA Author Manuscript
NIH
-PA Author Manuscript

Figure 1.Half array pictures: (A) final half array comprising of 9 electrodes, wiring, and electroniccontact pads; magnified views of the 9 electrode test site (B) before and (C) after the final layerof resist is applied and electrode holes are opened.
Gardner et al. Page 11
Sens Actuators B Chem. Author manuscript; available in PMC 2010 February 2.
NIH
-PA Author Manuscript
NIH
-PA Author Manuscript
NIH
-PA Author Manuscript

Figure 2.Complete microelectrode array platform and numbering designation for electrochemicalexperimentation configuration.
Gardner et al. Page 12
Sens Actuators B Chem. Author manuscript; available in PMC 2010 February 2.
NIH
-PA Author Manuscript
NIH
-PA Author Manuscript
NIH
-PA Author Manuscript
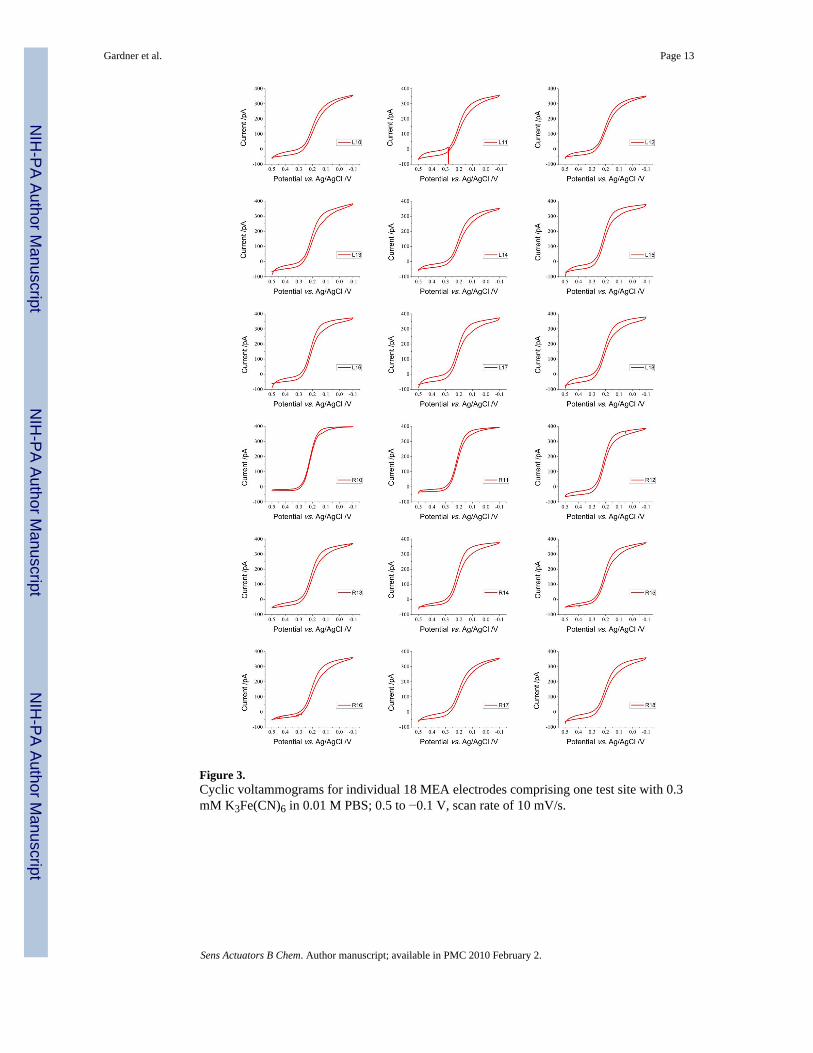
Figure 3.Cyclic voltammograms for individual 18 MEA electrodes comprising one test site with 0.3mM K3Fe(CN)6 in 0.01 M PBS; 0.5 to −0.1 V, scan rate of 10 mV/s.
Gardner et al. Page 13
Sens Actuators B Chem. Author manuscript; available in PMC 2010 February 2.
NIH
-PA Author Manuscript
NIH
-PA Author Manuscript
NIH
-PA Author Manuscript

Figure 4.Average cyclic voltammetry and standard deviation comparison for MEA electrodescomprising one test site with 0.3 mM (black sigmoidal curve set) and 0.5 mM (blue sigmoidalcurve set) K3Fe(CN)6 in 0.01 M PBS; 0.5 to −0.1 V, scan rate of 10 mV/s. n=18
Gardner et al. Page 14
Sens Actuators B Chem. Author manuscript; available in PMC 2010 February 2.
NIH
-PA Author Manuscript
NIH
-PA Author Manuscript
NIH
-PA Author Manuscript

Figure 5.Cyclic voltammetry testing of a microelectrode array electrode in (a) five successive tests and(b) average and standard deviation with 0.1 mM K3Fe(CN)6 in 0.01 M PBS, 0.5 to −0.1 V withscan rate of 60 mV/s. Arrow indicates the potential scanning direction. n=5
Gardner et al. Page 15
Sens Actuators B Chem. Author manuscript; available in PMC 2010 February 2.
NIH
-PA Author Manuscript
NIH
-PA Author Manuscript
NIH
-PA Author Manuscript

Figure 6.Cyclic voltammetry of K3Fe(CN)6 using (a) microelectrode array electrode and (b) 10 μm CHelectrode at concentrations of 0.05 (lower curve), 0.1, 0.3, 0.5, 0.8, and 1 mM (upper curve)in 0.01 M PBS supporting electrolyte, 0.5 to −0.1 V with scan rate in all cases of 10 mV/s.Arrow indicates the potential scanning direction. Plots of peak currents vs mediatorconcentration and linear fits (solid lines) for (c) microelectrode array electrode and (d) 10 μmCH electrode.
Gardner et al. Page 16
Sens Actuators B Chem. Author manuscript; available in PMC 2010 February 2.
NIH
-PA Author Manuscript
NIH
-PA Author Manuscript
NIH
-PA Author Manuscript

Figure 7.Absorbance in the visible spectrum of (red) 0.01 M PBS and (blue) 1 mM K3Fe(CN)6 in 0.01M PBS when a microelectrode array with resist polymer coating is attached to the bottom ofa 96-well plate. A control (black) of 1 mM K3Fe(CN)6 in 0.01 M PBS in an unaltered well isshown for comparison. 350 – 700 nm with a scan increment of 5 nm.
Gardner et al. Page 17
Sens Actuators B Chem. Author manuscript; available in PMC 2010 February 2.
NIH
-PA Author Manuscript
NIH
-PA Author Manuscript
NIH
-PA Author Manuscript

Figure 8.Microelectrode array electrode L8 differential anodic stripping voltammetry testing on 50 ppbCu and 50 ppb Pb in HNO3 solution; 60 s preconcentration, −0.6 to 0.4 V scan range.
Gardner et al. Page 18
Sens Actuators B Chem. Author manuscript; available in PMC 2010 February 2.
NIH
-PA Author Manuscript
NIH
-PA Author Manuscript
NIH
-PA Author Manuscript

NIH
-PA Author Manuscript
NIH
-PA Author Manuscript
NIH
-PA Author Manuscript
Gardner et al. Page 19
Table 1
Experimental parameters for cyclic and differential pulse anodic stripping voltammetry testing.
Parameter Type CV Parameter DPASV Parameter
Initial E (V) 0.5 −0.6 (Cu & Pb)
High E (V) 0.5 0.4 (Cu & Pb)
Low E (V) −0.1
Input Positive/Negative N
Scan Rate (V/s) 0.01
Segment (#) 2
Sample Interval (V) 0.001
Quiet Time (s) 2 60
Sensitivity (A/V) 1×10⁻⁹ 1×10⁻⁹
Increment E (V) 0.004
Amplitude (V) 0.025
Pulse Width (s) 0.05
Sample Width (s) 0.0167
Pulse Period (s) 0.02
Sens Actuators B Chem. Author manuscript; available in PMC 2010 February 2.