to the Creation of Profit as the Source of Local Revenue (An ...
14
Research Journal of Finance and Accounting www.iiste.org ISSN 2222-1697 (Paper) ISSN 2222-2847 (Online) Vol.9, No.14, 2018 42 Sinergy of Working Capital and Intellectual Capital to the Creation of Profit as the Source of Local Revenue (An Emphirical Study at BPR in West Java in 2012-2016) Garin Pratiwi Solihati Faculty of Economy and Business, Accounting Department, Universitas Mercubuana, Jakarta Abstract In the Regional Revenue and Expenditure Budget (APBD) there is a Pendapatan Asli Daerah (PAD). This revenue is derived from the efforts of the Local Government of Tk II to exploit / exploit regional assets such as natural resources or to set aside financial wealth in the form of business capital by establishing a business unit in order to obtain the results of dividends or returns on income as part of revenue (original) and used for regional development. The Government of Tk II established the Rural Bank (BPR) as a business unit by setting aside some of the assets in the form of business capital.As an empirical study selected PD BPR located in West Java whose establishment and ownership by Local Government Level II in West Java Province include PD BPR Garut, PD BPR kota Bandung, PD BPR Sumedang.The data sources used are secondary data sources through the publication of information by financial authorities such as Bank Indonesia or the Financial Services Authority (OJK) as well as primary data sources through direct monitoring to the object of research and through the sending and answer questionnaire, the data examined covering the year 2012 – 2016.The research method is survey method by using quantitative research method to get past or current data for decision making. Keywords: Employee productivity 3 PD BPR and Pendapatan Asli Daerah (PAD) Abstrak Dalam Anggaran Pendapatan dan Belanja Daerah (APBD) terdapat pos Pendapatan Asli Daerah (PAD). Pendapatan ini berasal dari usaha Pemda Tk II memanfaatkan/melakukan ekploitasi atas aset daerah seperti kekayaan alam ataupun dengan menyisihkan kekayaan finansil berupa modal usaha dengan mendirikan unit bisnis dengan tujuan untuk mendapatkan hasil berupa dividen atau pengembalian laba yang masuk sebagai bagian pendapatan (asli daerah) dan digunakan untuk pembangunan daerah. Pemda Tk II mendirikan Bank Perkreditan Rakyat (BPR) sebagai unit bisnis dengan menyisihkan sebagian aset berupa modal usaha. Sebagai studi empiris dipilih PD BPR yang berada di Jawa Barat yang pendirian dan kepemilikannya oleh Pemerintah Daerah Tingkat II di Provinsi Jawa Barat, yang memiliki Asset antar 100-200 milyar, pertumbuhan total asset diatas 50% dan pertumbuhan laba setalh pajak diatas 30%. Meliputi PD BPR Garut, PD BPR Kota Bandung, PD BPR Sumedang. Sumber data yang digunakan adalah sumber data sekunder melalui publikasi informasi oleh otoritas keuangan seperti Bank Indonesia atau Otoritas Jasa Keuangan (OJK), data yang diteliti meliputi tahun 2012 - 2016. Metode penelitian adalah menggunakan metode penelitian kuantitatif untuk mendapatkan data masa lampau atau saat ini guna pengambilan keputusan. Kata kunci : Produktivitas pegawai 3 PD BPR dan Pendapatan Asli Daerah (PAD) I. INTRODUCTION A. Background of the Research Development is an effort that people do continuously with the aim that life is getting better and better; in other words, it means for life today better than yesterday and tomorrow better than today. The sentence is also a reference that productivity should be the foundation in life so that life becomes better and better each day and so forth. Efforts of the local governments (Level II) to do development in every field from day to day have been increasing simultanously. This development effort definitely requires a large amount of financing. Quite a lot of efforts made by the local government to increase its income in order to finance such development, they are, for example by increasing tax revenue, utilizing its existing natural resources in the area or also by establishing a business unit by providing business capital for the business unit Establishment of Rural Banks conducted by Local Government Level II is one way to earn income as a source of local revenue (PAD) to finance its development. The question raised in the establishment of the BPR is whether the established BPR has given the optimum dividend to the Second Level Regional Government as its original objective. To see whether the objectives can be achieved or not, it needs to be examined more deeply about the ability of rural banks to create profit by seeing whether there is an optimal synergy between the intellectual capital in BPR and working capital provided by the local government. The ability to create profit by BPR is very important both for the sustainability of its business and as a source of local revenue for the Local Government Level II. This ability to create profit, among others, can occur
-
Upload
khangminh22 -
Category
Documents
-
view
4 -
download
0
Transcript of to the Creation of Profit as the Source of Local Revenue (An ...

Research Journal of Finance and Accounting www.iiste.org ISSN 2222-1697 (Paper) ISSN 2222-2847 (Online) Vol.9, No.14, 2018
42
Sinergy of Working Capital and Intellectual Capital to the Creation of Profit as the Source of Local Revenue (An Emphirical Study at BPR in West Java in 2012-2016) Garin Pratiwi Solihati Faculty of Economy and Business, Accounting Department, Universitas Mercubuana, Jakarta Abstract In the Regional Revenue and Expenditure Budget (APBD) there is a Pendapatan Asli Daerah (PAD). This revenue is derived from the efforts of the Local Government of Tk II to exploit / exploit regional assets such as natural resources or to set aside financial wealth in the form of business capital by establishing a business unit in order to obtain the results of dividends or returns on income as part of revenue (original) and used for regional development. The Government of Tk II established the Rural Bank (BPR) as a business unit by setting aside some of the assets in the form of business capital.As an empirical study selected PD BPR located in West Java whose establishment and ownership by Local Government Level II in West Java Province include PD BPR Garut, PD BPR kota Bandung, PD BPR Sumedang.The data sources used are secondary data sources through the publication of information by financial authorities such as Bank Indonesia or the Financial Services Authority (OJK) as well as primary data sources through direct monitoring to the object of research and through the sending and answer questionnaire, the data examined covering the year 2012 – 2016.The research method is survey method by using quantitative research method to get past or current data for decision making. Keywords: Employee productivity 3 PD BPR and Pendapatan Asli Daerah (PAD) Abstrak Dalam Anggaran Pendapatan dan Belanja Daerah (APBD) terdapat pos Pendapatan Asli Daerah (PAD). Pendapatan ini berasal dari usaha Pemda Tk II memanfaatkan/melakukan ekploitasi atas aset daerah seperti kekayaan alam ataupun dengan menyisihkan kekayaan finansil berupa modal usaha dengan mendirikan unit bisnis dengan tujuan untuk mendapatkan hasil berupa dividen atau pengembalian laba yang masuk sebagai bagian pendapatan (asli daerah) dan digunakan untuk pembangunan daerah. Pemda Tk II mendirikan Bank Perkreditan Rakyat (BPR) sebagai unit bisnis dengan menyisihkan sebagian aset berupa modal usaha. Sebagai studi empiris dipilih PD BPR yang berada di Jawa Barat yang pendirian dan kepemilikannya oleh Pemerintah Daerah Tingkat II di Provinsi Jawa Barat, yang memiliki Asset antar 100-200 milyar, pertumbuhan total asset diatas 50% dan pertumbuhan laba setalh pajak diatas 30%. Meliputi PD BPR Garut, PD BPR Kota Bandung, PD BPR Sumedang. Sumber data yang digunakan adalah sumber data sekunder melalui publikasi informasi oleh otoritas keuangan seperti Bank Indonesia atau Otoritas Jasa Keuangan (OJK), data yang diteliti meliputi tahun 2012 - 2016. Metode penelitian adalah menggunakan metode penelitian kuantitatif untuk mendapatkan data masa lampau atau saat ini guna pengambilan keputusan. Kata kunci : Produktivitas pegawai 3 PD BPR dan Pendapatan Asli Daerah (PAD) I. INTRODUCTION A. Background of the Research Development is an effort that people do continuously with the aim that life is getting better and better; in other words, it means for life today better than yesterday and tomorrow better than today. The sentence is also a reference that productivity should be the foundation in life so that life becomes better and better each day and so forth. Efforts of the local governments (Level II) to do development in every field from day to day have been increasing simultanously. This development effort definitely requires a large amount of financing. Quite a lot of efforts made by the local government to increase its income in order to finance such development, they are, for example by increasing tax revenue, utilizing its existing natural resources in the area or also by establishing a business unit by providing business capital for the business unit Establishment of Rural Banks conducted by Local Government Level II is one way to earn income as a source of local revenue (PAD) to finance its development. The question raised in the establishment of the BPR is whether the established BPR has given the optimum dividend to the Second Level Regional Government as its original objective. To see whether the objectives can be achieved or not, it needs to be examined more deeply about the ability of rural banks to create profit by seeing whether there is an optimal synergy between the intellectual capital in BPR and working capital provided by the local government. The ability to create profit by BPR is very important both for the sustainability of its business and as a source of local revenue for the Local Government Level II. This ability to create profit, among others, can occur
Research Journal of Finance and Accounting www.iiste.org ISSN 2222-1697 (Paper) ISSN 2222-2847 (Online) Vol.9, No.14, 2018
43
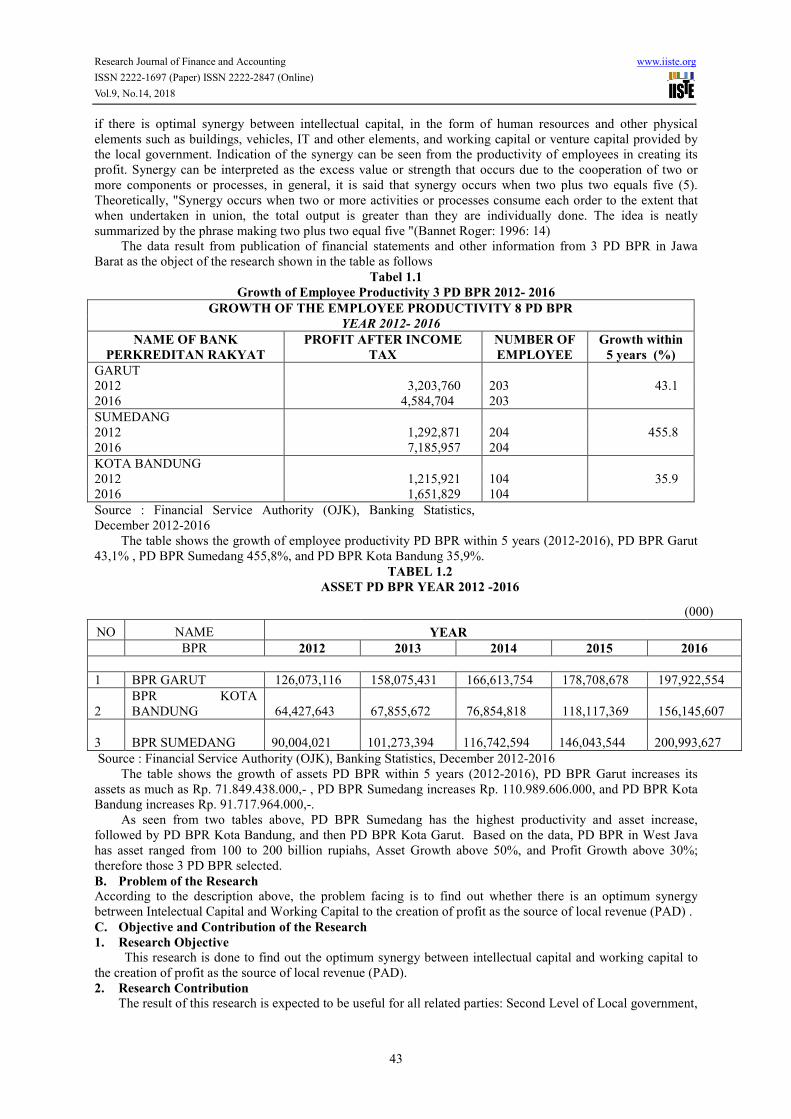
if there is optimal synergy between intellectual capital, in the form of human resources and other physical elements such as buildings, vehicles, IT and other elements, and working capital or venture capital provided by the local government. Indication of the synergy can be seen from the productivity of employees in creating its profit. Synergy can be interpreted as the excess value or strength that occurs due to the cooperation of two or more components or processes, in general, it is said that synergy occurs when two plus two equals five (5). Theoretically, "Synergy occurs when two or more activities or processes consume each order to the extent that when undertaken in union, the total output is greater than they are individually done. The idea is neatly summarized by the phrase making two plus two equal five "(Bannet Roger: 1996: 14) The data result from publication of financial statements and other information from 3 PD BPR in Jawa Barat as the object of the research shown in the table as follows Tabel 1.1 Growth of Employee Productivity 3 PD BPR 2012- 2016 GROWTH OF THE EMPLOYEE PRODUCTIVITY 8 PD BPR YEAR 2012- 2016 NAME OF BANK PERKREDITAN RAKYAT PROFIT AFTER INCOME TAX NUMBER OF EMPLOYEE Growth within 5 years (%) GARUT 2012 3,203,760 203 43.1 2016 4,584,704 203 SUMEDANG 2012 1,292,871 204 455.8 2016 7,185,957 204 KOTA BANDUNG 2012 1,215,921 104 35.9 2016 1,651,829 104 Source : Financial Service Authority (OJK), Banking Statistics, December 2012-2016 The table shows the growth of employee productivity PD BPR within 5 years (2012-2016), PD BPR Garut 43,1% , PD BPR Sumedang 455,8%, and PD BPR Kota Bandung 35,9%. TABEL 1.2 ASSET PD BPR YEAR 2012 -2016 (000) NO NAME YEAR BPR 2012 2013 2014 2015 2016 1 BPR GARUT 126,073,116 158,075,431 166,613,754 178,708,678 197,922,554 2 BPR KOTA BANDUNG 64,427,643 67,855,672 76,854,818 118,117,369 156,145,607 3 BPR SUMEDANG 90,004,021 101,273,394 116,742,594 146,043,544 200,993,627 Source : Financial Service Authority (OJK), Banking Statistics, December 2012-2016 The table shows the growth of assets PD BPR within 5 years (2012-2016), PD BPR Garut increases its assets as much as Rp. 71.849.438.000,- , PD BPR Sumedang increases Rp. 110.989.606.000, and PD BPR Kota Bandung increases Rp. 91.717.964.000,-. As seen from two tables above, PD BPR Sumedang has the highest productivity and asset increase, followed by PD BPR Kota Bandung, and then PD BPR Kota Garut. Based on the data, PD BPR in West Java has asset ranged from 100 to 200 billion rupiahs, Asset Growth above 50%, and Profit Growth above 30%; therefore those 3 PD BPR selected. B. Problem of the Research According to the description above, the problem facing is to find out whether there is an optimum synergy betrween Intelectual Capital and Working Capital to the creation of profit as the source of local revenue (PAD) . C. Objective and Contribution of the Research 1. Research Objective This research is done to find out the optimum synergy between intellectual capital and working capital to the creation of profit as the source of local revenue (PAD). 2. Research Contribution The result of this research is expected to be useful for all related parties: Second Level of Local government,

Research Journal of Finance and Accounting www.iiste.org ISSN 2222-1697 (Paper) ISSN 2222-2847 (Online) Vol.9, No.14, 2018
44
BPR as the business unit of local government, and if necessary, as information for Financial Service Authority to supervice and evaluate the operational of each BPR owned by the local government. II. LITERATURE REVIEW, CONCEPTUAL FRAMEWORK AND HYPOTHESIS DEVELOPMENT A. Literaturw Review 1. The Resource Based Theory Resource Based Theory (RBT) was firstly presented by wernerfelt in 1984 in his pioneering article entitled "A Resource Based of the firm" (Ulum, 2015). RBT states that the company has resources that can make it have a competitive advantage and can mobilize it to have a good long-term performance. Barney in Ulum (2015) states that in the RBT perspective, company resources include all assets, capabilities, organizational processes, corporate attributes, information, knowledge, and others controlled by the company that enable it to understand and implement strategies to improve efficiency and effectiveness of the company. Resource Based Theory (RBT) discusses the resources of the company, and how it can develop a competitive advantage from its resources (Zulmiati, 2012), Resource Based Theory explains the two views about the company's market-oriented strategy (market -based) and resource-based (Dewi, 2011). Zulmiati (2012), Resource Based Theory mentions that the company's competitive advantage is derived from the company's ability to assemble and utilize the right combination of resources. In this case, it can be said that the resources that exist in the company either tangible or intangible can be a determinant for good company performance. 2. Intellectual Capital (IC) In its development, Intellectual Capital began to be realized its importance by the perpetrators of this business. This can be proven in many researches that have been done to Intellectual Capital. Pradiansyah (2010: 270) says that Charles Handy of London Business School estimates a company's intellectual capital can now be worth 3 or 4 times the value of its tangible assets. The knowledge-oriented and information-oriented company has based its superior performance on intellectual capital. Although it is known to be very valuable and superior, intellectual capital is an important strategic asset in the knowledge-based economy (Rehman, et al (2011). Pulic in Ulum (2015) explains that, in the Knowledge Era, there are two types of resources that create added value in the enterprise ie physical resources and financial resources. Intellectual Capital is an intangible asset that is not easy to be measured, because of that, then comes the concept of Value Added Intellectual Coefficient (VAIC ™) which is a solution to measure and report intellectual capital with reference to corporate financial information. Zéghal and Maaloul (2010) state that some companies are currently investing in employee training, research and development, customer relationships, computer systems and administration, etc. This investment is often referred to as intellectual capital that grows and competes with physical and financial capital investment. From some definitions above, it can be concluded as (Wahdikorin, 2010) states that in general, the researchers identified three major constructs of IC, namely: human capital (HC), structural capital (SC), and customer capital (CC). Intellectual Capital as a Corporate Asset (Warno, 2011) Intellectual capital can only be regarded as an asset and can not be treated as an asset like other assets that can be measured and reported in the company's financial statements because of the difficulty of measuring this asset. The following basic properties of the asset will be explained in relation to intellectual capital, namely: a. Expenditures – it is made in connection with the development of the main components of the IC in the form of HC, SC, CE, which will provide benefits in the future and will further support the going concern and to achieve the goal (goal achievement) of the company. b. Intellectual capital – the one that is not wholly owned by the company because what the company possesses is the potential that exists within the three main components of the intellectual capital. c. Human capital, structural capital, and costumer capital are the result of past transactions conducted by the company. Value Added Intellectual Coefficient (VAICTM), Pulic in Ulum (2015) classifies Intellectual Capital in the VAICTM model into three parts: Efficiency of human capital (Human Capital / HCE), Structural capital efficiency (Structural Capital / SCE), Capital employed efficiency (capital effeciency / CEE). The model of VAICTM will be the references in this study and is described in more detail in the next section. The following will be explained one by one the components of VAICTM. a) Human Capital Efficiency (HCE) Human Capital Efficiency (HCE) shows the contribution made by each rupiah invested by human capital in the value added of the organization. Human capital represents the individual knowledge stock of an organization represented by its employees (Ulum, 2015). Human capital is very important for the continuity of the company because it is a combination of intangible resources inherent in members of the organization. Human capital is the accumulation of investment values in employee training and human resource competence (Dewi, 2011). b) Structural Capital Efficiency (SCE) Structural Capital Efficiency (SCE)\, the amount of structural capital needed to generate 1 rupiah from
Research Journal of Finance and Accounting www.iiste.org ISSN 2222-1697 (Paper) ISSN 2222-2847 (Online) Vol.9, No.14, 2018
45
VA, and it is an indication of how the success of structural capital in the value creation (Ulum, 2015). Structural capital (organization capital) is the ability of the organization or company in fulfilling the routine process of the company, and the structure that supports the employees’ efforts to produce optimal intellectual performance and overall business performance, for example: the company's operational system, the manufacturing process, the organizational culture, the management philosophy and all forms of the intellectual property owned by the company (Sawarjuwono, Puspita dan Wahyu, 2011) c) Capital Employed Efficiency (CEE) Capital Employed Efficiency (CEE) shows the contribution made by each unit of capital employed to the value added organization (Ulum, 2015). CEE is a company's ability to manage resources in the form of capital asset which if it is managed properly will improve the company's financial performance. Mainkaiw (Dewi, 2011) defines physical capital as a material used as an input in the production of goods and services to come. Companies with strong structural capital will have cultural support that allows companies to try something, to learn, and to try something again. The concept of intellectual capital allows it to be measured and developed within a company (Dewi, 2011). The advantage of the VAIC ™ method is that the data required is relatively easy to obtain from a variety of sources and types of companies. Other IC measurement alternatives are limited to generating unique financial and non-financial indicators that merely complement the profile of an individual company. Such indicators, particularly non-financial indicators, are not available or not recorded by other companies (Tan et al., 2007). Consequently, the ability to apply these alternative IC measurements consistently to large and diversified samples is limited (Firer and Williams, 2003). 3. Working Capital a. The definitions of Working Capital put forward by some experts such as (Eugene.F Brigham, Joel.F Houston, 2006: 131). Working capital or sometimes also called dirty capital, is actually a current assets used in operations. Working capital is the right or share owned by the owner of the company shown in capital post (capital stock), surplus and retained earnings (S.Munawir, 2010: 19). The working capital definition according to the functional concept proposed by (Jumingan, 2006: 67) is as follows: "Working capital is the amount of funds used during the accounting period intended to generate current income that is in accordance with the main purpose of the establishment of the company the ". b. Types of Working Capital Concerning the definition of working capital can be put forward into some concepts (Bambang Riyanto, 2011: 57-58). The concepts are: 1. The concept of quantitative - This concept is based on the quantity of funds embedded in the elements of current assets in which this asset is an asset that once rotated back in the original form or assets in which embedded in it will be free again in a short time. 2. Qualitative Concept - If the quantitative concept of working capital is only associated with the amount of current assets only, then on this qualitative concept of working capital understanding is also associated with the large amount of current debt or debt that must be paid immediately. 3. Functional concept is based on the function of funds in generating income (income). Each of the funds done or used in the company is intended to generate income. There are some factors that are affecting Working Capital are suggested by (S.Munawir, 2010: 117-119), among others: 1. Characteristics or Type of the company. Working capital of a service company will be lower when compared with the requirement of working capital of industrial company because it does not require big investment in cash, receivable or inventory. 2. The time taken to produce or obtain goods to be sold and the price of the union of the goods. 3. Terms of purchase of materials or merchandise. Terms of purchase of merchandise or basic materials that will be used to produce goods greatly affect the amount of working capital required by the company concerned. 4. Terms of sale. The more lenient credits granted by the company to buyers will result in an increasing amount of working capital to be invested in the receivable sector. 5. Inventory turnover rate. Inventory turn over rate, showing how many times the inventory is replaced in the sense of being bought and resold. 4. Banking Management 4.1. Management in General The definition of Bank according to the law of RI number 10/1998: banking is a business entity that collects funds from the public in the form of savings and distributes it to the community in the form of credit or other forms in order to improve the standard of living of the people. Especially for BPR, its operational activities are limited to only receiving deposits in the form of savings and deposits and not involved in the payment of demand deposits. 4.2. Sound Banking Business (Bisnis bank yang sehat) Business management should be based on sound banking norms. Therefore, the management of the bank should be done with caution (prudent banking management). To measure the performance of bank, it can be seen from

Research Journal of Finance and Accounting www.iiste.org ISSN 2222-1697 (Paper) ISSN 2222-2847 (Online) Vol.9, No.14, 2018
46
the profitability and employee productivity indicators. 5. Government Regulations relating to BPR After specifically conducting bank management included banking coaching and supervision, the institution is separated from Bank Indonesia to the Financial Services Authority (OJK). The government regulation related to banking is issued by 2 (two) institutions namely (1) related to monetary policy issued by Bank Indonesia and (2) relating to bank guidance and supervision are issued by the Financial Services Authority (OJK) B. Conceptual Framework and Hypothesis Development According to Prof.DR.Sugiyono (2014: 58) there is a Causal Assertive frame of mind. In this research, the causal associative thinking framework is used, that with the optimal synergy between intellectual capital and working capital is assumed to be able to encourage the increase of income and profit of bank with the increase of bank profit then most likely will also rise dividend for bank owners with the increase of dividend in ultimately will increase the local revenue (PAD) in the budget of regional expenditure.sebagai source of regional development funds.
Figure 1 The Framework Hypothesis In this study the researcher uses a causal hypothesis which is a hypothesis that states there is influence of a variable against other variables. The hypothesis is asfollows: H1: Working Capital Affects Profit Creation H2: Intellectual Capital affects Profit creation III RESEARCH METHOD A. Research design This study uses hypothesis testing, which aims to test the effect of variable working capital (X1), Intellectual Capital (X2) to the creation of profit (Y). This research is evaluative research using quantitative approach. The unit of analysis is 3 (three) PD BPRs in West Java which have assets of 100 to 200 Billion rupiahs, with Total Asset growth rate above 50%. Profit after tax growth above 30%. namely PD BPR Garut, PD BPR Sumedang and PD BPR Kota Bandung. The data researched in the form of financial report data PD BPR published by the Financial Services Authority (OJK). B. Data Collection Technique The required data are mostly secondary data in the form of published financial statements issued by the Financial Services Authority (OJK) and Financial Statistics Indonesia / SEKI issued by Bank Indonesia and the respective BPR sites. Library research (library research) is done to get the data from annual PD BPR reports during the period 2012-2016 (5 years). Other sources include journals, and other sources that can be used in this study.
ASSET PRODUKTIF - CREDIT - BANK INVESTMENT PROFIT AFTER TAXDEVIDENT
LOCAL REVENUE INTELLECTUAL CAPITAL - VAHU - VAHA - STAVA WORKING CAPITAL UANG
Research Journal of Finance and Accounting www.iiste.org ISSN 2222-1697 (Paper) ISSN 2222-2847 (Online) Vol.9, No.14, 2018
47
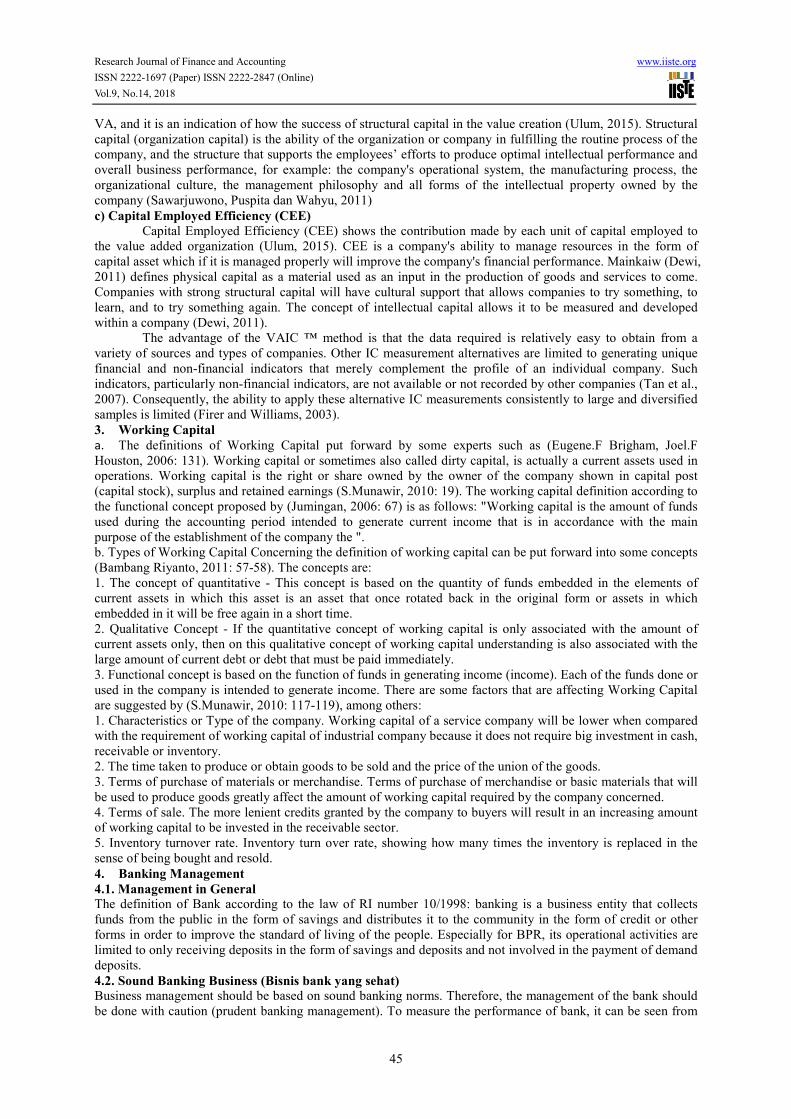
C. Populasi dan Sampel Population is a generalization region consisting of object / subject that has a certain quantity and characteristic set by the researchers to be studied and then drawn conclusions (Sugiyono 2014: 62). In this study the population is a Regional Company in the form of Rural Banks whose capital is owned by the local government of Level II which has assets of 100 to 200 billion rupiah, the growth rate of Total Assets above 50%. Profit after tax growth above 30%. namely PD BPR Garut, PD BPR Sumedang and PD BPR Kota Bandung. D. Operasional Variabel 1. Working Capital According to Jumingan, 2006:67 Working capital is the amount of funds used during the accounting period that is intended to generate a short-term income (current income) in accordance with the main purpose of the establishment of the company the amount of capital used. Working Capital = Sales / (Current Asset – Current Liabilities) 2. VAIC The independent variables of this research are Intellectual Capital and Working Capital . Intellecctual Capital represented by calculating HCE, SCE, CEE. A. Calculating Value Added (VA) VA = OUT - IN Info: OUT = Output: total sales and other revenue, IN = Input: selling expenses and other expenses (except employee expenses), B. Calculating Human Capital Efficiency (HCE) HCE is an employee who has the expertise, competence, knowledge and skills in a company, measured by HCE is an indicator of human capital value added efficiency. The formula: HCE = VA / HC Info: HCE = Human Capital efficiency: ratio from VA to HC, VA = value added, HC = Human Capital: employee expenses. C. Calculating Structural Capital Efficiency (SCE) SCE is a form of real wealth for the company because it is the place where all the results of the valuation activities are generated by the stored Human Capital, as well as the infrastructure or support for Human Capital to carry out activities to generate value for the company. The formula: SCE = SC / VA Info: SCE = Structural Capital efficiency: ratio from SC to VA., SC = Structural Capital : VA – HC, VA = value added. D.Calculating Capital Employed Efficiency (CEE) CEE is the total capital utilized in fixed and current assets in a company (Pulic, 1998; Firer and Williams, 2003) The formula for calculating CEE: CEE = VA / CE Info: CEE = Capital Employed efficiency: ratio from VA to CE., VA = value added, CE = Capital Employed: available funds (equity, net profit). E. Method of Analysis 1. Decriptive Statistics Analysis Descriptive statistics are statistics used to analyze data by way of describing or describing data that has been collected as it is without any intention to make conclusions that apply to the public or generalization (Imam Ghozali, 2013). 2. Clasic Assumption Test a. Test of Normality The Normality test aims to test whether in the regression model the intruder or residual variable has a normal distribution. In principle, data normality can be known by looking at the spread of data (dots) on the diagonal axis of the graph or by looking at the histogram of the residual (Ghozali, 2013).
Research Journal of Finance and Accounting www.iiste.org ISSN 2222-1697 (Paper) ISSN 2222-2847 (Online) Vol.9, No.14, 2018
48
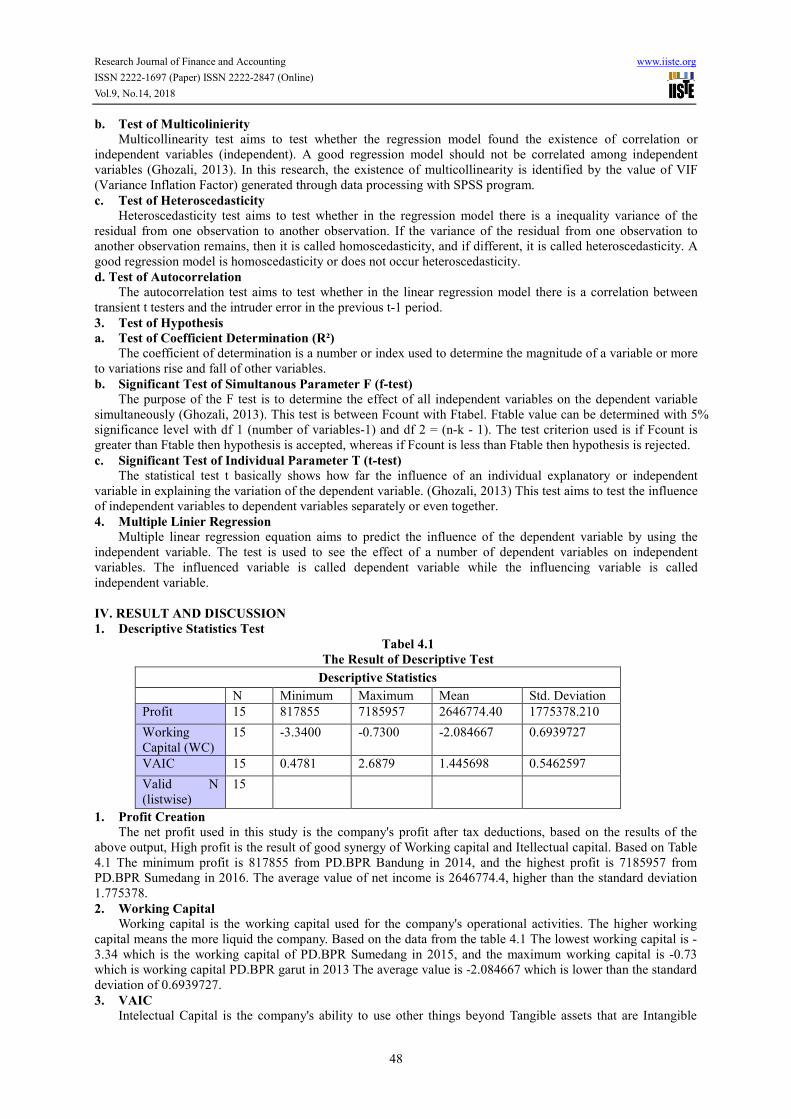
b. Test of Multicolinierity Multicollinearity test aims to test whether the regression model found the existence of correlation or independent variables (independent). A good regression model should not be correlated among independent variables (Ghozali, 2013). In this research, the existence of multicollinearity is identified by the value of VIF (Variance Inflation Factor) generated through data processing with SPSS program. c. Test of Heteroscedasticity Heteroscedasticity test aims to test whether in the regression model there is a inequality variance of the residual from one observation to another observation. If the variance of the residual from one observation to another observation remains, then it is called homoscedasticity, and if different, it is called heteroscedasticity. A good regression model is homoscedasticity or does not occur heteroscedasticity. d. Test of Autocorrelation The autocorrelation test aims to test whether in the linear regression model there is a correlation between transient t testers and the intruder error in the previous t-1 period. 3. Test of Hypothesis a. Test of Coefficient Determination (R²) The coefficient of determination is a number or index used to determine the magnitude of a variable or more to variations rise and fall of other variables. b. Significant Test of Simultanous Parameter F (f-test) The purpose of the F test is to determine the effect of all independent variables on the dependent variable simultaneously (Ghozali, 2013). This test is between Fcount with Ftabel. Ftable value can be determined with 5% significance level with df 1 (number of variables-1) and df 2 = (n-k - 1). The test criterion used is if Fcount is greater than Ftable then hypothesis is accepted, whereas if Fcount is less than Ftable then hypothesis is rejected. c. Significant Test of Individual Parameter T (t-test) The statistical test t basically shows how far the influence of an individual explanatory or independent variable in explaining the variation of the dependent variable. (Ghozali, 2013) This test aims to test the influence of independent variables to dependent variables separately or even together. 4. Multiple Linier Regression Multiple linear regression equation aims to predict the influence of the dependent variable by using the independent variable. The test is used to see the effect of a number of dependent variables on independent variables. The influenced variable is called dependent variable while the influencing variable is called independent variable. IV. RESULT AND DISCUSSION 1. Descriptive Statistics Test Tabel 4.1 The Result of Descriptive Test Descriptive Statistics N Minimum Maximum Mean Std. Deviation Profit 15 817855 7185957 2646774.40 1775378.210 Working Capital (WC) 15 -3.3400 -0.7300 -2.084667 0.6939727 VAIC 15 0.4781 2.6879 1.445698 0.5462597 Valid N (listwise) 15 1. Profit Creation The net profit used in this study is the company's profit after tax deductions, based on the results of the above output, High profit is the result of good synergy of Working capital and Itellectual capital. Based on Table 4.1 The minimum profit is 817855 from PD.BPR Bandung in 2014, and the highest profit is 7185957 from PD.BPR Sumedang in 2016. The average value of net income is 2646774.4, higher than the standard deviation 1.775378. 2. Working Capital Working capital is the working capital used for the company's operational activities. The higher working capital means the more liquid the company. Based on the data from the table 4.1 The lowest working capital is -3.34 which is the working capital of PD.BPR Sumedang in 2015, and the maximum working capital is -0.73 which is working capital PD.BPR garut in 2013 The average value is -2.084667 which is lower than the standard deviation of 0.6939727. 3. VAIC Intelectual Capital is the company's ability to use other things beyond Tangible assets that are Intangible
Research Journal of Finance and Accounting www.iiste.org ISSN 2222-1697 (Paper) ISSN 2222-2847 (Online) Vol.9, No.14, 2018
49
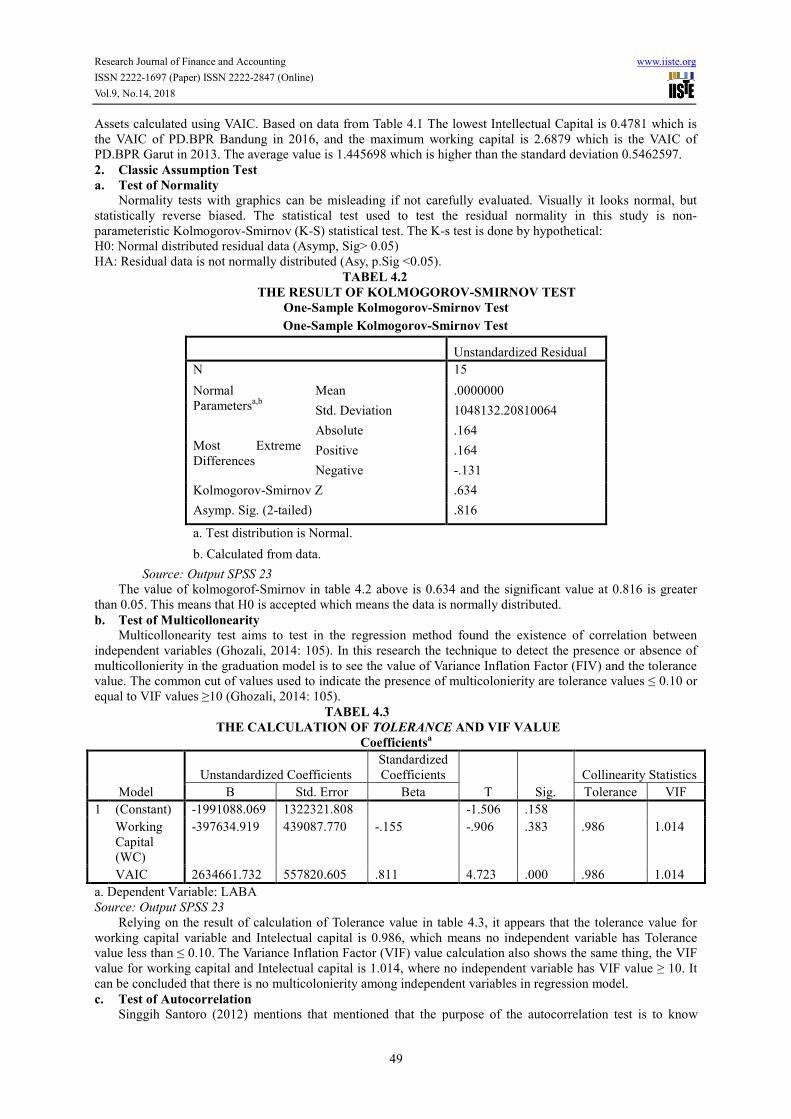
Assets calculated using VAIC. Based on data from Table 4.1 The lowest Intellectual Capital is 0.4781 which is the VAIC of PD.BPR Bandung in 2016, and the maximum working capital is 2.6879 which is the VAIC of PD.BPR Garut in 2013. The average value is 1.445698 which is higher than the standard deviation 0.5462597. 2. Classic Assumption Test a. Test of Normality Normality tests with graphics can be misleading if not carefully evaluated. Visually it looks normal, but statistically reverse biased. The statistical test used to test the residual normality in this study is non-parameteristic Kolmogorov-Smirnov (K-S) statistical test. The K-s test is done by hypothetical: H0: Normal distributed residual data (Asymp, Sig> 0.05) HA: Residual data is not normally distributed (Asy, p.Sig <0.05). TABEL 4.2 THE RESULT OF KOLMOGOROV-SMIRNOV TEST One-Sample Kolmogorov-Smirnov Test One-Sample Kolmogorov-Smirnov Test Unstandardized Residual N 15 Normal Parametersa,b Mean .0000000 Std. Deviation 1048132.20810064 Most Extreme Differences Absolute .164 Positive .164 Negative -.131 Kolmogorov-Smirnov Z .634 Asymp. Sig. (2-tailed) .816 a. Test distribution is Normal. b. Calculated from data. Source: Output SPSS 23 The value of kolmogorof-Smirnov in table 4.2 above is 0.634 and the significant value at 0.816 is greater than 0.05. This means that H0 is accepted which means the data is normally distributed. b. Test of Multicollonearity Multicollonearity test aims to test in the regression method found the existence of correlation between independent variables (Ghozali, 2014: 105). In this research the technique to detect the presence or absence of multicollonierity in the graduation model is to see the value of Variance Inflation Factor (FIV) and the tolerance value. The common cut of values used to indicate the presence of multicolonierity are tolerance values ≤ 0.10 or equal to VIF values ≥10 (Ghozali, 2014: 105). TABEL 4.3 THE CALCULATION OF TOLERANCE AND VIF VALUE Coefficientsa Model Unstandardized Coefficients Standardized Coefficients T Sig. Collinearity Statistics B Std. Error Beta Tolerance VIF 1 (Constant) -1991088.069 1322321.808 -1.506 .158 Working Capital (WC) -397634.919 439087.770 -.155 -.906 .383 .986 1.014 VAIC 2634661.732 557820.605 .811 4.723 .000 .986 1.014 a. Dependent Variable: LABA Source: Output SPSS 23 Relying on the result of calculation of Tolerance value in table 4.3, it appears that the tolerance value for working capital variable and Intelectual capital is 0.986, which means no independent variable has Tolerance value less than ≤ 0.10. The Variance Inflation Factor (VIF) value calculation also shows the same thing, the VIF value for working capital and Intelectual capital is 1.014, where no independent variable has VIF value ≥ 10. It can be concluded that there is no multicolonierity among independent variables in regression model. c. Test of Autocorrelation Singgih Santoro (2012) mentions that mentioned that the purpose of the autocorrelation test is to know

Research Journal of Finance and Accounting www.iiste.org ISSN 2222-1697 (Paper) ISSN 2222-2847 (Online) Vol.9, No.14, 2018
50
whether in a linear regression model there is a correlation between the confounding error in period t and the error in period t-1 (previous). To detect autocorrelation symptoms, Durbin-Waston (D-W) test is used. According singgih santoso (2012), to find out the decision-making, whether or not autocorrelation exists, can be seen from the following provisions: a. If the D-W value lies below -2, it means there is a positive auto correlation b. b. When the D-W value lies from -2 to +2, it means there is no auto correlation c. c. If the D-W value is above +2, it means there is a negative auto correlation TABEL 4.4 THE RESULT OF AUTOCORRELATION TEST Model Summaryb Model R R Square Adjusted R Square Std. Error of the Estimate Durbin-Watson 1 .807a .651 .593 1132112.176 .664 a. Predictors: (Constant), VAIC, Working Capital (WC) b. Dependent Variable: LABA Source: Output SPSS 23 Based on the tabel 4.4 above, the amount of Durbin–Watson value is 0,664, which means the value of D-W is higher than -2 and less than +2. It can be concluded that there is no positive or negative autocorrelation; in other words, there is no autocorrelation in this regretion model. a. Test of Heteroscedasticity The heteroscedasticity test aims to test if there is inequality variance from one residual to other residual (Ghozali, 2014:139). A good regression model is homoscedasticity or does not occur heteroscedasticity (Ghozali, 2014: 139). The way to detect whether or not heteroscedasticity occur is with the plot graph and park test:: a. Plot Graph
FIGURE 4.1 SCATTERPLOT GRAPH From the figure 4.1 it can be seen that the dots spread randomly both up and under number 0 in Y axis. It can be summarized that there is no heteroscedasticity in this regretion model. b. Park Test Ghozali (2014:142) states the park test suggests that variance (s2) is a function of independent variables If the beta parameter coefficients of the regression equation are statistically significant, it shows that in the empirical model data is estimated that there is heteroscedasticity, and vice versa, if the beta parameter is not statistically significant, then the assumption of homoscedasticity in the model data can be rejected.
Research Journal of Finance and Accounting www.iiste.org ISSN 2222-1697 (Paper) ISSN 2222-2847 (Online) Vol.9, No.14, 2018
51
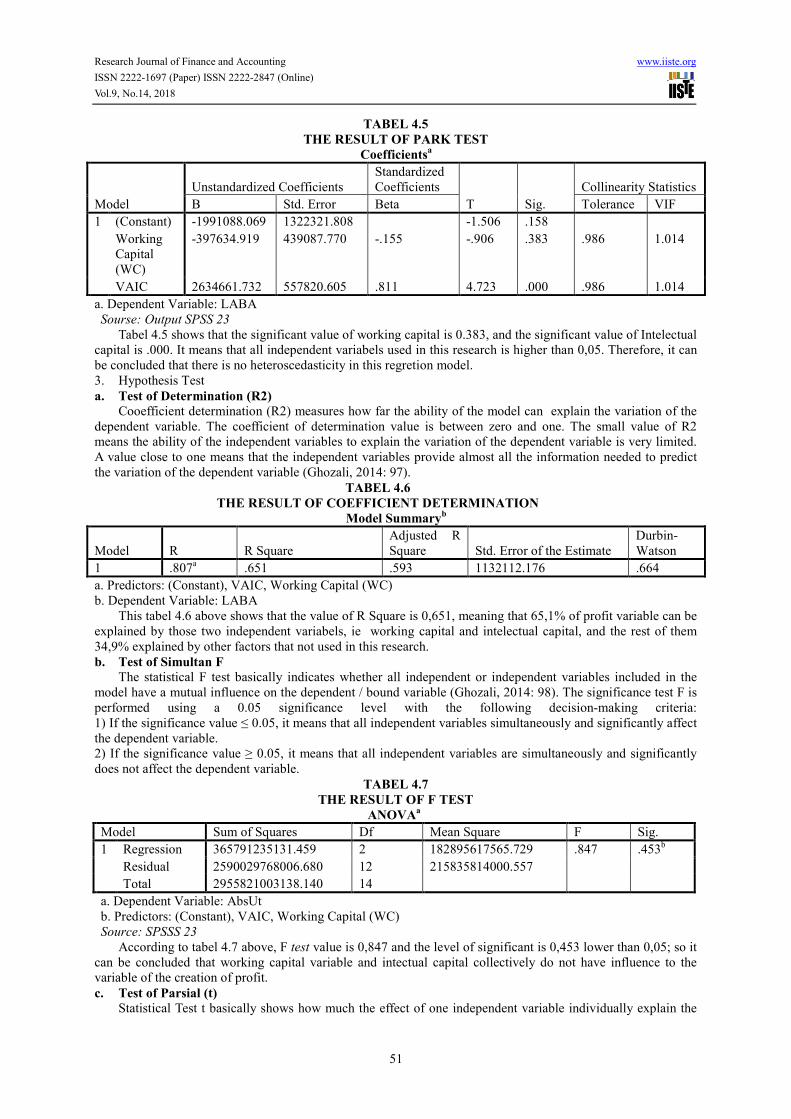
TABEL 4.5 THE RESULT OF PARK TEST Coefficientsa Model Unstandardized Coefficients Standardized Coefficients T Sig. Collinearity Statistics B Std. Error Beta Tolerance VIF 1 (Constant) -1991088.069 1322321.808 -1.506 .158 Working Capital (WC) -397634.919 439087.770 -.155 -.906 .383 .986 1.014 VAIC 2634661.732 557820.605 .811 4.723 .000 .986 1.014 a. Dependent Variable: LABA Sourse: Output SPSS 23 Tabel 4.5 shows that the significant value of working capital is 0.383, and the significant value of Intelectual capital is .000. It means that all independent variabels used in this research is higher than 0,05. Therefore, it can be concluded that there is no heteroscedasticity in this regretion model. 3. Hypothesis Test a. Test of Determination (R2) Cooefficient determination (R2) measures how far the ability of the model can explain the variation of the dependent variable. The coefficient of determination value is between zero and one. The small value of R2 means the ability of the independent variables to explain the variation of the dependent variable is very limited. A value close to one means that the independent variables provide almost all the information needed to predict the variation of the dependent variable (Ghozali, 2014: 97). TABEL 4.6 THE RESULT OF COEFFICIENT DETERMINATION Model Summaryb Model R R Square Adjusted R Square Std. Error of the Estimate Durbin-Watson 1 .807a .651 .593 1132112.176 .664 a. Predictors: (Constant), VAIC, Working Capital (WC) b. Dependent Variable: LABA This tabel 4.6 above shows that the value of R Square is 0,651, meaning that 65,1% of profit variable can be explained by those two independent variabels, ie working capital and intelectual capital, and the rest of them 34,9% explained by other factors that not used in this research. b. Test of Simultan F The statistical F test basically indicates whether all independent or independent variables included in the model have a mutual influence on the dependent / bound variable (Ghozali, 2014: 98). The significance test F is performed using a 0.05 significance level with the following decision-making criteria: 1) If the significance value ≤ 0.05, it means that all independent variables simultaneously and significantly affect the dependent variable. 2) If the significance value ≥ 0.05, it means that all independent variables are simultaneously and significantly does not affect the dependent variable. TABEL 4.7 THE RESULT OF F TEST ANOVAa Model Sum of Squares Df Mean Square F Sig. 1 Regression 365791235131.459 2 182895617565.729 .847 .453b Residual 2590029768006.680 12 215835814000.557 Total 2955821003138.140 14 a. Dependent Variable: AbsUt b. Predictors: (Constant), VAIC, Working Capital (WC) Source: SPSSS 23 According to tabel 4.7 above, F test value is 0,847 and the level of significant is 0,453 lower than 0,05; so it can be concluded that working capital variable and intectual capital collectively do not have influence to the variable of the creation of profit. c. Test of Parsial (t) Statistical Test t basically shows how much the effect of one independent variable individually explain the
Research Journal of Finance and Accounting www.iiste.org ISSN 2222-1697 (Paper) ISSN 2222-2847 (Online) Vol.9, No.14, 2018
52
Penciptaan laba = α+WC+IC+e Profit Creation = 244811.066460224 + (-139721.378039384)WC + 258712.008775589 +e
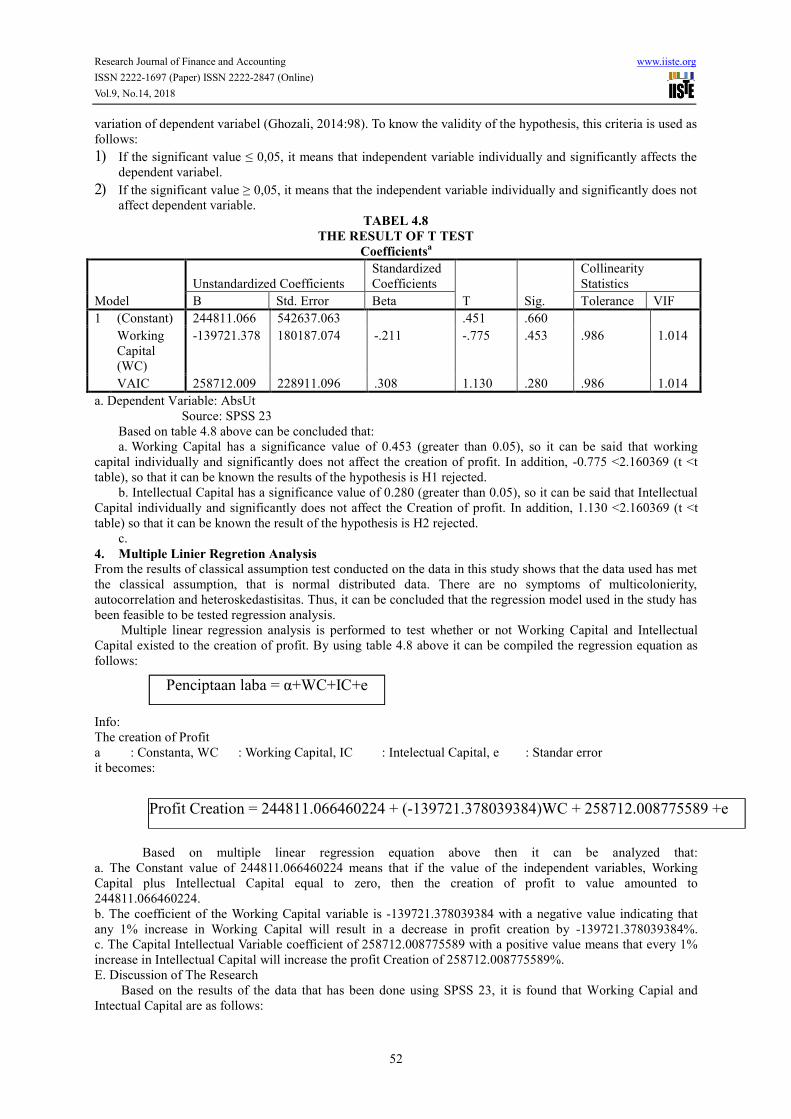
variation of dependent variabel (Ghozali, 2014:98). To know the validity of the hypothesis, this criteria is used as follows: 1) If the significant value ≤ 0,05, it means that independent variable individually and significantly affects the dependent variabel. 2) If the significant value ≥ 0,05, it means that the independent variable individually and significantly does not affect dependent variable. TABEL 4.8 THE RESULT OF T TEST Coefficientsa Model Unstandardized Coefficients Standardized Coefficients T Sig. Collinearity Statistics B Std. Error Beta Tolerance VIF 1 (Constant) 244811.066 542637.063 .451 .660 Working Capital (WC) -139721.378 180187.074 -.211 -.775 .453 .986 1.014 VAIC 258712.009 228911.096 .308 1.130 .280 .986 1.014 a. Dependent Variable: AbsUt Source: SPSS 23 Based on table 4.8 above can be concluded that: a. Working Capital has a significance value of 0.453 (greater than 0.05), so it can be said that working capital individually and significantly does not affect the creation of profit. In addition, -0.775 <2.160369 (t <t table), so that it can be known the results of the hypothesis is H1 rejected. b. Intellectual Capital has a significance value of 0.280 (greater than 0.05), so it can be said that Intellectual Capital individually and significantly does not affect the Creation of profit. In addition, 1.130 <2.160369 (t <t table) so that it can be known the result of the hypothesis is H2 rejected. c. 4. Multiple Linier Regretion Analysis From the results of classical assumption test conducted on the data in this study shows that the data used has met the classical assumption, that is normal distributed data. There are no symptoms of multicolonierity, autocorrelation and heteroskedastisitas. Thus, it can be concluded that the regression model used in the study has been feasible to be tested regression analysis. Multiple linear regression analysis is performed to test whether or not Working Capital and Intellectual Capital existed to the creation of profit. By using table 4.8 above it can be compiled the regression equation as follows: Info: The creation of Profit a : Constanta, WC : Working Capital, IC : Intelectual Capital, e : Standar error it becomes: Based on multiple linear regression equation above then it can be analyzed that: a. The Constant value of 244811.066460224 means that if the value of the independent variables, Working Capital plus Intellectual Capital equal to zero, then the creation of profit to value amounted to 244811.066460224. b. The coefficient of the Working Capital variable is -139721.378039384 with a negative value indicating that any 1% increase in Working Capital will result in a decrease in profit creation by -139721.378039384%. c. The Capital Intellectual Variable coefficient of 258712.008775589 with a positive value means that every 1% increase in Intellectual Capital will increase the profit Creation of 258712.008775589%. E. Discussion of The Research Based on the results of the data that has been done using SPSS 23, it is found that Working Capial and Intectual Capital are as follows:
Research Journal of Finance and Accounting www.iiste.org ISSN 2222-1697 (Paper) ISSN 2222-2847 (Online) Vol.9, No.14, 2018
53
1. Working Capital on Profit Creation PD.BPR judging from the results of hypothesis testing shows that working capital (X1) has a significance value of 0.453 (greater than 0.05), so it can be concluded that working capital individually and significantly does not affect the creation of profit . In addition, -0.775 <2.160369 (t <t table) so that it can be known the results of the first hypothesis H1 rejected. Thus this study proves that working capital has no significant effect on the creation of profit. That is, all funds collected from the public in the form of savings either in the form of savings or deposits are not placed as working capital on PD.BPR concerned but directly placed on other banks as Investment or distributed as Credit to other parties. 2.Intellectual to the Creation of Profit PD.BPR judging from the results of hypothesis testing shows that Intelectual Capital (X2) has a significance value of 0.280 (greater than 0.05), so it can be said that Intellectual Capital individually and significantly does not affect the Creation of profit. In addition, 1.130 <2.160369 (t <t table) so that it can be known the results of the hypothesis is H2 rejected. Thus, this study proves that intectual capital has no significant effect on the creation of profit. That is, Intetectual capital, which means the use of Intangible assets (assets intangible) such as employees and the use of other assets have not been maximally used or empowered as a tool to encourage the creation of profit. The company should add Value Added Intangible Assets such as employee training, research and development, customer relationships, computer systems and administration, etc. V. CONCLUSSION AND SUGGESTION A. CONCLUSSION Based on the results of the data that has been done using SPSS 23, it is found that the influence of Working Capital and Intellectual Capital in Profit Creation is as follows: 1. Working Capital has a significance value of 0.453 (greater than 0.05), so it can be said that working capital individually and significantly does not affect the creation of profit. In addition, -0.775 <2.160369 (t <t table) so that it can be known the results of the hypothesis is H1 rejected. Thus, this study proves that Working Capital has no significant effect on Profit Creation. That is, the profit is not obtained from the availability of liquid working capital. 2. Intellectual Capital has a significance value of 0.280 (greater than 0.05), so it can be said that Intellectual Capital individually and significantly does not affect the Creation of profit. In addition, 1.130 <2.160369 (t <t table) so that it can be known the results of the hypothesis is H2 rejected. Thus, this study proves that Intellectual Capital does not have a significant effect on Profit Creation That is, profit is not influenced by the ability of Intelectual capital calculated using VAIC. 3. With the rejection of H1 and H2, it shows that Working Capital and Intellectual Capital are not the factors that determine profit creation. Working capital is negative (minus) because most of the funds collected from the community in the form of deposits and savings by the BPR directly distributed to third parties (three) in the form of credit. So, BPR does not have sufficient working capital. If viewed from the side of liquidity, it means that Working Capital is not in a liquid position, and this is very dangerous for bank operations in case of a large fund withdrawal. 4. Intetectual capital with the use of Intangible assets such as employees and the use of other assets has not been maximally used or empowered as a tool to encourage the creation of profit. The company should add Value Added Intangible Assets such as employee training, research and development, customer relationships, computer systems and administration, etc. B. SUGGESTION 1. BPR PD Management must reorganize the bank liquidity condition because if there is a large fund withdrawal, not only liquidity risk arises but other risks will arise such as reduced investment from other parties and reputation risk. 2. BPR PD Management must take steps in anticipation of maintaining the stability of its business operations, such as by maintaining the quality of service, establishing a clear percentage of funds dictributed through credit and collected funds. It also should maintain the financial balance of the company and periodically perform capacity building in the internal company such as enhancement of marketing capability, training of management ability and improvement of service ability to the customers. BIBLIOGRAPHY Abdullah Thamrin, Tantri Francis, (2012). Bank dan Lembaga Keuangan, Jakarta: PT Raja Grafindo Persada, Jakarta Abas, Zulfirayanti. 2013. Pengaruh Efisiensi Modal Kerja Terhadap Profitabilitas Perusahaan. Agha, Hina. 2014. Impact Of Working Capital Management On Profitablity. European Scientific Journal. Ahangar, Reza Gharoie. 2011., The relationship between Intellectual Capital and financial performance: An empirical investigation in an Iranian company.African Journal of business management Vol.5(1), pp88-95. Bennett, Roger 1996.Corporate Strategy and Bussiness Planning, First edition, London: M & E Pitman

Research Journal of Finance and Accounting www.iiste.org ISSN 2222-1697 (Paper) ISSN 2222-2847 (Online) Vol.9, No.14, 2018
54
Publishing Blogspot. (2012). Definisi-Pengertian Kesehatan Bank menurut para Ahli. Diakses pada 7 Agustus 2014 dari World Wide Web: http://mbegedut.blogspot.com/2012/10/definisi-pengertian-kesehatan-bank.html Blogspot.(2013). Statistik Perbankan Indonesia bulan Desember 2010-2013. Diakses pada 10 Agustus 2014 dari World Wide Web http://www.bi.go.id/id/statistik/perbankan/indonesia/Pages/SPI_1213.aspx Blogspot. (2013). Statistik Ekonomi Keuangan Indonesia. Diakses pada 10 Agustus 2014 dari World Wide Web http://www.bi.go.id/id/statistik/seki/bulanan/Pages/SEKI-Desember-2013.aspx Brigham and Houston. 2010. Fundamental of Financial Management, Edisi 11. Jakarta : Salemba Empat. Cahyani dkk,. Pengaruh intellectual capital terhadap profitabilitas pada perusahaan manufaktur yang terdaftar di bursa efek Indonesia., Jurnal Riset akuntansi dan perpajakan Vol, 2, No. 1,hal 1-18 Certif.2012.Pelatihan berbasis kompetensi, Sertifikasi profesi Bank Perkerditan Rakyat,Manajemen Aset dan Liabilitas, menetapkan standar Meningkatkan Kinerja.Jakarta Clarke, M., Seng, D., & Whiting, R. H. (2011). Intellectual Capital and firm performance in Australia. Journal of Intellectual Capital,12(4):505-530. Davood Choopani, Ali Ehtesham (2016). “Influence of Intellectual Capital components on financial performance of companies in food industries”. Internasional Journal s(1),2016:431-439. Firer, S., & Williams, S. M. (2003),.Intellectual Capital and Traditional Measures of Corporate Performance.Journal of Intellectual Capital,4(3),348-360. Iman Ghozali 2013. AplikasiAnalisis Multivariate dengan Program IBM SPSS 21. Semarang: Badan Penerbit Universitas Diponegoro. Hoque, Ariful., Mia, Amin., & Anwar, Rakibul. 2015. Working Capital Management and Profitability: A Study on Cement Industry in Bangladesh. Journal on Finance and Acounting. Infobank, No. 399, Juni 2012 Kasmir. 2014. Dasar-dasarPerbankan. EdisiRevisi 2008. Jakarta : PT Raja GrafindoPersada. Khan, Muhammad., & Khokhar, Imran. 2015. The Effect Of Selected Financial Ratios On Profitability: An Empirical Analysis Of Listed Firms Of Cement Sector In Saudi Arabia. Quarterly Journal of Econometrics Research. Martono. (2002). Bank & Lembaga Keuangan. Yogyakarta : Penerbit Ekonesia Munawir, S. 2010.Analisa Laporan Keuangan, Edisi 4. Yogyakarta : Liberty. Norantika, Dewi. 2014. Pengaruh Perputaran Modal Kerja, Perputaran Piutang, Perputaran Kas dan Perputaran Persediaan terhadap Net Profit Margin (NPM) pada Perusahaan Industri Barang Konsumsi di Bursa Efek Indonesia Periode 2009-2013. Okwo, Ifeoma Mary., Enekwe, Chinedu Innocent., & Ugwunta David Okelue. 2012. Financial Management as a Determinant of Profitability: a Study of Selected Pharmaceutical Firms in Nigeria. European Journal of Business and Management. Otoritas Jasa Keuangan. Statistik Perbankan bulan Desember 2010, 2011, 2012 dan 2013 Partina Ana, Rahmawati Aini. (2007). Bank dan Lembaga Keuangan Non Bank. Jakarta: Penerbit Universitas Terbuka Pulic, A 2000. “An Accounting Tool for Intellectual Capital Management.” http://www.measuring-ip.at/papers/ham99txt.htm. Rachmawati, D.A.D. (2012). “Pengaruh Intellectual Capital terhadap Return on assets (ROA) Perbankan. Jurnal Akuntansi, 1(1). Rehman, H. ur, Zahid, A., Rehman, C. A., & Rehman, W. ul. (2011). Intellectual Capital Performance and its impact on corporate performance: an Empirical Evidence from Modaraba sectorof Pakistan. Australian Journal of Business and management research,1(5):8-16. Restu, F, Pengaruh Intellectual Capital terhadap Economic value added pada perusahaan perbankan yang terdaftar di bursa efekIndonesiaPeriode 2011-2013, jurnalakuntansiuniversitasnegeri Surabaya. Riyanto,Bambang. 2008. Dasar-dasar Pembelanjaan Perusahaan. Yogyakarta: Gajah Mada. Riyanto, Bambang. 2012. Dasar-dasar Pembelajaran Perusahaan. Edisi keempat. Cetakan kedua belas. BPFE. Yogyakarta. Rolos, Olivia. M., Murni, Sri., & Saerang, Ivonne. S. 2014. Modal Kerja Pengaruhnya Terhadap Net Profit Margin Pada Perusahaan Tambang Yang Terdaftar di Bursa Efek Indonesia. Jurnal EMBA. Rousilita Suhendah, 2012. “Pengaruh Intellectual Capital Terhadap Profitabilitas, Produktivitas, dan Penilaian Pasar pada Perusahaan yang Go Public di Indonesia padaTahun 2005-2007. Jurnal Akuntansi Universitas Tarumanagara. Santoso, Clairene. E. E., (2013). Perputaran Modal Kerja dan Perputaran Piutang Pengaruhnya Terhadap Profitabilitas pada PT Pegadaian Persero. Jurnal Universitas Sam Ratulangi Manado Sulistianingrum, Silviana. D., Suryadi., & Warneni. 2012. Pengaruh Perputaran Modal Kerja Terhadap Profitabilitas Perusahaan Property and Real Estate Terdaftar di BEI. Sugiyono. (2014). Cara mudah menyusun Skripsi,Tesis, dan Disertasi. Bandung: Penerbit Alfabeta

Research Journal of Finance and Accounting www.iiste.org ISSN 2222-1697 (Paper) ISSN 2222-2847 (Online) Vol.9, No.14, 2018
55
Suwajuwono dalam PuspitadanWahyu, 2011 Intellectual Capital :Perlakuan Pengujuran dan Pelaporan (Sebuah Library Research). Jurnal Akuntansi & Keuangan Vol.5 No. 1 pp.35-57. Tan, HP, Plowman, D., & Hancock, P. (2007) Intellectual Capital and Finacial Return of Companies. Journal of Intellectual Capital, 8(1), 76-95. Ulum, I (2015). “Intellectual Capital performance sector perbankan di Indonesia”. “ Intellectual Capital: Model Pengukuran, Framework Pengungkapan, dan Kinerja Organisasi. Warno. (2011). Intellectual capital: PerspektifPengakuan, Pengukuran dan Implementasi. Jurnal STIE Semarang, 3 (3). Warrad, Lina. 2013. The Impact Of Working Capital Turnover On Jordanian Chemical Industries’ Profitability. American Journal of Economics and Business Administration. Wibowo, Eko. 2012. “Analisis Value Added sebagai Indikator Intellcetual Capital dan Konsekuensinya terhadap Kinerja Perbankan” Journal of Accounting Wignjosoebroto.2000.Tehnik Tata Cara dan Pengukuran Kerja.Surabaya:Guna Widya Zeghal D., &Maaloul, A.(2010). Analising value added as an indicator od intellectual capital and its consequences on company performance. Journal of intellectual capital 39-60. Zuliyati, 2011. “ Intellectual Capital dan Kinerja Perusahaan”. Jurnal dinamika keuangan dan perbankan. Vol.3, No.1: hal 113-125 Zulmiati, 2012.“ Intellectual Capital Terhadap Kinerja Perusahaan” Jurnal akuntansi Universitas Dipenogoro.