Social and landscape effects on food webs: a multi-level network simulation model
Upload
independentCategory
view
0download
0
Proceedings of International Computer Symposium CIC’97 (Mexico,1997). Pedro Galicia ( Ed.). National Polytechnic Institute, Mexico, pp.52-85.
This is the report sent to Mexico-City Government__________________________________________________________
_______
Computer tool kit for structuring andclassifying the information for solution ofsocial, political, economic, and regionalproblems in the Moscow Mayor’s office
Author: Prof. Dr. Pavel Makagonov, Deputy Chief of Mayor Directorate in Moscow Mayor’s Office (Russia)Presentation: Prof. Dr. Mikhail Alexandrov Center for Computing Research of the National Polytechnic Institute (Mexico)
Abstract
Information analysis in practice of the city management isfacing with difficulties typical for all forms of weaklyformalized humanitarian problems: weakly structured datahaving mainly quality information form. To solve the majorpart of those problems the data might be presented in theobject-attribute matrix’s form. The joint use of thecollective of heuristic algorithms is proposed to developdecision-making support system on the basis of structuring,classification and clustering. Having various competence ofeach algorithm on concrete data might find asymptoticallyoptimal combination of algorithms. In algorithms instead ofcriteria of neighborhood similarity and belonging to onecluster intuition and expert’s experience might be used. Therole of computer part of the dialog graphical human-machine(computer) system comes to operative adaptation of the
subproblem of data for image analysis. Examination is made inthree examples, where the objects for cluster analysis are:the city management systems, territorial units of the cityand concrete citizens and their properties (attributes) arerespectively city development indexes, subjects of the lettersof the citizens to the city administration and public healthindexes, obtained with the method of express-diagnostics.
Keywords:
city management, letters of citizens, public healthdiagnostics, weakly formalized problem, weakly structureddata, heuristic algorithm, image analysis, clusteranalysis, dendrite, decision-making support system.
1. Introduction. Problem formulating
Problems of the information analysis that big cityadministration ( in particular Moscow Mayor’s Directorate)faces in practice have a multiaspect interdisciplinarynature. They are, as a rule, weakly formalized problems towhich the following properties are typical:- weakly structured data;- fuzzily determined objectives, impeding the elaboration of
criteria of their achievement; weakly structuring because ofthe fuzzy, ambiguous wording of the objectives, (that isnormally expressed in advancing a set of particularrequirements fulfilling of which as it is supposed, providethe achievement of that global fuzzy objective);
- complexity (multilaterality) , expressed in mixture ofmutually dominated economic, ecological, humanitarian andother aspects;
- quality or combined nature of the used information;- absence of template rules of the decision-making and routine
mathematical processing methods;- absence of the developed system of the models of the
analyzed problem.
2

Social, economic and administrative system are open and theirmodels depending on the formulation of the problem might varyup the set of the factors substantial for this particularproblem. The openness of the humanitarian system iscomplicating the problem even more by virtue of the models’dependence not only from the internal properties of theobjects of the system in examination, but also on theproperties of the supersystem and on the processes of theinformation exchange, energy and materials between system inexamination and supersystem, in which it is submerged. It isnot always obvious in relation to the system of the citymanagement where the concrete property of the objects inexamination concern - to subsystem or supersystem.
Correctness of each of the ideas expressed here will be backedby the demonstration of the examples of the computationexperiments in practical materials. As examples we are takingthree different type problems from humanitarian spheres:- estimation of the city management quality for its
optimization on the basis of the citizens’ letters to theMayor’s Office;
- analysis of materials of the Russian Mayors’ competition inorder to range them according to their achievements;
- analysis of possibilities to apply express-methods of theestimation of the public health qualities in order toincrease the effectiveness of the insurance medicine.
We are going to explain formulating of each of those tasks.
1.1 Analysis of the citizens letters
Why is to evaluate the city management according to theanalysis of the citizens’ letters to the Mayor? Thecitizens’ letters to the Mayor with their petitions,complaints and proposals to improve the city administrationwork might be used as an important element of the feed backin the city services management system to elaborate operativemanagerial decisions and to improve the legal basis of thecity management.
3

Relation a type of a complaint to the address of respondentpermits to separate problems requiring decision on the wholecity level and even on federal level, from the problems ofthe city district or neighborhood.
While using data on complaints in the estimation of theactivities of the city administration on different levels, itis necessary to take into account a discrepancy of opinionsof those who complain and city administration as regards thelevel of the management on which exist the tools for theproblem solving mentioned in the complaint [1], as well as thefact that the distribution of the problems of complaints inthe districts is influenced not only by the quality of theadministration work, but also historically long-term factorsof the district development.
Figure 1 shows comparison of two curves. First - isdistribution of the letters (complaints and petitions) of thecitizens to the city Mayor according to rubrics - reflectssocial expectations of citizens from the administration.Second curve is obtained as a result of the questioning of 50Mayors of the Russian cities - from the biggest, with thepopulation over one million, up to small towns with thepopulation of 20 thousands. Second curve reflects theestimations of the city administration of their possibilitiesto independently solve social problems indicated in therubrics of the letters. Small values in their estimationsreflect absence of the resources and managerial tools tosolve those problems. Big values, on the contrary, show fullcontrol of the problem by the administration. The divergencebetween those curves reflect not only difference betweenwishes and possibilities. They reflect also difference inapproaches to solve the problem. In particular, some kind ofcomplaints of citizens reflect their social customs of thepast, they are typical for the administrative distributivesystem. At the same time, we can not say that administrationis fully guided by the principles of the socially- orientedmarket economy.
Since the city is an open system it is difficult to separate
4

in the complaints the general city problems from local andfrom state ones. Each complaint, being examined separately,is sent into archives then. This is typical situation whenthe data base accumulate huge information valuable not onlyin small portions but as a whole. But from that point of viewsimilar information is analyzed only on the level of thegeneral consolidated statistic. What is still left open isthe problem how to make knowledge hidden in this archivesuitable to elaborate strategy of the city management. Thisproblem belongs to the Data Mining in Computer Science.
1.2 Competition of the Russian Mayors
In 1995 there was a competition of Russian Mayors. During thelast stage of the competition the questionnaires wereintroduced urgently with surplus number of quality andquantity indexes developed by us taking into accountproposals of the jury’s members. At the same time the Mayors,filling in the questionnaires, received possibility to makethe rate voting on suitability of indexes to evaluate theirwork. The list of indexes for evaluating the quality of theMayors work was selected on the basis of analysis of theircollective opinion. According to those indexes it wasnecessary to range city Mayors according to the success oftheir work that is to solve the problem of the one-dimensionranging on multidimensional data, presented with the tableof quality and quantity characteristics.
Up to now there is no stable set of indexes to evaluate thequality of city management in the world. The reasons areabsence of the uniform quantity equivalent of the evaluationof the quality of life and the quality of the city services[2,3]. Methods, based on the comparison of the value andeffectiveness can not be fully applied because of necessity ofinvolvement of such indexes as public health, life spun,victim rate, crime rate, damage from the mistakes of theadministration and etc. We do not know any generally acceptedmodels and algorithms to solve these tasks of one-dimensionalranging in absence of clear criteria.
5

1.3 Express-diagnostics of the public health
The problems of improving the prophylactics of the publichealth are not less difficult. First, it is connected withdefinition of the public health and difficulty to elaboratecriteria to define it. What is public health? Is it aresource of national economics or one of the characteristicsof the quality of life, of the development of the society?Today there is no answer to this question that would suit foreveryone. The reason of this situation is absence of thedefinition of the human that would suit physicians andsociologists. Since this notion depends on being age,professional requirements imposed by employers, sometimes onsex and sometimes on the territory occupied by the population,up to now there is no uniform generally accepted and equallyunderstood notion of public health.
One thing is clear today that the health of the individual, agroup or a demographic group is connected with the study ofthe open system. The form of the development of the object(for example, human health) in the external environmentcharacterized by kinetics, that is by persistent flow ofsubstance, energy and entropy, that is by changes of energyquality or degree of consolidation in the internal structureof the object (for example, reserve of adaptability of thebody to the changes of the external conditions - the flows ofsubstance and energy).
It is clear from economic considerations, that application ofthose thin, labor-consuming and valuable methods ofprophylactic examinations of public health should be backed bythe results of the cheaper express-analysis. We organizedanalysis of the method of the express-diagnostic called“Diacoms” [4], based on the changes of the 12electrophysiological indexes before and after small physicalworkload with the help of electropuncture. The authors ofthis method referred to the classical method of Nakatanibased on structural-functional model of human being. Theyconfirm that their measurements are sufficient to developedthe condition of health, if information on sexual, age,regional, professional and some other group particularities of
6

concrete person is available. This required the checking. Theproblem was reduced to the proving of the possibility ofrecognition of the sick and healthy people on the basis ofthe results of the express-diagnostics in absence of theuniversal and stable criteria. The level of probability of thefirst and the second type errors in solution of the problemhad to give possibilities to reducing the costs formonitoring of the public health without reducingeffectiveness.
2. Data Mining and Knowledge Discovery problems
If the data collection on similar problems takessufficiently long time and passes actively, then at least onepart of the original information is presented by formalizedfactual material in form of the data base or table. Thisinformation in many cases is possible to roll into the matrixof the object-attribute type.
It goes without saying, that the rolling up of information isnot always simple and obvious problem. Sometimes the originaldata even are not complete in details, taking into account alltheir mass nature, and their replenishment is oftenimpossible. Part the information is contained in the fields ofcomments, it is related with natural language and itsformalizing, its structuring requires applications of theapparatus of semantic analysis or at least quasisemanticanalysis. These aspects are discussed in the workshop reportwith our participation.[ 5]
As soon as we get the data in the form of object-attributematrix, the task on the cleaning of those data is raised. Weare speaking not about the elimination of mistakes, butmaking, optimization of the image of data according to theconcrete problem. If this problem is revealing the generalproperties in their totality, then we are first of allinterested in the most frequently or most rarely appearingquality and quantity characteristics. These arecharacteristics of belonging of objects to one class. Oftenit is characteristics of one type conditions of the
7

supersystem that practically take place for all objects inexamination.
What is interesting from the point of view of studying objectsof one system is differentiation of these objects accordingto the properties in a number of group, class (clusters),general number of which tens (or more) times differs fromthe selective or general totality of objects.
If it is necessary to develop specific particularities of thetotality of objects in examination, their clustering, thegeneral and rarely properties should be eliminated. ( Rareproperty means wide spreading of the opposite property).Filtration of the general properties is advisable to carryout on the preprocessing level. In order to makepreprocessing of the original information it is necessary tohave local data base either internal to the dialoginterpretation system or external but suitable to create localsubbase of the table type.
3. Heuristic of the image analysis
Thus, the absence of models and nondevelopment of theaxiomatic, combination of the quality information withquantity information in weakly formalized problems while thevaguely determined objectives do not give possibility togroundly apply the known methods of analysis of multi-dimensional data. That is why the apparatus of spectral andstatistical analysis as well as methods of cluster and imageanalysis [6,7] should be used as heuristic algorithm [8]. Inoriginal form these methods were developed as a model to theproperties of which were assigned some axiomatic. Theapplication of this method beyond the framework of thisaxiomatic deprives algorithms of the reason of theirapplication and transform them into heuristics.In our case the respective systems of axioms, on whichmathematical methods are based, might be presented ashypothetical and we need some tool kit speeding up theverification of generation and change of hypothetical on
8

axioms and models. We need some means of operative structuringof data. We need some tool kit, not requiring a priorinformation on structural particularities of the problem. Suchapparatus will not replace a human expert, but will intensifyhis intellectual possibilities.
Obviously, the formulated above requirements and limitationsmight be fulfilled only within the framework of the creationof the dialog human-machine system to interpret thehumanitarian information subject to presentation in theobject-qualities matrix type.
The practice of mass solution of similar problems makes usrely on collective of heuristic algorithms. (There is verysimilar idea in image recognition [9]). Each of the algorithmsbehaves in a different way in a new set of data presented inthe object-quality matrix. While comparing (according to thecriteria reflecting the particularities of the problem)results of the work of each algorithms, one might single outthose of them that turned out to be more competent, morestable in the particular set of the original information.These algorithms are declared to be leaders and they are giventhe right to solve the present problem with the present set ofthe original information.
The strong point of the application of the human-machinesystem is it’s first component--a human expert with hisintuition and his nonformal information suitable to generatenew ideas. Nevertheless, it is important to create conditionsfor this expert, in which he might see the original data in anew light. For that purpose it is necessary to apply themethods of the image analysis. Nevertheless, the best resultsappear when expert gets image presentation of not the originalinformation, but the results of application to it of somealgorithms of structuring.
These should be algorithms not requiring a prior informationon models. These algorithms might be elements of algorithmsof clustering, but the material for image analysis should be
9

presented at that moment when criteria of structuring orclustering or this or that optimization are not switched onyet.
Criteria for structuring or clustering should be generated byexpert as result of the image analysis of data usingnonformalized data and experience of expert. First of all weare speaking about the image analysis of geometrical and eventopological dislocation of objects in some properties space.In this case an expert visually singles out some structures,clusters, the existence of which would be difficult to image apriori. To single out one cluster from other objects it isnecessary to introduce local metrics, in which the conditionaldistance inside cluster is bigger then interclusterconditional distance, constructed probably according to someother principle.
The computer part of this dialog system should supply theexpert some information in a form, generating new ideas on thebasis of the analogy method and permitting to verifynonobvious consequences of his ideas--axioms.
The work with collective of algorithms, organized in themultiwindows presentation of data, contributes to that. Insome windows it is necessary to give the expert possibility toform his hypothesis about distribution a totality of objectsin clusters and on mutual locations of clusters; and hemight use these data located beyond object-qualities matrixand his intuition.
Computer part of the dialog system should give possibility forthe expert to express his presentation in one of the windowsin a form, so that information about them finds reflection insome other windows. This might be done by painting theobject’s images or their attributes, belonging to onehypothetical group, in all the windows by one color or bymarking one and the same element with cursor in all windows,if it is forcibly marked by expert in one window and etc.
10

So, the computer part of the system should transmitindications of the object, interesting for the expert, in eachwindow of the multiwindows system. In other windows expertshould find a confirmation of the correctness of hishypothesis. In those other windows there should be presentedthe results of some processing of the original information,and if the results of processing show the correctness of thenonobvious consequences of the proposed axiomatic, than theconfidence to this axiomatic is increasing. We will call thisprinciple the justification of the model on the level of theComputer Science.
The most interesting algorithm of clustering of objects inpractice of societal studies are construction of dendriteaccording to the method up to the closest neighbor [7] andmethods of factor analysis [6,8] on the basis of solution ofthe full problem of eigen numbers and eigen vectors ofcovariational matrix constructed on the object-attributesmatrix. Their joint use gives much greater effect than eachof them separately.
Dendrite, constructed for all the objects according to themethod up to the nearest neighbor is valuable by the fact thatit does not depend on dimension of the space of properties andgives image representation on the basis of joint use of allinformation in each objects. The algorithm permits to presentdendrite in the form of graph with indication of the arcs’lengths in the colored scale of distances. An expert has apossibility to make invisible all the arks (edges of graph)longer than the assigned value. The uniform graph is splittedinto forest, each tree of which could be considered as acluster of object, the distance between which is less thanbetween the clusters. By selecting the level in the scale ofdistances, an expert could operatively advance hypothesis ondistribution of all the totality of objects in clusters.
Analysis of dendrites permits to make the idea of the mostvaluable clusters and clustering centers. The expert mighthave possibility to fix hypothesis on distribution inclusters by painting the objects of each clusters in one
11

color. Then the hypothesis is verified as revealing ofnonobvious consequences. For that purpose the color of theobject assigned by the expert is transmitted by the systeminto other windows, where the objects located on the bases ofother criteria of neighborhood (in original order, ingeographical coordinates and etc.). By analyzing the mutuallocation of the painted objects in other windows, an expertverifies correctness of his hypothesis and makes correctionsof the details.
The most productive means of such verification is the methodof factor analysis. In accordance with this method all theobjects might be reflected in subspaces of orthogonal vectors- factors (Fi), that are linear combinations of original set ofobject properties. The method of natural orthogonalcomponents is taken as a basis for clustering in factor space.This method permits to select the coordination system (factorpairs), taking into account internal links of attributes anddependencies hidden in them.
During the problem solution an expert has possibility toverify the stability of the selected clusters, at the sametime observing them in factor spaces and in dendrite. Thestability of clusters obviously might serve as criteria of thequality of solution and objectivity of analysis. Figure 2 shows as 4 clusters of individuals, corresponding to4 different genetic diseases, might be visually devided in twofactor spaces and in dendrite. Even if one develops algorithmof automatic separation of those 4 clusters it might turn outthat principles laid down in them and criteria would not beworking in a majority of other cases.
Figure 3 shows a map iso-potential lines as image of a matrixof indexes that characterize the successful work of mayors.The blue color (light gray in black-white drawing) correspondto big positive values, orange (gray in black-white drawing)in paint corresponds to the zero values, brown ( deep gray inblack-white drawing) - to the big-in-amplitude negativevalues. The colored scale on the left side shows lengths ofmatrix’s lines belonging to the objects of one class. In the
12

factor space window, located on the right side of drawing, onecan see the painting of objects according to the degree ofreduced rating of the success from the upper right corner tothe lower left one. The analysis of this window shows that theabsolute antipodes to the group of the most successful mayorsare absent. They did not take part in this competition.
On the other hand the presentation of the object-qualitiesmatrix, consolidated according to the classes, has the clearlydefined block structure which would be not only difficult toanalyze without image presentation as a map but in general tonotice it. The block structure of the matrix is revealed, whenseveral attribute clusters or object clusters are available orif objects and attributes are consolidated in accordance withtheir belonging to their clusters.
The results of the work of algorithm might be requiring newrestructuring and filtration of the original information,reconcideration of the original properties, rolling up part ofthem to new characteristics, corresponding to the objectivesdefinition. It is clear as well that collective of algorithmsshould be minimized as possible, but on the other hand shouldbase on the various principles of grouping and differentiationof objects.
While searching for algorithm of consecutive and joint use ofthe assigned tool kit, an expert solves the problem ofadaptive search of asymptotically optimal algorithm forconcrete totality of data. He tunes tool kit in accordancewith the particularities of the concrete totality of data.Successful completion of search of optimal algorithm ispractically moment of solution of the problem. After that forthe new selection out of the same general totality algorithmmight be replaced by more simple method of recognition usingthe first selection as educational.
4. Classification problem in the example of analysisof the citizens appeals to the Mayor
13

The original information is presented as a matrix, the linesof which corresponds to administrative districts, that isterritorial objects, and columns - to types of complaints,that is characteristics (properties, attributes) of thoseobjects. The element of matrix is also a number ofcomplaints of particular type in particular administrativedistrict of the city.
In this matrix all the properties (in general case) might besplit into three groups. Naturally those groups are presentthere in the hidden way. First group contains characteristics,comparable according to its value for all objects. Secondgroup comprises properties present in substantial form insignificant part of objects and weakly presented in theothers. We consider as a significant part the totality ofobjects, making not less than first dozens of percent from thegeneral quantity. The third group comprises the rareproperties, developing not more that in 1 to 5 percent of theobjects.
First part of the properties normally appears in connectionwith the transition from the examination of the system of thehigher order towards subsystem. These properties are advisableto single out into separate totality, since all the objectsaccording to them seem to be almost similar. The solution ofproblems, connected with those properties, lays either in theupper level of the subsystem management, or in the system ofthe next higher level. Without elimination of these propertiesthey will be masking the specific of each of those objectsimpeding the distribution of them in classes. Because of thesame reason the rarely appearing properties were eliminated aswell.
Nevertheless, when considering the problems of operativereaction and management those properties will be preservedsince they are effective feed back in the management systemand indication of their deviation from the normal condition.
Cluster analysis of the citizens letters was made from this
14
positions.
Since the idea what should be a cluster is not known a priorithe separation of cluster is made by an expert in a regime ofgraphical dialog with the system.
The problem of the attribute classification might be solved.Then the role of columns and lines of the original matrix ofthe object-attributes type is changed.
Before the clustering beginning the system is used to filterthe clearly not informative attributes and simplify the searchof clusters.
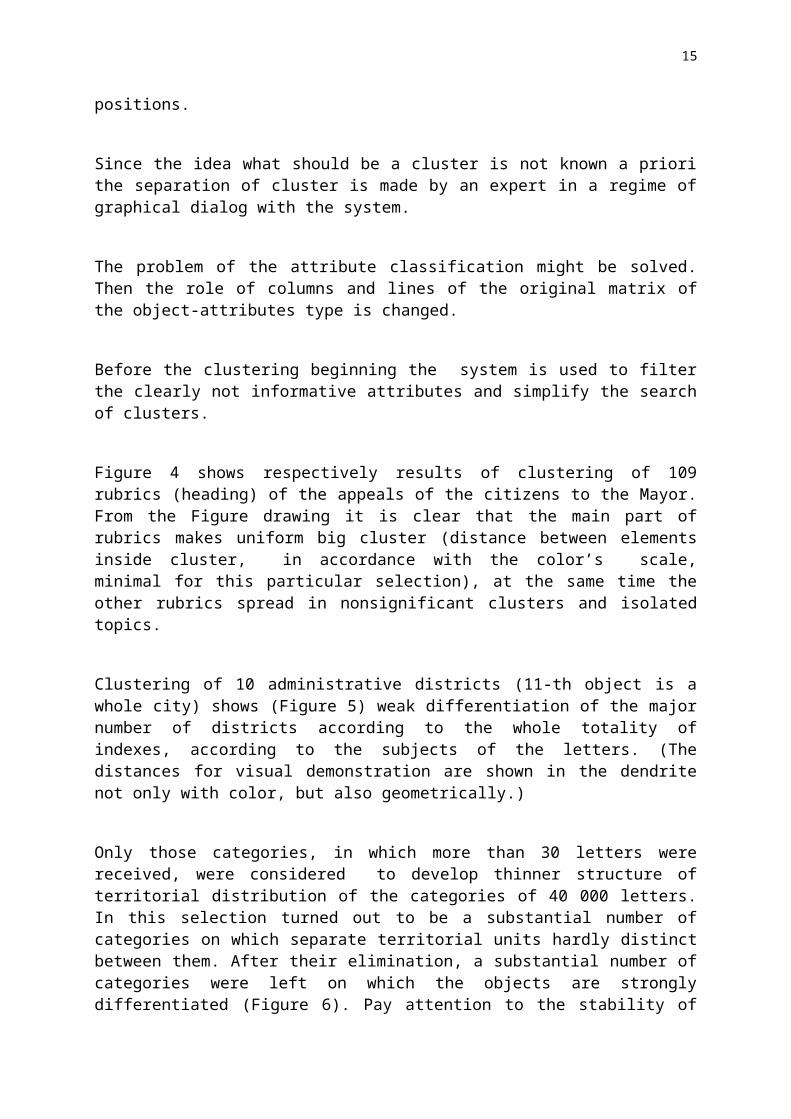
Figure 4 shows respectively results of clustering of 109rubrics (heading) of the appeals of the citizens to the Mayor.From the Figure drawing it is clear that the main part ofrubrics makes uniform big cluster (distance between elementsinside cluster, in accordance with the color’s scale,minimal for this particular selection), at the same time theother rubrics spread in nonsignificant clusters and isolatedtopics.
Clustering of 10 administrative districts (11-th object is awhole city) shows (Figure 5) weak differentiation of the majornumber of districts according to the whole totality ofindexes, according to the subjects of the letters. (Thedistances for visual demonstration are shown in the dendritenot only with color, but also geometrically.)
Only those categories, in which more than 30 letters werereceived, were considered to develop thinner structure ofterritorial distribution of the categories of 40 000 letters.In this selection turned out to be a substantial number ofcategories on which separate territorial units hardly distinctbetween them. After their elimination, a substantial number ofcategories were left on which the objects are stronglydifferentiated (Figure 6). Pay attention to the stability of
15

geometrical representation of objects in dendrite and factorspace of two main components after the reduction of number ofsigns in Figures 4 and 6.
This reduced matrix is the base to reveal the distinctionbetween separate territories of the city and to makemanagerial decisions of particular nature. A cluster analysisof districts was made on them and as a result they werestrongly split in all the dominant factor subspaces (Figure7).
5. Object-properties matrix forming
In the previous demonstration example object-attribute matrixwas formed by way of simple query to the data base with thefollowing normalization by the citizens number in eachadministrative district. Normally the forming of the object-attribute matrix turns out to be many stage process with stepby step change of the structure of qualities as well as theform of their coding. We are speaking about:- the joint use of quality and quantity parameters,- reducing quality and quantity parameters to one type
category of scales,- combination of various types of weak scales the most
important of which in this particular case turns out to benominal and ordinal,
- normalizing the values of attributes, adaptation qualityand quantity attributes to the comparable type forpossibility of their further one type processing,
- rolling up of the original attributes to the combinationwhich might be local criteria of optimality of correlationof their values.
This list of question’s might be demonstrated by an example ofthe Mayors’ competition problem solution.
It goes without saying that quantitative indexes of themayors’ activities are normalized by value of the resource of
16

each of them so that to get out from the influence of thecity size or the resources located in it. All the indexes aretransformed into pure number.
By the limitation of the city resources there are local,temporary and century limitations of growth for any index ofthe city development. After achievement of this limits thenegative consequences appear in the form of oppression growthof other parameters of development.
The problem of forming optimality criteria for citydevelopment consists in the construction of relationshipsindex and resource or competing indexes, for whichunsatisfactory value of one of them might depreciate theachievement in the other.
In principle the most convenient indexes rated in such way sothat for a medium city they were closed to zero and maximumdeviations were similar for all the indexes both in positiveand negative direction. This would permit to consider, whilemeasuring the similarity of cities or mayors according to thisparticular system of indexes that each of them has equaldegree of influence.
The constructing of indexes is most preferable from thequestionnaire data, reflecting opposing trends and actions,comparing objectively existing undesirable processes withactions of the Mayor, exerting balancing influence on thedevelopment of those processes.
Let us demonstrate it by the following examples:
Crime rate might be related to the population number as wellas to the number of the police officers. Certainly the numberof police officers closely correlate with the populationnumber, but in fact the degree of filling of the police staffas well as qualification of professional hands theeffectiveness of the crime struggle depends on the Mayor. That
17

is why the normalizing by number of population will speakonly on the degree of the crime development and rate settingin number of police officers will permit to evaluateeffectiveness of the crime prevention.
It is known that the optimal value of capital investment closeto 25% to the gross national product. If the budgetstipulates those figures different from 25% in any side, thiswill mean not only particularity of the current situation, butalso various subjective orientation of the Mayor, generallyspeaking, to non-optimal actions both in substantial successof this figure and under it.
To compare various parameters it would be methodically betterif all they are one-type according to their orientation oftheir trend of changes from the best to worst. Some indexesare advisable to introduce with negative value if their growthshows the unfavorable trends.
If during the analysis it turns out to be that a part ofparameters of concrete data from the optimized turned out tobe maximized, then it would be better to make all of themmaximized by introducing new functional scales. For example,if the better quality of the Mayors’ work reflects zero valueof parameters and deviation of both signs witness theworsening, than instead of that parameter together with someother maximized ones, it would be better to take absolutevalue of this parameter with negative sign.. If optimum lays inside the diapason of the admitted values(and not on its border), then the objects could be rangedaccording to their degree of distance from the optimum pointin any direction. If we assume for the convenience of indexcomparison, that the values closes to optimal should producebigger score, we might be brought to the necessity tointroduce the ordinal scale.
While forming the system of quality indexes that should beused jointly with quantitative, it is desirable to use, if
18

possible, the ordinal scales stronger in comparison withnominal. This recommendation differs from the practice ofconducting expertise reducing quality and quantity propertiesto their dichotomous signs in nominal scales. While using thismethod, should take place the simplification of theclassification problem hands reducing the expert’s mistakeprobability and our approach has it is own advantage tosoften defaults linked with «multi-dimension damnation».
In fact we should pass from the property set to characterizeobjects towards stable criteria set according to which we willtell ranging and grouping objects.
6. Cluster analysis of cities and mayor’s achievements
Principle of equal degree success was used here as a leadingmethod to develop informative set of parameters. The principleis that the winner cannot be candidate having big success onlyin one particular index while having other indexes medium andweak. The winner should have many factors according to whichhe positively differs from the others, from the main mass.From the point of view of the citizen - consumer of cityservices - the success in one of many, generally speaking,closely connected, interdependent and inter-complimentingindexes does not mean anything if there is a failure or modestsuccess in other indexes. What is needed is integratedpositive effect in many simple indexes and not hugebreakthrougn only in one of them. Otherwise, we will probablyget the result non-balanced and not coordinated with the mainpurpose.
According to the introduced principle, high places should notbe awarded to those mayors, for whom the excluding ofinsignificant part of the indexes, on which they reached somesuccess, would transform them from leaders into outsiders.
As result, while revealing competition winners one mightconsecutively eliminate weakly informative indexes, non-
19

significant in concrete situation, and to reduce the number ofcandidates, by eliminating a priory outsiders so that leftproperties could visually demonstrate the essence ofachievements, permitting the mayors-candidatures to enter innumber of winners.
Figure 8 showing the attributes as objects and the names ofthe cities as attributes, demonstrates that in the describedsituation scale of values of the F20 factors is defined byabnormal value of one Mayor - ¹ 39 (city of Vladikavkaz).
It means that the excluding of these properties would notchange the distribution of all the objects except one. At thesame time the distribution of the other objects might beconsidered not in the narrow part of the scale, where theywere forced because of the abnormal value for one object,and in the whole new scale. This would permit the thinnerstructure of distribution of all the other objects or all theother signs while distancing one of them.
Taking into account the introduced principle the problem ofmayor rating definition is solved in the following way.
1. The index and factor sets appear, in which the main mass ofobjects is transformed into one solid group. These sets arereplaced by the generalized representatives. This step is madein the dendrite for the transponized object-attributes matrix.(This step is made on the dendrite for transponized object-attributes matrix. You can see on the Figure 9 dendrite ofthe attributes of the evaluation of the mayors’ activities.All the links are distanced except the shortest: first level -from 0 to 45.63 - red (dark) edges and second level - from45.63 to 91.25 - yellow (light) edges. Maximum distancebetween the nodes - attributes is the 501.88. On the right thesame nodes are represented by points in the space of secondand third factors (F2*F3). In the screen of the display incolor one might see that the dark grouping in the center ofthe window Weight space all these nodes of the dendrite linkedby the visual edges. The solid groups of objects are replaced
20

by the generalized representatives).
2. By singling out all the nodes, growing into the tree withshort edges, showing by one color, one might control thestability of their unification. Painted by one color all thetops should be considered in the subspaces of dominantfactors. If the groups, singled out in dendrite, are left inthe factor subspaces as compact, if they even mixed with someother elements, in this case this kind of stability is acriteria of correctness of their unification. If the otherelements of the group go aside from it in subspaces of thedominant factors, then it is necessary to withdraw them fromthe group.
3. In the same way as the reducing the number of attributes ismade it is possible to reduce a number of objects by replacingthe tight stable group of objects by their generalized modelrepresentative.
Next step requires the participation of a jury: ranging andgrouping of the winners out of leaders who achieved equaldegree of success in several factor spaces. The jury mightassign weights to different factors - combinations of signs,composing the factors, or singling out independent group offactors, in each of which leaders should be revealed.
In fact an interdependence of various states of activities ofthe mayors produce the special situation: positives values ofsome indexes in certain combinations with negative valuesmight play the role of negative ones. Jury or their expertsobliged to reveal such combinations if they appeared inconcrete material and reflect there opinion about this fact inassignment of weights of indexes or in grouping of objects insubsets excluding interpretation of similar cases as asuccess.
In our case mainly two class of mayors were revealed, havingthe right to claim the winning places connected with theirsuccesses, according to the attributes selection of which was
21

dictated by incompleteness of the original materials. Thefirst group of mayors characterized by significant well-beingof their citizens turned out to be the cities constructed atthe occurrence of oil, gas, gold, diamonds and ferrous oredeposits.
As a rule this group of mayors does not very much complainabout external obstacles, does not care much about some othertypes of city wealth like land, significant real estate,municipal properties.
This group is attached by the mayors of the cities completelysustained by the budget of the Ministry of finance.
The main most numerous group of mayors with more modestsuccess differs by absence of natural resources with thosecities and it is filled with the difficulty conversedenterprises of transforming nature with obsoleteinfrastructure, which is reflected in increased number theclaims towards external circumstances in a great number ofproposals to draft legislation.
The advanced mayors from this group organize proper controland accounting as well as the cities development planning and,in particular, land use. Figure 10 shows the winnersaccording to the principle of the equal degree success invarious indexes.
After generalization of properties and cities with similarvalues of characteristics as well as after elimination ofhurricane deviations of negative separate characteristics ofthe mayors of the cities not claiming the high rating, therelative grows becomes obvious of distances between objects inattributes spaces. In dendrite it is connected withintegration of the closely located objects and in factorspaces after the elimination of hurricane deviations thedifferentiation of objects is growing in all the scale. Thescale of values is being reducing and the objects spread alongall the scale.
22

7. Technics of the image recognition. Analysis of theresults of public health express-diagnostics
In the medical practice the public health is defined by thecontraposition of pathologies. Nevertheless Ibn-Sina A.A.(Avicenna) [10] proposed classification of the degree ofhealth and disease that shows that transition states aredegrees of adaptability of the body towards the environmentand characteristics of degree of preparedness and exhaustionof the body resources to resist.
Let us examine the results of the studies, organized by theauthor of the Diacoms method according to the data, presentedkindly by them. This data are grouped in files according tothe names of diseases from which the examined patients sufferor into files of practically healthy people with possiblecomplaints for some insignificant indisposition. In firstcomputation experiments in each file relating to a certaintype of disease there was singled out averagerepresentative - typical carrier of the disease.
Practically all healthy people was splitting to the groups 60- 120 persons and they were averaged.
As a result selection of 26 characteristic carrier variousdiseases and 12 of representatives of the practically healthypeople were received. This data was subject to lineartransformations. After this 36 attributes of each subjectswere received.
The soft transition from healthy condition towards diseasedoes not permit to hope that there exist clearly definedclusters and distantly located each from the other, if wewould like to study all the population at some territory atthe same time. In this case we might rely only on singlingout the individual classes with softly transitional values ofcharacteristics from one class to another. It means that inattributes space we should establish limits of splitting into
23

the classes in the way so that the distances between theclosest elements of two different classes might turn out to bebigger then the distances between the elements inside of onesof the same class.
The illustration of that is given in the example of the firstfactor (Figure 11) in the space of G1*G2, where the healthcondition for individuals in the right semispace is easilyinterpreted as weak change of the condition of allfunctional system of a human being been after the work load.In the most rough approximation the splitting into cluster ofhealthy (objects of the green color) and diseased people( objects of the blue, gray and violet colors) turns out to beaccording to the first factor F1 that shows that the healthypeople characterized by the increased value of potentials -results of the electrical puncture measurements (left part ofF1 plot) as well as low value of differences of thosemeasurements made before and after the work load ( right partof F1 plot).
The consecutive examination of the results of clusteranalysis in various subspaces permits practically completelyto dissect the healthy and disease fraction and to reveal theconcrete types of diseases. After the consideration of eachfactors spaces the problem of revealing passes towards thecategory of purely logical. The results of measurementsaccording to the Nacatani method turned out to be non-excessive and as physicians confirm self-sufficient forexpress evaluation of the health condition.
This non-excessiveness is revealed in absence of smalldistances in dendrite (Figure 12) and in equidistantdistribution of objects in factors space of first twodominants. Self-sufficiency of factors is revealed in thefact that, for each of the types of diseases for which we hadsome materials, it is possible to find such factors subspacein which individuals, suffering from this particular type ofdisease, satisfactorily distance from all the otherindividuals, the condition of whom is not recognized in someother subspaces.
24

Thus it is seen in the Figure 13 that the diseased person notdistinct from the group of healthy in space of main factorsG1,G2, is clearly distanced from all the others along the axesG3. Violet color designates here 4 individuals suffering fromvarious diseases not different from class of healthy peopledesignated by green color at Figure 12 in the right window ofthe space of factors G1,G2 and in dendrite in the left window.
Let us introduce the following designations: - D(Fi) - algorithm of recognition of objects on the basis of
the surely singled out by one of the factors Fi; - L1(Fg, D (Fi),..............D (Fj)) - algorithm of logical
recognition on the basis of the consecutive or groupexclusion of the surely singled out objects according to thealgorithm D from group of objects singled out according tothe factor Fg;
- L2(Fg,D(Fi),...D(Fj),L1(D(Fk),..D(Fm))......L1(D(Fn),...D(Fp))-algorithm of logical recognition by way of consecutive orgroup exclusion of the surely singled out objects accordingto algorithms D and L1 from group of objects singed outaccording to the factor Fg.
This three algorithms are sufficient to fully identify eachtype of the diseases.
It goes without saying that each average representative ofconcrete disease should be replaced in factor space by certainhyperellipsoid of scattering. In our particular case we couldnot consider that we have sufficient set of data for suchpresentation. Nevertheless it is obvious that if we placeconcrete person in examination with his (her) characteristicsin the same set of data, then his position in all the factorssubspaces, his embedding to that or this cluster, hisneighborhood with those or these average representatives ofthe concrete disease groups give the first information on thecondition of health of this particular person.
It goes without saying also that the additions of a number of
25

easily registered attributes like age, sex, profession,residence gives us possibility to more precisely approach tothe forming of the examining selection and to more preciselyidentify the health condition of the concrete person. Theresults will be of importance to elaborate economic strategyof monitoring of the public health. If the preliminaryexpress- examination permits to substantially reduce thenumber of such risk group, and a cost of this examination willbe less of total examination with more expensive methods, thenit is worthwhile to introduce the cheaper express-methodeverywhere.
8. Use the examination selection
Since the objects- attributes matrix should be filled in allits positions and part of the attributes useful forclusterization might be known only for one part of objectsthat passed more detailed examination an expert might usea method which we call the method of marked atoms. Bypainting objects images in accordance to known additionproperties into various colors and finding there dispositionin formally structured clusters and in some other windows(connected with other methods), we can form hypothesis on theexistence the same valuable, from the point of view ofclassification, properties of all the objects located in thesame cluster with the present one.
In fact we get method of image recognition based on theexamination selection. A particular feature of all thementioned methods of work with dialogue human - machine systemis possible to quickly generate and verify hypothesis what isespecially valuable at the original stage of the solution ofthe weakly formalized problem. That is why the similar human- machine system might be considered as the tool kit not onlyto solve the applied weakly formalized problems as well as thetool to create simple systems to template rules for decisionsmaking.
For example, if we achieved the stable clustering in the flowof objects connected with the concrete problem, and number of
26

clusters while new objects appear in the period of timeobserved, then we might identify belonging of the newly comingobjects to one of the clusters singled out with the help ofthe simple technology not requiring high qualification in theapplied spheres from the operator in the human - machinesystem.
The methods and results of analysis of express-diagnosticsdata for the public health where each object presented theaverage value for the group of 60-150 healthy people or groupsuffering from the same disease, were demonstrated above.
Let us show that satisfactory results could be obtained alsoin the case of mass diagnostics of concrete individuals. Infact from the point of view of insurance the problem ofrecognition might be simplified at the expense of refusal fromthe examination of the statistically rare diseases.
Apart from that in a number of cases we have cleardifferentiation in age, sex, profession, residence and someother social factors. In any case the result of recognitionmight be of probability nature. What is necessary is onlyto estimate the mistake of the first or second kind.
Figure 14 designates, respectively with light blue, green,blue and red color, alcoholics, people suffering from heartdisease, practically healthy men and practically healthywomen, 25 individuals in each group. Yellow color designatesthose suffering who might be hardly singled out among thehealthy people. Violet color shows the healthy people whomight be hardly singled out among the diseased.
Both mistakes do not exceed in this particular case 10%. Afterattachment to this particular selection of 10 heart diseased(Fig. 15 yellow color) and 10 practically healthy men (violetcolor ) the distribution along the axes G1 in comparison withoriginal selection did not change and along the axes G2 itchanged the sign towards the negative, since vector F2 changethe sign as well keeping practically the same nature.
27

Out of the attached heart diseased persons not more then 3 liebeyond the zone of the dislocation of heart diseased of themodel selection and not more then 3 men went beyond theoriginal selection. So the recognition mistake does notexceed 30% while the simplest means and methods admittingimprovement are used. This approach is interesting for thesolutions of problems of insurance and insurance medicine.
9. Conclusion.
The results obtained in applied spheres are considered as anillustration for application of the methods developed incontext of the particularities of the original data and ourdomain recommendation are not absolute.
The stability of results in respect of variation of datashows the objectivity and fruitfulness of application theabove mentioned approach to solve the applied problems of theData Mining, Classification and Decision Support type on thebasis of the collective of heuristic algorithms.
28

Literature.
[1]. Makagonov, P. (1997): Estimation of City Management Quality: Analysis of letters toMoscow Mayor’s Office by the System «Assistant of Expert».The Journal Automatic Controland Computer Sciences. N 3, pp. 11-19.[2]. United Nations Development Programme (1995): Human Development Report:Russian Federation. (rus.)[3]. Hatry, H. P. et al. (1992): How effective are your community services? Proceduresfor measuring their quality. The Urban Institute, Washington[4]. Lakin, V., Fedorov, V. (1991): Computer System of Express- Diagnostics "Diacoms"Abstracts of International Forum "Computer Science in service of ecologyand health.". Tollatti (rus.)[5]. Alexandrov, M., Makagonov, P., Norkin, K. (1997): Decision Making withsupport of laws, normative deeds and precedents in Moscow Mayor’s Office. Project of system.Abstracts and Reports of International Symposium on Computer Sciences CIC-97. Mexico [6]. Joresrog, K. (1963): Statistical estimation in factor analysis. A new technique and itsfoundation. Inaugural dissertation, Uppsala, 1963[7]. Pluta, W. (1977): Comparative multi-dimensional Analysis in Economics. Warsaw:"Economics". [8]. Makagonov, P., Denisov, V. (1987): Graphical representation of the results of fieldanalysis by the method of Empirical Orthogonal Functions. Abstracts of II NationalConference on Image Analysis., Moscow: Society of Instrumental Engineers,1987(rus.).[9]. Rasstrigin, L., Erenstein, R (1981): Collective recognition method. Moscow.(rus.)[10]. Ibn-Sina, A. (Avicenna) (1930): A treatise on the canon of medicine. 1930(translated by Gruner), (rus.)
Figures
Fig. 1. Comparison inhabitants' and administration's social expectations.Fig. 2. Clusters of 4 genetic syndromes in dendrite and factor subspaces.Fig. 3. Map image of matrix of mayor's successful work.Fig. 4. Clusters of letters' topics in factor subspace and dendrite.Fig. 5. Short distances between clusters of administrative regions at theinitial set of attributes in factor's space and dendrite.Fig. 6. Clusters of letters' topics in factor subspaces and dendrite aftereliminating of close attributes.Fig. 7. Clusters of administrative regions in brief list of letters'topics.Fig. 8. Anomalous results of attribute for only city. Candidates forelimination from matrix objects-properties.Fig. 9. Singling out descriptions in dendrite and factor's space.Fig. 10. Determination winners according to the principal of the equaldegree success in various indexes. ( in right upper corner of factors F1and F2 space red color cluster - cities' mayors with great results, formingfactors F1 and F2).Fig. 11. Classification of sick and almost healthy people ( factor F1 - thegreat results of dimensions (Nakatani's Method DIACOMS (electrical puncture
29

diagnostics and its Computer version).Fig. 12. Evendistributed reciprocal remote objects ( with differentcondition of health ) in dendrite and factor's space.Fig. 13. Possibility to singling out different kinds of sicknesses inproper factor's space.Fig. 14. Possibility to discrimination closed groups of sick and healthypeople in factor’s space.Fig. 15. The identification of sick and almost healthy men in factor'sspace with the examination selection.
30
Copyright © 2022 FDOKUMEN


![JNTU ONLINE EXAMINATIONS [Mid 2 - lica] - Webs](https://static.fdokumen.com/doc/165x107/633727b2d63e7c790105aa60/jntu-online-examinations-mid-2-lica-webs.jpg)