Application of Delaunay triangulation to the nearest neighbour method of strain analysis
Upload
braintrainCategory
view
2download
0
Journal of Experimental Marine Biology and Ecology 391 (2010) 101–111
Contents lists available at ScienceDirect
Journal of Experimental Marine Biology and Ecology
j ourna l homepage: www.e lsev ie r.com/ locate / jembe
A neighbour is a neighbour? Consumer diversity, trophic function, and spatialvariability in benthic food webs
M.C. Nordström ⁎, P. Lindblad, K. Aarnio, E. BonsdorffEnvironmental and Marine Biology, Department of Biosciences, Åbo Akademi University, Artillerigatan 6, BioCity, FI-20520 Åbo, Finland
⁎ Corresponding author. Tel.:+358 02 215 3420; fax:E-mail address: [email protected] (M.C. Nords
0022-0981/$ – see front matter © 2010 Elsevier B.V. Aldoi:10.1016/j.jembe.2010.06.015
a b s t r a c t
a r t i c l e i n f oArticle history:Received 3 March 2010Received in revised form 10 June 2010Accepted 14 June 2010
Keywords:Functional diversityNiche complementarityPredator–prey interactionsStable isotopesδ13Cδ15N
The short ecological history and the environmental conditions characterising the Baltic Sea make itinhabitable for only few species, resulting in a functional poverty of the system (number of functional groupsand number of species within each group). Thus, it is a well-suited system for studies on biodiversity andecosystem functions, particularly when moving from observation of patterns to determination ofmechanisms behind observed relationships, such as the importance of species richness for trophicfunctioning. Predators in the benthic community are predominately generalists, with a potential for overlapin trophic function. Through analysis of stable isotope ratios (13C:12C and 15N:14N), we determined thetrophic position of epibenthic consumers and estimated spatial variability in isotope ratios of food webcomponents at nine shallow sandy sites. There were significant differences in isotope ratios both withinspecies and for species assemblages between bays. The secondary consumer signatures in bivariate δ-spaceshowed a partly overlapping transition from benthivores (Crangon crangon, Pomatoschistus microps) to morepelagically feeding predators (Gasterosteus aculeatus). At two sites (one sheltered, one moderately exposed),the gut contents of generalist predators revealed feeding on abundant prey and confirmed the potential foroverlap in diets. Focusing on members of the benthic trophic pathway, we assessed the influence ofsecondary consumer diversity on trophic transfer, with temporal separation of resource use as a mediator ofbiodiversity effects. In a laboratory experiment, we were able to show temporally separated foraging for twoepibenthic carnivores and that mechanisms behind the biodiversity effect differed in time. Many food webproperties, such as function, resilience and resistance are linked to the diversity and characteristics of nodesand links in the food web (e.g. degree of redundancy, connectedness and trophic level) and our studyprovides information on some dimensions of the trophic niches of abundant species in shallow soft-bottomfood webs.
+358 02 215 4748.tröm).
l rights reserved.
© 2010 Elsevier B.V. All rights reserved.
1. Introduction
Positive relationships between biodiversity and ecosystem functionshave been reported from a range of ecosystems and trophic levels(Loreau et al., 2000; Balvanera et al., 2006; Cardinale et al., 2006;Stachowicz et al., 2007). For primary producers of temperate grasslands(Tilman et al., 1996), detritivores in streams (Jonsson and Malmqvist,2000), and secondary consumers onmarine shores (Griffin et al., 2008),species richness influences ecosystem functions, such as stability,biological production, and resource acquisition. Currently, focus hasshifted to the functions provided by consumers and the potentialconsequences of diversity changes within consumer trophic levels(Duffy, 2002; Ives et al., 2005). Higher-level consumers are likely to bestrong interactors within the food web, but are also prone to localextinction (Petchey et al., 2004; Byrnes et al., 2007). Members of a
feeding guild use the same resources in similar ways and may in atrophic sense be functionally equivalent (Blondel, 2003). However, thetrophic niche includes several dimensions of feeding, including onwhat,where, and when foraging takes place, and such niche segregation maybe of importance for trophic functioning (Fridley, 2001).
On shallow marine sandy bottoms in northern Europe, severalsympatrically occurring predators (crustaceans, gobiids and flatfishes)show a dietary overlap, feeding on invertebrate infauna (Pihl, 1985;Aarnio et al., 1996). The diet of generalist predators depends on whichfood items are spatially or temporally available (Evans, 1983), causingvariability in realized feeding links. Acknowledging such variability, weevaluated epibenthic predator positions in trophic pathways bystudying stable isotope ratios (13C:12C and 15N:14N, expressed as δ13Cand δ15N) (Peterson and Fry, 1987) between and within secondaryconsumers at a set of shallow sandy sites. Stable isotopes are useful fordetermining trophic structure when the isotope ratios of a consumerreflect those of its diet in a fairly predictable manner. δ13C provides anindication of carbon sources used by an organism, as its value changesrelatively little (0–1‰) between diet and consumer. δ15N shows a

102 M.C. Nordström et al. / Journal of Experimental Marine Biology and Ecology 391 (2010) 101–111
stepwise increase (2–4‰) from one trophic level to the next(McCutchan et al., 2003; Fry, 2006). Together, these two variablesprovide a time-integrated measure of trophic position (Peterson andFry, 1987), integrating realized feeding relationships (Layman, 2007).Trophic pathways can be strongly linked to spatial attributes and manystudies point to connections between species trophic interactions andthe immediate surroundings (Deegan and Garritt, 1997; Guest et al.,2004; Connolly et al., 2005; Kanaya et al., 2007). The sites included inthis study range in exposure from relatively sheltered to exposed, acharacteristic known to influence energy flow (Möller et al., 1985). Bydepicting the spatial consistency of position in bivariate δ-space ofbenthic species, we assessed their relative position in major trophicpathways, accounting for site-specific diets. For comparative purposeswe also studied gut contents of epibenthic predators at two sites(geographically close, differing in exposure).
For predators feeding on the same set of prey species (belonging tothe same trophic pathway), aspects of the trophic niche other thanprey preferences may be important for coexistence, e.g. habitatpreferences and in particular the time of active foraging. Foraging atdifferent times of the day could decrease niche overlap and increasetotal resource use in diverse predator assemblages. Such mechanismsconstitute the rationale for the niche complementarity hypothesis,which is one of the proposed explanations for heightened functioningin high-diversity assemblages (Loreau and Hector, 2001; Karlson etal., 2010). Although the theory of resource partitioning has beengenerally accepted for decades (Schoener, 1974), there is a lack ofexperimental evidence to support that predator diversity effects onprey capture are mediated through niche complementarity (Brunoand Cardinale, 2008; Griffin et al., 2008).
Two of the epibenthic predator species commonly found atshallow sandy sites in the northern Baltic Sea are known to feed atdifferent times: the flounder, Platichthys flesus L., is a visual hunter andfeeds during daytime (Mattila and Bonsdorff, 1998), whereas thebrown shrimp, Crangon crangon L., feeds mainly in lower lightconditions (night, dusk and dawn) (Pihl and Rosenberg, 1984).Using this pair of co-occurring generalist predators and two types ofprey in a laboratory experiment, we tested the following hypotheses:(1) higher diversity in a predator assemblage results in high predationefficiency; and (2) the diversity effect is mediated through differencesin time of feeding.
A consensus on significant relationships between biodiversity andecosystem functioning is now established, and the next challenge is toidentify the mechanisms behind the observed patterns (Hector et al.,2009). Comparing process rates observed in species mixtures againstthe rates in the average monoculture and the highest performingmonoculture assesses non-transgressive and transgressive overyield-ing, respectively (Fridley, 2001; Griffin et al., 2008). Additivepartitioning of biodiversity effects identifies two categories ofmechanisms: complementarity effects (resource partitioning, facili-tative or interference interactions), and selection effects (includingpositive and negative sampling effects, connecting to dominance orsubordinance of species with particular traits) which together amountto the net biodiversity effect (Loreau and Hector, 2001). Fox's (2005)subsequent development of a tripartite partitioning yields a compo-nent of trait-independent complementarity (equal to the comple-mentarity effect of Loreau and Hector, 2001), and further splits thepreviously mentioned selection effect into trait-dependent comple-mentarity and dominance. Identification of mechanisms underpin-ning biodiversity and ecosystem functioning patterns are needed forfuture predictions of consequences following species loss or gain, butformal comparisons of the available measures are rare (Hector et al.,2009), and to the best of our knowledge, no estimates of diel variationin biodiversity effects are available.
The overall study objective was to assess aspects of the trophicecology of an assemblage of benthic generalist consumers. Morespecifically, we wanted to (1) determine species-specific positions in
trophic pathways, (2) assess effects of predator diversity andtemporal feeding habits on predation efficiency, and (3) identifymechanisms behind potential biodiversity effects. By combiningspatial variation-inclusive estimates of predator positions in trophicpathways with a short-term functional experiment, we elucidatedrealized trophic patterns as well as a temporal manifestation ofmechanisms behind main predator–prey relationships in the low-diversity study system.
2. Methods
Organisms for the stable isotope analysis, dietary analysis andlaboratory experiment were collected from shallow (b1.5 m) sedi-ment sites using the following methods: Macrozoobenthos using a1 mm sieve, predatory epibenthic fauna using a beach seine (2 mmnet) and a push net (2 mm net). Surface sediment cores (top 2 cm)were collected by snorkelling. Organisms for stable isotope analysiswere sampled in nine bays (Table 1) around the Åland Islands,northern Baltic Sea (Fig. 1). All sites were shallow with sandysubstrate and sparse vegetation. The degree of exposure assigned toeach bay varied from relatively sheltered (sites A1, A3 and B4) viamoderately exposed (B5, B6, C8 and C9) to exposed (A2 and C7).Predators for dietary analysis were collected at sites B4 and B5, whichare geographically close but differ in exposure to wind and waves.
2.1. Epibenthic consumer trophic positions, stable isotope analysis
We evaluated epibenthic predator trophic positions using δ13C as anindicator of carbon source (base of food web) and δ15N as a proxy fortrophic level. We studied epibenthic predators (fishes and C. crangon)and included infaunal macroinvertebrates and sediment organic matter(SOM) for comparison. Sampling was performed during a time intervalof 12 days (Table 1) tominimize the effect of temporal changes in stableisotope values (Nordström et al., 2009). Macroinvertebrates wereovernight placed in filtered seawater (20 μm) to allow gut evacuation.Organisms (determined to lowest possible taxon) and sediment werestored frozen (−20 °C) and later oven-dried (60 °C, 48 h) and ground,after which an aliquot of the homogenous sample was packed in a tincapsule. Samples of fishes and shrimp were muscle tissue. Otherinvertebrates were analyzed whole, molluscs after removing the shell.Samples were composites of several individuals, and were not acidifiedsince this could affect stable isotope ratios (Carabel et al., 2006). Also, theamphipod Bathyporeia pilosa Lindström, which constitutes the sampleslikely most affected by acidification, is consumed entirely by thepredators,whereby exoskeleton isotopes contribute to consumer ratios.Analysis of stable isotope ratios 13C:12C and 15N:14N was conducted atthe Stable Isotope Facility, UC California, Davis. Carbon and nitrogenisotope ratios are expressed in per mille (‰) delta (δ) values accordingto:
δ13C or δ15N = Rsample = Rstandard–1� �h i
× 103
whereR is 13C:12C or 15N:14N. The international standards forCandNareVienna-PDBandatmosphericN2, respectively (Fry, 2006).Data accuracywasestimatedbyanalyzingsets of subsamples in triplicate fromall bays.The reproducibility for δ13C and δ15Nwas0.2‰orbetter.Whenpossible,we analyzed three replicate samples per species per site.
When sampling for stable isotope analysis, we also measured watertemperature (°C) and took samples for water chemistry. Dissolved O2
(mg l−1, %) was measured by Winkler titration, salinity fromconductivity on a Metrohm 712, and pH on a Metrohm 691. Levels oftotal P and total N (μg l−1) were determined spectrophotometricallyafter persulfate oxidation, and Chl-a (μg l−1) after filtration and acetoneextraction (Chl-a). Sediment samples for analysis of organic content(loss on ignition, 3 h at 500 °C) (n=3) and grain size distributionswere

Table 1Description of sites visited for collection of surface sediment, primary and secondary consumers for stable isotope analysis. Degree of exposure calculated from the Baardseth Exposure Index modified for archipelago conditions (Berglundet al., 2003). n/a=data not available.
Area,site nr
Site name Date ofsampling
Coordinates Exposure: degreeand direction
Sediment organiccontent (%)
Sedimentgrain size
Vegetation observed during sampling Salinity pH Temp(°C)
Chl-a(μg l−1)
Tot-N(μg l−1)
Tot-P(μg l−1)
A1 Norrsandvik 7.6.2007 60°22 N 19°36 E 18° NE 0.51±0.04 Medium andcoarse sand
Fucus vesiculosus, Cladophoraglomerata and Chorda filumfound on stones and bolders.Sparse vegetation (Potamogetonpectinatus, Chara aspera)characterized the bottom.
5.3 8.5 17.4 1.3 260 12
A2 Finbo 7.6.2007 60°21 N 19°36 E 90° E 0.23±0.01 Mostly verycoarse sand,also granules,coarse andmedium sand
Fucus vesiculosus, Cladophoraglomerata and Chorda filumfound on stones and bolders.Sparse vegetation (Potamogetonpectinatus, Chara aspera)characterized the bottom.
5.5 8.5 15.2 n/a n/a n/a
A3 Äppelö, Södersand 9.6.2007 60°22 N 19°42 E 36° S 0.37±0.02 Medium sand Cladophora glomerata on rocks,Chara aspera, Potamogetonpectinatus, Chorda filum,Potamogeton perfoliatus
5.3 8.1 15.6 1.0 300 22
B4 Skeppsvik 11.6.2007 60°11 N 19°31 E 18° W 0.30±0.02 Medium andfine sand
Mostly bare sandy bottom,but Chara aspera, Potamogetonpectinatus and loose-lying Pylaiellalittoralis present
6.0 8.7 17.4 1.1 300 28
B5 Hinderbengtsviken 11.6.2007 60°10 N 19°32 E 63° SW 0.20±0.01 Coarse sand Bare sand, some loose-lyingfilamentous algae(e.g. Pylaiella littoralis)
6.0 8.5 13.6 1.2 270 17
B6 Degersand 11.6.2007 60°09 N 19°36 E 54° S 0.14±0.01 Mostly mediumsand, also finesand
Bare sand, some loose-lyingfilamentous algae(e.g. Pylaiella littoralis)
5.7 8.3 13.2 1.7 290 24
C7 Maren 16.6.2007 60°11 N 20°15 E 81° S 0.27±0.03 Medium andfine sand
Close to the shore almost uniformChara aspera, further out moderateamounts of Potamogeton pectinatus.On rocks mostly Pylaiella littoralisand/or Cladophora glomerata
5.5 8.4 19.7 0.9 260 13
C8 Prästö 16.6.2007 60°12 N 20°15 E 54° SW 0.18±0.01 Mostly mediumsand, alsofine sand
Bare sand, only sparse occurrenceof Potamogeton pectinatus
5.2 8.2 15.9 1.6 310 18
C9 Mickelsö 19.6.2007 60°12 N 20°17 E 45° W 0.24±0.01 Mostly mediumsand, alsofine sand
Bare sand, small amounts ofChara aspera, Potamogetonpectinatus, single Potamogetonperfoliatus individuals, alsoCladophora glomerata on small rocks.
5.6 8.3 17.4 1.3 420 24
103M.C.N
ordströmet
al./Journal
ofExperim
entalMarine
Biologyand
Ecology391
(2010)101
–111

Fig. 1. Study sites at the Åland Islands, northern Baltic Sea. Letters indicate geographical grouping of sites.
104 M.C. Nordström et al. / Journal of Experimental Marine Biology and Ecology 391 (2010) 101–111
also collected from all localities. The data are presented with other sitecharacteristics in Table 1.
2.2. Epibenthic consumer diets, gut content analysis
The epibenthic predators, Crangon crangon, Pomatoschistus micropsKrøyer, Pomatoschistus minutus Pallas, and Platichthys flesus werecollected for dietary analysis in two bays (B4 and B5; Table 1), in July,August and September. Predator densities varied greatly and somespecies were absent at one site on some occasions. Only P. flesus gutcontents are presented for each sampling event, the rest are given asan average for the whole season. Each individual predator wasweighed and its total length measured (0.01 g and 1 mm accuracy),and then stored in 70% alcohol for analysis of contents of stomachand/or intestine. Prey itemswere determined to lowest possible taxonand counted.
2.3. Predation efficiency in differing predator assemblages, laboratoryexperiment
We used juvenile flounder, Platichthys flesus, and brown shrimp,Crangon crangon, as predators. The flounder is the most commonflatfish in the northern Baltic Sea, where its juveniles are sympatric tothe brown shrimp on shallow sandy bottoms (Aarnio et al., 1996).Two prey species were used, juvenile Macoma balthica L. (Bivalvia),and Bathyporeia pilosa (Amphipoda), which are both among thedominant infauna of the biotope, and are eaten by the predators usedin this experiment (Pihl, 1985; Aarnio et al., 1996; this study).
The experiment used a two-factor design. The factor, ‘Predatorassemblage’, had three levels: (1) P. flesus, (2) C. crangon, and (3) P.flesus+C. crangon. The other factor, ‘Time’, had two levels: (1) day, and(2) night. This design allowed us to study the independent andinteractive effects of diversity and time of feeding, i.e. to take intoaccount potential temporal resource partitioning. The different predatortreatments constituted a substitutive design equalizing density oversingle species and combination treatments. In our experiment, densityequalled two predators per replicate and the ecological function of
interest, namely predation efficiency, was measured as per capitaconsumption rate. A control treatment without predators was used tocheck for mortality unrelated to predation. Each treatment consisted ofsix replicates.
Flounders were 56–72 mm (average 63±7mm) and shrimp 49–62 mm (average 55±5mm) in total length. The prey species averaged1.9 mm(M. balthica) and 2.7 mm (B. pilosa) in length. 30 individuals perpreywere added to eachaquarium, 1102 ind.m−2 per species and a totalof 2204 ind.m−2, correspondingwell tonaturaldensities (Blomqvist andBonsdorff, 1986; Bonsdorff et al., 1995). A high density of predators wasused, as the effects of diversity are most pronounced at high predatordensities (Griffin et al., 2008).
All trials were conducted in a temperature-regulated room (12.0–14.6 °C). During trials, salinity and pH were about 4.8 and 7.9,respectively. High oxygen levels (≥92%) were maintained by airbubbling. The substrate was 3 cm deep dried, sieved (≤500 μm) sand(organic content 0.2%). Predators were starved for 48 h prior to trialsto equalize hunger levels. A fine net prevented predators fromescaping. Prey were acclimatised to the trial tanks before predatorswere added and trials started. The predators were allowed to foragefor 5 h (09–14, 21–02) in either light or dark conditions. Aftercompletion of trials, the sand was sieved and remaining prey counted.The short trial duration also enabled us to conduct gut contentsanalysis on P. flesus. Gut contents were studied under a microscopeand retrieved prey counted. Prey were difficult to distinguish in thegut of C. crangon and prey that were unaccounted for (found neither inthe sediment nor in the gut of P. flesus) were counted as eaten by thebrown shrimp.
2.4. Data analyses
To evaluate if spatial variation in stable isotope ratios was presentwithin species, means of the measured ratios were tested over sitesusing one-way ANOVA or t-tests, if assumptions of normality andhomogeneity of variances were fulfilled, otherwise the non-parametricKruskal–Wallis test was used. Multivariate analyses (ANOSIM andnMDS based on Euclidean distances) tested for differences in stable
105M.C. Nordström et al. / Journal of Experimental Marine Biology and Ecology 391 (2010) 101–111
isotopes among sites (δ13C or δ15N). We focused on a subset of species(Crangon crangon, Pomatoschistus minutus, Pomatoschistus microps,Gasterosteus aculeatus L., Macoma balthica) and sites (A1–B4, C7 andC9) in order to get a balanced analysis. Relationships betweenenvironmental variables and site stable isotope values (δ13C and δ15Nseparately) were evaluated using the BEST procedure in PRIMER 6(Clarke, 1993; Clarke and Gorley, 2006). Comparisons betweenepibenthic secondary consumer species (δ13C and δ15N) were madeusing ANOSIM, where the R statistics of pairwise tests were considered‘low’ if b0.5. Interspecific comparisons were made using two-wayANOVA (factors ‘Site’ and ‘Species’) for organisms not included inmultivariate analysis.
Predation efficiency was measured as per capita consumption pertrial for each prey species. Total consumptionwas calculated as the sumfor both prey species. The expected prey-specific consumption in thecombination treatmentwas calculated as the sumof observedper capitaconsumption in monocultures divided by the number of predatorspecies (in this experiment: 2) (Griffin et al., 2008). The proportionaldeviation from expected predator effects was expressed as [(observedconsumption−expected consumption)/expected consumption]×100.For evaluation of non-transgressive overyielding, prey consumption inthe combination treatment was compared with the average ofmonocultures (Fridley, 2001). Efficiency data from the experimentwere analyzed with two-way ANOVA using R 2.7.2 (R DevelopmentCore Team, 2008). Tukey's honestly significant difference (HSD) wasused for a posteriori multiple comparisons. Data were tested fornormality and homogeneity of variances prior to analyses andtransformed if not meeting the assumptions. The tripartite partition(trait-independent complementarity, trait-dependent complementari-ty, and dominance) of the net biodiversity effect was calculatedaccording to Fox (2005), and each effect type was tested for deviationfrom 0 (no significant effect) using a one-sample t-test.
3. Results
3.1. Consumer stable isotope ratios and spatial variability
Stable isotope ratios 13C:12C and 15N:14Nwere studied in the speciesin a benthic food web of nine shallow soft-bottom bays. The lowestaverage consumer δ13C was recorded for the bivalve Macoma balthica,−22.1‰ (site C8), and the highest for the ragworm Nereis diversicolor
Fig. 2. Stable isotope values (δ13C and δ15N,‰) of benthic foodweb components for sites A1–minutus, Pomatoschistus microps, Platichthys flesus; and c)–d) lower trophic levels: Nereis di
Müller, −14.9‰ (site A2) (Fig. 2). The corresponding values for δ15Nwere 3.4‰ for M. balthica (site B4) and 11.9‰ for Pomatoschistusminutus (site C7). Unfortunately, the sediment samples contained toolittleN andC to give reliable estimates of isotope ratios. The SOM isotopevalues are given in Fig. 2, but excluded from further analyses.
Sites differed in assemblage δ13C composition (ANOSIM; globalR=0.715, p≤0.001, Table 2). A cluster analysis based on δ13C,separated the twomost sheltered sites A1 and B4 from the other sites,meaning that they had assemblages more similar in C isotopecomposition than some bays located geographically closer to eachother (e.g. sites A1 and A2). A site-specific composition of nitrogenratios was also identified (ANOSIM global R=0.773, p≤0.001), withsite C7 primarily separated from the other bays by clustering.Geographical distance between sites was thus not consistent ininfluencing the stable isotope values of food web components. Therewere no significant correlations between matrices constructed fromabiotic variables and δ13C or δ15N (BEST, pN0.05).
Significant intraspecific differences in stable isotopes ratios forboth C and Nwere found (Fig. 2, Table 2). Some species showed largeranges in δ13C, e.g. Macoma balthica differed up to 5.0‰ betweensite-averages, whereas for Bathyporeia pilosa the largest between-site difference was 1.5‰. The corresponding ranges for δ15N were2.7‰ and 1.4‰ for M. balthica and B. pilosa respectively. Among thesecondary consumers, Crangon crangon showed the largest rangeand differed up to 2.4‰ in δ13C, and 2.5‰ δ15N, whereasGasterosteus aculeatus showed significant differences only for δ13Cby up to 1.4‰.
Secondary consumer trophic signatures differed between specieswhen including spatial variation (ANOSIM Global R=0.691, p≤0.001,Table 2). The three-spined stickleback,G. aculeatus, showed isotope ratiosindicating a diet consisting of pelagic prey (Fig. 2), separating this speciesfrom other secondary consumers. The stable isotope ratios of Crangoncrangon differed significantly from those of the sand goby, Pomatoschistusminutus, but overlapped with the common goby, Pomatoschistus microps(Table 2). The two gobiid species showed an intermediate but significantseparation (R=0.511, p≤0.001). In all, this suggests that P. micropsutilizesbenthic foodsources toagreaterdegree thanP.minutus. Therewasno significant spatial difference in flounder δ13C or δ15N between the twosites (B5andB6)wherePlatichthysflesuswascaught in sufficient amountsfor stable isotope analysis. However, P. flesus was isotopically separatedfrom C. crangon at both sites (δ13C: two-way ANOVA, ‘Species’ F1,
C9. a)–b) secondary consumers: Gasterosteus aculeatus, Crangon crangon, Pomatoschistusversicolor, Macoma balthica, Bathyporeia pilosa, SOM.

Fig. 3. Dietary composition (n of prey objects, %) of epibenthic predators at sites B4 andB5: Ccra=Crangon crangon, Pmin=Pomatoschistus minutus, Pmic=Pomatoschistusmicrops, Pfle=Platichthys flesus. a) Interspecific predator diets averaged for the entireseason. b) Monthly dietary composition of Platichthys flesus (size classes separated at46 mm; Aarnio et al., 1996) at site B5.
Table 2Results fromunivariate analyses (A=ANOVA;K–W=Kruskal–Wallis; t=t-test) on intra-specific (between-site) stable isotope values, and multivariate analyses (ANOSIM) oninter-specific and site-specific differences in stable isotope values. Significant values arepresented in bold.
Species, between sites Test df MS F/χ2/t p
δ13CCrangon crangon A 8, 18 1.526 6.656 ≤0.001 ***Pomatoschistus minutus A 6, 11 0.574 2.209 0.121Pomatoschistus microps K–W 6 16.069 0.013 *Platichthys flesus t 4 −0.189 0.859Gasterosteus aculeatus K–W 8 17.953 0.022 *Nereis diversicolor K–W 5 16.064 0.007 **Macoma balthica K–W 7 21.28 0.003 **Bathyporeia pilosa A 4, 10 3.668 38.121 ≤0.001 ***
δ15NCrangon crangon A 8, 18 1.847 13.106 ≤0.001 ***Pomatoschistus minutus A 6, 11 0.699 5.338 0.008 **Pomatoschistus microps A 6, 14 2.264 33.135 ≤0.001 ***Platichthys flesus t 4 0.207 0.846Gasterosteus aculeatus A 8, 18 0.407 2.451 0.054Nereis diversicolor K–W 5 15.316 0.009 **Macoma balthica K–W 7 18.981 0.008 **Bathyporeia pilosa A 4, 10 3.428 6.286 0.009 **
ANOSIM R p
Secondary consumers, δ13C and δ15NGlobal 0.691 ≤0.001 ***G. aculeatus, C. crangon 0.975 ≤0.001 ***G. aculeatus, P. minutus 0.896 ≤0.001 ***G. aculeatus, P. microps 0.911 ≤0.001 ***C. crangon, P. minutus 0.768 ≤0.001 ***C. crangon, P. microps 0.064 0.083P. minutus, P. microps 0.511 ≤0.001 ***
Sites, δ13CGlobal 0.715 ≤0.001 ***
Sites, δ15NGlobal 0.773 ≤0.001 ***
106 M.C. Nordström et al. / Journal of Experimental Marine Biology and Ecology 391 (2010) 101–111
8=17.693, p=0.003; δ15N: two-way ANOVA, ‘Species’ F1, 8=8.414,p=0.020, no significant interactions between ‘Site’ and ‘Species’).
Regarding primary consumers, B. pilosa was consistently moreenriched in 13C than M. balthica (δ13C: two-way ANOVA, ‘Species’F1, 16=7.230, pb0.001, no significant interaction, Fig. 2), but only at siteB5 for δ15N (two-way ANOVA, ‘Site’× ‘Species’ F3, 16=6.670, p=0.004).Nereis diversicolor also had significantly higher δ13C values than M.balthica, except at site A1 (two-way ANOVA, ‘Site’× ‘Species’:F5, 24=14.681, pb0.001, Tukey's HSD for A1 p=0.428, site B1 withonly one replicate was not included in analysis). The high δ15N of N.diversicolor is in agreement with its predatory nature (two-way ANOVA,‘Species’: F1, 24=10.111, pb0.001,no significant interactionbetween ‘Site’and ‘Species’).
3.2. Epibenthic consumer diets
The dietary analyses provided us a snapshot of active predation onbenthic macroinvertebrates and revealed some differences in thecontribution of prey taxa to consumer diets at two sites. Of 429 gutsexamined, 217 guts contained material, from which 20 prey taxa wereidentified. At site B4, Pomatoschistus microps had fed on meiofauna andChironomidae,whereasPomatoschistusminutus also consumedmolluscsand crustaceans (Fig. 3). Meiofauna was a significant part of the diet ofmost predators (≥43.2% of prey objects found in gut). The diet ofCrangon crangon consisted mostly of macrozoobenthos, although thismay be connected to the large number of empty guts noted for C.crangon, i.e. most ingested prey were already digested. Crustaceans
quantity (mainly Bathyporeia pilosa) weremore important in the diet ofC. crangon at the exposed site, B5, where amphipods dominates thefaunal community. At this site, Platichthys flesus seemed to switchconsumption from meiofauna to macrofauna (e.g. B. pilosa andChironomidae) as it grew during the season (Fig. 3). Yield-effort curvessuggest that only P.minutus at B4was sufficiently sampled, as the curvesfor other consumers did not approach an asymptote. Nevertheless, thegut analyses show that the generalist predators in the bays studied havethe potential to use abundant or profitable prey groups that may differbetween life stages or sites. All benthic predators consumed the mostabundant prey taxa (pers. obs.), confirming that interspecific dietaryoverlap occurs.
3.3. Consumer diversity and temporal predation efficiency
The laboratory experiment showed that temporal separation inforaging activity determined the level of predation efficiency and themanifestation of biodiversity effects. Average survival of prey in thecontrol treatment was 99%, indicating negligible non-predatorymortality. Predation efficiency differed between predator assemblagesdepending on the time of the trial (‘Predator assemblage’× ‘Time’:pb0.001, Table 3a). The combination treatment showed consistentlyhighpredation efficiencywhereas themonocultures alternately showeddecreased per capita consumption in accordancewith predator-specifictemporal feeding habits: Platichthys flesus foraged almost exclusivelyduring daytime, Crangon crangon mostly at night (Fig. 4). When thepredation efficiency was separated into prey-specific effects, somedifferences were observable. During daytime, all predator assemblagesshowed a comparable consumption of Bathyporeia pilosa (Tukey's HSD:pN0.05) (Fig. 4c), whilemoreMacoma balthicawere consumed in the P.flesus-treatment than in the C. crangon assemblage (Tukey's HSD:pb0.001). In the combination treatment, predation efficiency wasindependent of time (Tukey's HSD: pN0.05). However, the gut contentanalyses show that the two predator species foraged in temporally
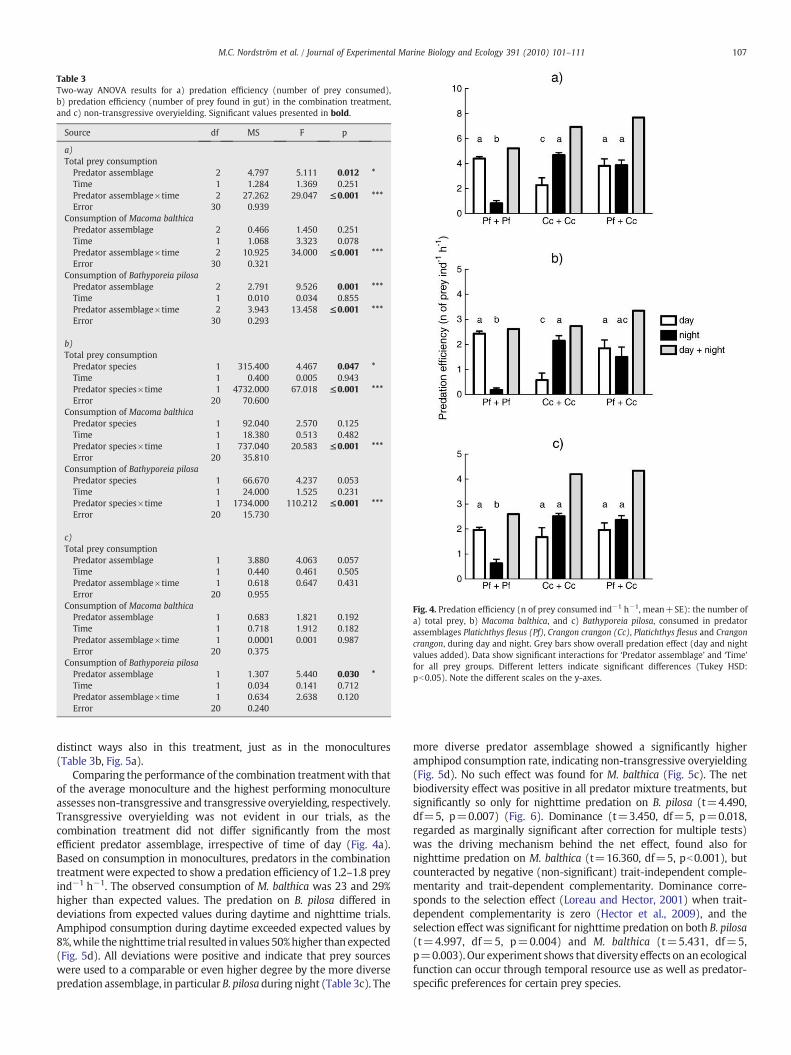
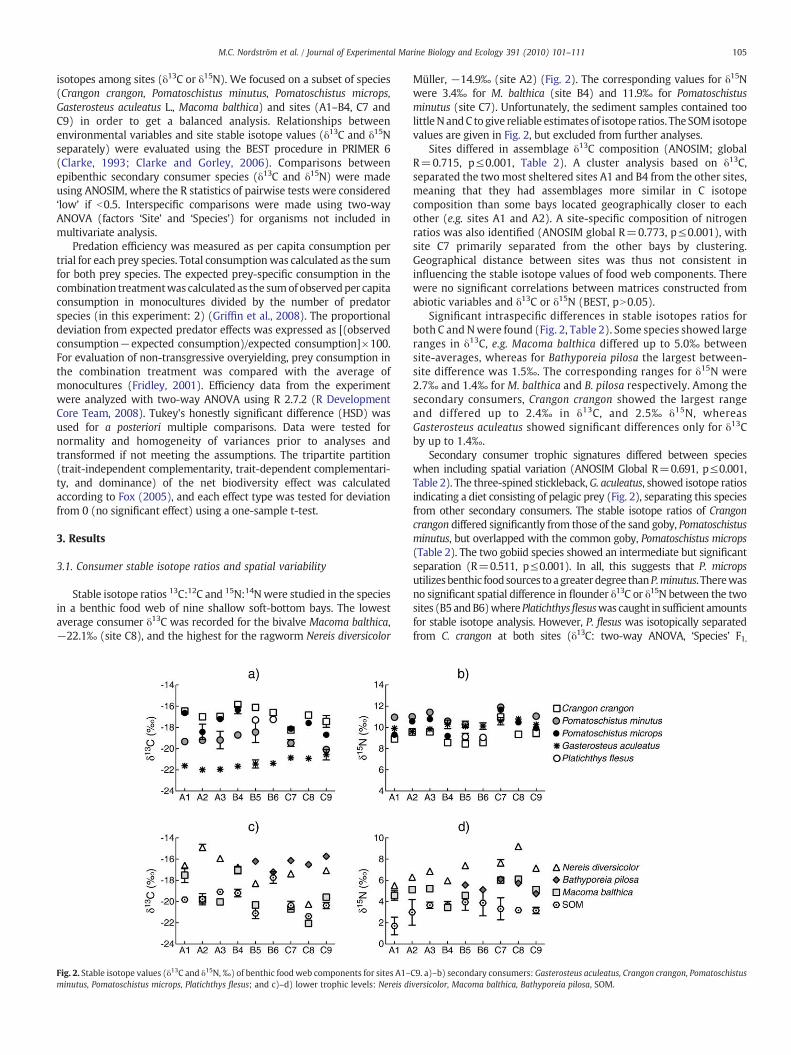
Fig. 4. Predation efficiency (n of prey consumed ind−1 h−1, mean+SE): the number ofa) total prey, b) Macoma balthica, and c) Bathyporeia pilosa, consumed in predatorassemblages Platichthys flesus (Pf), Crangon crangon (Cc), Platichthys flesus and Crangoncrangon, during day and night. Grey bars show overall predation effect (day and nightvalues added). Data show significant interactions for ‘Predator assemblage’ and ‘Time’for all prey groups. Different letters indicate significant differences (Tukey HSD:pb0.05). Note the different scales on the y-axes.
Table 3Two-way ANOVA results for a) predation efficiency (number of prey consumed),b) predation efficiency (number of prey found in gut) in the combination treatment,and c) non-transgressive overyielding. Significant values presented in bold.
Source df MS F p
a)Total prey consumption
Predator assemblage 2 4.797 5.111 0.012 *Time 1 1.284 1.369 0.251Predator assemblage×time 2 27.262 29.047 ≤0.001 ***Error 30 0.939
Consumption of Macoma balthicaPredator assemblage 2 0.466 1.450 0.251Time 1 1.068 3.323 0.078Predator assemblage×time 2 10.925 34.000 ≤0.001 ***Error 30 0.321
Consumption of Bathyporeia pilosaPredator assemblage 2 2.791 9.526 0.001 ***Time 1 0.010 0.034 0.855Predator assemblage×time 2 3.943 13.458 ≤0.001 ***Error 30 0.293
b)Total prey consumption
Predator species 1 315.400 4.467 0.047 *Time 1 0.400 0.005 0.943Predator species×time 1 4732.000 67.018 ≤0.001 ***Error 20 70.600
Consumption of Macoma balthicaPredator species 1 92.040 2.570 0.125Time 1 18.380 0.513 0.482Predator species×time 1 737.040 20.583 ≤0.001 ***Error 20 35.810
Consumption of Bathyporeia pilosaPredator species 1 66.670 4.237 0.053Time 1 24.000 1.525 0.231Predator species×time 1 1734.000 110.212 ≤0.001 ***Error 20 15.730
c)Total prey consumption
Predator assemblage 1 3.880 4.063 0.057Time 1 0.440 0.461 0.505Predator assemblage×time 1 0.618 0.647 0.431Error 20 0.955
Consumption of Macoma balthicaPredator assemblage 1 0.683 1.821 0.192Time 1 0.718 1.912 0.182Predator assemblage×time 1 0.0001 0.001 0.987Error 20 0.375
Consumption of Bathyporeia pilosaPredator assemblage 1 1.307 5.440 0.030 *Time 1 0.034 0.141 0.712Predator assemblage×time 1 0.634 2.638 0.120Error 20 0.240
107M.C. Nordström et al. / Journal of Experimental Marine Biology and Ecology 391 (2010) 101–111
distinct ways also in this treatment, just as in the monocultures(Table 3b, Fig. 5a).
Comparing the performance of the combination treatmentwith thatof the average monoculture and the highest performing monocultureassesses non-transgressive and transgressive overyielding, respectively.Transgressive overyielding was not evident in our trials, as thecombination treatment did not differ significantly from the mostefficient predator assemblage, irrespective of time of day (Fig. 4a).Based on consumption in monocultures, predators in the combinationtreatment were expected to show a predation efficiency of 1.2–1.8 preyind−1 h−1. The observed consumption of M. balthica was 23 and 29%higher than expected values. The predation on B. pilosa differed indeviations from expected values during daytime and nighttime trials.Amphipod consumption during daytime exceeded expected values by8%,while the nighttime trial resulted in values 50%higher than expected(Fig. 5d). All deviations were positive and indicate that prey sourceswere used to a comparable or even higher degree by the more diversepredation assemblage, in particular B. pilosa during night (Table 3c). The
more diverse predator assemblage showed a significantly higheramphipod consumption rate, indicating non-transgressive overyielding(Fig. 5d). No such effect was found for M. balthica (Fig. 5c). The netbiodiversity effect was positive in all predator mixture treatments, butsignificantly so only for nighttime predation on B. pilosa (t=4.490,df=5, p=0.007) (Fig. 6). Dominance (t=3.450, df=5, p=0.018,regarded as marginally significant after correction for multiple tests)was the driving mechanism behind the net effect, found also fornighttime predation on M. balthica (t=16.360, df=5, pb0.001), butcounteracted by negative (non-significant) trait-independent comple-mentarity and trait-dependent complementarity. Dominance corre-sponds to the selection effect (Loreau and Hector, 2001) when trait-dependent complementarity is zero (Hector et al., 2009), and theselection effect was significant for nighttime predation on both B. pilosa(t=4.997, df=5, p=0.004) and M. balthica (t=5.431, df=5,p=0.003). Our experiment shows that diversity effects on an ecologicalfunction can occur through temporal resource use as well as predator-specific preferences for certain prey species.

Fig. 5. Species-specific predation efficiency in the predator combination treatment: a) Total number of prey found in gut of predators Platichthys flesus (Pf) and Crangon crangon (Cc).b) Non-transgressive overyielding did not occur for total prey as predation efficiency (n of prey consumed ind−1 h−1, mean+SE) in the combination treatment did not differsignificantly from the average monoculture. c) Expected and observed consumption (n of prey ind−1 h−1, mean+SE) of Macoma balthica and d) Bathyporeia pilosa in thecombination treatment. Percentages show deviation from expected values. Different letters indicate significant differences (Tukey HSD: pb0.05). Note the different scales on the y-axes.
108 M.C. Nordström et al. / Journal of Experimental Marine Biology and Ecology 391 (2010) 101–111
4. Discussion
Benthic consumer positions in major trophic pathways wereidentified and described through analyses of stable isotope ratios andgut contents. In a laboratory predation experiment we evaluated thetemporal separation of epibenthic predator foraging, and foundbiodiversity effects to manifest temporally. Even though large-scale,spatial patterns suggest stable interspecific relationships, otherdimensions of the trophic niche can enable food web components tofunction dynamically within the framework of the web.
4.1. Spatial isotope patterns
Local processes influence element transfer in benthic food webs(Guest et al., 2004; Norkko et al., 2007) and isotope ratios are a result ofsite-specific element flows. Specific pathways have been identified onscales of tens of meters to a few 100 m, where differing δ-values mayoccur within a locality, e.g. within or between habitats (Guest et al.,
Fig. 6. The net effect on prey consumption partitioned into diversity components; trait-independent complementarity (TIC), trait-dependent complementarity (TDC), anddominance (D); mean+SE. Macoma balthica (Mb), Bathyporeia pilosa (Bp), day(d), night (n). Asterisks (*) indicate significant (pb0.05) dominance effects. No otherpartitioned diversity effects differed significantly from zero. Significant net effect foundonly for Bp n.
2004; Kanaya et al., 2007; Riera et al., 2009). Variation also occurs atlarger scales (up to hundreds of km; Jennings and Warr, 2003), e.g. inconnection to spatial subsidies of organicmatter (Norkko et al., 2007) orproximity to nutrient discharges (Hansson et al., 1997; Savage andElmgren, 2004). Spatial differences in phyto- and zoobenthos stableisotope ratios can be larger than seasonal differences for the samespecies (Jennings andWarr, 2003; Kanaya et al., 2007; Nordström et al.,2009).
In general, the trophic structure of the sampled species assemblagesin termsof thevertical distribution (δ15N)was consistent in space. Therewere significant differences in δ15N values among localities, bothregarding the whole sample assemblages and within-species compar-isons over sites, but since the trophic shift, Δδ15N, is variable(McCutchan et al., 2003) and the separation between an obligateprimary consumer and secondary consumers in our dataset generallywas large, between-site differences in δ15Nb3‰ are perceived asresulting from e.g. local nitrogen dynamics rather than indicatingchanges in trophic level. For one of the study sites, vertical stability on atemporal scale was previously demonstrated (Nordström et al., 2009),supporting the pattern reported here.
Spatial differences in δ13C were not clearly related to thegeographical placement of sites, nor did any relationship betweenabiotic site characteristics and δ13C emerge. Variables fluctuating on ashort-term basis are not believed to be major structuring factors forthe isotope ratios in the studied organisms. The separation ofsheltered sites from more exposed bays in our analysis has at leasttwo hypothetical, not mutually exclusive, explanations: (1) spatialdifferences in isotope ratios are manifested at basal resource level;and (2) exposure to waves and wind changes the relative importanceof organic matter produced benthically and pelagically (Möller et al.,1985; Newsome et al., 2007). The shift in δ13C was especially evidentfor the facultatively suspension- and deposit-feeding bivalve Macomabalthica as its δ13C values were up to 5‰ higher at sheltered sites thanin more exposed bays (Fig. 7). As Δδ13C is considered to be b2‰between the consumer and its diet (McCutchan et al., 2003), a
Fig. 7. Degree of exposure and meanMacoma balthica δ13C values at sampled sites. Linerepresents best fit (robust regression).
109M.C. Nordström et al. / Journal of Experimental Marine Biology and Ecology 391 (2010) 101–111
difference of the magnitude observed for M. balthica (if not mirroredat basal resource level) indicates a complete switch in feeding habit orfood objects between sites, in accordance with the sediment quality-related switch in feeding mode from filtering to deposit-feeding in M.balthica found by Ólafssson (1986). The spatial variability observed forδ13C exceeds the generally accepted limits of trophic shift, suggestingcaution when pooling isotope data from different habitats or overlarge spatial scales.
4.2. Secondary consumers in the benthic food web
In this study, we evaluated several dimensions of benthicsecondary consumer trophic niches: (1) prey preferences or trophicpathway (dietary analysis, stable isotope ratios), and (2) temporalresource use (predation experiment).
4.2.1. Prey preferences/element pathwayThe dietary analysis showed that the generalist predators had fed on
abundant prey groups irrespective of location suggesting potentialoverlap in feeding, consistent with gut content-based evaluationsconducted elsewhere (Pihl, 1985; del Norte-Campos and Temming,1994). The specific distinction of stable isotope ratios of the secondaryconsumers varied, and there was partial overlap between predatorsrelying on pelagic and benthic food. For example, the intermediateseparation in bivariate δ-space for two congeneric species, Pomatoschis-tus minutus and Pomatoschistus microps, supports previous suggestionsof trophic segregation between the gobies (Nellbring, 1988; Salgado etal., 2004) and indicates that P. microps is trophically closer to Crangoncrangon.
One of the assumptions made when using stable isotopes todetermine trophic structure is that interspecific differences in δ-spaceresult from dietary separation. However, the stable isotope values of aconsumer also depend on physiological processes by which theassimilated nutrients are ‘routed’ to various tissues, and are thusultimately a result of the isotope incorporation-rate of a particulartissue (Wolf et al., 2009). Stable isotope analysis has recently beensuggested to contribute to niche ecology by depicting aspects of thetrophic niche (Bearhop et al., 2004; Layman et al., 2007), but inferencefrom stable isotope δ-values is not straightforward since intra- andinterspecific variation depends on fractionation factors, and variabil-ity in consumer diet and isotope ratios of food sources (Newsomeet al., 2007; Hoeinghaus and Zeug, 2008). Clearly, including spatialvariation in our approach is a strength, as it identifies the range overwhich consumer isotopic values vary in similar biotopes at distancesof hundreds of meters to tens of kilometres (100 m to 40 km).
4.2.2. Temporal resource useResource partitioning can enable co-existence between species.
The mechanisms of resource partitioning are multidimensional, and
generally, temporal separation of niches is of less importance thanseparation by habitat or food-type (Schoener, 1974). Compared toother groups, however, predators aremore often separated by specificdiel activity patterns (Schoener, 1974) and our study shows that theecological function, prey capture rate, of juvenile flounder and brownshrimp is similar, but separated temporally. Although systematicallyseparate (different phyla), the brown shrimp, Crangon crangon, andjuvenile flounder, Platichthys flesus, can be considered functionallyequivalent on shallow soft bottoms of the Baltic Sea in that they bothfeed on abundant infaunal invertebrates (Pihl, 1985; Aarnio et al.,1996, this study). Assemblages consisting of functionally equivalentspecies may maintain resource use through compensation if onespecies is locally lost (Yachi and Loreau, 1999; Duffy, 2002). For this tooccur, the predators should, not only feed on the same prey, but alsoexert comparable predation pressure. In this study, such redundancywas not found. Instead, the predator species showed a temporalseparation in feeding. Intraspecific interactions seemed to have agreater negative impact on predation efficiency than intraspecificones, as the treatment containing both predator species was able tomatch the best performing single species treatment irrespective oftime of day (Fig. 5). Increased or high predation efficiency in higher-diversity consumer assemblages has previously been found formarinebenthos (Boström, 2002; Fodrie et al., 2008; Griffin et al., 2008),although the mechanisms causing this differed between studies.
There are several mechanisms, such as niche differentiation orspecies interactions, which may result in biodiversity effects. Mechan-isms can act simultaneously, and reinforce or counteract each other,making it informative to test for biodiversity effects and, irrespective ofthe outcome, evaluate underlying mechanisms. The evidence fortransgressive overyielding in empirical studies is mixed (Duffy et al.,2007; BrunoandCardinale, 2008).Ourexperiment allowed for testingoftransgressive overyielding only in day and nighttime trials separately,and no such biodiversity effect was found. Overall (day+night)predation efficiency in the combination treatmentwas high, but cannotbe conclusively interpreted to show transgressive overyielding. How-ever, non-transgressive overyielding was evident for predation on oneof the prey species, Bathyporeia pilosa, and dominance was the primarymechanism found for consumption onbothprey typesduringnighttimetrials. A large and positive dominance effect is expected when speciesoccupy similar niches, and the one with higher monoculture yieldsdominates at the expense of the species with low monocultureperformance (Fox, 2005). Hector et al. (2009) suggested that thecontribution of trait-dependent complementarity is normally smallbecause niches are not usually nested. Trait-independent complemen-tarity will occur if individuals of all species perform better in mixtures,due to e.g. facilitation. However, the predatorswe used are not expectedto experience a direct facilitation of the kind observed by Fodrie et al.(2008). The prey in our study are consumed whole by the epibenthicpredators, and facilitationwould bemore likely to originate fromalteredbehaviour or habitat selection of prey.
To conclude, we set out to study aspects of benthic consumertrophic properties, including consumer positions in major trophicpathways and the influence of secondary consumer diversity onpredation efficiency, and temporal niche separation as a mediator ofbiodiversity effects. Our findings show some interspecific divergencesin foraging, but also reveal a considerable overlap in trophic functionbetween benthic predators in the northern Baltic Sea, where temporalseparation of feeding may lead to biodiversity effects. Short-termstudies need to be complemented with studies on biodiversity effectsthat take longer time to become manifest, and studies using otherexperimental set-ups, such as additive experimental designs, such asthat by Boström (2002), who found C. crangon and P. flesus to functionadditively (Sih et al. 1998).
The reduced growth of benthic organisms in the sub-optimalsalinity of the northern Baltic Sea skews the size distribution of thisentire food web towards small body sizes (e.g. prey smaller than a

110 M.C. Nordström et al. / Journal of Experimental Marine Biology and Ecology 391 (2010) 101–111
few cm). The epibenthic assemblages in the northern Baltic Seaconsist of few species, most of them generalists. This results in aprevalence of weak links in the food web, due to mechanisms such asprey switching. Trophically flexible species (wide niches) maypromote population stability by incorporating carbon and nutrientsfrom several sources at lower foodweb levels (Romanuk et al., 2006).Neighbouring bays may differ in relative importance of carbonpathways and species may function differently at different sites,though still linked to the samemetacommunity (Leibold et al., 2004).Thus, the “neighbours” within a benthic community can maintainfood web structure through variability in trophic functioning. Theinfluence of predator diversity on food web/ecosystem functioningis a challenging, but fruitful, area of research. Incorporation ofspatial and temporal scales in this type of work is required if ourultimate aim is to be able to predict consequences of species loss.
Acknowledgements
We thank U. Jacob, and two reviewers for providing helpfulcomments, which improved the manuscript. Thanks to K. Häggqvistfor preparing samples, and to Husö biological station for providingworking facilities. Staff and students are acknowledged for all the help.Financial support was received from Stiftelsen för Åbo Akademi. [ST]
References
Aarnio, K., Bonsdorff, E., Rosenback, N., 1996. Food and feeding habits of juvenileflounder Platichthys flesus (L.), and turbot Schophthalmus maximus L. in the Ålandarchipelago, northern Baltic Sea. J. Sea Res. 36, 311–320.
Balvanera, P., Pfisterer, A.B., Buchmann, N., He, J.S., Nakashizuka, T., Raffaelli, D., Schmid, B.,2006. Quantifying the evidence for biodiversity effects on ecosystem functioning andservices. Ecol. Lett. 9, 1146–1156.
Bearhop, S., Adams, C.E., Waldron, S., Fuller, R.A., MacLeod, H., 2004. Determining trophicnichewidth: a novel approachusing stable isotope analysis. J. Anim. Ecol. 73, 1007–1012.
Berglund, J., Mattila, J., Rönnberg, O., Heikkilä, J., Bonsdorff, E., 2003. Seasonal and inter-annual variation in occurrence and biomass of rooted macrophytes and drift algaein shallow bays. Est. Coast. Shelf Sci. 56, 1167–1175.
Blomqvist, E.M., Bonsdorff, E., 1986. Spatial and temporal variations of benthicmacrofaunain a sand bottom area on Åland, northern Baltic Sea. Ophelia Suppl. 4, 27–36.
Blondel, J., 2003. Guilds or functional groups: does it matter? Oikos 100, 223–231.Bonsdorff, E., Norkko, A., Boström, C., 1995. Recruitment and population maintenance of
the bivalveMacoma balthica (L.)—factors affecting settling success and early survivalon shallow sandy bottoms. In: Eleftheriou, A., Ansell, A.D., Smith, C.J. (Eds.), Biologyand Ecology of Shallow Coastal Waters, pp. 253–260. Olsen & Olsen, Fredensborg.
Boström, M., 2002. Epibenthic predators and their prey — interactions in a coastal foodweb. PhD thesis, Åbo Akademi University, Åbo.
Bruno, J.F., Cardinale, B.J., 2008. Cascading effects of predator richness. Front. Ecol.Environ. 6, 539–546.
Byrnes, J.E., Reynolds, P.L., Stachowicz, J.J., 2007. Invasions and extinctions reshapecoastal food webs. PLoS ONE 2, e295.
Carabel, S., Godínez-Domínguez, E., Verísimo, P., Fernández, L., Freire, J., 2006. Anassessment for sample processing methods for stable isotope analyses of marinefood webs. J. Exp. Mar. Biol. Ecol. 336, 254–261.
Cardinale, B.J., Srivastava, D.S., Duffy, J.E., Wright, J.P., Downing, A.L., Sankaran, M.,Jouseau, C., 2006. Effects of biodiversity on the functioning of trophic groups andecosystems. Nature 443, 989–992.
Clarke, K.R., 1993. Non-parametric multivariate analyses of changes in communitystructure. Aust. J. Ecol. 18, 117–143.
Clarke, K.R., Gorley, R.N., 2006. PRIMER v6: User Manual/Tutorial. PRIMER-E, Plymouth.Connolly, R.M., Gorman, D., Guest, M.A., 2005. Movement of carbon among estuarine
habitats and its assimilation by invertebrates. Oecologia 14, 684–691.Deegan, L.A., Garritt, R.H., 1997. Evidence for spatial variability in estuarine food webs.
Mar. Ecol. Prog. Ser. 147, 31–47.del Norte-Campos, A.G.C., Temming, A., 1994. Daily activity, feeding and rations in gobies
and brown shrimp in the northern Wadden Sea. Mar. Ecol. Prog. Ser. 115, 41–53.Duffy, J.E., 2002. Biodiversity and ecosystem function: the consumer connection. Oikos
99, 201–219.Duffy, J.E., Cardinale, B.J., France, K.E., McIntyre, P.B., Thébault, E., Loreau, M., 2007. The
functional role of biodiversity in ecosystems: incorporating trophic complexity.Ecol. Lett. 10, 522–538.
Evans, S., 1983. Production, predation and food niche segregation in a marine shallowsoft-bottom community. Mar. Ecol. Prog. Ser. 10, 147–157.
Fodrie, F.J., Kenworthy, M.D., Powers, S.P., 2008. Unintended facilitation betweenmarine consumers generates enhanced mortality for their shared prey. Ecology 89,3268–3274.
Fox, J.W., 2005. Interpreting the ‘selection effect’ of biodiversity on ecosystem function.Ecol. Lett. 8, 846–856.
Fridley, J.D., 2001. The influence of species diversity on ecosystem productivity: how,where, and why? Oikos 93, 514–526.
Fry, B., 2006. Stable Isotope Ecology. Springer, New York.Griffin, J.N., De La Haye, K., Hawkins, S.J., Thompson, R.C., Jenkins, S.R., 2008. Predator
diversity and ecosystem functioning: density modifies the effect of resourcepartitioning. Ecology 89, 298–305.
Guest, M.A., Connolly, R.M., Loneragan, N.R., 2004. Carbonmovement and assimilationby invertebrates in estuarine habitats at a scale ofmetres.Mar. Ecol. Prog. Ser. 278,27–34.
Hansson, S., Hobbie, J.E., Elmgren, R., Larsson, U., Fry, B., Johansson, S., 1997. The stablenitrogen isotope ratio as a marker of food-web interactions and fish migration.Ecology 78, 2249–2257.
Hector, A., Bell, T., Connolly, J., Finn, J., Fox, J., Kriwan, L., Loreau, M., McLaren, J., Schmid, B.,Weigelt, A., 2009. The analysis of biodiversity experiments: from pattern towardmechanism. In: Naeem, S., Bunker, D.E., Hector, A., Loreau, M., Perrings, C. (Eds.),Biodiversity, Ecosystem Functioning, & Human Wellbeing. An Ecological andEconomic Perspective. Oxford University Press, pp. 94–104.
Hoeinghaus, D.J., Zeug, S.C., 2008. Can stable isotope ratios provide for community-widemeasures of trophic structure? Comment. Ecology 89, 2353–2357.
Ives, A.R., Cardinale, B.J., Snyder, W.E., 2005. A synthesis of subdisciplines: predator–preyinteractions, and biodiversity and ecosystem functioning. Ecol. Lett. 8, 102–116.
Jennings, S., Warr, K.J., 2003. Environmental correlates of large-scale spatial variation inthe δ15N of marine animals. Mar. Biol. 142, 1131–1140.
Jonsson, M., Malmqvist, B., 2000. Ecosystem process rate increases with animal speciesrichness: evidence from leaf-eating, aquatic insects. Oikos 89, 519–523.
Kanaya, G., Takagi, S., Nobata, E., Kikuchi, E., 2007. Spatial dietary shift ofmacrozoobenthosin a brackish lagoon revealed by carbon and nitrogen stable isotope ratios. Mar. Ecol.Prog. Ser. 345, 117–127.
Karlson, A.M.L., Nascimento, F.J.A., Näslund, J., Elmgren, R., 2010. Higher diversity ofdeposit-feeding macrofauna enhances phytodetritus processing. Ecology 91,1414–1423.
Layman, C.A., 2007. What can stable isotope ratios reveal about mangroves as fishhabitats? Bull. Mar. Sci. 80, 513–527.
Layman, C.A., Arrington, D.A., Montaña, C.G., Post, D.M., 2007. Can stable isotope ratiosprovide for community-wide measures of trophic structure? Ecology 88, 42–48.
Leibold, M.A., Holyoak, M., Mouquet, N., Amarasekare, P., Chase, J.M., Hoopes, M.F.,Holt, R.D., Shurin, J.B., Law, R., Tilman, D., Loreau, M., Gonzalez, A., 2004. Themetacommunity concept: a framework for multi-scale community ecology. Ecol.Lett. 7, 601–613.
Loreau, M., Hector, A., 2001. Partitioning selection and complementarity in biodiversityexperiments. Nature 412, 72–76.
Loreau, M., Naeem, S., Inchausti, P., Bengtsson, J., Grime, J.P., Hector, A., Hooper, D.U.,Huston, M.A., Raffaelli, D., Schmid, B., Tilman, D., Wardle, D.A., 2000. Biodiversityand ecosystem functioning: current knowledge and future challenges. Science294, 804–808.
Mattila, J., Bonsdorff, E., 1998. Predation by juvenile flounder (Platichthys flesus L.): atest of prey vulnerability, predator preference, switching behaviour and functionalresponse. J. Exp. Mar. Biol. Ecol. 227, 221–236.
McCutchan Jr, J.H., Lewis Jr, W.M., Kendall, C., McGrath, C.C., 2003. Variation in trophicshift for stable isotope ratios of carbon, nitrogen, and sulfur. Oikos 102, 378–390.
Möller, P., Pihl, L., Rosenberg, R., 1985. Benthic faunal energy flow and biologicalinteraction in some shallow marine soft bottom habitats. Mar. Ecol. Prog. Ser. 27,109–121.
Nellbring, S., 1988. Quantitative and Qualitative Studies of Fish in Shallow Water,Northern Baltic Proper. PhD thesis, University of Stockholm, Stockholm.
Newsome, S.D., Martinez del Rio, C., Bearhop, S., Phillips, D.L., 2007. A niche for isotopicecology. Front. Ecol. Environ. 5, 429–436.
Nordström, M., Aarnio, K., Bonsdorff, E., 2009. Temporal variability of a benthic food web:patterns and processes in a low-diversity system. Mar. Ecol. Prog. Ser. 378, 13–26.
Norkko, A., Thrush, S.F., Cummings, V.J., Gibbs, M.M., Andrew, N.L., Norkko, J., Schwarz,A.M., 2007. Trophic structure of coastal Antarctic food webs associated withchanges in sea ice and food supply. Ecology 88, 2810–2820.
Ólafssson, E.B., 1986. Density dependence in suspension-feeding and deposit-feedingpopulations of the bivalve Macoma balthica: a field experiment. J. Anim. Ecol. 55,517–526.
Petchey, O.L., Downing, A.L., Mittelbach, G.G., Persson, L., Steiner, C.F., Warren, P.H.,Woodward, G., 2004. Species loss and the structure and functioning of multitrophicaquatic systems. Oikos 104, 467–478.
Peterson, B.J., Fry, B., 1987. Stable isotopes in ecosystem studies. Annu. Rev. Ecol. Syst.18, 293–320.
Pihl, L., 1985. Food selection and consumption of mobile epibenthic fauna in shallowmarine areas. Mar. Ecol. Prog. Ser. 22, 169–179.
Pihl, L., Rosenberg, R., 1984. Food selection and consumption of the shrimp Crangoncrangon in some shallow marine areas in western Sweden. Mar. Ecol. Prog. Ser. 15,159–168.
R Development Core Team, 2008. R: a language and environment for statisticalcomputing. R Foundation for Statistical Computing, Vienna, Austria3-900051-07-0.URL http://www.R-project.org.
Riera, P., Escaravage, C., Leroux, C., 2009. Trophic ecology of the rocky shore communityassociated with the Ascophyllum nodosum zone (Roscoff, France): A δ13C vs δ15Ninvestigation. Est. Coast. Shelf Sci. 81, 143–148.
Romanuk, T.N., Beisner, B., Martinez, N., Kolasa, J., 2006. Non-omnivorous generalitypromotes population stability. Proc. R. Soc. B. 2, 374–377.
Salgado, J.P., Cabral, H.N., Costa, M.J., 2004. Feeding ecology of the gobies Pomatoschistusminutus (Pallas, 1770) and Pomatoschistus microps (Krøyer, 1838) in the upperTagus estuary, Portugal. Scienta Marina 68, 425–434.

111M.C. Nordström et al. / Journal of Experimental Marine Biology and Ecology 391 (2010) 101–111
Savage, C., Elmgren, R., 2004. Macroalgal (Fucus vesiculosus) δ15N values trace decreasein sewage influence. Ecol. Appl. 14, 517–526.
Schoener, T.W., 1974. Resource partitioning in ecological communities. Science 185,27–39.
Sih, A., Englund, G., Wooster, D., 1998. Emergent impacts of multiple predators on prey.Trends Ecol. Evol. 13, 350–355.
Stachowicz, J.J., Bruno, J.F., Duffy, J.E., 2007. Understanding the effects of marinebiodiversity on communities and ecosystems. Annu. Rev. Ecol. Evol. Syst. 38, 739–766.
Tilman, D., Wedin, D., Knops, J., 1996. Productivity and sustainability influenced bybiodiversity in grassland ecosystems. Nature 379, 718–720.
Wolf, N., Carleton, S.A., del Rio, C.M., 2009. Ten years of experimental animal isotopicecology. Funct. Ecol. 23, 17–26.
Yachi, S., Loreau, M., 1999. Biodiversity and ecosystem productivity in a fluctuatingenvironment: the insurance hypothesis. PNAS 96, 1463–1468.
Copyright © 2022 FDOKUMEN


![JNTU ONLINE EXAMINATIONS [Mid 2 - lica] - Webs](https://static.fdokumen.com/doc/165x107/633727b2d63e7c790105aa60/jntu-online-examinations-mid-2-lica-webs.jpg)