Support for site testing of the European Extremely Large Telescope: precipitable water vapor over La...
12
Support for site testing of the European Extremely Large Telescope: precipitable water vapour over La Silla † Richard R. Querel *a , Florian Kerber b , Gaspare Lo Curto b , Joanna E. Thomas-Osip c , Gabriel Prieto c , Arlette Chac´ on d , Omar Cuevas d , Diana Pozo d , Julio Mar´ ın d , David A. Naylor a , Michel Cur´ e d , Marc S. Sarazin b , Carlos Guirao b and Gerardo Avila b a Institute for Space Imaging Science, University of Lethbridge, Canada; b European Southern Observatory, Garching, Germany; c Las Campanas Observatory, La Serena, Chile; d Grupo Astrometeorolog´ ıa, Universidad de Valparaiso, Chile ABSTRACT The European Southern Observatory (ESO), the Institute for Space Imaging Science (ISIS) and the AstroMete- orology group at the Universidad de Valparaiso collaborated on a project to understand the precipitable water vapour (PWV) over the La Silla Paranal Observatory. Both La Silla and Paranal were studied with the goal of using them as reference sites to evaluate potential E-ELT sites. As ground-based infrared astronomy matures, our understanding of the atmospheric conditions over the observatories becomes paramount, specifically water vapour since it is the principle source of atmospheric opacity at infrared wavelengths. Several years of archival optical spectra (FEROS) have been analysed to reconstruct the PWV history above La Silla using an atmospheric radiative transfer model (BTRAM) developed by ISIS. In order to better understand the systematics involved, a dedicated atmospheric water vapour measurement campaign was conducted in May 2009 in close collaboration with Las Campanas observatory and the GMT site testing team. Several methods of determining the water col- umn were employed, including radiosonde launches, continuous measurements by infrared radiometers (IRMA), a compact echelle spectrograph (BACHES) and several high-resolution optical echelle spectrographs (FEROS, HARPS and MIKE). All available observations were compared to concurrent satellite estimates of water vapour in an attempt to ground-truth the satellite data. We present a comparison of the methods used, and results from the archival study and measurement campaign. A mean PWV of 3.4 ± 2.4 mm is found for La Silla using FEROS data covering the period 2005–2009. Important lessons on the strengths and limitations of satellite data are presented. The value of a stand-alone high time resolution PWV monitor has been demonstrated in the context of parallel observations from Las Campanas and La Silla. Keywords: precipitable water vapour, PWV, site testing, atmosphere, radiative transfer model, infrared ra- diometer, echelle, radiosonde, La Silla, Las Campanas, E-ELT, BTRAM, FEROS, HARPS, IRMA, MIKE 1. INTRODUCTION Water vapour is the principle source of opacity at infrared wavelengths in the Earth’s atmosphere. Measure- ments of atmospheric water vapour serve two primary purposes when considering operation of an astronomical observatory: long-term monitoring of precipitable water vapour (PWV), whose vertical column abundance is expressed in mm, 1 is useful for the characterization of potential observatory sites, while real-time monitoring of PWV is useful for optimizing their use, in particular with regards to mid-infrared observations. In support of site testing for the European Extremely Large Telescope (E-ELT), we have used La Silla and Paranal as calibration sites to ground-truth satellite measurements of PWV. To this end, dedicated measure- ment campaigns have been conducted at both sites and also at Las Campanas Observatory (LCO) through a collaboration between the Institute for Space Imaging Science (ISIS), scientists from the European Southern Observatory (ESO), and the Giant Magellan Telescope (GMT) site test team at LCO. * e-mail: [email protected], telephone: 1 403 317 2864 † This paper includes data gathered with the 6.5 meter Magellan Telescopes located at Las Campanas Observatory, Chile.
-
Upload
independent -
Category
Documents
-
view
0 -
download
0
Transcript of Support for site testing of the European Extremely Large Telescope: precipitable water vapor over La...
Support for site testing of the European Extremely LargeTelescope: precipitable water vapour over La Silla†
Richard R. Querel*a, Florian Kerberb, Gaspare Lo Curtob, Joanna E. Thomas-Osipc,Gabriel Prietoc, Arlette Chacond, Omar Cuevasd, Diana Pozod, Julio Marınd,
David A. Naylora, Michel Cured, Marc S. Sarazinb, Carlos Guiraob and Gerardo Avilab
aInstitute for Space Imaging Science, University of Lethbridge, Canada;bEuropean Southern Observatory, Garching, Germany;
cLas Campanas Observatory, La Serena, Chile;dGrupo Astrometeorologıa, Universidad de Valparaiso, Chile
ABSTRACT
The European Southern Observatory (ESO), the Institute for Space Imaging Science (ISIS) and the AstroMete-orology group at the Universidad de Valparaiso collaborated on a project to understand the precipitable watervapour (PWV) over the La Silla Paranal Observatory. Both La Silla and Paranal were studied with the goal ofusing them as reference sites to evaluate potential E-ELT sites. As ground-based infrared astronomy matures,our understanding of the atmospheric conditions over the observatories becomes paramount, specifically watervapour since it is the principle source of atmospheric opacity at infrared wavelengths. Several years of archivaloptical spectra (FEROS) have been analysed to reconstruct the PWV history above La Silla using an atmosphericradiative transfer model (BTRAM) developed by ISIS. In order to better understand the systematics involved, adedicated atmospheric water vapour measurement campaign was conducted in May 2009 in close collaborationwith Las Campanas observatory and the GMT site testing team. Several methods of determining the water col-umn were employed, including radiosonde launches, continuous measurements by infrared radiometers (IRMA),a compact echelle spectrograph (BACHES) and several high-resolution optical echelle spectrographs (FEROS,HARPS and MIKE). All available observations were compared to concurrent satellite estimates of water vapourin an attempt to ground-truth the satellite data. We present a comparison of the methods used, and resultsfrom the archival study and measurement campaign. A mean PWV of 3.4 ± 2.4 mm is found for La Silla usingFEROS data covering the period 2005–2009. Important lessons on the strengths and limitations of satellite dataare presented. The value of a stand-alone high time resolution PWV monitor has been demonstrated in thecontext of parallel observations from Las Campanas and La Silla.
Keywords: precipitable water vapour, PWV, site testing, atmosphere, radiative transfer model, infrared ra-diometer, echelle, radiosonde, La Silla, Las Campanas, E-ELT, BTRAM, FEROS, HARPS, IRMA, MIKE
1. INTRODUCTION
Water vapour is the principle source of opacity at infrared wavelengths in the Earth’s atmosphere. Measure-ments of atmospheric water vapour serve two primary purposes when considering operation of an astronomicalobservatory: long-term monitoring of precipitable water vapour (PWV), whose vertical column abundance isexpressed in mm,1 is useful for the characterization of potential observatory sites, while real-time monitoring ofPWV is useful for optimizing their use, in particular with regards to mid-infrared observations.
In support of site testing for the European Extremely Large Telescope (E-ELT), we have used La Silla andParanal as calibration sites to ground-truth satellite measurements of PWV. To this end, dedicated measure-ment campaigns have been conducted at both sites and also at Las Campanas Observatory (LCO) through acollaboration between the Institute for Space Imaging Science (ISIS), scientists from the European SouthernObservatory (ESO), and the Giant Magellan Telescope (GMT) site test team at LCO.
* e-mail: [email protected], telephone: 1 403 317 2864†This paper includes data gathered with the 6.5 meter Magellan Telescopes located at Las Campanas Observatory, Chile.
Several independent measurement techniques were used in this study. Continuous measurements were pro-vided by IRMA1–3 infrared radiometers operating at 20 µm. PWV was also retrieved from measured spectracovering the wavelength range from the visible to the near-infrared using facility instruments (FEROS,4 HARPS5
and MIKE6) through fitting their data to simulated atmospheric spectra. In addition, a compact light-weightechelle spectrograph, BACHES,7 was used with the ESO 1-m telescope to allow for greater flexibility in timingobservations to coincide with radiosonde launches. And finally, we evaluated the potential utility of a sim-ple stand-alone 4-band lunar spectrophotometer, operating at ∼0.94 µm, which employed a 100 mm diametertelescope.
Local meteorological data were provided by a series of radiosonde launches timed to coincide with satelliteoverpasses. The radiosondes provided in situ measurements of PWV, and time and location specific atmosphericprofiles. Together, this multi-faceted approach has resulted in a unique data set. Integral to this analysis isa site-specific atmospheric radiative transfer model (BTRAM8, 9), common to all echelle fitting and radiometerretrieval schemes used in this study.
The PWV history over La Silla has been reconstructed by analysing >1700 high-resolution echelle spectra ofstandard stars using archival FEROS data. The retrieved PWV values have been compared to estimates derivedfrom a GOES satellite10 and the MERIS11 spectrometer aboard the Envisat spacecraft. Together, these uniquedata spanning several years, can be used to investigate the seasonal variations in the water column above theChilean site.
Our three PWV measurement campaigns in 2009, described below, have resulted in a unique data set bothin terms of quality and quantity of measurements. An unprecedented number of independent instruments andmethods has been used which allows for a meaningful comparison of results. In most cases, there is foundto be good agreement between the methods used. Comparison with satellite data shows excellent agreementfor Paranal while for La Silla the topography combined with the limited spatial resolution of the GOES dataintroduces a wet bias. The PWV retrieval algorithm used with the GOES images employs a profile derivedusing data from radiosondes launched at Antofagasta (∼110 km from Paranal, while ∼625 km from La Silla).This may also explain why the GOES PWV agreement is better for Paranal than for La Silla. The wet-biasobserved in the GOES derived PWV is less pronounced in the higher resolution MERIS data set. It is reasonablethat Paranal can be used as a reference for sites in northern Chile, while La Silla, still requires further detailedanalysis, but can still provide important lessons for other sites. The long-term mean PWV for Paranal is 2.3± 1.8 mm while La Silla is wetter at 3.4 ± 2.4 mm. The relatively large uncertainties in these values are dueto pronounced seasonal variations that exist on both sites. A dedicated campaign to better understand thesystematics of PWV analysis has been successfully conducted on La Silla (May 2009) in high to moderate PWVconditions; two additional campaigns on Paranal (Jul/Aug 2009 and Nov 2009) enjoyed much lower PWV. Wereport on the results of all campaigns in this paper and a parallel submission. Based on the experience gainedin this study it will be possible to select the best-suited methods and suggest optimised strategies for supportingPWV monitoring at current and future observatory sites.
The PWV project has the following goals in order to directly support E-ELT site testing:
1. Reconstruct the record of precipitable water vapour (PWV) over La Silla and Paranal from archival data;
2. Correlate the ground-based PWV values with satellite data to establish La Silla and Paranal as referencesites for E-ELT site evaluation; and,
3. Evaluate the merit of various method to determine PWV for operational use at an observatory.
1.1 Water vapour and atmospheric models
Several methods exist for measuring the amount of water vapour in the atmosphere. To date, an accurateand practical means of determining PWV has remained elusive. One approach that uses ground based opticalspectroscopy is the so-called weak-line method,12, 13 which uses isolated spectral lines that are intrinsicallyinsensitive to temperature variations. This allows for a simple, single-layer atmospheric model with a limitednumber of molecular parameters. The principle disadvantage of this method is the requirement of weak lineswhich makes identifying the spectral continuum from which the equivalent width is derived of critical importance.
Recent developments by the ISIS using their multi-layer atmospheric radiative transfer model (BTRAM)has greatly improved our ability to obtain precise PWV measurements from absorption line spectroscopy in thewavelength range 580–980 nm. This model uses input data from HITRAN200814 and employs a customizableprofile of the distribution of water vapour in the atmosphere. As a consequence an entire manifold of weak andstrong blended spectral lines can be fitted simultaneously to retrieve more accurate and robust PWV values.A study was performed to assess the validity of this method by fitting spectra taken with the MIKE echellespectrometer at Las Campanas observatory in the context of field testing an IR radiometer (IRMA).15 The fitused a total of 1100 water vapour lines to derive the column abundance of PWV, with excellent results (∼5%precision). Although some systematics effects remain, there is generally good agreement between the weak-linemethod and BTRAM derived values.16
2. HISTORY OF PWV OVER LA SILLA PARANAL OBSERVATORYFROM ESO ARCHIVAL DATA
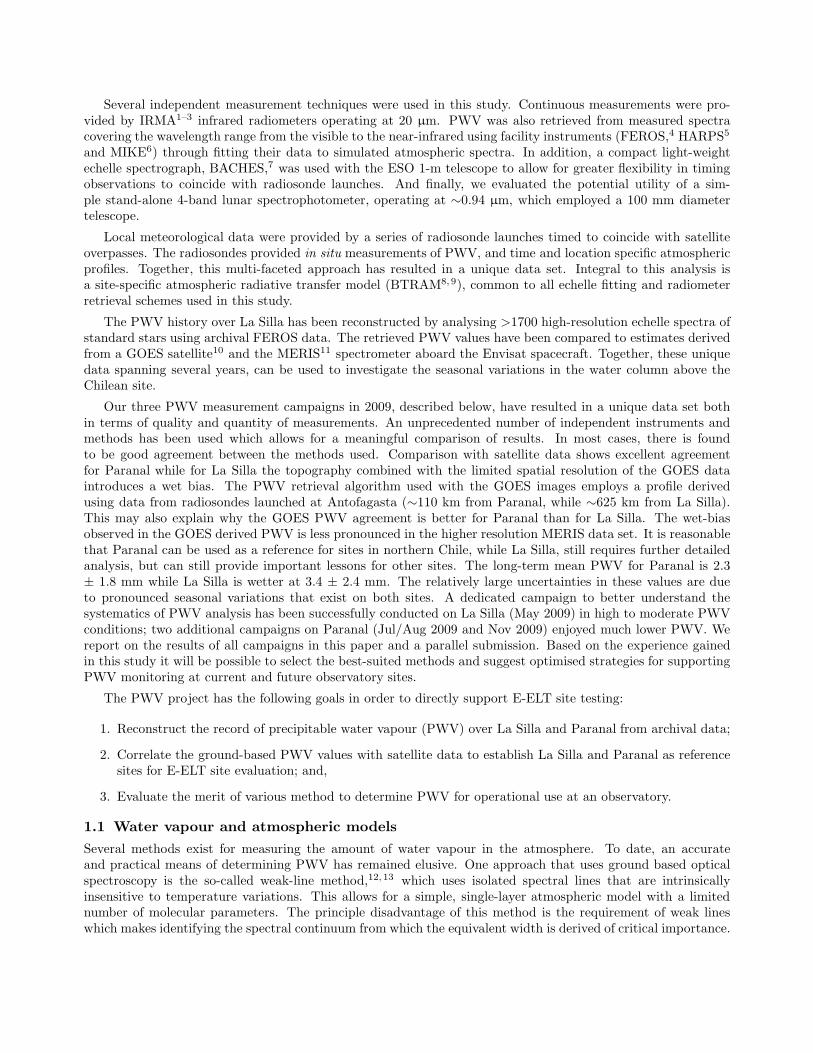
Using the new spectral modelling approach pioneered at ISIS15 many lines covering several atmospheric bandscan be used simultaneously to achieve a global fit between a measured high-resolution spectrum and a simulatedmanifold of water vapour lines. To study the seasonal variations of PWV over the La Silla site, we analysed∼1700 FEROS flux standard calibration observations covering the period from 2005 to 2009, stored in the ESOdata archive. Figure 1 shows examples of these fitting results. These flux standard spectra of white dwarfs havenearly flat and featureless stellar continuum making them particularly well suited for this study. These werereprocessed to provide the PWV fitting algorithm with a homogeneous data set. The approach used for theFEROS data reduction is similar to the UVES reprocessing project using validated master calibration files.17
The standard star observations are performed at a relatively high spectral resolution (R∼40000). Similarly,standard star observations taken with UVES (∼1500 spectra) have been used to make an equivalent analysis forParanal, see parallel submission by Kerber et al.18 For both instruments the number of useable spectra could beincreased by including science observations as well, however, stellar features represent a significant complicationto the extraction of PWV values. Analysis of science data would require the careful selection of targets, forexample only stars with temperatures >10,000 K, to minimize the number of photospheric lines; thus we limitedour sample to standard star observations.
For the analysis with BTRAM, a mid-latitude profile modified with site-specific archival radiosonde data fromAntofagasta has been employed. Since the distribution of water vapour is highly time dependent this profilerepresents a median distribution. It is expected that the median is more applicable to Paranal, which is located∼110 km from Antofagasta, while less representative for La Silla, since it is ∼625 km from Antofagasta. In allcases the distribution of water vapour, usually expressed in terms of a scale height, is the dominant source ofuncertainty.
2.1 Satellite data and ground truth
The archive value of the FEROS standard stars data sets are essential in establishing a statistical relationshipbetween the ground-based data and the satellite data taken with the geostationary GOES satellite and theMERIS spectrometer onboard the sun-synchronous ENVISAT, situated in a low Earth orbit. Calibration andvalidation of space-borne instruments is usually achieved using ground based observations: the goal being torender the satellite data more accurate by characterising systematic effects between instruments and techniques.
For example, GOES provides good temporal resolution – one full Earth disk observation every 3 hours –but offers only limited spatial resolution (12 × 12 km). Moreover, the GOES radiometer cannot measure watervapour directly but instead derives it based on an empirical relationship between brightness measurements at6.5 and 10.7 µm (a water vapour emission band and an IR window, respectively). This approach is sensitive totemperature effects. On the other hand, the MERIS spectrometer directly measures water vapour lines between890 and 900 nm with a spatial resolution of 1.2 × 1.2 km, however, due to its polar orbit it passes over sites inChile only every 2–3 days; always around 14:30 UTC, thus providing only day time measurements.
As is shown in the next section, despite the large difference in spatial and temporal resolution, there is generalagreement between the water wapour derived by the two satellites.11 However, it should be noted that thereis an approximate factor of 100 reduction between the GOES footprint and the MERIS footprint, and another
717.0 717.5 718.0 718.5 719.0Wavelength (nm)
0.0
0.2
0.4
0.6
0.8
1.0
Tra
nsm
issi
on
FEROS dataBTRAM fit
1.64 mm PWV
717.0 717.5 718.0 718.5 719.0Wavelength (nm)
0.0
0.2
0.4
0.6
0.8
1.0
Tra
nsm
issi
on
FEROS dataBTRAM fit
7.51 mm PWV
Figure 1. Example of deriving PWV from fitting a simulated atmosphere to FEROS archival data. Each plot showsthe measured spectra, simulated spectra and a residual. Both spectra were measured in October 2005. The left panelrepresents dry conditions, whereas the right panel is a relatively wetter night.
factor of 18,000 reduction between the MERIS footprint and the collection area of typical 10 m telescope.This overall factor of 1.8 million between the area sampled by GOES and the area observed by a telescopeillustrates the challenge in directly comparing their retrieved PWV values. The larger areas will necessarilyinclude regions around the observatories. Since these regions are low-lying and wetter their retrievals will tendbe biased. Notwithstanding this limilation, the FEROS archival provides an ideal data set to compare groundand space-based measurements.
2.2 Results from the archive
When comparing the PWV values derived from the FEROS archival spectra and the satellite data one has tokeep in mind that these approaches are different in a number of important aspects. In the ground-based case, theobservations sample a very small volume of the atmosphere – a single line-of-sight towards a star. The satellite-borne instrument is nadir-viewing, recording an average of PWV over its field-of-view representing many squarekilometres which may contain lakes, fields, roads, etc. Also, the ground-based telescopes benefit from using awell-defined stellar continuum as a background source, while the satellites rely on sunlight reflected by the Earth(MERIS) or emission from the atmosphere (GOES). FEROS and MERIS determine PWV from absorption linesin the near-IR (700–1000 nm), while GOES measures brightnesses in the thermal IR (water vapour emission at6.5 µm and an IR window at 10.7 µm). Regardless of the methodology used, in all cases a model of the Earth’satmosphere (which include pressure, temperature and density profiles) is required to derive PWV.
Given the significant differences between ground and space-based measurement techniques, particularly inspatial and temporal coverage, the degree of agreement found in our study is quite remarkable. In all cases,except for those rare times for which simultaneous radiosonde launches exist, all retrieval methods are basedupon a mean atmospheric profile. Since the scale height and distribution of water vapour is time dependent, allresults based on archival data can be affected by systematic errors of up to 20% as a consequence of having useda median profile in their retrieval. Even with this caveat it is important to note that when comparing the resultspresented in this paper, no zero-point offsets or scaling factors have been applied to the individual data sets.
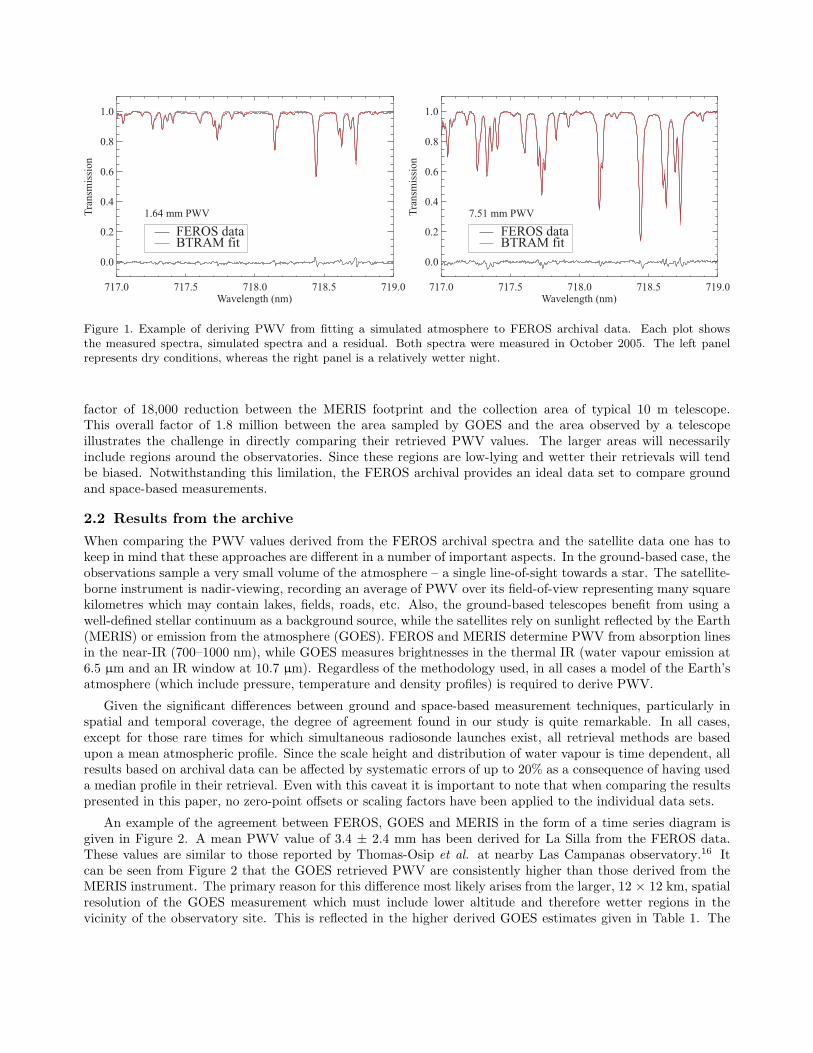
An example of the agreement between FEROS, GOES and MERIS in the form of a time series diagram isgiven in Figure 2. A mean PWV value of 3.4 ± 2.4 mm has been derived for La Silla from the FEROS data.These values are similar to those reported by Thomas-Osip et al. at nearby Las Campanas observatory.16 Itcan be seen from Figure 2 that the GOES retrieved PWV are consistently higher than those derived from theMERIS instrument. The primary reason for this difference most likely arises from the larger, 12 × 12 km, spatialresolution of the GOES measurement which must include lower altitude and therefore wetter regions in thevicinity of the observatory site. This is reflected in the higher derived GOES estimates given in Table 1. The

53600 53800 54000 54200 54400 54600 54800
0
5
10
15
20P
WV
[mm
]
GOESMERISFEROS
GOESMERISFEROS
53860 53880 53900 53920 53940 53960 53980 54000
0
2
4
6
8
10
12
PW
V[m
m]
GOESMERISFEROS
GOESMERISFEROS
53960 53965 53970 53975 53980 53985Time [MJD]
0
2
4
6
8
10
12
PW
V[m
m]
GOESMERISFEROS
GOESMERISFEROS
Figure 2. Comparison of PWV data derived from FEROS archival data and satellite data for the period 2005–2009.Pronounced seasonal variations are evident as is the more qualitative agreement when compared to the archival analysisfor Paranal.18 Middle and bottom plots show zoomed in subsets of the time series (delineated by the vertical bars).Agreement between the data sets is excellent. In terms of absolute PWV, GOES values are consistently higher thanFEROS results. The dampening effect of its limited spatial resolution is evident.
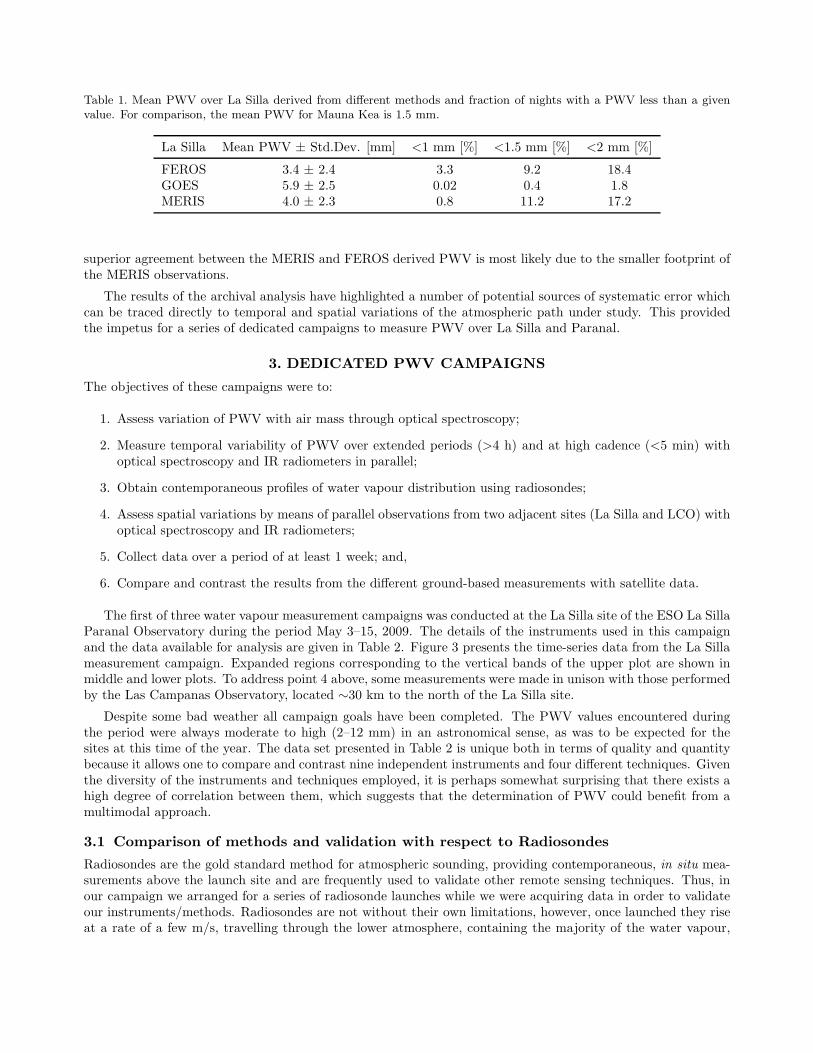
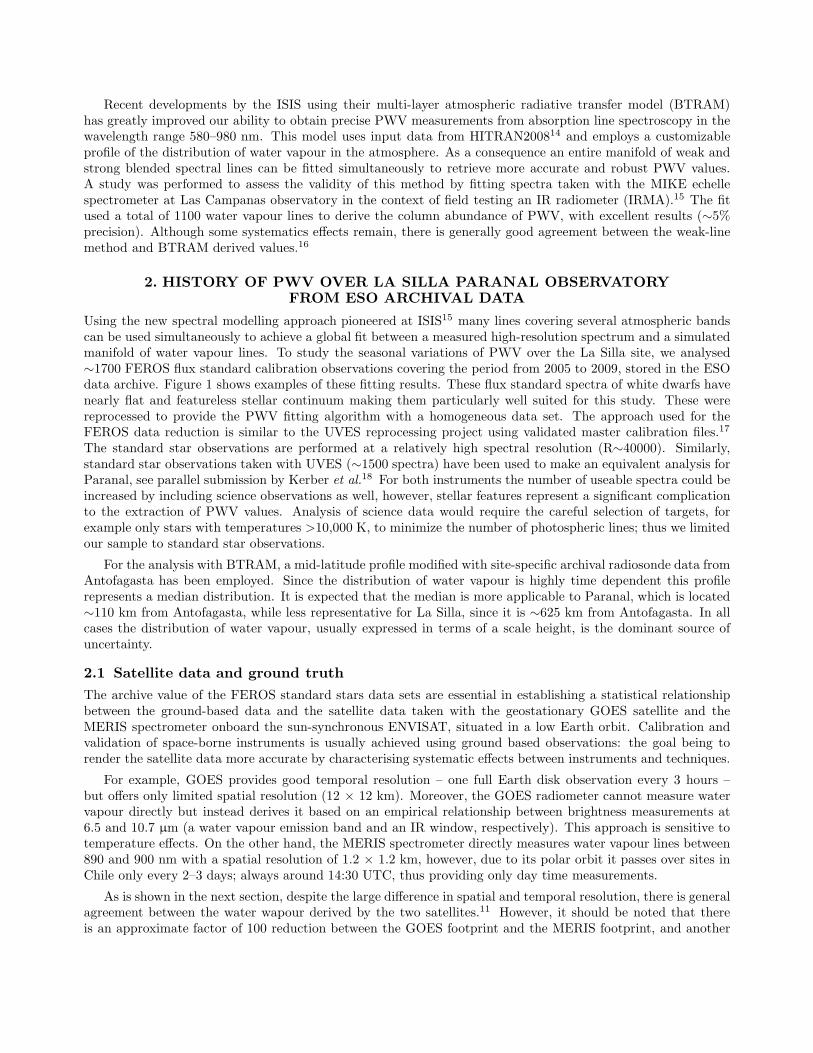
Table 1. Mean PWV over La Silla derived from different methods and fraction of nights with a PWV less than a givenvalue. For comparison, the mean PWV for Mauna Kea is 1.5 mm.
La Silla Mean PWV ± Std.Dev. [mm] <1 mm [%] <1.5 mm [%] <2 mm [%]
FEROS 3.4 ± 2.4 3.3 9.2 18.4GOES 5.9 ± 2.5 0.02 0.4 1.8MERIS 4.0 ± 2.3 0.8 11.2 17.2
superior agreement between the MERIS and FEROS derived PWV is most likely due to the smaller footprint ofthe MERIS observations.
The results of the archival analysis have highlighted a number of potential sources of systematic error whichcan be traced directly to temporal and spatial variations of the atmospheric path under study. This providedthe impetus for a series of dedicated campaigns to measure PWV over La Silla and Paranal.
3. DEDICATED PWV CAMPAIGNS
The objectives of these campaigns were to:
1. Assess variation of PWV with air mass through optical spectroscopy;
2. Measure temporal variability of PWV over extended periods (>4 h) and at high cadence (<5 min) withoptical spectroscopy and IR radiometers in parallel;
3. Obtain contemporaneous profiles of water vapour distribution using radiosondes;
4. Assess spatial variations by means of parallel observations from two adjacent sites (La Silla and LCO) withoptical spectroscopy and IR radiometers;
5. Collect data over a period of at least 1 week; and,
6. Compare and contrast the results from the different ground-based measurements with satellite data.
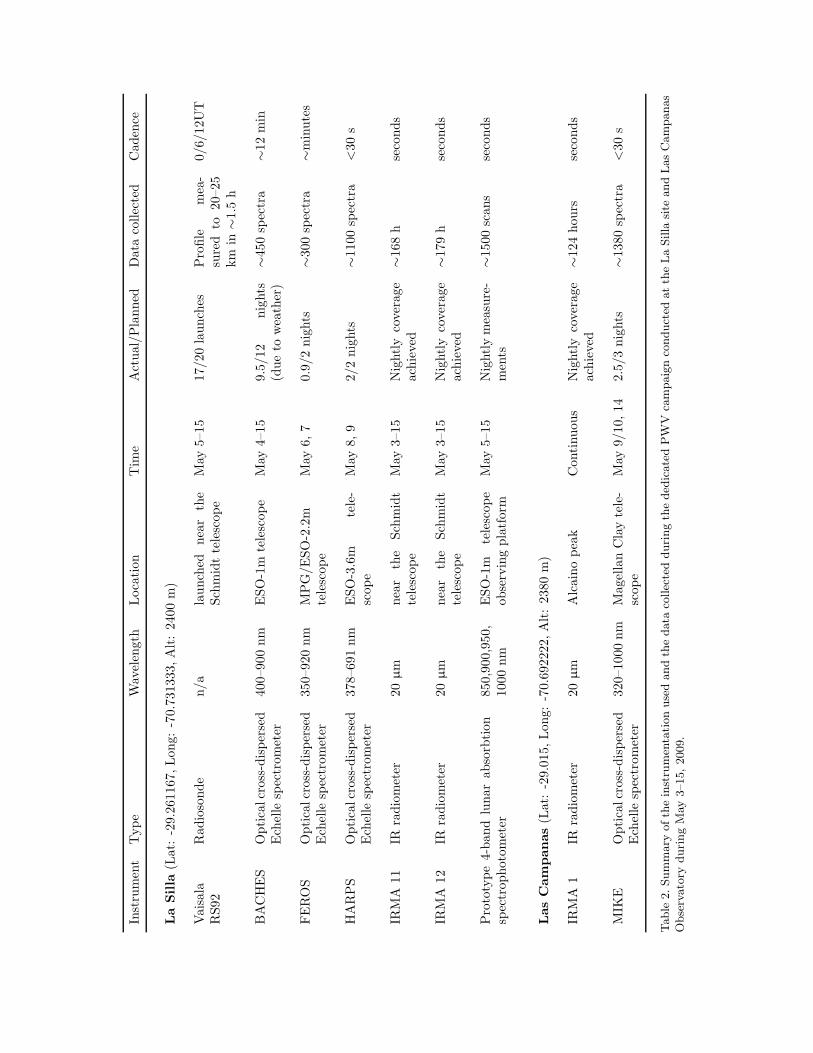
The first of three water vapour measurement campaigns was conducted at the La Silla site of the ESO La SillaParanal Observatory during the period May 3–15, 2009. The details of the instruments used in this campaignand the data available for analysis are given in Table 2. Figure 3 presents the time-series data from the La Sillameasurement campaign. Expanded regions corresponding to the vertical bands of the upper plot are shown inmiddle and lower plots. To address point 4 above, some measurements were made in unison with those performedby the Las Campanas Observatory, located ∼30 km to the north of the La Silla site.
Despite some bad weather all campaign goals have been completed. The PWV values encountered duringthe period were always moderate to high (2–12 mm) in an astronomical sense, as was to be expected for thesites at this time of the year. The data set presented in Table 2 is unique both in terms of quality and quantitybecause it allows one to compare and contrast nine independent instruments and four different techniques. Giventhe diversity of the instruments and techniques employed, it is perhaps somewhat surprising that there exists ahigh degree of correlation between them, which suggests that the determination of PWV could benefit from amultimodal approach.
3.1 Comparison of methods and validation with respect to Radiosondes
Radiosondes are the gold standard method for atmospheric sounding, providing contemporaneous, in situ mea-surements above the launch site and are frequently used to validate other remote sensing techniques. Thus, inour campaign we arranged for a series of radiosonde launches while we were acquiring data in order to validateour instruments/methods. Radiosondes are not without their own limitations, however, once launched they riseat a rate of a few m/s, travelling through the lower atmosphere, containing the majority of the water vapour,
Instrument
Typ
eWavelength
Location
Tim
eActual/P
lanned
Datacollected
Cad
ence
LaSilla
(Lat:-29.26
1167
,Lon
g:-70.73
1333
,Alt:24
00m)
Vaisala
RS92
Rad
iosonde
n/a
launched
near
the
Schmidttelescop
eMay
5–15
17/2
0launches
Profile
mea-
sured
to20
–25
kmin
∼1.5h
0/6/
12UT
BACHES
Opticalcross-dispersed
Echelle
spectrom
eter
400–
900nm
ESO-1m
telescop
eMay
4–15
9.5/
12nights
(dueto
weather)
∼45
0spectra
∼12
min
FEROS
Opticalcross-dispersed
Echelle
spectrom
eter
350–
920nm
MPG/E
SO-2.2m
telescop
eMay
6,7
0.9/
2nights
∼30
0spectra
∼minutes
HARPS
Opticalcross-dispersed
Echelle
spectrom
eter
378–
691nm
ESO-3.6m
tele-
scop
eMay
8,9
2/2nights
∼11
00spectra
<30
s
IRMA
11IR
radiometer
20µm
near
the
Schmidt
telescop
eMay
3–15
Nightly
coverage
achieved
∼16
8h
seconds
IRMA
12IR
radiometer
20µm
near
the
Schmidt
telescop
eMay
3–15
Nightly
coverage
achieved
∼17
9h
seconds
Prototype4-ban
dlunar
absorbtion
spectrop
hotom
eter
850,90
0,95
0,10
00nm
ESO-1m
telescop
eob
servingplatform
May
5–15
Nightly
measure-
ments
∼15
00scan
sseconds
LasCampanas(L
at:-29.01
5,Lon
g:-70.69
2222
,Alt:23
80m)
IRMA
1IR
radiometer
20µm
Alcainopeak
Con
tinu
ous
Nightly
coverage
achieved
∼12
4hou
rsseconds
MIK
EOpticalcross-dispersed
Echelle
spectrom
eter
320–
1000
nm
Mag
ellanClaytele-
scop
eMay
9/10
,14
2.5/
3nights
∼13
80spectra
<30
s
Tab
le2.
Summaryof
theinstrumen
tation
usedan
dthedatacollectedduringtheded
icated
PW
Vcampaign
conducted
attheLaSilla
site
andLas
Cam
pan
asObservatoryduringMay
3–15
,20
09.

54955 54960 54965
0
2
4
6
8
10
12P
WV
[mm
]
IRMA 1IRMA 11BACHESFEROSHARPSMIKERadiosondeGOES
IRMA 1IRMA 11BACHESFEROSHARPSMIKERadiosondeGOES
54959.0 54959.5 54960.0 54960.5 54961.0
2
4
6
8
PW
V[m
m]
54963.0 54963.5 54964.0 54964.5 54965.0 54965.5Time [MJD]
0
2
4
6
8
10
12
PW
V[m
m]
Figure 3. Upper window is a comparison of PWV data derived from the various methods during the PWV campaign onLa Silla and Las Campanas in May 3–15, 2009. IRMA 1 and MIKE are located at Las Campanas, all other instrumentsare at La Silla. GOES satellite data has been overplotted for comparison. The middle and lower plots are expandedsubsets of the time-series, denoted by the vertical bars in the upper plot.
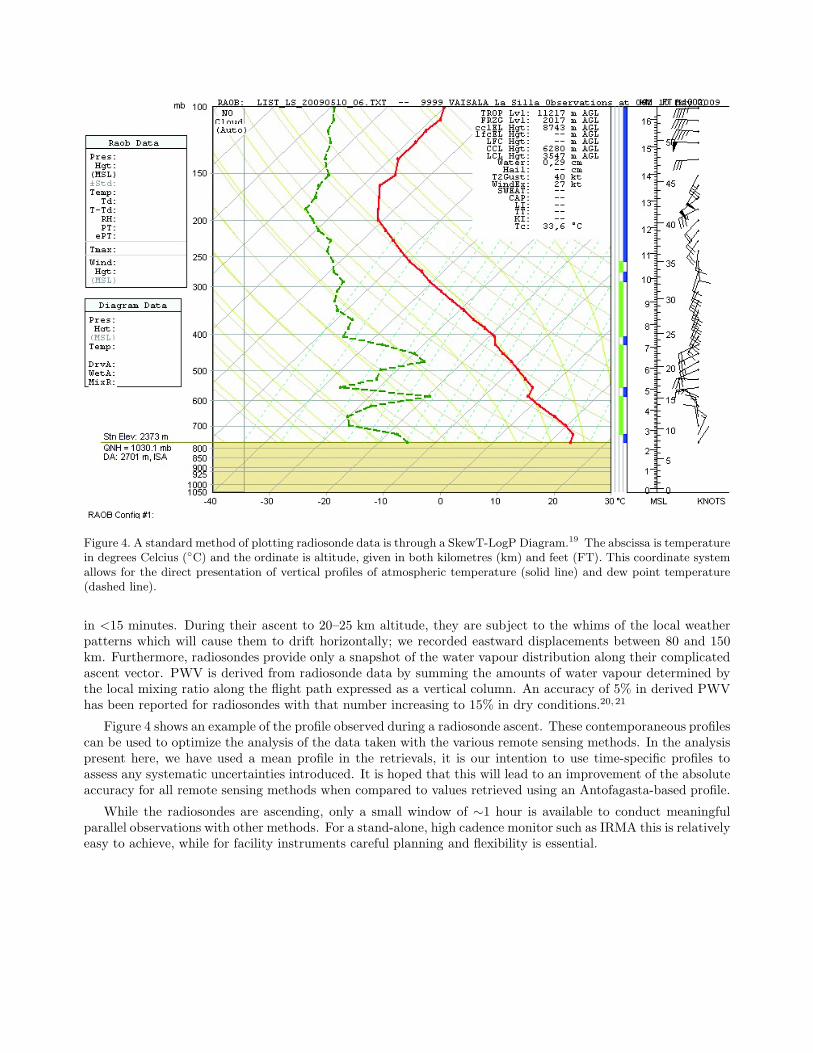
Figure 4. A standard method of plotting radiosonde data is through a SkewT-LogP Diagram.19 The abscissa is temperaturein degrees Celcius (◦C) and the ordinate is altitude, given in both kilometres (km) and feet (FT). This coordinate systemallows for the direct presentation of vertical profiles of atmospheric temperature (solid line) and dew point temperature(dashed line).
in <15 minutes. During their ascent to 20–25 km altitude, they are subject to the whims of the local weatherpatterns which will cause them to drift horizontally; we recorded eastward displacements between 80 and 150km. Furthermore, radiosondes provide only a snapshot of the water vapour distribution along their complicatedascent vector. PWV is derived from radiosonde data by summing the amounts of water vapour determined bythe local mixing ratio along the flight path expressed as a vertical column. An accuracy of 5% in derived PWVhas been reported for radiosondes with that number increasing to 15% in dry conditions.20, 21
Figure 4 shows an example of the profile observed during a radiosonde ascent. These contemporaneous profilescan be used to optimize the analysis of the data taken with the various remote sensing methods. In the analysispresent here, we have used a mean profile in the retrievals, it is our intention to use time-specific profiles toassess any systematic uncertainties introduced. It is hoped that this will lead to an improvement of the absoluteaccuracy for all remote sensing methods when compared to values retrieved using an Antofagasta-based profile.
While the radiosondes are ascending, only a small window of ∼1 hour is available to conduct meaningfulparallel observations with other methods. For a stand-alone, high cadence monitor such as IRMA this is relativelyeasy to achieve, while for facility instruments careful planning and flexibility is essential.
2 4 6 8 10 12Radiosonde PWV [mm]
2
4
6
8
10
12IR
MA
11P
WV
[mm
] y = 0.99x
R2 = 0.85
2 4 6 8 10 12Radiosonde PWV [mm]
2
4
6
8
10
12
BA
CH
ES
PW
V[m
m] y = 0.82x
R2 = 0.94
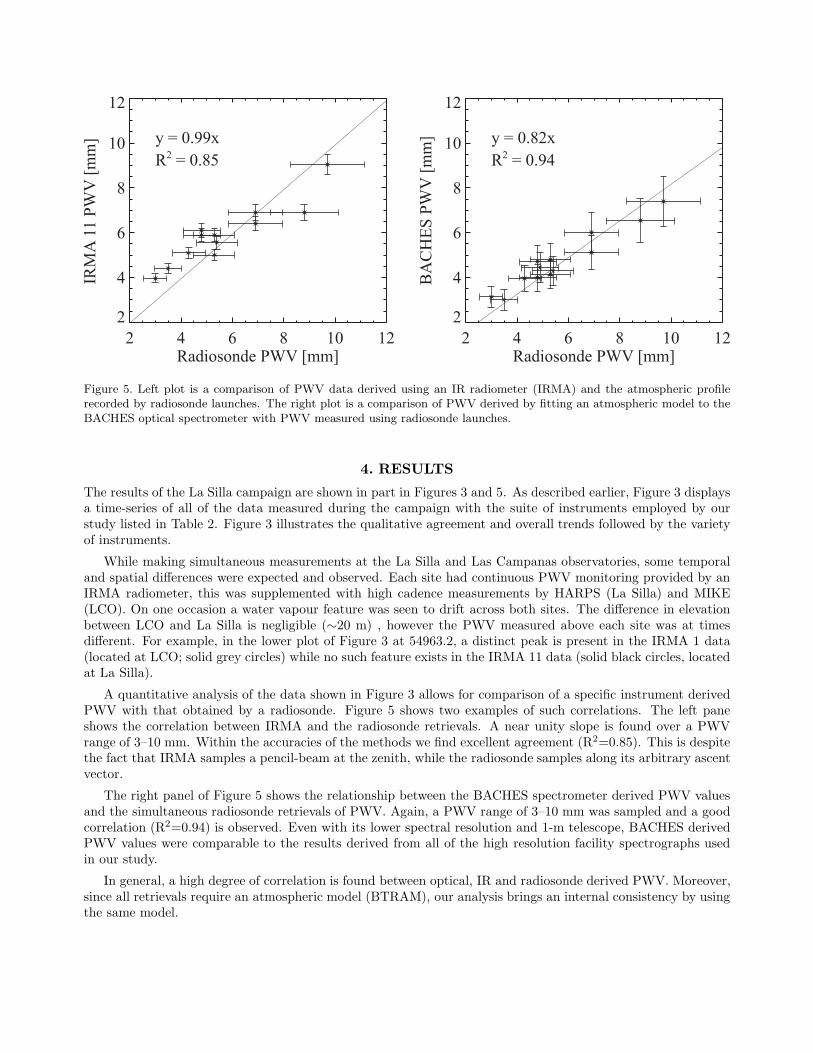
Figure 5. Left plot is a comparison of PWV data derived using an IR radiometer (IRMA) and the atmospheric profilerecorded by radiosonde launches. The right plot is a comparison of PWV derived by fitting an atmospheric model to theBACHES optical spectrometer with PWV measured using radiosonde launches.
4. RESULTS
The results of the La Silla campaign are shown in part in Figures 3 and 5. As described earlier, Figure 3 displaysa time-series of all of the data measured during the campaign with the suite of instruments employed by ourstudy listed in Table 2. Figure 3 illustrates the qualitative agreement and overall trends followed by the varietyof instruments.
While making simultaneous measurements at the La Silla and Las Campanas observatories, some temporaland spatial differences were expected and observed. Each site had continuous PWV monitoring provided by anIRMA radiometer, this was supplemented with high cadence measurements by HARPS (La Silla) and MIKE(LCO). On one occasion a water vapour feature was seen to drift across both sites. The difference in elevationbetween LCO and La Silla is negligible (∼20 m) , however the PWV measured above each site was at timesdifferent. For example, in the lower plot of Figure 3 at 54963.2, a distinct peak is present in the IRMA 1 data(located at LCO; solid grey circles) while no such feature exists in the IRMA 11 data (solid black circles, locatedat La Silla).
A quantitative analysis of the data shown in Figure 3 allows for comparison of a specific instrument derivedPWV with that obtained by a radiosonde. Figure 5 shows two examples of such correlations. The left paneshows the correlation between IRMA and the radiosonde retrievals. A near unity slope is found over a PWVrange of 3–10 mm. Within the accuracies of the methods we find excellent agreement (R2=0.85). This is despitethe fact that IRMA samples a pencil-beam at the zenith, while the radiosonde samples along its arbitrary ascentvector.
The right panel of Figure 5 shows the relationship between the BACHES spectrometer derived PWV valuesand the simultaneous radiosonde retrievals of PWV. Again, a PWV range of 3–10 mm was sampled and a goodcorrelation (R2=0.94) is observed. Even with its lower spectral resolution and 1-m telescope, BACHES derivedPWV values were comparable to the results derived from all of the high resolution facility spectrographs usedin our study.
In general, a high degree of correlation is found between optical, IR and radiosonde derived PWV. Moreover,since all retrievals require an atmospheric model (BTRAM), our analysis brings an internal consistency by usingthe same model.
The La Silla campaign was the first of three PWV measurement campaigns. Some nights with poor weatherconditions and difficulty scheduling observation times resulted in a limited set of high resolution spectra withwhich to correlate to concurrent radiosonde data. The reader is referred to the paper by Kerber et al.18 whichpresents aggregates the La Silla data with the results from two later campaigns at Paranal. The two campaignsresulted in a larger data set and thus a better source of intercomparison of the spectrometer and radiosondePWV estimates. Good agreement was also found between the GOES PWV retrievals and radiosonde estimates.This is fully consistent with the findings from the FEROS archival data. As described above the discrepancybetween the FEROS archival PWV and GOES PWV values may be attributable to its limited spatial resolution.GOES is found to both over- and underestimate PWV depending on atmospheric conditions and the actualdistribution of water vapour. For these and other figures see the parallel submission by Kerber et al.18
4.1 Conclusion
In this paper we have presented results from a campaign to measure atmospheric water vapour above Chileansites using data from nine ground based instruments and two satellites together with contemporaneous launchesof radiosondes from the sites.
All ground-based measurements, regardless of wavelength, used the same atmospheric model to retrieve PWV.A high degree of correlation between radiosonde data and the other methodologies has been found. When oneconsiders the fact that the different techniques covers the wavelength range of 0.7–20 µm it is quite remarkablethat such agreement exists.
The PWV measurement campaign was a multimodal approach to tackle the problem of determining PWVabove the Chilean sites. Using the gold standard of radiosondes, given their limitations, we found there was ahigh degree of correlation between every approach. The use of ground-based instruments dedicated to monitoringthe atmosphere is feasible and has the potential to add value to observatory scheduling operations. Real-timemonitoring of PWV is useful as an operational tool (short-term) and for site characterisation and testing (long-term). FEROS and HARPS measurements of spectrophotometric standard stars have been demonstrated to begood tools for monitoring the PWV over La Silla. A continuous monitoring of PWV using this method (ideallyonce per day) would allow for the generation of a long-term data set which could help to characterise the siteand serve as a baseline for understanding the climatology of other sites.
Analysis of the data from the three PWV campaigns at La Silla and Paranal have resulted in the followinggeneral conclusions. The internal precision of PWV data from optical spectroscopy is∼7%. The internal precisionof IR radiometer data is ∼3%. Relative agreement between all three IRMA units measuring at the same site isextremely good on time scales of a few seconds to several hours. Correlation between PWV values derived fromradiosondes and IR radiometers is close to 1 with a small zero-point offset. From this we conclude that withinthe uncertainties of the methods the results in PWV are fully compatible.
This study also demonstrates the legacy value and utility of archival data. The historical comparison tosatellite data would not have been possible without a well-maintained and accessible repository of measurements.
ACKNOWLEDGMENTS
This work has been funded by the E-ELT project in the context of site characterization. The measurementshave been made possible by the coordinated effort of the project team and the observatory site hosting it. Wewould like to thank all the technical staff, astronomers and telescope operators at La Silla and Paranal who havehelped us in setting up equipment, operating instruments and supporting parallel observations. We thank theDirectors of La Silla Paranal observatory (A. Kaufer, M. Sterzik, U. Weilenmann) for accommodating such ademanding project in the operational environment of the observatory and for granting technical time. Specialthanks to G. Ihle, O. Schuetz and in particular A. Pizarro (all on La Silla). Special thanks are also due to thehead of science operations (I. Saviane) for specifically adding flexibility to the scheduling enabling us to achieveparallel observations betweens instruments and the radiosondes. It is a pleasure to thank the Chilean DirectionGeneral de aeronautica civil for the helpful collaboration and for reserving airspace around the observatories toensure a safe environment for launches of radiosonde balloons. We gratefully acknowledge the good collaborationwith the TMT and GMT site testing teams. Special thanks are due to the TMT project for providing on loan
the two IRMA units used during our campaigns. D.A.N. would also like to acknowledge funding received fromNSERC and CFI. The authors would like to thank Greg Tompkins and Brad Gom for their work with BTRAMand IRMA.
REFERENCES
[1] Naylor, D. A., Chapman, I. M., and Gom, B. G., “Measurements of atmospheric water vapor above MaunaKea using an infrared radiometer,” Proc. SPIE 4815, 36–45 (Sept. 2002).
[2] Phillips, R. R. and Naylor, D. A., “Initial operations of an water vapour monitor (IRMA) at Gemini South,Las Campanas Observatories, and in the TMT site testing role,” Proc. SPIE 6269 (July 2006).
[3] Naylor, D. A. et al., “IRMA as a Potential Phase Correction Instrument: Results from the SMA TestCampaign,” International Journal of Infrared and Millimeter Waves 29, 1196–1204 (Dec. 2008).
[4] Kaufer, A. et al., “Commissioning FEROS, the new high-resolution spectrograph at La-Silla.,” The Mes-senger 95, 8–12 (Mar. 1999).
[5] Mayor, M. et al., “Setting New Standards with HARPS,” The Messenger 114, 20–24 (Dec. 2003).[6] Bernstein, R. et al., “MIKE: A Double Echelle Spectrograph for the Magellan Telescopes at Las Campanas
Observatory,” Proc. SPIE 4841, 1694–1704 (Mar. 2003).[7] Avila, G. et al., “BACHES A Compact Light-Weight Echelle Spectrograph for Amateur Astronomy,” The
Messenger 129, 62–64 (Sept. 2007).[8] Chapman, I. M. and Naylor, D. A., “Development of a Freely Distributed, Customizable Atmospheric
Radiative Transfer Model,” in [Fourier Transform Spectroscopy/ Hyperspectral Imaging and Sounding of theEnvironment ], Technical Digest (CD), paper HTuD2, OSA (2005).
[9] BTRAM Website: http://blueskyspectroscopy.com/ (2010).[10] Space Systems-Loral; GOES I-M Databook: http://goes.gsfc.nasa.gov/text/goes.databook.html (2010).[11] Kurlandczyk, H. and Sarazin, M., “Remote sensing of precipitable water vapour and cloud cover for site
selection of the European Extremely Large Telescope (E-ELT) using MERIS,” Proc. SPIE 6745 (Oct. 2007).[12] Brault, J. W., Fender, J. S., and Hall, D. N. B., “Absorption Coefficients of Selected Atmospheric Water
Lines,” Journal of Quantitative Spectroscopy and Radiative Transfer 15, 549–551 (1975).[13] Thomas-Osip, J. et al., “Calibration of the Relationship between Precipitable Water Vapor and 225 GHz
Atmospheric Opacity via Optical Echelle Spectroscopy at Las Campanas Observatory,” PASP 119, 697–708(June 2007).
[14] Rothman, L. S. et al., “The HITRAN 2008 molecular spectroscopic database,” Journal of QuantitativeSpectroscopy and Radiative Transfer 110, 533–572 (June 2009).
[15] Querel, R. R. et al., “Comparison of precipitable water vapour measurements made with an optical echellespectrograph and an infrared radiometer at Las Campanas Observatory,” Proc. SPIE 7014 (Aug. 2008).
[16] Thomas-Osip, J. et al., “Giant Magellan Telescope Site Testing: PWV Statistics and Calibration,” Proc.SPIE 7733-169 (June 2010).
[17] Hanuschik, R. http://www.eso.org/observing/dfo/quality/reproUVES/processing.html (2007).[18] Kerber, F. et al., “Support for site testing of the European Extremely Large Telescope: precipitable water
vapor over Paranal,” Proc. SPIE 7733-54 (June 2010).[19] Introduction to the SkewT diagram. http://airsnrt.jpl.nasa.gov/SkewT_info.html (2010).[20] Schneider, M. et al., “Continuous quality assessment of atmospheric water vapour measurement techniques:
FTIR, Cimel, MFRSR, GPS, and Vaisala RS92,” Atmospheric Measurement Techniques 3, 323–338 (Mar.2010).
[21] Wang, J. et al., “A near-global, 2-hourly data set of atmospheric precipitable water from ground-based GPSmeasurements,” Journal of Geophysical Research (Atmospheres) 112, 11107–+ (June 2007).