Title THE MAGNITUDE AND TREND OF ARTIMETHER–LUMEFANTRINE (LA) STOCK-OUTS AT PUBLIC HEALTH CENTRES...
20
SP031310 FINAL REPORT_26 JUNE 2013 Title THE MAGNITUDE AND TREND OF ARTIMETHER–LUMEFANTRINE (LA) STOCK-OUTS AT PUBLIC HEALTH CENTRES IN BLANTYRE Investigators Thuboy Blessings R (B.Pharm (Hons) IV), Tailos Vongaishe M (B.Pharm (Hons) IV) Supervisors Mr. R Mwale (Senior Lecturer, Department of Pharmacy, College of Medicine) Mr. W Chalira (General Manager, Malawi Pharmacies Limited; Part-time Lecturer, Department of Pharmacy, College of Medicine) Institution under whose umbrella the research project will be conducted The College of Medicine - University of Malawi
Transcript of Title THE MAGNITUDE AND TREND OF ARTIMETHER–LUMEFANTRINE (LA) STOCK-OUTS AT PUBLIC HEALTH CENTRES...
SP031310 FINAL REPORT_26 JUNE 2013
Title
THE MAGNITUDE AND TREND OF ARTIMETHER–LUMEFANTRINE (LA)
STOCK-OUTS AT PUBLIC HEALTH CENTRES IN BLANTYRE
Investigators
Thuboy Blessings R (B.Pharm (Hons) IV), Tailos Vongaishe M (B.Pharm (Hons) IV)
Supervisors
Mr. R Mwale (Senior Lecturer, Department of Pharmacy, College of Medicine)
Mr. W Chalira (General Manager, Malawi Pharmacies Limited; Part-time Lecturer,
Department of Pharmacy, College of Medicine)
Institution under whose umbrella the research project will be conducted
The College of Medicine - University of Malawi
SP031310 FINAL REPORT_26 JUNE 2013
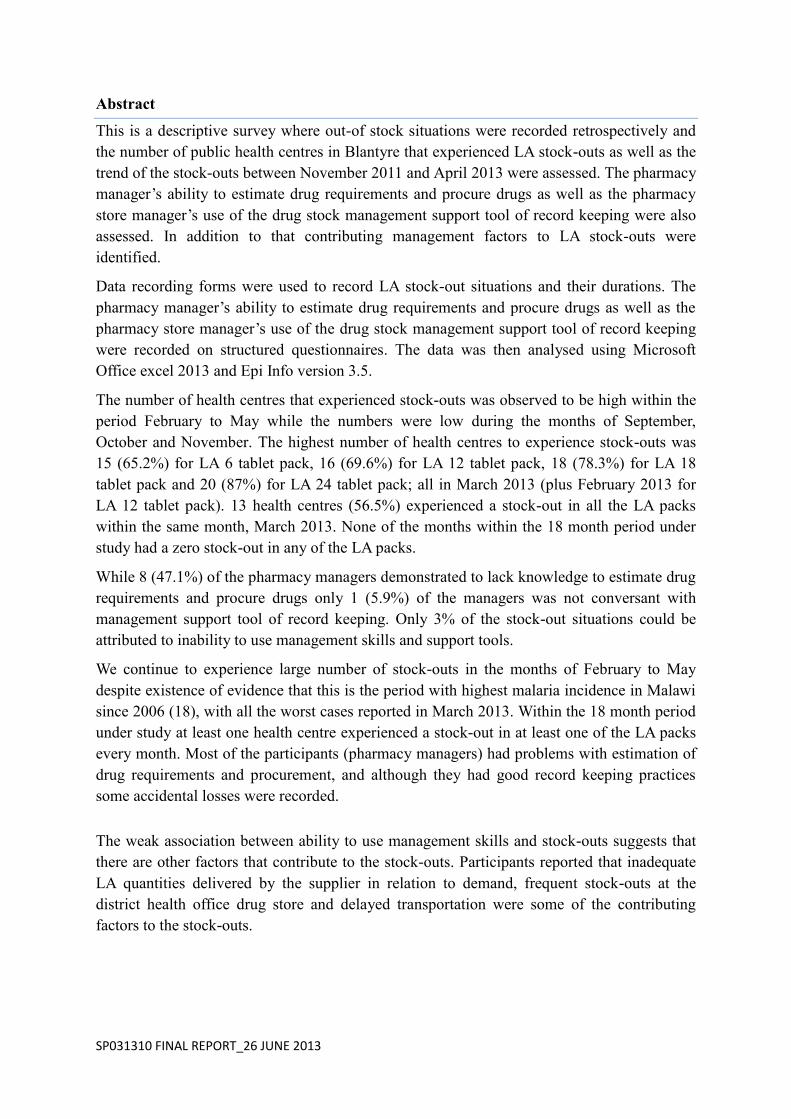
Abstract
This is a descriptive survey where out-of stock situations were recorded retrospectively and
the number of public health centres in Blantyre that experienced LA stock-outs as well as the
trend of the stock-outs between November 2011 and April 2013 were assessed. The pharmacy
manager’s ability to estimate drug requirements and procure drugs as well as the pharmacy
store manager’s use of the drug stock management support tool of record keeping were also
assessed. In addition to that contributing management factors to LA stock-outs were
identified.
Data recording forms were used to record LA stock-out situations and their durations. The
pharmacy manager’s ability to estimate drug requirements and procure drugs as well as the
pharmacy store manager’s use of the drug stock management support tool of record keeping
were recorded on structured questionnaires. The data was then analysed using Microsoft
Office excel 2013 and Epi Info version 3.5.
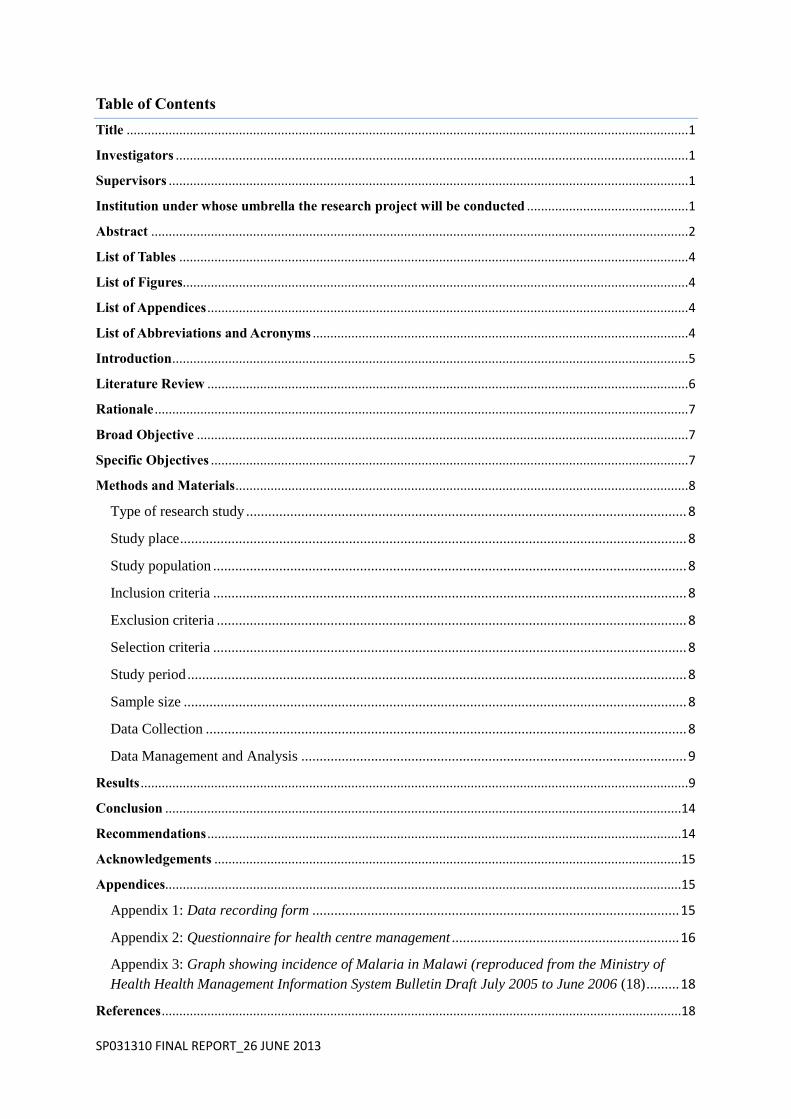
The number of health centres that experienced stock-outs was observed to be high within the
period February to May while the numbers were low during the months of September,
October and November. The highest number of health centres to experience stock-outs was
15 (65.2%) for LA 6 tablet pack, 16 (69.6%) for LA 12 tablet pack, 18 (78.3%) for LA 18
tablet pack and 20 (87%) for LA 24 tablet pack; all in March 2013 (plus February 2013 for
LA 12 tablet pack). 13 health centres (56.5%) experienced a stock-out in all the LA packs
within the same month, March 2013. None of the months within the 18 month period under
study had a zero stock-out in any of the LA packs.
While 8 (47.1%) of the pharmacy managers demonstrated to lack knowledge to estimate drug
requirements and procure drugs only 1 (5.9%) of the managers was not conversant with
management support tool of record keeping. Only 3% of the stock-out situations could be
attributed to inability to use management skills and support tools.
We continue to experience large number of stock-outs in the months of February to May
despite existence of evidence that this is the period with highest malaria incidence in Malawi
since 2006 (18), with all the worst cases reported in March 2013. Within the 18 month period
under study at least one health centre experienced a stock-out in at least one of the LA packs
every month. Most of the participants (pharmacy managers) had problems with estimation of
drug requirements and procurement, and although they had good record keeping practices
some accidental losses were recorded.
The weak association between ability to use management skills and stock-outs suggests that
there are other factors that contribute to the stock-outs. Participants reported that inadequate
LA quantities delivered by the supplier in relation to demand, frequent stock-outs at the
district health office drug store and delayed transportation were some of the contributing
factors to the stock-outs.
SP031310 FINAL REPORT_26 JUNE 2013
Table of Contents
Title ................................................................................................................................................................ 1
Investigators .................................................................................................................................................. 1
Supervisors .................................................................................................................................................... 1
Institution under whose umbrella the research project will be conducted .............................................. 1
Abstract ......................................................................................................................................................... 2
List of Tables ................................................................................................................................................. 4
List of Figures ................................................................................................................................................ 4
List of Appendices ......................................................................................................................................... 4
List of Abbreviations and Acronyms ........................................................................................................... 4
Introduction ................................................................................................................................................... 5
Literature Review ......................................................................................................................................... 6
Rationale ........................................................................................................................................................ 7
Broad Objective ............................................................................................................................................ 7
Specific Objectives ........................................................................................................................................ 7
Methods and Materials ................................................................................................................................. 8
Type of research study ........................................................................................................................ 8
Study place .......................................................................................................................................... 8
Study population ................................................................................................................................. 8
Inclusion criteria ................................................................................................................................. 8
Exclusion criteria ................................................................................................................................ 8
Selection criteria ................................................................................................................................. 8
Study period ........................................................................................................................................ 8
Sample size ......................................................................................................................................... 8
Data Collection ................................................................................................................................... 8
Data Management and Analysis ......................................................................................................... 9
Results ............................................................................................................................................................ 9
Conclusion ...................................................................................................................................................14
Recommendations .......................................................................................................................................14
Acknowledgements .....................................................................................................................................15
Appendices ...................................................................................................................................................15
Appendix 1: Data recording form .................................................................................................... 15
Appendix 2: Questionnaire for health centre management .............................................................. 16
Appendix 3: Graph showing incidence of Malaria in Malawi (reproduced from the Ministry of
Health Health Management Information System Bulletin Draft July 2005 to June 2006 (18) ......... 18
References ....................................................................................................................................................18
SP031310 FINAL REPORT_26 JUNE 2013
List of Tables
Table 1: Range of stock-outs duration of LA 6 Tab by month
Table 2: Range of stock-outs duration of LA 12 Tab by month
Table 3: Range of stock-outs duration of LA 18 Tab by month
Table 4: Range of stock-outs duration of LA 24 Tab by month
Table 5: Measure of the pharmacy stores manager’s ability to measure drug requirements and
procure drugs
Table 6: Measure of the manager’s use of drug management tools
List of Figures
Figure 1: Magnitude and trend of LA stock-outs
Figure 2: LA 6 Tab average stock-out duration by month
Figure 3: LA 12 Tab average stock-out duration by month
Figure 4: LA 18 Tab average stock-out duration by month
Figure 5: LA 24 Tab average stock-out duration by month
List of Appendices
Appendix 1: Data recording form
Appendix 2: Questionnaire for health centre management
Appendix 3: Graph showing incidence of Malaria in Malawi (reproduced from the Ministry
of Health, Health Management Information System Bulletin Draft July 2005 to
June 2006
List of Abbreviations and Acronyms
ACT : Artemisinin based Combination Therapy
CMS : Central Medical Stores
HSA : Health Surveillance assistant
IPTp : Intermittent Preventive Treatment in Pregnancy
IRS : Indoor Residual Spraying
ITN : Insecticide Treated Nets
LA : Artimether-Lumefantrine
PMI : United States Presidential Malaria Initiative
SP : Sulfadoxine-Pyrimethamine
Tab : Tablet
SP031310 FINAL REPORT_26 JUNE 2013
UNICEF: United Nations Children’s Fund
USAID: United States Aid for International Development
Introduction
Malaria is one of the leading causes of morbidity and mortality in Malawi with an estimate of
98% of the cases due to the Plasmodium Falciparum and the remaining 2% caused by
Plasmodium Ovale (1). For example, according to the ministry of health malaria still
accounts for 34% of all outpatient visits i. e six million suspected cases treated every year. It
is also noted that malaria remains the leading cause of hospitalizations among under five
children accounting for 40% of hospital admissions in this age group (1).
Many interventions have been rolled out to control malaria namely; use of Insecticide-treated
nets (ITNs), Indoor residual spraying (IRS), intermittent preventive treatment in pregnancy
(IPTp) and Case management. Case management involves the use of antimalarial
chemotherapy such as Artimether - Lumefantrine (LA) as a first-line therapy for
uncomplicated malaria (2).
In Malawi the current malaria treatment guideline that recommends the use of Artimether -
Lumefantrine (20mg/120mg) as first-line treatment for uncomplicated malaria was officially
launched in December 2007 after 14 years (1993 - 2007) of Sulfadoxine – Pyrimethamine
(SP) use whose efficiency had been compromised by parasite resistance (3) (4). The
Artemisinin based Combination Therapy (ACT) is dispensed for free for all ages in the public
sector.
Financing for the purchase and distribution of LA is done by United States Aid for
International Development (USAID) (under the Presidential Malaria Initiative (PMI)
program), the Malawi government, Global fund and also the World health organization
(through the United Nations Children’s Fund - UNICEF) in order of decreasing level of
contribution (2).
LA comes in packs of 24, 18, 12 and six tablets designed for specific age groups administered
in three days with an initial two dose spacing of 8 hours followed by 12 hour spaces between
doses. A stock-out in any of these packs hinders a particular age group from getting the
treatment. Stock-outs of the large packs can easily be improvised by the smaller packs for
example an adult may be given 4 six-tablet packs in cases where the health centre has run out
of the 24-tablet packs. However such a practice makes treatment costly as the cost of four six
tablet packs is by far higher than the cost of one 24 tablet pack (>150%) (5). Likewise, the
vice versa is not practical as issues of quality maintenance and contamination come in. For
instance, to give six tablets to a child would involve breaking the 24 tablet pack to count out
the tablets. In the absence of LA stock alternative anti-malarial prescribing is employed e. g
Quinine and sulfadoxine-pyrimethamine (SP) whose effectiveness is not guaranteed due to
parasite resistance (4).
In Malawian public health centres management of drug stocks including LA rests in the hands
of Health Surveillance Assistants (HSA) who have undergone drug management trainings and
continue going through seminars that equip them with the necessary basic skills in drug stock
SP031310 FINAL REPORT_26 JUNE 2013
management. Blantyre, Malawi’s commercial city, has no district hospital and hence the
majority of its residents depend on the health centres for medical attention from where a
referral to the tertiary Queen Elizabeth hospital is made. Being the first port of call for the
city’s residents, LA availability at all times cannot and should not be undermined. It is also
the wish of the government donor partners that LA is available at all times such that for
example children less than five years old take an antimalarial drug within 24 hours of the
commencement of fever (6).
Stock-outs of essential drugs is common news in the country and they have been reported on
various scales in different public domains like the media with worst cases occurring in the
early months of 2013 where stocks went below 5% at the Malawi Central Medical Stores (7).
LA is an essential medicine and the causes of stock-outs vary, but often reflect the weak drug
management systems of a country. Poorly resourced supply chains, bad stock management
practices, and inadequate lead-time planning can threaten the regular availability of drugs in
the public health system. In addition, unpredictable funding flows in many countries,
combined with inadequate distribution from central warehouses to peripheral points of care,
undermine the ability to ensure that essential drugs are always available at the last mile (8).
Malawi’s pharmaceutical management system has been plagued with problems. Stock outs of
antimalarials and other essential drugs occur regularly due to issues related to financing,
quantification, ordering, tendering, receipt, storage, and distribution (9).
Literature Review
Stock-outs of any drug in government health facilities results in health hazards and the
relapse of illnesses due to non-adherence to treatment regime and exposure to fake, expired,
and adulterated drugs as people turn to alternative health care in prayer houses, herbal homes,
patent medicine vendors, and traditional birth attendants (10). Frequent stock-outs of drugs
do not only deny patients of access to the drugs but also reflect a failure of the health system
to live up to its obligation consequently wearing out the trust people had in the health system
that indisputably diminishes health seeking behavior (11). In many African countries the
information about the existence of essential drugs stock-outs is everywhere but limited
accurate information exists on the magnitude and trend of the problem. It is worth noting that
publicizing ACT stock-outs is a crucial element to raise awareness of this problem and
initiate interventions aimed at elimination of ACT stock-outs at the point of care (12).
Despite pooled efforts by governments and the donor community essential drugs stock-outs
still haunt and threaten access to the first-line treatments in sub-Saharan African countries for
example those under the United States Presidential Malaria Initiative (PMI). In 2007 a cross
sectional retrospective study on the deficiency of drugs for life threatening diseases found out
that anti-malarial drugs were out of stock for periods ranging from 42 to 138 days in the
targeted 37 Lilongwe district health centres, Malawi, within a space of one year (13). In
addition to that, another research on the magnitude and trend of Artimether-Lumefantrine
stock-outs in 170 public health facilities in Kenya revealed that 11.6% of the facilities had no
any LA at the point of a random visit in 2012 (14).
SP031310 FINAL REPORT_26 JUNE 2013
LA stock-outs in health centres have also been marked as one of the major problems
impeding progress in the control of Malaria by the Christian Reformed World Relief
Committee in their October 29, 2010 annual report on Building Community Capacity to
Control Malaria in Central Malawi (3). In this paper we intend to report the magnitude and
trend of LA stock-outs in Blantyre district public health centres as well as the quality of drug
management skills of the drug store managers.
Rationale
Prompt treatment of uncomplicated malaria with effective anti-malarials is a cornerstone of
malaria control efforts, providing individual benefits by curing infection and preventing
progression to severe disease or death and community-level benefits by reducing the
infectious reservoir and thus averting the emergence and spread of drug resistance (15). As a
result there is need for determined efforts to ensure that all health facilities have the first line
therapy in stock throughout the year if at all timely treatment is to be realised. Lack of
sufficient information on the current situation of the magnitude and trend of Artimether –
Lumefantrine stock-outs in the Malawian health facilities make it impossible for
implementation of such activities.
Currently there is no record of what percentage of the health centres experience LA stock-
outs and which period of the year are the health centres mostly hit by the stock-outs. In this
study we have conducted a survey in the health centres in Blantyre in order to determine the
magnitude and the trend of LA stock-outs. Results of this research may help policy makers
empower the human resource with information through Continued Professional Development
in drug management as well as revise the quantities supplied to the health centres during the
period drug stock-outs are more likely. Information on the pharmaceutical sector is vital for
the optimal management of any essential drugs program (16).
Broad Objective
To assess the number of public health centres in Blantyre that experienced LA stock-outs
between November 2011 to April 2013 and the contributing management factors.
Specific Objectives
1. Determine the number of health centres with total LA stock-outs or at least one type
of LA pack stock-outs within the past 18 months.
2. Determine the trend (pattern) of LA stock-outs within the period November 2011 to
April 2013.
3. Assess the pharmacy managers’ ability to estimate drug requirements and procure
drugs.
4. Assess the pharmacy managers’ use of the drug stock management support tools (17).
5. Measure the association between LA stock-outs and poor/lack of use of various drug
management skills and tools.

SP031310 FINAL REPORT_26 JUNE 2013
Methods and Materials
Type of research study
The nature of our study design was a retrospective quantitative survey.
Study place
The study took place in Blantyre District.
Study population
Our study population was the public health centres in Blantyre District.
Inclusion criteria
The centre had to be a government/ public health centre and located within Blantyre
District.
Exclusion criteria
Any centre outside Blantyre or not public/ government based was excluded.
Selection criteria
We included every public health centre that is within Blantyre District.
Study period
The data was collected from the 6th
of May to 15th
of May 2013. Data entry and analysis
took place from the 16th
of May to the 24th
of May.
Sample size
There are 24 public health centres in Blantyre. Therefore since our study is a survey and
the population is manageable all health centres were included, so the sample size was 24.
Data Collection
To determine the number of health centres that experienced any type of stock-out and the
months that they experienced the stock-outs, we used the stock records of the clinics after
seeking consent from the management. We recorded the findings on our own data recording
forms (see appendix 1).
The drug management cycle consists of four important aspects namely: selection,
procurement, storage and distribution; and lastly use (17). In the public sector in Malawi the
selection is done at central level and the pharmacy managers in the health centres are mainly
responsible for the other parts of the cycle. In our study the main focus is to assess the
procurement skills and the use of important management tools. In public health centres
procurement consists of ordering drugs from the district health office or supplier (mostly a
donor). Drugs ordered from the district health office are those that are not on the donor’s list
and those that are on the donor’s list but have run out of stock before the next scheduled day
of delivery. To order drugs from the district health office exact quantities are requested but
ordering for drugs from the donors is done through writing reports on the amount of drugs
used monthly: based on the report the supplier will quantify the amount of drugs the health
centre should receive and sends them directly to the health centre. Direct delivery to health
centres contributes to an apparently smooth procurement process. Hence it is important for
the manager to know how to estimate drug requirements for their centre and also to know
SP031310 FINAL REPORT_26 JUNE 2013
how to use drug management tools. Therefore; to find out about the manager’s ability to
estimate drug requirements and procure drugs as well as level of use of management tools we
used a structured non-disguised questionnaire (see appendix 2) i. e the purpose of the study
was not hidden from the participants.
Data Management and Analysis
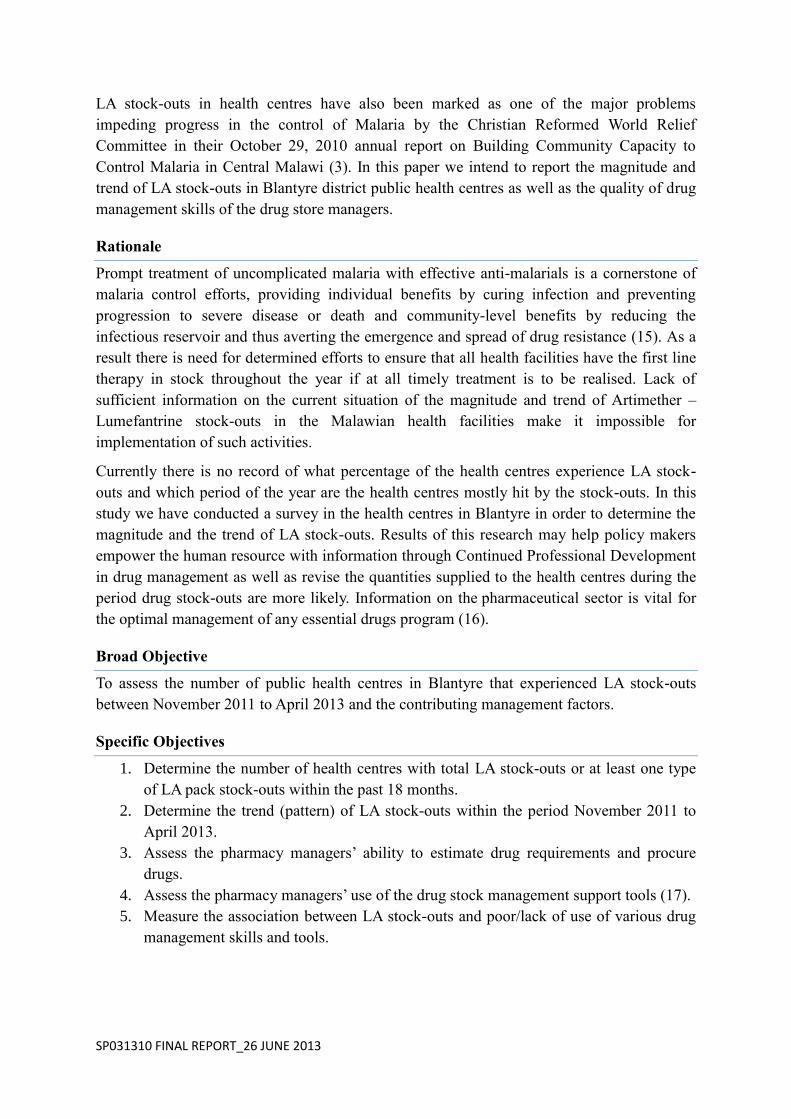
Data was entered into Microsoft Office Excel 2013. Using Microsoft Office Excel 2013
we presented magnitude of stock-outs in a line graph with the trend being indicated by shape
of the line. Questionnaires were used to assess the pharmacy manager’s ability to estimate
drug requirements and procure drugs, also to assess the pharmacy store manager’s use of the
drug stock management support tools. For each section a pass was given only to those who
scored either a 3 or 4 out of the 4 questions asked, where a pass represented by a one
indicated that one is able to calculate drug requirements and procure drugs correctly or use
management tools depending on the section. Procurement skills and use of management tools
results were entered into Microsoft Office Excel 2013. Analysis to find the percentage of drug
store managers who were able/unable to procure drugs correctly and use management support
tools especially stock record keeping correctly was done using EPI INFO version 3.5 and
represented in frequency tables. After collection and grouping of the data we measured the
association between stock-outs (binary-yes/no) and the correct use of management skills and
support tools (binary-able/unable) using the Phi (correlation) coefficient.
Results
We set out to collect data from 24 health centres but due to transport constraints we only
managed to visit 23 health centres and of those 23, six of the managers were not present
during our visit, therefore only 17 questionnaires were filled.
0
10
20
30
40
50
60
70
80
90
100
N O V 1 1
D E C 1 1
J A N 1 2
F E B 1 2
M A R 1 2
A P R 1 2
M A Y 1 2
J U N 1 2
J U L 1 2
A U G 1 2
S E P 1 2
O C T 1 2
N O V 1 2
D E C 1 2
J A N 1 3
F E B 1 3
M A R 1 3
A P R 1 3 P
ERC
ENTA
GE
OF
HEA
LTH
CEN
TRES
WIT
H S
TOC
KO
UT
MONTH-YEAR
F I G U R E 1 : M A G N I T U D E A N D T R EN D O F L A S T O C K - O U T S
6 Tab 12 Tab 18 Tab 24 Tab All within 1 month
SP031310 FINAL REPORT_26 JUNE 2013
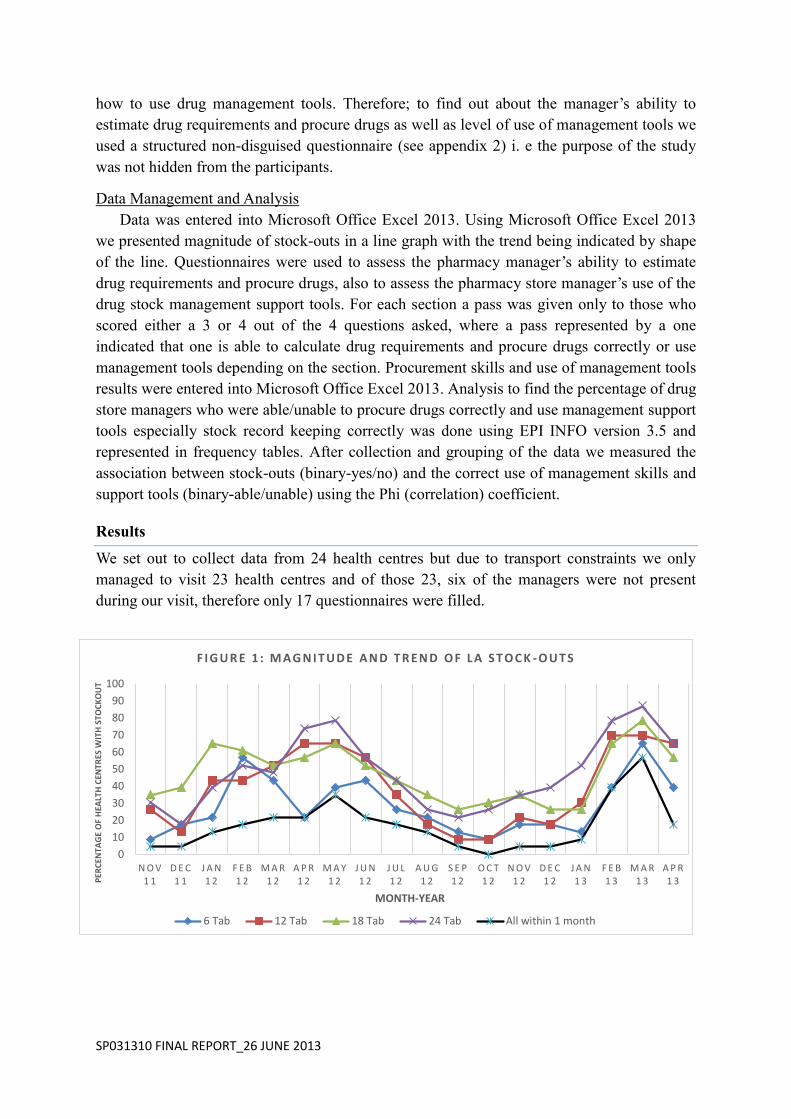
Table 1: Range of stock-outs duration of LA 6 Tab by month
Month NOV 11
DEC 11
JAN 12
FEB 12
MAR 12
APR 12
MAY 12
JUN 12
JUL 12
AUG 12
SEP 12
OCT 12
NOV 12
DEC 12
JAN 13
FEB 13
MAR 13
APR 13
Range (days)
17-19 1-9 6-31 2-19 1-27 2-30 1-20 2-30 9-27 1-16
10-13 1-10 1-17 1-5 3-7 1-28 3-21 1-26
Table 2: Range of stock-outs duration of LA 12 Tab by month
Month NOV 11
DEC 11
JAN 12
FEB 12
MAR 12
APR 12
MAY 12
JUN 12
JUL 12
AUG 12
SEP 12
OCT 12
NOV 12
DEC 12
JAN 13
FEB 13
MAR 13
APR 13
Range (days)
3-18 2-9
1-31 2-20 1-29 3-30 2-27 2-20 3-28 3-28
12-27 2-11 1-7 9-16 1-9 3-24 1-31 1-28
18
4
16.2
8.8
14.5 15.4
8
12.2
15.8
8.8
11
5.5
8.3
2.8 4.7
7.4
12 13.2
NOV11
DEC11
JAN12
FEB12
MAR12
APR12
MAY12
JUN12
JUL 12 AUG12
SEP12
OCT12
NOV12
DEC12
JAN13
FEB13
MAR13
APR13
Du
rati
on
of
sto
ck-o
ut
(day
s)
Month-Year
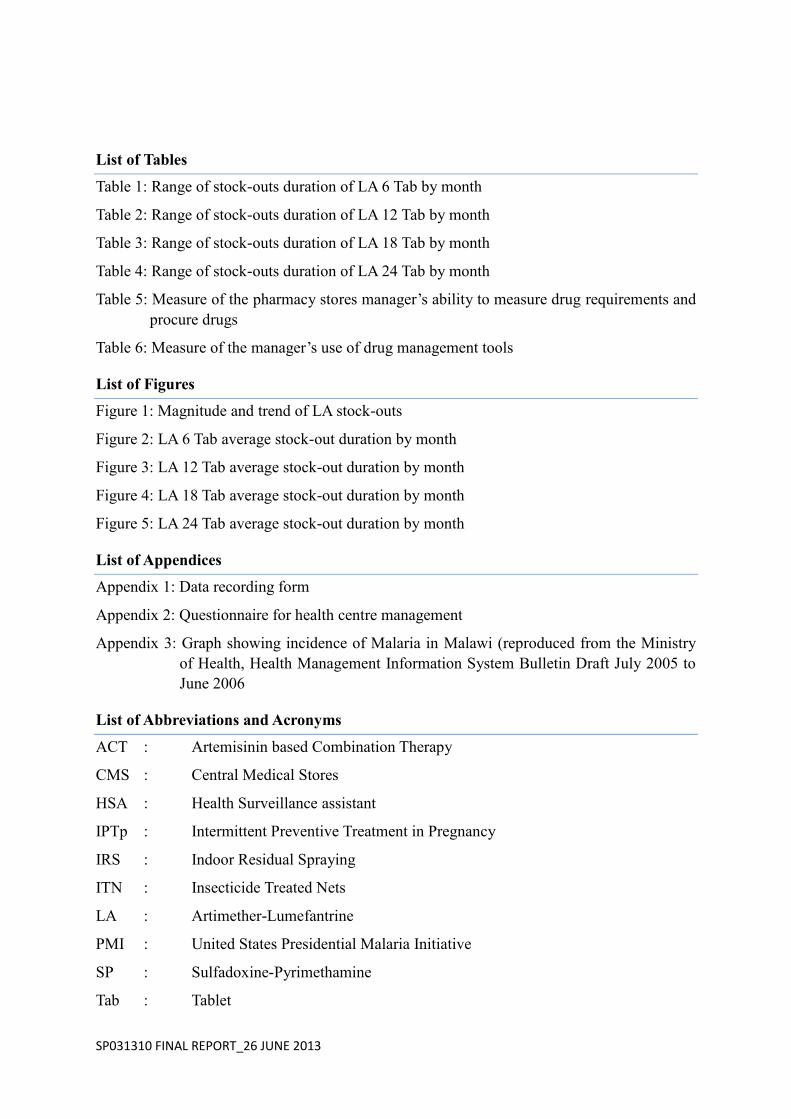
Figure 2: LA 6 Tab average stock-out duration by month
11.3
5
13.8
10.6 12.3 11.9
14.7
9.2 11.3 12.5
19.5
6.5 3
12.3
5
13.4
17.9
11.1
NOV11
DEC11
JAN12
FEB12
MAR12
APR12
MAY12
JUN12
JUL12
AUG12
SEP12
OCT12
NOV12
DEC12
JAN13
FEB13
MAR13
APR13D
ura
tio
n o
f st
ock
-ou
t (d
ays)
Month-Year
Figure 3: LA 12 Tab average stock-out duration by month
SP031310 FINAL REPORT_26 JUNE 2013
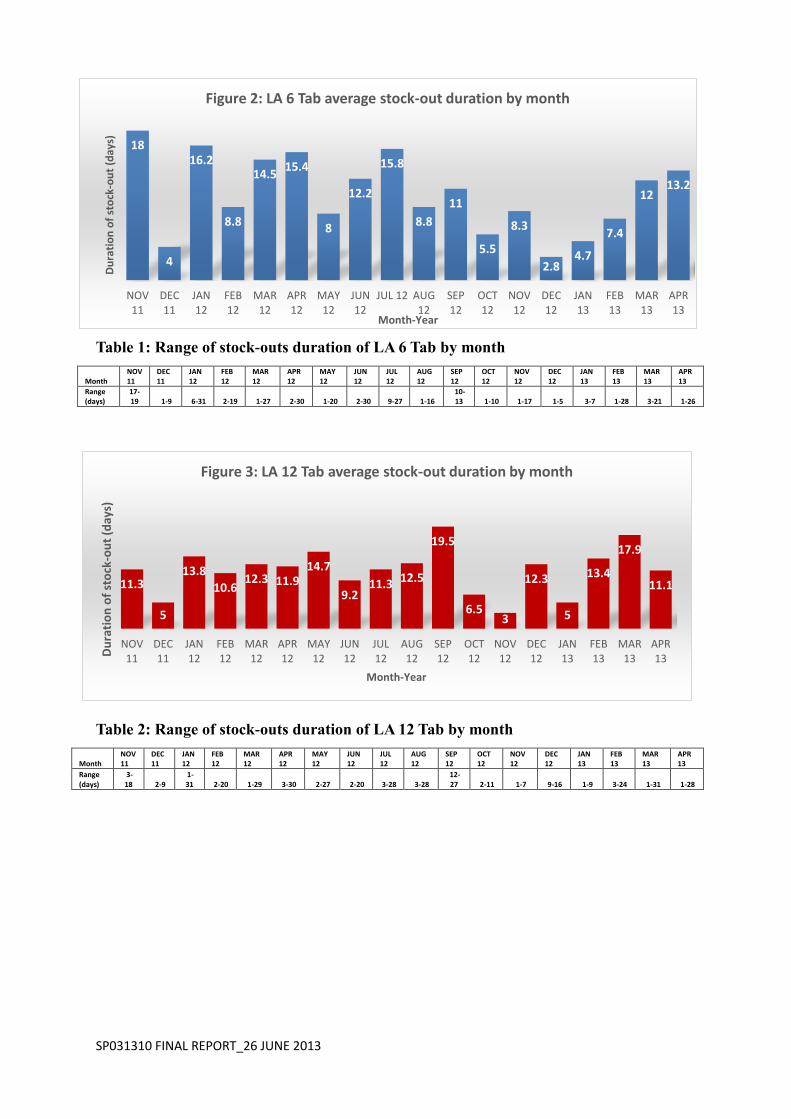
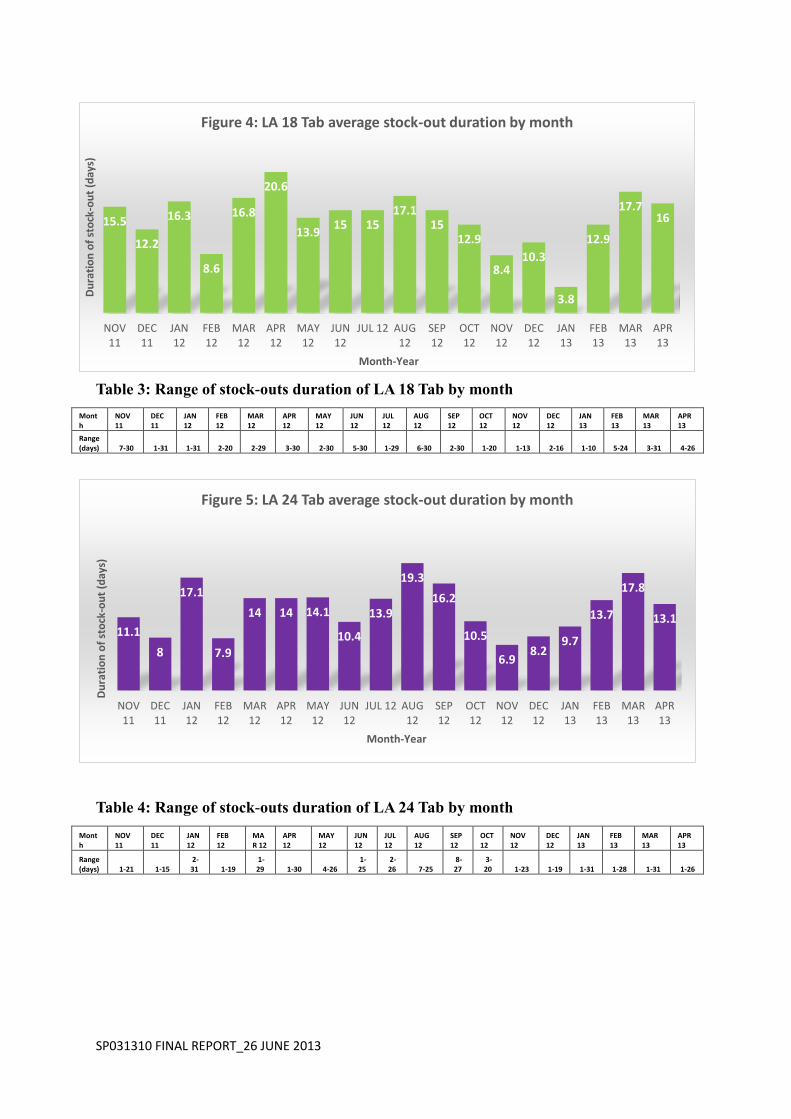
Table 3: Range of stock-outs duration of LA 18 Tab by month
Month
NOV 11
DEC 11
JAN 12
FEB 12
MAR 12
APR 12
MAY 12
JUN 12
JUL 12
AUG 12
SEP 12
OCT 12
NOV 12
DEC 12
JAN 13
FEB 13
MAR 13
APR 13
Range (days) 7-30 1-31 1-31 2-20 2-29 3-30 2-30 5-30 1-29 6-30 2-30 1-20 1-13 2-16 1-10 5-24 3-31 4-26
Table 4: Range of stock-outs duration of LA 24 Tab by month
Month
NOV 11
DEC 11
JAN 12
FEB 12
MAR 12
APR 12
MAY 12
JUN 12
JUL 12
AUG 12
SEP 12
OCT 12
NOV 12
DEC 12
JAN 13
FEB 13
MAR 13
APR 13
Range (days) 1-21 1-15
2-31 1-19
1-29 1-30 4-26
1-25
2-26 7-25
8-27
3-20 1-23 1-19 1-31 1-28 1-31 1-26
15.5
12.2
16.3
8.6
16.8
20.6
13.9 15 15
17.1 15
12.9
8.4 10.3
3.8
12.9
17.7 16
NOV11
DEC11
JAN12
FEB12
MAR12
APR12
MAY12
JUN12
JUL 12 AUG12
SEP12
OCT12
NOV12
DEC12
JAN13
FEB13
MAR13
APR13
Du
rati
on
of
sto
ck-o
ut
(day
s)
Month-Year
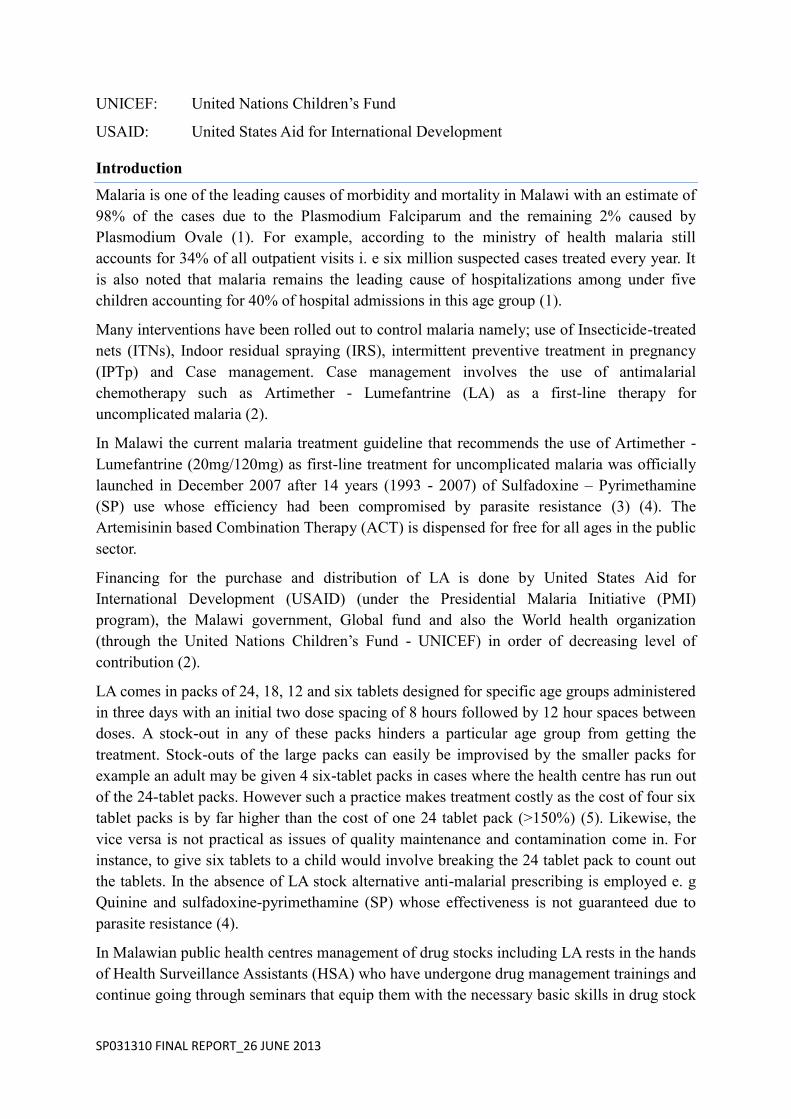
Figure 4: LA 18 Tab average stock-out duration by month
11.1
8
17.1
7.9
14 14 14.1
10.4
13.9
19.3
16.2
10.5
6.9 8.2
9.7
13.7
17.8
13.1
NOV11
DEC11
JAN12
FEB12
MAR12
APR12
MAY12
JUN12
JUL 12 AUG12
SEP12
OCT12
NOV12
DEC12
JAN13
FEB13
MAR13
APR13
Du
rati
on
of
sto
ck-o
ut
(day
s)
Month-Year
Figure 5: LA 24 Tab average stock-out duration by month
SP031310 FINAL REPORT_26 JUNE 2013
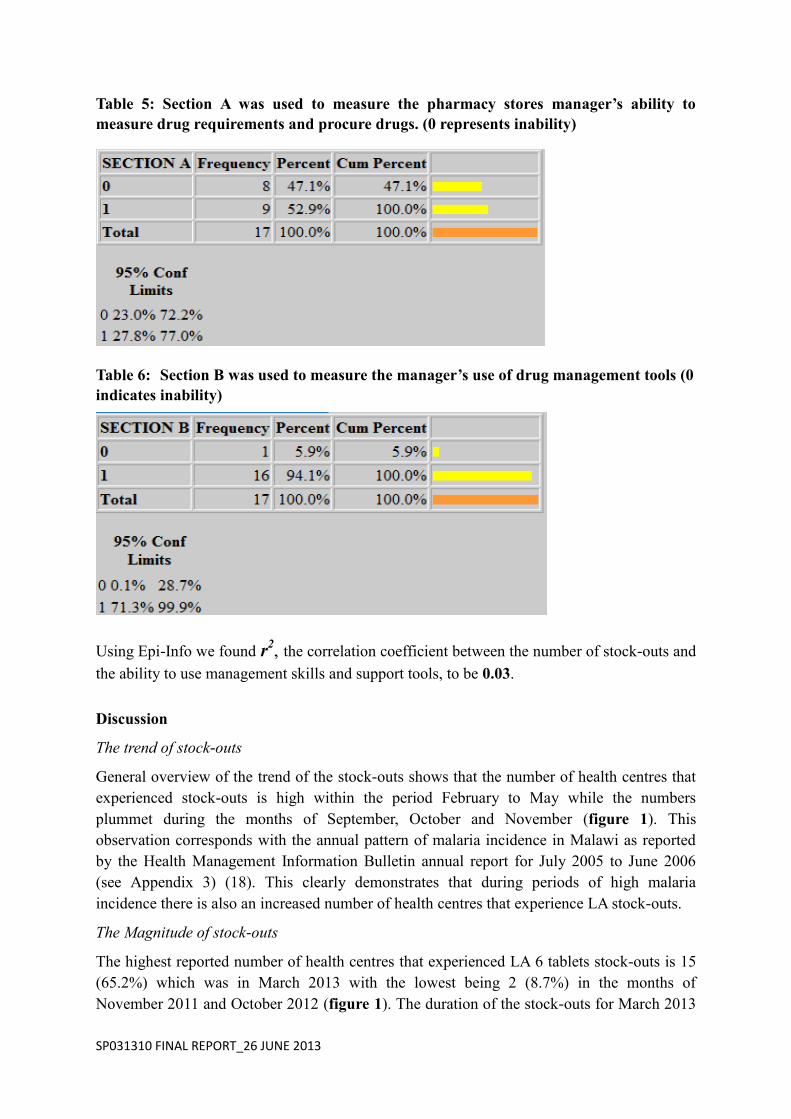
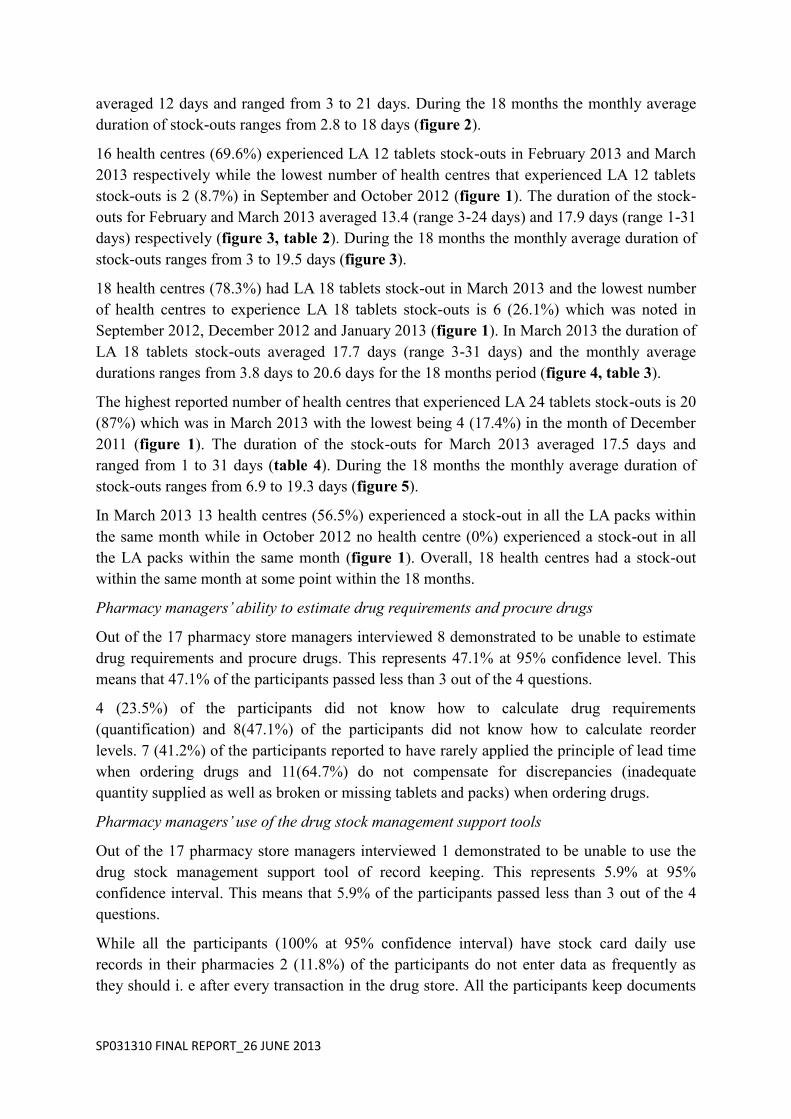
Table 5: Section A was used to measure the pharmacy stores manager’s ability to
measure drug requirements and procure drugs. (0 represents inability)
Table 6: Section B was used to measure the manager’s use of drug management tools (0
indicates inability)
Using Epi-Info we found r2, the correlation coefficient between the number of stock-outs and
the ability to use management skills and support tools, to be 0.03.
Discussion
The trend of stock-outs
General overview of the trend of the stock-outs shows that the number of health centres that
experienced stock-outs is high within the period February to May while the numbers
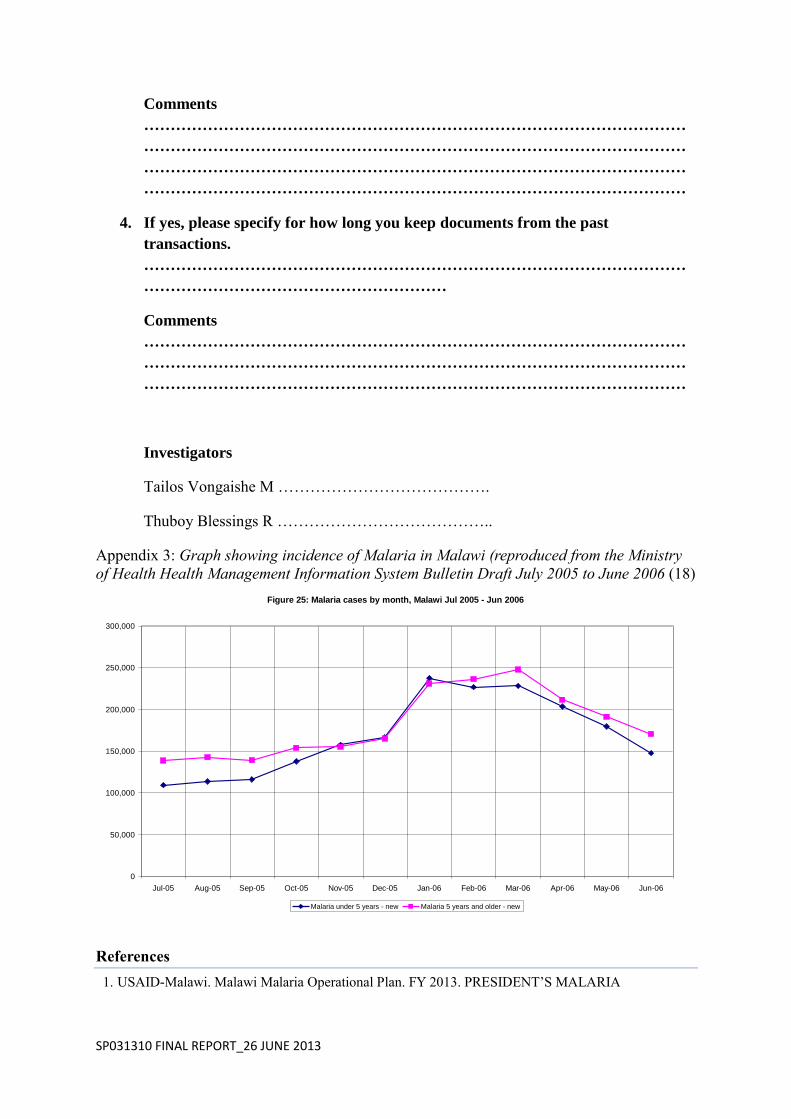
plummet during the months of September, October and November (figure 1). This
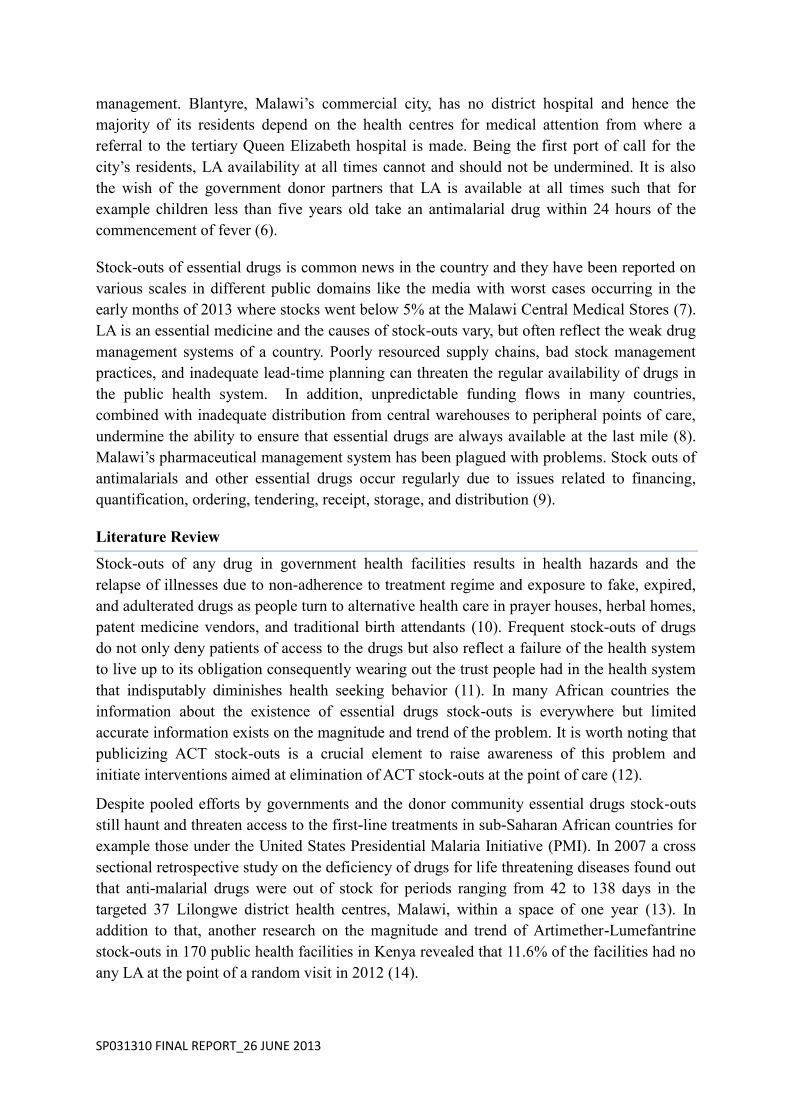
observation corresponds with the annual pattern of malaria incidence in Malawi as reported
by the Health Management Information Bulletin annual report for July 2005 to June 2006
(see Appendix 3) (18). This clearly demonstrates that during periods of high malaria
incidence there is also an increased number of health centres that experience LA stock-outs.
The Magnitude of stock-outs
The highest reported number of health centres that experienced LA 6 tablets stock-outs is 15
(65.2%) which was in March 2013 with the lowest being 2 (8.7%) in the months of
November 2011 and October 2012 (figure 1). The duration of the stock-outs for March 2013
SP031310 FINAL REPORT_26 JUNE 2013
averaged 12 days and ranged from 3 to 21 days. During the 18 months the monthly average
duration of stock-outs ranges from 2.8 to 18 days (figure 2).
16 health centres (69.6%) experienced LA 12 tablets stock-outs in February 2013 and March
2013 respectively while the lowest number of health centres that experienced LA 12 tablets
stock-outs is 2 (8.7%) in September and October 2012 (figure 1). The duration of the stock-
outs for February and March 2013 averaged 13.4 (range 3-24 days) and 17.9 days (range 1-31
days) respectively (figure 3, table 2). During the 18 months the monthly average duration of
stock-outs ranges from 3 to 19.5 days (figure 3).
18 health centres (78.3%) had LA 18 tablets stock-out in March 2013 and the lowest number
of health centres to experience LA 18 tablets stock-outs is 6 (26.1%) which was noted in
September 2012, December 2012 and January 2013 (figure 1). In March 2013 the duration of
LA 18 tablets stock-outs averaged 17.7 days (range 3-31 days) and the monthly average
durations ranges from 3.8 days to 20.6 days for the 18 months period (figure 4, table 3).
The highest reported number of health centres that experienced LA 24 tablets stock-outs is 20
(87%) which was in March 2013 with the lowest being 4 (17.4%) in the month of December
2011 (figure 1). The duration of the stock-outs for March 2013 averaged 17.5 days and
ranged from 1 to 31 days (table 4). During the 18 months the monthly average duration of
stock-outs ranges from 6.9 to 19.3 days (figure 5).
In March 2013 13 health centres (56.5%) experienced a stock-out in all the LA packs within
the same month while in October 2012 no health centre (0%) experienced a stock-out in all
the LA packs within the same month (figure 1). Overall, 18 health centres had a stock-out
within the same month at some point within the 18 months.
Pharmacy managers’ ability to estimate drug requirements and procure drugs
Out of the 17 pharmacy store managers interviewed 8 demonstrated to be unable to estimate
drug requirements and procure drugs. This represents 47.1% at 95% confidence level. This
means that 47.1% of the participants passed less than 3 out of the 4 questions.
4 (23.5%) of the participants did not know how to calculate drug requirements
(quantification) and 8(47.1%) of the participants did not know how to calculate reorder
levels. 7 (41.2%) of the participants reported to have rarely applied the principle of lead time
when ordering drugs and 11(64.7%) do not compensate for discrepancies (inadequate
quantity supplied as well as broken or missing tablets and packs) when ordering drugs.
Pharmacy managers’ use of the drug stock management support tools
Out of the 17 pharmacy store managers interviewed 1 demonstrated to be unable to use the
drug stock management support tool of record keeping. This represents 5.9% at 95%
confidence interval. This means that 5.9% of the participants passed less than 3 out of the 4
questions.
While all the participants (100% at 95% confidence interval) have stock card daily use
records in their pharmacies 2 (11.8%) of the participants do not enter data as frequently as
they should i. e after every transaction in the drug store. All the participants keep documents

SP031310 FINAL REPORT_26 JUNE 2013
from past transactions but 17.6% of the participants accidentally lose some of the documents
kept within less than three years.
Association between management skills and stock-outs
R which is the measure of association or relationship between poor management skills and
stock-outs is 0.17. This shows that there is an association between the two but it is quiet weak
(because R is not close to one). The correlation coefficient (R2) is 0.03; meaning that only 3%
of the stock-outs can be attributed to poor or lack of management skills.
Conclusion
March 2013 is the month that experienced the most stock-outs in all categories and we
continue to experience large number of stock-outs in the months of February to May despite
existence of evidence that this is the period with highest malaria incidence in Malawi since
2006 (18). None of the months within the 18 month period under study had a zero stock-out
in any of the LA packs. Close to half of the participants (pharmacy managers) had problems
with estimation of drug requirements and procurement mainly in the areas of use of lead time,
calculating reorder levels and compensation of discrepancies. Most of the participants have
good record keeping practices although accidental losses may occur once in a while.
Our research findings show that there is weak association between ability to use management
skills and support tools and stock-outs. This suggests that there are other factors that
contribute to the stock-outs. Although our focus was mainly on management factors,
participants reported that inadequate LA quantities delivered by the supplier in relation to
demand, frequent stock-outs at the district health office drug store and delayed transportation
were some of the contributing factors to the stock-outs.
Recommendations
Since the trend shows an increase in stock-outs with increasing incidence of malaria we
recommend forecasting methods be revised with emphasis on use of current data on the
pattern of malaria incidence in Malawi. We also recommend that the size of the catchment
areas of some of the health centres should be revised due to the magnitude and frequency of
some of the stock-outs.
Considering that most health centres reported transport delays as one of the causes of the
stock-outs we suggest that measures should be taken to ensure timely delivery of drugs
ordered from the district health office drug store. Since the DHO orders drugs from the
central medical stores and then distribute them to health centres, this could be a reasonable
bottleneck in the supply chain. Hence we suggest direct delivery of drugs from the central
medical stores to the health centres.
With regard to ability of the pharmacy managers to use management skills we recommend
further training in basic requirements estimation and procurement skills i. e quantification,
use of lead time, calculation of reorder levels and compensation for discrepancies.
We also recommend improvement of document storage through the use of storage cabinets.
SP031310 FINAL REPORT_26 JUNE 2013
Lastly we recommend that further studies should be done to closely look into other possible
factors leading to stock-outs e. g financing programs, transport delays and outdated
information on size of the catchment area.
Acknowledgements
We would like to extend our gratitude to the following for their contribution to our study; our
supervisors Mr R Mwale and Mr W Chalira, The Blantyre District Health Office for the
authorization of the research and assistance, Health Centre managers, Mr Kumitawa
(Statistician) and the undergraduate research coordinator – Sarah White.
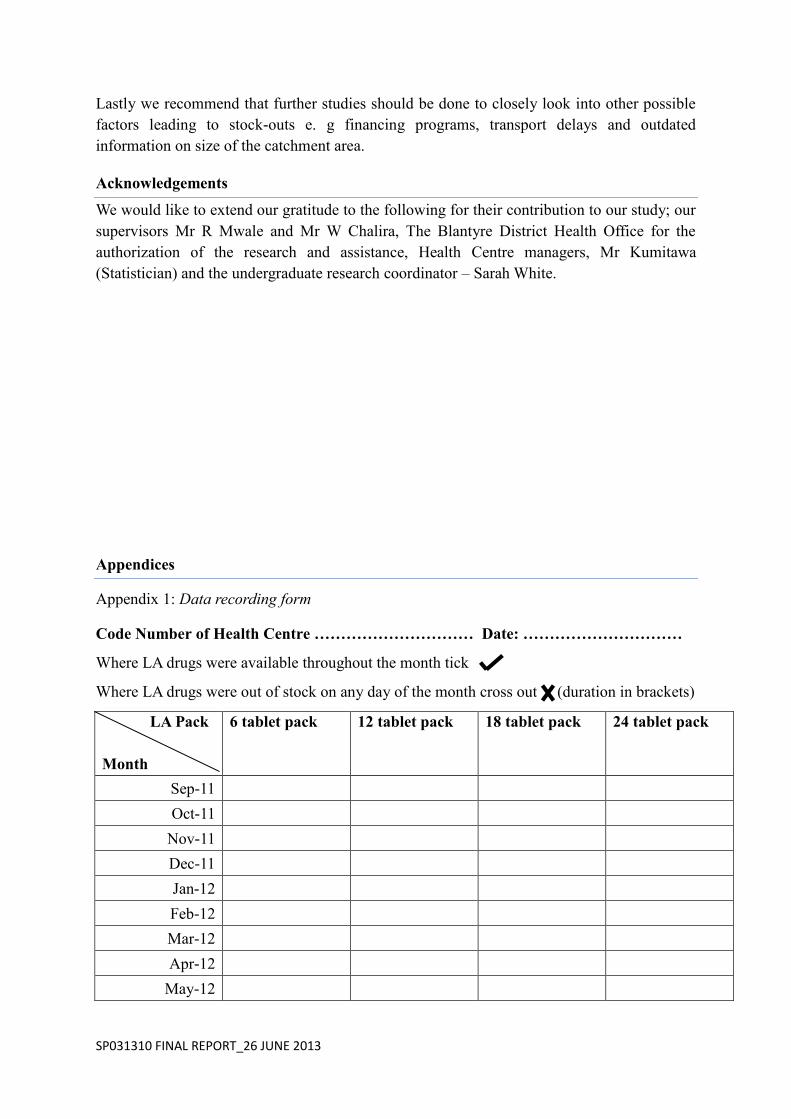
Appendices
Appendix 1: Data recording form
Code Number of Health Centre ………………………… Date: …………………………
Where LA drugs were available throughout the month tick
Where LA drugs were out of stock on any day of the month cross out (duration in brackets)
LA Pack
Month
6 tablet pack 12 tablet pack 18 tablet pack 24 tablet pack
Sep-11
Oct-11
Nov-11
Dec-11
Jan-12
Feb-12
Mar-12
Apr-12
May-12
SP031310 FINAL REPORT_26 JUNE 2013
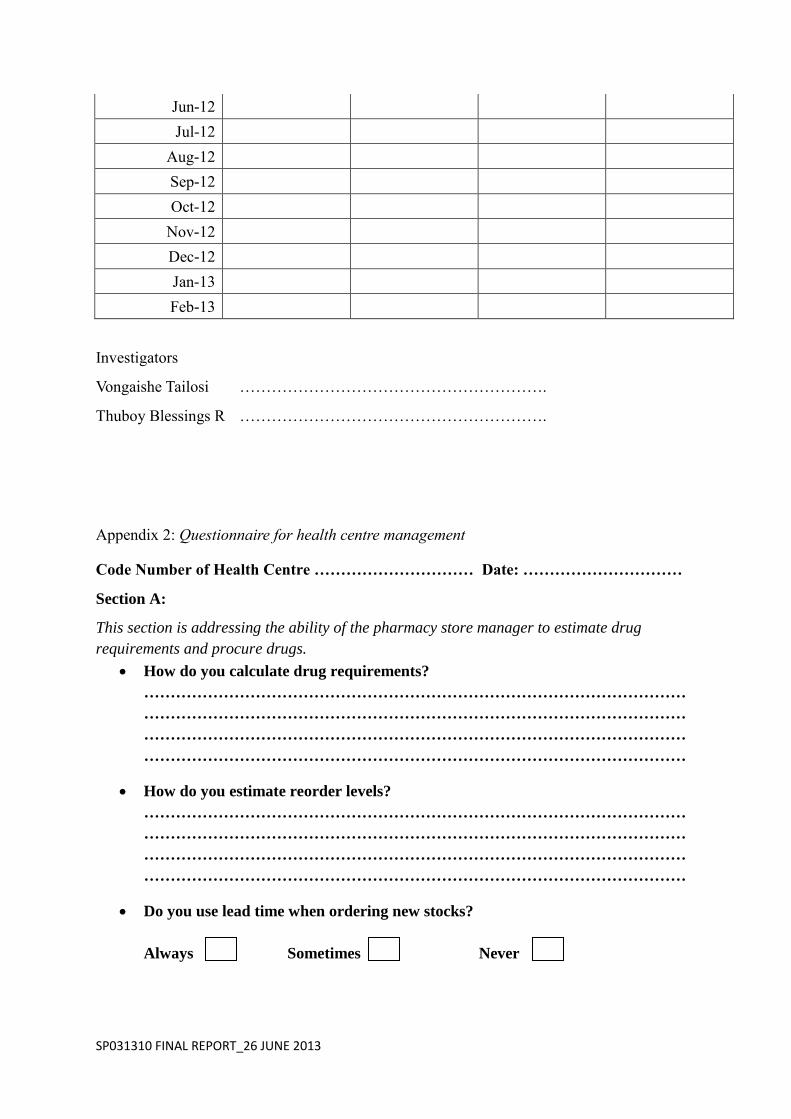
Jun-12
Jul-12
Aug-12
Sep-12
Oct-12
Nov-12
Dec-12
Jan-13
Feb-13
Investigators
Vongaishe Tailosi ………………………………………………….
Thuboy Blessings R ………………………………………………….
Appendix 2: Questionnaire for health centre management
Code Number of Health Centre ………………………… Date: …………………………
Section A:
This section is addressing the ability of the pharmacy store manager to estimate drug
requirements and procure drugs.
How do you calculate drug requirements?
…………………………………………………………………………………………
…………………………………………………………………………………………
…………………………………………………………………………………………
…………………………………………………………………………………………
How do you estimate reorder levels?
…………………………………………………………………………………………
…………………………………………………………………………………………
…………………………………………………………………………………………
…………………………………………………………………………………………
Do you use lead time when ordering new stocks?
Always Sometimes Never
SP031310 FINAL REPORT_26 JUNE 2013
Comments
…………………………………………………………………………………………
…………………………………………………………………………………………
…………………………………………………………………………………………
………………………………………………………………………………………….
How often do you compensate for discrepancies in drugs supplied from the
central medical stores?
Always Sometimes Never
Comments
…………………………………………………………………………………………
…………………………………………………………………………………………
…………………………………………………………………………………………
…………………………………………………………………………………………
Section B:
This section is addressing the quality of the pharmacy store manager’s use of drug
management tools.
1. Do you have stock cards daily use records in the pharmacy store?
Yes No
Comments
…………………………………………………………………………………………
…………………………………………………………………………………………
…………………………………………………………………………………………
…………………………………………………………………………………………
2. How often do you use of stock cards daily use records?
Always Sometimes Never
Comments
…………………………………………………………………………………………
…………………………………………………………………………………………
…………………………………………………………………………………………
…………………………………………………………………………………………
3. Do you keep documents from the past transactions?
Yes No
SP031310 FINAL REPORT_26 JUNE 2013
Comments
…………………………………………………………………………………………
…………………………………………………………………………………………
…………………………………………………………………………………………
…………………………………………………………………………………………
4. If yes, please specify for how long you keep documents from the past
transactions.
…………………………………………………………………………………………
…………………………………………………
Comments
…………………………………………………………………………………………
…………………………………………………………………………………………
…………………………………………………………………………………………
Investigators
Tailos Vongaishe M ………………………………….
Thuboy Blessings R …………………………………..
Appendix 3: Graph showing incidence of Malaria in Malawi (reproduced from the Ministry
of Health Health Management Information System Bulletin Draft July 2005 to June 2006 (18)
References
1. USAID-Malawi. Malawi Malaria Operational Plan. FY 2013. PRESIDENT’S MALARIA
Figure 25: Malaria cases by month, Malawi Jul 2005 - Jun 2006
0
50,000
100,000
150,000
200,000
250,000
300,000
Jul-05 Aug-05 Sep-05 Oct-05 Nov-05 Dec-05 Jan-06 Feb-06 Mar-06 Apr-06 May-06 Jun-06
Malaria under 5 years - new Malaria 5 years and older - new

SP031310 FINAL REPORT_26 JUNE 2013
INITIATIVE.
2. World Health Organisation W. Malawi Profile. World Malaria Report. ; 2012.
3. SPS CfPM. National Malaria Control Program Supervision Report for Monitoring ACT and Malaria
Control Activities. Lilongwe: Republic of Malawi, Malawi Ministry of Health; 2008.
4. Bernadette Hensen LSPRSJBCJJW. Taking stock: provider prescribing practices in the presence and
absence of ACT stock. Malaria Journal. 2011; 218(10).
5. Norvatis Pharma S. Health Worker Information Book. 2013. Coartem.
6. USAID C. THE PRESIDENT’S MALARIA INITIATIVE REPORT TO CONGRESS. Seventh Annual
Report to Congress. , US Department of Health and Human services; 2013.
7. CHIBAYA S. The Nation Online. [Online].; 2013 [cited 2013 May. Available from:
http://www.mwnation.com/national-news-the-nation/15057-malawi-hospitals-lack-95-drugs.
8. MMV: Medicines for Malaria Venture. [Online]. [cited 2013 April. Available from:
http://www.mmv.org/achievements-challenges/challenges/stock-outs.
9. USAID-Malawi. Malawi Malaria Operational Plan. FY 2012. Year Six.
10. Ikoh MU UACACJ. The influence of "stock out" on health-seeking behavior of low income women in
Uyo urban, Akwa Ibom State, Nigeria. International Quaterly of Community Health Educucation.
2008-2009; 29(3).
11. Martha Embrey. Towards Sustainable Access To Medicines. In Martha Embrey MRLG, editor. MDS-3:
Managing Access to Medicines and Health Technologies. Arlington, VA: Management Sciences
for Health; 2012. p. 1.4.
12. Time for a "Third Wave" of malaria activism to tackle the drug stock-out crisis. PLoS Medicine. 2009
Nov; 6(11).
13. Norman N Lufesi MAIA. Deficient supplies of drugs for life threatening diseases in an African
community. BMC Health Services Research. 2007 June; 7(86).
14. Sudoi RK, Githinji S, Nyandigisi A, Muturi A, Snow RW, Zurovac D. The magnitude and trend of
artemether-lumefantrine stock-outs at public health centres in Kenya. 2012; 11(1).
15. Chirwa E, Msadala M. World Health Organisation. [Online].; 2008 [cited 2012 May 25. Available
from: http://apps.who.int/medicinedocs/documents/s18367en/s18367en.pdf.
16. Trap B, Chinyanganya FW, Hogerzeil HV, Nathoo KJ, Chidarikire A, Moore H. Worl Health
Organisation. [Online].; 2004 [cited 2012 May 29. Available from:
http://apps.who.int/medicinedocs/documents/s14116e/s14116e.pdf.
17. Chalira WC, Chisale M, Emafo P, Mballa RN, Ofori-Adjei D, Razafindrakoto AN. World Health
Organisation. [Online].; 2004 [cited 2012 June 02. Available from:
http://apps.who.int/medicinedocs/pdf/s7919e/s7919e.pdf.
18. Health Management Information Bulletin. Annual Report. Lilongwe: Ministry of Health, Planning Dpt,
SP031310 FINAL REPORT_26 JUNE 2013
Health Management Unit; July 2005 - June 2006.