Competing technologies: Lock-ins and lock-outs
15
Competing Technologies: Lock-ins and Lock-outs Loet Leydesdorff Department of Science & Technology Dynamics, Nieuwe Achtergracht 166, 1018 WV Amsterdam, The Netherlands; <[email protected]> & Peter Van den Besselaar Department of Social Science Informatics, Roetersstraat 15, 1018 WB Amsterdam, The Netherlands; <[email protected]> Abstract W. Brian Arthur’s model for competing technologies is discussed from the perspective of evolution theory. Using Arthur’s own model for the simulation, we show that ‘lock-ins’ can be suppressed by adding reflexivity or uncertainty on the side of consumers. Competing technologies then tend to remain in competition. From an evolutionary perspective, lock-ins and prevailing equilibrium can be considered as different trajectories of the techno-economic systems under study. Our simulation results suggest that technological developments which affect the natural preferences of consumers do not induce changes in trajectory, while changes in network parameters of a technology sometimes induce ordered substitution processes. These substitution processes have been shown empirically (e.g., Fisher & Prey, 1971), but hitherto they have been insufficiently understood from the perspective of evolutionary modelling. The dynamics of the selective network determine the possible dissolution of a lock-in given the presence of competing technologies. Keywords: competition, lock-in, alternative technologies, substitution, trajectory 1. Introduction Arthur (1988a, 1988b, 1989) specified why one expects a lock-in in the case of competing technologies, randomness in initial purchasing behaviour, and absorbing barriers because of network effects. A random walk will necessarily reach one of the barriers. In an evolutionary model, the absorbing barriers can also be considered as selectors on the variation. Since Arthur’s model was specified with reference to competing technologies, the selection environments are then market segments. In this study, we use Arthur’s model for a discussion of lock-ins from the perspective of evolution theory. Using comparable simulations, we first show that one does not need the assumption of absorbing barriers in order to find lock-ins as a result of random walks. If a network effect (that is, a path-dependency upon previous adopters) is assumed, lock-ins can be generated endogenously. Second, we discuss the economic interpretation of these effects in terms of consumer behaviour on markets. We shall show that under realistic assumptions, continuing competition is a third trajectory, in addition to lock-in on either side. Third, we focus on ‘lock-out’: under which conditions will technologies that have been locked-in be able to leap out? In a final section, our results are interpreted in terms of non-linear dynamics.
Transcript of Competing technologies: Lock-ins and lock-outs
Competing Technologies: Lock-ins and Lock-outs
Loet Leydesdorff Department of Science & Technology Dynamics,
Nieuwe Achtergracht 166, 1018 WV Amsterdam, The Netherlands; <[email protected]>
& Peter Van den Besselaar
Department of Social Science Informatics, Roetersstraat 15, 1018 WB Amsterdam, The Netherlands;
<[email protected]> Abstract W. Brian Arthur’s model for competing technologies is discussed from the perspective of evolution theory. Using Arthur’s own model for the simulation, we show that ‘lock-ins’ can be suppressed by adding reflexivity or uncertainty on the side of consumers. Competing technologies then tend to remain in competition. From an evolutionary perspective, lock-ins and prevailing equilibrium can be considered as different trajectories of the techno-economic systems under study. Our simulation results suggest that technological developments which affect the natural preferences of consumers do not induce changes in trajectory, while changes in network parameters of a technology sometimes induce ordered substitution processes. These substitution processes have been shown empirically (e.g., Fisher & Prey, 1971), but hitherto they have been insufficiently understood from the perspective of evolutionary modelling. The dynamics of the selective network determine the possible dissolution of a lock-in given the presence of competing technologies. Keywords: competition, lock-in, alternative technologies, substitution, trajectory 1. Introduction Arthur (1988a, 1988b, 1989) specified why one expects a lock-in in the case of competing technologies, randomness in initial purchasing behaviour, and absorbing barriers because of network effects. A random walk will necessarily reach one of the barriers. In an evolutionary model, the absorbing barriers can also be considered as selectors on the variation. Since Arthur’s model was specified with reference to competing technologies, the selection environments are then market segments. In this study, we use Arthur’s model for a discussion of lock-ins from the perspective of evolution theory. Using comparable simulations, we first show that one does not need the assumption of absorbing barriers in order to find lock-ins as a result of random walks. If a network effect (that is, a path-dependency upon previous adopters) is assumed, lock-ins can be generated endogenously. Second, we discuss the economic interpretation of these effects in terms of consumer behaviour on markets. We shall show that under realistic assumptions, continuing competition is a third trajectory, in addition to lock-in on either side. Third, we focus on ‘lock-out’: under which conditions will technologies that have been locked-in be able to leap out? In a final section, our results are interpreted in terms of non-linear dynamics.
2. Arthur’s (1988) model Arthur generalized his model from so-called Pólya-urn models for the purposes of studying economic processes like standardization, network effects, and so-called ‘increasing returns’ (David 1985; cf. Arthur 1990). As in the case of path-dependency in the probabilities of drawings in urn models, one can assume that the choices made by previous adopters from among competing technologies will matter for individual consumers (Leydesdorff 1992; 1995). While an adopter may have a given (‘natural’) inclination toward one technology, this preference can be modified by information about the market shares of various technologies. For example, even if one wished nowadays to buy a video cassette recorder using a system other than VHS, one would soon realize the need to conform to this standard in order to profit from the apparatus given current market conditions. Standardization tends to lock a prevailing technology and a market into each other (David & Foray 1994). This lock-in is caused by ‘network externalities’ in the diffusion phase like technological interrelatedness, learning by doing, or economies of scale and scope. Arthur (1988a, 1988b, 1989) distinguished two technologies which he labeled A and B. Additionally, he assumed two types of agents, R and S, with different ‘natural inclinations’ towards A and B. R-agents have a natural inclination aR towards type A technology, and a lower inclination bR towards B. Similarly, one can attribute parameters aS and bS to S-agents (bS > aS). The network effects are modelled as independent terms, again differently for R-type agents and S-type agents. The appeal of a technology is increased by previous adopters with a term r for R-type agents, and s for S-type agents. These assumptions lead to the following model: Technology A Technology B
R-agent aR + rnA bR + rnB
S-agent aS + snA bS + snB
Table 1. Returns to adopting A or B, given nA and nB previous adopters of A and B. (The model assumes that aR > bR and that bS > aS. Both r and s are positive.)
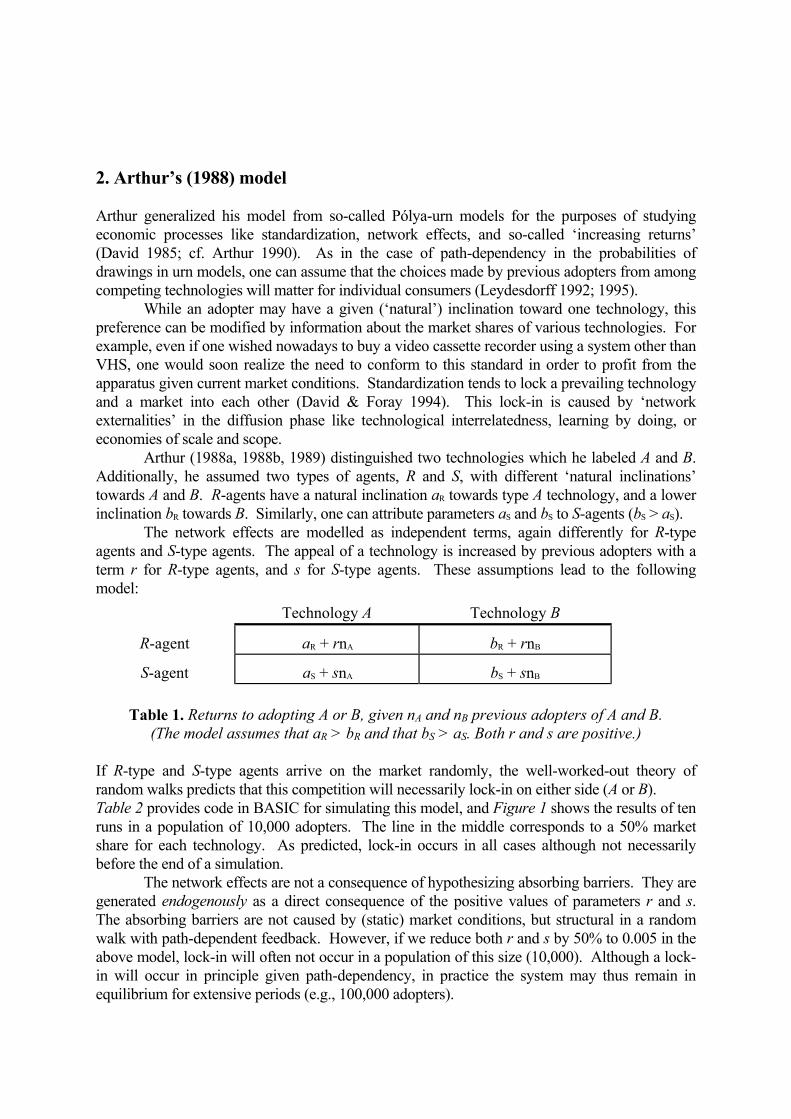
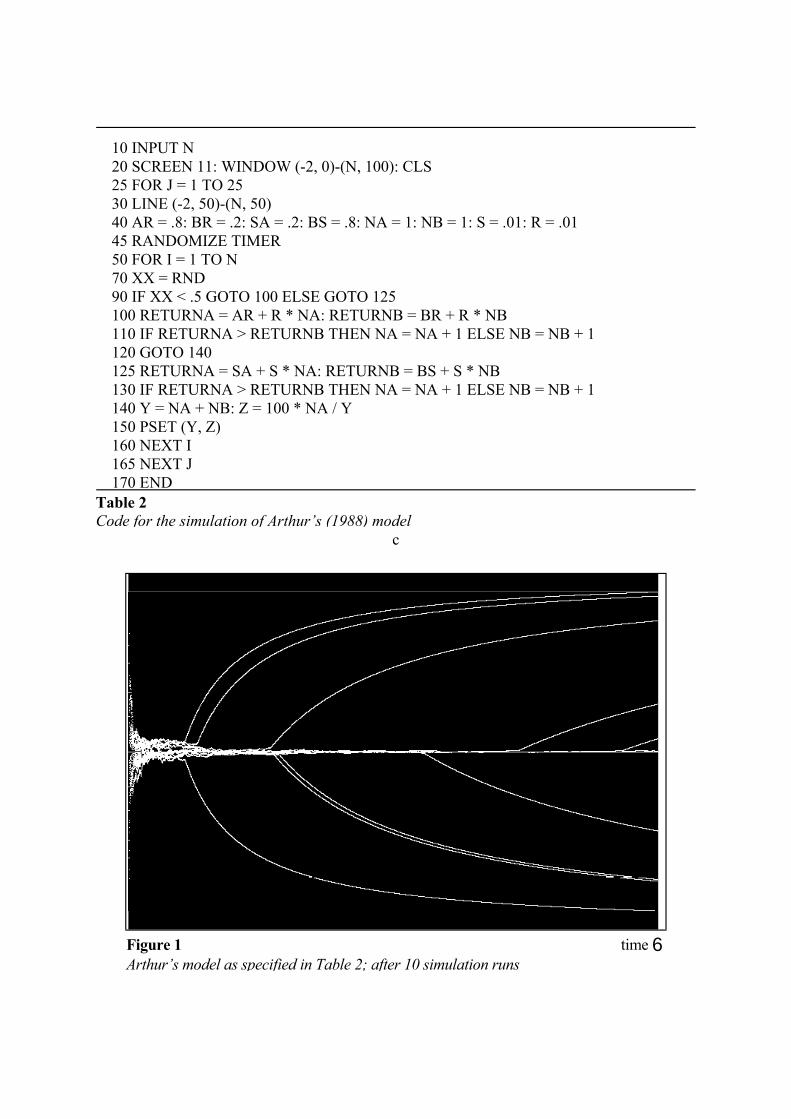
If R-type and S-type agents arrive on the market randomly, the well-worked-out theory of random walks predicts that this competition will necessarily lock-in on either side (A or B). Table 2 provides code in BASIC for simulating this model, and Figure 1 shows the results of ten runs in a population of 10,000 adopters. The line in the middle corresponds to a 50% market share for each technology. As predicted, lock-in occurs in all cases although not necessarily before the end of a simulation. The network effects are not a consequence of hypothesizing absorbing barriers. They are generated endogenously as a direct consequence of the positive values of parameters r and s. The absorbing barriers are not caused by (static) market conditions, but structural in a random walk with path-dependent feedback. However, if we reduce both r and s by 50% to 0.005 in the above model, lock-in will often not occur in a population of this size (10,000). Although a lock-in will occur in principle given path-dependency, in practice the system may thus remain in equilibrium for extensive periods (e.g., 100,000 adopters).
c
10 INPUT N 20 SCREEN 11: WINDOW (-2, 0)-(N, 100): CLS 25 FOR J = 1 TO 25 30 LINE (-2, 50)-(N, 50) 40 AR = .8: BR = .2: SA = .2: BS = .8: NA = 1: NB = 1: S = .01: R = .01 45 RANDOMIZE TIMER 50 FOR I = 1 TO N 70 XX = RND 90 IF XX < .5 GOTO 100 ELSE GOTO 125 100 RETURNA = AR + R * NA: RETURNB = BR + R * NB 110 IF RETURNA > RETURNB THEN NA = NA + 1 ELSE NB = NB + 1 120 GOTO 140 125 RETURNA = SA + S * NA: RETURNB = BS + S * NB 130 IF RETURNA > RETURNB THEN NA = NA + 1 ELSE NB = NB + 1 140 Y = NA + NB: Z = 100 * NA / Y 150 PSET (Y, Z) 160 NEXT I 165 NEXT J 170 END
Table 2 Code for the simulation of Arthur’s (1988) model
Figure 1 time 6 Arthur’s model as specified in Table 2; after 10 simulation runs
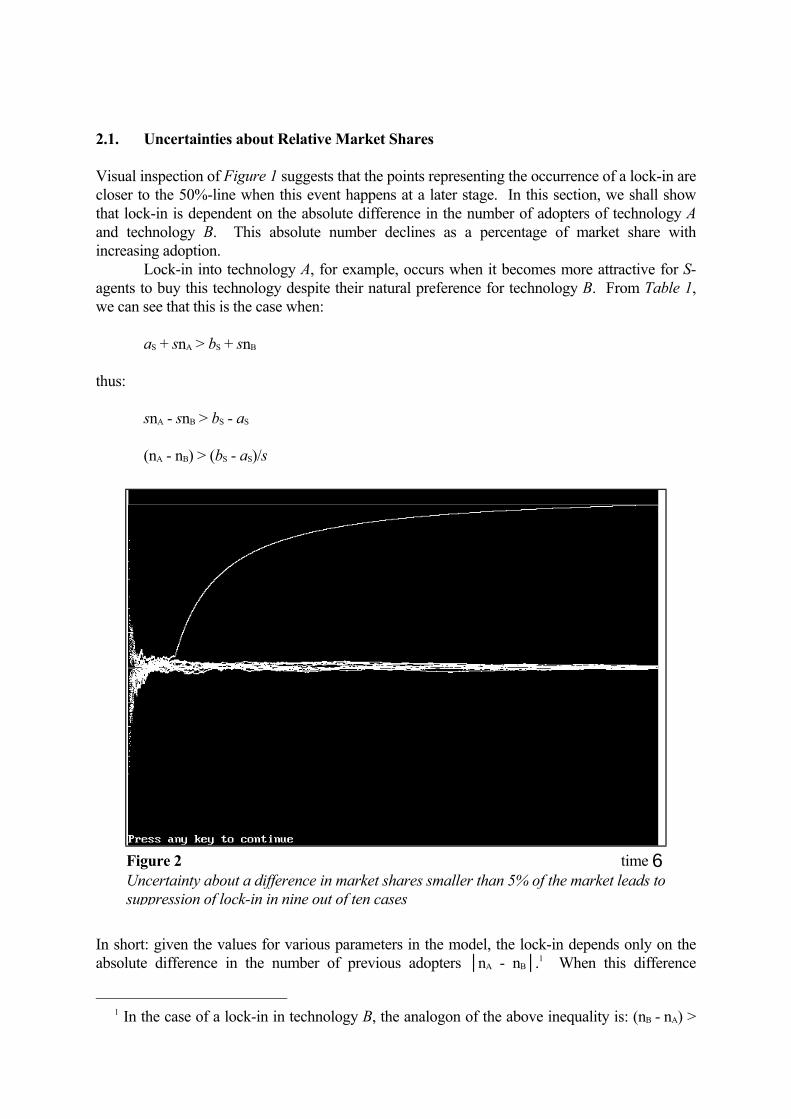
2.1. Uncertainties about Relative Market Shares Visual inspection of Figure 1 suggests that the points representing the occurrence of a lock-in are closer to the 50%-line when this event happens at a later stage. In this section, we shall show that lock-in is dependent on the absolute difference in the number of adopters of technology A and technology B. This absolute number declines as a percentage of market share with increasing adoption. Lock-in into technology A, for example, occurs when it becomes more attractive for S-agents to buy this technology despite their natural preference for technology B. From Table 1, we can see that this is the case when: aS + snA > bS + snB thus: snA - snB > bS - aS (nA - nB) > (bS - aS)/s
Figure 2 time 6 Uncertainty about a difference in market shares smaller than 5% of the market leads to suppression of lock-in in nine out of ten cases
In short: given the values for various parameters in the model, the lock-in depends only on the absolute difference in the number of previous adopters │nA - nB│.1 When this difference
1 In the case of a lock-in in technology B, the analogon of the above inequality is: (nB - nA) >

surpasses a critical value, the system is locked-in. With increasing diffusion, this abolute difference (│nA - nB│) becomes smaller as a percentage of the total number of adopters (nA + nB). This relative decrease of the percentage has an economic interpretation. While consumers may be able to distinguish large differences in adoption between two technologies, decreasingly smaller percentages may become difficult to perceive. Let us, for example, assume that consumers can appreciate the difference in market penetration of technologies A and B as long as this difference is larger than 5% of the market. When the difference becomes smaller than 5%, adopters become uncertain, and one may assume that adopters would hold to their ‘natural inclination’ under this condition. Table 3 shows how the insertion of lines 80, 100, and 160 in the code specifies this effect. Figure 2 illustrates that lock-ins virtually disappear in this case.
10 INPUT N 20 SCREEN 11: WINDOW (-2, 0)-(N, 100): CLS 25 FOR J = 1 TO 10 30 LINE (-2, 50)-(N, 50) 40 AR = .8: BR = .2: SA = .2: BS = .8: NA = 1: NB = 1: S = .01: R = .01 45 RANDOMIZE TIMER 50 FOR I = 1 TO N 70 XX = RND 80 IF (NA - NB) > 0 THEN M = (NA - NB) ELSE M = (NB - NA) 90 IF XX < .5 GOTO 100 ELSE GOTO 160 100 IF M * 20 < (NA + NB) GOTO 110 ELSE GOTO 130 110 NA = NA + 1 120 GOTO 210 130 RETURNA = AR + R * NA: RETURNB = BR + R * NB 140 IF RETURNA > RETURNB THEN NA = NA + 1 ELSE NB = NB + 1 150 GOTO 210 160 IF M * 20 < (NA + NB) GOTO 170 ELSE GOTO 190 170 NB = NB + 1 180 GOTO 210 190 RETURNA = SA + S * NA: RETURNB = BS + S * NB 200 IF RETURNA > RETURNB THEN NA = NA + 1 ELSE NB = NB + 1 210 Y = NA + NB: Z = 100 * NA / Y 220 PSET (Y, Z) 230 NEXT I 240 NEXT J 250 END
Table 3 Revised model with uncertainty at 5% level
2.2. Reflexivity on the Side of Consumers The Arthur-models assume that adopters are passive followers of market forces. However,
(aR - bR)/r.
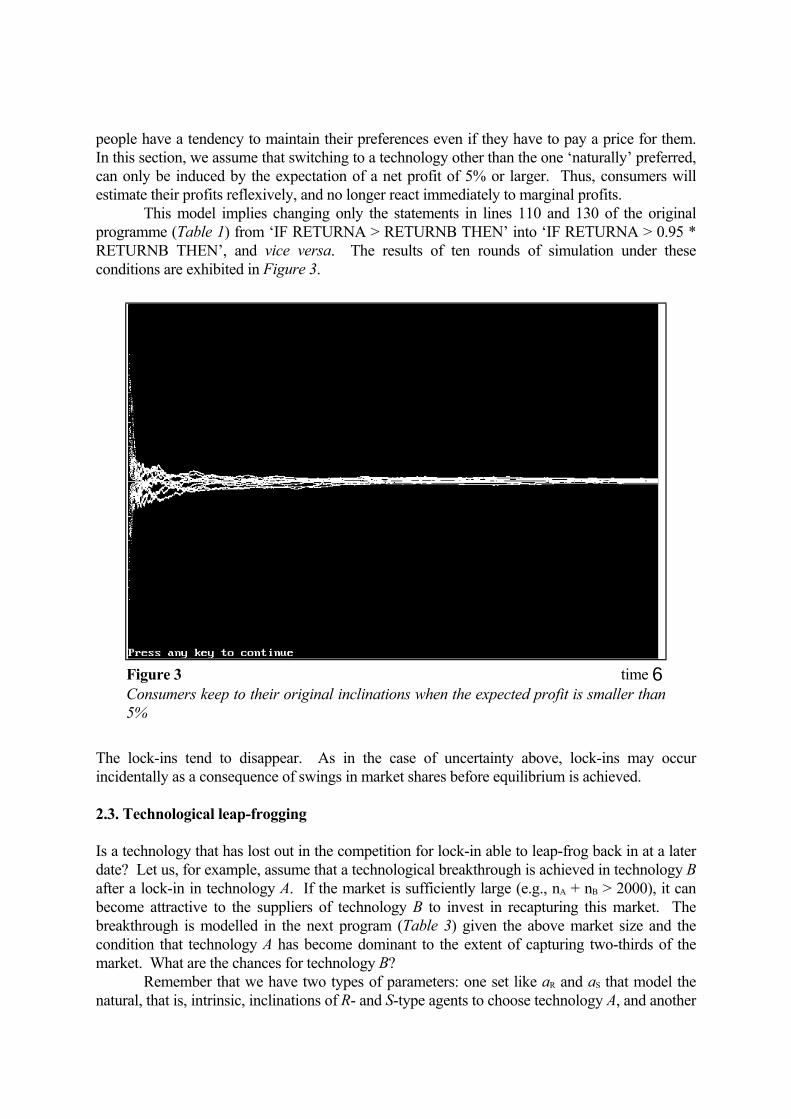
people have a tendency to maintain their preferences even if they have to pay a price for them. In this section, we assume that switching to a technology other than the one ‘naturally’ preferred, can only be induced by the expectation of a net profit of 5% or larger. Thus, consumers will estimate their profits reflexively, and no longer react immediately to marginal profits. This model implies changing only the statements in lines 110 and 130 of the original programme (Table 1) from ‘IF RETURNA > RETURNB THEN’ into ‘IF RETURNA > 0.95 * RETURNB THEN’, and vice versa. The results of ten rounds of simulation under these conditions are exhibited in Figure 3.
Figure 3 time 6 Consumers keep to their original inclinations when the expected profit is smaller than 5%
The lock-ins tend to disappear. As in the case of uncertainty above, lock-ins may occur incidentally as a consequence of swings in market shares before equilibrium is achieved. 2.3. Technological leap-frogging Is a technology that has lost out in the competition for lock-in able to leap-frog back in at a later date? Let us, for example, assume that a technological breakthrough is achieved in technology B after a lock-in in technology A. If the market is sufficiently large (e.g., nA + nB > 2000), it can become attractive to the suppliers of technology B to invest in recapturing this market. The breakthrough is modelled in the next program (Table 3) given the above market size and the condition that technology A has become dominant to the extent of capturing two-thirds of the market. What are the chances for technology B? Remember that we have two types of parameters: one set like aR and aS that model the natural, that is, intrinsic, inclinations of R- and S-type agents to choose technology A, and another
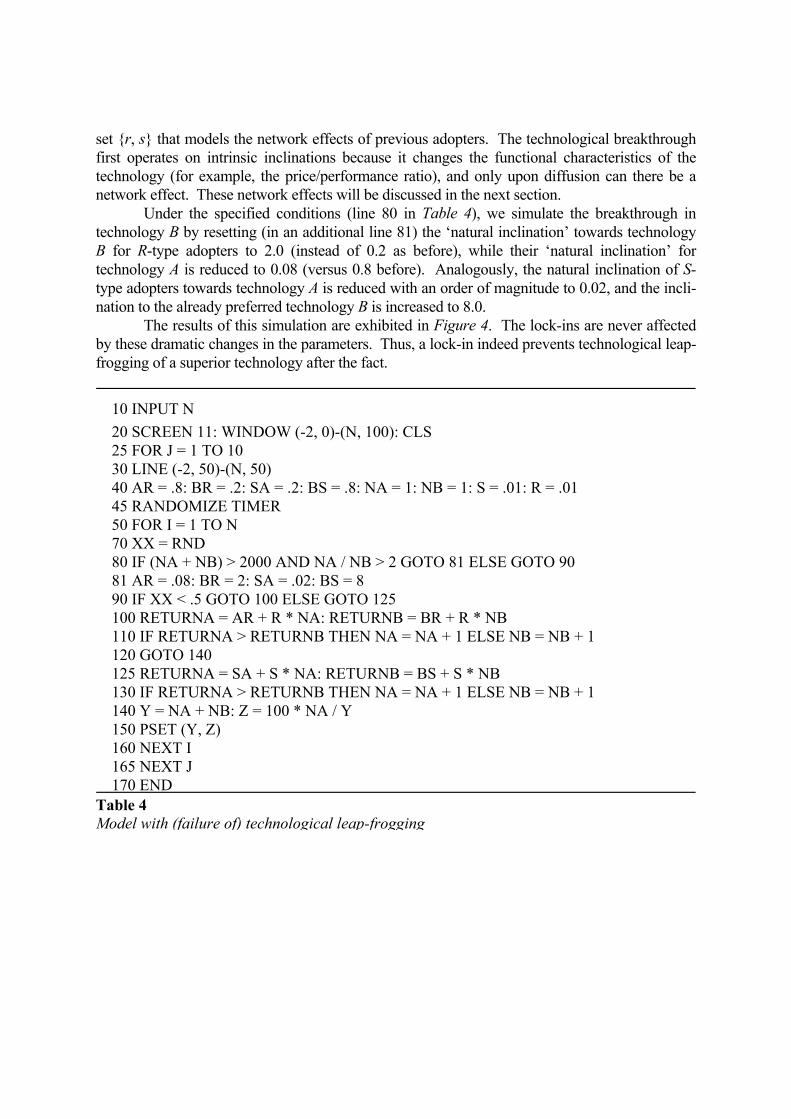
set {r, s} that models the network effects of previous adopters. The technological breakthrough first operates on intrinsic inclinations because it changes the functional characteristics of the technology (for example, the price/performance ratio), and only upon diffusion can there be a network effect. These network effects will be discussed in the next section. Under the specified conditions (line 80 in Table 4), we simulate the breakthrough in technology B by resetting (in an additional line 81) the ‘natural inclination’ towards technology B for R-type adopters to 2.0 (instead of 0.2 as before), while their ‘natural inclination’ for technology A is reduced to 0.08 (versus 0.8 before). Analogously, the natural inclination of S-type adopters towards technology A is reduced with an order of magnitude to 0.02, and the incli-nation to the already preferred technology B is increased to 8.0. The results of this simulation are exhibited in Figure 4. The lock-ins are never affected by these dramatic changes in the parameters. Thus, a lock-in indeed prevents technological leap-frogging of a superior technology after the fact.
10 INPUT N 20 SCREEN 11: WINDOW (-2, 0)-(N, 100): CLS 25 FOR J = 1 TO 10 30 LINE (-2, 50)-(N, 50) 40 AR = .8: BR = .2: SA = .2: BS = .8: NA = 1: NB = 1: S = .01: R = .01 45 RANDOMIZE TIMER 50 FOR I = 1 TO N 70 XX = RND 80 IF (NA + NB) > 2000 AND NA / NB > 2 GOTO 81 ELSE GOTO 90 81 AR = .08: BR = 2: SA = .02: BS = 8 90 IF XX < .5 GOTO 100 ELSE GOTO 125 100 RETURNA = AR + R * NA: RETURNB = BR + R * NB 110 IF RETURNA > RETURNB THEN NA = NA + 1 ELSE NB = NB + 1 120 GOTO 140 125 RETURNA = SA + S * NA: RETURNB = BS + S * NB 130 IF RETURNA > RETURNB THEN NA = NA + 1 ELSE NB = NB + 1 140 Y = NA + NB: Z = 100 * NA / Y 150 PSET (Y, Z) 160 NEXT I 165 NEXT J 170 END
Table 4 Model with (failure of) technological leap-frogging
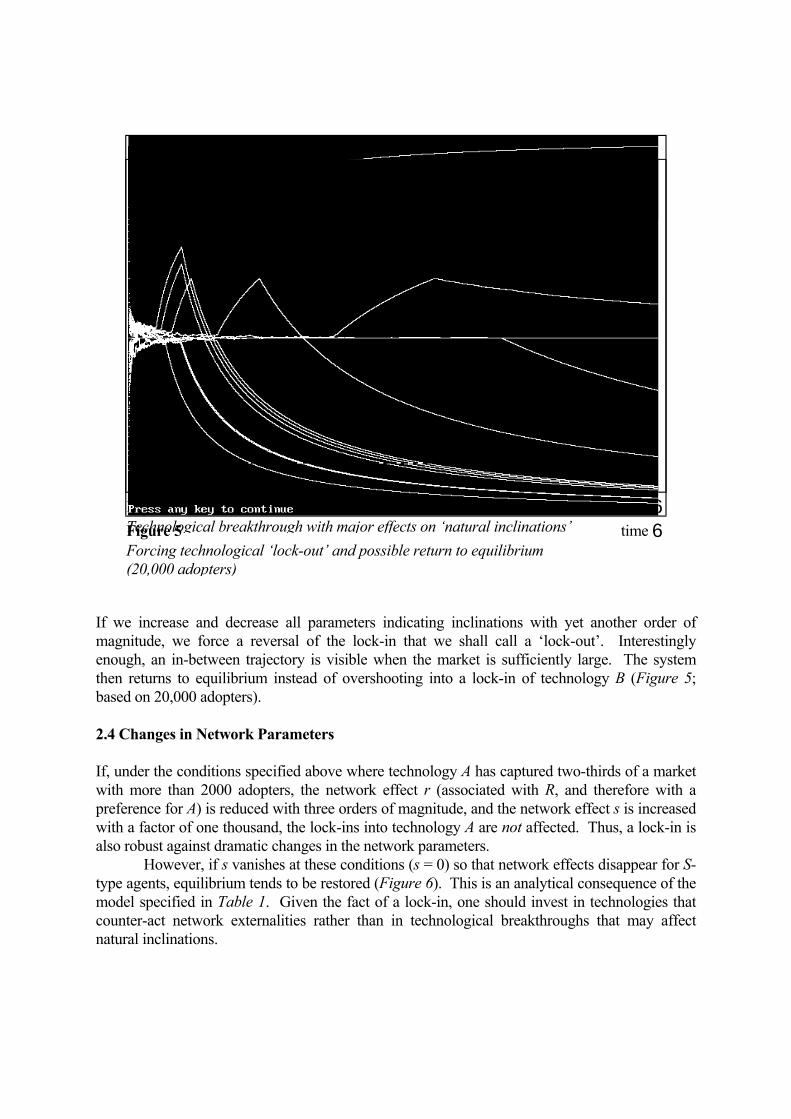
Figure 4 time 6 Technological breakthrough with major effects on ‘natural inclinations’
Figure 5 time 6 Forcing technological ‘lock-out’ and possible return to equilibrium (20,000 adopters)
If we increase and decrease all parameters indicating inclinations with yet another order of magnitude, we force a reversal of the lock-in that we shall call a ‘lock-out’. Interestingly enough, an in-between trajectory is visible when the market is sufficiently large. The system then returns to equilibrium instead of overshooting into a lock-in of technology B (Figure 5; based on 20,000 adopters). 2.4 Changes in Network Parameters If, under the conditions specified above where technology A has captured two-thirds of a market with more than 2000 adopters, the network effect r (associated with R, and therefore with a preference for A) is reduced with three orders of magnitude, and the network effect s is increased with a factor of one thousand, the lock-ins into technology A are not affected. Thus, a lock-in is also robust against dramatic changes in the network parameters. However, if s vanishes at these conditions (s = 0) so that network effects disappear for S-type agents, equilibrium tends to be restored (Figure 6). This is an analytical consequence of the model specified in Table 1. Given the fact of a lock-in, one should invest in technologies that counter-act network externalities rather than in technological breakthroughs that may affect natural inclinations.
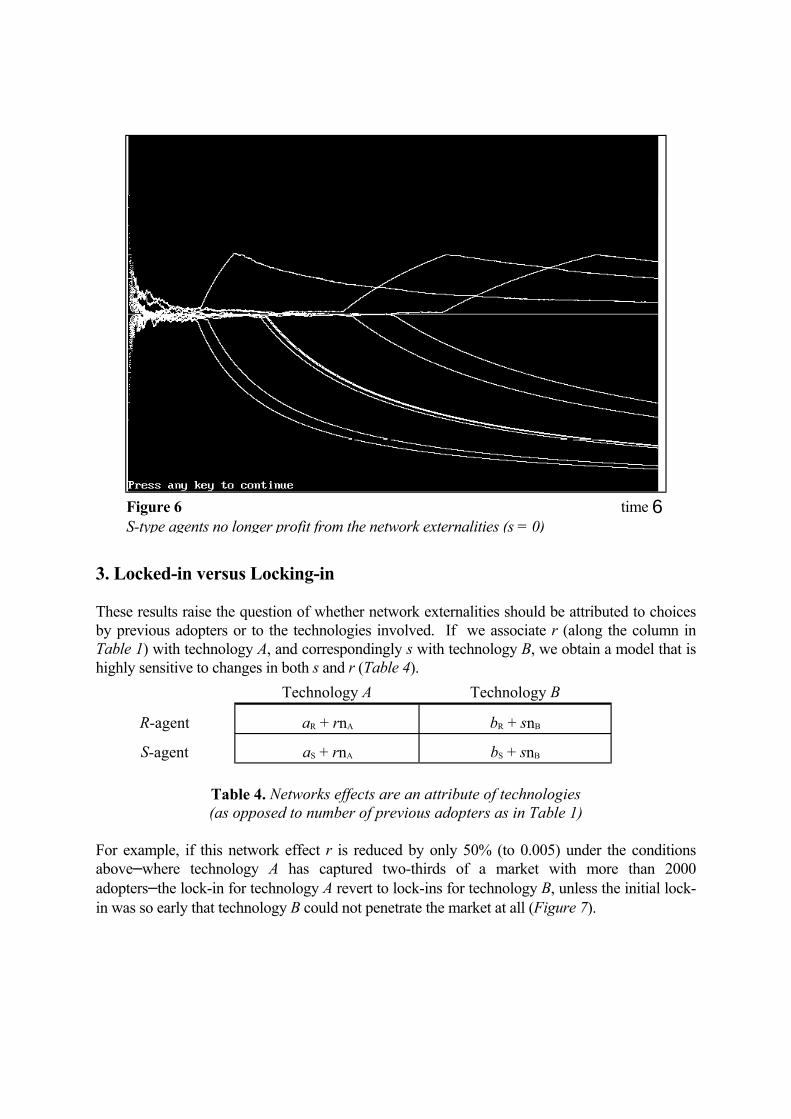
Figure 6 time 6 S-type agents no longer profit from the network externalities (s = 0)
3. Locked-in versus Locking-in These results raise the question of whether network externalities should be attributed to choices by previous adopters or to the technologies involved. If we associate r (along the column in Table 1) with technology A, and correspondingly s with technology B, we obtain a model that is highly sensitive to changes in both s and r (Table 4). Technology A Technology B
R-agent aR + rnA bR + snB
S-agent aS + rnA bS + snB
Table 4. Networks effects are an attribute of technologies (as opposed to number of previous adopters as in Table 1)
For example, if this network effect r is reduced by only 50% (to 0.005) under the conditions above─where technology A has captured two-thirds of a market with more than 2000 adopters─the lock-in for technology A revert to lock-ins for technology B, unless the initial lock-in was so early that technology B could not penetrate the market at all (Figure 7).
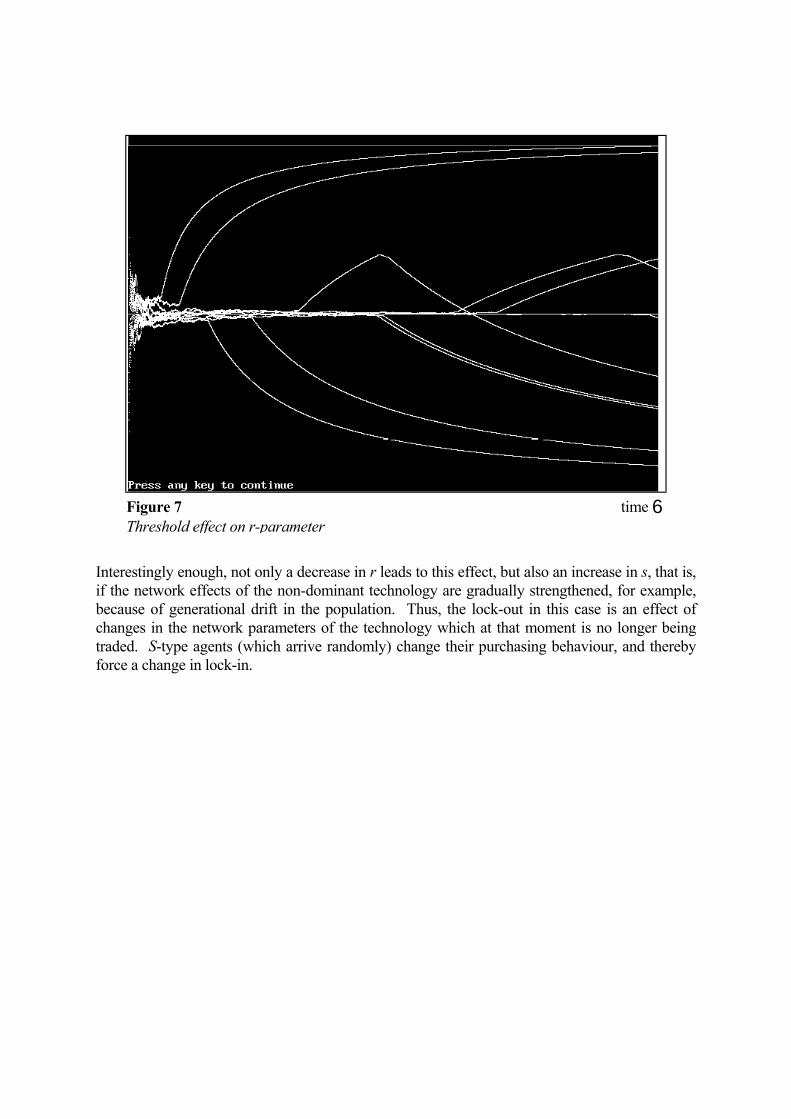
Figure 7 time 6 Threshold effect on r-parameter
Interestingly enough, not only a decrease in r leads to this effect, but also an increase in s, that is, if the network effects of the non-dominant technology are gradually strengthened, for example, because of generational drift in the population. Thus, the lock-out in this case is an effect of changes in the network parameters of the technology which at that moment is no longer being traded. S-type agents (which arrive randomly) change their purchasing behaviour, and thereby force a change in lock-in.

Figure 8 time 6 Gradual increase of network effect s, favouring technology B
Figure 9 time 6 Lock-in, lock-out, and return to equilibrium in a population of 30,000 adopters
Note that equilibrium cannot be restored by changing only the network parameters. One needs another mechanism like uncertainty among adopters to induce a return to equilibrium. For example, if we combine a simulation with the above condition of keeping to one’s original preference in the case of less than 5% difference in market shares (given a market of more than 10,000 adopters),2 the system obtains a window for returning to equilibrium. This is demonstrated in Figure 9 for a population of 30,000. 4. Summary and Discussion Arthur (1988b) noted that lock-ins can again disappear if the network effects of previous adopters are attenuated, for example, along a learning curve (cf. Kauffman 1988; Frenken & Verbart 1998). In this study, we showed that the network effects can also be suppressed a priori, for example, by reducing the relevant parameters or by counter-acting them. The competing technologies then tend to remain in competition. One might wish to save Arthur’s theory by stating that the system of competing technologies is in this case ‘locked into an equilibrium.’ However, this begs the question of the necessity of an eventual lock-in. Lock-ins can be considered as discrete long-term expectations of network effects. Selectors at the network level are a consequence of the relational factors in the variation. (In the model, these parameters are distinguished from adopters’ ‘natural inclinations’ for one or another technology.) In other words, the lock-in in one technology, or in the other, or in an equilibrium between the two can be considered as three different trajectories of the techno-economic systems under study. It was shown that a lock-in as defined by Arthur (1988a) is dependent on the difference between the numbers of adopters of the two technologies. In Arthur’s model, however, adopters were considered passive followers of market forces. If one assumes that adopters have a reflexive capacity to estimate uncertainties, categorical lock-ins tend to disappear in favour of a long-term trajectory of competitive equilibrium. Thus, a co-evolution between competing technologies may not be exceptional in view of the prevailing reflexivity and uncertainty at the actor level (cf. Alchian 1950). When only two technologies are assumed, a competitive balance between these dynamics is not expected to be stable given endogenous reinforcement mechanisms. A third subdynamic, like a degree of freedom on the consumer side, enables the system to stabilize into a steady state. When a fourth degree of freedom can be specified, this potentially globalizes the stabilization as a next-order recursion of the selection (Leydesdorff 1994). The obvious candidate for this degree of freedom is ‘technological change’ during the adoption process. Technological developments may affect both parameters in the model: (a) the natural inclinations of consumers, and (b) the positive network effects from the number of previous adopters. For example, if in the future it becomes possible to download movies from the Internet, the advantages of using one type of VCR or another might disappear. Furthermore, our simulations show that trajectory transitions can indeed be induced by changing network parameters. However, the emergence of a new technology affecting the natural inclinations of consumers does not lead to a transition in this model if there is already a lock-in. In their study of hyper-selection in innovation processes, Bruckner et al. (1994) have shown that only within niches can the separatrix between the two basins of attraction sometimes 2 An additional threshold of 10,000 adopters for making uncertainty relevant is necessary, since otherwise no lock-ins may occur, as demonstrated in Figure 2.
be tunneled given a stochastic model. This conclusion fully accords with our results: if sufficiently present, network parameters become dominant. Finally, we could show that changes in the network effect can sometimes lead to ordered substitution processes, notably following the lock-in line of the substituting technology. These rapid, but ordered substitution processes have been demonstrated empirically (e.g., Fisher & Prey 1971). Hitherto, they have been insufficiently understood from the perspective of evolutionary modelling. In our opinion, evolutionary networks should be considered as hyper-networks that are able to suppress relevant subdynamics when this suppression appears to be functional for further development (cf. Bruckner et al. 1996). Not the emergence of a new technology, but structural adjustments in the dynamics of the network seem to determine the dissolution of one lock-in or another given a choice between competing technologies (cf. Freeman & Perez 1988; David & Foray 1994). Acknowledgement We wish to thank Koen Frenken for stimulating discussions and valuable suggestions (cf. Frenken & Verbart 1998). We also acknowledge partial funding by the European Commission, TSER project PL97-1296. References Alchian, A. A. (1950). ‘Uncertainty, Evolution, and Economic Theory,’ Journal of Political Economy 58, 211-22. Arthur, W. Brian (1988a). ‘Competing technologies,’ in: Dosi, G., C. Freeman, R. Nelson, G. Silverberg, and L. Soete (eds.), Technical Change and Economic Theory. London: Pinter, pp. 590-607. Arthur, W. Brian (1988b). ‘Self-Reinforcing Mechanisms in Economics,’ in: Anderson, Ph. W. et al. (Eds.), The Economy as an Evolving Complex System. Redwood City, CA: Addison-Wesley, pp. 9-32. Arthur, W. Brian (1989). ‘Competing Technologies, Increasing Returns, and Lock-In by Historical Events,’ Economic Journal 99, 116-31. Arthur, William B. (1990). ‘Positive Feedbacks in the Economy,’ Scientific American, February 1990, 80-85. Bruckner, Eberhard, Werner Ebeling, Miguel A. Jiménez Montaño, & Andrea Scharnhorst (1994). ‘Hyperselection and Innovation Described by a Stochastic Model of Technological Evolution,’ in: Leydesdorff, Loet & Van den Besselaar, Peter (Eds.), Evolutionary Economics and Chaos Theory: New directions in technology studies. London: Pinter, pp. 79-90 Bruckner, Eberhard, Werner Ebeling, Miguel A. Jiménez Montaño, & Andrea Scharnhorst (1996). ‘Nonlinar stochastic effects of substitution ─ an evolutionary approach,’ Journal of Evolutionary Economics 6, 1-30.

David, Paul A. (1985). ‘Clio and the Economics of QWERTY,’ American Economic Review 75, 332-7. David, Paul A. & Dominique Foray (1994). ‘Dynamics of Competitive Technology Diffusion Through Local Network Structures: The Case of EDI Document Standards,’ in: Leydesdorff, Loet & Van den Besselaar, Peter (Eds.), Evolutionary Economics and Chaos Theory: New directions in technology studies. London: Pinter, pp. 63-78. Fisher, J. C., and R. H. Pry (1971). ‘A Simple Substitution Model of Technological Change,’ Technological Forecasting and Social Change 3, 75-88. Freeman, Chris and Perez, Carlota (1988). ‘Structural crises of adjustment, business cycles and investment behaviour,’ in: Dosi, G., C. Freeman, R. Nelson, G. Silverberg, and L. Soete (eds.), Technical Change and Economic Theory. London: Pinter, pp. 38-66. Frenken, Koen and Okke Verbart (1998). ‘Simulating paradigm shifts using a lock-in model,’ in: Petra Ahrweiler and Nigel Gilbert (eds.), Simulations in Science and Technology Studies. Berlin: Springer Verlag (forthcoming). Kauffman, Stuart A. (1988). ‘The Evolution of Economic Webs,’ in: Anderson, Ph. W. et al. (Eds.), The Economy as an Evolving Complex System. Redwood City, CA: Addison-Wesley, pp. 125-46 Leydesdorff, Loet (1992). ‘Irreversibilities in science and technology networks: an empirical and analytical approach,’ Scientometrics 24 (2), 321-57. Leydesdorff, Loet (1994). ‘The Evolution of Communication Systems,’ Int. J. Systems Research and Information Science 6, 219-30. Leydesdorff, Loet (1995). The Challenge of Scientometrics: The Development, Measurement, and Self-Organization of Scientific Communications. Leiden: DSWO Press, Leiden University.

aR bR aS bS r s
Figure 1 (Table 2)
0.8 0.2 0.2 0.8 0.01 0.01
Figure 2 0.8 0.2 0.2 0.8 0.01 0.01
Figure 3 0.8 0.2 0.2 0.8 0.01 0.01
Figure 4 after technological breakthrough
0.8 0.08
0.2 2.0
0.2 0.02
0.8 8
0.01 0.01
0.01 0.01
Figure 5 after technological breakthrough
0.8 0.008
0.2 20
0.2 0.002
0.8 80
0.01 0.01
0.01 0.01
Figure 6 after threshold
0.8 0.2 0.2 0.8 0.01 0.01 s = 0
Figure 7 after threshold
0.8 0.8
0.2 0.2
0.2 0.2
0.8 0.2
0.01 0.005
0.01 0.01
Figure 8 after threshold
0.8 0.2 0.2 0.8 0.01 0.01 sn+1= sn * 1.001
Figure 9 (N = 30,000) after threshold
0.8 0.2 0.2 0.8 0.01 0.01 sn+1 = sn * 1.001
Table 5
Summary of parameter values and changes in parameter values for different figures