Tower-Footing Resistance and Lightning Trip-outs of 150 kV ...
8
* Correspondence to: Yusreni Warmi. E-mail: [email protected] * Padang Institute of Technology, Padang, West Sumatra, Indonesia. Tower-Footing Resistance and Lightning Trip-outs of 150 kV Transmission Lines in West Sumatra in Indonesia Yusreni Warmi 1,* , and Koji Michishita 2 1 Padang Institute of Technology, Padang, West Sumatra, Indonesia 2 Graduate School of Science and Technology, Shizuoka University, Hamamatsu, 4328561, Japan Abstract. The trip-out rates calculated by taking account of the reduction in the tower-footing resistance due to the ionizing effect agree well with the observed ones. This indicates the importance of the impulse resistance in the analysis of the lightning performance of the line. The trip-out rate at the lower arm is high for the cases of the average grounding resistance of 33.3 ohms, and the rates at the upper arm are high for the cases of the average grounding resistance of 5.6 ohms. Such à trend can be simulated by the IEEE method using the impulse resistance. The trend for the trip-out ratio to become high with the increase in the span length is significant after improvement of the tower-footing resistance. However, the trend is weak before improvement of the tower-footing resistance. This is because in the case of the high tower-footing resistance the flashover occurs before the arrival of the wave reflected from the adjacent towers due to the high potential rise of the tower. Therefore, the degree of the influence of the span length on the trip-out ratio is dependent on the tower-footing resistance. The local lightning activity significantly affects the trip-out rate. 1 Introduction An electric power transmission system in Indonesia more commonly uses an overhead line than an underground cable. An overhead transmission line is quite susceptible to lightning strokes due to high construction. There is a 150 kV transmission line from Payakumbuh to Koto Panjang in West Sumatra, passing the area whose average number of thunderstorm days per year (IKL: Isokeraunic levels) reached up to 165, and the frequency of direct lightning strokes to the transmission line was high. This line is the trunk line between West Sumatra sub-system (Padang UPT) and Riau sub-system (Riau UPT). The intensity of a lightning stroke is very high, due to the layout of the transmission line that is surrounded by mountain, hill and near the sea [1-2]. Thus, they had a threat of lightning from the sea, and the lines that cross the mountain and hill are structures that appear on the surface of the ground and become an easy target for lightning stroke. Therefore, it must have à high degree of immunity against lightning strokes. According to the data from the Distribution and Load Control Centre Sumatra (Sumatra P3B), the main cause of the trip-outs is lightning, amounting to 66% of all trip- outs [3-5]. In addition to causing blackouts, lightning overvoltage also causes the trip-out of the transmission line. An example of these incidents is the Payakumbuh– Koto Panjang blackout that lasted as long as 10 minutes in 2010. In 2011, the blackout is also caused by the outage of Circuit 1 and 2 for 39 and 57 minutes, respectively [3-5]. Lightning performance of a transmission line has been studied for a long time. According to [6-8], the high ratio of trip-outs of 110 kV to 138 kV lines in China, Mexico, and Malaysia for five years were 62%, 50%, and 79%, respectively. In Japan, the high ratio of lightning trip- outs of 110 – 154 kV lines was 75% [9]. Lightning trip-outs mean the operation of a circuit breaker at the substation due to flashover caused by lightning [10]. Furthermore, it is shown that the tower- footing resistance has a significant influence on the back-flashover protection performance: the lower the tower-footing impedance, the less the back-flashover rate [10-18] In this paper, lightning performance of the 150 kV transmission line in West Sumatra is studied. To the best of our knowledge, this is the first time that the lightning performance of the transmission line in West Sumatra high lightning activity area and the high lightning trip-out area is studied. In fact, the overhead line located in hilly areas will be much closer to the clouds, thus having more frequency of lightning strokes. West Sumatra is located in a tropical area. Therefore, the air has a humidity, which explains the high-intensity lightning, namely 20 to 40 flashes/100 km-year [19] for the high isokeraunic level area. According to [20] the lightning trip-out rate of 110 kV to 154 kV line from 1980 to 2000 was 1.7 to 2.8 trip-out/100 km-year. There is a 150 kV transmission line from Payakumbuh to Koto Panjang in West Sumatra, passing an area whose average number of thunderstorm days per year (IKL: Isokeraunic levels) reached 165, and the possibility of direct lightning strokes to the transmission line, including the strokes to the transmission tower, is high [3-5]. © The Authors, published by EDP Sciences. This is an open access article distributed under the terms of the Creative Commons Attribution License 4.0 (http://creativecommons.org/licenses/by/4.0/). MATEC Web of Conferences 215, 01022 (2018) https://doi.org/10.1051/matecconf/201821501022 ICTIS 2018
-
Upload
khangminh22 -
Category
Documents
-
view
4 -
download
0
Transcript of Tower-Footing Resistance and Lightning Trip-outs of 150 kV ...

* Correspondence to: Yusreni Warmi. E-mail: [email protected]
* Padang Institute of Technology, Padang, West Sumatra, Indonesia.
Tower-Footing Resistance and Lightning Trip-outs of 150 kV Transmission Lines in West Sumatra in Indonesia
Yusreni Warmi 1,*, and Koji Michishita 2
1Padang Institute of Technology, Padang, West Sumatra, Indonesia 2Graduate School of Science and Technology, Shizuoka University, Hamamatsu, 4328561, Japan
Abstract. The trip-out rates calculated by taking account of the reduction in the tower-footing resistance
due to the ionizing effect agree well with the observed ones. This indicates the importance of the impulse
resistance in the analysis of the lightning performance of the line. The trip-out rate at the lower arm is high
for the cases of the average grounding resistance of 33.3 ohms, and the rates at the upper arm are high for
the cases of the average grounding resistance of 5.6 ohms. Such à trend can be simulated by the IEEE
method using the impulse resistance. The trend for the trip-out ratio to become high with the increase in the
span length is significant after improvement of the tower-footing resistance. However, the trend is weak
before improvement of the tower-footing resistance. This is because in the case of the high tower-footing
resistance the flashover occurs before the arrival of the wave reflected from the adjacent towers due to the
high potential rise of the tower. Therefore, the degree of the influence of the span length on the trip-out ratio
is dependent on the tower-footing resistance. The local lightning activity significantly affects the trip-out
rate.
1 Introduction
An electric power transmission system in Indonesia
more commonly uses an overhead line than an
underground cable. An overhead transmission line is
quite susceptible to lightning strokes due to high
construction. There is a 150 kV transmission line from
Payakumbuh to Koto Panjang in West Sumatra, passing
the area whose average number of thunderstorm days per
year (IKL: Isokeraunic levels) reached up to 165, and the
frequency of direct lightning strokes to the transmission
line was high. This line is the trunk line between West
Sumatra sub-system (Padang UPT) and Riau sub-system
(Riau UPT). The intensity of a lightning stroke is very
high, due to the layout of the transmission line that is
surrounded by mountain, hill and near the sea [1-2].
Thus, they had a threat of lightning from the sea, and the
lines that cross the mountain and hill are structures that
appear on the surface of the ground and become an easy
target for lightning stroke. Therefore, it must have à high
degree of immunity against lightning strokes.
According to the data from the Distribution and Load
Control Centre Sumatra (Sumatra P3B), the main cause
of the trip-outs is lightning, amounting to 66% of all trip-
outs [3-5]. In addition to causing blackouts, lightning
overvoltage also causes the trip-out of the transmission
line.
An example of these incidents is the Payakumbuh–
Koto Panjang blackout that lasted as long as 10 minutes
in 2010. In 2011, the blackout is also caused by the
outage of Circuit 1 and 2 for 39 and 57 minutes,
respectively [3-5].
Lightning performance of a transmission line has been
studied for a long time. According to [6-8], the high ratio
of trip-outs of 110 kV to 138 kV lines in China, Mexico,
and Malaysia for five years were 62%, 50%, and 79%,
respectively. In Japan, the high ratio of lightning trip-
outs of 110 – 154 kV lines was 75% [9].
Lightning trip-outs mean the operation of a circuit
breaker at the substation due to flashover caused by
lightning [10]. Furthermore, it is shown that the tower-
footing resistance has a significant influence on the
back-flashover protection performance: the lower the
tower-footing impedance, the less the back-flashover
rate [10-18] In this paper, lightning performance of the
150 kV transmission line in West Sumatra is studied. To
the best of our knowledge, this is the first time that the
lightning performance of the transmission line in West
Sumatra high lightning activity area and the high
lightning trip-out area is studied. In fact, the overhead
line located in hilly areas will be much closer to the
clouds, thus having more frequency of lightning strokes.
West Sumatra is located in a tropical area. Therefore, the
air has a humidity, which explains the high-intensity
lightning, namely 20 to 40 flashes/100 km-year [19] for
the high isokeraunic level area. According to [20] the
lightning trip-out rate of 110 kV to 154 kV line from
1980 to 2000 was 1.7 to 2.8 trip-out/100 km-year. There
is a 150 kV transmission line from Payakumbuh to Koto
Panjang in West Sumatra, passing an area whose average
number of thunderstorm days per year (IKL: Isokeraunic
levels) reached 165, and the possibility of direct
lightning strokes to the transmission line, including the
strokes to the transmission tower, is high [3-5].
© The Authors, published by EDP Sciences. This is an open access article distributed under the terms of the Creative Commons Attribution License 4.0
(http://creativecommons.org/licenses/by/4.0/).
MATEC Web of Conferences 215, 01022 (2018) https://doi.org/10.1051/matecconf/201821501022ICTIS 2018

2 Transmission Line under Study
2.1 Line configuration
The location of the transmission line under study in
West Sumatra is shown in Figure 1. as the blue line.
Among 248 towers, 156 towers (63 %) are located on
hills, 51 towers (20.5 %) in rice fields, and 41 towers
(16.5 %) in the forest [1,21]. In figure 1 shows a plan of
a 150-kV overhead transmission line between
Payakumbuh - Koto Panjang under study, shown in the
middle, with the total length of 86 km. The studied line
is a double-circuit, balanced-insulation, and transposed
transmission line. The IKL was as many as 165 days/
year in the area where the line segment between No. 1 to
No. 140 towers, 47 km in length, locates, while the IKL
was 22 days/ year in the area where the line segment
from No. 141 to No. 248 towers locates. The
thunderstorm in this area often moves from the northeast
to the southwest.
Fig. 2 shows the configuration of one of four types of
towers with almost the same dimensions [22]. The types
of towers might be chosen dependent on the easiness of
the construction. The range of the span length was from
147 m to 434 m with an average of 333 m.
Table 1. Shows the dimension, the component ratio
and the frequency ratio of the lightning trip-outs
dependent on tower types. The four types of towers had
almost the same dimensions [19,22,23]. The types of
towers might be chosen dependent on the easiness of the
construction. The range of the span length was from 147
m to 434 m with an average of 333 m.
Table 1. Line condition.
Tower Types
A B C D
d OHGW 7.0 6.8 6.8 7.0
d Upper 7.6 7.0 7.0 7.6
d Middle 8.0 7.4 7.4 7.6
d Lower 8.45 7.8 7.8 7.6
d Tower 5.0 5.4 5.4 5.6
h OHGW 32.2 31.7 31.7 31.7
h Upper 28.1 27.7 27.7 27.7
h Middle 23.8 23.6 23.6 23.6
h Lower 19.5 19.5 19.5 19.5
Crossing angle of
line 0 - 3 0 - 20 20 - 40 40 - 60
Component ratio
(%) 53.6 28.6 10.7 7.1
Frequency ratio of
tripout (%) 60.5 30.2 8.1 1.2
Figure 3. Shows the distribution of the length of an
arcing horn gap installed at each tower [22,23]. The
arcing horn gap is arranged 75% to 85% of the length of
the insulator string, 1.2 m to 1.6 m. At the towers with
frequent insulator damages, the length of an arcing horn
gap is shortened to 0.9 – 1.0 m, and as a result, more
than half of the horns had the length from 0.9 m to 1.0
m. The 4 to 6 pieces of the TLAs were installed at 10
towers among No.1 to No.140 towers dependent on the
frequency of the flashovers [22,23]. The arcing horn gap
is arranged 75% to 85% of the length of the insulator
string, 1.2 m to 1.6 m. At the towers with frequent
insulator damages, the length of an arcing horn gap is
shortened to 0.9 – 1.0 m, and as a result, more than half
of the horns had the length from 0.9 m to 1.0 m. The 4 to
6 pieces of the TLAs were installed at 10 towers among
Fig. 2. Configuration of representative tower.
Fig. 1. Location of Transmission line under study.
2
MATEC Web of Conferences 215, 01022 (2018) https://doi.org/10.1051/matecconf/201821501022ICTIS 2018

No.1 to No.140 towers dependent on the frequency of
the flashovers [22,23].
2.2 Tower-footing résistance
Figure 4. Shows the average tower-footing resistance
as a function of the tower-number group before and after
the improvement of the tower-footing resistance, carried
out from 2010 to 2014.
The average tower-footing resistance for the tower-
number group before and after the improvement was in
the ranges from 24 to 50 Ω and from 4 to 6 Ω,
respectively. The average periods before and after the
improvement were 3.3 and 1.8 years, respectively.
3. Factor Influencing Lightning Trip-outs
3.1 Lightning activity
Figure 5. Shows the trip-out rate as a function of the
line segment expressed by the tower-number group. The
rate decreases with the increase of the tower number
with which the location of towers first directs toward the
east and then to the south. In the area of the line, the
lightning activity is high in the north and weakens in the
south as is indicated by the decrease of the IKL from 165
to 22 days/ year. The lightning activity might be the
cause of the decrease of the rate of the line segment with
the increase of the tower number.
Since the trip-out rates of the line segment between
No. 73 – No. 140 towers are relatively low probably due
to the low lightning flash density, the following analysis
will be made for the line from No. 1 to No. 72 towers to
clarify the degree of influence of some factors.
3.2 Tower-footing résistance
Fig. 5. Trip-outs rate as a function of the tower-number group.
Fig. 6. Trip-out rate as a function of tower-footing
resistance.
Fig. 4. Measurement data of average value of tower-footing resistance at No. 1 to No 140 towers.
Fig. 3. Distribution of the length of an arcing horn gap from No. 1
to No. 140 towers [22]
.
3
MATEC Web of Conferences 215, 01022 (2018) https://doi.org/10.1051/matecconf/201821501022ICTIS 2018
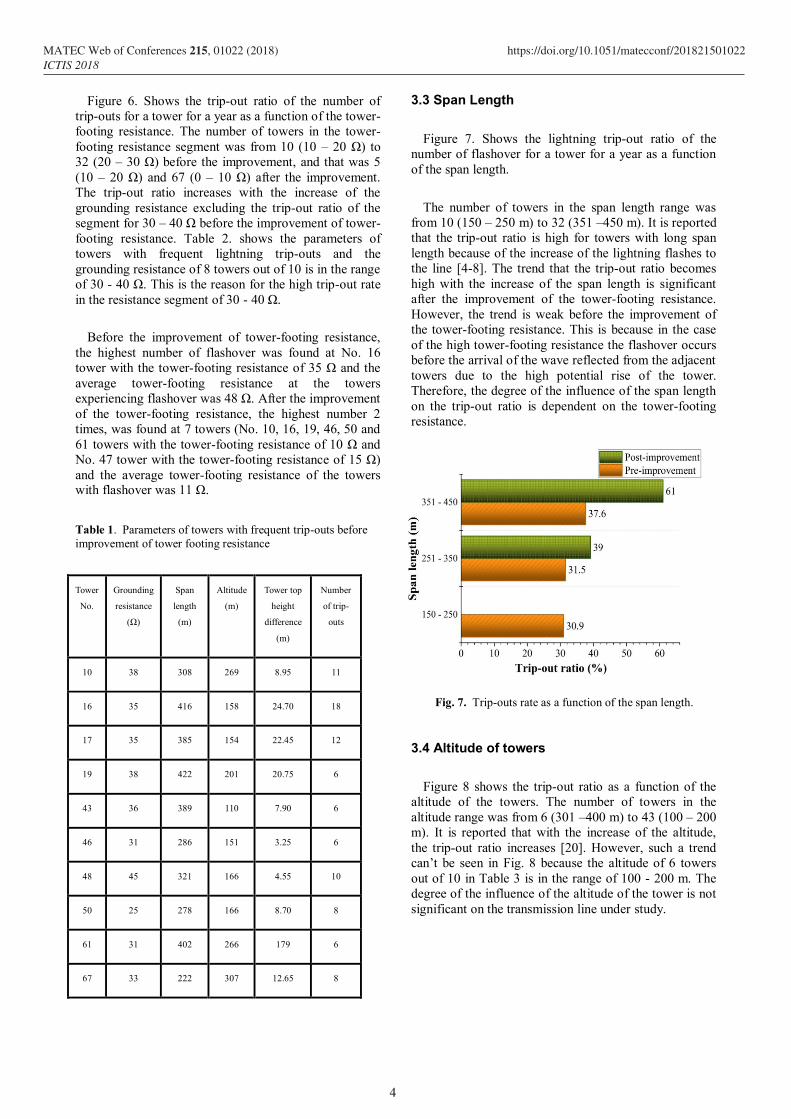
Figure 6. Shows the trip-out ratio of the number of
trip-outs for a tower for a year as a function of the tower-
footing resistance. The number of towers in the tower-
footing resistance segment was from 10 (10 – 20 Ω) to
32 (20 – 30 Ω) before the improvement, and that was 5
(10 – 20 Ω) and 67 (0 – 10 Ω) after the improvement.
The trip-out ratio increases with the increase of the
grounding resistance excluding the trip-out ratio of the
segment for 30 – 40 Ω before the improvement of tower-
footing resistance. Table 2. shows the parameters of
towers with frequent lightning trip-outs and the
grounding resistance of 8 towers out of 10 is in the range
of 30 - 40 Ω. This is the reason for the high trip-out rate
in the resistance segment of 30 - 40 Ω.
Before the improvement of tower-footing resistance,
the highest number of flashover was found at No. 16
tower with the tower-footing resistance of 35 Ω and the
average tower-footing resistance at the towers
experiencing flashover was 48 Ω. After the improvement
of the tower-footing resistance, the highest number 2
times, was found at 7 towers (No. 10, 16, 19, 46, 50 and
61 towers with the tower-footing resistance of 10 Ω and
No. 47 tower with the tower-footing resistance of 15 Ω)
and the average tower-footing resistance of the towers with flashover was 11 Ω.
Table 1. Parameters of towers with frequent trip-outs before
improvement of tower footing resistance
3.3 Span Length
Figure 7. Shows the lightning trip-out ratio of the
number of flashover for a tower for a year as a function
of the span length.
The number of towers in the span length range was
from 10 (150 – 250 m) to 32 (351 –450 m). It is reported
that the trip-out ratio is high for towers with long span
length because of the increase of the lightning flashes to
the line [4-8]. The trend that the trip-out ratio becomes
high with the increase of the span length is significant
after the improvement of the tower-footing resistance.
However, the trend is weak before the improvement of
the tower-footing resistance. This is because in the case
of the high tower-footing resistance the flashover occurs
before the arrival of the wave reflected from the adjacent
towers due to the high potential rise of the tower.
Therefore, the degree of the influence of the span length
on the trip-out ratio is dependent on the tower-footing
resistance.
3.4 Altitude of towers
Figure 8 shows the trip-out ratio as a function of the
altitude of the towers. The number of towers in the
altitude range was from 6 (301 –400 m) to 43 (100 – 200
m). It is reported that with the increase of the altitude,
the trip-out ratio increases [20]. However, such a trend
can’t be seen in Fig. 8 because the altitude of 6 towers
out of 10 in Table 3 is in the range of 100 - 200 m. The
degree of the influence of the altitude of the tower is not
significant on the transmission line under study.
Tower
No.
Grounding
resistance
(Ω)
Span
length
(m)
Altitude
(m)
Tower top
height
difference
(m)
Number
of trip-
outs
10 38 308 269 8.95 11
16 35 416 158 24.70 18
17 35 385 154 22.45 12
19 38 422 201 20.75 6
43 36 389 110 7.90 6
46 31 286 151 3.25 6
48 45 321 166 4.55 10
50 25 278 166 8.70 8
61 31 402 266 179 6
67 33 222 307 12.65 8
Fig. 7. Trip-outs rate as a function of the span length.
4
MATEC Web of Conferences 215, 01022 (2018) https://doi.org/10.1051/matecconf/201821501022ICTIS 2018

3.5 Height difference of tower tops
Figure 9. Shows the trip-out ratio as a function of the
height difference of the tower top. The height difference
of tower tops is calculated as the average difference
between the absolute value of the tower top from two
adjacent towers. The number of towers in the tower top
difference range was from 13 (21 – 50 m) to 44 (0 – 20
m). It is reported that the larger the difference of the
tower-top height, the higher the trip-out ratio [20].
However, in our dataset, there seems almost no relation
because the difference of the 44 towers out of 72 is in the
range of less than 20 m with 83 trip-outs out of 143. The
result of the investigation shows that the difference of
the tower top is not a dominant factor on the transmission line under study.
4. Location of Flashover
Figure 10. Shows the trip-out rate in circuits I and II
of the line between No. 1 and No. 140 towers. The high
rate of lightning trip-outs before and after the
improvement of the tower-footing resistance is seen in
circuit I. This is due to the placement of circuit I on the
north side from No. 1 to 37 towers, and on the east side
from No. 38 to No. 140 towers. In this area, the
thunderstorm often approaches the line from the
northeast and the towers often located on the ridge of the
mountain. Therefore, the insulator voltage on the circuit I is high due to the topology.
5. Analysis
5.1 Method of analysis
The critical current resulting in the flashover is
evaluated at two times, namely two µs and 6µs, as in the
case of the IEEE FLASH program by assuming the front
duration of the lightning current two µs. Such a
simplified method is used because the objective of this
thesis is to Improve the lightning protection design of the
transmission line. In the process, the insulator voltage is
calculated by the difference between the phase voltage
and the arm voltage as in [1]. The voltage and current are
calculated by the distributed constant circuit theory by
taking account of the coupling between the OHGW and
the phase conductors, the reflection at two adjacent
towers and the reflection at the interface of the struck
tower and the ground.
The corona-coupling model is incorporated through
the approximate diameter of the corona sheath [1]. The
ionizing effect of the ground is taken into account [2,7]
through a straightforward method (four parallel), and the
power-frequency voltage is also taken into account.
The critical flashover voltage (CFO) is calculated
based on the time to flashover by (4.2) [1,2,3,4,8,9].
Fig. 8. Trip-outs rate before and after improvement as a function
of the altitude.
Fig. 9 Effect of tower-height difference on the trip-out ratio.
Fig. 10 Rate of trip-outs for circuits I and II.
5
MATEC Web of Conferences 215, 01022 (2018) https://doi.org/10.1051/matecconf/201821501022ICTIS 2018

(1)
where CFO is critical flashover voltage, t is time to
flashover and D is the gap or insulator length (m)
5.2 Line model and lightning incidence to transmission line
A 47 km–long double-circuit line with the span length
of 333 m, simulating the range from No. 1 to No. 140
towers, was selected to estimate the lightning
performance of the transmission line under study. As the
most of the flashovers occur at the length of an arcing
horn gap of 0.9 m, the length of an arcing horn gap is
assumed to be 0.9 m.
The ground flash density is calculated by (2.2) [1-5]
by assuming the thunderstorm day is equal to the IKL of
165 days-year. In this way, the ground flash density is
calculated to be 23.65 flashes/.
Lightning incidence to overhead lines was calculated
to be 548.4 flashes/100 km-year through (2.3) [1-2].
The cumulative frequency distribution of the lightning
current is assumed to be given by (2.4) [1-2].
The back-flashover rate, BFR, is given as the product
of this probability and the number of strokes that
terminate on the towers. For simplicity, the number of
strokes to the towers is assumed to be 60% of all strokes
to the line as in (6) [1-2].
(2)
where is the critical current resulting in back-
flashover.
6. Results and Discussion
6.1 Trip-out Rates
Figures 11 (a) and (b) shows the comparison of
observed trip-out rates with the analysis by the IEEE
FLASH program version 1.81. The IEEE Flash program
recommends using tower-footing resistance measured at
low frequency because this value can be estimated easily
[1]. In the analysis, the average tower-footing resistance
with the flashover (47.7 or 10.7 ) and the average
tower footing resistance at towers No. 1–140 (33.3 or
5.6 ) are used, respectively. The average impulse
resistance of towers, the reduced resistance of the towers
due to the ionizing effect before and after the
improvement is set 23.8 Ω and 5.4 Ω, respectively, by
assuming the impulse resistance is about 50% of the
low-current value [2,3,4]. The impulse resistance is also
used in the analysis. The trip-out rates by the IEEE Flash
program are in good agreement with the observation
result before and after the improvement of the tower-
footing resistance when the impulse resistance of the
tower is used in the analysis. Meanwhile, the observation
result is lower than the trip-out rates by the IEEE Flash
in another case.
Figures 12 (a) and (b) Shows the dependence of trip-
out rates on arm location. The calculated results agree
reasonably well with the observation of lightning trip-out
rate. From these results, it is shown that the IEEE Flash
program and the IEEE method provides reasonable
estimates of the trip-out rates for the line under study by
taking into consideration the ionizing effect.
(a). Trip-out rates before improvement of tower-footing
resistance.
(b). Trip-out rates after improvement of tower-footing resistance.
Fig. 11. Trip-out rates by the IEEE FLASH program with
lightning trip-outs observation before (a) and after (b)
improvement of tower-footing resistance (Re).
6
MATEC Web of Conferences 215, 01022 (2018) https://doi.org/10.1051/matecconf/201821501022ICTIS 2018

7. Conclusion
The results of the lightning trip-out in West Sumatra in
Indonesia are presented. It is shown that the main
cause of the trip-outs is lightning, which causes 66%
of all trip-outs. The main conclusions are as follows:
1. The lightning trip-out rates of the studied line are
significantly affected by the tower-footing resistance
and the length of an arcing horn gap for the
transmission lines under study.
2. The trip-out rates calculated by taking into account
of the reduction of the tower-footing resistance due to
the ionizing effect agree well with the observed ones.
This indicates the importance of the impulse
resistance in the analysis of the lightning
performance of the line.
3. The trip-out rate at the lower arm is high for the cases
of the average grounding resistance of 33.3 ohms,
and the rates at the lower arm are high for the cases
of the average grounding resistance of 5.6 ohms. This
trend can be simulated by the IEEE method using the
impulse resistance.
4. The trend that the trip-out ratio becomes high with an
increase in the span length is significant after the
improvement of the tower-footing resistance.
However, the trend is weak before the improvement
of the tower-footing resistance. This is because, in
the case of the high tower-footing resistance, the
flashover occurs before the arrival of the wave
reflected from the adjacent towers due to the high
potential rise of the tower. Therefore, the degree of
the influence of the span length on the trip-out ratio
is dependent on the tower-footing resistance.
5. Local lightning activity significantly affects by the
trip-out rate. The high rate of lightning trip-out
before and after the improvement of the tower-
footing resistance is seen in circuit I. This is due to
the placement of circuit I on the north side of towers
No. 1 to 37 towers and on the east side of towers No.
38 to No. 140. In the next area, the thunderstorms
often approach the line and the towers from the
northeast.
6. The trip-out rate of the line under study can be
reduced to less than half of the present rate, 22
flashovers/100 km–year if the tower-footing
resistance of all the towers is set to less than 10 Ω
and the length of the arcing horn gap is set to more
than 1.2 m.
References
[1] Joint CIRED/CIGRE Working Group 05, “Protection of MV and LV Networks Againts Lightning Prt I: Basic Information”, IEE Conf. Publ. No. 438, vol. 1, 1997.
[2] Evgeni Volpov and Evgeni Katz, “Characterization of Local Environmental Data and Lightning Caused Outages in the IECO Transmission Line Network,” IEEE Trans. On Delivery, vol. 31, Issue. 2, pp. 640–647, April, 2016.
[3] Meteorological and Geophysical of Padang Panjang, “Annual report,” BMKG Padang Panjang, Indonesia, Dec. 2010.
[4] Y. Warmi and K. Michishita, "Investigation of Lightning Performance on 150 kV Transmission Line in West Sumatra", 9th Asia-Pacific International Conference on Lightning (APL 2015), 23 - 27 June 2015, Nagoya, Japan.
[5] Y. Warmi and K. Michishita, "A Study on Lightning Outages on 150 kV Transmission Line of Payakumbuh-Koto Panjang in West Sumatra in Indonesia”, 19th International Symposium on High Voltage Engineering (ISH 2015), 23 – 28 August 2015, Pilsen, Czech Republic.
[6] J. He, X. Wang, Z. Yu, and R. Zeng, “Statistical Analysis of Lightning Performance of
(a). Trip-out rates before improvement of tower-footing
resistance.
(b). Trip-out rates after improvement of tower-footing resistance.
Fig. 12. Dependence of trip-out rates on arm location
7
MATEC Web of Conferences 215, 01022 (2018) https://doi.org/10.1051/matecconf/201821501022ICTIS 2018

Transmission Lines in Several Regions of China,” IEEE Trans. Power Deliv., vol. 30, no. 3, pp. 1543–1551, 2014. https://ieeexplore.ieee.org/document/6924796/.
[7] R. de la Rosa, G. Enriquez, and J. L. Bonilla, “Contributions to lightning research for transmission line compaction,” IEEE Trans. Power Deliv., vol. 3, no.2, pp.716–723,Apr.1988. https://ieeexplore.ieee.org/document/4310/.
[8] I. M. Rawi and M. Z. A. A. Kadir, “Investigation on the 132kV overhead lines lightning- related flashovers in Malaysia,” in Proc. VIII International Symposium on Lightning Protection (SIPDA), Balneario Comboriu, Brazil, Oct 2015, pp. 239 – 243. https://ieeexplore.ieee.org/document/7339293/.
[9] M. Miyazaki, K. Nishiyama and M. Miki, T. Miki, “Overview of Statistical Data on Lightning Outages of Transmission Line in Japan,” CIGRE, C4-, 202, Japan, 2016.
[10] IEEE Guide for Improving the Lightning Performance of Transmission Lines, IEEE Standards board 1243-1997.
[11] Subcommittee for transmission lines, study committee a lightning risk, “Application Guide for Transmission Line Surge Arrester,” CRIEPI Report H-07 2012 (in Japanese).
[12] Transmission and distribution committee, “A simplified Method for Estimating Lightning Performance of Tranmission Lines, ” IEEE Trans.Power Apparatus and System, vol. PAS-104, no. 4, pp 918 – 932, July, 1985.
[13] F. M. Gatta, A. Geri, S. Lauria, M. Maccioni, and F. Palone, “Tower Grounding Improvement vs. Line Surge Arresters: Comparison of Remedial Measures for High-BFOR Subtransmission Lines,” IEEE Trans. Ind. Apl., vol. 51, no. 6, pp. 4952 – 4960, June 2015. https://ieeexplore.ieee.org/document/7131509/.
[14] S. Wu and W. Sun, “Back flashover protection performance analysis of 220kV double circuit transmission line,” in Proc. Asia-Pacific Conference Power and Energy Engineering, (APPEEC), Wuhan, Cina, March 2011, pp. 1– 4. https://ieeexplore.ieee.org/document/5749070/.
[15] A. Ametani and T. Kawamura, “A method of a lightning surge analysis recommended in Japan using EMTP,” IEEE Trans. Power Deliv., vol. 20, no. 2, pp. 867–875, Apr. 2005. https://ieeexplore.ieee.org/document/1413327/.
[16] J. Sardi and M. Z. A. Ab Kadir, “Investigation on the effects of line parameters to the lightning performance of 132 kV Kuala Krai-Gua Musang transmission line,” in Proc. 7th International Symposium on Power Engineering and Optimization, (PEOCO), Langkawi, Malaysia, June 2013, pp. 594 – 599. https://ieeexplore.ieee.org/document/6564617/?denied.
[17] E. F. Koncel, “Potential of a Transmission-Line Tower Top When Struck by Lightning,” Trans. Am. Inst. Electr. Eng., vol. 75, no. 3, pp. 457 – 462, Jan. 1956. https://ieeexplore.ieee.org/document/4499327/.
[18] A. Holdyk and B. Gustavsen, “Inclusion of Field Solver-Based Tower Footing Grounding Models in Electromagnetic Transients Programs,” IEEE Trans. Ind. Apl., vol. 51, no. 6, pp. 5101 – 5106, 2015. https://ieeexplore.ieee.org/document/7056439/.
[19] Meteorological and Geophysical of Padang Panjang, “Annual report,” BMKG Padang Panjang, Indonesia, Dec. 2014.
[20] Subcommittee for transmission lines, Lightning protection design committee, “Guide to Lightning Protection Design for Transmission Line, “CRIEPI Report T-72 2002 (in Japanese).
[21] The Distribution and Load Control Center Sumatra (Sumatra P3B), the monthly report, Sumatra P3B, Padang UPT, Indonesia, 2013.
[22] Y. Warmi and K. Michishita, “Horn Length Estimation for Decrease of Trip-out Rates on 150 kV Transmission Line in West Sumatra in Indonesia,” Joint Conference of The thenth International Workshop on High Voltage Engineering (IWHV 2016) and 2016 Japan-Koroea Joint Symposium on Electrical Discharge and High Voltage Engineering (JK 2016 on ED & HVE), ED–16–127, SP–16–056, HV–16–112, Miyazaki, Japan (2016.11.4). https://ci.nii.ac.jp/naid/40021027830/.
[23] Y. Warmi and K. Michishita, “Tower-footing Resistance and Lightning Trip-outs of 150 KV Transmission Lines in West Sumatra in Indonesia, ” International Review of Electrical Engineering (IREE), Vol 12, No 3, ISSN 1827 – 6660. https://doi.org/10.15866/iree.v12i3.12233.
8
MATEC Web of Conferences 215, 01022 (2018) https://doi.org/10.1051/matecconf/201821501022ICTIS 2018