Numerical Assessment of Isolated Footing Capacity due to its ...
26
Computational Engineering and Physical Modeling 5-2 (2022) 45-70 How to cite this article: Hasan M, Islam S, Ali AB, Rezuan M, Debnath T. Numerical Assessment of Isolated Footing Capacity due to its Size and the Impact of Neighboring Foundation. Comput Eng Phys Model 2022;5(2):45–70. https://doi.org/10.22115/cepm.2022.320189.1196 2588-6959/ © 2022 The Authors. Published by Pouyan Press. This is an open access article under the CC BY license (http://creativecommons.org/licenses/by/4.0/). Contents lists available at CEPM Computational Engineering and Physical Modeling Journal homepage: www.jcepm.com Numerical Assessment of Isolated Footing Capacity due to its Size and the Impact of Neighboring Foundation Mahadi Hasan 1 *, Shafiqul Islam 2 , Ayesha Binta Ali 3 , Mehebub Rezuan 1 , Tapas Debnath 1 1. Department of Civil Engineering, Ahsanullah University of science and Technology, Dhaka, Bangladesh 2. Assistant Professor, Department of Civil Engineering, Ahsanullah University of Science and Technology, Dhaka, Bangladesh 3. Lecturer, Department of Civil Engineering, Ahsanullah University of Science and Technology, Dhaka, Bangladesh Corresponding author: [email protected] https://doi.org/10.22115/cepm.2022.320189.1196 ARTICLE INFO ABSTRACT Article history: Received: 19 December 2021 Revised: 06 June 2022 Accepted: 07 July 2022 Shallow foundations are uses for safe transmission of structural load to the ground considering soil bearing capacity and allowable settlement. In this research, an empirical analysis is present by using Terzaghi and Meyerhof model. Which is compared with numerical analysis using PLAXIS 3D Foundation. Bearing capacity determined by both cases matched well. The purpose of the study is to predict the maximum allowable stress capacity of shallow foundation in different conditions and establish relationships between stress and settlements for different footing dimensions under various circumstances, as well as the impact of pressure bulb overlapping of two adjacent footing. There are some notable findings are found in this study such as Ultimate stress bearing capacity of soil under allowable settlement varies if two adjacent footings are placed 1.5 m apart. Similar results have been found by varying spacing 2 m & 2.5 m. Sizes of footing may have insignificant effect on spacing between two adjacent footings. And footing may act as an isolated footing in 3 m away from another footing on sandy soil and 2 m away from another footing on clayey soil. Keywords: Shallow footing; PLAXIS 3D; Stress; Settlement; Footing minimum spacing; Footing dimensions.
-
Upload
khangminh22 -
Category
Documents
-
view
2 -
download
0
Transcript of Numerical Assessment of Isolated Footing Capacity due to its ...

Computational Engineering and Physical Modeling 5-2 (2022) 45-70
How to cite this article: Hasan M, Islam S, Ali AB, Rezuan M, Debnath T. Numerical Assessment of Isolated Footing Capacity due
to its Size and the Impact of Neighboring Foundation. Comput Eng Phys Model 2022;5(2):45–70.
https://doi.org/10.22115/cepm.2022.320189.1196
2588-6959/ © 2022 The Authors. Published by Pouyan Press.
This is an open access article under the CC BY license (http://creativecommons.org/licenses/by/4.0/).
Contents lists available at CEPM
Computational Engineering and Physical Modeling
Journal homepage: www.jcepm.com
Numerical Assessment of Isolated Footing Capacity due to its Size
and the Impact of Neighboring Foundation
Mahadi Hasan1*, Shafiqul Islam2, Ayesha Binta Ali3, Mehebub Rezuan1, Tapas
Debnath1
1. Department of Civil Engineering, Ahsanullah University of science and Technology, Dhaka, Bangladesh
2. Assistant Professor, Department of Civil Engineering, Ahsanullah University of Science and Technology, Dhaka,
Bangladesh
3. Lecturer, Department of Civil Engineering, Ahsanullah University of Science and Technology, Dhaka, Bangladesh
Corresponding author: [email protected]
https://doi.org/10.22115/cepm.2022.320189.1196
ARTICLE INFO
ABSTRACT
Article history:
Received: 19 December 2021
Revised: 06 June 2022
Accepted: 07 July 2022
Shallow foundations are uses for safe transmission of
structural load to the ground considering soil bearing
capacity and allowable settlement. In this research, an
empirical analysis is present by using Terzaghi and
Meyerhof model. Which is compared with numerical
analysis using PLAXIS 3D Foundation. Bearing capacity
determined by both cases matched well. The purpose of the
study is to predict the maximum allowable stress capacity of
shallow foundation in different conditions and establish
relationships between stress and settlements for different
footing dimensions under various circumstances, as well as
the impact of pressure bulb overlapping of two adjacent
footing. There are some notable findings are found in this
study such as Ultimate stress bearing capacity of soil under
allowable settlement varies if two adjacent footings are
placed 1.5 m apart. Similar results have been found by
varying spacing 2 m & 2.5 m. Sizes of footing may have
insignificant effect on spacing between two adjacent
footings. And footing may act as an isolated footing in 3 m
away from another footing on sandy soil and 2 m away from
another footing on clayey soil.
Keywords:
Shallow footing;
PLAXIS 3D;
Stress;
Settlement;
Footing minimum spacing;
Footing dimensions.

46 M. Hasan et al./ Computational Engineering and Physical Modeling 5-2 (2022) 45-70
1. Introduction
Foundation is the lowest load bearing part of any structures. Shallow and deep foundation are the
two types of foundation, which distribute structures load to its underlying soil. Foundations should
be designed for taking care of soil at all depths pressures and for tolerating total and differential
movements. The ability of soil to hold any engineered structure pressure on soil without shear
failure is known as bearing capacity. Settlements of the foundations are going to be within
acceptable limits can’t make sure by applying an impact pressure. Settlement analysis should
generally be performed because most structures are sensitive to excessive settlement. The
theoretical maximum pressure which may be supported without failure is known as Ultimate
bearing capacity; allowable bearing capacity can be found by dividing ultimate bearing capacity
divided by an element of safety. On soft soil location under loaded foundations sometimes large
settlements may occur without actual shear failure occurring; in that type of cases, the allowable
bearing capacity is predicated on the utmost allowable settlement [1].
Geotechnical engineers are often deals with non-homogeneous layered soil under foundation, but
for engineering purposes they simplified in representation as homogeneous layers. Layered soil
failure mechanism depends on the soil properties and thickness of every layer. Layer which is
thicker and consists of weak soil the failure mechanism could also be limited within these layer
only and the remaining layers has no influence on it. The failure mechanism should be considered
for two or more layers for other cases [1].
Finite element analysis is a numerical technique. In this system all the complexities, like shape
variations, boundary conditions and loads are keep same but the obtained results are approximate.
Nowadays, it’s gaining engineers attentions for its variety and flexibility. Geotechnical and
structural analyzation within the deep excavations like the soil properties, details of structures,
construction sequences, and supply necessary information which is required for design purpose
can be done by Numerical analysis. This research has been done by using PLAXIS 3D
FOUNDATION [1].
There are two main parts of foundation design, one is the ultimate bearing capacities of the soil
under the foundation, and other is tolerable settlement which can withstand by footing without
affecting the superstructure. Determining the value of load that can handle by the soil under the
foundation before shear failure, is the aims of the ultimate bearing capacity. Researches on ultimate
bearing capacity are often administered using either analytical simulations or experimental
analyzation. The numerical simulation can be done using theory of plasticity or finite element
analysis, while the experimental analyses can be done by making prototype, model and full-scale
tests. While theoretical results matched with experimental results then the solution is satisfactory.
Soil layer assumed homogeneous and soil parameters are assumed remain constant for bearing
capacity analysis by analytical solution and Terzaghi’s bearing capacity theory, where results
matched well with each other’s. However, in some cases where the soil parameters vary with depth,
most of those theories can't be used, for that the analytical solutions that take into consideration
the non-homogeneity shows inaccurate results. There are two types of layered soil profiles, one is
naturally deposited and other is artificially made. The soil considered as homogeneous. The

M. Hasan et al./ Computational Engineering and Physical Modeling 5-2 (2022) 45-70 47
ultimate load failure surface within the soil depends on the shear strength parameters of the soil
layers, such as; soil layer thickness, footing shape, and footing size. So, it is important to work out
the profile and to calculate the bearing capacity accordingly [2].
Two types of layered soil profiles were taken, where a strong layer situated over a weak layer, and
vice versa. Within the literature, over the last four decades, several reports are often found handling
the matter of foundations situated over layered soils. For developing empirical formula to predict
the ultimate bearing capacity of footings, researchers analyze on the results of prototype in
laboratory model testing. In this chapter some relevant review about these reports are presented.
Now-a-days Finite element analysis is used extensively for geotechnical problem solutions [3].
Conventional finite element analyses are frequently used to predict the bearing capacity of
multilayered soils (Griffiths, 1982; Burd and Frydman, 1997). Various elasto-plastic parameters
are main reason for the steadiness of structures facing natural phenomena. The anisotropy of soil
shear strength and stiffness has been recognized as a crucial thing about many sorts of ground
deformation and failure issues (Nishimura, 2005). Soil-water interaction, Over consolidation ratio
(OCR), bonding effect or structured soil also are significant factors to effect on bearing capacity
of shallow foundation on clayey soil. Many researches are conducted to gauge static and dynamics
properties and make many co-relations with other soil index properties of soil [1].
The last three decades have witnessed a tremendous growth in the numerical method. For this, it
is possible to obtain more realistic and satisfactory results of the shallow footing design to make it
more economical. So many works are already found on this numerical method applied on strip
footing bearing capacity and settlement. Settlement modelling of raft footing founded on
Oderekpe/Abakaliki shale in south east region of Nigeria [4]. Strength Characterization of
foundation soils at federal university Lokoja based on standard penetration tests data [5]. Empirical
and numerical prediction of settlement and bearing capacity of foundations from SPT data in
North-West region of Nigeria [6]. Bearing capacity and settlement analysis of closely spaced
shallow foundations with various footing geometry on multi-layered soils [7]. Ultimate bearing
capacity of two interfering strip footings on sand overlying clay [8]. Study of Tilt on Adjacent Strip
Footings [9].
The Mohr-Coulomb model [10–12] is a linear elastic and perfectly plastic soil model that is used
to analyze soil behaviors in elastic zones. Hooke’s law of isotropic elasticity is followed in the
linear elastic part of the model and the perfectly plastic part is constructed on the Mohr-Coulomb
failure criterion. The model requires the following material properties: cohesion, friction angle,
dilatancy angle, unit weight, permeability and modulus of elasticity, which are well known to most
geotechnical engineers and can be obtained from basic tests on soil samples. Both effective and
undrained parameters can be considered depending upon the drainage type of the model [13].
In 1953 Button analyze on bearing capacity of a strip footing resting on two layers of clay soil.
Both layers are considered consolidated nearly equivalent. For calculation of ultimate bearing
capacity of foundation he assumed that the ultimate load failure surface is cylindrical, and curve
lies at the edge of the footing. Based on the upper soil layer and on the ratio of the cohesion of the
top/bottom clay layers the bearing capacity factors are used [14].

48 M. Hasan et al./ Computational Engineering and Physical Modeling 5-2 (2022) 45-70
In 1969 Meyerhof and Brown research on foundations staying on a stiff clay layer which is situated
over a soft clay layer, and then the soft layer situated over a stiff layer. They assumed that footing
fails by punching via top layer for first case, and fails with full development of the bearing capacity
of the bottom layer for second case. Acceptable modified bearing capacity factors got from
equations and charts, found from the empirical relationship which is found from experimental
results. The results of the research were summarized in charts, for utilizing during calculation of
bearing capacity of layered clay foundations, but these results are strongly suffering from the
characteristics of the clay tested because these are experimental. The aim of this research is to
present the results in a series of model footing which tests administered on two-layered clay soils,
and therefore the models have many restrictions. They're used only one types of clay, but strength
of the clay varied, the deformation properties remained constant. Using rigid strip and circular
footings with rough bases this research completed and only surface loading applied. During these
studies were made shear strength of the clay assumed as un-drained. Footings resting in
homogeneous clay a series of tests also conducted. They found that the failure pattern under a
footing is a function of the physical mode of the clay rupture, which depends on the structure of
the clay. The mechanism of failure of the structure situated on the clay isn't explained by
conventional Mohr-coulomb concepts of cohesion and friction [15].
In 1971 Ohri analyze on the effect of disturbance of two neighboring planes and rough square
footings under to vertical load which is situated in cohesion less soil. The failure mechanism
indicates fourfold symmetry and displacement is orthogonal to the sides. But it is often said that
this analyzation will provide a useful start line for a far better alternative boundary solution [16].
In 1974 Meyerhof research in the case where sand layer situated over a clay layer. He used dense
sand over soft clay and loose sand over stiff clay. Results found on circular and strip footings and
field data were compared with model tests results of the analyses of various modes of failure.
While dense sand situated over a soft clay deposit, the failure mechanism was assumed as nearly
truncated pyramidal shape, pushed into the clay in order that, for the case of general shear failure,
the friction angle of the sand and the un-drained cohesion of the clay are integrated within the
combined failure zones. Using this theory, for calculating the bearing capacity of strip, and circular
footings staying on dense sand over soft clay, semi-empirical formulas were developed. He carried
out some model tests on strip and circular footings on the surface and at shallow depths for the soil
profile dense sand layer overlying clay. Those tests result and the observations of field were found
to accept as true with the theory. The sand mass under the footing failed laterally by squeezing at
an ultimate load while loose sand situated on stiff clay. Formulas were developed for the ultimate
bearing capacity of strip and circular footings. Model tests were performing on strip and circular
footings, and it was found that the results also agreed with the developed theory. It was found from
theory and those test results that the impact of the sand layer thickness under the footing depends
mainly on the bearing capacity ratio of the clay to the sand, the friction angle of the sand, depth
and shape of the foundation. This research is restricted to vertically loaded footings only, it doesn't
include eccentric or inclined loads, and it's only describing about soil profile sand over clay, and
did not give any solution for clay over sand [17].

M. Hasan et al./ Computational Engineering and Physical Modeling 5-2 (2022) 45-70 49
In 1985 Georgiadis and Michalopoulos presented a numerical method for determining the bearing
capacity of shallow foundations resting on layered soil, which could be any combination of
cohesive and non-cohesive layers. Several potential failure surfaces were analyzed and then
minimum material factor for which foundation is stable was chosen. Variety of semi empirical
solutions for homogeneous and two-layer soil profiles, experiments and other numerical methods
including finite elements, and comparisons between the results found using this method, showed
the validity of the proposed method. Semi-empirical methods for the calculation of the bearing
capacity of shallow foundations on two-layer soil profile are based on the results of experimental
investigations. Most of them are restricted to variety of limited cases, and can't cover any layered
soil profiles; moreover, the bearing capacity computed with the varied semi- empirical formulas
are usually scattered. Within the case of quite two layers during a profile, the bearing capacities
are often computed with a finite element analysis or numerical analysis [18].
In 2013 Verma & Kumar have studied on different layered soils, for an equivalent thickness and
sort of soils in upper layer (fine gravel) lower layer (sand), if size of square test plates increases
bearing capacity increases and settlement decreases [19].
In 2013 Marto & Oghabi have analyzed on geo-grid presence within the soil and makes the
correlation between the applied pressure & settlement. They found their behavior is almost linear
until getting to the failure stage [20].
2. Research significance
The designers will find important information about choose footing size and spacing between two
adjacent footings in constructing shallow foundation on layered soil through this research. The
objectives of this research are:
➢ To predict the utmost allowable stress capacity of shallow foundation in several conditions.
➢ To predict minimum required spacing between two adjacent footings for acting as isolated
footing.
➢ To establish relationships of Stress, Settlements, Footing dimensions, Two adjacent footing
spacing.
➢ Comparing results of Numerical analysis and traditional methods.
It is essential to notice that the models were simple and only require minimum information.
Furthermore, the research also helps to predict about the bearing capacity, settlement, size of the
footing, minimum required spacing between two adjacent footings under different condition.
3. Methodology
Theoretically a precise analysis of bearing capacity and settlement is so lengthy because of data
collection from field and work with them in laboratory and analysis on them to find a result is
time-consuming. Besides, there are higher degree of indeterminacy and unpredictable behaviors
of soil. Analysis can do theoretically in many ways considering the empirical relations and
suggestions offered by numerous authors. This chapter deals mainly with the collection of soil

50 M. Hasan et al./ Computational Engineering and Physical Modeling 5-2 (2022) 45-70
parameters, development of soil model to estimate of ultimate load bearing capacity of footing and
the settlement of footing by empirical and as well as numerical system, and finally comparison
between empirical and numerical analysis result. Numerical analysis was performed by PLAXIS
3D FOUNDATION to obtain bearing capacity and settlement of footing in different soil
conditions. To predict the bearing capacity, settlement, size of the footing, minimum required
spacing between two adjacent footings under different conditions numerical analysis has been
performed. The research work has been progressed in following steps:
➢ Allowable bearing capacities of shallow foundations are calculated by conventional method as
well as numerical method.
➢ Settlements of shallow foundations are calculated by conventional method as well as numerical
method.
➢ Stress-Settlement graph is plotted for different spacing and the loads against 50 mm settlement
are considered to be the allowable settlement of shallow foundation.
➢ Stress-Dimension graph is plotted for different spacing and the loads against 50 mm settlement
are considered to be the allowable settlement of shallow foundation.
➢ Stress-Distance graph is plotted for different dimension and the loads against 50 mm settlement
are considered to be the allowable settlement of shallow foundation.
Afterward, evaluating several possible behavior patterns of shallow foundation have been
generalized as outcomes.
3.1. Different types of soil parameters
For the estimation of ultimate bearing capacity and settlement of shallow foundation in
conventional method, four different types of soil comprising layers of different parameters use as
representative samples. To represent a generalized foundation response, four soil profiles are
considered based on the contribution of Medium stiff clay, Dense sand and Medium dense sand as
shown in Figure 3.1. Soil type-1 and soil type-2 which are medium stiff clay over dense sand, are
used for bearing capacity calculation by conventional method and as well as numerical method for
50 mm allowable settlement, and finally the results are compared. Soil type-3 and soil type-4 which
are medium dense sand over medium stiff clay, are used for settlement calculation by conventional
method and as well as numerical method, and finally compare the both result. The considered
footing thickness is 0.5 meters that is placed at a depth of 2 meters from ground surface. The soil
layer is considered as 10-meter depth. Where, upper layer is equivalent to 2 meters + 0.5 meters
thickness of footing + 2 times of footing dimension. The rest is considered as lower soil layer.
We use these parameters for both numerical simulation (using PLAXIS 3D FOUNDATION) and
empirical method (using Terzaghi bearing capacity formula). For the allowable bearing pressures
and settlement of shallow foundations, footing plan dimension of 2 m by 2 m by .5 m for length,
breadth and depth respectively were assumed with safety factor 3 for soil type 1 & 3. Footing plan
dimension of 3 m by 3 m by .5 m for length, breadth and depth respectively were assumed with
safety factor 3 for soil type 2 & 4 [26].

M. Hasan et al./ Computational Engineering and Physical Modeling 5-2 (2022) 45-70 51
Fig. 1. Different types of layered soil a) Soil type-1, b) Soil type-2, c) Soil type-3, d) Soil type-4.
Table 1
Different soil parameters for this research. Parameters Unit Medium Stiff
Clay
Medium Dense
Sand
Dense
Sand
Referenc
e
Angle of internal friction
(Φ)
Degre
e
25 35 40 [21]
Modulus of elasticity (E) kN/m2 10,000 35,000 70,000 [22]
Soil unit weight (γ) kN/m3 16 16 18 [23]
Poisson’s ratio (ν) - 0.35 0.3 0.45 [24]
Soil Cohesion (C) kN/m2 25 1 2 [25]
Soil Model Mohr-Coulomb
Soil Behavior Undrained
3.2. Bearing capacity calculation through conventional methods
In layered soil profiles, soil unit weight, angle of internal friction and cohesion are not constant
throughout the depth. The ultimate failure surface may extend through two or more of the soil
layers. Within each layer in layered soil deposits, the soil can be assumed to be homogeneous while
the strength properties of adjacent layers are generally different.
Meyerhof and Hanna proposed a semi-empirical technique, based on small scale tests, to solve the
bearing capacity of a sand layer overlaying a clay layer [27]. As referred by Murthy et al. [28],
finite element method or numerical limit analysis were utilized by Burd and Frydman to obtain the
bearing capacity of two-layer clay foundation with distinctly different strength [29].
Terzaghi (1943) was introduce a widespread theory for evaluating the safe bearing capacity of
shallow foundation with unsmooth base and introduced three types of bearing capacity calculation
system based on failure pattern. They are general shear failure, local shear failure and punching
shear failure [30].

52 M. Hasan et al./ Computational Engineering and Physical Modeling 5-2 (2022) 45-70
Fig. 2. Terzaghi’s bearing capacity theory [31].
The ultimate bearing capacity for local shear failure for square footing is obtained as follows,
qu=0.867C'Nc'+γDfNq'+0.4γBNγ'
Notation:
qu = Ultimate bearing capacity of the underlying soil,
C′ = Cohesion of underlying soil, [25]
γ = Soil unit weight [23],
B = Dimension of each side of the foundation,
Df = Depth of foundation,
Nc′, Nq′, Nγ′ = Modified bearing capacity factors [32]
Result of bearing capacity:
Soil Type 1: By conventional method, qu= 528.8 kN/m2 & by Numerical analysis, qu= 550 kN/m2
Soil Type 2: By conventional method, qu= 444 kN/m2 & by Numerical analysis, qu= 360 kN/m2
It is found that bearing capacity determined by the conventional methods and numerical
simulations matched well.
3.3. Settlement calculation through conventional methods
Structural damage and disturbance to a building frame can caused by excessive settlements, such
as sticking doors and windows, cracks in tile and plaster, and excessive wear or equipment failure
from misalignment. It is necessary to investigate both shear resistance of base (ultimate bearing
capacity) and soil settlements for the stability of structure [2].
The types of foundation settlement are: Immediate settlement, Primary settlement, and Secondary
compression (creep). Primary settlement further divided into two types [32],
Normally consolidated clay: The present effective overburden pressure is the maxi-mum pressure
that the soil has ever experienced in its lifetime.
Over consolidated clay: The present effective overburden pressure is less than that which the soil
experienced in the past.
For Normally consolidated clay:
Sc =CcH
1+e0log10
δ0+Δδ
δ0 [32]

M. Hasan et al./ Computational Engineering and Physical Modeling 5-2 (2022) 45-70 53
For calculation of settlement taking three dimensional effect into account,
∆δavg =Δδt+4Δδm+Δδb
6 [32]
Notation,
Cc = Compressibility Index (0.27), [32]
H = Height of clay layer,
eo = Initial void ratio (0.9), [32]
δo = Effective overburden pressure, δo = γ(Df + H),
Δδ = Additional stress due to structure,
Δδt = Additional stress due to structure at top,
Δδm = Additional stress due to structure at mid height,
Δδb = Additional stress due to structure at bottom,
For Soil Type 3:
H = 3.5m, h= (6.5+3.5/2) =8.25m, δo= γh = (16x8.25) = 132 kN/m2.
Table 2
Data for calculation of additional stress due to structure by taking three dimensional effect into account. m=L/B h,(m) b=B/2 n=z/b I4 Δδ0 (kN/m2) Δδ (kN/m2)
1 6.5 1 6.5 .035 700 30.8
1 7.375 1 7.37 .044 700 24.5
1 8.25 1 8.25 .027 700 18.9
Notation,
m = length by width ratio,
h = depth,
Δδ0 = Structure Stress (Previous),
Δδ = Structure Stress (New),
I4 = Factor based on m and n value [32],
Here, Δδavg = (230.8+4*24.5+18.9)/6 =24.6 kN/m2.
For Soil Type 4:
H = 4.5m, h= (5.5+4.5/2) =7.75m, δo= γh = (16x7.75) = 124 kN/m2.
Table 3
Data for calculation of additional stress due to structure by taking three dimensional effect into account. m=L/B h,(m) b=B/2 n=z/b I4 Δδ0 (kN/m2) Δδ (kN/m2)
1 5.5 0.75 7.73 .035 800 28
1 6.62 0.75 8.83 .024 800 19.2
1 7.75 0.75 10.33 .019 800 15.2
Here, Δδavg = (28+4*19.2+15.2)/6 =20 kN/m2
Result of settlement Calculation:
For soil type-3: Using Conventional method, Sc=39.9 mm & using Numerical analysis, Sc=39.6
mm.
For soil type 4: Using Conventional method, Sc=41.5 mm & using Numerical analysis, Sc=46 mm.

54 M. Hasan et al./ Computational Engineering and Physical Modeling 5-2 (2022) 45-70
It is found that settlement determined by the conventional methods and numerical simulations
matched well. Now we can take PLAXIS 3D FOUNDATION results as standard and our procedure
is correct because it’s bearing capacity and settlement values matched with well-established
empirical results.
3.4. Geometric model and analysis
A square footing is loaded vertically at exactly its center point for ignoring any eccentrically effect
on foundation. The footing is 2 m below from soil surface and the thickness of footing is 0.5 m
and total soil profile taken as 10 m thick with varying top and bottom layer thickness and soil layer
types.
Fig. 3. Shallow Footing under Vertical Load [33].
Similar arrangements are prepared for different types of soil for models development and analysis
in PLAXIS 3D FOUNDATION software [34].
Step-1: Work planes are generated (Fig. 4) as horizontal planes at a certain vertical level in which
geometric points, lines and loads can be defined.
Fig. 4. Workplanes generation.
M. Hasan et al./ Computational Engineering and Physical Modeling 5-2 (2022) 45-70 55
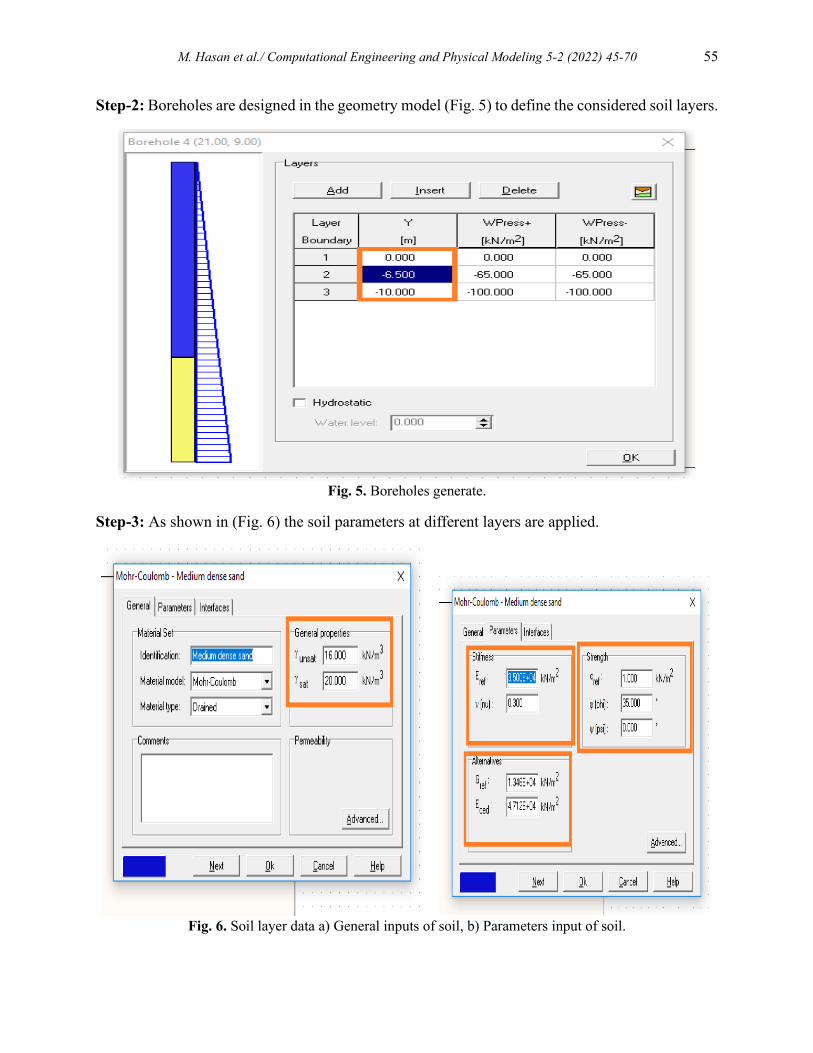
Step-2: Boreholes are designed in the geometry model (Fig. 5) to define the considered soil layers.
Fig. 5. Boreholes generate.
Step-3: As shown in (Fig. 6) the soil parameters at different layers are applied.
Fig. 6. Soil layer data a) General inputs of soil, b) Parameters input of soil.

56 M. Hasan et al./ Computational Engineering and Physical Modeling 5-2 (2022) 45-70
Step-4: The footing properties are also applied as showing (Fig. 7)
Fig. 7. Footing’s property input interface.
Step-5: (Fig.8) represents the geometric boundary of footing and load assignment location.
a) b)

M. Hasan et al./ Computational Engineering and Physical Modeling 5-2 (2022) 45-70 57
c) d)
Fig. 8. System of load assigning. a) Geometry lines, b) Assigning load c) Assigning floor, d) Assigning
footing as floor.
Step-6: To perform finite element calculations, the geometry has to be divided into small elements.
A composition of finite elements is called finite element mesh. When the geometry model is fully
defined and material properties have been assigned to all soil layer and structural object, it is
recommended to generate 2D and 3D mesh as shown in (Fig. 9). With the 3D mesh generation, the
geometry modeling process is complete. To illustrate the phases of construction as well as loading
stages, it is being proceeded into the “Calculation” mode afterward.
a)

58 M. Hasan et al./ Computational Engineering and Physical Modeling 5-2 (2022) 45-70
b)
Fig. 9. Generation of mesh for finite elements analysis. a) 2D mesh generate b) 3D mesh generate.
Step-7: In calculation mode different phases are generated like excavation, footing loading etc.
which are shown in (Fig.10).
Fig. 10. Creating calculation phases.

M. Hasan et al./ Computational Engineering and Physical Modeling 5-2 (2022) 45-70 59
Step-8: Load is applied on the shallow footing (Fig. 11) & (Fig. 12).
Fig. 11. Preview of an isolated footing and load.
a)
b)
Fig. 12. Preview of two adjacent footing. a) 2D mesh of two footing, b) Preview of two adjacent footing
and load.

60 M. Hasan et al./ Computational Engineering and Physical Modeling 5-2 (2022) 45-70
Step-9: Calculation proceeds which is shown in (Fig. 13).
a)
b)
Fig. 13. Calculation phase a) Calculations sheet, b) Confirmation of correct calculations.

M. Hasan et al./ Computational Engineering and Physical Modeling 5-2 (2022) 45-70 61
Step-10: Finally the settlement outputs are generated (Fig. 14).
Fig. 14. Settlements of Footing.
For different magnitude of applied loads, different settlements are found which are graphically
presented in Result and Discussion chapter.
4. Results and discussions
4.1. Maximum allowable stress determination
Stress is a physical quantity that expresses the internal forces that neighboring particles of a
continuous material exert on each other. The maximum average contact stress between the
foundation and the soil without failure is known as bearing capacity of soil. Using PLAXIS 3D
FOUNDATION maximum stress for different type of soils and different size of footings are
determined by trial method. Different load is applied on different size of footing in different soil
condition for finding maximum load bearing capacity in each condition under maximum allowable
settlement (50 mm). Finally, the ratio of maximum load in allowable settlement and footing area
is represented as maximum allowable stress.
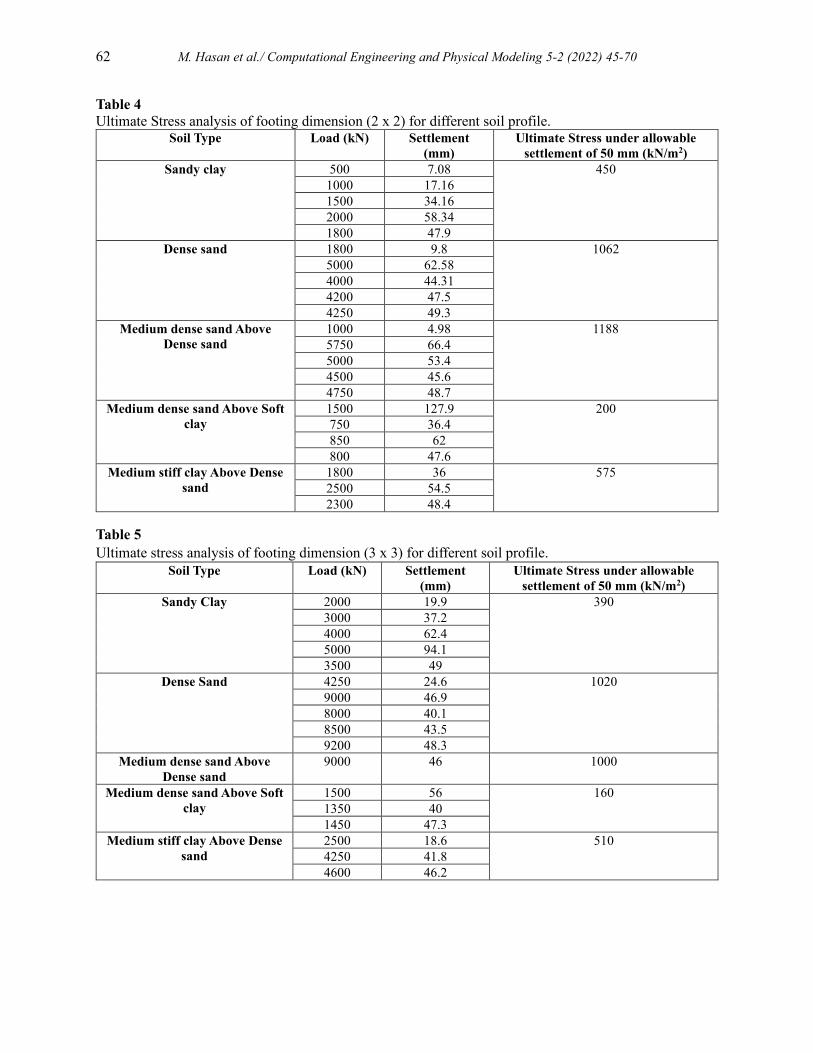
As shown in Table 4 & 5 as the footing size increases (from 2 x 2 to 3 x 3) the allowable stress
capacity of soil decreases for all types of soil considered in this study. The data of the table also
indicates that the presence of clayey soil in considerable depth shown significantly less bearing
capacity under allowable settlement. Based on allowable settlement the soil load bearing capacity
of considered soil can be arranged as:
Dense Sand> Medium Dense Sand above Dense Sand> Medium Stiff Clay above Dense Sand>
Sandy Clay> Medium Dense Sand above Soft Clay.
62 M. Hasan et al./ Computational Engineering and Physical Modeling 5-2 (2022) 45-70
Table 4
Ultimate Stress analysis of footing dimension (2 x 2) for different soil profile. Soil Type Load (kN) Settlement
(mm)
Ultimate Stress under allowable
settlement of 50 mm (kN/m2)
Sandy clay 500 7.08 450
1000 17.16
1500 34.16
2000 58.34
1800 47.9
Dense sand 1800 9.8 1062
5000 62.58
4000 44.31
4200 47.5
4250 49.3
Medium dense sand Above
Dense sand
1000 4.98 1188
5750 66.4
5000 53.4
4500 45.6
4750 48.7
Medium dense sand Above Soft
clay
1500 127.9 200
750 36.4
850 62
800 47.6
Medium stiff clay Above Dense
sand
1800 36 575
2500 54.5
2300 48.4
Table 5
Ultimate stress analysis of footing dimension (3 x 3) for different soil profile.
Soil Type Load (kN) Settlement
(mm)
Ultimate Stress under allowable
settlement of 50 mm (kN/m2)
Sandy Clay 2000 19.9 390
3000 37.2
4000 62.4
5000 94.1
3500 49
Dense Sand 4250 24.6 1020
9000 46.9
8000 40.1
8500 43.5
9200 48.3
Medium dense sand Above
Dense sand
9000 46 1000
Medium dense sand Above Soft
clay
1500 56 160
1350 40
1450 47.3
Medium stiff clay Above Dense
sand
2500 18.6 510
4250 41.8
4600 46.2

M. Hasan et al./ Computational Engineering and Physical Modeling 5-2 (2022) 45-70 63
4.2. Minimum required spacing between two adjacent footings
Numerical analysis indicates that the load bearing capacity of an individual footing may be affected
by adjacent footing’s location. A close interval of two footings reduces individual footing capacity
under allowable settlement. At a certain distance the influence becomes insignificant. The
minimum spacing at which two adjacent footing can be shown resistant equivalent to their
individual capacity have been summarized in Table 6.
Table 6
Required minimum spacing for sandy soil. Soil Type Footing
Dimension
(m2)
Max Allowable
Stress (kN/m2)
Settlement
(Max 50 mm)
Min Required
Spacing (m)
Sandy Clay 2 x 2 450 49 3
Dense Sand 2 x 2 1062 49.2 3
Medium Dense Sand
Above Dense Sand
2 x 2 1187 46.5 3
Sandy Clay 3 x 3 390 48.4 3
Dense Sand 3 x 3 1020 45.2 3
Medium Dense Sand
Above Dense Sand
3 x 3 1000 43 3
Table 7
Required minimum spacing for clayey soil. Soil Type Footing
Dimension
(m2)
Max Allowable
Stress (kN/m2)
Settlement
(Max 50 mm)
Min Required
Spacing (m)
Medium Dense Sand
Above Soft Clay
2 x 2 200 44.5 2
Medium Stiff Clay
Above Dense Sand
2 x 2 575 48.5 2
Medium Stiff Clay
Above Dense Sand
3 x 3 510 48.2 2
As shown in Table 6 and Table 7 it is obvious that minimum required spacing between two
consecutive shallow footings for sandy type soil is 3m (Fig. 16) and for clayey type soil is 2m (Fig.
15). If the footings are placed less than 3m in sandy type soil and less than 2m in clayey type soil,
then their influenced stress area overlaps. In that case smaller bearing capacity values should be
considered or combined footing could be a good alternative in the perspective of foundation level.
It is also noticeable that footing dimension (2 x 2) and dimension (3 x 3) behave almost similarly.
For both the cases minimum required spacing remains same. Which indicates footing dimension
may have no effects on required minimum spacing for not overlapping influenced stress area
between two adjacent footings.

64 M. Hasan et al./ Computational Engineering and Physical Modeling 5-2 (2022) 45-70
Fig. 15. Influenced stress area on clayey soil after application of load on footing.
Fig. 16. Influenced stress area on sandy soil after application of load on footing.

M. Hasan et al./ Computational Engineering and Physical Modeling 5-2 (2022) 45-70 65
4.3. Shallow footing behavior under allowable settlement (50 mm)
As the procedure mentioned in Methodology for numerical analysis, settlements of footing are
calculated for different stress conditions by using PLAXIS 3D FOUNDATION for different
footing dimensions. During this process spacing between two consecutive footings were kept 1.5
meter for different dimensions. Finally, the outcomes are represented as Stress vs Settlement graph
(Fig. 17).
This work has been repeated by keeping 2 meter (Fig. 18) & 2.5 meter (Fig. 19) spacing between
two adjacent footings to observe shallow footings behavior under allowable settlement of 50mm.
Following the same outcomes Stress vs Dimension graph (Fig. 20) and Stress vs Distance graph
(Fig. 21) are also plotted to show the behavior of shallow footing under allowable settlement.
Fig. 17. Stress vs. Settlement graph for different footing sizes (spacing 1.5 m fixed between two adjacent
footings).
Table 8
Regression analysis of Stress vs Settlement (spacing 1.5 m fixed between two adjacent footings). Footing Dimension (m2) Regression Equation Regression value, R2
1 x 1 y=10.96x+370.2 0.986
1.5 x 1.5 y=7.623x+221.1 0.989
2 x 2 y=6.867x+132.5 0.990
2.5 x 2.5 y=5.627x+81.13 0.980
3 x 3 y=4.840x+69.39 0.998
Fig. 17 represents the combined graph of Stress vs Settlement for 1.5 meter spacing between two
adjacent footings. Each graph line represents stress capacity of different footing dimensions under
allowable settlement of 50mm. The regression values of best fitted lines indicate a good
representation which can be extended for larger values (Table 8). From Figure 8, it is very clear
0
200
400
600
800
1000
1200
1400
1600
0 20 40 60 80 100 120 140 160
Str
ess
(KN
/m2)
→
Settlement (mm) →
Dimension=(1x1)
Dimension=(1.5x1.5)
Dimension=(2x2)
Dimension=(2.5x2.5)
Dimension=(3x3)

66 M. Hasan et al./ Computational Engineering and Physical Modeling 5-2 (2022) 45-70
that as the footing size increases, the graph lines representing higher dimensions continue to
dragging down below. It indicates as the footing size increases the stress capacity decreases.
Fig. 18. Stress vs. Settlement graph for different footing size (spacing 2 m fixed between two adjacent
footings).
Table 9
Regression analysis of Stress vs. Settlement (spacing 2 m fixed between two adjacent footings). Footing Dimension (m2) Regression Equation Regression value, R2
1 x 1 y=11.55x+398.6 0.979
1.5 x 1.5 y=8.807x+268.5 0.991
2 x 2 y=6.788x+157.4 0.984
2.5 x 2.5 y=5.102x+139.6 0.983
3 x 3 y=4.500x+89.63 0.992
Fig. 19. Stress vs Settlement graph for different footing size (spacing 2.5 m fixed between two adjacent
footings).
0
200
400
600
800
1000
1200
1400
1600
0 20 40 60 80 100 120 140 160
Str
ess
(KN
/m2)
→
Settlement (mm) →
Dimension=(1x1)
Dimension=(1.5x1.5)
Dimension=(2x2)
Dimension=(2.5x2.5)
Dimension=(3x3)
0
200
400
600
800
1000
1200
1400
1600
0 20 40 60 80 100 120 140 160
Stre
ss (
KN
/m2)
→
Settlement (mm) →
Dimension=(1x1)
Dimension=(1.5x1.5)
Dimension=(2x2)
Dimension=(2.5x2.5)
Dimension=(3x3)

M. Hasan et al./ Computational Engineering and Physical Modeling 5-2 (2022) 45-70 67
Table 10
Regression analysis of Stress vs Settlement (spacing 2.5 m fixed between two adjacent footings). Footing Dimension (m2) Regression Equation Regression value, R2
1 x 1 y=10.47x+397.6 0.981
1.5 x 1.5 y=8.121x+290 0.993
2 x 2 y=7.078x+159.6 0.984
2.5 x 2.5 y=5.710+97.14 0.971
3 x 3 y=4.905+88.67 0.991
Fig. 18 & Fig. 19 represents the repetition of Stress vs Settlement analysis for 2 meter and 2.5
meter spacing between two adjacent footings respectively. Similar to Fig. 17 each cases it is
noticed that as the footing size increases, the graph lines representing higher dimensions continue
to dragging down below by indicating as the footing size increases the stress capacity decreases.
Fig. 20. Stress vs. Dimension graph for different spacing (settlement 50 mm fixed).
Fig. 20 represents the combined graph of Stress vs. Dimension for allowable settlement of 50mm.
It is noticeable that the points of the curved lines representing different spacing in graph are located
very close to each other. As shown in graph stress capacity varies for (1 x 1) footing 925-975
kN/m2, for (1.5 x 1.5) footing 600-710 kN/m2, for (2 x 2) footing 475-520 kN/m2, for (2.5 x 2.5)
footing 360-400 kN/m2, for (3 x 3) footing 310-330 kN/m2.
So spacing may have negligible effect on variation of footing sizes. And it is also noticeable that
as the size of the footing increases stress bearing capacity decreases which was seen in earlier
analyzation on Stress vs. Settlement. (Fig. 17, Fig. 18 & Fig. 19).
0
200
400
600
800
1000
1200
1 1.5 2 2.5 3
Str
ess
(KN
/m2)
→
Dimension (m * m) →
Spacing 1.5m
Spacing 2m
Spacing 2.5m

68 M. Hasan et al./ Computational Engineering and Physical Modeling 5-2 (2022) 45-70
Fig. 21. Stress vs. Distance graph for different footing size (settlement 50 mm fixed).
Fig. 21 represents the combined graph of Stress vs. Distance under allowable settlement of 50mm
for different dimensions. The graph lines representing different dimensions are found as flat
indicating less stress deviation in varying spacing between two adjacent footings.
It is also observed that as the size of the footing increases stress bearing capacity under allowable
settlement of soil decreases similarly found on Stress vs. Settlement (Fig. 17, Fig. 18 & Fig. 19)
& Stress vs. Dimension analysis. (Fig. 20).
5. Conclusion
Using PLAXIS 3D FOUNDATION software different dimensions of footings have been analyzed
in different conditions of layered soil for finding the generated stress capacity of footing under
allowable settlement, isolated footing’s influence area and to check them with conventional
methods. And then executing analysis over those outcomes, other relevant findings have also been
originated which are being conclusively recommended here.
Analyzing through all the test model results of these are the outcomes have been sorted out:
➢ The data of the Table 4 & Table 5 indicates that the presence of clayey soil in considerable
depth shown significantly less bearing capacity under allowable settlement.
➢ Footing may act as an isolated footing in 3 m away from another footing on sandy soil as
shown in Table 6. It is noticed that two adjacent footing’s influenced stress area don’t overlap if
the footings are placed 3 meter apart on sandy soil.
➢ Footing may act as an isolated footing in 2 m away from another footing on clayey soil as
shown in Table 7. It is noticed that two adjacent footing’s influenced stress area don’t overlap if
the footings are placed 2 meter apart on clayey soil.
➢ Sizes of footing may have insignificant effect on spacing between two adjacent footings.
As shown in (Fig. 22), stress capacity varies for (1 x 1) footing 925-975 kN/m2, for (1.5 x 1.5)
footing 600-710 kN/m2, for (2 x 2) footing 475-520 kN/m2, for (2.5 x 2.5) footing 360-400 kN/m2,
0
200
400
600
800
1000
1200
1 1.5 2 2.5 3
Str
ess
(KN
/m2)
→
Distance (m) →
1x1
1.5x1.5
2x2
2.5x2.5
3x3

M. Hasan et al./ Computational Engineering and Physical Modeling 5-2 (2022) 45-70 69
for (3 x 3) footing 310-330 kN/m2 for different spacing between two adjacent footings. Similar
studies have been noticed on (Fig. 23), where varying spacing has not any significant impact on
generated stress on footing. So spacing may have negligible effect on variation of footing sizes.
Designers may find useful solutions to choose footing size in different soils considering stress
bearing capacity, designers may also find economical solution in choosing isolated or combined
footing in case of 2m or 3m gap for two adjacent footings based on soil type through this research.
In this research several parameters have been left unused and untouched i.e. effect of ground water,
cutback problem, many other soil types etc. For making the results of this research more
representative, reliable and precise, research on other parameter should be done in future. The
recommended parameters which should be investigated in future are as follows:
➢ Perform numerical analysis under those soil samples which is collected from different field
conditions.
➢ For estimating ground water effect on footing, Ground water level at various positions
needs to be considered.
➢ Effect of cutback on shallow foundation need to perform. Because there are so many
plumbing and gas line without proper planning which means any correction or check on that line
need to cut near foundation area in future.
Conflicts of Interest
On behalf of all authors, the corresponding author states that there is no conflict of interest.
References
[1] Banik S. Determination of bearing capacity of shallow foundation on Dhaka sub-soil using
subloading tij model 2014.
[2] S. A. Settlement of Strip footing on Sand Mat Placed over Thick Soft Clay Deposit. Bangladesh
University Of Engineering And Technology, Master Thesis. 2016.
[3] Nakai T, Shahin HM, Zhang F, Hinokio M, Kikumoto M, Yonaha S, et al. Bearing capacity of
reinforced foundation subjected to pull-out loading in 2D and 3D conditions. Geotext Geomembranes
2010;28:268–80. https://doi.org/10.1016/j.geotexmem.2009.09.013.
[4] Bunyamin S, Aghayan S. Settlement Modelling of Raft Footing Founded on Oferekpe/Abakaliki
Shale in South East Region of Nigeria. Comput Eng Phys Model 2018;1:68–82.
[5] Sadeeq J, Salahudeen A. Strength characterization of foundation soils at federal university lokoja
based on standard penetration tests data. Niger J Technol 2017;36:671–6.
https://doi.org/10.4314/njt.v36i3.2.
[6] Salahudeen AB, Eberemu AO, Ijimdiya TS, Osinubi KJ. Empirical and numerical prediction of
settlement and bearing capacity of foundations from SPT data in North-West region of Nigeria. Niger
J Eng 2017;23:31–41.
[7] Amorin MEC, Ventura GP. Bearing capacity and settlement analysis of closely spaced shallo w
foundations with various footing geometry on multi-layered soils. Evol Geotech 2022:339.
[8] Zheng G, Zhao J, Zhou H. Ultimate bearing capacity of two interfering strip footings on sand
overlying clay. Acta Geotech 2021;16:2301–11. https://doi.org/10.1007/s11440-021-01153-5.

70 M. Hasan et al./ Computational Engineering and Physical Modeling 5-2 (2022) 45-70
[9] Anaswara S, Shivashankar R. Study of Tilt on Adjacent Strip Footings, 2021, p. 517–25.
https://doi.org/10.1007/978-981-15-5644-9_39.
[10] Smith IM, Griffiths DV, Margetts L. Programming the finite element method. John Wiley & Sons;
1982.
[11] Koiter WT. General theorems for elastic plastic solids. Prog Solid Mech 1960:167–221.
[12] Van Langen H, Vermeer PA. Automatic step size correction for non-associated plasticity problems.
Int J Numer Methods Eng 1990;29:579–98. https://doi.org/10.1002/nme.1620290308.
[13] Asif TH, Islam S, Basak A, Shahriar F, Rahman SMS. Application of Numerical Method in
Assessing the Variations in Pile Group Efficiency under Different Circumstances. Comput Eng Phys
Model 2022;5:50–68. https://doi.org/10.22115/cepm.2022.324662.1200.
[14] Button SJ. The bearing capacity of footing on a two-layer cohesive subsoil. Proc 3^< Rd> ICSMFE,
1953 1953;1:332–5.
[15] Brown JD, Meyerhof GG. Experimental study of bearing capacity in layered clays. Soil Mech Fdn
Eng Conf Proc/Mexico/, 1969.
[16] A A, NK A, A. D. An Overview of Bearing Capacitay od Shallow Foundation. Compliance Eng
2020;11:393.
[17] Meyerhof GG. Ultimate Bearing Capacity of Footings on Sand Layer Overlying Clay. Can Geotech
J 1974;11:223–9. https://doi.org/10.1139/t74-018.
[18] Georgiadis M, Michalopoulos AP. Bearing Capacity of Gravity Bases on Layered Soil. J Geotech
Eng 1985;111:712–29. https://doi.org/10.1061/(ASCE)0733-9410(1985)111:6(712).
[19] Sanjeev K V, Pradeep KJ, Rakesh K. Prediction of bearing capacity of granular layered soil by plate
load test. Int J Adv Eng Res Stud E-ISSN2249–8974 2013.
[20] Marto A, Oghabi M, Eisazadeh A. The effect of geogrid reinforcement on bearing capacity properties
of soil under static load. Univ Teknol Johor Bahru 2013.
[21] Meyerhof G.G. Foundation engineering handbook, 1956
[22] “USACE”. Settlement Analysis, 1990.
[23] Lindeburg. Civil Engineering Reference Manual, 2001, 8th Edition.
[24] Table from das, 1994. [18 October 2019].
[25] Bowles JE. Foundation analysis and design. 1996.
[26] Salahudeen AB, Sadeeq JA. Investigation of shallow foundation soil bearing capacity and settlement
characteristics of Minna City Centre development site using Plaxis 2D software and empirical
formulations. Niger J Technol 2017;36:663–70.
[27] Meyerhof GG, Hanna AM. Ultimate bearing capacity of foundations on layered soils under inclined
load. Can Geotech J 1978;15:565–72. https://doi.org/10.1139/t78-060.
[28] Vinod P. Analyses Of Two-Layer Soil Systems Beneath Rigid Footings 2013.
[29] Burd HJ, Frydman S. Bearing capacity of plane-strain footings on layered soils. Can Geotech J
1997;34:241–53. https://doi.org/10.1139/t96-106.
[30] Imam Al Kudrot EE. Evaluation of soil characteristics for determination of bearing capacity of
shallow foundation based on CPT 2015.
[31] https://en.wikipedia.org/wiki/Foundation _(engineering) ,17 August 2020 n.d.
[32] Das BM, Sivakugan N. Principles of foundation engineering. Cengage learning; 2018.
[33] https://cdeep.iitb.ac.in n.d.
[34] Brinkgreve RBJ. Tutorial Manual PLAXIS 3D Foundation. Delft Univ Technol Plaxis Bv Netherl
2013;665.