TIPE3 Is the Transfer Protein of Lipid Second Messengers that Promote Cancer
37
Cancer Cell Article TIPE3 Is the Transfer Protein of Lipid Second Messengers that Promote Cancer Svetlana A. Fayngerts, 1 Jianping Wu, 2 Camilla L. Oxley, 3 Xianglan Liu, 4 Anastassios Vourekas, 1 Terry Cathopoulis, 1 Zhaojun Wang, 1 Jian Cui, 4 Suxia Liu, 4 Honghong Sun, 1 Mark A. Lemmon, 3 Lining Zhang, 4 Yigong Shi, 2, * and Youhai H. Chen 1, * 1 Department of Pathology and Laboratory Medicine, Perelman School of Medicine, University of Pennsylvania, Philadelphia, PA 19104, USA 2 School of Life Sciences, Tsinghua University, Beijing 100084, China 3 Department of Biochemistry and Biophysics, Perelman School of Medicine, University of Pennsylvania, Philadelphia, PA 19104, USA 4 Institute of Immunology, School of Medicine, Shandong University, Jinan, Shandong 250012, China *Correspondence: [email protected] (Y.S.), [email protected] (Y.H.C.) http://dx.doi.org/10.1016/j.ccr.2014.07.025 SUMMARY More than half of human cancers have aberrantly upregulated phosphoinositide signals; yet how phospholipid signals are controlled during tumorigenesis is not fully understood. We report here that TIPE3 (TNFAIP8L3) is the transfer protein of phosphoinositide second messengers that promote cancer. High-resolution crystal structure of TIPE3 shows a large hydrophobic cavity that is occupied by a phospholipid-like molecule. TIPE3 preferentially captures and shuttles two lipid second messengers, i.e., phosphatidylinositol 4,5- bisphosphate and phosphatidylinositol 3,4,5-trisphosphate, and increases their levels in the plasma mem- brane. Notably, human cancers have markedly upregulated TIPE3 expression. Knocking out TIPE3 diminishes tumorigenesis, whereas enforced TIPE3 expression enhances it in vivo. Thus, the function and metabolism of phosphoinositide second messengers are controlled by a specific transfer protein during tumorigenesis. INTRODUCTION Tumorigenesis is a multistep process orchestrated by several classes of molecules that control cell death and/or growth. The TNFAIP8 (tumor necrosis factor-alpha-induced protein 8, or TIPE) family of proteins has been recently described as regula- tors of tumorigenesis and inflammation (Kumar et al., 2004; Sun et al., 2008). TNFAIP8 promotes tumor metastasis and is a risk factor for non-Hodgkin’s lymphoma in humans and for bacterial infection in mice (Ahn et al., 2010; Zhang et al., 2012). Similarly, TIPE2 (TNFAIP8L2) regulates both carcinogenesis and inflammation, and its germline deletion leads to fatal inflam- matory diseases (Gus-Brautbar et al., 2012; Sun et al., 2008; Wang et al., 2012). TIPE1 has been reported to regulate cell death (Hitomi et al., 2008), whereas the role of TIPE3 has not yet been described. How TNFAIP8 family regulates tumorigen- esis is largely unknown. Phosphoinositides constitute approximately 1% of lipids in the eukaryotic plasma membrane, but they play a major role as signaling molecules in both normal and tumor cells. There are seven phosphoinositides, which are generated by phosphoryla- tion of the inositol ring of phosphatidylinositol (PtdIns) on the third, fourth, and/or fifth hydroxyl groups (Fruman et al., 1998). PtdIns 4,5-bisphosphate (PtdIns(4,5)P 2 ) plays key signaling roles (Kwiatkowska and Sobota, 1999; McLaughlin et al., 2002). It is the precursor of at least three second messengers: inositol 1,4,5-trisphosphate (Ins(1,4,5)P 3 ) and diacylglycerol generated through hydrolysis by phospholipase C (PLC) isoforms; and PtdIns(3,4,5)P 3 generated through phosphorylation by phos- phoinositide-3 kinases (PI3Ks). More than half of human cancers have aberrantly upregulated PtdIns(3,4,5)P 3 or PtdIns(4,5)P 2 sig- nals. While somatic mutations of PTEN, Ras, and the a catalytic subunit of PI3K (PIK3CA) account for many cases of the phos- phoinositide signaling upregulation, other mechanisms of the Significance More than half of human cancers have aberrantly upregulated phosphoinositide signals; yet how lipid signals are controlled in cancer cells is not fully understood. The TNFAIP8 family of proteins has been recently described as a risk factor for human cancer, although its mechanisms of action are largely unknown. We report here that TIPE3 (TNFAIP8L3) is the transfer pro- tein of two lipid second messengers, PtdIns(4,5)P 2 and PtdIns(3,4,5)P 3 , and is hijacked by cancer cells to cause malignant transformation. This finding explains why normal cells can control their phospholipid signals but cancer cells cannot, a phe- nomenon widely recognized but poorly understood. Therefore, TIPE3 may represent a therapeutic target for treating malig- nant diseases. Cancer Cell 26, 1–14, October 13, 2014 ª2014 Elsevier Inc. 1 Please cite this article in press as: Fayngerts et al., TIPE3 Is the Transfer Protein of Lipid Second Messengers that Promote Cancer, Cancer Cell (2014), http://dx.doi.org/10.1016/j.ccr.2014.07.025
Transcript of TIPE3 Is the Transfer Protein of Lipid Second Messengers that Promote Cancer

Please cite this article in press as: Fayngerts et al., TIPE3 Is the Transfer Protein of Lipid Second Messengers that Promote Cancer, Cancer Cell (2014),http://dx.doi.org/10.1016/j.ccr.2014.07.025
Cancer Cell
Article
TIPE3 Is the Transfer Proteinof Lipid Second Messengers that Promote CancerSvetlana A. Fayngerts,1 Jianping Wu,2 Camilla L. Oxley,3 Xianglan Liu,4 Anastassios Vourekas,1 Terry Cathopoulis,1
Zhaojun Wang,1 Jian Cui,4 Suxia Liu,4 Honghong Sun,1 Mark A. Lemmon,3 Lining Zhang,4 Yigong Shi,2,*and Youhai H. Chen1,*1Department of Pathology and Laboratory Medicine, Perelman School of Medicine, University of Pennsylvania, Philadelphia, PA 19104, USA2School of Life Sciences, Tsinghua University, Beijing 100084, China3Department of Biochemistry and Biophysics, Perelman School of Medicine, University of Pennsylvania, Philadelphia, PA 19104, USA4Institute of Immunology, School of Medicine, Shandong University, Jinan, Shandong 250012, China
*Correspondence: [email protected] (Y.S.), [email protected] (Y.H.C.)http://dx.doi.org/10.1016/j.ccr.2014.07.025
SUMMARY
More thanhalf of humancancershaveaberrantly upregulatedphosphoinositide signals; yet howphospholipidsignals are controlled during tumorigenesis is not fully understood. We report here that TIPE3 (TNFAIP8L3) isthe transfer protein of phosphoinositide second messengers that promote cancer. High-resolution crystalstructure of TIPE3 shows a large hydrophobic cavity that is occupied by a phospholipid-like molecule.TIPE3 preferentially captures and shuttles two lipid second messengers, i.e., phosphatidylinositol 4,5-bisphosphate and phosphatidylinositol 3,4,5-trisphosphate, and increases their levels in the plasma mem-brane.Notably, humancancers havemarkedly upregulatedTIPE3expression. Knockingout TIPE3diminishestumorigenesis, whereas enforced TIPE3 expression enhances it in vivo. Thus, the function andmetabolism ofphosphoinositide second messengers are controlled by a specific transfer protein during tumorigenesis.
INTRODUCTION
Tumorigenesis is a multistep process orchestrated by several
classes of molecules that control cell death and/or growth. The
TNFAIP8 (tumor necrosis factor-alpha-induced protein 8, or
TIPE) family of proteins has been recently described as regula-
tors of tumorigenesis and inflammation (Kumar et al., 2004;
Sun et al., 2008). TNFAIP8 promotes tumor metastasis and is
a risk factor for non-Hodgkin’s lymphoma in humans and for
bacterial infection in mice (Ahn et al., 2010; Zhang et al., 2012).
Similarly, TIPE2 (TNFAIP8L2) regulates both carcinogenesis
and inflammation, and its germline deletion leads to fatal inflam-
matory diseases (Gus-Brautbar et al., 2012; Sun et al., 2008;
Wang et al., 2012). TIPE1 has been reported to regulate cell
death (Hitomi et al., 2008), whereas the role of TIPE3 has not
yet been described. How TNFAIP8 family regulates tumorigen-
esis is largely unknown.
Significance
More than half of human cancers have aberrantly upregulated pin cancer cells is not fully understood. The TNFAIP8 family of prcancer, although its mechanisms of action are largely unknowntein of two lipid second messengers, PtdIns(4,5)P2 and PtdInstransformation. This finding explains why normal cells can contnomenon widely recognized but poorly understood. Thereforenant diseases.
Phosphoinositides constitute approximately 1%of lipids in the
eukaryotic plasma membrane, but they play a major role as
signaling molecules in both normal and tumor cells. There are
seven phosphoinositides, which are generated by phosphoryla-
tion of the inositol ring of phosphatidylinositol (PtdIns) on the
third, fourth, and/or fifth hydroxyl groups (Fruman et al., 1998).
PtdIns 4,5-bisphosphate (PtdIns(4,5)P2) plays key signaling roles
(Kwiatkowska and Sobota, 1999; McLaughlin et al., 2002). It is
the precursor of at least three second messengers: inositol
1,4,5-trisphosphate (Ins(1,4,5)P3) and diacylglycerol generated
through hydrolysis by phospholipase C (PLC) isoforms; and
PtdIns(3,4,5)P3 generated through phosphorylation by phos-
phoinositide-3 kinases (PI3Ks). More than half of human cancers
have aberrantly upregulated PtdIns(3,4,5)P3 or PtdIns(4,5)P2 sig-
nals. While somatic mutations of PTEN, Ras, and the a catalytic
subunit of PI3K (PIK3CA) account for many cases of the phos-
phoinositide signaling upregulation, other mechanisms of the
hosphoinositide signals; yet how lipid signals are controlledoteins has been recently described as a risk factor for human. We report here that TIPE3 (TNFAIP8L3) is the transfer pro-(3,4,5)P3, and is hijacked by cancer cells to cause malignantrol their phospholipid signals but cancer cells cannot, a phe-, TIPE3 may represent a therapeutic target for treating malig-
Cancer Cell 26, 1–14, October 13, 2014 ª2014 Elsevier Inc. 1
0
1
2
3
0 10 20 30 40
TIP
E3
RN
A MEF, PDGF
Tumor Adjacent tissue
A
F
G
0 5
10 15 20 25
shTIPE3 shScr
Cel
l num
ber,
105
** **
** 0 5
10 15 20
shTIPE3 shScr
Cel
l num
ber,
105
**
** *
0
0.5
1
1.5 **
0
0.5
1
1.5
Num
ber o
f col
onie
s
**
0
0.5
1
1.5
Num
ber o
f col
onie
s
**
TIP
E3
RN
A NIH3T3, PDGF
NCI-H727
T24 HT-29
NCI-H727
T24 HT-29
0 1 2 3 4 5 6
shScr
Cel
l num
ber,
106
**
**
Eso
phag
us
Lung
Tumor Adjacent tissue
Tumor Adjacent tissue
p < 0.001 TI
PE
3 ex
pres
sion
sco
re 10
0 2 4 6 8
Tumor Adjacent tissue
p < 0.001 10
0 2 4 6 8
TIP
E3
expr
essi
on s
core
Num
ber o
f col
onie
s
B C
D E
(legend on next page)
Cancer Cell
TIPE3 in Phospholipid Signaling and Cancer
2 Cancer Cell 26, 1–14, October 13, 2014 ª2014 Elsevier Inc.
Please cite this article in press as: Fayngerts et al., TIPE3 Is the Transfer Protein of Lipid Second Messengers that Promote Cancer, Cancer Cell (2014),http://dx.doi.org/10.1016/j.ccr.2014.07.025

Cancer Cell
TIPE3 in Phospholipid Signaling and Cancer
Please cite this article in press as: Fayngerts et al., TIPE3 Is the Transfer Protein of Lipid Second Messengers that Promote Cancer, Cancer Cell (2014),http://dx.doi.org/10.1016/j.ccr.2014.07.025
dysregulation are being discovered as well (Vivanco and Saw-
yers, 2002; Yuan and Cantley, 2008). In this report, we describe
a mammalian transfer protein for PtdIns(4,5)P2 and PtdIns(3,4,5)
P3 and examine its role in phosphoinositide signaling.
RESULTS
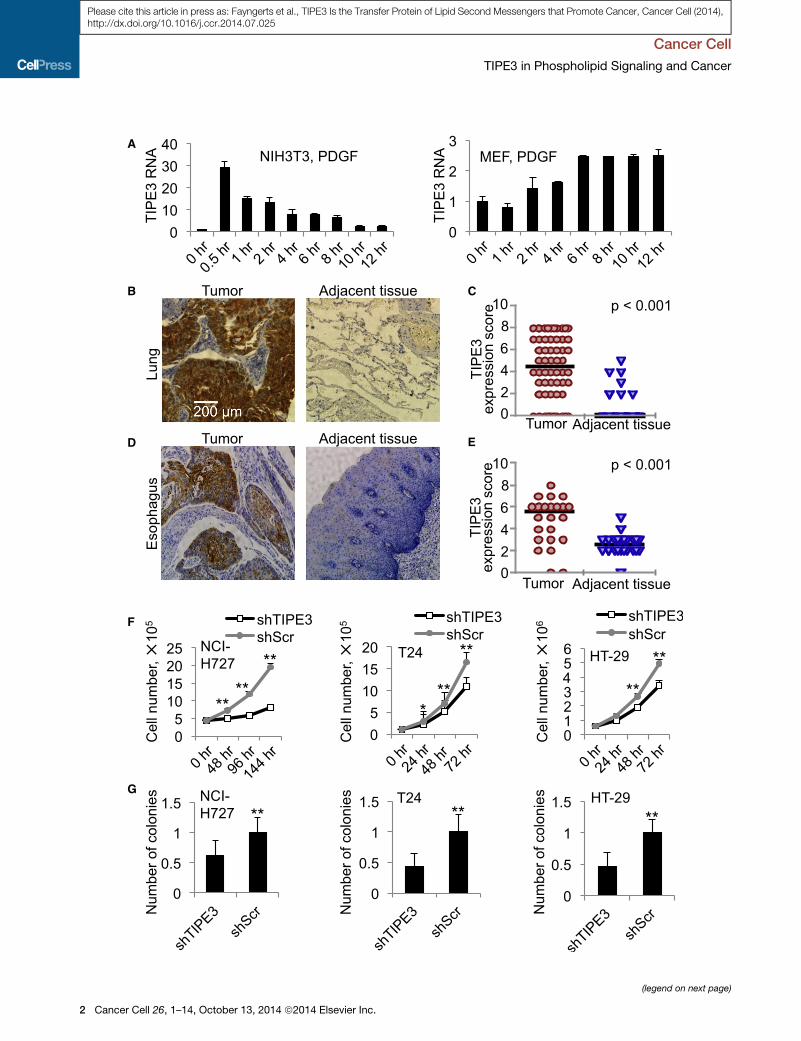
TIPE3 Is Markedly Upregulated in Four Types of HumanCancers and in Cells Treated with Growth FactorsTIPE3 is expressed in a wide range of organs, but its expression
levels vary greatly (Figure S1A available online). High levels of
TIPE3 messenger RNA (mRNA) were detected in murine uterus
and developing embryos, whereas little or no TIPE3 was de-
tected in lymphoid organs. Moderate expression of TIPE3 was
observed in many organs, including intestine, lung, brain,
bladder, and colon (Figure S1A). Similarly, murine and human
cell lines have varying levels of TIPE3 expression (Figures S1B
and S1C). It is interesting that, when treated with platelet-derived
growth factor (PDGF), serum-starved NIH 3T3 cells and primary
murine embryonic fibroblasts (MEFs) both markedly upregulated
TIPE3 expression in a time-dependent manner (Figure 1A).
To determine TIPE3 expression in human tumors, we studied,
by immunohistochemistry, tumor samples from 60 lung cancer
patients and 24 esophageal cancer patients. Marked upregula-
tion of TIPE3 protein was observed in the majority of tumor sec-
tions compared with adjacent nontumor sections from the same
patients (Figures 1B–1E; Figures S1D and S1E). Additionally, we
also detected significant TIPE3 upregulation in human cervical
cancer (70 patients) and colonadenocarcinoma (82 patients)
(data not shown). These results indicate that, similar to other
TIPE proteins, TIPE3 may be involved in tumorigenesis.
Overexpressing TIPE3 Promotes Tumorigenesis,whereas Knocking out TIPE3 Inhibits ItTo explore the potential role of TIPE3 in tumorigenesis, we used
knockdown, knockout, and overexpression approaches. Trans-
fection with a short hairpin RNA (shRNA) that targets TIPE3
(shTIPE3) significantly reduced TIPE3 expression in three human
cancer cell lines: NCI-H727 lung carcinoma cells (with KRasV12
and PIK3CAE545 mutations), T24 bladder carcinoma cells (with
HRasV12mutation), and HT-29 colorectal adenocarcinoma cells
(with PIK3CAT449 and BRAFV600E mutations) (Figures S1F and
S1G). This was associated with significant reduction in total cell
numbers (Figure 1F) and compromised ability of the cells to form
colonies in soft agar (Figure 1G). Conversely, when overex-
pressed, TIPE3 significantly increased the numbers of 293T cells
Figure 1. Upregulation of TIPE3 Expression Correlates with Tumorigen
(A) RT-PCR analyses of TIPE3 mRNA levels in the NIH 3T3 fibroblast cell line (lef
stimulated with 20 (left) and 50 (right) ng/ml of PDGF for the indicated times before
(right) and MEF (left) at 0 hr were set as 1.
(B–E) TIPE3 upregulation in human cancers. Immunohistochemistry analyses o
patients diagnosed with lung cancer (B and C) and esophageal cancer (D and E)
expression in tumors and adjacent tissues of 60 patients with lung cancer (C)
Supplemental Experimental Procedures. Each data point represents a TIPE3 exp
(F) Cell growth analysis of human NCI-H727, T24, and HT-29 cells stably expres
indicated times.
(G) Soft agar colony formation of NCI-H727, T24, and HT-29 cells expressing eithe
set as 1.
For (A), (F), and (G), values represent means ± SD. *p < 0.05; **p < 0.01. The experim
with HRasV12 or PIK3CAE545 mutation (Figure S2A) and of
HRasV12-transformed NIH 3T3 cells (NIH 3T3-HRasV12) (Fig-
ure 2A). TIPE3 overexpression also increased the size of the col-
onies formed in soft agar (Figures 2B and S2B) and accelerated
cell cycle progression as evidenced by a reduced population
of G0/G1 cells and increased S/G2/M cells (Figure 2C). These
results indicate that TIPE3 promotes tumor cell growth in vitro.
To examine the effect of TIPE3 on tumorigenesis in vivo, we
first injected NIH 3T3-HRasV12 cells with or without TIPE3 over-
expression into nude mice (nu/nu). Strikingly, both tumor onset
and tumor growth were significantly accelerated in the TIPE3
group (Figure 2D). By day 10 following tumor cell injection, tu-
mors of the TIPE3 group were twice as large as those of the con-
trol group (p < 0.05, n = 14) (Figures 2E and S2C). The difference
in tumor size wasmost likely due to enhanced proliferation of the
TIPE3-overexpressing cells because increased bromodeoxyuri-
dine (BrdU) incorporation was observed in tumor sections of
the TIPE3 group (Figures 2F and S2D). Cell death, as determined
by cleaved (active) caspase-3 staining, may also play a role
because 0.86% cells in TIPE3-transfected tumors underwent
cell death compared to 1.94% cells in the control tumors
(Figure S2E).
Next, we studied carcinogen-induced tumorigenesis in the
recently generated Tipe3 knockout (Tipe3�/�) mice (Figure S2F).
Under pathogen-free conditions, thesemice developed normally
and did not exhibit noticeable signs of spontaneous diseases
during the first 3 months of their lives (data not shown). However,
following subcutaneous injection with the carcinogen 3-methyl-
cholanthrene, Tipe3�/� mice exhibited a markedly delayed skin
tumor onset and reduced tumor size in comparison with wild-
type (WT)mice (Figures 2G and 2H). As expected, Tipe3�/� fibro-
sarcoma cells grew much slower than WT controls in the culture
(Figure 2I).
The Unique N-Terminal Region of TIPE3 Is Essential forIts Effect on Cell Growth and SurvivalUnlike other members of the TNFAIP8 family that were capable
of inducing cell death, TIPE3 did not reduce cell viability in the
culture (Figures S2A and S2G). To the contrary, when overex-
pressed in NIH 3T3 cells, TIPE3 was able to increase the per-
centage of S phase cells, even in the absence of the oncogenic
Ras (Figure 3A). Consistent with this observation, TIPE3 drives
cap-dependent protein synthesis required for G1-S transition.
Cotransfection of TIPE3-expressing vector and green fluores-
cence protein (GFP)-expressing vector that contained a cap-
dependent translation initiation site significantly increased the
esis
t) and C57BL/6 MEFs (right). Cells were first serum starved for 12 hr and then
being collected for the RNA analyses. The expression levels of TIPE3 in NIH 3T3
f TIPE3 protein expression in tumors and their adjacent normal tissues from
. TIPE3-positive cells are shown in brown (B and D). Quantitation of the TIPE3
and 24 patients with esophageal cancer (E) was performed as described in
ression score of patients. The horizontal bars represent the medians.
sing either shTIPE3 or short hairpin scrambled (shScr) RNA (control) over the
r shTIPE3 or shScr. Numbers of colonies formed by cells expressing shScr were
ents were repeated at least three timeswith similar results. See also Figure S1.
Cancer Cell 26, 1–14, October 13, 2014 ª2014 Elsevier Inc. 3

WTTipe3-/-
A B C
D E F
G H I
0
20
40
60
51.3 64
34 27.3
14.7 8.7
0 20 40 60 80
100
HRasV12/ HRasV12/
G2/M S
0 2 4 6 8
10 12 14
HrasV12/TIPE3 HRasV12/vector
0 10 20 30 40 50
HRasV12/TIPE3 HRasV12/vector
**
Cel
l num
ber,
105
**
Brd
U in
corp
orat
ion,
%
Tum
or v
olum
e (m
m3 )
, 10
2
**
* **
Tumors
*
HRasV12/vector
HRasV12/TIPE3 TIPE3 vector
0 0.5
1 1.5
2 2.5
HRasV12/ HRasV12/
*
Aver
age
size
of c
olon
ies
TIPE3 vector
Cel
l cyc
le, %
TIPE3 vector
**
** **
Tum
or in
cide
nce,
% Tipe3-/-
WT
p<0.01
Tum
or v
olum
e (m
m3 )
, 10
2
10 8 64 2 0
WTTipe3-/-Tipe3-/-
WT
p<0.01
0 2 4 6 8
10 **
**
Tipe3-/-
WT10 8 64 2 0
10 8 64 2 0
Cel
l num
ber100
80 60 40 20 0
HRasV12/ HRasV12/
HRasV12/TIPE3
1 cm
days
Figure 2. TIPE3 Promotes Tumorigenesis, Cell Growth, and Cell Survival In Vitro and In Vivo
(A–C) Analyses of cell growth (A), relative colony size in soft agar (B), and cell cycle progression (C) of NIH 3T3-HRasV12 cells stably transfected with either TIPE3-
Flag or empty vector. For (B), number of colonies formed by NIH 3T3-HRasV12 cells transfected with empty vector was set as 1. The experiments were repeated
at least three times with similar results. Values represent means ± SD.
(D–F) TIPE3 promotes tumor growth in a murine xenograft model. Nude mice (n = 14) were injected subcutaneously with NIH 3T3-HRasV12 cells stably
transfected with either TIPE3-Flag or empty vector. (D) Tumor volume was determined over a course of 10 days. (E) At day 10, tumors were excised and
photographed. In vivo cell proliferation was analyzed by BrdU incorporation. (F) The percentages of BrdU-positive cells in tumor sections are shown. Results are
representative of two independent experiments. Values represent means ± SD.
(G–I) Tipe3 deficiency reduces tumor growth in mice. Tipe3�/� mice and wild-type (WT) controls (n = 15), 7 weeks of age, were injected subcutaneously with
3-methylcholanthrene. (G) Tumor incidence was examined for up to 17 weeks. Data are pooled from two independent experiments. (H) Tumor volume was
monitored for up to 17weeks. Results are representative of two independent experiments. Values represent means ± SEM; the p values shown are for differences
after week 11. (I) Growth of Tipe3�/� andWT fibrosarcoma cells over the indicated times. Data are pooled from three independent Tipe3�/� and two independent
WT fibrosarcoma cell cultures established from different 3-methylcholanthrene-induced tumors. The cell numbers at 0 hr were set as 1. The experiments were
repeated four times with similar results.
Values represent means ± SD. *p < 0.05; **p < 0.01. See also Figure S2.
Cancer Cell
TIPE3 in Phospholipid Signaling and Cancer
Please cite this article in press as: Fayngerts et al., TIPE3 Is the Transfer Protein of Lipid Second Messengers that Promote Cancer, Cancer Cell (2014),http://dx.doi.org/10.1016/j.ccr.2014.07.025
expression of GFP (Figure 3B). The TIPE3 effect was less
apparent in cells transfected with a GFP-expressing vector
that contained an internal ribosome entry site (Figure S3A). The
4 Cancer Cell 26, 1–14, October 13, 2014 ª2014 Elsevier Inc.
effect of TIPE3 on cap-dependent GFP expression was signifi-
cantly reduced by the PI3K inhibitor LY294002 and/or the
MEK-ERK pathway inhibitor PD98059 (Figure S3B), indicating

Cancer Cell
TIPE3 in Phospholipid Signaling and Cancer
Please cite this article in press as: Fayngerts et al., TIPE3 Is the Transfer Protein of Lipid Second Messengers that Promote Cancer, Cancer Cell (2014),http://dx.doi.org/10.1016/j.ccr.2014.07.025
that TIPE3 may play a role in the regulation of the PI3K-AKT and
MEK-ERK signaling pathways.
As stated earlier, TIPE3 overexpression reduced the percent-
age of dying tumor cells in nude mice. In vitro, a similar effect
was observed in cultured NIH 3T3 cells. TIPE3 significantly
decreased serum deprivation-induced death of NIH 3T3 cells,
as assessed by trypan blue staining (Figure 3C) and cleaved
caspase-3 staining (Figure S3C), and the addition of the PI3K
inhibitor LY294002 abolished this effect (Figures S3C and S3D).
All TIPE family proteins contain a highly conserved TIPE2
homology (TH) domain consisting of seven a helices (Fig-
ure S3E) (Zhang et al., 2009). TIPE3 has a unique N-terminal
(NT) sequence of 19 amino acids, designated as the NT region
here, which is not seen in other members of the TIPE family.
Hypothesizing that the TIPE3 NT region is important for its
unique ability to promote cell growth and survival, we investi-
gated the effect of deleting it. A truncated TIPE3 variant lacking
amino acids 2–20 (trTIPE3) not only lost the function of TIPE3 but
also appeared to exert a dominant negative effect. Overexpres-
sion of trTIPE3 significantly reduced cell growth, decreased
the number of S-phase cells, enhanced cell death, and reduced
cap-dependent translation (Figures 3D–3I). The trTIPE3 effect on
serum starvation-induced cell death was not further enhanced
by LY294002, suggesting that trTIPE3 might inhibit the PI3K
pathway (Figure 3F). Notably, when cotransfected into the
same cells, the inhibitory effects of trTIPE3 on cell growth and
death prevailed over those of WT TIPE3, indicating that trTIPE3
may function in a dominant negative fashion (Figures 3J and
3K). It is to be noted that location of the Flag-tag did not affect
TIPE3 functions (Figures 3L and 3M). TIPE2, another member
of the TIPE family that exhibits similar activities as trTIPE3 in
cell growth and death, completely lost its function when fused
to the NT region of TIPE3 (Figures 3L and 3M).
TIPE3 Promotes Activation of the PI3K-AKT andMEK-ERK PathwaysTIPE3 overexpression in NIH 3T3 cells substantially enhanced
AKT phosphorylation, whereas trTIPE3 overexpression reduced
it, and similar effects were seen for phosphorylation of ERK and
p70S6K (Figure 4A; Figure S4A). Both AKT and ERK regulate
cyclin D1 levels and thus influence cell cycle G1-S transition.
Cyclin D1 levels were elevated in NIH 3T3 cells transfected
with TIPE3 and decreased in cells transfected with trTIPE3
(Figures 4A and S4A). Additionally, TIPE3 enhanced HRasV12-
induced phosphorylation of AKT and ERK in NIH 3T3 cells
(Figures 4A and S4A).
On the other hand, TIPE3 knockdown human NCI-H727 and
T24 carcinomas cells and Tipe3 knockout murine fibrosarcoma
cells showed significantly decreased phosphorylation of both
AKT and ERK (Figure 4B; Figures S4B and S4C). In HT-29 cells,
TIPE3 knockdown impaired AKT activation but did not affect
ERK activation.
To gain more insight into TIPE3-mediated regulation of AKT
and ERK activation, we treated NIH 3T3 cells with PDGF in the
absence or presence of overexpressed TIPE3. PDGF markedly
increased the levels of phosphorylated AKT and ERK, which
were further augmented by TIPE3 (Figures 4C and 4D; Figures
S4D and S4E). The PI3K inhibitor LY294002 completely blocked
AKT phosphorylation, whereas rapamycin that inhibits the
mammalian target of rapamycin had no effect (Figures 4C and
S4D), indicating that TIPE3 amplifies PI3K-dependent activation
of AKT. However, LY294002 did not change the level of ERK
phosphorylation, whereas PD98059, a MEK inhibitor, abolished
ERK phosphorylation entirely, with or without TIPE3 overexpres-
sion. It is interesting that U-73122, an inhibitor of PLC, and bisin-
dolylmaleimide I, an inhibitor of PKC, overpowered the effect of
TIPE3 on ERK phosphorylation (Figures 4D and S4E).
TIPE3 Regulates Phosphoinositide Metabolism andSignalingWeobserved significant increases in the total levels of PtdIns(4,5)
P2 inTIPE3-overexpressingcellsusing threeapproaches:protein-
lipid overlay assay with PLCd-Pleckstrin homology (PH) domain
that specifically binds PtdIns(4,5)P2 (Figure 4E), immunofluores-
cence confocal microscopy of fixed cells with anti-PtdIns(4,5)P2
antibody (Figures S4F and S4G), and immunoblotting with an
anti-PtdIns(4,5)P2 antibody (Figure S4H). Similarly, the total pool
of PtdIns(3,4,5)P3 was also markedly increased (�4-fold) in
TIPE3-overexpressing cells (Figures 4E and S4H). Consistent
with these results, significant reductions in the PtdIns(4,5)P2
and PtdIns(3,4,5)P3 cellular levels were observed in Tipe3
knockout murine fibrosarcoma cells as compared to WT cells
(Figure S4I). The effect of overexpressed TIPE3 was dependent
on the NT region since the trTIPE3 that lacks it decreased
PtdIns(4,5)P2 and PtdIns(3,4,5)P3 levels (Figure S4J).
To visualize changes in PtdIns(4,5)P2 and PtdIns(3,4,5)P3
levels following stimulation of cells with PDGF, we performed
confocal microscopy of fixed cells using GFP-tagged PH
domains. In untreated NIH 3T3 cells, PLCd-PH-GFP, which
selectively binds PtdIns(4,5)P2, was localized predominantly to
the plasma membrane (Figure 5A; Figure S5A). PDGF stimula-
tion (for 5.5 min) significantly reduced membrane-bound but
increased cytoplasmic PLCd-PH-GFP signals, which is consis-
tent with PI3K- and PLC-induced PtdIns(4,5)P2 depletion.
Remarkably, TIPE3 overexpression significantly increased the
membrane-bound PLCd-PH-GFP signal in both untreated and
PDGF-treated cells, whereas trTIPE3 overexpression greatly
decreased it (Figures 5A and S5A). It is important to note that
TIPE3 overexpression completely eliminated the PDGF-induced
reduction of the membrane-bound PLCd-PH-GFP signal (vector
versus TIPE3 groups), indicating that PtdIns(4,5)P2 depletion
was not significant in the presence of overexpressed TIPE3.
The GRP1 and AKT PH domains selectively bind PtdIns(3,4,5)
P3 and PtdIns(3,4,5)P3/PtdIns(3,4)P2, respectively (Ferguson
et al., 2000). In untreated NIH 3T3 cells, AKT-PH-GFP was local-
ized primarily to the cytoplasm and weakly to the nucleus and
plasma membrane; GRP1-PH-GFP was localized prominently
to the nucleus and weakly to the cytoplasm (Figures 5B and
5C; Figures S5B and S5C). A few minutes after PDGF stimula-
tion, both AKT-PH-GFP and GRP1-PH-GFP showed a notice-
able translocation to the plasma membrane. TIPE3 significantly
increased the levels of plasma membrane-bound AKT-PH-GFP
and GRP1-PH-GFP in both untreated and PDGF-stimulated
cells. These TIPE3 effects were dependent on the NT region
since the trTIPE3 that lacks it had the opposite effects (Figures
5B and 5C; Figures S5B and S5C).
Although slightly concentrated at the plasma membrane,
TIPE3 protein was distributed throughout the cytoplasm of
Cancer Cell 26, 1–14, October 13, 2014 ª2014 Elsevier Inc. 5

68.4 66.7
11.8 15.8 19.8 17.5
0 20 40 60 80
100
trTIPE3 vector
G2/M S G0/G1
0 10 20 30 40 50 trTIPE3
vector
59.8 66.7
24 15.8 16.2 17.5
0 20 40 60 80
100
TIPE3 control
G2/M S G0/G1
0
10
20
30
40
TIPE3 vector
0 0.5
1 1.5
2 2.5
CMV-
TIPE3 vector
0 0.5
1 1.5
2 2.5
CMV-
TIPE3 vector
ns
Cel
l cyc
le, %
**
**
** **
EGFPG
FP, M
FI
**
** Cel
l dea
th ,
%
EGFP
GFP
, mR
NA
TIPE3 vector
A B C
0
0.5
1
1.5
0
10
20
30 0.5 1 2 4 µg
0
5
10
15
Cel
l dea
th ,
% ns
Cel
l dea
th ,
%
0 10 20 30 40 50
ns
**
Cel
l dea
th ,
% **
**
Cel
l num
ber
ns
**
Cel
l num
ber
ns
0
10
20
30 trTIPE3 vector
**
Cel
l num
ber,
105
** **
D E F
**
Cel
l dea
th ,
%
ns
** ns
Cel
l cyc
le, %
*
ns
**
0
0.5
1
1.5 trTIPE3 vector
Cel
l num
ber
** **
0
0.5
1
1.5 trTIPE3 vector
0
0.5
1
1.5
CMV-EGFP
trTIPE3 vector
GFP
, mR
NA** **
GFP
, MFI
G H I
0
0.5
1
1.5
J K L M
GFPGFP
Figure 3. The NT Region of TIPE3 Is Essential for Its Ability to Promote Cell Growth and Survival
(A) Cell cycle analysis of NIH 3T3 cells stably transfected with either TIPE3-Flag or empty vector.
(B) 293T cells were cotransfected with pEGFP-C3 (50cap-GFP, for cap-dependent translation) and either TIPE3-Flag-expressing or empty vector. The relative
levels of GFP protein expression 32 hr after transfection were quantified by measuring the cellular mean fluorescence intensity (MFI) (left), whereas the relative
levels of GFP mRNA were determined by real-time PCR (right). Protein and mRNA levels of cells transfected with empty vector were set as 1.
(legend continued on next page)
Cancer Cell
TIPE3 in Phospholipid Signaling and Cancer
6 Cancer Cell 26, 1–14, October 13, 2014 ª2014 Elsevier Inc.
Please cite this article in press as: Fayngerts et al., TIPE3 Is the Transfer Protein of Lipid Second Messengers that Promote Cancer, Cancer Cell (2014),http://dx.doi.org/10.1016/j.ccr.2014.07.025

Cancer Cell
TIPE3 in Phospholipid Signaling and Cancer
Please cite this article in press as: Fayngerts et al., TIPE3 Is the Transfer Protein of Lipid Second Messengers that Promote Cancer, Cancer Cell (2014),http://dx.doi.org/10.1016/j.ccr.2014.07.025
untreated cells (Figure 5D; Figures S5A–S5C). On PDGF ac-
tivation, TIPE3 protein translocated from cytoplasm to plasma
membrane, yielding a clear appearance of plasma membrane
localization (Figures 5E and S5A–S5C). No such PDGF-induced
effect was seen for the trTIPE3 protein, although a fraction of the
protein was also localized to the plasma membrane (Figures 5D
and S5A–S5C).
To determine whether altering TIPE3 subcellular localization
changes the phosphoinositide distribution, we fused TIPE3
with GFP to force it to go into the nucleus as previously
described (Seibel et al., 2007). We found that TIPE3 was
excluded from the nucleus, whereas GFP and the TIPE3-GFP
fusion protein were present in the nucleus, indicating that GFP
confers the ability for TIPE3 to enter this organelle (Figures
S5D–S5F). Notably, we observed strong PtdIns(4,5)P2 staining
in the nuclei of all cells expressing TIPE3-GFP but not in those
of cells expressing TIPE3 or GFP alone or in nontransfected cells
(p < 0.0001) (Figures S5D–S5F).
The Crystal Structure of TIPE3 Reveals a Lipid-BindingScaffoldTo help elucidate the molecular mechanism by which TIPE3
functions, we sought to determine its crystal structure. We crys-
tallized the full-length conserved TH domain, i.e., a trTIPE3 that
lacks amino acids 2–20, in the space group I222 (Protein Data
Bank [PDB] ID: 4Q9V). The structure was determined by molec-
ular replacement, and the atomic model was refined at 2.3 A
resolution (Figure 6A; Table S1).
The structure of the crystallized TIPE3 consists of an NT a0
helix and six additional helices (a1–a6) that are similar to those
observed for TIPE2 (residues 24–184; PDB ID: 3F4M) (Zhang
et al., 2009). The helices a1–a6 of TIPE3 can be aligned to those
of TIPE2 with a root-mean-squared deviation (RMSD) of 0.574 A
over 128 aligned Ca atoms (Figure 6B). The most prominent
feature of the TH fold is the presence of a large centrally located
hydrophobic cavity (Figure 6C), which, with 20 A in depth and
10 A in diameter, was thought to be the binding site for a lipo-
philic molecule. Similar to TIPE2 (Zhang et al., 2009), the hydro-
phobic cavity in TIPE3 is occupied by two tubes of electron
density (each measuring approximately 20 A in length), which
(C) NIH 3T3 cells stably transfected with either TIPE3-Flag or empty vector wer
assessed by trypan blue staining.
(D) Cell growth of NIH 3T3 cells stably transfected with either trTIPE3-Flag or em
(E) Relative numbers of 293T cells transfected with the indicated amounts of trT
Number of 293T cells transfected with 0.5 mg of empty vector was set as 1.
(F) NIH 3T3 cells stably transfected with either trTIPE3-Flag or empty vectors were
times. Cell death was assessed by trypan blue staining.
(G) Cell death of 293T cells transfected with the indicated amounts of trTIPE3-Fl
(H) Cell cycle analysis of NIH 3T3 cells stably transfected with either trTIPE3-Fla
(I) 293T cells were cotransfected with pEGFP-C3 and either trTIPE3-Flag-expres
transfection were quantified by measuring cellular MFI, whereas the relative levels
mRNA levels of cells transfected with empty vector were set as 1.
(J and K) 293T cells were cotransfected with equal amounts (2 mg) of the follo
expressing vectors. Relative cell numbers were determined (J), and the degree
number of 293T cells transfected with empty vector was set as 1.
(L and M) 293T cells were transfected with one of the following plasmids as i
NT-TIPE3-TIPE2-Flag (TIPE2-Flag fused with the NT region of TIPE3). Relative ce
by trypan blue staining 32 hr later. For (L), the number of 293T cells transfected
The y axis values represent means ± SD. *p < 0.05; **p < 0.01; ns, not significant. T
with similar results. See also Figure S3.
are connected at the surface opening of the cavity (Figure 6D).
The shape and size of the electron density are reminiscent of
two aliphatic tails of a phospholipid, although the head group
cannot be identified because of poor electron density. Notably,
positive ion electrospray ionization mass spectrometry of lipids
copurified with trTIPE3 from bacteria revealed two major peaks:
653 mass-to-charge ratio and 683 mass-to-charge ratio. The
molecular mass of the first peak is indicative of 16:0/16:1 phos-
phatidic acid (PA), whereas that of the second peak is indicative
of 16:0/18:0 or 16:0/18:1 PA. Therefore, it is likely that PAs are
the phospholipids that occupy the hydrophobic cavity of trTIPE3
expressed in bacteria (which do not possess phosphoinositides).
Within the same asymmetric unit, helix a0 from one TIPE3
molecule forms a coiled coil with that of another TIPE3molecule,
constituting a homodimer (Figure S6A). These two a helices
interact with each other mainly through van der Waals contacts.
In addition, the a0 helix from one TIPE3 molecule also interacts
with the a1 helix of its partner molecule. Notably, truncation of
the a0 helix exhibits no significant effect on the elution profile
of TIPE3 on gel filtration, suggesting that the observed TIPE3
dimer is likely an artifact of crystallization at high protein
concentrations.
TIPE3 Binds to Phosphoinositides through Its THdomain, and This Binding Is Essential for Its FunctionNext, we examined whether affinity-purified TIPE3 exhibits any
binding specificity for the various eukaryotic lipid molecules
in the protein-lipid overlay assay (Figures S6B–S6D). Of the
22 different types of eukaryotic lipids tested, TIPE3 appeared
to predominantly interact with PtdIns(4,5)P2, PtdIns(3,5)P2,
PtdIns(3,4)P2, PtdIns4P, PtdIns(3,4,5)P3, and PA (Figures S6C
and S6D; data not shown). The trTIPE3, as well as TIPE2,
TIPE1, and TNFAIP8 proteins, interacted with the same set of
lipids, indicating that the highly conserved TH domain, but not
the NT region, is responsible for the observed lipid binding activ-
ity (Figures S6B, S6C, and S6E). By contrast, the PLCd-PH
domain (GST-PLCd-PH) interacted only with PtdIns(4,5)P2 in
the same assay (Figure S6C). PLCd-PH binds to the PtdIns(4,5)
P2 head group, and addition of 15 mM free Ins(1,4,5)P3 to the
overlay assay was sufficient to prevent PLCd-PH binding to
e cultured in serum-free medium for the indicated times, and cell death was
pty vectors over indicated times.
IPE3-Flag plasmid or empty vector were determined 32 hr after transfection.
cultured in serum-freemediumwith or without LY29 (LY29004) for the indicated
ag plasmid or empty vector were assessed by trypan blue staining.
g or empty vectors.
sing or empty vectors. The relative levels of GFP protein expression 16 hr after
of the GFP mRNA expression were determined by real-time PCR. Protein and
wing plasmids as indicated: empty, TIPE3-Flag-expressing, or trTIPE3-Flag-
of cell death (K) was assessed by trypan blue staining 32 hr later. For (J), the
ndicated: empty vector, TIPE3-Flag, trTIPE3-Flag, Flag-trTIPE3, TIPE2-Flag,
ll numbers were determined (L), and the degree of cell death (M) was assessed
with empty vector was set as 1.
he experiments were performed in duplicates and repeated at least three times
Cancer Cell 26, 1–14, October 13, 2014 ª2014 Elsevier Inc. 7

0 1 2 3 4 5
TIPE3 vector
0
0.4
0.8
1.2
trTIPE3 vector
WB
sig
nal
WB
sig
nal ** **
** *
** ** ** ** * *
0 1 2 3 4 5
HRasV12/TIPE3 HRasV12/vector
WB
sig
nal **
** **
A
0 2 4 6 8
10
0 2.5 5 10 10 10 10 10
TIPE3 vector
**
p-E
RK
** **
**
PDGF LY29 PD98
- - - - + - - - - - - - - + - -
0
1
2
3
0 2.5 5 10 10 10 10 10
TIPE3 vector
* ** * * ns ns
min PDGF LY29 PD98
Bis I Bis I
- - - - + - - - - - - - - + - -
p-E
RK
2
min
Tota
l pho
spho
inos
itide
s**
0 1 2 3 4 5
TIPE3 vector
*
0
0.4
0.8
1.2
0
0.4
0.8
1.2 shTIPE3 shScr
0
0.4
0.8
1.2
NCI-H727 T24 HT-29
WB
sig
nal
ns
0
1
2
3
0 2.5 5 10 10 10
TIPE3 vector
p-A
KT
PDGF LY29 Rapa
- - - - + - - - - - - +
** ** *
**
min
* * ** * ** ** ns
B C
vector
D E
Figure 4. TIPE3 Promotes the Activation of PI3K-AKT and MEK-ERK Pathways
(A) Whole cell lysates were prepared fromNIH 3T3 cells stably transfected with TIPE3-Flag, trTIPE3-Flag, or empty vectors (left andmiddle panels), or TIPE3-Flag
and/or HRasV12 vectors (right panel). Western blot (WB) was performed using antibodies against the indicated proteins. The densitometric quantification of
protein signals was made using ImageJ software. Signals of cells transfected with empty vector were set as 1.
(B) Whole cell lysates were prepared fromNCI-H727, T24, and HT-29 cells stably expressing either shTIPE3 or small hairpin scrambled (shScr). Western blot (WB)
was performed using antibodies against the indicated proteins. Signals of cells treated with shScr were set as 1.
(C and D) NIH 3T3 cells stably transfected with either TIPE3-Flag or empty vectors were serum starved and then stimulated with 40 ng/ml of PDGF for the
indicated times, with or without the following inhibitors: LY29 (LY29004), Rapa (Rapamycin), PD98 (PD98059), Bis I (Bisindolylmaleimide I), or U-73 (U-73122). (C)
pertains to p-AKT, and (D) pertains to p-ERK. Lysates of these cells were used for western blot with antibodies against the indicated proteins. Signals of cells
transfected with vector 2.5 min after PDGF stimulation were set as 1.
(E) Cellular levels of PtdIns(4,5)P2 and PtdIns(3,4,5)P3 in NIH 3T3 cells stably transfected with either TIPE3-Flag or empty vector were estimated by protein-lipid
overlay assay with GST-PLCd-PH and GST-GRP1-PH domains as described in Supplemental Experimental Procedures. Signals of cells transfected with empty
vector were set as 1.
The y axis values represent means ± SD. *p < 0.05, and **p < 0.01; ns, denotes not significant. The abbreviation p- indicates phosphorylated. The experiments
were performed at least three times with similar results. See also Figure S4.
Cancer Cell
TIPE3 in Phospholipid Signaling and Cancer
Please cite this article in press as: Fayngerts et al., TIPE3 Is the Transfer Protein of Lipid Second Messengers that Promote Cancer, Cancer Cell (2014),http://dx.doi.org/10.1016/j.ccr.2014.07.025
nitrocellulose-bound PtdIns(4,5)P2 (Figure S6C). However, add-
ing free Ins(1,4,5)P3 had no effect on TIPE3 binding to PtdIns(4,5)
P2, suggesting that the mode of interaction is different from that
8 Cancer Cell 26, 1–14, October 13, 2014 ª2014 Elsevier Inc.
between PLCd-PH and PtdIns(4,5)P2 (Figure S6C). This is
consistent with our structural data, which identify an anchoring
role for the acyl chains of phospholipid (Figure 6D).

0 1 2 3 4
M Cyt 0
0.5 1
1.5 2
2.5
GAPDH
ATPase
Flag
TIPE3
GAPDH
ATPase
Flag
M Cyt
TIPE3 trTIPE3
M Cyt TIPE3
0.5
1
1.5
2
2.5
0.5 1
1.5 2
2.5 3
3.5
PM
PLC
-PH
-GFP
/ C
ytP
LC-P
H-G
FP
0.5 1
1.5 2
2.5 3 **
**
** **
**
A
D
PM
AK
T-P
H-G
FP /
Cyt
AK
T-P
H-G
FP
PM
GR
P1-
PH
-GFP
/ C
yt G
RP
1-P
H-G
FP
E
WB
sig
nals
WB
sig
nals
**
**
** **
**
**
0
0.5
1
1.5
M Cyt
TIPE3 trTIPE3
** **
B C +PDGF DMEM10 +PDGF DMEM10 +PDGF DMEM10
Figure 5. TIPE3 Regulates Lipid Metabolism and Signaling
(A–C) NIH 3T3 cells were cotransfected with PLCd-PH-GFP (A), AKT-PH-GFP (B), or GRP1-PH-GFP (C) and one of the following plasmids as indicated: pRK5
vector (vector), pRK5-TIPE3-Flag (TIPE3), and pRK5-trTIPE3-Flag (trTIPE3). Thirty-two hours after the transfection, cells were cultured in Dulbecco’s modified
Eagle’s medium (DMEM) with 10% fetal calf serum (DMEM10, in A through C) or in DMEM10 with 40 ng/ml of PDGF for 5.5 min (+PDGF in A), or they were serum
starved for 4 hr and then cultured in DMEM containing 40 ng/ml of PDGF for 7.5 min (+PDGF in B and C) followed by fixation. Cells expressing the Flag-tagged
proteins were selected by immunofluorescencemicroscopywith an anti-Flag antibody. Ratios of GFP fluorescence intensity on plasmamembrane (PM) over that
in the cytoplasm (Cyt) of the same cells are calculated based on line fluorescence intensity profiles.
(D) Membrane (M) and cytoplasmic (Cyt) proteins fractions were prepared from NIH 3T3 cells stably transfected with TIPE3-Flag and trTIPE3-Flag. Western blot
(WB) was performed using antibodies against the indicated proteins. Signals of TIPE3 or trTIPE3 in membrane fractions were set as 1.
(E) NIH 3T3 cells stably transfected with TIPE3-Flag were cultured in DMEM with 10% of FCS (DMEM10) or serum-starved for 4 hr and then cultured in DMEM
containing 40 ng/ml of PDGF for 7.5 min (+PDGF). Membrane protein fractions (M) of these cells were analyzed by western blot (WB) using antibodies against the
indicated proteins. Signals of TIPE3 in membrane fractions of cells cultured in DMEM10 were set as 1.
Values represent means ± SD; **p < 0.01. The experiments were repeated at least three times with similar results. See also Figure S5.
Cancer Cell
TIPE3 in Phospholipid Signaling and Cancer
Please cite this article in press as: Fayngerts et al., TIPE3 Is the Transfer Protein of Lipid Second Messengers that Promote Cancer, Cancer Cell (2014),http://dx.doi.org/10.1016/j.ccr.2014.07.025
To test the importance of the hydrophobic cavity in the TIPE3
TH domain, we replaced leucine 60, positioned in the center of
this pocket, with the much bulkier tryptophan to yield the
TIPE3 60W mutant (Figure S7A). A similar approach was
described to test the importance of the hydrophobic cavity in
orphan nuclear hormone receptors hypothesized to bind phos-
phoinositides (Krylova et al., 2005; Sablin et al., 2003). TIPE3
60Wmutant showed markedly reduced ability to bind phosphoi-
nositide (Figure S7B). This finding is consistent with the struc-
ture-based proposition that the acyl chains of phosphoinositide
are positioned inside the TH domain cavity, allowing the nega-
tively charged head group to form electrostatic interactions
with the neighboring positively charged side chains that line
the opening of the cavity (Figures 6C and 6D). Supporting this
analysis, a TIPE3 4Q mutant (in which lysines 33, 34, 38, and
42 were all replaced with glutamines) and a TIPE3 2Q mutant
(in which arginines 93 and 109 were replaced with glutamines)
both exhibited marked reductions in phosphoinositide binding
(Figures S7A and S7B). By contrast, a TIPE3 3Q mutant—in
which glutamine replaces lysines 76, 79, and 83, which lie on a
positively charged surface distant from the cavity opening—
showed WT levels of phosphoinositide binding in the overlay
assay (Figures S7A and S7B).
Notably, the TIPE3 mutants that showed impaired phosphoi-
nositide binding also had markedly reduced TIPE3 functions.
Compared with WT TIPE3, the TIPE3 60W, 2Q, and 4Q
mutants had significantly reduced capacities to promote cap-
dependent translation of GFP (Figure S7C), whereas TIPE3 3Q
(which retains phosphoinositide binding) did not—although all
mutants were expressed at similar levels as those of the WT
TIPE3 (Figures S7C and S7D). As expected, TIPE3 4Q had no
detectable effects on ERK activation or PtdIns(4,5)P2 levels
and might even reduce the levels of AKT phosphorylation and
PtdIns(3,4,5)P3 (Figures S7E and S7F). Introduction of a
4Q-equivalent mutation in trTIPE3 abolished its ability to bind
phosphoinositide (Figure S7B). Moreover, 4Q, 2Q, and 60W
Cancer Cell 26, 1–14, October 13, 2014 ª2014 Elsevier Inc. 9

0
5a
2
3 4
6
5b 1 1 6
0 2
5a 4
3
0
5a
2
3 4
6
5b 1
0
5a
2
3 4
6
5b 1 1 6
0 2
5a 4
3 C D
A B
Figure 6. The Crystal Structure of the TH-Domain of Human TIPE3
(A) Cartoon presentation of TH-domain of human TIPE3 (trTIPE3, residues 21–204). Helices are rainbow colored with a0 in blue and a6 in red.
(B) Cartoon representation of superposition of human TIPE3 (residues 21–204, shown in green) with the human TIPE2 (residues 24–184, shown in red) structures.
(C) TIPE3 contains a centrally located hydrophobic cavity. (Left) TIPE3 is shown in a green cartoon representation; amino acids with hydrophobic side chains that
line the cavity are shown in orange. (Right) TIPE3 eletrostatic surface potential: blue, positive; red, negative.
(D) TIPE3 is shown in a green cartoon representation. The two long connected tubes of 2Fo-Fc electron density found in TIPE3 cavity is shown in blue mesh,
contoured at 1.5 s.
See also Table S1 and Figure S6.
Cancer Cell
TIPE3 in Phospholipid Signaling and Cancer
Please cite this article in press as: Fayngerts et al., TIPE3 Is the Transfer Protein of Lipid Second Messengers that Promote Cancer, Cancer Cell (2014),http://dx.doi.org/10.1016/j.ccr.2014.07.025
mutations in trTIPE3 reduced its ability to inhibit cell proliferation
and to induce cell death (Figures S7G–S7I), whereas the 3Q
mutation had no such effect.
TIPE3 Can Act as a PtdIns(4,5)P2 and PtdIns(3,4,5)P3
Transfer ProteinAlthough the TH fold is unique, the lipid-binding mode by the
TIPE family of proteins is reminiscent of lipid-binding mode
by lipid transfer proteins (Prinz, 2010). We wondered whether
phosphoinositide-loaded TIPE3 might exert its effects in part
by transferring phosphoinositides to the plasma membrane
and whether the dominant negative trTIPE3 might promote
cell death by reducing the membrane pool of PtdIns(4,5)P2 and
PtdIns(3,4,5)P3. Consistent with this notion, trTIPE3-induced
cell death could be partially reversed by overexpressing a myris-
toylated variant of phosphatidylinositol-4-phosphate 5-kinase
(PIP5K) that leads to elevated plasma membrane PtdIns(4,5)P2
(Figure S7J) (Volpicelli-Daley et al., 2010; Wang et al., 2008).
Neither a constitutively active PI3K (PI3KCAE545) nor HRasV12
had any detectable effect on trTIPE3-induced cell death
(Figure S7J).
To determine whetherWT TIPE3 protein might have properties
consistent with a phosphoinositide transfer protein, we exam-
ined whether it could recognize PtdIns(4)P, PtdIns(4,5)P2, and
PtdIns(3,4,5)P3 present in a lipid bilayer, and extract the lipid
10 Cancer Cell 26, 1–14, October 13, 2014 ª2014 Elsevier Inc.
from the membrane. We purified recombinant TIPE3 and TIPE3
4Q from mammalian cells (Figure S6B) and assessed their
binding to small unilamellar vesicles (SUVs) containing 100%
phosphatidylcholine (PC), 10% PtdIns(4)P, 10% PtdIns(4,5)P2,
or 10% PtdIns(3,4,5)P3 in a PC background using a well-estab-
lished centrifugation-based assay (Kavran et al., 1998; Lee
and Lemmon, 2001). TIPE3 sedimented efficiently with vesicles
containing 10% phosphoinositides, with the following order of
preference: PtdIns(3,4,5)P3 > PtdIns(4,5)P2 > PtdIns(4)P (Figures
7A and 7B). Consistent with the results of the overlay assay,
TIPE3 4Q showed significantly reduced binding to PtdIns(4,5)
P2- and PtdIns(3,4,5)P3-containing vesicles compared with WT
TIPE3; more than 60% of the 20 mM TIPE3 and only �30%
of 20 mM TIPE3 4Q were bound to vesicles when the concentra-
tion of vesicles was 1,000 mM (Figures 7A and 7B). Lack of bind-
ing specificity of TIPE3 4Q to PtdIns(4)P-, PtdIns(4,5)P2-, and
PtdIns(3,4,5)P3-containing vesicles suggests that lysines in
the a0 helix may form electrostatic interactions with 5- and
3-phosphate groups of PtdIns(4,5)P2 and PtdIns(3,4,5)P3. By
contrast, only background levels of TIPE3 and TIPE3 4Q sedi-
mented with 100% PC vesicles. A negative control protein
(trypsin inhibitor) showed no binding to either type of vesicles
(Figures 7A and 7B).
Having established that TIPE3 could bind to vesicles con-
taining PtdIns(4,5)P2, we next asked whether the protein could

Cancer Cell
TIPE3 in Phospholipid Signaling and Cancer
Please cite this article in press as: Fayngerts et al., TIPE3 Is the Transfer Protein of Lipid Second Messengers that Promote Cancer, Cancer Cell (2014),http://dx.doi.org/10.1016/j.ccr.2014.07.025
extract fluorescently labeled phosphoinositide from these vesi-
cles and effectively solubilize it. When increasing concentrations
of TIPE3 were incubated for 1 hr with 100 mM vesicles containing
20% TopFluor PtdIns(4,5)P2 and 80% PC, substantial amounts
of TopFluor PtdIns(4,5)P2 fluorescence was detected in the
supernatant after ultracentrifugation, whereas equivalent exper-
iments with the PLCd-PH domain showed no significant fluores-
cence in the supernatant (Figures 7C and S6B). This result
suggests that TIPE3 can effectively remove PtdIns(4,5)P2 from
the vesicles and solubilize it in the aqueous phase—extracting
up to 50% of the total available PtdIns(4,5)P2 at a protein con-
centration of 40 mM. Size exclusion chromatographic analysis
of the supernatants revealed a single peak corresponding to
TIPE3 monomer, ruling out the possibility that TIPE3/vesicle
complexes remain in the supernatants (data not shown). Sup-
porting its dominant negative effect, trTIPE3 did not remove
TopFluor PtdIns(4,5)P2 after binding to 20% TopFluor
PtdIns(4,5)P2-containing vesicles; �10% of 20 mM trTIPE3 re-
mained in supernatant (Figure S7K). Similar to trTIPE3, TIPE2
strongly bound to vesicles containing 20% PtdIns(4,5)P2 and
80% PC, with only �15% remaining unbound (data not shown).
It is important to note that neither TIPE3 nor TIPE3 4Qwas able to
bind and extract TopFluor PC from 100 mM vesicles containing
20% TopFluor PC and 80% PC used as control (Figure S7K).
We further investigated the ability of TIPE3 to extract
PtdIns(4,5)P2 from membranes using a surface plasmon reso-
nance (SPR)-based assay. PtdIns(4,5)P2-containing vesicles
(3% and 10%) were immobilized on L1 sensor chips, and the
binding signal obtained with a saturating injection of PLCd-PH
was measured before and after TIPE3 or TIPE3 4Q had been
flowed over the sensor chip. A significant reduction (more than
60%) in PLCd-PH binding at saturation was detected after
TIPE3 had been exposed to the sensor chip (Figure 7D), indi-
cating that TIPE3 extracts PtdIns(4,5)P2 from the immobilized
vesicles. TIPE3 4Q also appeared to extract PtdIns(4,5)P2 from
the immobilized membranes, but to a reduced extent, which is
consistent with our other studies of this mutant (Figure 7D).
As discussed earlier, TIPE3 overexpression appears to in-
crease both total and plasma membrane levels of PtdIns(4,5)P2
in NIH 3T3 cells. To determine whether TIPE3 is capable of in-
serting extracted PtdIns(4,5)P2 into a lipid bilayer, we analyzed
transfer of TopFluor PtdIns(4,5)P2 from the soluble TIPE3/
TopFluor PtdIns(4,5)P2 complexes detected in the supernatant
in Figure 7C to 100% PC vesicles. We collected supernatants
frommixtures of TIPE3 with 100 mMTopFluor PtdIns(4,5)P2-con-
taining vesicles that had been subjected to ultracentrifugation
and incubated them with vesicles containing 250 mM 100% PC
for 1 hr at room temperature. The mixtures were then recentri-
fuged as described elsewhere (Lee and Lemmon, 2001), and
the level of TopFluor PtdIns(4,5)P2 fluorescence remaining in
the supernatant was measured. Addition of vesicles containing
100% PC alone led to a substantial reduction in fluorescence
corresponding to presumed TIPE3/TopFluor PtdIns(4,5)P2 com-
plexes in the supernatant (Figure 7E). This was accompanied by
a dramatic increase in fluorescence intensity associated with the
vesicle pellet (Figure 7F), indicating that TopFluor PtdIns(4,5)P2
was transferred into the PC vesicles. The concomitant loss of
TopFluor PtdIns(4,5)P2-derived fluorescence from the superna-
tant and its acquisition in the pellet was not accompanied by
any change in TIPE3 protein concentrations in the supernatant,
arguing that TIPE3 has transferred the labeled PtdIns(4,5)P2 to
the PC vesicles (Figure 7E).
TIPE3 Can Promote the Generation of PtdIns(3,4,5)P3
by PI3KTo examine whether TIPE3 could promote the phosphorylation
of PtdIns(4,5)P2 by PI3K(p110a/p85a), we performed in vitro
membrane capture (enzymatic) assay for the PI3K in the absence
or presence of increasing amounts of TIPE3 (Knight et al., 2007).
SUVs containing 10% PtdIns(4,5)P2 in a PC background were
used in this assay. We found that TIPE3 indeed stimulated
PI3K activity in a concentration-dependent manner (Figure 7G).
At 20min after the initiation of the PI3K assay, we observed three
times more PtdIns(3,4,5)P3 in reactions containing 200 nM
TIPE3, two times more PtdIns(3,4,5)P3 in reactions containing
100 nM TIPE3, and 1.65 times more PtdIns(3,4,5)P3 in reactions
containing 20 nM TIPE3 than those of control PI3K reactions
lacking TIPE3 (BSA was used as a control protein). Finally, we
examined whether TIPE3 associated with PI3K. We immunopre-
cipitated endogenous p110a, p110b, and p85 fromNIH 3T3 cells
overexpressing TIPE3, with or without PDGF treatment, and
found that TIPE3 did not coimmunoprecipitate with these PI3K
proteins. In addition, we did not detect an association of TIPE3
with the oncogenic mutant of p110a, E545K, when both proteins
were overexpressed in 293T cells.
DISCUSSION
PtdIns transfer proteins (PITPs) play essential roles in phospho-
lipid signaling, and their dysregulation leads to a variety of disor-
ders, including cancer and degenerative diseases (Nile et al.,
2010). It is unclear whether, and to what degree, currently known
PITPs or PITP-like proteins can transfer phosphoinositides. It
was reported that the yeast Kes1/Osh4p protein (de Saint-
Jean et al., 2011) and the human a-TTP protein (Kono et al.,
2013) that belongs to the Sec14-like family might transfer
PtdIns4P and PtdIns(4,5)P2, respectively, but not other phos-
phoinositides. The mammalian nuclear receptor SF-1 and
LRH-1 proteins of the NR5A family were also found to accommo-
date phosphoinositides within their large hydrophobic cavities
(Krylova et al., 2005), but whether they can transfer these lipids
is unknown.
The results reported here argue that the TH domain of TIPE
proteins can function as a lipid transfer domain and that TIPE3
is a lipid transfer protein for two second messengers,
PtdIns(4,5)P2 and PtdIns(3,4,5)P3. Crystal structure and muta-
genesis analyses revealed that the acyl chains of lipid are likely
accommodated in the hydrophobic cavity formed by the a1–a6
helixes of the TIPE3 TH domain. The negatively charged head
group of phosphoinositides is likely involved in electrostatic in-
teractions with positively charged amino acids of the a0 helix
(that might function as a flexible ‘‘lid’’) and those located at the
entrance to the hydrophobic cavity. Structure determination of
the full-length TIPE3 bound to phosphoinositides is required to
provide additional insight into this issue.
Our results support a dual role model for TIPE3 in phosphoino-
sitide signaling and metabolism. TIPE3 may regulate the spatial
and temporal distribution of lipid second messengers in
Cancer Cell 26, 1–14, October 13, 2014 ª2014 Elsevier Inc. 11

0
20
40
60
80
0 10 20 30 40 50 60
TIPE3 PLC -PH
Total protein, µM
** ** **
**
TopF
luor
Ptd
Ins(
4,5)
P2
extra
ctio
n (F
IU),
%
0
5
10
15
20
25 TIPE3 PLC -PH
Pro
tein
in s
uper
nata
nt, µ
M
Total protein, µM
0 20 40 60 80
100 120
PLC
-PH
bin
ding
to
Ptd
Ins(
4,5)
P2 (
RU
), %
* *
**
10% PtdIns(4,5)P2
Bin
ding
to v
esic
les,
%
0
20
40
60
80 TIPE3 TIPE3 4Q Trypsin in
*
**
ns
*
**
0 20 40 60 80
100 120
PLC
-PH
bin
ding
to
Ptd
Ins(
4,5)
P2 (
RU
), %
** **
*
3% PtdIns(4,5)P2
Bin
ding
to v
esic
les,
%
Total available lipid, µM
PtdIns(3,4,5)P3PtdIns(4,5)P2PC
TIPE3
TIPE3 4Q PtdIns(3,4,5)P3PtdIns(4,5)P2PC
Trypsin in PtdIns(3,4,5)P3
1000 µM Total available lipid
0
5
10
15
20
0 11 20
0 250
0 2 4 6 8
10 12 14
0 11 20
0 250
µM PC µM PC
Total TIPE3, µM
TopF
luor
Ptd
Ins(
4,5)
P2
in s
uper
nata
nt (F
IU),
102
**
** ns
µM PC µM PC
Total TIPE3, µM
ns
TIP
E3
in s
uper
nata
nt, µ
M
0
2
4
6
8
0 11 20
TopF
luor
Ptd
Ins(
4,5)
P2
tran
sfer
(FIU
), 10
2
Total TIPE3, µM
** ** ns
PI3
K a
ctiv
ity
0 0.5
1 1.5
2 2.5
3
control 20 nm TIPE3 100 nm TIPE3 200 nm TIPE3
** * * *
* *
*
A B
C D
E F G
Figure 7. TIPE3 Is a Phosphoinositide Transfer Protein
(A and B) The sedimentation-based binding assay was used to determine the percentages of TIPE3, TIPE3 4Q, and control protein trypsin inhibitor (Trypsin in)
bound to vesicles containing 10% PtdIns(4)P + 90% PC (10% PtdIns(4)P); 10% PtdIns(3,4,5)P3 + 90% PC (10% PtdIns(3,4,5)P3); 10% PtdIns(4,5)P2 + 90% PC
(10%PtdIns(4,5)P2); or 100%PC as indicated. (A) Binding with 1,000 mMconcentration of total lipid; (B) binding with varying concentrations of total lipid. Proteins
were used at a concentration of 20 mM.
(C) The sedimentation-based extraction assay was used to determine the percentages of TopFluor PtdIns(4,5)P2 extracted from 100 mM 20% TopFluor
PtdIns(4,5)P2 + 80%PC vesicles and transferred to supernatant by TIPE3 and PLCd-PH (left panel); and fractions of TIPE3 and PLCd-PH proteins not bound to the
20% TopFluor PtdIns(4,5)P2 + 80% PC vesicles (right panel).
(D) In the SPR-based assay, 3% (left panel) and 10% (right panel) PtdIns(4,5)P2-containing vesicles were immobilized on L1 sensor chips, and the binding signal
obtained with a saturating injection of GST-PLCd-PH (5 mM) was measured before and after TIPE3 or TIPE3 4Q (both at 40 mM) had been flowed over the sensor
chip. GST-PLCd-PH binding to PtdIns(4,5)P2-containing surfaces before TIPE3 or TIPE3 4Q exposure is set as 100%, and GST-PLCd-PH binding to PtdIns(4,5)
P2-containing surfaces after TIPE3 or TIPE3 4Q exposure is presented as the percentage reduction.
(E) The sedimentation-based transfer assay was used to measure the depletion of TopFluor PtdIns(4,5)P2 from soluble TIPE3-TopFluor PtdIns(4,5)P2 in
supernatants (left panel) and fractions of TIPE3 remaining in supernatants (right panel) after incubation with 100% PC vesicles or buffer alone.
(legend continued on next page)
Cancer Cell
TIPE3 in Phospholipid Signaling and Cancer
12 Cancer Cell 26, 1–14, October 13, 2014 ª2014 Elsevier Inc.
Please cite this article in press as: Fayngerts et al., TIPE3 Is the Transfer Protein of Lipid Second Messengers that Promote Cancer, Cancer Cell (2014),http://dx.doi.org/10.1016/j.ccr.2014.07.025

Cancer Cell
TIPE3 in Phospholipid Signaling and Cancer
Please cite this article in press as: Fayngerts et al., TIPE3 Is the Transfer Protein of Lipid Second Messengers that Promote Cancer, Cancer Cell (2014),http://dx.doi.org/10.1016/j.ccr.2014.07.025
response to external or internal stimuli by sequestrating
PtdIns(4,5)P2 and PtdIns(3,4,5)P3 from the lipid bilayer and shut-
tling them through the aqueous phase. Additionally, TIPE3 may
also function as a lipid-presenting protein to enhance the activity
of phosphoinositide-modifying enzymes such as PI3K. A similar
function has been reported for PtdIns transfer proteins such as
Sec14, the major yeast PITP protein that regulates phosphoino-
sitide signaling and metabolism by presenting PtdIns to PI4K
(Bankaitis et al., 2010; Lev, 2010; Prinz, 2014; Schaaf et al.,
2008). Consistent with this view, TIPE3 physically translocates
from cytoplasm to plasma membrane on cell activation by
PDGF or on cell transformation by the oncogenic HRasV12
(data not shown). Upregulation of TIPE3 expression in PDGF-
stimulated cells and cancer cells may positively feed back to
cell activation through the aforementioned mechanism.
The TIPE3 TH domain is highly homologous to TH domains of
other members of the TIPE family. The domain is also highly
conserved through evolution and is found in vertebrates; inverte-
brates such as the mosquito and fruit fly; and unicellular eukary-
otes such as choanoflagellate, Dictyostelium, and Entamoeba.
This raises the question as to whether all TH domains are
involved in regulating lipid signaling. Our studies indicate that
all murine TIPE family proteins bind phosphoinositides, and, in
addition to TIPE3, TIPE2 regulates the PtdIns(3,4,5)P3 signaling
pathway. However, the functions of TH domains may be regu-
lated by other sequences present in the protein. For example,
as reported here, the TIPE3 NT region, which is not shared by
other members of the family, is essential for the effects seen
on cell growth and survival; TIPE3 lacking the NT region func-
tions in a dominant negative fashion. Similarly, some TH-con-
taining proteins of the unicellular eukaryotes possess NT PH
domains, which likely affect their functions. Therefore, TH-con-
taining proteins may play diverse roles depending on the non-
TH sequences that they also possess. Thus, despite their high
sequence homology in the TH domains, TIPE2 and TIPE3 appear
to play distinct roles. TIPE2 functions as a negative regulator of
neoplastic cell growth, and its expression is downregulated dur-
ing liver carcinogenesis. The tumor suppressor activity of TIPE2
is likely dependent on its interaction with Rac1 and Rgl/RalGDS
molecules (Gus-Brautbar et al., 2012; Wang et al., 2012). How-
ever, no such interaction could be found for TIPE3 (data not
shown). Therefore, TIPE2 and TIPE3 appear to have distinct
molecular mechanisms.
Hyperactivation of PtdIns(3,4,5)P3 signaling is reported in
more than 50% of human cancers. Somatic gene mutations of
the signaling molecules such as PTEN and PI3K are found in
many of these cancers. Our findings reveal a mechanism of
hyperactivating PtdIns(3,4,5)P3 signaling pathway in cancer
cells by TIPE3, a phosphoinositide transfer protein. Therefore,
TIPE3 may represent a therapeutic target for treating malignant
diseases.
(F) The sedimentation-based transfer assaywas used tomonitor the transfer of To
to 100% PC vesicles.
(G) Time course of PI3K (p110a/p85a)-mediated phosphorylation of PtdIns(4,5)P2
PtdIns(3,4,5)P3 were measured by protein-lipid overlay assay with GST-GRP1-PH
1. FIU, fluorescence intensity units; RU, resonance units. Values represent mean
For (A)–(F), the experiments were repeated at least three times with similar results
with similar results. See also Figure S7.
EXPERIMENTAL PROCEDURES
Mice
Male athymic nude mice (nu/nu) and WT C57BL/6 mice were purchased from
Jackson Laboratories. Tipe3+/� C57BL/6 mice (Tnfaip8l3tm1a(KOMP)Mbp) were
purchased from the Knockout Mouse Project Repository. Mice were housed
in the University of Pennsylvania Animal Care Facilities under pathogen-free
conditions. All animal procedures were preapproved by the Institutional Animal
Care and Use Committee of the University of Pennsylvania, and all experi-
ments conform to the relevant regulatory standards.
Human Samples
Human non-small cell lung cancer arrays containing 60 tumor samples and
their corresponding adjacent normal tissues, as well as human esophageal
carcinoma arrays containing 24 tumor samples and their adjacent normal tis-
sues, were purchased from Outdo Biotech. Human colon cancer and cervical
cancer microarrays were purchased from Xi’an Alena Biotech. All samples
have been deidentified prior to analysis and are therefore considered exempt.
All human study procedures were preapproved by the Institutional Review
Board of Shandong University.
Crystallization, Data Collection, and Structure Determination
The human trTIPE3 (residues 21–204) was purified as described in Supple-
mental Experimental Procedures. Crystals of trTIPE3 were grown at 18�C us-
ing the hanging-drop vapor diffusion method by mixing 1 ml of protein
(10 mg/ml in 25 mM Tris-HCl, 1 M NaCl, pH 8.0) with 1 ml of reservoir solution
(0.1 MMES 6.7, 1.95 M (NH4)2SO4). The crystals appeared in 2 days and grew
to full size in a week. The 2.3 A native data were collected at Shanghai Syn-
chrotron Radiation Facility beamline BL17U. The data sets were integrated
and scaled using the HKL2000 package. Further processing was performed
using the CCP4 suite. The structure was solved by molecular replacement us-
ing PHASER and manually refined with COOT and PHENIX. Data collection
and refinement statistics are listed in Table S1. All the figures were prepared
using PyMOL software.
Other experimental procedures, including in vivo tumorigenesis studies;
human tumor studies; cell culture; protein purification; protein crystallization;
protein-lipid overlay assay; and phosphoinositide binding, extraction, and
transfer assays are available in Supplemental Information.
ACCESSION NUMBERS
The TIPE3 structure data were deposited in the PDB with the ID code of 4Q9V.
SUPPLEMENTAL INFORMATION
Supplemental Information includes Supplemental Experimental Procedures,
seven figures, and one table and can be found with this article online at
http://dx.doi.org/10.1016/j.ccr.2014.07.025.
AUTHOR CONTRIBUTIONS
S.A.F. and Y.H.C. conceived the study and wrote the article. S.A.F. designed
and performed the experiments and analyzed the data. C.L.O., A.V., T.C.,
Z.W., and H.S. were involved in the design or execution of several experi-
ments. M.A.L. made suggestions for the design of the lipid biochemical studies
and contributed to manuscript preparation. X.L., L.Z., J.C., and S.L. designed
and performed the human tumor studies. J.W. and Y.S. solved the crystal
pFluor PtdIns(4,5)P2 from soluble TIPE3-TopFluor PtdIns(4,5)P2 in supernatants
in the absence or presence of TIPE3 at indicated concentrations. The levels of
domain. PI3K activity determined at 40 min in the absence of TIPE3 was set to
s ± SD. *p < 0.05; **p < 0.01; ns, not significant.
. For (G), the experiments were performed in triplicates and repeated two times
Cancer Cell 26, 1–14, October 13, 2014 ª2014 Elsevier Inc. 13

Cancer Cell
TIPE3 in Phospholipid Signaling and Cancer
Please cite this article in press as: Fayngerts et al., TIPE3 Is the Transfer Protein of Lipid Second Messengers that Promote Cancer, Cancer Cell (2014),http://dx.doi.org/10.1016/j.ccr.2014.07.025
structure of TIPE3 and contributed to manuscript preparation. Y.H.C. oversaw
the project.
ACKNOWLEDGMENTS
We thank Thomas Porturas, George Luo, Qingguo Ruan, Derek Johnson, Yael
Gus-Brautbar, Xiaohong Liang, and Fumin Shi for conceptual inputs and tech-
nical assistance. We are grateful to Jeannine Mendrola for providing purified
PLCd-PH and Katarina Moravcevic for providing purified GST-PLCd-PH and
technical assistance. This work was funded by the NIH (grants AI-077533,
AI-050059, and GM-085112 to Y.H.C.), the National Natural Science Founda-
tion of China (projects 31130002 and 31021002 to Y.S.), and the Ministry of
Science and Technology (grant numbers 2009CB918801 to Y.S. and
2011CB503906 to L.Z.).
Received: January 24, 2014
Revised: April 29, 2014
Accepted: July 28, 2014
Published: September 18, 2014
REFERENCES
Ahn, S.H., Deshmukh, H., Johnson, N., Cowell, L.G., Rude, T.H., Scott, W.K.,
Nelson, C.L., Zaas, A.K., Marchuk, D.A., Keum, S., et al. (2010). Two genes on
A/J chromosome 18 are associated with susceptibility to Staphylococcus
aureus infection by combined microarray and QTL analyses. PLoS Pathog.
6, e1001088.
Bankaitis, V.A., Mousley, C.J., and Schaaf, G. (2010). The Sec14 superfamily
and mechanisms for crosstalk between lipid metabolism and lipid signaling.
Trends Biochem. Sci. 35, 150–160.
de Saint-Jean, M., Delfosse, V., Douguet, D., Chicanne, G., Payrastre, B.,
Bourguet, W., Antonny, B., and Drin, G. (2011). Osh4p exchanges sterols for
phosphatidylinositol 4-phosphate between lipid bilayers. J. Cell Biol. 195,
965–978.
Ferguson, K.M., Kavran, J.M., Sankaran, V.G., Fournier, E., Isakoff, S.J.,
Skolnik, E.Y., and Lemmon, M.A. (2000). Structural basis for discrimination
of 3-phosphoinositides by pleckstrin homology domains. Mol. Cell 6, 373–384.
Fruman, D.A., Meyers, R.E., and Cantley, L.C. (1998). Phosphoinositide
kinases. Annu. Rev. Biochem. 67, 481–507.
Gus-Brautbar, Y., Johnson, D., Zhang, L., Sun, H.,Wang, P., Zhang, S., Zhang,
L., and Chen, Y.H. (2012). The anti-inflammatory TIPE2 is an inhibitor of the
oncogenic Ras. Mol. Cell 45, 610–618.
Hitomi, J., Christofferson, D.E., Ng, A., Yao, J., Degterev, A., Xavier, R.J., and
Yuan, J. (2008). Identification of a molecular signaling network that regulates a
cellular necrotic cell death pathway. Cell 135, 1311–1323.
Kavran, J.M., Klein, D.E., Lee, A., Falasca, M., Isakoff, S.J., Skolnik, E.Y., and
Lemmon, M.A. (1998). Specificity and promiscuity in phosphoinositide binding
by pleckstrin homology domains. J. Biol. Chem. 273, 30497–30508.
Knight, Z.A., Feldman, M.E., Balla, A., Balla, T., and Shokat, K.M. (2007). A
membrane capture assay for lipid kinase activity. Nat. Protoc. 2, 2459–2466.
Kono, N., Ohto, U., Hiramatsu, T., Urabe, M., Uchida, Y., Satow, Y., and Arai,
H. (2013). Impaired a-TTP-PIPs interaction underlies familial vitamin E defi-
ciency. Science 340, 1106–1110.
Krylova, I.N., Sablin, E.P., Moore, J., Xu, R.X., Waitt, G.M., MacKay, J.A.,
Juzumiene, D., Bynum, J.M., Madauss, K., Montana, V., et al. (2005).
Structural analyses reveal phosphatidyl inositols as ligands for the NR5 orphan
receptors SF-1 and LRH-1. Cell 120, 343–355.
14 Cancer Cell 26, 1–14, October 13, 2014 ª2014 Elsevier Inc.
Kumar, D., Gokhale, P., Broustas, C., Chakravarty, D., Ahmad, I., and Kasid, U.
(2004). Expression of SCC-S2, an antiapoptotic molecule, correlates with
enhanced proliferation and tumorigenicity of MDA-MB 435 cells. Oncogene
23, 612–616.
Kwiatkowska, K., and Sobota, A. (1999). Signaling pathways in phagocytosis.
BioEssays 21, 422–431.
Lee, A., and Lemmon, M.A. (2001). Analysis of phosphoinositide binding by
pleckstrin homology domain from dynamin. Methods Enzymol. 329, 457–468.
Lev, S. (2010). Non-vesicular lipid transport by lipid-transfer proteins and
beyond. Nat. Rev. Mol. Cell Biol. 11, 739–750.
McLaughlin, S., Wang, J., Gambhir, A., and Murray, D. (2002). PIP(2) and pro-
teins: interactions, organization, and information flow. Annu. Rev. Biophys.
Biomol. Struct. 31, 151–175.
Nile, A.H., Bankaitis, V.A., and Grabon, A. (2010). Mammalian diseases of
phosphatidylinositol transfer proteins and their homologs. Clin. Lipidol. 5,
867–897.
Prinz, W.A. (2010). Lipid trafficking sans vesicles: where, why, how? Cell 143,
870–874.
Prinz, W.A. (2014). The lipid trade. Nat. Rev. Mol. Cell Biol. 15, 79.
Sablin, E.P., Krylova, I.N., Fletterick, R.J., and Ingraham, H.A. (2003).
Structural basis for ligand-independent activation of the orphan nuclear recep-
tor LRH-1. Mol. Cell 11, 1575–1585.
Schaaf, G., Ortlund, E.A., Tyeryar, K.R., Mousley, C.J., Ile, K.E., Garrett, T.A.,
Ren, J., Woolls, M.J., Raetz, C.R., Redinbo, M.R., and Bankaitis, V.A. (2008).
Functional anatomy of phospholipid binding and regulation of phosphoinosi-
tide homeostasis by proteins of the sec14 superfamily. Mol. Cell 29, 191–206.
Seibel, N.M., Eljouni, J., Nalaskowski, M.M., and Hampe, W. (2007). Nuclear
localization of enhanced green fluorescent protein homomultimers. Anal.
Biochem. 368, 95–99.
Sun, H., Gong, S., Carmody, R.J., Hilliard, A., Li, L., Sun, J., Kong, L., Xu, L.,
Hilliard, B., Hu, S., et al. (2008). TIPE2, a negative regulator of innate and
adaptive immunity that maintains immune homeostasis. Cell 133, 415–426.
Vivanco, I., and Sawyers, C.L. (2002). The phosphatidylinositol 3-Kinase AKT
pathway in human cancer. Nat. Rev. Cancer 2, 489–501.
Volpicelli-Daley, L.A., Lucast, L., Gong, L.W., Liu, L., Sasaki, J., Sasaki, T.,
Abrams, C.S., Kanaho, Y., and De Camilli, P. (2010). Phosphatidylinositol-
4-phosphate 5-kinases and phosphatidylinositol 4,5-bisphosphate synthesis
in the brain. J. Biol. Chem. 285, 28708–28714.
Wang, Y., Chen, X., Lian, L., Tang, T., Stalker, T.J., Sasaki, T., Kanaho, Y.,
Brass, L.F., Choi, J.K., Hartwig, J.H., and Abrams, C.S. (2008). Loss of
PIP5KIbeta demonstrates that PIP5KI isoform-specific PIP2 synthesis is
required for IP3 formation. Proc. Natl. Acad. Sci. USA 105, 14064–14069.
Wang, Z., Fayngerts, S., Wang, P., Sun, H., Johnson, D.S., Ruan, Q., Guo, W.,
and Chen, Y.H. (2012). TIPE2 protein serves as a negative regulator of phago-
cytosis and oxidative burst during infection. Proc. Natl. Acad. Sci. USA 109,
15413–15418.
Yuan, T.L., and Cantley, L.C. (2008). PI3K pathway alterations in cancer: var-
iations on a theme. Oncogene 27, 5497–5510.
Zhang, X., Wang, J., Fan, C., Li, H., Sun, H., Gong, S., Chen, Y.H., and Shi, Y.
(2009). Crystal structure of TIPE2 provides insights into immune homeostasis.
Nat. Struct. Mol. Biol. 16, 89–90.
Zhang, Y., Wang, M.Y., He, J., Wang, J.C., Yang, Y.J., Jin, L., Chen, Z.Y., Ma,
X.J., Sun, M.H., Xia, K.Q., et al. (2012). Tumor necrosis factor-a induced
protein 8 polymorphism and risk of non-Hodgkin’s lymphoma in a Chinese
population: a case-control study. PLoS ONE 7, e37846.

Cancer Cell, Volume 26
Supplemental Information
TIPE3 Is the Transfer Protein
of Lipid Second Messengers that Promote Cancer
Svetlana A. Fayngerts, Jianping Wu, Camilla L. Oxley, Xianglan Liu, Anastassios Vourekas, Terry Cathopoulis, Zhaojun Wang, Jian Cui, Suxia Liu, Honghong Sun, Mark A. Lemmon, Lining Zhang, Yigong Shi, and Youhai H. Chen

SUPPLEMENTAL DATA
Figure S1, related to Figure 1. TIPE3 expression and TIPE3 knockdown (A-C) Real-time PCR analyses of TIPE3 expression in murine organs, tissues, or cells (A and B)

and human cell lines (C). The expression levels of TIPE3 in bone marrow (A), RAW 264.7 cells (B), and U937 cells were set as 1. (D and E) Quantitation of the intensity of TIPE3 expression in tumors and adjacent tissues of 60 patients with lung cancer (D) and 24 patients with esophageal cancer (E) was performed as described in Supplemental Experimental Procedures. Each data point represents a TIPE3 expression intensity score of patient’s tumor or adjacent tissue. Lines represent medians. (F) Real-time PCR analyses of TIPE3, TIPE2, TIPE1, and TNFAIP8 expression in NCI-H727, T24, and HT-29 cells stably expressing either shTIPE3 or shScr. Levels of TIPE3, TIPE2, TIPE1, and TNFAIP8 expression in NCI-H727, T24, and HT-29 cells stably expressing shScr were set as 1. (G) Whole cell lysates were prepared from HT-29 cells stably expressing either shTIPE3 or shScr, or HeLa cells. Western blot was performed with anti-TIPE3 TH-domain antibody and anti--actin antibody. MLF, murine lung fibroblasts. Values represent means ± SD, * p< 0.05, and ** p< 0.01. The experiments were performed in duplicate and repeated at least three times with similar results.

Figure S2, related to Figure 2. TIPE3 promotes tumorigenesis in vitro and in vivo (A) 293T cells were transfected with empty vector, HRasV12, PI3KE545, with or without TIPE3-Flag plasmid as indicated and relative cell numbers were determined 32 hr after transfection. Number of 293T cells transfected with empty vector was set as 1. (B) Soft agar colony forming abilities of NIH3T3-HRasV12 cells stably transfected with either TIPE3-Flag or empty vector. (C-E) Tumors generated as described in Figure 2 were weighed and compared (C) Tumor sections from mice that received Brdu injection 2 hr before sacrifice were stained for Brdu by immunofluorescence histochemistry. Brdu staining was detected using a Cy3-labeled secondary antibody and is shown in pink, whereas DAPI-stained nuclei are shown in blue (D) Immunofluorescence staining was also performed on tumor sections with anti-cleaved caspase-3 antibody. The percentages of cleaved caspase-3-positive cells are shown (E). (F) Lysates were prepared from the uteri of 3 Tipe3-/- and 3 wild type (WT) mice. Western blot was performed with anti-TIPE3 TH-domain antibody and anti--actin antibody. (G) 293T cells were transfected with equal amounts of the following plasmids as indicated: empty vectors, TIPE3-Flag, TIPE2-Flag, TIPE1-Flag, and TNFAIP8-Flag. Relative cell numbers were determined (left panel, number of 293T cells transfected with empty vector was set as 1), and the degree of cell death

was assessed by trypan blue staining (right panel) 32 hr later. For bar graphs, Y-axis values represent means ± SD, * p<0.05, and ** p <0.01. The experiments were repeated at least three times with similar results.
Figure S3, related to Figure 3. The unique roles of TIPE3 (A) 293T cells were co-transfected with pMigR1 (IRES-GFP, for IRES-dependent translation) and either TIPE3-Flag-expressing or empty vector. The relative levels of GFP protein expression 32 hr after the transfection were quantified by measuring the cellular mean fluorescence intensity (MFI) (left panel), and the relative levels of GFP mRNA expression were determined by real-time PCR (right panel). Protein and mRNA levels of cells transfected with empty vector were set

as 1. (B) 293T cells that did or did not stably express TIPE3-Flag were transfected with pEGFP-C3 (5’cap-GFP, for cap-dependent translation). After 3.5 hr, cells were cultured with or without LY29 (LY29004) or PD98 (PD98059) inhibitors as indicated. The levels of GFP protein expression were quantified by measuring the cellular MFI 12 hr later. The GFP level of 293T cells stably transfected with empty vector and cultured without inhibitors was set as 1. (C) NIH3T3 cells transfected with either TIPE3-Flag (TIPE3 +) or empty vector (TIPE3 -) were cultured with or without 10% fetal calf serum (FCS) or LY29 (LY29004) as indicated. After 12 hr, whole cell lysates were prepared and examined by Western blot with anti-cleaved caspase-3 (C. casp-3) and anti--actin. (D) NIH3T3 cells transfected with either TIPE3-Flag or empty vector were cultured in serum-free medium with or without LY29 (LY29004) for the indicated times. Cell death was assessed by trypan blue staining. For bar graphs, Y-axis values represent means ± SD; ns designates not significant; * p<0.05, and ** p <0.01; h denotes hr. The experiments were repeated three times with similar results. (E) Sequence alignment of murine TNFAIP8, TIPE1, TIPE2, and TIPE3 proteins was generated by CLUSTAL W2. Identical residues are highlighted in black and similar residues are highlighted in gray (generated by the BOXSHADE 3.21).

Figure S4, related to Figure 4. TIPE3 promotes the activation of PI3K-AKT and MEK-ERK pathways

(A) Whole cell lysates were prepared from NIH3T3 cells stably transfected with TIPE3-Flag, trTIPE3-Flag, or empty vectors (Top Panel), or TIPE3-Flag and/or HRasV12 vectors (Bottom Panel). Western blot was performed using antibodies against the indicated proteins. (B) Whole cell lysates were prepared from NCI-H727, T24, and HT-29 cells stably expressing either shTIPE3 or shScr. Western blot was performed using antibodies against the indicated proteins. (C) Whole cell lysates were prepared from 3 Tipe3-/- and 2 wild type fibrosarcoma cultures established from different 3-methylcholanthrene-induced tumors. Western blot was performed using antibodies against the indicated proteins. (D and E) NIH3T3 cells stably transfected with either TIPE3-Flag (TIPE3 +) or empty vectors (TIPE3 -) were serum-starved, and then stimulated with 40 ng/ml of PDGF for the indicated times, with or without the following inhibitors: LY29 (LY29004), Rapa (Rapamycin), PD98 (PD98059), Bis I (Bisindolylmaleimide I), or U-73 (U-73122). Western blot was performed using antibodies against the indicated proteins. (F and G) NIH3T3 cells were transfected with TIPE3-GFP (F) or GFP (G) plasmids and analyzed by immunofluorescence confocal microscopy. PtdIns(4,5)P2 (shown in green) was detected with anti-PtdIns(4,5)P2 and Alexa Fluor 555-labeled secondary antibody. TIPE3-GFP and GFP are shown in red and DAPI-stained nuclei are shown in blue. For Panel (E), five cells are shown, but only one expresses TIPE3-GFP. For Panel (F), six cells are shown with only three expressing GFP. (H) Cellular levels of PtdIns(4,5)P2 and PtdIns(3,4,5)P3 in NIH3T3 cells stably transfected with either TIPE3-Flag or empty vector were estimated by dot blot with anti-PtdIns(4,5)P2 and anti-PtdIns(3,4,5)P3 antibodies. Signals of cells transfected with empty vector were set as 1. (I) Cellular levels of PtdIns(4,5)P2 and PtdIns(3,4,5)P3 in Tipe3-/- and wild type fibrosarcoma cells were measured by protein-lipid overlay assay with GST-PLC-PH and GST-GRP1-PH proteins. Data are pooled from 3 Tipe3-/- and 2 wild type fibrosarcoma cultures established from different 3-methylcholanthrene-induced tumors. Signals of wild type fibrosarcoma cells were set as 1. (J) Cellular levels of PtdIns(4,5)P2 and PtdIns(3,4,5)P3 in NIH3T3 cells stably transfected with either trTIPE3-Flag or empty vector were estimated by protein-lipid overlay assay with GST-PLC-PH and GST-GRP1-PH domains (Right Panel) and by dot blot with anti-PtdIns(4,5)P2 and anti-PtdIns(3,4,5)P3 antibodies (Left Panel). Signals of cells transfected with empty vector were set as 1. For Panels (H-J) the densitometric quantification of signals was performed using ImageJ software. Y-axis values represent means ± SD, * p<0.05, and ** p< 0.01. p- indicates phosphorylated. The experiments were performed at least three times with similar results.


Figure S5, related to Figure 5. TIPE3 regulates phosphoinositide metabolism and signaling (A-C) Cells were treated and analyzed as described in Figure 4A-4C. GFP signals are shown in green; Flag antibody staining, detected with an Alexa Fluor 555-labeled secondary antibody, is shown in red. For A-C, the experiments were repeated at least three times with similar results. (D-F) NIH3T3 cells were transfected with TIPE3-GFP (D), GFP (E), or TIPE3-Flag (F) plasmids. Thirty-two hr after the transfection, cells were fixed, permeabilized with 0.1% Triton X-100, and analyzed by immunofluorescence confocal microscopy. PtdIns(4,5)P2 detected with anti-PtdIns(4,5)P2 and Alexa Fluor 555-labeled secondary antibody is shown in green. The plasma membrane PtdIns(4,5)P2 is seen as multiple dots due to the loss of lipid bilayer integrity under the permeabilization condition. TIPE3-GFP (D), GFP (E) and TIPE3-Flag detected with anti-Flag Alexa Fluor 488 antibody (F) are shown in red. For Panel D, four cells are shown, but only one expresses TIPE3-GFP. For Panel E, two cells are shown with one expressing GFP. For Panel F, three cells are shown with only one expressing TIPE3-Flag. For D-F, the experiments were repeated at least two times with similar results. For A-F, DAPI-stained nuclei are shown in blue. The last image in each group is an overlay of the other three.

Table S1, related to Figure 6. Crystallographic statistics for the TH-domain of human TIPE3.
Data TIPE3 (21-204) Space Group I222
Cell dimentions a, b, c (Å), �, �, � (°) 61.73, 87.30, 242.31, 90, 90, 90
Number of molecules in ASU 2 Wavelength (Å) 0.9796 Resolution (Å) 40~2.30 (2.38~2.30) Rmerge (%) 7.3 (38.2)
I/� 30.4 (6.6)
Completeness (%) 99.4 (99.9) Number of measured reflections 199733 Number of unique reflections 29376 Redundancy 6.8 (7.0) Wilson B factor (Å2) 43.2 R-factor (%) 23.98 Rfree (%) 26.19 Number of atoms Protein main chain 1498 Protein side chain 1557 Protein all atoms 3055 Water molecules 137 Other entities 44 All atoms 3236 Average B value (Å2) Protein main chain 54.8 Protein side chain 62.9 Protein all atoms 58.9 Water molecules 58.7 Other entities 108.6 All atoms 59.5 Rms deviations from ideal values Bonds (Å) 0.010 Angle (°) 1.219 Ramachandran plot statistics (%) Most favorable 94.1 Additionally allowed 5.7 Generously allowed 0.3 Disallowed 0
Values for highest resolution shell are shown in parentheses. Rmerge=�h�i|Ih,i-Ih|/�h�iIh,i, where Ih is
the mean intensity of the i observations of symmetry related reflections of h. R=�|Fobs-
Fcalc|/�Fobs, where Fcalc is the calculated protein structure factor from the atomic model (Rfree was
calculated with 5% of the reflections selected).

Figure S6, related to Figure 6. TIPE3 binds to phosphoinositides (A) Cartoon representation of trTIPE3 homodimer formed in the crystal. Chains A (residues 22-204) is shown in cyan and chain B (residues 21-204) is shown in green. (B) TIPE3-Flag, TIPE3 4Q-Flag, TIPE3 3Q-Flag, TIPE3 2Q-Flag, TIPE3 60W-Flag, trTIPE3-Flag, trTIPE3 4Q-Flag, TIPE2-Flag, TIPE1-Flag, TNFAIP8-Flag, TIPE3, and TIPE3 4Q proteins were purified from
293T cells. GST, TIPE3-Flag (E. coli), GST-PLC�-PH, and PLC�-PH were purified from
Escherichia coli BL21 cells. Purified proteins were separated by SDS-PAGE and stained with

silver. The HSPA8 and HSPA1A protein bands (identified by mass spectrometry) are also seen in the TIPE3 60W-Flag lane. (C) Binding of TIPE3-Flag, trTIPE3-Flag (purified after
overexpression in 293T cells), and GST-PLC�-PH proteins to lipids spotted on PIP strips, in the
presence or absence of inositol-1,4,5-trisphosphate (Ins(1,4,5)P3), as determined by protein-lipid overlay assay. Control eluate as described in Supplemental Experimental Procedures was used as the control. LPA, lysophosphatidic acid; LPC, lysophosphocholine; PE, phosphatidylethanolamine; PC, phosphatidylcholine; S(1)P, sphingosine-1-phosphate; PA, phosphatidic acid; PS, phosphatidylserine. (D and E) Binding of (D) GST and TIPE3-Flag proteins (purified from Escherichia coli BL21 cells) and (E) TIPE2-Flag, TIPE1-Flag and TNFAIP8-Flag proteins (purified from 293T cells) to phosphoinositides spotted on PIP strips as determined by protein-lipid overlay assay.

Figure S7, related to Figure 7. TIPE3 binds to phosphoinositides through its TH domain and the binding is essential for its function (A) The structure models of wild type murine TIPE3 (residues 21-204) and murine TIPE3 mutants (residues 21-204) generated based on human TIPE3 crystal structure using Phyre2 and PyMOL are shown in surface presentation. Amino acids with hydrophobic side chains are shown in orange, those with positively charged side chains are in blue, and those with negatively

charged side chains are colored red. Tryptophan positioned inside the hydrophobic pocket, which is mutated in TIPE3 60W, as well as several other residues mutated in this study are marked. (B) Binding of recombinant TIPE3-Flag, TIPE3 4Q-Flag, TIPE3 3Q-Flag, TIPE3 2Q-Flag, TIPE3 60W-Flag, trTIPE3-Flag, and trTIPE3 4Q-Flag proteins to lipids spotted on PIP strips as determined by protein-lipid overlay assay. (C) 293T cells were co-transfected with pEGFP-C3 and one of the following plasmids: empty vector, TIPE3-Flag, TIPE3 4Q-Flag, TIPE3 3Q-Flag, TIPE3 2Q-Flag, and TIPE3 60W-Flag. The relative levels of GFP protein expression were quantified by measuring cellular MFI 32 hr after the transfection. GFP level of cells transfected with empty vector was set as 1. (D) 293T cells were co-transfected with pEGFP-C3 and one of the following plasmids: empty vector, TIPE3-Flag, TIPE3 4Q-Flag, TIPE3 3Q-Flag, TIPE3 2Q-Flag, and TIPE3 60W-Flag. The levels of Flag-tagged proteins and actin were determined by Western blot 16 hr after the transfection. (E) Whole cell lysates were prepared from NIH3T3 cells stably transfected with either TIPE3 4Q-Flag or empty vector. Western blot was performed using antibodies against the indicated proteins. (F) Total levels of PtdIns(4,5)P2 and PtdIns(3,4,5)P3 in NIH3T3 cells stably transfected with either TIPE3 4Q-Flag or empty vector were measured by protein-lipid overlay assay with GST-PLC-PH and GST-GRP1-PH domains. The densitometric quantification of signals was performed using ImageJ software. Signals of cells transfected with empty vector were set as 1. (G and H) 293T cells were transfected with 4
μg of the following plasmids: empty vector, trTIPE3-Flag, trTIPE3 4Q-Flag, trTIPE3 3Q-Flag,
trTIPE3 2Q-Flag, and trTIPE3 60W-Flag. Thirty-two hr after the transfection, cells were stained with trypan blue, and relative cell numbers (G) and percentages of dead cells (H) determined by light microscopy. The number of 293T cells transfected with empty vector was set as 1. (I) 293T
cells were transfected with 4 μg of the following plasmids: empty vector, trTIPE3-Flag, trTIPE3
4Q-Flag, trTIPE3 3Q-Flag, trTIPE3 2Q-Flag, or trTIPE3 60W-Flag. The levels of Flag-tagged proteins and actin were determined by Western blot 16 hr after the transfection. (J) 293T cells
were transfected with 4 μg of empty vector, or co-transfected with 2 μg of trTIPE3 plasmid and
2 μg of one of the following plasmids: empty vector, PI3KE545, Myr (myristoylated) PIP5K,
and HRasV12. Thirty-two hr after the transfection, cells were stained with trypan blue and the percentages of dead cells determined. (K) The sedimentation-based extraction assay was used to
determine (i) the percentages of TopFluorPtdIns(4,5)P2 extracted from 100 μM 20%
TopFluorPtdIns(4,5)P2+80% PC vesicles and the percentages of TopFluorPC extracted from 100
μM 20% TopFluorPC+80% PC vesicles, and transferred to supernatant by TIPE3 or trTIPE3
(left panel), and (ii) fractions of TIPE3 and trTIPE3 proteins not bound to the 20% TopFluorPtdIns(4,5)P2+80% PC and 20% TopFluorPC+80% PC vesicles (right panel). Proteins were used at a concentration of 20 M. Values represent means ± SD; * p<0.05, and ** p<0.01. p- indicates phosphorylated. The experiments were repeated at least two times with similar results.

SUPPLEMENTAL EXPERIMENTAL PROCEDURES Tumor xenograft study
Tumors were generated by subcutaneous injection of 2105 cells in 100 µl PBS into the
flanks of six-week-old nude mice. Mice were monitored every other day and tumor volume was calculated using the following equation: (width2 length)/6. At day 10 after the cell injection, mice were euthanized. Two hours before euthanasia, a group of mice were injected intraperitoneally with BrdU according to the manufacturer’s instructions (Invitrogen). Tumors were excised, weighed, fixed, and paraffin-embedded for sectioning. Tumor sections were stained with hematoxylin and eosin, or with anti-BrdU or anti-cleaved caspase-3 according to the manufacturer’s instructions (Cell Signaling Technology), and analyzed using ImageJ software. Student’s t-test was used to evaluate the statistical significance of the differences in tumor growth, weight, BrdU incorporation, and caspase-3 cleavage. Carcinogen-induced tumorigenesis study
Each seven-week-old female Tipe3-/- or wild type mouse was subcutaneously injected into the hind flank with 0.4 mg of 3-methylcholanthrene in 0.1 ml of corn oil. Mice were monitored weekly for the development of tumors and tumor volume was calculated as described above. At 17 weeks after the carcinogen injection, mice were euthanized and tumors were aseptically excised. Tumors were processed to establish fibrosarcoma cell cultures or fixed for histological analyses. For the establishment of Tipe3-/- and wild type fibrosarcoma cell cultures, tumor samples were finely minced and enzymatically digested by collagenase P (1.0 mg/ml, Roche) at 37°C for 15 min with rapid shaking. Then tumor samples were thoroughly washed and cultured in DMEM (Gibco) supplemented with 15% heat-inactivated fetal bovine serum (HyClone) and 100 U/ml penicillin and100 g/ml streptomycin (Gibco) at 37°C, with 5% CO2 for 2 weeks. Mann-Whitley U test was used to evaluate the statistical significance of the differences in tumor incidence and tumor growth between Tipe3-/- and wild type groups. Human cancer studies
To study TIPE3 expression, we purchased two independently generated rabbit anti-TIPE3 antibodies - the first was against the RPNLKRICEGINKLLDEKVL peptide and the second against the MDSDSGEQSEGEPGC peptide of human TIPE3 (Wuhan Boster Biological Technology Inc., China). Both antibodies specifically recognize TIPE3, exhibit no cross-reactivity with other members of the TNFAIP8 family, and work for Western blot and immunohistochemistry (Sun et al., 2014). The first antibody was used for human lung and esophageal cancer studies whereas the second one was used for cervical and colon cancer studies. All tissue sections were 4 m-thick and embedded in paraffin. They were first heated, dewaxed, and hydrated, followed by antigen retrieval in 10 mM citrate buffer solution, pH 6.0 (heated to boiling for 2-3 min). Endogenous peroxidase was blocked using 3% solution of hydrogen peroxide. The sections were then blocked with goat serum for 10 min, and incubated with rabbit anti-TIPE3 polyclonal antibodies at 4 ℃ overnight. Secondary staining was performed with HRP-conjugated anti-rabbit IgG using a MaxVisionTM Kit and a DAB Peroxidase Substrate kit (Maixin Co., Fuzhou, China). The sections were counterstained with hematoxylin. Normal rabbit IgG was used as a control for the primary antibody. All slides were independently analyzed by two pathologists in a blinded manner, and scored based on both intensity of TIPE3 expression and the percentage of TIPE3 positive cells as follows. The

intensity of TIPE3 expression: 0, no staining; 1, weak staining; 2, moderate staining; 3, strong staining. The percentage of TIPE3 positive cells: 0, <1%; 1, 1-20%; 2, 21-40%; 3, 41-60%; 4, 61%~80%; 5, ≥81%. The two scores for each slide were then combined to produce a final TIPE3 expression score. When there were discrepancies between the two pathologists, the average score was used. Mann-Whitney U test was used to evaluate the statistical significance of the results. Cell culture and plasmids Cell lines were obtained from the American Type Culture Collection (ATCC) and maintained in the suggested media. The following pharmacological inhibitors were used to treat the cells: LY29004 (50 M, Cell Signaling Technology), PD98059 (100 M, Promega), U-73122 (5 M, Calbiochem), Bisindolylmaleimide I (4 M, Cell Signaling Technology), and Rapamycin (100 nM, Cell Signaling Technology). Full-length TIPE3 cDNA was isolated from a C57BL/6 mouse brain by RT-PCR using TIPE3-specific primers, and subcloned into pRK5 and pBabe-hygro vectors with a Flag tag endcoded at the C- and/or N-terminus, as well as pEGFP-C3, pRK5-GST-HA PreScission [derived from pRK5-GST-HA PreScission p70 S6K1 (Addgene)], and pGEX-4T-1 vectors. TIPE3 and TIPE2 mutants were generated from TIPE3 and TIPE2 cDNAs, respectively, by PCR, and cloned as described for TIPE3. GRP1-PH-GFP was generated by cloning GRP1-PH fragment into pEGFP-C1 vector (Kavran et al., 1998). HRasV12 (pBabe HRasV12), PI3KE545 (pBabe HA PIK3CA E545K), myr-PIP5K (pWZL Neo Myr Flag
PIP5K1B), PLC�-PH-GFP (pEGFP-C1-PLC�-PH), and AKT-PH-GFP (pEGFP-C1-AKT-PH)
plasmids were purchased from Addgene. ShTIPE3 (GATCATGGTTGAGTGCTGTAACTTCA AGAGAGTTACAGCACTCAACCATGATC) and shScr (GATAGGTCTGGATGTATCAGTC TTCAAGAGAGACTGATACATCCAGACCTATC) were amplified together with U6 promoter by PCR and cloned into the pBabe-puro vector. Plasmid DNA transfection and viral infection
293T cells were transfected with plasmid DNA using Fugene 6 (Promega) reagent according to the manufacturer’s instructions. For virus production, pBabe (with puromycin or hygromycin resistance) with or without TIPE3, trTIPE3, HRasV12, shTIPE3, or shScr fragments and packaging constructs were co-transfected into 293T cells. After 24 and 48 hr, virus-containing medium was filtered and used to infect NIH3T3, NCI-H727, HT-29, or T24 cell lines in the presence of 6.5 mg/ml of polybrene (Millipore). Infected cells were selected using puromycin or hygromycin (Sigma) and used within 10 passages of infection. NIH3T3-HRasV12-vector (empty pBabe) and NIH3T3-HRasV12-TIPE3 cell lines were generated by (i) infecting NIH3T3 with HRasV12 containing virus, followed by selection using puromycin, and (ii) infection of the NIH3T3-HRasV12 cells with empty vector virus and TIPE3 containing virus, respectively, and then selected using hygromycin. Real-time PCR
Total RNA was extracted from tissues or cells with TRIzol (Invitrogen) according to the manufacturer’s instructions. Reverse transcription was performed using SuperScript II Reverse Transcriptase (Invitrogene) with oligo dT primers according to the manufacturer’s instructions. Real-time PCR was carried out in an Applied Biosystems 7500 System with Power SYBR Green PCR Master Mix (Applied Biosystems). Murine Tipe3 PCR fragments were amplified with 5’-CTC ATC CAG TGA GAA TCA AGC-3’ and 5’-GGT TCA AAT CCG CAT CAG AGT-3’

primers. Human TIPE3, TIPE2, TIPE1, and TNFAIP8 PCR fragments were amplified with Hs_TNFAIP8L3_1_SG, Hs_TNFAIP8L2_1_SG, Hs_TNFAIP8L1_1_SG and Hs_TNFAIP8_3_SG QuantiTect Primers, respectively (Qiagen). Relative levels of murine and human TIPE family gene expression were determined using murine and human GAPDH, respectively, as the endogenous control. Levels of GFP mRNA in 293T cells transfected with GFP-expressing plasmids (pEGFP-C3 or pMigR1) were determined by quantitative real-time PCR using EGFP_1_SG QuantiTect Primers (Qiagen) and the corresponding plasmids as standards. All reactions were carried out in duplicates. Student’s t-test was used to evaluate the statistical significance of the results. Cell growth, cycle, and death assays
For the cell growth assay, cells were counted at denoted intervals on a hemocytometer slide using a light microscope. The growth of fibrosarcoma cells was assessed by staining them with crystal violet and determining absorbance at 550 nm. For the cell cycle assay, cells were stained with propidium iodide (Invitrogen) according to the manufacturer’s instructions, and analyzed by flow cytometry for DNA content. For cell death assay, cells were stained with trypan blue and counted on a hemocytometer slide using a light microscope. For all assays, cells were cultured in duplicates. The Student’s t-test was used to evaluate the statistical significance of the results. Soft agar colony formation assay Cells suspended in culture medium containing 0.3% of Noble Agar (Difco) were overlaid onto a bottom layer of solidified 0.6% Noble Agar in culture medium, at a concentration of 5×10³ cells per well of six-well plates. Cells were cultured for 1-4 weeks until visible colonies were formed. Each cell line was assayed in duplicates. Colonies were analyzed with a light microscope, photographed, and quantified, and the colony sizes were analyzed using ImageJ software. More than thirty different fields were analyzed to assess the average number of colonies for each cell line and more than thirty colonies were analyzed to determine the average size of the colonies. Student’s t-test was used to evaluate the statistical significance of the results. GFP protein synthesis assay
293T cells were plated in 6-cm dishes (1×10⁶/dish) and co-transfected with 1 μg of either
pEGFP-C3 (5’cap-GFP) or pMigR1 (IRES-GFP) and 3 μg of one of the following constructs:
pRK5, pRK5-TIPE3-Flag, pRK5 TIPE3 2Q-Flag, pRK5 TIPE3 3Q-Flag, pRK5 TIPE3 4Q-Flag, pRK5 TIPE3 60W-Flag, and pRK5-trTIPE3-Flag. Thirty-two hr later, the transfected cells were collected, and the intensity of cellular green fluorescence was analyzed by flow cytometry. The cells co-transfected with pRK5-trTIPE3-Flag were collected and analyzed 16 hr after the transfection to avoid trTIPE3-induced cell death. The results were evaluated using Student’s t-test for statistical significance. Immunofluorescence staining
For staining PtdIns(4,5)P2 on plasma membrane with specific antibodies, NIH3T3 cells were transfected with pEGFP-C3, pEGFP-TIPE3, and pEGFP-trTIPE3 using PolyFect Transfection Reagent (Qiagen) according to the manufacturer’s instructions. Thirty-two hours later, cells were stained as described by Hammond et al. and Sharma et al. with minor modifications (Hammond et al., 2009; Sharma et al., 2008). Briefly, cells were fixed with 4%

formaldehyde and 0.2% glutaraldehyde in HBS (25 mM HEPES, 150 mM NaCl, pH 7.4) buffer
for 1 h at 4◦C, permeabilized and blocked with 0.5% saponin in HBS buffer containing 3% BSA
(fatty acids free, Sigma) for 2 h at 4◦C, and then stained with primary anti-PtdIns(4,5)P2 (1:100)
(Echelon) in HBS/3% BSA/0.5% saponin overnight at 4◦C and secondary anti-mouse IgM (Fab fragment) labeled with Alexa Fluor 555 (1:2000) (Invitrogen) in HBS/3% BSA/0.5% saponin for
2 h at 4◦C. For staining PtdIns(4,5)P2 in nucleus with specific antibodies, NIH3T3 cells were transfected with pEGFP-C3, pEGFP-TIPE3, or pRK5-TIPE3-Flag using PolyFect Transfection Reagent according to the manufacturer’s instructions. Thirty-two hours later, cells were fixed
with 3% formaldehyde in HBS buffer for 15 min at 37◦C, permeabilized with 0.1 % Triton X-100 in HBS/3% BSA buffer for 10 min at room temperature (RT), blocked with 3% BSA in HBS for 50 min at RT and then, stained with primary anti-PtdIns(4,5)P2 (1:100) in HBS/3% BSA for 1 h at RT, secondary anti-mouse IgM (Fab fragment) labeled with Alexa Fluor 555 (1:2000) and anti-Flag antibody labeled with Alexa Fluor 488 (1:300) (Cell Signaling Technology) in HBS/3% BSA for 1 h at RT. For staining phosphoinositides with specific PH-domains, NIH3T3 cells were co-transfected with pRK5, pRK5-TIPE3-Flag, or pRK5-trTIPE3-Flag and one of the
following plasmids: PLC�-PH-GFP, AKT-PH-GFP, and GRP1-PH-GFP using PolyFect
Transfection Reagent. Thirty-two hr later, cells were fixed with 3% formaldehyde in HBS buffer
for 15 min at 37◦C, permeabilized with 0.1 % Triton X-100 in HBS/3% BSA for 10 min at RT, blocked with 3% BSA in HBS for 50 min at RT and then, stained with primary anti-Flag antibody (1:2000) in HBS/3% BSA for 1 h at RT and secondary anti-mouse IgG antibody (Fab fragment) labeled with Alexa Fluor 555 (1:3000) (Invitrogen) in HBS/3% BSA for 1 h at RT. In all experiments, immunofluorescence staining with fluorescently labeled secondary antibody only was used as controls. All slides were dried and covered with ProLong Gold with DAPI (Invitrogen). Images were acquired on a Zeiss LSM 510 NLO/META confocal microscope and analyzed using LSM Image Browser (Zeiss) and NIS-Elements BR3.10 (Nikon) software. All images shown are representatives of at least two independent experiments. More than thirty fields of cells expressing either TIPE3-GFP, GFP, or TIPE3-Flag were analyzed in each set of PtdIns(4,5)P2 immunofluorescence experiments. Each field contained at least one cell expressing TIPE3-GFP, GFP, or TIPE3-Flag, and two non-transfected cells. Chi-squire test was used to evaluate the statistical significance of the results. The sub-cellular distribution of fluorescence signals was determined for at least seven individual cells per experiment using line intensity profiles (Stauffer et al., 1998). Student’s t-test was used to evaluate the statistical significance of the results. Western blot
For Western blot estimation of proteins, cells were lysed for 20 min at 4°C in 1% Triton X-100 lysis buffer containing protease and phosphatase inhibitors. Cell debris was removed by centrifugation at 14,000 × g for 20 min at 4°C. In subcellular fractionation experiment membrane and cytoplasmic proteins were separated using Qproteome Cell Compartment Kit (QIAGEN) according to the manufacturer’s instructions. The protein concentration of the lysates was determined by BCA assay (Pierce). Equal amounts of total protein were resolved by SDS-PAGE, transferred to membranes, immunoblotted with specific primary and secondary antibodies, and the signals were detected by chemiluminescence (Pierce). Primary antibodies for p-AKT(T308), AKT, p-ERK1/2 (T202/Y204 of ERK1 and T185/Y187 of ERK2), ERK1/2, p-p70 S6K (T389),

cyclin D1, and cleaved caspase-3 were purchased from Cell Signaling Technology and used
according to the manufacturer’s instructions. Anti-HRas (used at dilution 1:500) and anti-�1
sodium potassium ATPase antibodies (1:1000) were from Abcam, and anti-Flag (1:2000), anti-�-
actin (1:3000) and anti-GAPDH antibodies (1:3000) were from Sigma. Anti-TIPE3 antibodies
raised against the TIPE3 TH-domain were used at a concentration of 0.15 μg/ml. These
antibodies specifically recognize TIPE3 protein and exhibit no cross-reactivity with other members of the TNFAIP8 family. HRP-conjugated secondary anti-mouse and anti-rabbit IgG (1:1500) were purchased from GE Healthcare. The densitometric quantification of Western blot signals was performed using ImageJ software. Paired t-test was used to evaluate the statistical significance of the results. TIPE3 purification for crystallization
Different constructs of human TIPE3 were screened for expression and behavior in both bacterial and insect cells. For selected bacterial expression system, TIPE3 sequence was codon-optimized and cloned into a modified pGEX-4T2 (GE Healthcare) vector with the drICE cleavage site. The Escherichia coli BL21(DE3) cells transformed with pGEX-4T2 TIPE3 vector
were incubated at 37oC for 3 hr, followed by TIPE3 induction with 0.1 mM isopropyl-�-D-
thiogalactopyranoside (IPTG) at OD600 of ~1.0. After growing for 14 hr at 15◦C, the cells were harvested and re-suspended in TBS (25 mM Tris-HCl, 1 M NaCl, pH 8.0) buffer. The cells were
lysed by sonication and cell debris was removed by centrifugation at 13000 rpm for 1 hr at 4◦C. After centrifugation, the supernatant was loaded onto Glutathione Sepharose 4B resin (GE Healthcare) and washed with TBS buffer. The fusion protein was digested on column by drICE
protease at 4◦C overnight and eluted with TBS buffer. The eluate was concentrated to about 15
mg/ml and incubated with trypsin (final concentration of 35 μg/ml) for 30 min at RT. The
protein was then applied to Superdex-200 (GE Healthcare) in TBS buffer, and the peak fraction was collected for crystallization with a final concentration of 10 mg/ml. Estimation of PtdIns(4,5)P2 and PtdIns(3,4,5)P3 cellular levels
Cellular levels of PtdIns(4,5)P2 and PtdIns(3,4,5)P3 were estimated using protein-lipid overlay assay with GST-PLC-PH and GST-GRP1-PH domains and dot blot with anti-PtdIns(4,5)P2 or anti-PtdIns(3,4,5)P3 antibody. For protein-lipid overlay assay, phosphoinositides were isolated from the cells as described (Clark et al., 2011) and spotted on membranes. The membranes were blocked with 3% BSA in PBS-0.1% Tween-20 (PBS-T) for 1 h at RT and
incubated with GST-PLC-PH or GST-GRP1-PH (1.0 μg/ml, Echelon) in PBS-T with 3% BSA
for 1 h at RT. Proteins were detected with anti-GST-HRP antibody (Cell Signaling Technology). In control protein-lipid overlay assays membranes were stained with anti-GST-HRP only. For normalization, part of the cell cultures were lysed in 1% SDS lysis buffer containing protease and phosphatase inhibitors, sonicated, spotted on membranes and immunoblotted with murine
anti-�-actin (1:4000) and HRP-conjugated secondary anti-mouse IgG (1:3000). For dot blot
studies, cells were lysed in 1% SDS lysis buffer containing protease and phosphatase inhibitors, and sonicated (Barrero-Villar et al., 2008). Lysates were normalized as described above. The normalized lysates were then spotted on membranes, immunoblotted with primary anti-

PtdIns(4,5)P2 (1:1000, Echelon) or anti-PtdIns(3,4,5)P3 (1:200, Echelon) and the secondary HRP-conjugated anti-mouse IgM (1:2000, Invitrogen) or Flag-HRP antibody (1:1000, Sigma). Signals were detected by chemiluminescence (Pierce) and quantified by desitometry using ImageJ software. Paired t-test was used to assess the statistical significance of the results. Screening for lipid binding using protein-lipid overlay assay
The membrane lipid strips containing triglyceride, PtdIns, PtdIns(4)P, PtdIns(4,5)P2, PtdIns(3,4,5)P3, phosphatidylserine (PS), phosphatidylethanolamine (PE), phosphatidic acid (PA), diacylglycerol (DAG), cholesterol, phosphatidylcholine (PC), sphingomyelin, phosphatidylglycerol (PG), 3-sulfogalactosylceramide, and cardiolipin, and PIP strips containing lysophosphatidic acid (LPA), lysophosphocholine (LPC), PtdIns(3)P, PtdIns(4)P, PtdIns(5)P, PtdIns(3,4)P2, PtdIns(4,5)P2, PtdIns(3,5)P2, PtdIns(3,4,5)P3, PE, PC, sphingosine 1-Phosphate (S1P), PA, PS were purchased from Echelon. The strips were blocked with 3% BSA in PBS-T for 1 h at RT. Recombinant TIPE3 and TIPE3 mutants with a Flag tag at the N-terminus were purified from 293T cells using Dynabeads Protein G (Invitrogen) coated with Flag antibodies (Sigma), and eluted from the beads with Flag-peptides (Sigma). Eluate samples for the control group were obtained by subjecting the lysates of 293T-pRK5 cells to the same purification process described above. Recombinant GST and GST-TIPE3-Flag proteins were affinity-purified from Escherichia coli BL21(DE3) cells (Stratagene) using Glutathione MagBeads (GenScript). GST was eluted from the beads with reduced glutathione; TIPE3-Flag was eluted by proteolytic cleavage of GST-TIPE3-Flag on the beads with thrombin (Amersham). Eluates were then concentrated, and depleted of Flag-peptides, reduced glutathione, or other contaminants by dialysis with Amicon Centrifugal Filters (Millipore). GST-PLC-PH was purchased from Echelon. The strips were incubated with 10 nM of purified recombinant proteins in PBS-T with 3% BSA for 1 h at RT. For Ins(1,4,5)P3 competition experiments, 10 nM of recombinant proteins were pre-incubated with 15 M Ins(1,4,5)P3 (Echelon) for 30 min at RT before being used for PIP strip staining. Bound proteins were detected by immunoblot with anti-Flag-HRP or anti-GST-HRP (Millipore) using chemiluminescence reagents. Control protein-lipid overlay assays were performed following the same procedure using the control eluate instead of Flag-tagged proteins. Phosphoinositide binding, extraction, and transfer assays
Dioleoylphosphatidylcholine (DOPC), brominated distearoyl PC (brominated PC), and TopFluor PtdIns(4,5)P2 were purchased from Avanti Polar Lipids. PtdIns(4)P, PtdIns(4,5)P2 and PtdIns(3,4,5)P3 were purchased from Cell signals. Small unilamellar vesicles (SUVs) were produced as described (Lee and Lemmon, 2001). Recombinant GST-TIPE3, GST-TIPE3 4Q, and GST-trTIPE3 were purified from 293T cells using Glutathione MagBeads. TIPE3 and TIPE3 4Q were isolated by cleavage of GST-TIPE3 and GST-TIPE3 4Q proteins, respectively, with PreScission Protease (GE Healthcare), and dialyzed using Amicon Centrifugal Filters. Purified PLC-PH domain was kindly provided by Dr. Mendrola (University of Pennsylvania). Purified trypsin inhibitor of Glycine max was purchased from Sigma. Sedimentation-based binding assays were performed as described (Lee and Lemmon, 2001) with minor modifications: i.e., 20 M of TIPE3, TIPE3 4Q, or Trypsin inhibitor and 10% PtdIns(4,5)P2 [10% PtdIns(4,5)P2 + 10% DOPC + 80% brominated PC], 10% PtdIns(4)P [10% PtdIns(4)P + 10% DOPC + 80% brominated PC],
10% PtdIns(3,4,5)P3 [10% PtdIns(3,4,5)P3 + 10% DOPC + 80% brominated PC] or 100% PC (20% DOPC + 80% brominated PC) SUVs were used in the assays, and the relative amounts of

proteins in supernatants and pellets were determined by silver staining of SDS-PAGE gels containing the resolved proteins. In sedimentation-based PtdIns(4,5)P2 extraction assays, 100 M SUVs composed of 20% TopFluorPtdIns(4,5)P2 and 80% DOPC were mixed with purified
TIPE3 (5 – 40 M), trTIPE3 (20 M) or PLC�-PH (5 – 40 M), incubated 1 h at RT, and
centrifuged as described (Lee and Lemmon, 2001). In sedimentation-based PC extraction assays, 100 M SUVs composed of 20% TopFluorPC and 80% DOPC were mixed with purified TIPE3 (20 M) and trTIPE3 (20 M), incubated 1 h at RT, and centrifuged as described (Lee and Lemmon, 2001). The fluorescence intensity of supernatants (corresponding to TopFluorPtdIns(4,5)P2 or TopFluorPC extraction) was detected using a Synergy 2 fluorescence plate reader (BioTek). In sedimentation-based PtdIns(4,5)P2 transfer assays, supernatants generated in TIPE3 sedimentation-based PtdIns(4,5)P2 extraction assays were mixed with 250 M 100% PC SUVs, incubated for 1 h at RT, and centrifuged as described (Lee and Lemmon, 2001). The pellets were solubilized in HBS buffer containing 0.25% Triton X-100. The fluorescence intensity of supernatants (corresponding to soluble TIPE3/TopFluorPtdIns(4,5)P2) and solubilized pellet fractions (corresponding to TopFluorPtdIns(4,5)P2 transfer into 100% PC SUVs) was detected as above. Student’s t-test was used to assess the statistical significance of the results. Surface plasmon resonance (SPR)-based assay
SPR-based assays were carried out using a BIAcore 3000 instrument measuring PtdIns(4,5)P2 binding as described previously (Moravcevic et al., 2010; Sugiki et al., 2010). Briefly, 10% PtdIns(4,5)P2 [10% PtdIns(4,5)P2 + 90% DOPC], 3% PtdIns(4,5)P2 [3% PtdIns(4,5)P2 + 97% DOPC] or 100% PC (100% DOPC) SUVs were generated and immobilized on L1 sensor chip surfaces (BIAcore), resulting in signals of 6500 to 8500 resonance units.
GST-PLC�-PH was kindly provided by Dr. Moravcevic (University of Pennsylvania). GST-
PLC�-PH (5 M) binding to these surfaces was measured before and after injections of TIPE3
(40 M) or TIPE3 4Q (40 M) in HBS buffer pH 7.4 at a flow rate of 3 l/min. SPR signals detected in sensorgrams were analyzed using BIAevaluation software (BIAcore). Signals for each experiment were corrected for background (DOPC) binding. The PtdIns(4,5)P2 extraction by TIPE3 and TIPE3 4Q from 3% and 10% PtdIns(4,5)P2-containing surfaces was quantified as
reductions in GST-PLC�-PH binding to these surfaces after TIPE3 or TIPE3 4Q had been flowed
over the sensor chip. GST-PLC�-PH binding to PtdIns(4,5)P2-containing surfaces before TIPE3
or TIPE3 4Q exposure was set as 100% and GST-PLC�-PH binding to PtdIns(4,5)P2-containing
surfaces after TIPE3 or TIPE3 4Q exposure was quantified as the percentage reduction. Student’s t-test was used to assess the statistical significance of the results. PI3K enzymatic assay
Active PI3K (p110�/p85�) was purchased from Echelon. SUVs were produced as
described (Lee and Lemmon, 2001). PI3K enzymatic activity was measured using membrane capture assay as described (Knight et al., 2007) with minor modifications. Briefly, PI3K was
assayed at a concentration of 2 μg/ml in HBS buffer with 10 mM MgCl2, 50 μM ATP, 500
μg/ml BSA, 250 μM SUVs composed of 10% PtdIns(4,5)P2 + 10% DOPC + 80% brominated

PC, and in the absence or presence of increasing amounts of TIPE3 (0-200 nM). Before adding to the reactions, SUVs were pre-incubated with 0-200 nM of TIPE3 or BSA in HBS buffer for 1 h at RT. Reactions were initiated by adding ATP, and terminated by spotting on nitrocellulose membrane. Reactions of PI3K with 0-200 nM TIPE3 but without ATP and reactions with ATP and 0-200 nM TIPE3 but without PI3K were used as negative controls. The levels of PtdIns(3,4,5)P3 in each reaction were measured by protein-lipid overlay assay with GST-GRP1-PH domain. Signals were detected by chemiluminescence (Pierce) and quantified by desitometry using ImageJ software. Paired t-test was used to assess the statistical significance of the results. SUPPLEMENTAL REFERENCES Barrero-Villar, M., Barroso-Gonzalez, J., Cabrero, J.R., Gordon-Alonso, M., Alvarez-Losada, S.,
Munoz-Fernandez, M.A., Sanchez-Madrid, F., and Valenzuela-Fernandez, A. (2008). PI4P5-kinase Ialpha is required for efficient HIV-1 entry and infection of T cells. J Immunol 181, 6882-6888.
Clark, J., Anderson, K.E., Juvin, V., Smith, T.S., Karpe, F., Wakelam, M.J., Stephens, L.R., and Hawkins, P.T. (2011). Quantification of PtdInsP3 molecular species in cells and tissues by mass spectrometry. Nat Methods 8, 267-272.
Hammond, G.R., Schiavo, G., and Irvine, R.F. (2009). Immunocytochemical techniques reveal multiple, distinct cellular pools of PtdIns4P and PtdIns(4,5)P(2). Biochem J 422, 23-35.
Moravcevic, K., Mendrola, J.M., Schmitz, K.R., Wang, Y.H., Slochower, D., Janmey, P.A., and Lemmon, M.A. (2010). Kinase associated-1 domains drive MARK/PAR1 kinases to membrane targets by binding acidic phospholipids. Cell 143, 966-977.
Sharma, V.P., DesMarais, V., Sumners, C., Shaw, G., and Narang, A. (2008). Immunostaining evidence for PI(4,5)P2 localization at the leading edge of chemoattractant-stimulated HL-60 cells. J Leukoc Biol 84, 440-447.
Stauffer, T.P., Ahn, S., and Meyer, T. (1998). Receptor-induced transient reduction in plasma membrane PtdIns(4,5)P2 concentration monitored in living cells. Curr Biol 8, 343-346.
Sugiki, T., Takahashi, H., Nagasu, M., Hanada, K., and Shimada, I. (2010). Real-time assay method of lipid extraction activity. Anal Biochem 399, 162-167.
Sun, Y., Liu, X., Wang, Q., Guo, C., Shi, Y., and Zhang, L. (2014). Identification and application of specific antibody against human TIPE3, a new member of TIPE family. Journal of Shandong University 52, 5-9.