
Correlations between meteorological parameters and prostate cancer
Upload
independentCategory
view
0download
0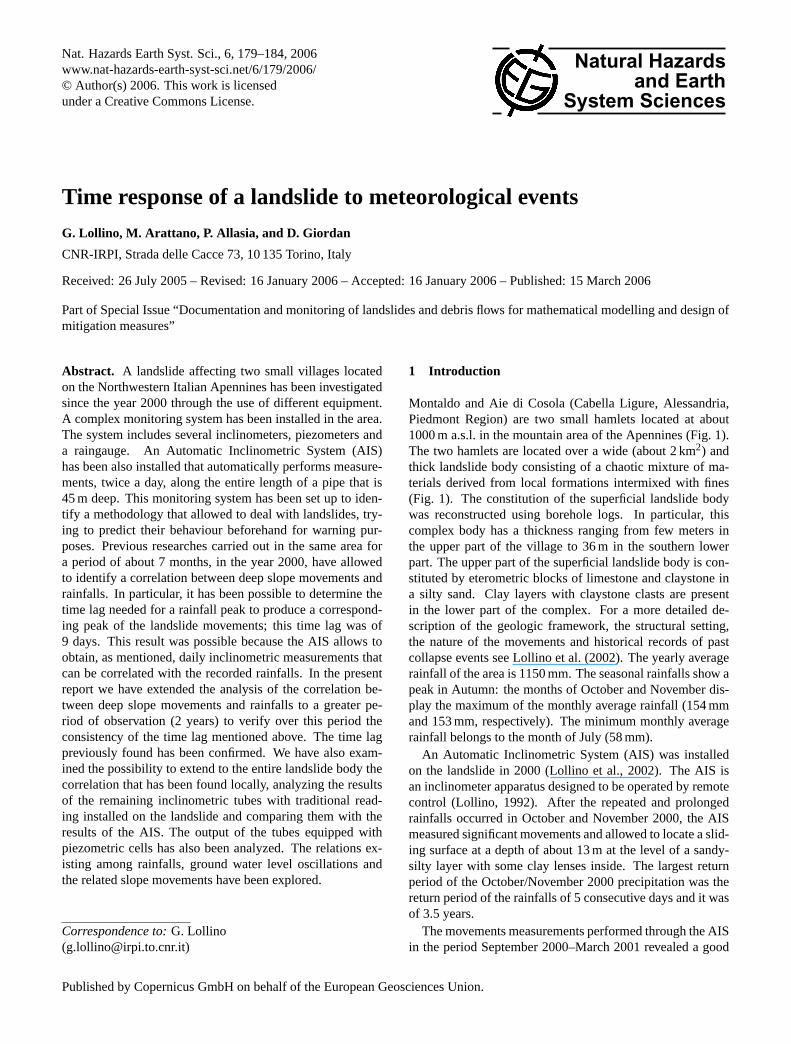
Nat. Hazards Earth Syst. Sci., 6, 179–184, 2006www.nat-hazards-earth-syst-sci.net/6/179/2006/© Author(s) 2006. This work is licensedunder a Creative Commons License.
Natural Hazardsand Earth
System Sciences
Time response of a landslide to meteorological events
G. Lollino, M. Arattano, P. Allasia, and D. Giordan
CNR-IRPI, Strada delle Cacce 73, 10 135 Torino, Italy
Received: 26 July 2005 – Revised: 16 January 2006 – Accepted: 16 January 2006 – Published: 15 March 2006
Part of Special Issue “Documentation and monitoring of landslides and debris flows for mathematical modelling and design ofmitigation measures”
Abstract. A landslide affecting two small villages locatedon the Northwestern Italian Apennines has been investigatedsince the year 2000 through the use of different equipment.A complex monitoring system has been installed in the area.The system includes several inclinometers, piezometers anda raingauge. An Automatic Inclinometric System (AIS)has been also installed that automatically performs measure-ments, twice a day, along the entire length of a pipe that is45 m deep. This monitoring system has been set up to iden-tify a methodology that allowed to deal with landslides, try-ing to predict their behaviour beforehand for warning pur-poses. Previous researches carried out in the same area fora period of about 7 months, in the year 2000, have allowedto identify a correlation between deep slope movements andrainfalls. In particular, it has been possible to determine thetime lag needed for a rainfall peak to produce a correspond-ing peak of the landslide movements; this time lag was of9 days. This result was possible because the AIS allows toobtain, as mentioned, daily inclinometric measurements thatcan be correlated with the recorded rainfalls. In the presentreport we have extended the analysis of the correlation be-tween deep slope movements and rainfalls to a greater pe-riod of observation (2 years) to verify over this period theconsistency of the time lag mentioned above. The time lagpreviously found has been confirmed. We have also exam-ined the possibility to extend to the entire landslide body thecorrelation that has been found locally, analyzing the resultsof the remaining inclinometric tubes with traditional read-ing installed on the landslide and comparing them with theresults of the AIS. The output of the tubes equipped withpiezometric cells has also been analyzed. The relations ex-isting among rainfalls, ground water level oscillations andthe related slope movements have been explored.
Correspondence to:G. Lollino([email protected])
1 Introduction
Montaldo and Aie di Cosola (Cabella Ligure, Alessandria,Piedmont Region) are two small hamlets located at about1000 m a.s.l. in the mountain area of the Apennines (Fig. 1).The two hamlets are located over a wide (about 2 km2) andthick landslide body consisting of a chaotic mixture of ma-terials derived from local formations intermixed with fines(Fig. 1). The constitution of the superficial landslide bodywas reconstructed using borehole logs. In particular, thiscomplex body has a thickness ranging from few meters inthe upper part of the village to 36 m in the southern lowerpart. The upper part of the superficial landslide body is con-stituted by eterometric blocks of limestone and claystone ina silty sand. Clay layers with claystone clasts are presentin the lower part of the complex. For a more detailed de-scription of the geologic framework, the structural setting,the nature of the movements and historical records of pastcollapse events see Lollino et al. (2002). The yearly averagerainfall of the area is 1150 mm. The seasonal rainfalls show apeak in Autumn: the months of October and November dis-play the maximum of the monthly average rainfall (154 mmand 153 mm, respectively). The minimum monthly averagerainfall belongs to the month of July (58 mm).
An Automatic Inclinometric System (AIS) was installedon the landslide in 2000 (Lollino et al., 2002). The AIS isan inclinometer apparatus designed to be operated by remotecontrol (Lollino, 1992). After the repeated and prolongedrainfalls occurred in October and November 2000, the AISmeasured significant movements and allowed to locate a slid-ing surface at a depth of about 13 m at the level of a sandy-silty layer with some clay lenses inside. The largest returnperiod of the October/November 2000 precipitation was thereturn period of the rainfalls of 5 consecutive days and it wasof 3.5 years.
The movements measurements performed through the AISin the period September 2000–March 2001 revealed a good
Published by Copernicus GmbH on behalf of the European Geosciences Union.
180 G. Lollino et al.: Time response of a landslide to meteorological events���������*���0���+��-���)��.���������%�����-�������.#�����)������������-����-����+��)��,�����+��-���
�0��%������������%������#���%������
:�'0��� �� �5���-� %�)� �*� �������� ��� ������� ����������� �� � %���� ���������� .��#6� /�� %������ ����,��
����������� ������� �0�� ��� �����'� �����%� �������6� ��� ������'� �����6� 4�� %���� ����)�6� !�� %���
�������������+��6�<��%��������������
Fig. 1. Sketch map of Montaldo di Cosola landslide. 1) main land-slide body; 2) minor, active, rotational slides due to strong streamerosion; 3) eroding areas; 4) main scarps; 5) main landslide crowns;6) monitored area.
correlation with the rainfalls. In particular it was possible toidentify a time lag of about 9 days between the occurrenceof a rainfall peak and the corresponding peak in the recordedmovements produced by these rainfalls. The existence of acorrelation between rainfalls and slope movements had beenalready qualitatively observed by several authors (Campbell,1975; Govi and Sorzana, 1980; Caine, 1980; Govi et al.,1985; Zezere and Rodriguez, 2002; Barton, 2002). Govi etal. (1985), in particular, found a qualitative-general corre-lation that linked rainfalls and landslide occurrence. Caine(1980), Zezere and Rodriguez (2002) and many other au-thors proposed triggering rainfall thresholds. Using the AISit has been possible to identify, locally, a quantitative andnot only qualitative relationship between rainfalls peaks andslope movements peaks.
The time lag of 9 days was more precisely and objectivelyidentified with a cross correlation analysis. The cross corre-lation function,φyx , that has been used in the analysis was
:�'0���/����5���-�%�)��*��-��%����������������������%������������.�����+��-�������)��3�%������+��-��3�
"-���������%���������������%�,�%���������'����-����+��������0�*��������������������)�-��*���!�%�
)��.�.�#� ���������� +��-� �� ����������� ������ ����'� �� ����)�� ��� )��,��0��#� %��������� �-�� ���� ��� ��
�������%������))����0������'��������)������.#���%���������������������77/������������������/ /��� ��
��%.������-����,����'����*��-��%���0��%�����%����.#�����)�������+��-���)��.���������%����������-�
%���0��%�����%����.#����)������������%������ �55�������77<6��0������**��77!����������������+���-�
)����.����#� �*� �� )���������#� ��*������ �0%.��� �*� ������'� )������ +��-� ��%���� ������0�0�� ��������'
��)�.��������� "-�� ���� ��� �0�� .#� �� �������� 0���� %����)��������� ���� ����+�� ��,����� �0��%����
%���0��%�����+-��-�+�0���.�������2)����,���*�%����.#�����)��������"-����%)���������*��-���������
����%�����-������������������.��*�0����������������������/ /�
��� ���� ������������ ������������������������ �
���������#�%�������������-��������0�������������������������������#�����*��-�����)����%��������
��%��'�*��%��-�����������-������*���������������0���'� �-����%����%�������,���+���)��*��%���*��� �-�
)��������)��%.���/ �G� ���-�/ ��"-�������#������,�������-�������%����'��*�7���#���2������.��+���
�-������*����)��5�������-��������)�����'�)��5������-�����������%�,�%�����
:0��-����.���,��������*� �-����%�� �#)��+�������������0�� *��� �-��)������ �#�/ /�G� �#�/ 4
+��-� �-�� )0�)���� �*� ,���*#��'� �-�� ���0���� )��,��0��#�%��������� �,��� �� ���'��� )������ �*� ��%����0���'
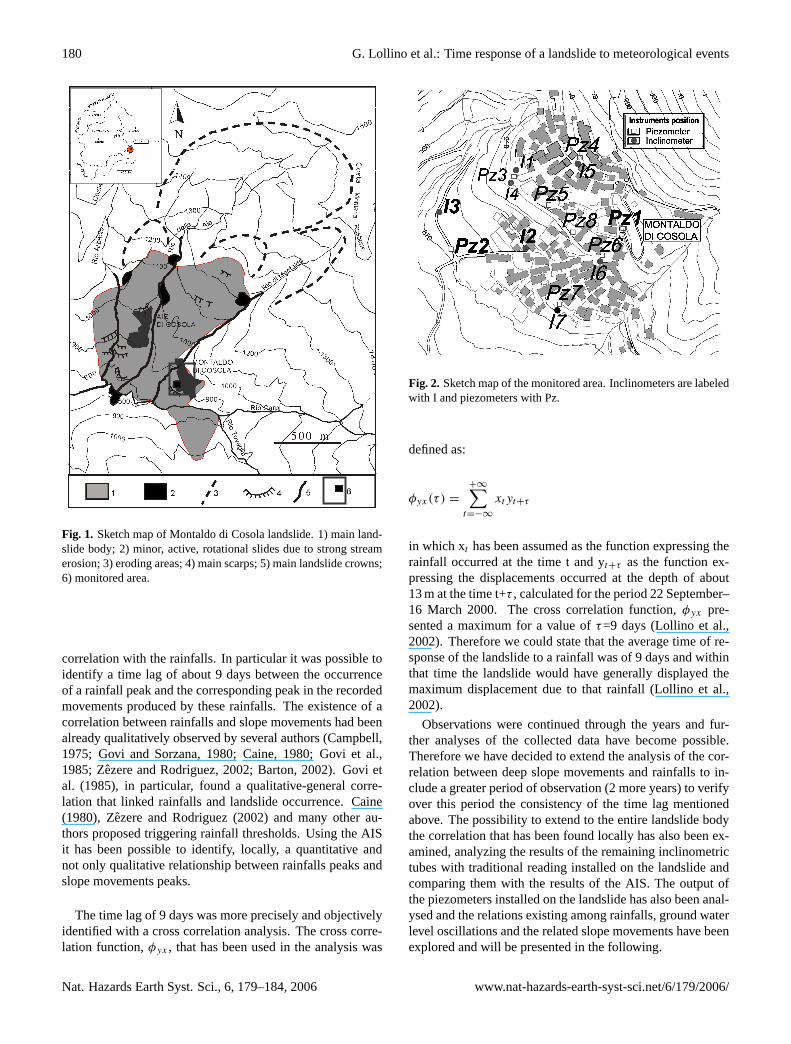
Fig. 2. Sketch map of the monitored area. Inclinometers are labeledwith I and piezometers with Pz.
defined as:
φyx(τ ) =
+∞∑t=−∞
xtyt+τ
in which xt has been assumed as the function expressing therainfall occurred at the time t and yt+τ as the function ex-pressing the displacements occurred at the depth of about13 m at the time t+τ , calculated for the period 22 September–16 March 2000. The cross correlation function,φyx pre-sented a maximum for a value ofτ=9 days (Lollino et al.,2002). Therefore we could state that the average time of re-sponse of the landslide to a rainfall was of 9 days and withinthat time the landslide would have generally displayed themaximum displacement due to that rainfall (Lollino et al.,2002).
Observations were continued through the years and fur-ther analyses of the collected data have become possible.Therefore we have decided to extend the analysis of the cor-relation between deep slope movements and rainfalls to in-clude a greater period of observation (2 more years) to verifyover this period the consistency of the time lag mentionedabove. The possibility to extend to the entire landslide bodythe correlation that has been found locally has also been ex-amined, analyzing the results of the remaining inclinometrictubes with traditional reading installed on the landslide andcomparing them with the results of the AIS. The output ofthe piezometers installed on the landslide has also been anal-ysed and the relations existing among rainfalls, ground waterlevel oscillations and the related slope movements have beenexplored and will be presented in the following.
Nat. Hazards Earth Syst. Sci., 6, 179–184, 2006 www.nat-hazards-earth-syst-sci.net/6/179/2006/

G. Lollino et al.: Time response of a landslide to meteorological events 181
2 Monitoring installations
The monitoring activities, so far, have been concentratedonly on one sector of the landslide (Fig. 1). This sector isclose to the hamlet of Montaldo di Cosola and was chosen toprovide the citizens with direct information regarding theirvillage and the possible effects of the landslide movementson their houses. The monitoring network consists of fivepiezometers and six inclinometric tubes, four of which in-tended for use with a probe inclinometer handled by an op-erator and the other two provided with an Automated Incli-nometer System (AIS).
The inclinometers detected movements along a shallow lo-cal surface, located at a depth of 13.5 m, probably connectedwith a rotational slide along a scarp. As previously men-tioned the AIS is an inclinometer apparatus designed to op-erate by remote control (Lollino, 1992; Lollino et al., 2002).It combines the advantages of the measurements made byan operator with a probe inclinometer and the measurementsmade by in-place inclinometers (Mikkelsen, 1996; Dunni-cliff, 1995), since it allows the possibility of a practically infi-nite number of reading points with almost continuous record-ing capabilities. The AIS is run by a central unit micro-processor and allows several automatic measurements whichwould be too expensive if made by an operator. The compo-sition of the AIS and its main characteristics can be found inLollino et al., 2002.
3 Correlation between slope deep movements and rain-falls
As already mentioned in the introduction, a cross-correlationanalysis of the displacement data coming from the AIS andthe rainfalls recorded during the same time interval was per-formed for the period September 2000–March 2001. Thisanalysis revealed that a time lag of 9 days existed between therainfall peaks and the corresponding peaks in the recordedmovements.
Further observations of the same type were carried out forthe period May 2002–May 2004 with the purpose of veri-fying the results previously mentioned over a larger periodof time. During such a period the landslide displacementswere recorded through the AIS and also the rainfalls werecollected. A comparison between the recorded rainfalls andthe displacements occurred at the depth of about 13 m for theperiod May 2002–May 2004 is shown in Fig. 3.
By analyzing the data shown in this latter figure it is possi-ble to notice that some correlation exists between rainfallsand movements, as it had been observed already for theperiod September 2000–March 2001. This occurrence hadbeen already observed by several other authors in other sites.Thanks to the AIS that performs daily measurements, it hasbeen possible to recognize that the most significant move-ments occur with a certain delay after the rainfalls. In partic-
�0�-���)������ �-�� �������������)����%�����+���� ��������� �-��0'-� �-��������������� �-�� ����*�����+���
���������������%)�������.��+�����-���������������*����������-�����)����%��������0���������-����)�-��*
�.�0����%������*����-��)������ �#�/ /�G� �#�/ 4�����-�+�����:�'0�����
:�'0�����G���%)�������.��+��������#�����*�������������#����)����%���������-����)�-��*���!�%��0���'
�-�� )������ �#� / /� G� �#� / 4�� "-�� +-���� ����+�� )����� �0�� �-�� %���� ��'��*�����
���)����%������-���+����)��������.#���'��*����������*����)��5��.���5�����+���
C#�����#3��'� �-��������-�+�� ��� �-��� ������� *�'0��� ��� ���)����.��� ���������� �-��� ��%�������������
�2�����.��+��������*���������%�,�%������������-���.�����.���,���������#�*����-��)��������)��%.���/
G� ���-� / �� "-��� ���0������� -��� .���� ������#� �.���,��� .#� ��,����� ��-��� �0�-���� ��� ��-��� ������
"-��5�� ��� �-�������-���)��*��%������#�%���0��%������ ���-���.����)����.��� �������'��3�� �-��� �-��%���
��'��*������%�,�%��������0��+��-���������������#��*���� �-������*������ ���)�����0��������,������ ��%�� ��'
�2�����.��+�����-�����0��������*��-��%������'��*����������*����)��5�������-��������)�����'�)��5������-�
���������%�,�%������I�+�,�����-���%�0����*��-�����%����'�������������#������%%�������#�������*��.��
*��%� �-�� '��)-� �*� :�'0��� ��� "-�� 0��� �*� ������������������ *����������� ���� %�5��� %���� �.E����,�� ���
������*�������� �������� ������,���� 77<��� "-0�� �� ������������������ ����#���� �*� �-�� ��������� ����� -��
.����)��*��%������������*#�%�����.E����,��#��-����%����'�������������,���*#��-������������#��*��-����%�
��'�*�0���*����-��)������/ ���/ ��"-������#����+���)��*��%���*����+��'��-����%������������2)����
����-��������0������
Fig. 3. Comparison between daily rainfalls and daily displacementsat the depth of 13.5 m during the period May 2002–May 2004. Thewhite arrows point out the most significant displacements that werepreceded by significant rainfall peaks (black arrows).
ular an evident time lag exists between the occurrence of themost significant rainfall peaks and the corresponding peaksin the recorded movements. However, the amount of thistime lag is not easily and immediately identifiable from thegraph of Fig. 3. The use of cross-correlation facilitates andmakes more objective its identification (Stearns and David,1996). Thus a cross-correlation analysis of the recorded datahas been performed to identify more objectively the time lagand also to verify the consistency of the time lag found forthe period 2000–2001. The analysis was performed follow-ing the same criteria exposed in the introduction.
It must be noticed, however, that some lack of data ispresent in the records shown in Fig. 3, as it will appear fromthe data of Fig. 5 regarding the AIS measurements.
The cross correlation analysis revealed that the time lagbetween the rainfall peaks and the corresponding peaks in therecorded movements for the period May 2002–May 2004 isof 8 days. Even though Fig. 3 shows that not all the rainfallspeaks are necessarily followed by a peak of displacement,nevertheless several of the most significant rainfall peaks are.These latter are shown with the arrows in Fig. 3. Even thoughthe observation period is quite short, another evidence thatseems observable is that the rainfalls that produce significantdisplacement after 8 days occur in Autumn, which is, as men-tioned, the most rainy season of the year. Similar rainfalls oc-curred during other periods, particularly in Summer, do notseem to produce significant displacements that occur after apredictable delay. For the Summer season this is probablydue to the higher evapotranspiration rate that diminishes thesoil moisture.
The largest rainfall peak of the period May 2002–May2004 (135.4 mm) occurred in November, in particular on26 November 2002, exactly like it happened for the datarecorded in 2000–2001, when the largest rainfall peak oc-curred on 6 November 2000. For a comparison with the2000 precipitation we have calculated the return period of
www.nat-hazards-earth-syst-sci.net/6/179/2006/ Nat. Hazards Earth Syst. Sci., 6, 179–184, 2006

182 G. Lollino et al.: Time response of a landslide to meteorological events
:�'0���4�G����0����'����)����%�����������0������������-�)������*��-��.���-����+-�����-������������������
�0���'��-��)������ �#�/ /�G� �#�/ 4�
��� ���� ������������� ��� �������������������
��� )��,��0��#� %��������� ���� �-�+�� ��� :�'0��� /�� ��,����� ��-��� �������%������ �0.��� +��-
������������ ������'� -�,�� .���� ���������� ��� �-�� ���������� .��#�� "-�� ���0���� �*� �-�� %���0��%����
)��*��%��� ��� �-���� �0.��� +���� ��%)����� +��-� �-�� ����� ��%��'� *��%� �-�� ����� ��� :�'0��� !� �-�
��%)�����������-�+��
"-�����0������%��'�*��%��-����-����������%�������))�������.����-������+��-��-�����*������"-�
�������%����� ��.����� �<� �-�+�� )���������#� �-�� ��%�� %�,�%����� ��������� .#� �-�� ����� ��� *��� ��� �-�
%���0��%�����)��*��%�������-����%����#�����������������"-����������%�������������������747�<�%�������
����'��-����%�������+-�����-������7!?�/�%��������� ������������"-���������%�������������������7��%
���������+-��-��������������+����)���-�������������%���������)����%������.0���-���������*��-�������������
�-����%���*� �-��)��,��0�� �������%����������*� �-������� �������%����� ��������������7�<�7�%���������-��
������������%�������0%.����*�%���0��%����&��-�������������%������.0���-�+��'����������)����%�����
"-�������0�����-�+���0��*��%�.�-�,�����*��-��������������������"-����-�0�������+�������0%���-��
�-��*�����'��)��*��%�����������'���)������-��0'-��-����������.���2�����������-�������������������.��#�
Fig. 4. Resulting displacement as calculated at each point of theborehole where the AIS is installed during the period May 2002–May 2004.
the November 2002 rainfalls of 5 consecutive days and thiswas found to be of 15 years. The 26 November 2002 rain-fall peak was followed by a peak in movements (equal to1.2 mm/day) 8 days later, that is after a time lag equal to thatfound through cross correlation.
The effect of the cumulated rainfalls preceding the rain-fall peaks producing displacements was also examined. Thecross correlation analysis was repeated after having at-tributed a weight, given by the total amount of rainfalls ofthe 15 preceding days, to each daily rainfall producing a peakof displacements. No relevant effect was identified and theoutput of the cross-correlation analysis was the same as be-fore. The rainfalls that precede a rainfall peak that producesa landslide displacement do not seem to have any particulareffect on the time lag between rainfalls and displacements.However, it can be noticed that both for the displacementsoccurred in Autumn 2002 and in Autumn 2003 the rainfallsthat produced them were preceded by several rainy days. Aspreviously mentioned this is a common occurrence: Octoberand November are the most rainy months of the year and thisis an evident cause of the greater landslide displacements thatoccur in that period. It is also possible to find in the graph mi-nor displacements that were not preceded by any significantrainfall.
The time lag found has to be considered as a “warningtime” for this particular landslide. It means that after a sig-
"-�����������������������-0���2)����������-�+���)��5��*����)����%����+-���?�7���#��-�,�����)�����*���
����'��*����������*����)��5�
:�'0���!�G����)����%�����%���0�����-��0'-��-���������%�����������<���������0���'��-��)������ �#�/ /
G� �#�/ 4���%)�����+��-��-��%���0��%�����)��*��%����-��0'-��-�������0���'��-����%�
)������
�� !���������� ��� ���� ����
���:�'0���<���-��'��0���+�������,�������������������%���0����.#�)��3�%�������L�/�������������
�-�+������:�'0������-��'��0���+�������,�������������������%���0����.#�)��3�%������L���������%)����
+��-��-������*�����
"-���-����)��3�%���������)���������%)������0��#�����-������*�����)��3�%�����/�-������))������
��������'�����=���.���/ �����,����-�0'-��-���%�0�����*��-���������������������**������.���0����*��-���
��**����������������
"-�� ���)������*� �-��'��0���+����� ��,��� ��� �-�� ����*����� �))����� ���.��,��#� ��)���� ��� ��� ����.�
�.���,������:�'0�����
���)��,��0��#�%��������������%����'��*�?�7���#�� ��5���)�������,����-�0'-��-�����)������*� �-�
'��0���+�������,�������-������*�������������)����.���0����*��-��)���������*�������������#�����-����,����*��-�
������'� �0�*���� �������� ��%� .���+� �-�� '��0��� ��,���� "-�� ,��#� ��+� )��%��.����#� �*� �-����%��������
��10������,������#���,�������#��.�*��������,����*����0��������������-����-�������+���-������)������*��-�
%�,�%�����
Fig. 5. Displacements measured through the inclinometers I3, I6and I7 during the period May 2002–May 2004 compared with themeasurements performed through the AIS during the same period.
nificant rainfall has taken place, particularly in Autumn, apeak in landslide movements has to be expected around 8–9days later. As a consequence, fissures in houses, for instance,have to be expected to show their maximum enlargement 8–9days after a significant rainfall peak. The population mightbe warned accordingly.
There is a precise reason for the time lag that has beenfound. As we will see in a following chapter, the water tablefluctuations in response to a certain rainfall are almost im-mediate and thus an almost immediate response of the land-slide should be expected. However, as mentioned earlier, theAIS allowed to locate the sliding surface at a depth of about13 m at the level of a sandy-silty layer with some clay lensesinside. The existence and the location of this sliding surfacewas confirmed by the further measurements performed in theperiod 2002–2004 (Fig. 4). The presence of silt and clay onthe sliding surface explains the time lag, since the low per-meability of these materials requires some time for them toreach a level of saturation that allows the movements to start.Therefore each landslide has to be thoroughly investigated inorder to use this method for predicting displacement peaks.Each landslide might react differently, according to its par-ticular geological and stratigraphical conditions.
4 Results of traditional inclinometric measurements
As previously mentioned and shown in Fig. 2, several otherinclinometric tubes with traditional reading have been in-stalled on the landslide body. The results of the measure-ments performed in these tubes were compared with the datacoming from the AIS. In Fig. 5 the comparison is shown.
The results coming from the other inclinometers appearto be coherent with those of AIS. The inclinometer labeledI6 shows practically the same movements recorded by theAIS, as far as the measurements performed in the same days
Nat. Hazards Earth Syst. Sci., 6, 179–184, 2006 www.nat-hazards-earth-syst-sci.net/6/179/2006/

G. Lollino et al.: Time response of a landslide to meteorological events 183
:�'0���<�������0���+�������,�������������������%���0����.#�)��3�%�������L�/�����������0���'��-��)�����
�#�/ /�G� �#�/ 4�
:�'0����������0���+�������,�������������������%���0����.#�)��3�%�������L�����%)�����+��-��-������*����
����������0���'��-��)������ �#�/ /�G� �#�/ 4�
Fig. 6. Ground water level oscillations as measured by piezometersno. 2, 3 and 7 during the period May 2002–May 2004.
are concerned. This inclinometer is located at 949.6 m a.s.l.along the same road where the AIS (958.2 m a.s.l.) is lo-cated. The inclinometer I3 (located at 917 m a.s.l.), which islocated downslope, has recorded smaller displacements butthe trend of these latter is the same of the previous inclinome-ter and of the AIS. Inclinometer I7 (located at 936.9 m a.s.l.)has recorded a smaller number of measurements: the trend issimilar, but shows greater displacements.
These results show a uniform behavior of the entire land-slide. This should allow to assume that the findings per-formed at a single point through the AIS can be extendedto the entire landslide body. The entire landslide is thus ex-pected to show a peak of displacement when 8–9 days haveelapsed after a significant rainfall peak.
5 Ground water level oscillations
In Fig. 6 the ground water level oscillations as measured bypiezometers no. 2, 3 and 7 are shown. In Fig. 7 the groundwater level oscillations as measured by piezometer no. 3 arecompared with the rainfalls.
The three piezometers respond contemporaneously to therainfalls (piezometer 2 has stopped its recordings on Octo-ber 2003), even though the amounts of the oscillations aredifferent because of their different locations.
The response of the ground water level to the rainfalls ap-pears to be very rapid, as it can be observed in Fig. 7.
As previously mentioned, a time lag of 8–9 days takesplace between rainfall peaks and displacement peaks, eventhough the response of the ground water level to the rainfallsis so rapid, because of the presence of silt and clay at thelevel of the sliding surface located 13 m below the groundlevel. The very low permeability of these materials requiresevidently several days before a level of saturation is reachedthat allows the inception of the movements.
:�'0���<�������0���+�������,�������������������%���0����.#�)��3�%�������L�/�����������0���'��-��)�����
�#�/ /�G� �#�/ 4�
:�'0����������0���+�������,�������������������%���0����.#�)��3�%�������L�����%)�����+��-��-������*����
����������0���'��-��)������ �#�/ /�G� �#�/ 4�Fig. 7. Ground water level oscillations as measured by piezometerno. 3 compared with the rainfalls recorded during the period May2002–May 2004.
6 Conclusions
A complex monitoring network has been installed on alandslide located in North-Western Italy, on the ApenninesMountains. An Automatic Inclinometric System (AIS) hasallowed to identify, through a cross correlation analysis, arecurrent time lag of 8–9 days between the occurrence ofsignificant rainfall peaks and the corresponding peaks of thelandslide displacements. Therefore the prediction of a pos-sible moment of crisis of the landslide has become possi-ble: fissures in houses, for instance, have to be expected toshow their maximum enlargement 8–9 days after a signifi-cant rainfall peak and the population might be warned ac-cordingly. Other useful applications and advantages of thesefindings could be certainly found. A great advantage is cer-tainly given by the sense of security and confidence derivingfrom the possibility of predicting when the most importantconsequences of a landslide movement is expected. The timelag will not necessarily remain the same through the years;however, continuing the monitoring activity, it will be possi-ble to identify possible changes. As far as warning purposesare concerned, the AIS would need to be maintained in placecontinuously and its data to be systematically processed byexperts in order to maintain its workability up-to-date. Eachlandslide has to be thoroughly investigated in order to usethis method for predicting displacement peaks. Each land-slide might in fact react differently, according to its particulargeological and stratigraphical conditions.
The AIS was already known as a tool to design morereliable warning systems since it allows to schedule themeasurement recurrences, to increase the reading levels andtheir precision and to measure speed and acceleration of thepossible movements (Lollino, 1992; Lollino et al., 2002).The experience described in this paper has shown that if acorrespondence between rainfall peaks and displacementsat the depth of the sliding surface exists, the prediction of apossible moment of crisis for an active landslide could bealso possible some time in advance, with the use of the AIS.
www.nat-hazards-earth-syst-sci.net/6/179/2006/ Nat. Hazards Earth Syst. Sci., 6, 179–184, 2006

184 G. Lollino et al.: Time response of a landslide to meteorological events
This has certainly further increased the performance of theAIS as a warning system besides its use as a monitoringdevice.
Edited by: L. MarchiReviewed by: A. Pasuto and M. Mikos
References
Barton, M. E.: Early warning of landsliding using weather stationdata, Instability – Planning and Management, Thomas Telford,London, 455–462, 2002.
Caine, N.: The rainfall intensity-duration control of shallow land-slides and debris flows, Geografiska Annaler, 62A, 1–2, 23–27,1980.
Campbell, R. H.: Soil slip, debris flows and rainstorms in the SantaMonica Mountains and Vicinity, Southern California, U.S. Geo-logical Survey Professional Paper, 851, 1975.
Dunnicliff, J.: Geotechnical Instrumentation for Monitoring FieldPerformance, John Wiley & Sons, New York, 1988.
Dunnicliff, J.: Monitoring and instrumentation of landslides, Pro-ceedings of the 6th International Symposium on Landslides,Christchurch, New Zealand, 10–14 February 1992, A. A.Balkema, Rotterdam, 1881–1895, 1995.
Govi, M., Mortara, G., and Sorzana, P. F.: Eventi idrologici e frane,Geologia Applicata ed Idrogeologia, XX, Part II, 359–375, 1985.
Govi, M. and Sorzana, P. F.: Landslide Susceptibility as a func-tion of critical rainfall amount in Piedmont basin (North WesternItaly), Studia Geomorphologica Carpatho-Balcanica, 14, 43–61,1980.
Lollino, G.: Automated Inclinometric system, Proceedings of the6th International Symposium on Landslides, Christchurch, NewZealand, 10–14 February 1992, A. A. Balkema, Rotterdam,1147–1150, 1992.
Lollino, G., Arattano, M., and Cuccureddu, M.: The use of the Au-tomatic Inclinometric System (AIS) for landslide early warning:the case of Cabella Ligure (North -Western Italy), Phys. Chem.Earth, 27, 36, Elsevier Science Ltd., 1545–1550, 2002.
Mikkelsen, P. E.: Field instrumentation, in: Landslides, investiga-tion and mitigation, edited by: Turner, A. K. and Schuster, R.L., Transportation Research Board National Research Council,National Special report 247, Academy Press, Washington D.C.,278–316, 1996.
Stearns, S. D. and David, R. A.: Signal processing algorithms inMatlab, Prentice Hall P. T. R., Upper Saddle River, New Jersey,1996.
Zezere, J. L. and Rodriguez, M. L.: Rainfall thresholds for lands-liding in Lisbon Area (Portugal), Landslides, Proceedings of theFirst European conference on Landslides, Prague, Czech Repub-lic, 24–26 June, A. A. Balkema, 333–338, 2002.
Nat. Hazards Earth Syst. Sci., 6, 179–184, 2006 www.nat-hazards-earth-syst-sci.net/6/179/2006/
Copyright © 2022 FDOKUMEN