Time fluctuations of the phase modulation in a liquid crystal on silicon display: characterization...
12
Time fluctuations of the phase modulation in a liquid crystal on silicon display: characterization and effects in diffractive optics A. Lizana 1 , I. Moreno 2 , A. Márquez 3 , C. Iemmi 4 , E. Fernández 2 , J. Campos 1 and M. J. Yzuel 1 1 Departamento de Física, Universidad Autónoma de Barcelona, 08193 Bellaterra, Spain 2 Dept. de Ciencia de Materiales, Óptica y Tecnología Electrónica, Universidad Miguel Hernández, Elche, Spain 3 Dept. de Física, Ingeniería de Sistemas y Teoría de la Señal, Universidad de Alicante, Ap. 99, 03080 Alicante, Spain 4 Dept. de Física, Fac. de Ciencias Exactas y Naturales, Universidad de Buenos Aires, 1428 Buenos Aires, Argentina *Corresponding author: [email protected] Abstract: In this paper we provide evidence of the temporal fluctuations of the phase modulation property of a liquid crystal on silicon (LCoS) display, and we analyze its effect when the device is used for displaying a diffractive optical element. We use a commercial twisted nematic LCoS display configured to produce a phase-only modulation, and we provide time resolved measurements of the diffraction efficiency that show rapid fluctuations of the phase modulation, in the millisecond order. We analyze how these fluctuations have to be considered in two typical methods for the characterization of the phase modulation: two beam interference and diffraction from a binary grating. We finally provide experimental results on the use of this device for displaying a computer generated hologram. A reduction of the modulation diffraction efficiency results from the phase modulation fluctuation. ©2008 Optical Society of America OCIS codes: (120.2040) Displays; (230.3720) Liquid-crystal devices; (230.6120) Spatial light modulators, (050.5080) Phase shift. References and links 1. J. Turunen and F. Wyrowski, eds., Diffractive Optics for Industrial and Commercial Applications, (Akademie Verlag, Berlin, 1997). 2. H. J. Coufal, D. Psaltis and B. T. Sincerbox, Eds., Holographic Data Storage, (Springer-Verlag, Berlin, 2000). 3. W. Osten, C. Kohler, and J. Liesener, “Evaluation and application of spatial light modulators for optical metrology,” Opt. Pura Apl. 38, 71-81 (2005). 4. S. T. Wu and D. K. Yang, Reflective Liquid Crystal Displays, (John Wiley & Sons Inc., Chichester, 2005). 5. J. E. Wolfe and R. A. Chipman, “Polarimetric characterization of liquid-crystal-on-silicon panels,” Appl. Opt. 45, 1688-1703 (2006). 6. A. Márquez, I. Moreno, C. Iemmi, A. Lizana, J. Campos and M. J. Yzuel, “Mueller-Stokes characterization and optimization of a liquid crystal on silicon display showing depolarization,” Opt. Express 16, 1669-1685 (2008). 7. P. Clemente, V. Durán, Ll. Martínez-León, V. Climent, E. Tajahuerce, and J. Lancis, “Use of polar decomposition of Mueller matrices for optimizing the phase response of a liquid-crystal-on-silicon display,” Opt. Express 16, 1965-1974 (2008). 8. A. Lizana, A. Márquez, I. Moreno, C. Iemmi, J. Campos and M. J. Yzuel, “Wavelength dependence of polarimetric and phase-shift characterization of a liquid crystal on silicon display,” J. Eur. Opt. Soc. – Rapid Pub. 3, 08011 1-6 (2008). 9. A. Lizana, I. Moreno, C. Iemmi, A. Márquez, J. Campos and M. J. Yzuel, “Time-resolved Mueller matrix analysis of a liquid crystal on silicon display,” Appl. Opt. 47, 4267-4274 (2008). 10. I. Moreno, C. Iemmi, A. Márquez, J. Campos and M. J. Yzuel, “Modulation light efficiency of diffractive lenses displayed onto a restricted phase-mostly modulation display,” Appl. Opt. 43, 6278-6284 (2004). 11. K. Lu and B. E. A. Saleh, “Theory and design of the liquid crystal TV as an optical spatial phase modulator,” Opt. Eng. 29, 240-246 (1990). #99537 - $15.00 USD Received 30 Jul 2008; revised 26 Sep 2008; accepted 29 Sep 2008; published 6 Oct 2008 (C) 2008 OSA 13 October 2008 / Vol. 16, No. 21 / OPTICS EXPRESS 16711
Transcript of Time fluctuations of the phase modulation in a liquid crystal on silicon display: characterization...
Time fluctuations of the phase modulation in a liquid crystal on silicon display: characterization
and effects in diffractive optics A. Lizana1, I. Moreno2, A. Márquez3, C. Iemmi4, E. Fernández2, J. Campos1 and
M. J. Yzuel1 1Departamento de Física, Universidad Autónoma de Barcelona, 08193 Bellaterra, Spain
2Dept. de Ciencia de Materiales, Óptica y Tecnología Electrónica, Universidad Miguel Hernández, Elche, Spain 3Dept. de Física, Ingeniería de Sistemas y Teoría de la Señal, Universidad de Alicante, Ap. 99, 03080 Alicante, Spain 4Dept. de Física, Fac. de Ciencias Exactas y Naturales, Universidad de Buenos Aires, 1428 Buenos Aires, Argentina
*Corresponding author: [email protected]
Abstract: In this paper we provide evidence of the temporal fluctuations of the phase modulation property of a liquid crystal on silicon (LCoS) display, and we analyze its effect when the device is used for displaying a diffractive optical element. We use a commercial twisted nematic LCoS display configured to produce a phase-only modulation, and we provide time resolved measurements of the diffraction efficiency that show rapid fluctuations of the phase modulation, in the millisecond order. We analyze how these fluctuations have to be considered in two typical methods for the characterization of the phase modulation: two beam interference and diffraction from a binary grating. We finally provide experimental results on the use of this device for displaying a computer generated hologram. A reduction of the modulation diffraction efficiency results from the phase modulation fluctuation.
©2008 Optical Society of America
OCIS codes: (120.2040) Displays; (230.3720) Liquid-crystal devices; (230.6120) Spatial light modulators, (050.5080) Phase shift.
References and links
1. J. Turunen and F. Wyrowski, eds., Diffractive Optics for Industrial and Commercial Applications, (Akademie Verlag, Berlin, 1997).
2. H. J. Coufal, D. Psaltis and B. T. Sincerbox, Eds., Holographic Data Storage, (Springer-Verlag, Berlin, 2000).
3. W. Osten, C. Kohler, and J. Liesener, “Evaluation and application of spatial light modulators for optical metrology,” Opt. Pura Apl. 38, 71-81 (2005).
4. S. T. Wu and D. K. Yang, Reflective Liquid Crystal Displays, (John Wiley & Sons Inc., Chichester, 2005). 5. J. E. Wolfe and R. A. Chipman, “Polarimetric characterization of liquid-crystal-on-silicon panels,” Appl.
Opt. 45, 1688-1703 (2006). 6. A. Márquez, I. Moreno, C. Iemmi, A. Lizana, J. Campos and M. J. Yzuel, “Mueller-Stokes characterization
and optimization of a liquid crystal on silicon display showing depolarization,” Opt. Express 16, 1669-1685 (2008).
7. P. Clemente, V. Durán, Ll. Martínez-León, V. Climent, E. Tajahuerce, and J. Lancis, “Use of polar decomposition of Mueller matrices for optimizing the phase response of a liquid-crystal-on-silicon display,” Opt. Express 16, 1965-1974 (2008).
8. A. Lizana, A. Márquez, I. Moreno, C. Iemmi, J. Campos and M. J. Yzuel, “Wavelength dependence of polarimetric and phase-shift characterization of a liquid crystal on silicon display,” J. Eur. Opt. Soc. – Rapid Pub. 3, 08011 1-6 (2008).
9. A. Lizana, I. Moreno, C. Iemmi, A. Márquez, J. Campos and M. J. Yzuel, “Time-resolved Mueller matrix analysis of a liquid crystal on silicon display,” Appl. Opt. 47, 4267-4274 (2008).
10. I. Moreno, C. Iemmi, A. Márquez, J. Campos and M. J. Yzuel, “Modulation light efficiency of diffractive lenses displayed onto a restricted phase-mostly modulation display,” Appl. Opt. 43, 6278-6284 (2004).
11. K. Lu and B. E. A. Saleh, “Theory and design of the liquid crystal TV as an optical spatial phase modulator,” Opt. Eng. 29, 240-246 (1990).
#99537 - $15.00 USD Received 30 Jul 2008; revised 26 Sep 2008; accepted 29 Sep 2008; published 6 Oct 2008
(C) 2008 OSA 13 October 2008 / Vol. 16, No. 21 / OPTICS EXPRESS 16711

12. J. L. Pezzanitti and R. A. Chipman, “Phase-only modulation of a twisted nematic liquid-crystal TV by use of the eigenpolarization states,” Opt. Lett. 18, 1567-1569 (1993).
13. J. A. Davis, I. Moreno and T. Tsai, “Polarization eigenstates for twisted-nematic liquid-crystal displays,” Appl. Opt. 37, 937-945 (1998).
14. A. Márquez, C. Iemmi, I. Moreno, J. A. Davis, J. Campos and M. J. Yzuel, “Quantitative prediction of the modulation behavior of twisted nematic liquid crystal displays based on a simple physical model,” Opt. Eng. 40, 2558-2564 (2001).
15. H. T. Dai, K. S. Xu, Y. J. Liu, X. Wang and J. Liu, “Characteristics of LCoS phase-only spatial light modulator and its applications,” Opt. Commun. 238, 269-276 (2004).
16. Y. Lee, J. Gourlay, W. J. Hossack, I. Underwood and A. J. Walton, “Multi-phase modulation for nematic liquid crystal on silicon backplane spatial light modulators using pulse-width modulation driving scheme,” Opt. Commun. 236, 313-322 (2004).
17. W. J. Hossak, E. Theofanidou, J. Crain, K. Heggarty, M. Birch, “High-speed holographic optical tweezers using a ferroelectric liquid crystal microdisplay,” Opt. Express 11, 2053-2059 (2003).
18. M. S. Millán, J. Otón and E. Pérez-Cabré, “Chromatic compensation of programmable Fresnel lenses,” Opt. Express 14, 6226-6243 (2006).
19. I. Moreno, A. Lizana, J. Campos, A. Márquez, C. Iemmi and M. J. Yzuel, “Combined Mueller and Jones matrix method for the evaluation of the complex modulation in a liquid-crystal-on-silicon display,” Opt. Lett. 33, 627-629 (2008).
20. A. Hermerschmidt, S. Osten, S. Krüger and Thomas Blümel, "Wave front generation using a phase-only modulating liquid-crystalbased micro-display with HDTV resolution," Proc. SPIE 6584, 65840E (2007).
21. J. R. Moore, N. Collings, W. A. Crossland, A. B. Davey, M. Evans, A. M. Jeziorska, M. Komarčević, R. J. Parker, T. D. Wilkinson and H. Xu, “The silicon backplane design for an LCOS polarization-insensitive phase hologram SLM”, IEEE Photon. Techol. Lett. 20, 60-62 (2008).
22. S. Serati and J. Harriman, “Spatial light modulator considerations for beam control in optical manipulation applications,” Proc. SPIE 6326, 63262W1-11 (2006).
23. S.-Y. Lu and R. A. Chipman, “Interpretation of Mueller matrices based on polar decomposition,” J. Opt. Soc. Am. A 13, 1106-1113 (1996).
24. I. Moreno, P. Velásquez, C. R. Fernández-Pousa, M. M. Sánchez-López and F. Mateos, “Jones matrix method for predicting and optimizing the optical modulation properties of a liquid-crystal display,” J. Appl. Phys. 94, 3697-3702 (2003).
25. C. Soutar, S. E. Monroe Jr. and J. Knopp “Measurement of the transmittance of the Epson liquid crystal television,” Opt. Eng. 33, 1061-1069 (1994).
26. A. Bergeron, J. Gauvin, F. Gagnon, D. Gingras, H. H. Arsenault and M. Doucet, “Phase calibration and applications of a liquid crystal spatial light modulator,” Appl. Opt. 34, 5133-5139 (1995).
27. Z. Zhang, G. Lu and F. T. S. Yu “Simple method for measuring phase modulation in liquid crystal television,” Opt. Eng. 33, 3018-3022 (1994).
28. D. Engström, G. Milewski, J. Bengtsson and S. Galt, “Diffraction-based determination of the phase modulation for general spatial light modulators,” Appl. Opt. 45, 7195-7204 (2006).
29. A. Márquez, C. Iemmi, J. Campos, J. C. Escalera and M. J. Yzuel, “Programmable apodizer to compensate chromatic aberrations effects using a liquid crystal spatial light modulator,” Opt. Express 13, 716-730(2005).
30. R. Tudela, E. Martín-Badosa, I. Labastida, S. Vallmitjana, I. Juvells and A. Carnicer, “Full complex Fresnel holograms displayed on liquid crystal devices,” J. Opt. A: Pure Appl. Opt. 5, S189-S194 (2003).
1. Introduction
Liquid crystal (LC) microdisplays have found a widespread range of applications in different areas like diffractive optics [1], optical storage [2], or optical metrology [3]. Liquid crystal on silicon (LCoS) displays have become the most attractive microdisplays for these applications due to their very high spatial resolution and very high light efficiency [4]. However, several authors [5-9] have detected that LCoS displays produce certain amount of depolarization. We have recently demonstrated [8,9] that this depolarization effect is caused by temporal fluctuations of the state of polarization (SOP) of the reflected beam, originated by fluctuations of the LC molecular orientation as a function of time. These fluctuations are produced in time intervals smaller than the LCoS frame period and they are due to the way the electrical signal is addressed to the LCoS display.
For the above mentioned applications, it is very desirable to achieve a phase-only modulation regime, where a linear phase modulation up to 2π is produced versus the addressed gray level, without coupled depolarization or coupled amplitude modulation. This modulation regime maximizes the modulation diffraction efficiency [10]. Many works have demonstrated in the past the usefulness of liquid crystal displays to act as phase-only spatial light modulators [11-14]. LCoS devices have also been employed as phase-only displays
#99537 - $15.00 USD Received 30 Jul 2008; revised 26 Sep 2008; accepted 29 Sep 2008; published 6 Oct 2008
(C) 2008 OSA 13 October 2008 / Vol. 16, No. 21 / OPTICS EXPRESS 16712
[15,16]. Usually, all these works consider that the phase-only diffractive screen is a static mask. Some other works change the diffractive screen by means of different images encoded onto different frames of the video signal [17,18]. In general, the phase modulation properties of LCDs have been analyzed by means of Jones matrix based methods. However, the above mentioned depolarization effects led to the use of the Mueller-Stokes formalism in the study of LCoS displays [5-7]. We have recently combined both types of analysis to evaluate the depolarization as well as to find polarization configurations that lead to an amplitude-only or to a phase-only modulation [19].
In this work we advance a step forward and we analyze the effects originated from the rapid fluctuations present in LCoS displays when they are operated as phase-only modulators for applications in diffractive optics. First we compare two standard methods used to characterize the phase modulation as a function of the addressed gray level. We will show that a two beam interference method permits to measure the mean phase modulation. Alternatively, we propose using a phase-only diffraction grating method, but taking time-resolved measurements of the intensity of the generated diffraction orders. While the first method (two beam interference) provides the mean phase for building a gray level look-up table, the second method provides a demonstration of the phase modulation time fluctuation within the frame period interval. As an example, we finally report on the application of the LCoS device to display a phase-only computer generated hologram.
The outline of this paper is as follows. In section 2, a theory associated with the fluctuations phase phenomenon is presented. In section 3 the phase modulation measurement by a diffractive method is presented. Time-resolved phase measurements show strong time fluctuations of the phase modulation. In section 4 we use a simple model to analyze the time averaged phase measurements. We show that the use of time averaged intensity measurements leads to wrong results in the measured phase. The problem is overcome by the interference method presented in section 5. With this method the mean value of the temporal fluctuating phase modulation is directly obtained. We compare these mean values with the averaged of the time-resolved phase measurements and we show that they coincide. The effects of the phase fluctuations in the diffraction efficiencies of diffractive optical elements are shown in section 6. Finally, the conclusions are presented in section 7.
2. Phase modulation in LCoS displays
The use of LCDs to display phase-only diffractive elements is based on achieving a phase-only modulation configuration, where the display modifies the phase of the incoming light beam controlled through the addressed gray level. This can be easily achieved in parallel aligned displays by selecting the input beam linearly polarized in the orientation of the LC molelcular director. In twisted nematic displays, phase-only modulation is obtained by using the appropriate elliptical polarization configuration [12-14,19].
In modern LCoS displays, the electrical addressing control results in a temporal fluctuation of the voltage signal applied to each pixel [20,21]. These fluctuations have been reported in phase-only devices like electrically controlled birefringence (ECB) displays, and refreshing rates of kHz have been proposed to minimize its effect [22]. In other types of LCoS displays they result in time fluctuations in the reflected state of polarization (SOP), that depend on the input polarization and on the addressed gray level. These fluctuations results in an effective depolarization effect when the final optical detector averages over time intervals greater than the frame period [8-10]. In this situation, the Mueller-Stokes (M-S) formalism is more suitable to calibrate the polarimetric properties of these devices. However, the LCoS display description by means of the (M-S) formalism is not complete, missing the phase information. In Ref. [19], the polar decomposition [23] of the characterized Mueller matrix for the LCoS was applied. In this sense, the Mueller matrix of the LCoS display is decomposed as the product of three Mueller matrices: a depolarizer, a retarder and a diattenuator. We demonstrated that the diattenuation is negligible, and the retarder component was assigned to an equivalent Jones matrix to evaluate the phase modulation properties.
#99537 - $15.00 USD Received 30 Jul 2008; revised 26 Sep 2008; accepted 29 Sep 2008; published 6 Oct 2008
(C) 2008 OSA 13 October 2008 / Vol. 16, No. 21 / OPTICS EXPRESS 16713

In Ref. [8] time resolved measurements of the Mueller matrices of the LCoS display have shown that the depolarization effect is due to temporal fluctuations in the reflected SOP, but the instant degree of polarization (DoP) is maintained equal to one. Therefore, at every instant of time, the LCoS display can be described by the retardance component of the experimental Mueller matrix, which can be related to the equivalent Jones matrix. Therefore, the LCoS display under time resolved measurements can be regarded as a nonabsorbing polarization device, described with a unitary Jones matrix given [24] by the relation:
( ) ( ) ( )( ) ( )⎟⎟⎠
⎞⎜⎜⎝
⎛
−= β−
tAtBtBtA
e ti**RM , (1)
where β(t) represents the global mean phase shift, and the complex parameters A, B depend on the addressed voltage and fulfil the condition |A(t)|2+|B(t)|2=1. The Jones vector of the reflected beam can be written as follows:
( ) ( ) ( ) ( )( ) ( )
( ) ( )tJeJtAtBtBtA
etJ tiinput
tioutput
′=⎟⎟⎠
⎞⎜⎜⎝
⎛
−= β−β− ·
**, (2)
and
( ) ( ) ( )( ) ( ) ⎟⎟
⎠
⎞⎜⎜⎝
⎛
θθ
⎟⎟⎠
⎞⎜⎜⎝
⎛
−=′
φ sincos
·** ietAtBtBtA
tJ . (3)
The parameters φ and θ totally describe the input SOP, being φ the phase difference between the orthogonal electric field components and θ the azimuth angle. An arbitrary input SOP can be generated by means of a polarization state generator (PSG), composed by a linear polarizer followed by a quarter-wave plate (QWP).
If the reflected SOP output
J is projected onto a polarization state detector (PSD),
composed by a second QWP followed by a linear polarizer, a complex number Z is obtained as:
( ) ( ) ( ) ( ) ( ) ( ) ( ) ( )tzeetzetJPSDetZ titititi ··· δ−β−β−β− ==′= , (4)
where ( ) ( )tJPSDtz ′= . A phase-only configuration is obtained when the modulus |z(t)|
is maintained constant with time and for all different gray levels addressed to the display. Then, the phase modulation Φ can be understood as the addition of two phase contributions:
( ) ( ) ( )ttt δ+β=Φ , (5)
where δ(t) is the argument of z(t). The depolarization effect reported at Ref [6] is a consequence of the temporal variations of the modulus |z(t)|. In polarimetry, it is the intensity |z(t)|2 what is measured for each of the PSD configurations used to obtain the Stokes parameters for the SOP [6]. Thus, a configuration that shows no depolarization effect can still show phase fluctuations, due to the contribution of the phase terms β(t) and δ(t). For instance, in a parallel aligned display, if the illumination beam is linearly polarized parallel to the LC director, the emerging SOP is always linearly polarized, and fluctuations of the LC molecules will not cause depolarization but will cause phase fluctuations.
3. Measurement of the phase fluctuations by a diffractive method
In order to measure the experimental phase modulation provided by LCDs, several well-known measurement techniques have been proposed in the literature [25-28]. Typically, two different types of techniques are used: interferometric methods [25,26] or diffractive methods [27,28]. In this section we will show that the diffractive methods are very adequate to show
#99537 - $15.00 USD Received 30 Jul 2008; revised 26 Sep 2008; accepted 29 Sep 2008; published 6 Oct 2008
(C) 2008 OSA 13 October 2008 / Vol. 16, No. 21 / OPTICS EXPRESS 16714
the evidences of the phase modulation fluctuation, by using an oscilloscope to detect fast changes in the output intensities on the diffraction orders.
We use a LCoS display from Philips, model X97c3A0, sold as the kit LC-R2500 by Holoeye. It is a 2.46 cm diagonal monochrome reflective 45º twisted nematic LCoS display, with XGA resolution (1024 x 768 pixels), and with digital data input and digitally controlled gray scales with 256 gray levels. The pixels are squared with a pixel center to center separation of 19 μm and a fill factor of 93%. The experimental set-up is sketched in Fig. 1. The unexpanded beam of a He-Ne laser (λ=633 nm) impinges onto the LCoS display, with an angle of incidence of 2º. A polarization state generator (PSG) is placed at the incident beam, composed by a linear polarizer (LP1) and a quarter wave plate (QWP1). A half wave plate (HWP0) is introduced in front of the PSG in order to orient the linear polarized light coming from the laser parallel to LP1. On the other hand, at the reflected beam we have placed a polarization state detector (PSD), composed by a quarter wave plate (QWP2) and an analyzer (LP2). We selected a PSG and PSD configuration that yields a phase only modulation with maximum transmittance [6]. This configuration is given in Table inset in Fig. 1, where the origin of the angular orientation for the polarization elements is given with respect to the vertical direction. Two detectors (Newport 1830-C) are placed in a far diffraction plane, which will be used to obtain time-resolved measurements of the zero and first diffraction orders generated by diffraction gratings displayed on the LCoS device. The synchronized detected signals are monitored onto an oscilloscope (Tektronix TDS3012B) and they allow us to study the fluctuations of the intensity.
We first verified that the average intensity response of the LCoS display in this configuration is constant as a function of the gray level. For that purpose, we addressed a constant gray level and measure the intensity at the zero diffraction order. Figure 2(a) shows the average intensity as a function of the addressed gray level, which shows that it is maintained constant at almost perfect 100% transmission in the whole range. The intensity values are normalized to the maximum transmission value. Figure 2(a) also shows the degree of polarization (DoP), which has been measured following the method in [6]. It shows that the depolarization effect is negligible for this configuration, since DoP is equal to one for all values of gray level. This is a logical result since the configuration that yields maximum transmission at the exit must maintain the emerging SOP almost constant over the entire range of gray levels. Otherwise, a coupled intensity modulation would be present. In Fig. 2(b) we show the evolution of the intensity versus time for three gray levels. We can see that there is a certain fluctuation with time of the intensity values, which depends on the addressed gray level. Nevertheless, the average intensity is almost constant as a function of the gray level, as it is shown in Fig. 2(a). We note that for gray level GL=0 the detected intensity signal is constant, denoting that there is not fluctuation in the LC orientation for this gray level.
Next we address a binary grating to the LCoS display and measure the intensity of the zero and first diffraction orders. As the amplitude is the same for the two gray levels we consider only a phase difference between the two levels Φ(t) that depends on the time. Analytical expressions for the intensity in order 0 and in order 1 can be derived as a function of Φ. In particular, if the grating period is twice the width cell, the normalized intensities at 0 order and orders ±1 are given by [27]:
( ) ( )( )ttI Φ+= cos121
0 , ( ) ( )( )ttI Φ−π
=± cos1221 . (6)
From these relations, the phase modulation can be found as follows:
( )( ) ( ) ( )( ) ( )tItI
tItIt
12
0
12
0
44
cosπ+π−=Φ . (7)
#99537 - $15.00 USD Received 30 Jul 2008; revised 26 Sep 2008; accepted 29 Sep 2008; published 6 Oct 2008
(C) 2008 OSA 13 October 2008 / Vol. 16, No. 21 / OPTICS EXPRESS 16715
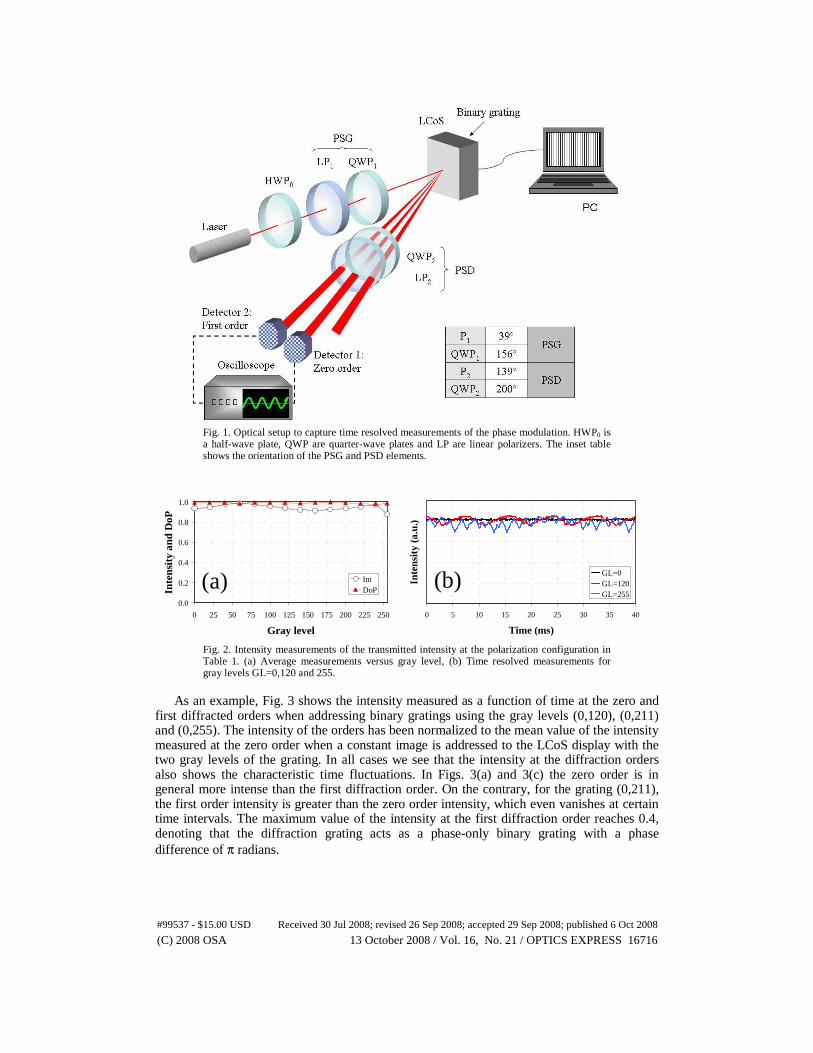
Fig. 1. Optical setup to capture time resolved measurements of the phase modulation. HWP0 is a half-wave plate, QWP are quarter-wave plates and LP are linear polarizers. The inset table shows the orientation of the PSG and PSD elements.
0.0
0.2
0.4
0.6
0.8
1.0
0 25 50 75 100 125 150 175 200 225 250
Gray level
Inte
nsit
y an
d D
oP
IntDoP(a)
0 5 10 15 20 25 30 35 40
Time (ms)
Inte
nsit
y (a
.u.)
GL=0GL=120GL=255
(b)
Fig. 2. Intensity measurements of the transmitted intensity at the polarization configuration in Table 1. (a) Average measurements versus gray level, (b) Time resolved measurements for gray levels GL=0,120 and 255.
As an example, Fig. 3 shows the intensity measured as a function of time at the zero and
first diffracted orders when addressing binary gratings using the gray levels (0,120), (0,211) and (0,255). The intensity of the orders has been normalized to the mean value of the intensity measured at the zero order when a constant image is addressed to the LCoS display with the two gray levels of the grating. In all cases we see that the intensity at the diffraction orders also shows the characteristic time fluctuations. In Figs. 3(a) and 3(c) the zero order is in general more intense than the first diffraction order. On the contrary, for the grating (0,211), the first order intensity is greater than the zero order intensity, which even vanishes at certain time intervals. The maximum value of the intensity at the first diffraction order reaches 0.4, denoting that the diffraction grating acts as a phase-only binary grating with a phase difference of π radians.
#99537 - $15.00 USD Received 30 Jul 2008; revised 26 Sep 2008; accepted 29 Sep 2008; published 6 Oct 2008
(C) 2008 OSA 13 October 2008 / Vol. 16, No. 21 / OPTICS EXPRESS 16716

By means of this procedure, we have used Eq. (7) to obtain the experimental phase difference when addressing different binary gratings to the LCoS display, corresponding to different pairs of gray levels. In Fig. 3(d), the instantaneous phase values as a function of time are shown corresponding to the binary gratings with gray levels (0,120), (0,211) and (0,255). In all cases fluctuations appear in the phase modulation. Particularly interesting is the case for the grating (0,211) where the mean phase difference is equal to 180º, but it is accompanied with a great fluctuation of almost 120º. These results are in agreement with those in Ref. [9], where the highest depolarization effect was observed around gray level 180. In both cases, the depolarization effect and the phase modulation fluctuation are originated from fluctuations in the orientation of the LC molecules, which appear to be the largest for this range of gray levels in our display.
0.0
0.2
0.4
0.6
0.8
1.0
0 5 10 15 20 25 30 35 40
Time (ms)
Inte
nsit
y
Zero order First order
(a)0.0
0.2
0.4
0.6
0.8
1.0
0 5 10 15 20 25 30 35 40
Time (ms)
Inte
nsit
y
Zero order First order
(b)
0.0
0.2
0.4
0.6
0.8
1.0
0 5 10 15 20 25 30 35 40
Time (ms)
Inte
nsit
y
Zero order First order
(c)-360
-300
-240
-180
-120
-60
0
0 5 10 15 20 25 30 35 40
Time (ms)
Pha
se m
odul
atio
n (d
eg)
GL=120 GL=211 GL=255
(d)
Fig. 3. Intensity measurements at the zero and fisrt diffraction orders for binary diffraction gratings with gray levels (a) (0,120), (b) (0,211) and (c) (0,255). (d) Instantaneous phase values as a function of time for different grey levels
4. Analysis of time averaged measurements
From the previous results it is clear that the phase-shift measured at the LCoS reflected beam is far to be constant into a frame period. Thus, the hypothesis of constant phase during the measurement time is not valid. In a large number of optical applications, as in holographic data storage [2] or diffractive optics [29,30], the integration time required is substantially higher than the LCoS frame period. In addition, methods for the characterization of the phase modulation based on interferometric systems [25,26], also usually employ CCD cameras where the integration time is much greater than the fluctuations observed in the LCoS display.
In this section we study how the phase fluctuations will affect measurements when experimental data are averaged over several frame periods. In this situation, the intensity measurements of the zero and first diffraction orders are given by:
( )( )( )tI Φ+= cos121
0 , ( )( )( )tI Φ−π
=± cos122
1 , (8)
where now Eqs. (6) have been adapted to include time averaged values ( )( )tΦcos , which
depends on the phase fluctuations of ( )tΦ . As we see in Fig. 3(d), the phase fluctuations for
#99537 - $15.00 USD Received 30 Jul 2008; revised 26 Sep 2008; accepted 29 Sep 2008; published 6 Oct 2008
(C) 2008 OSA 13 October 2008 / Vol. 16, No. 21 / OPTICS EXPRESS 16717
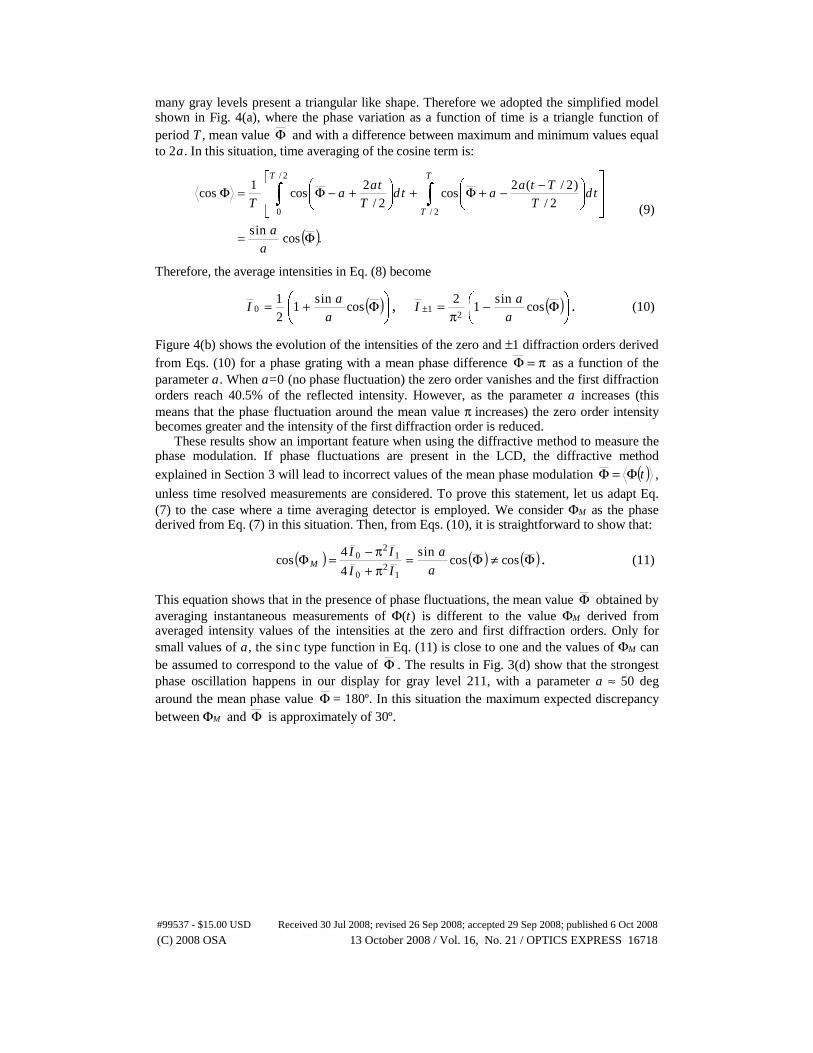
many gray levels present a triangular like shape. Therefore we adopted the simplified model shown in Fig. 4(a), where the phase variation as a function of time is a triangle function of period T, mean value Φ and with a difference between maximum and minimum values equal to 2a. In this situation, time averaging of the cosine term is:
( ).cossin
2/)2/(2
cos2/
2cos
1cos
2/
0 2/
Φ=
⎥⎥
⎦
⎤
⎢⎢
⎣
⎡⎟⎠
⎞⎜⎝
⎛ −−+Φ+⎟⎠
⎞⎜⎝
⎛ +−Φ=Φ ∫ ∫
aa
dtT
Ttaadt
Tat
aT
T T
T (9)
Therefore, the average intensities in Eq. (8) become
( )⎟⎠
⎞⎜⎝
⎛ Φ+= cossin
121
0a
aI , ( )⎟
⎠
⎞⎜⎝
⎛ Φ−π
=± cossin
122
1a
aI . (10)
Figure 4(b) shows the evolution of the intensities of the zero and ±1 diffraction orders derived from Eqs. (10) for a phase grating with a mean phase difference π=Φ as a function of the parameter a. When a=0 (no phase fluctuation) the zero order vanishes and the first diffraction orders reach 40.5% of the reflected intensity. However, as the parameter a increases (this means that the phase fluctuation around the mean value π increases) the zero order intensity becomes greater and the intensity of the first diffraction order is reduced.
These results show an important feature when using the diffractive method to measure the phase modulation. If phase fluctuations are present in the LCD, the diffractive method explained in Section 3 will lead to incorrect values of the mean phase modulation ( )tΦ=Φ ,
unless time resolved measurements are considered. To prove this statement, let us adapt Eq. (7) to the case where a time averaging detector is employed. We consider ΦM as the phase derived from Eq. (7) in this situation. Then, from Eqs. (10), it is straightforward to show that:
( ) ( ) ( )Φ≠Φ=π+π−=Φ coscos
sin44
cos1
20
12
0
aa
IIII
M . (11)
This equation shows that in the presence of phase fluctuations, the mean value Φ obtained by averaging instantaneous measurements of Φ(t) is different to the value ΦM derived from averaged intensity values of the intensities at the zero and first diffraction orders. Only for small values of a, the sinc type function in Eq. (11) is close to one and the values of ΦM can be assumed to correspond to the value of Φ . The results in Fig. 3(d) show that the strongest phase oscillation happens in our display for gray level 211, with a parameter a ≈ 50 deg around the mean phase value Φ = 180º. In this situation the maximum expected discrepancy between ΦM and Φ is approximately of 30º.
#99537 - $15.00 USD Received 30 Jul 2008; revised 26 Sep 2008; accepted 29 Sep 2008; published 6 Oct 2008
(C) 2008 OSA 13 October 2008 / Vol. 16, No. 21 / OPTICS EXPRESS 16718

(a)a−Φ
a+Φ
Φ
( )tΦ
0=t2T
t = Tt =
0.0
0.1
0.2
0.3
0.4
0.5
0.0 0.2 0.4 0.6 0.8 1.0Parameter a (units of π)
Inte
nist
y
Zero order
First order
(b)
Fig. 4. (a). Simplified phase variation in a period of time. (b). Intensity of the zero and first
diffraction order for a binary phase grating with mean phase π=Φ as a function of the amplitude (a) of the phase modulation.
5. Analysis of the two beam interference characterization method
Interferometric methods are another standard technique to measure the phase modulation in LCDs [25, 26]. Typically a two beam interferometer is built, where two light spots traverse two region of the LCD with different addressed gray level. The shift of the interference fringes serves as a measurement of the phase modulation. We built up such an interferometer in reflection (Fig. 5). The PSG and PSD are maintained. A diffraction grating is introduced before the LCoS so that the ±1 diffracted orders impinge onto two separate halves of the LCoS display (the other orders are filtered). After reflection, a lens recombines these two beams and the interference pattern is magnified by a microscope objective onto a CCD camera. One half of the LCoS is addressed with a constant zero gray level whereas in the other half the gray level is varied, in this way a fringe shift is obtained.
LCoS
LP1
LP2
QWP1
QWP2
Laser
PSG
PSD
PC
HWP0
CCD Camera
Convergent lens
Diffractiongrating
Fig. 5. Two beam interferometer set-up to measure the phase modulation.
It is interesting to analyze the effect of the phase fluctuations in this case. Now the interference pattern intensity will show time fluctuations as
( ) ( )( )( )pxtItI π+Φ+= 2cos12 0 . (12)
#99537 - $15.00 USD Received 30 Jul 2008; revised 26 Sep 2008; accepted 29 Sep 2008; published 6 Oct 2008
(C) 2008 OSA 13 October 2008 / Vol. 16, No. 21 / OPTICS EXPRESS 16719

where Φ(t) is the instantaneous phase shift, p is the period of the interference fringes on the CCD and x the coordinate in the CCD plane. We consider that the amplitude transmission in each area of the LCoS display is the same, and I0 is the intensity of a single point source.
If a fast camera were employed (as it was the case in Ref. [6]), a rapid fluctuation of the interference fringes could be observed. However, if a standard CCD camera were employed, time averaged images could be captured. In this situation, the registered intensity interference pattern becomes:
( ) ( )( ) ( ) .2cossin
12)2cos(12 00 ⎟⎠
⎞⎜⎝
⎛ π+Φ+=π+Φ+== pxa
aIpxtItII (13)
In the last part of Eq. (13) the model of Fig. 4(a) was used. From this equation it is clear that the time average of the fringes given by the interferometric method is also a sinusoidal fringe with a shift proportional to the mean phase Φ , but with a reduction of the visibility of the fringes that is related to fluctuation parameter a. This is equivalent to a partial coherence of the source. Let us note that this characterization method does not permit to obtain an instantaneous value of the phase modulation (unless a very fast CCD is used), but on the contrary it presents the advantage of providing the correct mean value Φ (in opposition to the diffractive method, that is capable to easily provide time resolved measurements, but it provides wrong values if phase fluctuations are ignored).
We have compared the two phase characterization measurement methods. We measured the fringes displacement in the two beam interferometer and derived the mean phase. Figure 6(a) shows an example of the fringe shift Δx as the addressed gray level changes. Figure 6(b) shows the mean phase modulation Φ (white squares, IP) derived from these data. On the other hand we calculated the mean value of the instantaneous phases (MIP) derived from the measurements made with the diffractive method (Fig. 4). They are also represented in Fig. 6(b) (red dots), and evidence an excellent agreement with the interferometric data. The error bars denote the range in which the instantaneous phase fluctuates.
Δx
p
(a)
-360
-300
-240
-180
-120
-60
0
0 25 50 75 100 125 150 175 200 225 250
Gray level
Pha
se m
odul
atio
n (d
eg)
MIPIP
(b)
Fig. 6. (a). Displacement Δx between two interference patterns for two gray levels addressed to the display. (b). Mean phase modulation versus addressed gray levels. IP denotes the interferometric phase characterization and MIP denotes the mean of the instantaneous phases measured with the diffractive method (Fig. 3(d)).
6. Effects in the diffraction efficiency of diffractive optical elements
One important application of LCoS microdisplays is as an element for displaying diffractive optical elements (DOE). In these applications, the diffraction efficiency becomes a relevant factor. Phase-only diffractive elements are of great interest since they maximize this parameter. When a phase-only diffractive element is displayed onto a spatial light modulator,
#99537 - $15.00 USD Received 30 Jul 2008; revised 26 Sep 2008; accepted 29 Sep 2008; published 6 Oct 2008
(C) 2008 OSA 13 October 2008 / Vol. 16, No. 21 / OPTICS EXPRESS 16720

the type of modulation defines an efficiency parameter named modulation diffraction efficiency [10]. This efficiency parameter is maximal, equal to 100%, when a pure and linear phase-only modulation up to 2π radians is achieved. For the case of binary phase modulation, the expected maximum modulation efficiency of around 40% is achieved when the phase difference is equal to π radians. In this case the DC term (zero order) vanishes.
In order to use the LCoS display as a device to display DOEs we modified the setup in Fig. 1 to include a spatial filter and a convergent lens on the input beam, in order to illuminate the whole LCoS area with a collimated beam, and another converging lens on the output beam. The CCD camera is placed on the back focal plane of the lens to capture the Fourier transform spectrum obtained by diffraction.
Because of the phase fluctuations that have been demonstrated previously, the diffraction efficiency of displayed DOEs will also fluctuate. As an example, we have tested the effect on two basic binary diffractive optical elements, with average phase levels 0 – π. The results in Fig. 6(b) show that this phase difference can be obtained (for the average phase values) for gray levels GL=0 and GL=211. The simplest binary DOE is the binary phase-only grating. The results for this diffractive element are shown in Fig. 7(a), which shows the typical diffraction orders generated by the grating. However it is remarkable that, although the ±1 orders are stronger, the zero (DC) order does not vanish. In section 3 we also measured the instant intensities in the diffraction orders of a binary grating to show the intensity fluctuations. As one of the gratings used in section 3 coincides with the grating used in this section (both have two phase levels equal to 0 and π) we can compare those results (Fig. 3(b)) and the results obtained in Fig. 7(a). In Fig. 3(b) the time resolved intensities of the zero and first diffraction orders for this case are shown. One can see that when the intensity of the zero diffraction order is equal to zero, the intensity of the first one is about 0.4, what is consistent with a binary phase grating with an instantaneous phase difference equal to π. The intensity of the diffraction orders in Fig. 7(a) correspond to the mean values of the time resolved measurements in Fig. 3(b), which are 0.377 for the ±1 orders and 0.059 for the zero order.
(a) (b)
Fig. 7. Fourier transform spectrum captured wit the CCD camera when a binary DOE is displayed onto the LCoS display with gray levels (0,211) (mean phase difference of π radians). (a). Binary diffraction grating, (Media 1). (b). Computer generated hologram designed to reconstruct a butterfly (Media 2).
Next we displayed a binary phase computer generated hologram designed to reconstruct a butterfly. The results are shown in Fig. 7(b). A linear phase along the diagonal direction is added to spatially separate the reconstruction of the different terms. In this way we separate the zero and ±1 orders. The butterfly is reconstructed in the ±1 orders with an efficiency equivalent to that of the first diffraction order in Fig. 7(a). The -1 order results in an inverted version of the butterfly, as expected. Again, the zero order term appears in the form of a DC peak located on axis, originated from the time fluctuations in the phase modulation. The video
#99537 - $15.00 USD Received 30 Jul 2008; revised 26 Sep 2008; accepted 29 Sep 2008; published 6 Oct 2008
(C) 2008 OSA 13 October 2008 / Vol. 16, No. 21 / OPTICS EXPRESS 16721

files linked to Figs. 7(a) and 7(b) show an interesting feature. These videos have been captured with the CCD camera operating at the shortest integration time, and a pulsation is observed in the zero diffraction order caused by the two different frequencies (the frequency in the CCD camera and the frequency in the LCoS display).
7. Conclusions
In summary, we have shown a new effect, experimentally detected, related to the fluctuation of the LC molecules in a LCoS display: the time fluctuation of the phase modulation. We have experimentally shown the evidence of these phase fluctuations by configuring the display in a phase-only modulation scheme and by taking time resolved measurements of the intensity of diffraction orders generated by a grating displayed onto the device.
We have studied the suitability in the presence of these time fluctuations of two experimental set-ups typically employed to measure the phase modulation. The first one is the above mentioned diffractive method based on addressing a binary grating to the display and measuring the intensity of the diffracted orders. This set-up is capable to provide time resolved measurements of the phase modulation. However, we demonstrated that this method leads to wrong values of the phase modulation if phase fluctuations are present but a slow detector, which measures time averaged intensity values, is employed. The second characterization method analyzed in the presence of phase fluctuations is the two beam interference technique. In this case we demonstrated that, in the case of using a standard CCD camera with integration times much longer than the frame period, the mean phase modulation is measured, independently of the phase fluctuations. These are visualized in the form of a reduction in the fringes contrast, but the fringe displacement remains only dependant on the mean phase. We have demonstrated that the mean phase modulation measured with the interferometric set-up coincides with the mean of the instantaneous phases measured with the diffractive method.
Finally, we displayed two binary-phase diffractive optical elements: a diffraction grating and a digital hologram. Then, we analyzed the phase fluctuation effect on the reconstruction. We selected two gray levels with a difference in mean phase equal to π radians, and we showed that the phase fluctuation results in a reduction of the diffraction efficiency, which is mainly visible in the form of a zero order DC term. Thus, because of the phase fluctuations the zero order in the reconstruction of the digital hologram is unavoidable.
Acknowledgments
We acknowledge financial support from the Spanish Ministerio de Educación y Ciencia (grants FIS2006-13037-C02-01 and FIS2006-13037-C02-02) and from Generalitat de Catalunya (grant ACI2003-42). C. Iemmi gratefully acknowledges the support of the Universidad de Buenos Aires and CONICET (Argentina).
#99537 - $15.00 USD Received 30 Jul 2008; revised 26 Sep 2008; accepted 29 Sep 2008; published 6 Oct 2008
(C) 2008 OSA 13 October 2008 / Vol. 16, No. 21 / OPTICS EXPRESS 16722