
San Juan • Santiago • Auckland • Londres • Milán • Montreal • Nueva Delhi • San Francisco
Upload
independentCategory
view
1download
0
Journal of Coastal Research 25 4 957–968 West Palm Beach, Florida July 2009
Tidal and Residual Currents Observations at the San Matıasand San Jose Gulfs, Northern Patagonia, ArgentinaDiego Moreira†‡, Claudia G. Simionato†‡*, Walter C. Dragani‡§††, and Mario N. Nunez†‡
†Centro de Investigaciones delMar y la Atmosfera (CIMA/CONICET-UBA)
Intendente Guiraldes 2160—Ciudad Universitaria
Pabellon II–2do.Piso, (C1428EGA)Ciudad Autonoma de Buenos
Aires, [email protected]
‡Departamento de Ciencias dela Atmosfera y los Oceanos
FCEN, UBAIntendente Guiraldes 2160—
Ciudad UniversitariaPabellon II–2do.Piso, (C1428EGA)Ciudad Autonoma de Buenos
Aires, Argentina.
§Servicio de Hidrografıa Naval(SHN) and
Escuela de Ciencias del Mar(ESCM-INUN)
Avda. Montes de Oca 2124(C1270ABV)
Ciudad Autonoma de BuenosAires, Argentina.
††Consejo Nacional deInvestigaciones Cientıficasy Tecnicas (CONICET),Argentina, Avda.Rivadavia 1917, (C1033AAJ)Ciudad Autonoma deBuenosAires, Argentina.
ABSTRACT
MOREIRA, D.; SIMIONATO, C.G.; DRAGANI,W. C., and NUNEZ, M.N., 2009. Tidal and residual currents observa-tions at the San Matıas and San Jose gulfs, Northern Patagonia, Argentina. Journal of Coastal Research, 25(4), 957–968. West Palm Beach (Florida), ISSN 0749-0208.
Four current time series, collected at costal locations of the San Matıas and San Jose gulfs, Argentina, are analyzedfor tidal and residual currents. Tides dominate San Matıas Gulf dynamics, accounting for more than 72% of thevariance, whereas winds dominate at San Jose Gulf, explaining approximately 70% of the variance. Tides display adominating semidiurnal regime, in compliance with what is know from the few tidal stations available and numericalsimulations. At San Matıas, coastal tidal currents speed increases northward, exceeding 0.6 m s�1 at San AntonioEste. Higher order harmonics because of nonlinear interactions are large; in every sampled site, M4 and M6 currentsare stronger than the diurnal constituents and have amplitudes around 5% of those from M2. At Las Grutas (SanMatıas Gulf), simultaneous wind observations were collected. Currents respond almost instantaneously to wind var-iability in the form of two modes. The first one results from winds blowing along the northwest–southeast axis andis very weak; the second one results from winds blowing from any other direction and is characterized by strongmeridional currents. Even though bimodal patterns are typical of semienclosed basins, the characteristic wind direc-tions in this gulf are not related with the orientation of its mouth but could result of the circulation in the form oftwo gyres suggested by numerical simulations. Energy peaks are observed at the 4 to 8 days’ band and at around 12and 20 days. Therefore, currents rapidly respond to wind variability in every timescale, from synoptic to intraseasonal.
ADDITIONAL INDEX WORDS: Wind forced currents, current measurements, Northpatagonian Gulfs.
INTRODUCTION
The Northpatagonian Gulfs (Figure 1) are a set of threegulfs located on the Argentinean Continental Shelf at thesouthwestern Atlantic at approximately 42� S and are knownas Nuevo, San Jose and San Matıas. The geometry and ba-thymetry of the area are complex, giving rise to a particulardynamics. The largest gulf, San Matıas, communicatesthrough a narrow mouth to the south with the smallest, SanJose, and through a broader mouth to the east with the openocean. With an area of 19,700 km2, it is one of the largestgulfs in South America. Its depth reaches 200 m and presentstwo relative maxima, one to the north and the other one tothe south. Its mouth, 64 km wide and with depths shallowerthan 100 m, restricts the exchange with the shelf. The SanJose Gulf has an area of 814 km2; its east–west extension is44.5 km, and it has a length of 18.5 km in the north–south
DOI:10.2112/08–1035.1 received 3 March 2008; accepted in revision19 June 2008.* Corresponding author.
direction. Its mouth, 6.8 km wide, is shallower than 80 m(SHN, 2000).
Three harbors are located at the San Matıas Gulfs: SanAntonio Oeste, San Antonio Este, and Punta Colorada (Fig-ure 1). Two important resorts, Las Grutas and Playas Dora-das (close to Punta Colorada), which are visited by thousandsof tourists in summer, are located on its coasts as well. Nopermanent settlements exist in the San Jose Gulf coasts,even though shellfish divers, coastal collectors, and artisanfishermen, constitute a small-scale but highly rentable activ-ity in the area. Los Pajaros Island, a nesting ground for nu-merous marine birds and a Natural Reserve, and the largestsea lions colony of Argentina, at Punta Bermeja (close toViedma), are also located in this gulf.
Fisheries involve most of inhabitants in this region. It gen-erates more than 1000 jobs and an annual income of morethan US$20 million. The industry is in permanent expansion,being responsible for a large part of the sea food productionand exportation in Argentina. During the last 5 years, thetotal catch in the area reached between 10 and 13.8 metrictons per year. Some of the species fished are Merluccius hubb-

958 Moreira et al.
Journal of Coastal Research, Vol. 25, No. 4, 2009
Figure 1. Bathymetry (in meters) of the Northpatagonian gulfs andmain geographical references.
si, Macruronus magellanicus, Paralichthys spp., Xistreurisrasile, Callorhinchus callorhynchus, Genypterus blacodes, Illexargentinus, Seriolella porosa, Parona sygnata, Squatina ar-gentina, Mustelus spp., and Galeorhynus galeus.
Besides their ecologic and economic importance, little isknown about physical aspects of the oceanography of thegulfs and, in particular, about their circulation and forcings.Direct observations, collected in the northeast of the San Ma-tıas Gulf, indicate weak mean currents, of around 0.14 m s�1
at a depth of 25 m (Framinan et al., 1991). Nevertheless, tidesin the region are among the largest in the world ocean, withamplitudes that exceed 9 m (SHN, 2008). This way, in thismacrotidal system, tidal currents tend to be larger than meancurrents, having large effects on vertical mixing and on prop-erties distribution. In particular, the genesis of several frontsobserved in the region in sea surface temperature satelliteimages has been connected to tides (Bava et al., 2002; Francoet al., 2008; Gagliardini and Rivas, 2004; Glorioso, 1987; Glo-rioso and Flather, 1995; Pisoni and Rivas, 2006; Rivas andDell’Arciprete, 2000). Those fronts are associated with areasof high primary productivity and have, therefore, a large im-pact on the fisheries (Sabatini, 2004). They also have a largeeffect on determining the direction of the CO2 fluxes (Bianchiet al., 2005).
The few tidal observations in the area come from the scarcecoastal tidal stations available: a total of four, located at SanAntonio Este (40�48� S, 64�53� W), Rıo Negro (41�02� S, 62�46�W), Punta Colorada (41�42� S, 65�00� W), and FondeaderoSan Roman (San Jose Gulf) (42�15� S, 64�14� W). There areno direct observations of tidal currents in coastal areas of the
gulfs, which, in turn, have the largest impact on human ac-tivity. Therefore, little is known about them or about the non-linear interactions that probably occur in the area as a resultof the complex geometry and bathymetry. With the aim ofovercoming this limitation, the current time series were col-lected at three coastal locations in the San Matıas Gulf andat one location in the San Jose Gulf. The data gathered spanperiods of between 1 and 3 month and provide the first op-portunity of exploring tidal and residual currents in thecoastal areas of the gulfs. The aim of this article is, therefore,to report those data and to provide a complete description oftheir statistics. It is expected that the results discussed herewill contribute to the knowledge of the complex tidal dynam-ics in the area and will constitute a basis for the validationof numerical models.
DATA
Current time series were collected at three coastal loca-tions of the San Matıas and San Jose gulfs. The instrumentwas an Aanderaa RCM9 MkII, and the timespan of the timeseries is of approximately 1 month each. Given that intensivecommercial fishing activities occur in the gulfs, the selectionof sampling sites was conditioned, for the security of the in-strument, to those places where permanent, visual controlcould be made. Sites were selected in terms of their economicimportance as harbors, resorts, or fisheries. In this way, mea-surements were taken at Playa Bengoa (San Jose Gulf ), aregion where bivalves are collected; at Punta Colorada (SanMatıas Gulf ), where a small harbor is located; and at SanAntonio Este (San Matıas Gulf ), the most important harborin the region. The location of the sampling sites can be ob-served in Figure 1.
During the first task, the current meter was deployed inPlaya Bengoa, at 42�15� S, 64�7� W, in the middle of the watercolumn, between May 20, 2006, and June 24, 2006, for a totalof 35 days; the total depth at this location was of 10 m. Dur-ing the second round, it was deployed in Punta Colorada at41�41� S, 65�00� W, at the same depth, during the period July4, 2006, to August 30, 2006, covering a total of 58 days. Fi-nally, during the third campaign, the instrument was de-ployed in San Antonio Este at 40�47� S, 64�53� W, where thedepth was of 9 m, between November 16, 2006, and December10, 2006, a total of 25 days. During that last day, the arraywas towed by a ship entering the harbor, but the instrumentwas able to be recovered. As a result, unfortunately, this timeseries was shorter than the others. In every case, zonal andmeridional current speed data were collected with a samplingperiod every half hour. The array consisted of an 80-kg ironbody, with a subsurface buoy (25 kg buoyancy) to maintainthe instrument in a vertical position, and a surface buoy topoint out the position of the mooring.
An oceanic buoy collected oceanographic and meteorologi-cal observations during the period July 4, 2005, to November11, 2005 (a total of 130 days). The buoy was deployed offshore Las Grutas (an important resort) at 40�56� S and 65�04�W (Figure 1), where the depth is 20 m. Wind speed and di-rection were measured with a Young, D4106–19, JR MA an-emometer, and surface currents were measured with a Dopp-

959Tidal and Residual Currents at Northern Patagonia
Journal of Coastal Research, Vol. 25, No. 4, 2009
Figure 2. Stick diagrams of the currents time series collected at (a) Pla-ya Bengoa, (b) Punta Colorada, (c) Las Grutas, and (d) San Antonio Este.Note that the scales used are not always the same and that each timeseries spans a different period.
ler current meter Aanderaa, DCS 3900R. The sampling pe-riod was 1 hour.
Data were corrected by magnetic declination, and qualitycontrol indicated that neither corrections nor filtering werenecessary.
RESULTS
Tidal and Residual Currents
Stick diagrams of the four current time series are given inFigure 2.; note that the vector scales are different for theplots corresponding to the San Matıas Gulf (Punta Colorada,Las Grutas, and San Antonio stations; Figures 2b–d) than forthe one of the San Jose Gulf (Playa Bengoa station; Figure2a). Also note that every series represents a different time-span. The first feature that emerges from this Figure is thelarge difference in the current speed and in the variability
observed between the series collected at the San Jose Gulfand those gathered at San Matıas Gulf. In particular, theseries gathered at Playa Bengoa displays weaker currentsand more temporal variability, as indicated by the continuouschange in the currents’ direction. The series collected at Pun-ta Colorada, Las Grutas, and San Antonio Este, instead, dis-plays a larger tendency to occur along an axis. This has anorth–northwest to south–southeast orientation at PuntaColorada and Las Grutas, and a northeast to southwest ori-entation at San Antonio Este.
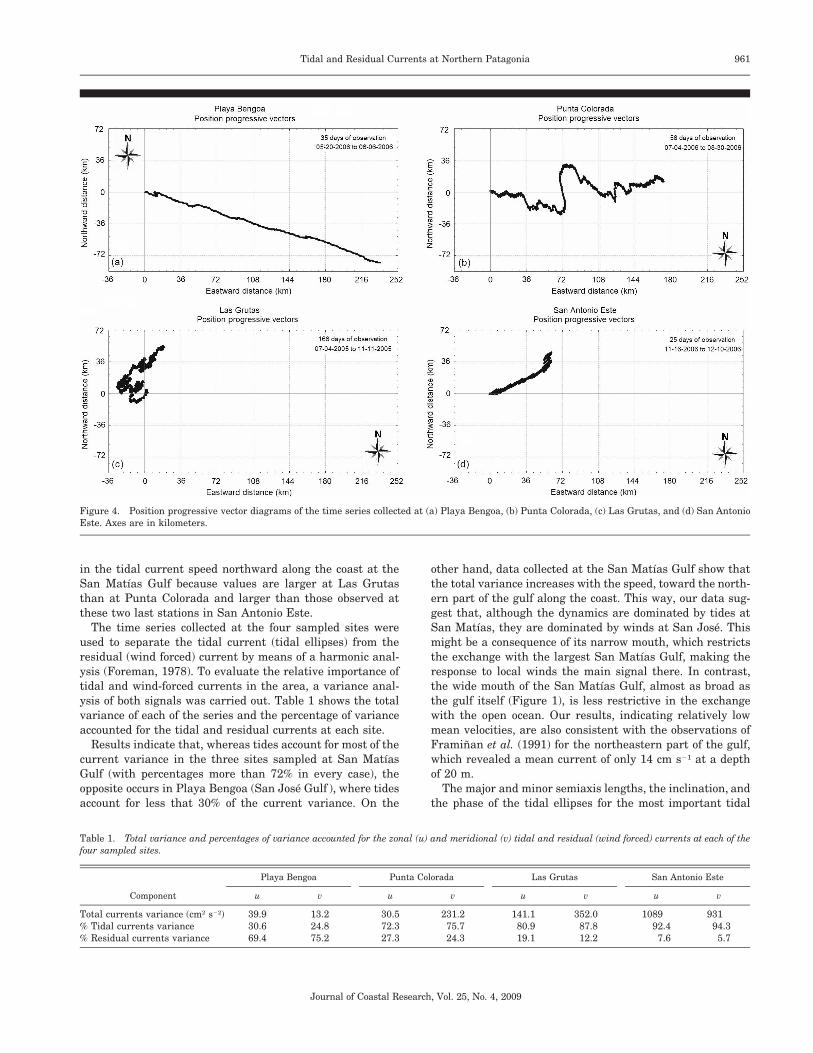
For a clearer interpretation, Figure 3 shows dispersion di-agrams in the u–v space (zonal velocity–meridional velocity)of the same time series. These plots provide a better imageof tidal current orientation and of the mean flow (at the ob-served level) along the observation period. At Playa Bengoa(San Jose Gulf ), currents were weak, reaching maximum val-ues of 26.4 and 15.6 cm s�1 for u (zonal velocity) and v (me-ridional velocity), respectively. The dot cloud (Figure 3a)spreads in west–northwest/east–southeast direction and isnot centered at the origin but displaced toward the south-eastern quadrant. This is an indication that a net wind-forcedeast–southeastward mean flow occurred during the periodobserved at the depth of the instrument; nevertheless, theshallowness of the location suggests that this flow is repre-sentative of the whole water column. The occurrence at thislocation of a strong wind-forced signal is consistent with thehigh variability in current direction observed in the stick di-agram for this station (Figure 2a). Mean flow direction is bet-ter observed in Figure 4, which shows the progressive posi-tion vector diagrams of the four time series. Even though thiskind of diagram does not exactly represent particle trajecto-ries in nature, it provides a good image of the mean flowdirection during the observation period. Note that eventhough the series collected at Playa Bengoa (spanning 35 d)is much shorter than the one corresponding to, for instance,Las Grutas (spanning 130 d), the progressive position-vectordiagram shows a much larger mean flow for the first seriesthan for the second. Nevertheless, the season when data werecollected at those two stations was the same: fall for PlayaBengoa and fall–winter for Las Grutas. This suggests a largerinfluence of the wind and a smaller influence of the tide asforcings at San Jose than at San Matıas Gulf.
The u–v dispersion diagrams for the data collected at SanMatıas Gulf (Figures 3b–d) show considerably larger valuesfor the currents. Maxima were 23.8 and 44.3 cm s�1 for u andv, respectively, at Punta Colorada; 37.5 and 54.2 cm s�1, re-spectively, at Las Grutas; and 57.5 and 54.8 cm s�1, respec-tively, at San Antonio Este. At Punta Colorada and Las Gru-tas, the cloud of dots in Figure 3 and the stick diagrams inFigure 2 (b and c) show that currents at these locations alignin a north–northwest/east–southeast direction. The disper-sion diagram (Figure 3) indicates a slight displacement of themean currents toward positive values of u, particularly atPunta Colorada. On the other hand, more dispersion is ob-served in Las Grutas than in Punta Colorada. This fact sug-gests a net eastward flow at both locations, but with largervariability at Las Grutas, which could derive from the factthat data at this last location were collected more offshorethan at Punta Colorada. This result is more visible in the

960 Moreira et al.
Journal of Coastal Research, Vol. 25, No. 4, 2009
Figure 3. Dispersion diagrams in the u–v space (zonal–meridional velocity) of the currents time series collected at (a) Playa Bengoa, (b) Punta Colorada,(c) Las Grutas, and (d) San Antonio Este. Axes are in centimeters per second.
progressive position diagrams of Figures 3b and 3c, where,as a result of the variability observed in the currents, themean flow results are much smaller in Las Grutas that inPunta Colorada. In contrast with the other two sites of theSan Matıas Gulf, the dispersion diagram (Figure 3d) and the
stick diagram (Figure 2d) for San Antonio Este indicate thatcurrents at this site have a preferential northeast–southwestdirection. Nevertheless, a small mean northeastward flowstill occurs, as revealed by the lower panel of Figure 4. Notethat both Figure 2 and Figure 3 seem to indicate an increase
961Tidal and Residual Currents at Northern Patagonia
Journal of Coastal Research, Vol. 25, No. 4, 2009
Figure 4. Position progressive vector diagrams of the time series collected at (a) Playa Bengoa, (b) Punta Colorada, (c) Las Grutas, and (d) San AntonioEste. Axes are in kilometers.
Table 1. Total variance and percentages of variance accounted for the zonal (u) and meridional (v) tidal and residual (wind forced) currents at each of thefour sampled sites.
Component
Playa Bengoa
u v
Punta Colorada
u v
Las Grutas
u v
San Antonio Este
u v
Total currents variance (cm2 s�2) 39.9 13.2 30.5 231.2 141.1 352.0 1089 931% Tidal currents variance 30.6 24.8 72.3 75.7 80.9 87.8 92.4 94.3% Residual currents variance 69.4 75.2 27.3 24.3 19.1 12.2 7.6 5.7
in the tidal current speed northward along the coast at theSan Matıas Gulf because values are larger at Las Grutasthan at Punta Colorada and larger than those observed atthese two last stations in San Antonio Este.
The time series collected at the four sampled sites wereused to separate the tidal current (tidal ellipses) from theresidual (wind forced) current by means of a harmonic anal-ysis (Foreman, 1978). To evaluate the relative importance oftidal and wind-forced currents in the area, a variance anal-ysis of both signals was carried out. Table 1 shows the totalvariance of each of the series and the percentage of varianceaccounted for the tidal and residual currents at each site.
Results indicate that, whereas tides account for most of thecurrent variance in the three sites sampled at San MatıasGulf (with percentages more than 72% in every case), theopposite occurs in Playa Bengoa (San Jose Gulf ), where tidesaccount for less that 30% of the current variance. On the
other hand, data collected at the San Matıas Gulf show thatthe total variance increases with the speed, toward the north-ern part of the gulf along the coast. This way, our data sug-gest that, although the dynamics are dominated by tides atSan Matıas, they are dominated by winds at San Jose. Thismight be a consequence of its narrow mouth, which restrictsthe exchange with the largest San Matıas Gulf, making theresponse to local winds the main signal there. In contrast,the wide mouth of the San Matıas Gulf, almost as broad asthe gulf itself (Figure 1), is less restrictive in the exchangewith the open ocean. Our results, indicating relatively lowmean velocities, are also consistent with the observations ofFraminan et al. (1991) for the northeastern part of the gulf,which revealed a mean current of only 14 cm s�1 at a depthof 20 m.
The major and minor semiaxis lengths, the inclination, andthe phase of the tidal ellipses for the most important tidal

962 Moreira et al.
Journal of Coastal Research, Vol. 25, No. 4, 2009
Tab
le2.
Maj
oran
dm
inor
axis
(cm
s�1),
incl
inat
ion,
and
phas
e(d
egre
es)
ofth
eti
dal
elli
pses
deri
ved
from
the
harm
onic
anal
ysis
ofcu
rren
tti
me
coll
ecte
dat
each
ofth
efo
ursa
mpl
edsi
tes.
Com
pone
nt
Pla
yaB
engo
a
Maj
orM
inor
Incl
inat
ion
Pha
se
Pun
taC
olor
ada
Maj
orM
inor
Incl
inat
ion
Pha
se
Las
Gru
tas
Maj
orM
inor
Incl
inat
ion
Pha
se
San
Ant
onio
Est
e
Maj
orM
inor
Incl
inat
ion
Pha
se
Q1
0.74
0.29
151.
5018
9.70
0.29
�0.
0778
.60
73.4
00.
09�
0.03
45.6
034
0.80
——
——
O1
0.21
�0.
0376
.60
158.
600.
340.
0911
4.20
250.
300.
480.
2896
.40
135.
100.
230.
0014
2.00
180.
00P
10.
06�
0.03
34.0
025
9.20
0.05
0.04
104.
5033
0.10
0.24
�0.
0515
.90
87.1
01.
160.
264.
4017
5.70
K1
0.29
�0.
2036
.20
256.
900.
170.
1410
6.60
327.
801.
06�
0.44
18.0
084
.70
0.54
0.33
30.9
023
3.70
N2
0.95
0.04
24.6
020
9.10
4.04
�0.
6210
3.30
160.
206.
830.
6012
1.40
302.
501.
920.
8833
.00
231.
40M
24.
93�
0.03
24.4
024
1.30
18.8
1�
3.01
108.
3018
4.20
28.2
53.
6812
0.60
345.
3060
.42
2.46
42.7
026
2.60
S2
0.58
�0.
1611
.90
326.
003.
11�
0.32
108.
5026
6.60
6.36
0.34
120.
4059
.10
15.8
3�
2.09
44.6
032
5.30
K2
0.12
�0.
0417
0.90
139.
800.
63�
0.10
87.5
026
0.40
1.28
0.00
99.4
052
.90
3.23
�0.
5923
.60
319.
10M
40.
320.
0045
.60
79.2
01.
490.
0795
.60
111.
501.
570.
7314
0.60
257.
806.
43�
0.49
22.2
026
6.60
M6
0.47
0.02
24.9
020
7.40
0.90
�0.
1311
6.30
34.6
01.
110.
0611
3.20
242.
206.
29�
1.18
48.0
027
8.20
M8
0.19
0.01
23.7
08.
300.
090.
028.
2026
6.00
0.17
�0.
0417
5.70
223.
002.
12�
0.21
33.1
027
0.90
M1
00.
110.
0446
.40
120.
600.
16�
0.04
94.4
030
8.80
0.29
0.06
115.
4022
1.10
0.54
�0.
2832
.00
283.
00
Figure 5. M2 tidal ellipses derived from a harmonic analysis applied tothe time series collected at (a) Playa Bengoa, (b) Punta Colorada, (c) LasGrutas, and (d) San Antonio Este. Axes are in centimeters per second.Note that the scales are not always the same.
current constituents, inferred from harmonic analysis of thedata collected at the four sites, are shown in Table 2. Notethat, because most of the series is short, the error in the es-timation of the tidal ellipses increases for the small-ampli-tude constituents. Also, note that the tidal ellipses corre-sponding to Q1 could not be inferred for the San Antonio se-ries because of its shortness. Because of the length of the dataseries, P1 was inferred from K1, and K2 from S2, following thetechnique given by Schureman (1988). The first feature thatemerges from Table 2 is the dominant semidiurnal characterof the tide in the area, where the diurnal constituents’ cur-rents only reach a small fraction of the semidiurnal ones.This is consistent with what is known from tidal gauges inthe area (SHN, 2008) as well as from numerical simulations(Glorioso and Flather, 1997). Secondly, a large difference be-tween the tidal current speed in San Matıas and San Josegulfs is observed, consistently with the dispersion diagramsof Figure 3. Data indicate, also consistent with that Figure,an increase in tidal current speed northward along the SanMatıas Gulf coast. In effect, the amplitude of the M2 tidalellipses is 18.8 cm s�1 at Punta Colorada, 28.2 cm s�1 at LasGrutas, and 60.4 cm s�1 at San Antonio Este (Figure 5). Com-paratively, tidal current in Playa Bengoa (San Jose Gulf ) issmall, with a maximum amplitude of only a few centimetersper second. With regard to the inclination of the dominantsemidiurnal constituents, these results seem to be what was
963Tidal and Residual Currents at Northern Patagonia
Journal of Coastal Research, Vol. 25, No. 4, 2009
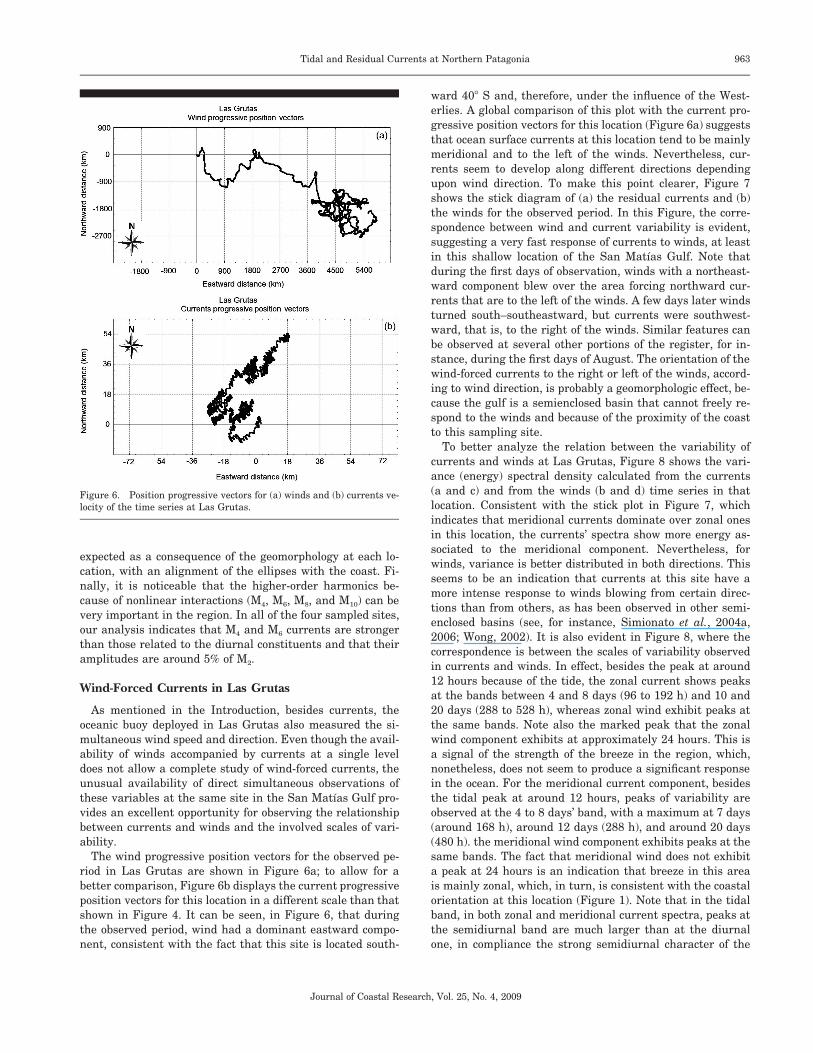
Figure 6. Position progressive vectors for (a) winds and (b) currents ve-locity of the time series at Las Grutas.
expected as a consequence of the geomorphology at each lo-cation, with an alignment of the ellipses with the coast. Fi-nally, it is noticeable that the higher-order harmonics be-cause of nonlinear interactions (M4, M6, M8, and M10) can bevery important in the region. In all of the four sampled sites,our analysis indicates that M4 and M6 currents are strongerthan those related to the diurnal constituents and that theiramplitudes are around 5% of M2.
Wind-Forced Currents in Las Grutas
As mentioned in the Introduction, besides currents, theoceanic buoy deployed in Las Grutas also measured the si-multaneous wind speed and direction. Even though the avail-ability of winds accompanied by currents at a single leveldoes not allow a complete study of wind-forced currents, theunusual availability of direct simultaneous observations ofthese variables at the same site in the San Matıas Gulf pro-vides an excellent opportunity for observing the relationshipbetween currents and winds and the involved scales of vari-ability.
The wind progressive position vectors for the observed pe-riod in Las Grutas are shown in Figure 6a; to allow for abetter comparison, Figure 6b displays the current progressiveposition vectors for this location in a different scale than thatshown in Figure 4. It can be seen, in Figure 6, that duringthe observed period, wind had a dominant eastward compo-nent, consistent with the fact that this site is located south-
ward 40� S and, therefore, under the influence of the West-erlies. A global comparison of this plot with the current pro-gressive position vectors for this location (Figure 6a) suggeststhat ocean surface currents at this location tend to be mainlymeridional and to the left of the winds. Nevertheless, cur-rents seem to develop along different directions dependingupon wind direction. To make this point clearer, Figure 7shows the stick diagram of (a) the residual currents and (b)the winds for the observed period. In this Figure, the corre-spondence between wind and current variability is evident,suggesting a very fast response of currents to winds, at leastin this shallow location of the San Matıas Gulf. Note thatduring the first days of observation, winds with a northeast-ward component blew over the area forcing northward cur-rents that are to the left of the winds. A few days later windsturned south–southeastward, but currents were southwest-ward, that is, to the right of the winds. Similar features canbe observed at several other portions of the register, for in-stance, during the first days of August. The orientation of thewind-forced currents to the right or left of the winds, accord-ing to wind direction, is probably a geomorphologic effect, be-cause the gulf is a semienclosed basin that cannot freely re-spond to the winds and because of the proximity of the coastto this sampling site.
To better analyze the relation between the variability ofcurrents and winds at Las Grutas, Figure 8 shows the vari-ance (energy) spectral density calculated from the currents(a and c) and from the winds (b and d) time series in thatlocation. Consistent with the stick plot in Figure 7, whichindicates that meridional currents dominate over zonal onesin this location, the currents’ spectra show more energy as-sociated to the meridional component. Nevertheless, forwinds, variance is better distributed in both directions. Thisseems to be an indication that currents at this site have amore intense response to winds blowing from certain direc-tions than from others, as has been observed in other semi-enclosed basins (see, for instance, Simionato et al., 2004a,2006; Wong, 2002). It is also evident in Figure 8, where thecorrespondence is between the scales of variability observedin currents and winds. In effect, besides the peak at around12 hours because of the tide, the zonal current shows peaksat the bands between 4 and 8 days (96 to 192 h) and 10 and20 days (288 to 528 h), whereas zonal wind exhibit peaks atthe same bands. Note also the marked peak that the zonalwind component exhibits at approximately 24 hours. This isa signal of the strength of the breeze in the region, which,nonetheless, does not seem to produce a significant responsein the ocean. For the meridional current component, besidesthe tidal peak at around 12 hours, peaks of variability areobserved at the 4 to 8 days’ band, with a maximum at 7 days(around 168 h), around 12 days (288 h), and around 20 days(480 h). the meridional wind component exhibits peaks at thesame bands. The fact that meridional wind does not exhibita peak at 24 hours is an indication that breeze in this areais mainly zonal, which, in turn, is consistent with the coastalorientation at this location (Figure 1). Note that in the tidalband, in both zonal and meridional current spectra, peaks atthe semidiurnal band are much larger than at the diurnalone, in compliance the strong semidiurnal character of the

964 Moreira et al.
Journal of Coastal Research, Vol. 25, No. 4, 2009
Figure 7. (a) Stick plot of the residual current (in centimeters per second) obtained by harmonic analysis of the time series collected in Las Grutas. (b)Stick plot of the winds (in meters per second) from the same site.
tide in this region (Glorioso and Flather, 1997). Finally,squared coherency and phase spectra between the zonal andmeridional current components (Figures 8e and 8f ) show thatthe wind-forced signal is highly coherent in both directionsand is almost in phase for all the above-mentioned bands,except at 96 hours, when a phase lag of approximately 60� isobserved between current components.
Even though the peaks in the diverse spectra of Figure 8seem to suggest that zonal (meridional) winds force zonal(meridional) currents, a Principal Components (Empirical Or-thogonal Function [EOF]) analysis, applied to both variablessimultaneously, reveals that currents respond mainly to localmeridional wind. In effect, the results of that analysis (Table3) show that a first mode, accounting for 51% of the totalvariance, relates to both current components and the merid-ional wind, whereas the zonal wind is separated in a secondmode. The factor loadings of the first mode (or correlation
between the mode and each variable) are 0.76 for u, 0.85 forv, and 0.82 for the meridional wind, indicating the high cor-relation among these three variables. The second mode, most-ly correlated to the zonal wind component, does not accountfor significant percentages of variance in the currents. More-over, Figure 9, which shows the cross-correlation between thecurrents and wind components for different time lags, con-firms that both current components are mostly forced by themeridional wind. This Figure also indicates the absence of asignificant time lag between changes in the wind and theresponse in the currents. In this way, response to the windis very energetic and fast in this location of the San MatıasGulf.
Finally, to provide an image of current response to winddirection at the location and depth of the Las Grutas site,Figure 10 shows current vectors, composed by wind sectors45� wide, the first one centered at the North, for the whole

965Tidal and Residual Currents at Northern Patagonia
Journal of Coastal Research, Vol. 25, No. 4, 2009
Figure 8. Energy spectral density of the currents and winds zonal (a and b) and meridional (c and d) components from the time series collected in LasGrutas and (e) coherence and (f) phase from the cross-spectra between the zonal and meridional currents components.
register. This Figure indicates that the Gulf at this locationresponds to most wind directions with a strong meridionalcurrent and a weak zonal one, except for northwesterly andsoutheasterly winds; for which, total currents response isvery weak. This result does not seem to be skewed for the
number of cases, given that every wind direction was wellrepresented in the sample. Even though the minimum of8.5% of the cases corresponded to southeasterly winds andthe maximum of 16.1% of the cases corresponded to northerlywinds, northwesterlies were represented by 13.6% of the cas-

966 Moreira et al.
Journal of Coastal Research, Vol. 25, No. 4, 2009
Table 3. Results of the Principal Components (EOF analysis) applied tothe residual currents and wind data collected at Las Grutas.
EOF Analysis—Factor Loadings Factor 1 Factor 2
Residual zonal current (u) 0.76 0.18Residual meridional current (v) 0.85 �0.15Zonal wind 0.25 0.94Meridional wind 0.82 �0.30Percentage of explained variance 51% 25%
Figure 10. Current vectors composed by wind sectors 45� wide and cen-tered at the north from the time series collected in Las Grutas.
Figure 9. Cross-correlation between currents and winds of the time series collected in Las Grutas: (a) zonal current and zonal wind, (b) zonal currentand meridional wind, (c) meridional current and zonal wind, and (d) meridional current and meridional wind.
es (Figure 11). Nevertheless, current speed could be influ-enced by mean wind speed for each wind direction, as re-vealed by Figure 10. In fact, even though southerly currentsin our composite of Figure 9 were weaker that northerly cur-rents, the observed mean wind speed for the correspondingdirection displayed the same feature (Figure 11). Our resultsindicate, therefore, that, for winds blowing from between thenorth and the east, this site of the gulf develops a strongsouthward current, whereas for winds blowing form the south
to the west, it develops a strong northward current, and al-most no response results for winds from the southeast–north-west direction. Because zonal wind-forced currents are smallat this location, errors in their estimation are probably larg-

967Tidal and Residual Currents at Northern Patagonia
Journal of Coastal Research, Vol. 25, No. 4, 2009
Figure 11. Composite of mean wind speed by wind direction in sectors45� wide centered at the north (left axis, solid line) and number of casesused for each composite (right axis, dashed line).
er. Nevertheless, they seem to be able to occur in oppositionto zonal wind, as is the case, for instance, for winds from the90� sector. The bimodal pattern of response to winds detectedin this series has been observed in other semienclosed basins(see, for instance, Simionato et al., 2004a, 2006; Wong, 2002);nevertheless, wind directions associated to one or anothermode of response are usually related to the orientation of themouth. This does not seem to be the case here, given that thegulf mouth has a north–south orientation, whereas currentsseem to respond, in one mode, to winds blowing along thenorthwest–southeast axis and, in another mode, to windsfrom any other direction. A pattern of circulation in the formof two gyres, one cyclonic to the north and the other anticy-clonic to the south has been find in this gulf (Beier and Aka-prahamyan, 1991; Beier, Fiore, and Orlanski, 1989) in nu-merical simulations; the occurrence of the northern gyre hasbeen also reported from observations (Piola and Scasso,1988). Likely, the pattern of the response observed in ourdata is a result of this fact and related to the geomorphologicfeatures of the area.
CONCLUSIONS
In this article, four current time series, with time spans ofbetween 1 and 5 months, collected at several locations of theSan Matıas and San Jose gulfs, were analyzed for tidal andwind-forced variability, providing the first information aboutcurrents in coastal locations of those gulfs. Results indicatethat coastal currents in San Matıas Gulf are stronger thanin San Jose Gulf; in fact, in this last gulf, current speed isabout one-fourth of that observed in the first gulf, with typ-ical values less than 15 cm s�1. As a result of the narrowmouth that communicates between them, the interaction be-tween San Jose and San Matıas gulfs seems to be quite re-stricted, and therefore, tidal currents are of small amplitudein the inner gulf. There, instead, wind-forced currents seemto dominate the energy balance. In every location, indepen-
dent of the season when data were collected, an eastwardwater mean flow was observed. This is probably a result ofthe fact that both gulfs are located in the Westerlies region.In the San Matıas Gulf, tidal currents account for more than70% of the total variance at every location. Coastal tidal cur-rents increase to the north, and in the northernmost location,they account for more than 90% of the variance. Tidal cur-rents are dominated by the semidiurnal constituents, in com-pliance with what is know from observations (SHN, 2008)and numerical simulations (Glorioso and Flather, 1997) forthe Patagonian Shelf, whereas diurnal constituents accountfor a much smaller percentage of the variance. An alignmentof the tidal ellipses with the coast line is observed at everylocation. Our analysis also indicates that higher-order har-monics from nonlinear interactions can be very important inthe region. In all four of the sampled sites, M4 and M6 cur-rents were stronger than those related to the diurnal con-stituents, and their amplitudes were around 5% of M2. Theimportance of nonlinear effects in the Argentinean Shelf wasnoticed by several authors from observations and numericalsimulations (see, for instance, Simionato et al., 2004b). Nev-ertheless, the data analyzed in this article have provided thefirst opportunity for a quantification of those effects at coast-al locations of the Northpatagonian Gulfs.
The instrument deployed at Las Grutas (San Matıas Gulf )measured simultaneous wind speed and direction, providingan unusual opportunity to evaluate wind-forced currents inthe area and their scales of variability. Even though the anal-ysis is restricted to the level of the instrument, the resultsare very useful and illustrate the particular way in which thisgulf responds to winds. It was found that currents respondalmost instantaneously to wind variability. The signal isdominated by meridional winds and seems to be in the formof two modes. One of them results from winds blowing in thenorthwest–southeast axis and is very weak; the other oneresults from winds from all the other directions and is char-acterized by strong meridional currents. Even though thiskind of bimodal pattern is typical of semienclosed basins, thecharacteristic wind directions do not seem to be related withthe orientation of the gulf mouth. The gulf develops a strongresponse to meridional winds but a weak one to the zonalwinds and seems to reflect all the observed wind scales ofvariability. Energy peaks are observed at the 4 to 8 days’band with a maximum at 7 days (around 168 h), at around12 days (288 h), and at around 20 days (480 h). Therefore,currents seem to rapidly respond to wind variability in syn-optic to intraseasonal timescales.
Evidently, our observations and results cannot provide acomplete picture of the circulation in these gulfs, and it isevident that more long-term observations of, at least, cur-rents and winds, are needed for a better understanding oftheir dynamics. Nevertheless, these data have provided alarge amount of information, contributing to the knowledgeof the complex tidal and wind-forced dynamics in the areaand constituting a basis for model validation. These simula-tions, which are envisaged for the immediate future by sev-eral research groups in Argentina, including ours, would helpto complement the few observations available, to compose a

968 Moreira et al.
Journal of Coastal Research, Vol. 25, No. 4, 2009
clearer conceptual picture, and to suggest the most importantareas for further observational efforts.
ACKNOWLEDGMENTS
This article is a contribution to the UNDP Project ARG/02/018–GEF BIRF N� 28385-AR ‘‘Prevention of coastal contam-ination and management of the marine biodiversity,’’ theSubproject A-B-30 ‘‘Study of the circulation in the San MatıasGulf with numerical models forced by tides and winds,’’ andthe UBA Grant X264. The salaries of Drs. Simionato, Dra-gani, and Nunez were paid, in part, by the CONICET andthe University of Buenos Aires.
LITERATURE CITED
BAVA J.; GAGLIARDINI, D.A.; DOGLIOTTI, A.I., and LASTA, C.A.,2002. Annual distribution and variability of remotely sensed seasurface temperature fronts in the Southwestern Atlantic. Ocean29th International Symposium on Remote Sensing of Environment,8–12 de Abril, 2002, Buenos Aires, Argentina.
BEIER, E.J. and AKAPRAHAMYAN, R., 1991. Variacion estacional dela circulacion inducida por el viento en el Golfo San Matıas apli-cando el modelo Cox/CIMA. Abstract In: IV Jornadas Nacionalesde Ciencias del Mar. (Madryn, Argentina), pp. 109.
BEIER E.J.; FIORE, M., and ORLANSKI, I., 1989. Circulacion esta-cional en los golfos Nordpatagonicos. Abstract In: IV Jornadas Na-cionales de Ciencias del Mar. (Madryn, Argentina), 124, pp. 86.
BIANCHI, A. A.; BIANUCCI, L.; PIOLA, A.R.; PINO, D.R.; SCHLOSS, I.;POISSON, A., and BALESTRINI, C.F., 2005. Vertical stratificationand air-sea CO2 fluxes in the Patagonian shelf, Journal of Geo-physical Research, 110, C07003, doi:10.1029/2004JC002488.
FOREMAN, M.G.G., 1978. Manual for tidal currents analysis and pre-diction. Pacific Marine Science Report. Patricia Bay, Sidney, BC,Canada: Institute for Ocean Sciences 78–6. 65p.
FRANCO, B.C.; PIOLA, A.R.; RIVAS, A.L.; BALDONI, A., and PISONI,J.P., 2008: Multiple thermal fronts near Patagonian shelf break.Geophysical Research Letters. 35, L02607, doi:10.1029/2007GL032066.
FRAMINAN, M.B.; BALESTRINI, C.F.; BIANCHI, A.A.; DEMILIO G., andPIOLA, A.R., 1991. Datos CTD y series temporales de velocidad,temperatura y conductividad en el golfo San Matıas. Servicio deHidrografıa Naval, Informe Tecnico N� 63/1991, Argentina.
GAGLIARDINI, D.A. and RIVAS, A.L., 2004. Environmental charac-teristics of San Matıas Gufl obtained from LANDSAT-TM andETM� data. Gayana (Concepc.), 68(2), 186–193.
GLORIOSO, P.D., 1987. Temperature distribution related to shelf-sea
fronts on the Patagonian shelf. Continental Shelf Research, 7(1),27–34.
GLORIOSO, P.D. and FLATHER, R.A., 1995. A barotropic model of thecurrents off SE South America. Journal of Geophysical Research,100, 13427–13440.
GLORIOSO, P.D. and FLATHER, R.A. 1997. The Patagonian Shelftides. Progress in Oceanography, 40, 263–283.
PIOLA, A.R. and SCASSO, L.M., 1988. Circulacion en el Golfo SanMatıas. Geoacta, 15(1), 33–51.
PISONI, J.P. and RIVAS, A., 2006. Frentes termicos sobre la PCA pormedio de imagenes satelitales. In: Proceedings of the VI JornadasNacionales de Ciencias del Mar and XIV Coloquio de Oceanografıa.(Diciembre 2006. Puerto Madryn, Argentina).
RIVAS, A.L. and DELL’ARCIPRETE, P. 2000. Frentes termicos en laplataforma Patagonica inferidos a partir de datos satelitales. Ab-stract. In: IV Jornadas Nacionales de Ciencias del Mar, (Madryn,Argentina), pp. 107.
SABATINI, M.E., 2004. Caracterısticas ambientales, reproduccion yalimentacion de la merluza (Merluccius hubbsi) y la anchoıta (En-graulis anchoıta) en su habito reproductivo Patagonico. Sıntesis yperspectivas. Revista de Investigacion y Desarrollo Pesquero, 16, 5–25.
SCHUREMAN, P., 1988. Manual of harmonic analysis and predictionof tides. Washington, DC: U.S. Department of Commerce, Coast,and Geodetic Survey Special Publication 98, 317p.
SHN, 2000. Derrotero Argentino, parte II: Costa del Atlantico—Des-de Cabo San Antonio a Cabo Vırgenes y Punta Dungeness y Su-plemento. In: Armada de la Republica Argentina. 9th ed. BuenosAires, Argentina: Servicio de Hidrografıa Naval Publicacion H202.
SHN, 2008. Tablas de Marea. Buenos Aires, Argentina: Servicio deHidrografıa Naval, Ministerio de Defensa Publicacion H 610.
SIMIONATO, C.G.; DRAGANI, W.; MECCIA, V.L., and NUNEZ, M.N.,2004a. A numerical study of the barotropic circulation of the Rıode la Plata estuary: sensitivity to bathymetry, the Earth’s rotationand low frequency wind variability. Estuarine, Coastal and ShelfScience, 61, 261–273.
SIMIONATO, C.G.; DRAGANI, W.; NUNEZ, M.N., and ENGEL, M.,2004b. A set of 3-D nested models for tidal propagation from theArgentinean Continental Shelf to the Rıo de la Plata estuary, partI: M2. Journal of Coastal Research, 20(3), 893–912.
SIMIONATO, C.G.; MECCIA, V.L.; DRAGANI, W.C.; GUERRERO, R., andNUNEZ, M.N., 2006. The Rıo de la Plata estuary response to windvariability in synoptic to intra-seasonal scales: Barotropic re-sponse. Journal of Geophysical Research, 111, C09031, doi:10.1029/2005JC003297.
WONG, K.C., 2002. On the wind-induced exchange between IndianRiver Bay, Delaware and the adjacent continental shelf. Continen-tal Shelf Research, 11–13, 1651–1668.
� FOREIGN RESUME �
Se estudian las corrientes de marea y residuales de cuatro series de corrientes colectadas en sitios costeros de los golfos San Matıas y San Jose, Argentina. En elgolfo San Matıas, la marea domina la dinamica, explicando mas del 72% de la varianza, mientras que los vientos dominan en el San Jose, explicando aproximadamenteel 70% de la varianza. Las mareas muestran un regimen esencialmente semidiurno, en concordancia con lo que se sabe de las pocas estaciones mareograficasdisponibles y de simulaciones numericas. En San Matıas, la velocidad de las corrientes costeras crece hacia el norte, excediendo los 0,6 m s�1 en San Antonio Este.Los armonicos de mayor orden, debidos a interacciones no lineales son grandes; en todos los sitios muestreados las corrientes debidas a M4 y M6 son mayores quelas componentes diurnas y tienen amplitudes de alrededor del 5% de M2. En Las Grutas (golfo San Matıas) se colectaron observaciones de viento simultaneas. Lascorrientes responden casi instantaneamente a la variabilidad del viento en forma de dos modos. El primero resulta de vientos que soplan a lo largo del eje noroeste-sudeste y es muy debil; el segundo resulta de vientos que soplan de todas las otras direcciones y esta caracterizado por fuertes corrientes meridionales. Aunque lospatrones bimodales son tıpicos de cuencas semicerradas, las direcciones caracterısticas del viento en este golfo no estan relacionadas con la orientacion de su boca,sino que podrıa resultar de la circulacion en forma de dos giros sugerida por simulaciones numericas. Se observan picos energeticos en la banda de 4 a 8 dıas yalrededor de 12 y 20 dıas. De esta manera, las corrientes responden rapidamente a la variabilidad del viento en todas las escalas temporales, de la sinoptica a laintra-estacional.
Copyright © 2022 FDOKUMEN