Thika Intergrated Strategic Urban Development Plan Report.pdf
385
-
Upload
khangminh22 -
Category
Documents
-
view
0 -
download
0
Transcript of Thika Intergrated Strategic Urban Development Plan Report.pdf
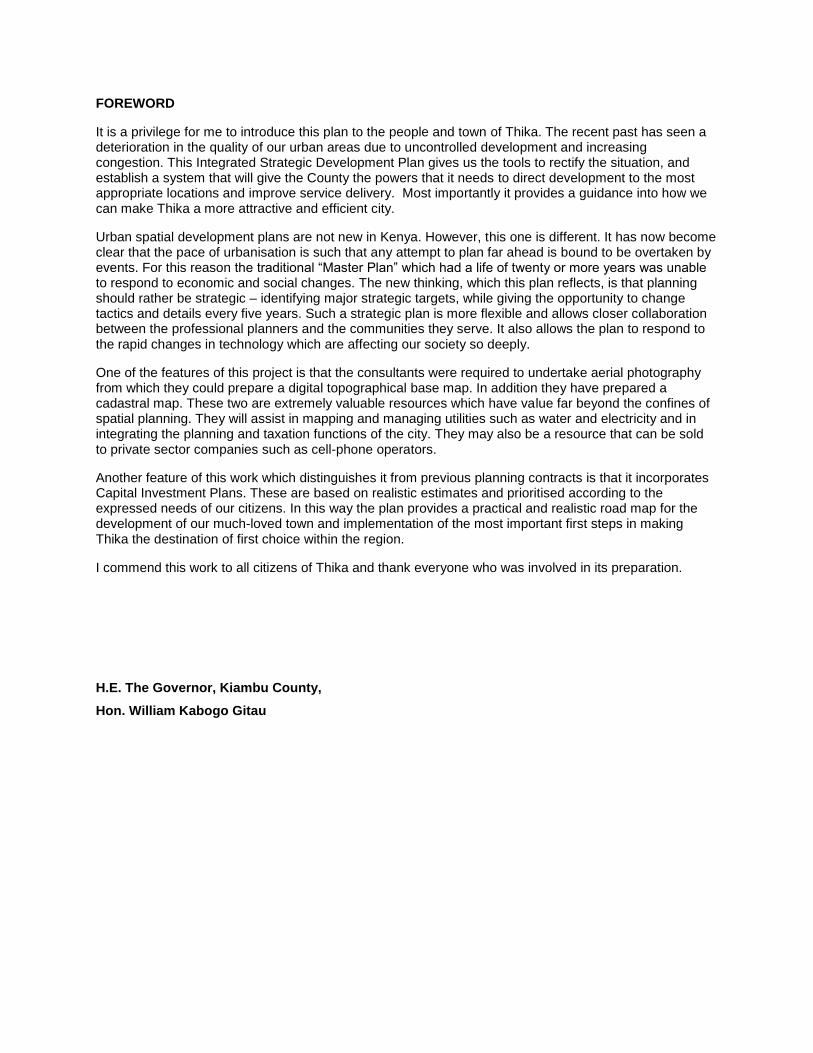
FOREWORD
It is a privilege for me to introduce this plan to the people and town of Thika. The recent past has seen a deterioration in the quality of our urban areas due to uncontrolled development and increasing congestion. This Integrated Strategic Development Plan gives us the tools to rectify the situation, and establish a system that will give the County the powers that it needs to direct development to the most appropriate locations and improve service delivery. Most importantly it provides a guidance into how we can make Thika a more attractive and efficient city.
Urban spatial development plans are not new in Kenya. However, this one is different. It has now become clear that the pace of urbanisation is such that any attempt to plan far ahead is bound to be overtaken by events. For this reason the traditional “Master Plan” which had a life of twenty or more years was unable to respond to economic and social changes. The new thinking, which this plan reflects, is that planning should rather be strategic – identifying major strategic targets, while giving the opportunity to change tactics and details every five years. Such a strategic plan is more flexible and allows closer collaboration between the professional planners and the communities they serve. It also allows the plan to respond to the rapid changes in technology which are affecting our society so deeply.
One of the features of this project is that the consultants were required to undertake aerial photography from which they could prepare a digital topographical base map. In addition they have prepared a cadastral map. These two are extremely valuable resources which have value far beyond the confines of spatial planning. They will assist in mapping and managing utilities such as water and electricity and in integrating the planning and taxation functions of the city. They may also be a resource that can be sold to private sector companies such as cell-phone operators.
Another feature of this work which distinguishes it from previous planning contracts is that it incorporates Capital Investment Plans. These are based on realistic estimates and prioritised according to the expressed needs of our citizens. In this way the plan provides a practical and realistic road map for the development of our much-loved town and implementation of the most important first steps in making Thika the destination of first choice within the region.
I commend this work to all citizens of Thika and thank everyone who was involved in its preparation.
H.E. The Governor, Kiambu County,
Hon. William Kabogo Gitau
Consultancy Services for Digital Topographical Mapping and the Preparation of Integrated Strategic Urban
Development Plans for Cluster III Towns-Thika
i
Table of Contents
1 Introduction ................................................................................................. 1-1
1.1 BACKGROUND ................................................................................................................................ 1-1
1.2 PURPOSE OF THE ISUDP................................................................................................................ 1-2
1.3 APPRECIATION OF ISUDP’S OBJECTIVES ......................................................................................... 1-3
1.4 SCOPE OF WORK............................................................................................................................ 1-3
1.5 DURATION OF THE WORK ................................................................................................................. 1-3
1.6 COMMENCEMENT OF THE STUDY AND TEAM MOBILIZATION ................................................................ 1-4
1.7 PROJECT OUTPUT AND DELIVERABLES ............................................................................................. 1-4
1.8 STAKEHOLDERS CONSULTATIONS: .................................................................................................. 1-4
1.8.1 Introduction ................................................................................................................................... 1-4
1.8.2 Identification of Stakeholders ........................................................................................................ 1-5
1.8.3 Stakeholder consultation ................................................................................................................ 1-5
1.8.4 Focussed Ground Discussions and Individual Interviews ............................................................. 1-5
1.8.5 Workshops...................................................................................................................................... 1-5
1.8.6 Methodology .................................................................................................................................. 1-6
Phase I ...................................................................................................................................................................... 1-6
Phase II ..................................................................................................................................................................... 1-7
Phase III ................................................................................................................................................................... 1-7
1.9 REPORT STRUCTURE ...................................................................................................................... 1-9
2 Town profile, population projections and policies review ....................... 2-1
2.1 INTRODUCTION ............................................................................................................................... 2-1
2.2 TOWN PROFILE ............................................................................................................................... 2-1
2.2.1 History and Administrative Divisions ............................................................................................ 2-1
2.2.2 Administration ............................................................................................................................... 2-1
2.2.3 Physical Features and Climate ...................................................................................................... 2-2
2.2.4 Regional Context ........................................................................................................................... 2-4
2.2.5 Demography .................................................................................................................................. 2-7
2.2.6 Population Growth ........................................................................................................................ 2-7
2.2.7 Urban Population .......................................................................................................................... 2-8
2.2.8 Household Size ............................................................................................................................... 2-8
2.3 ECONOMY OF TOWN........................................................................................................................ 2-9
2.3.1 Introduction ................................................................................................................................... 2-9
2.3.2 Employed Population ..................................................................................................................... 2-9
2.3.3 Per Capita Income ....................................................................................................................... 2-10
2.3.4 Poverty Level ............................................................................................................................... 2-10
2.3.5 Industries ..................................................................................................................................... 2-11
2.3.6 Commercial Activities .................................................................................................................. 2-11
2.3.7 Agriculture ................................................................................................................................... 2-12
Consultancy Services for Digital Topographical Mapping and the Preparation of Integrated Strategic Urban
Development Plans for Cluster III Towns-Thika
ii
2.3.8 Informal Sector ............................................................................................................................ 2-13
2.3.9 Issues/ Observations: ................................................................................................................... 2-14
2.4 POPULATION PROJECTION .............................................................................................................2-14
2.4.1 Historic growth rates ................................................................................................................... 2-14
2.4.2 Interpreting the data .................................................................................................................... 2-15
2.4.3 Projections ................................................................................................................................... 2-15
2.4.4 Natural Increase .......................................................................................................................... 2-15
2.4.5 Urban growth in Kenya ............................................................................................................... 2-15
2.4.6 Economic trends .......................................................................................................................... 2-16
The pull of the centre ............................................................................................................................................. 2-17
2.4.7 Summary ...................................................................................................................................... 2-18
2.5 LAND USE PROJECTIONS ...............................................................................................................2-18
2.5.1 Planning for growth ..................................................................................................................... 2-18
2.5.2 Existing land use .......................................................................................................................... 2-19
2.5.3 Are there any changes in land-use patterns which will affect densities? ..................................... 2-19
2.5.4 Density projections ...................................................................................................................... 2-19
2.6 LEGAL AND POLICY CONTEXT .........................................................................................................2-21
2.6.1 The Constitution ........................................................................................................................... 2-21
2.6.2 Physical Planning Act, Cap 286, 1996 ........................................................................................ 2-21
2.6.3 County Governments Act, 2012 ................................................................................................... 2-21
2.6.4 Urban Areas and Cities Act, 2011 ............................................................................................... 2-22
2.6.5 The Land Act, 2012 ...................................................................................................................... 2-24
2.7 POLICY AND GUIDELINES ...............................................................................................................2-24
2.7.1 Sessional Paper No. 10 of 2012: Vision 2030 ............................................................................. 2-24
2.7.2 National Land Policy ................................................................................................................... 2-25
2.7.3 Urban Development Policy .......................................................................................................... 2-25
2.7.4 Physical Planning Handbook ...................................................................................................... 2-26
2.8 PLANNING IMPLEMENTATION UNDER THE NEW CONSTITUTION ..........................................................2-27
2.8.1 Environment Policy and Guidelines ............................................................................................ 2-27
2.8.2 National Housing Policy .............................................................................................................. 2-29
2.8.3 Building By-laws .......................................................................................................................... 2-30
2.8.4 Previous Plans ............................................................................................................................. 2-31
2.9 INSTITUTIONAL FRAMEWORK .........................................................................................................2-31
2.9.1 County Government ..................................................................................................................... 2-31
2.9.2 Town Government ........................................................................................................................ 2-32
2.9.3 Department of Urban Development ............................................................................................. 2-32
2.9.4 Infrastructure Service Providers .................................................................................................. 2-32
2.10 CONCLUSION ................................................................................................................................2-32
3 Development concept ................................................................................. 3-1
3.1 INTRODUCTION ............................................................................................................................... 3-1
Consultancy Services for Digital Topographical Mapping and the Preparation of Integrated Strategic Urban
Development Plans for Cluster III Towns-Thika
iii
3.2 VISION ........................................................................................................................................... 3-1
3.3 PLANNING CONCEPT ....................................................................................................................... 3-1
3.3.1 Understanding of the regional setting ........................................................................................... 3-1
3.3.2 Development potential and constraints.......................................................................................... 3-4
3.3.3 Environmentally sensitive areas and land suitability .................................................................... 3-6
3.3.4 Elevation Analysis ......................................................................................................................... 3-6
3.4 SPATIAL DEVELOPMENT MODELS ..................................................................................................... 3-7
3.4.1 The Grid Model .............................................................................................................................. 3-7
3.4.2 Radial Development Model............................................................................................................ 3-7
3.4.3 Linear/Ribbon Model ..................................................................................................................... 3-8
3.4.4 Applicability of various Development Models ............................................................................... 3-8
3.5 PROPOSED PLAN ............................................................................................................................ 3-8
3.5.1 Integration of all development models ........................................................................................... 3-8
3.5.2 Hierarchy of Planning Units .......................................................................................................... 3-8
3.5.3 Seamless Transportation: .............................................................................................................. 3-8
3.5.4 Proving adequate basic infrastructure .......................................................................................... 3-8
3.5.5 Decentralised commercial areas ................................................................................................... 3-8
3.5.6 New Industrial area ....................................................................................................................... 3-8
3.5.7 Environmental conservation (hills, rivers) .................................................................................... 3-9
3.5.8 Providing new high density residential areas and re-densification of existing areas.................... 3-9
3.5.9 Improvement of informal areas ...................................................................................................... 3-9
3.5.10 Stakeholder consultations .......................................................................................................... 3-9
3.6 ILLUSTRATION OF CONCEPTS ........................................................................................................... 3-9
3.6.1 Densification .................................................................................................................................. 3-9
3.6.2 Arterial roads............................................................................................................................... 3-12
3.6.3 Planning hierarchy /Decentralized planning ............................................................................... 3-13
3.6.4 Division of town into Sectors ....................................................................................................... 3-17
3.6.5 Green fingers ............................................................................................................................... 3-18
3.6.6 Pedestrian friendly: wide pavements ........................................................................................... 3-19
3.6.7 Pedestrian friendly: arcades ........................................................................................................ 3-20
3.6.8 Pedestrian friendly: narrow roads ............................................................................................... 3-21
3.6.9 Mixed use ..................................................................................................................................... 3-23
3.6.10 Small squares .......................................................................................................................... 3-24
3.6.11 Parking .................................................................................................................................... 3-25
3.6.12 Water ....................................................................................................................................... 3-26
3.6.13 Topographical responses......................................................................................................... 3-27
3.6.14 Curved streets .......................................................................................................................... 3-28
3.6.15 Small business and jua kali ..................................................................................................... 3-29
3.6.16 Urban agriculture .................................................................................................................... 3-30
4 Structure plan .............................................................................................. 4-1
Consultancy Services for Digital Topographical Mapping and the Preparation of Integrated Strategic Urban
Development Plans for Cluster III Towns-Thika
iv
4.1 INTRODUCTION ............................................................................................................................... 4-1
4.2 EXISTING LAND USE ........................................................................................................................ 4-1
4.2.1 Issues/ Observations ...................................................................................................................... 4-4
4.3 LAND USE NORMS ........................................................................................................................... 4-4
4.4 PLANNING PRINCIPLES .................................................................................................................... 4-6
4.5 SPATIAL DEVELOPMENT STRATEGY .................................................................................................. 4-6
4.5.1 Low and high rise development with overall medium density ....................................................... 4-6
4.5.2 New planned development in urban extension areas ..................................................................... 4-6
4.5.3 Renewal of the old town area......................................................................................................... 4-7
4.5.4 Control of fringe development ....................................................................................................... 4-7
4.6 POPULATION DENSITY ..................................................................................................................... 4-7
4.6.1 Density matters for sustainability .................................................................................................. 4-7
4.6.2 Existing population density ............................................................................................................ 4-7
4.6.3 Proposed population density and land requirements ..................................................................... 4-8
4.6.4 Land Requirements ........................................................................................................................ 4-8
4.7 FUTURE EXPANSION OF THIKA PLANNING BOUNDARY ....................................................................... 4-9
4.8 POPULATION GROWTH SCENARIOS ................................................................................................4-11
4.8.1 High growth rate .......................................................................................................................... 4-11
4.8.2 Medium growth rate..................................................................................................................... 4-11
4.8.3 Low growth rate ........................................................................................................................... 4-11
4.8.4 Selection of growth scenario ........................................................................................................ 4-12
4.9 DEVELOPMENT OPTIONS ...............................................................................................................4-12
4.9.1 Option 1: Linear/ ribbon development......................................................................................... 4-12
4.9.2 Option 2: Compact radial development ....................................................................................... 4-12
4.9.3 Option 3: Polynuclear/decentralised development ...................................................................... 4-12
4.9.4 Selection of the development option............................................................................................. 4-12
4.10 LAND USE PLAN ...........................................................................................................................4-12
4.10.1 Residential land use ................................................................................................................. 4-15
High density residential .......................................................................................................................................... 4-15
Medium density residential .................................................................................................................................... 4-15
Low density residential .......................................................................................................................................... 4-15
4.10.2 Industrial land use ................................................................................................................... 4-17
4.10.3 Educational land use ............................................................................................................... 4-19
4.10.4 Recreational land use .............................................................................................................. 4-19
4.10.5 Public purpose land use .......................................................................................................... 4-21
4.10.6 Commercial land use ............................................................................................................... 4-22
4.10.7 Public utilities land use ........................................................................................................... 4-22
4.10.8 Roads and transport land use .................................................................................................. 4-24
4.10.9 Other land uses ........................................................................................................................ 4-24
5 Strategic sector plan ................................................................................... 5-1
Consultancy Services for Digital Topographical Mapping and the Preparation of Integrated Strategic Urban
Development Plans for Cluster III Towns-Thika
v
5.1 INTRODUCTION ............................................................................................................................... 5-1
5.2 ECONOMIC DEVELOPMENT .............................................................................................................. 5-1
5.2.1 Commerce ...................................................................................................................................... 5-1
5.2.2 Industry .......................................................................................................................................... 5-2
5.2.3 Agriculture ..................................................................................................................................... 5-2
5.2.4 Labour Force Participation Rate (LFPR) and employed population: ........................................... 5-3
5.2.5 Existing gap and Future Demand .................................................................................................. 5-4
Banking Institutions: ................................................................................................................................................ 5-4
5.2.6 Project identification for economic development .......................................................................... 5-4
5.3 PHYSICAL INFRASTRUCTURE ........................................................................................................... 5-7
5.3.1 Water Supply .................................................................................................................................. 5-7
5.3.2 Sewerage ...................................................................................................................................... 5-11
5.3.3 Stormwater drainage ................................................................................................................... 5-15
5.3.4 Solid waste ................................................................................................................................... 5-19
5.3.5 Fire safety .................................................................................................................................... 5-22
5.3.6 Electricity and street lighting....................................................................................................... 5-24
5.4 ROADS AND TRANSPORT ...............................................................................................................5-26
5.4.1 Traffic volumes and road capacity .............................................................................................. 5-26
5.4.2 Road Connectivity ........................................................................................................................ 5-27
5.4.3 Junction Capacity ........................................................................................................................ 5-27
5.4.4 Bus terminal capacity .................................................................................................................. 5-28
5.4.5 Parking ........................................................................................................................................ 5-29
5.4.6 Parking for heavy vehicles ........................................................................................................... 5-29
5.4.7 Public transport ........................................................................................................................... 5-29
5.4.8 Goals and Strategies .................................................................................................................... 5-30
5.4.9 Road Network Development ........................................................................................................ 5-31
5.4.10 Bypass Roads ........................................................................................................................... 5-34
5.4.11 Intersection improvements ....................................................................................................... 5-36
5.4.12 Pedestrian and Non-Motorized Transport (NMT) Facilities ................................................... 5-38
5.4.13 Existing Trip Characteristics in Thika .................................................................................... 5-39
5.4.14 Bus terminal and shelters ........................................................................................................ 5-39
5.4.15 Matatu station/terminal and shelters ....................................................................................... 5-42
5.4.16 Truck Terminals ...................................................................................................................... 5-43
5.4.17 Proposed Public Transport System ......................................................................................... 5-44
5.4.18 Traffic Management ................................................................................................................ 5-45
5.4.19 Parking .................................................................................................................................... 5-46
5.4.20 Railway Link ............................................................................................................................ 5-47
5.5 SOCIAL INFRASTRUCTURE .............................................................................................................5-50
5.5.1 Education ..................................................................................................................................... 5-50
5.5.2 Health Facilities .......................................................................................................................... 5-53
Consultancy Services for Digital Topographical Mapping and the Preparation of Integrated Strategic Urban
Development Plans for Cluster III Towns-Thika
vi
5.5.3 Other community facilities ........................................................................................................... 5-56
Security .................................................................................................................................................................. 5-57
5.6 ENVIRONMENT MANAGEMENT PLAN ................................................................................................5-58
5.6.1 Major Environmental Issues ........................................................................................................ 5-58
5.6.2 Goal ............................................................................................................................................. 5-60
5.6.3 Proposed environment management strategy .............................................................................. 5-60
5.6.4 Protect Environmentally Sensitive Areas ..................................................................................... 5-61
5.6.5 Environmental conservation and management ............................................................................ 5-66
5.7 DISASTER MANAGEMENT ...............................................................................................................5-68
5.8 TOURISM AND HERITAGE ...............................................................................................................5-77
5.8.1 Introduction ................................................................................................................................. 5-77
Tourist sites ............................................................................................................................................................ 5-77
Heritage sites .......................................................................................................................................................... 5-77
5.8.1 Assessment of tourism potential ................................................................................................... 5-77
5.8.2 Strategies for tourism and heritage conservation ........................................................................ 5-77
5.9 HOUSING .....................................................................................................................................5-80
5.9.1 Introduction ................................................................................................................................. 5-80
5.9.2 Housing demand and land use ..................................................................................................... 5-81
5.9.3 Possible housing solutions ........................................................................................................... 5-83
5.9.4 Number of units ............................................................................................................................ 5-84
5.9.5 Road, water and sewerage demand to service housing ............................................................... 5-84
5.10 INFORMAL SETTLEMENTS ..............................................................................................................5-86
5.11 INSTITUTIONAL SET-UP ..................................................................................................................5-87
5.12 FINANCIAL MANAGEMENT ..............................................................................................................5-89
6 Action area plans ........................................................................................ 6-1
6.1 INTRODUCTION ............................................................................................................................... 6-1
6.2 ACTION AREA PLAN 1: THIKA CBD ................................................................................................... 6-1
6.2.1 Existing situation ........................................................................................................................... 6-1
6.2.2 Existing land use ............................................................................................................................ 6-1
Issues and challenges of the CBD: ........................................................................................................................... 6-2
Objectives of the CBD Action Area Plan ................................................................................................................. 6-2
6.2.3 Proposed interventions .................................................................................................................. 6-2
Creating a pedestrian-friendly environment ............................................................................................................. 6-2
Improving traffic circulation .................................................................................................................................... 6-3
Providing off-street multi-storey parking ................................................................................................................. 6-3
................................................................................................................................................................................. 6-5
Remove encroachments on road reserves ................................................................................................................. 6-6
Improve Security ...................................................................................................................................................... 6-6
6.3 ACTION AREA PLAN 2: KIANDUTU INFORMAL SETTLEMENT ................................................................ 6-6
6.3.1 Introduction and existing status ..................................................................................................... 6-6
6.3.2 Existig land use of Kiandutu .......................................................................................................... 6-8
Consultancy Services for Digital Topographical Mapping and the Preparation of Integrated Strategic Urban
Development Plans for Cluster III Towns-Thika
vii
6.3.3 Issues and Challenges of Kiandutu Informal Settlement ............................................................... 6-8
6.3.4 Objectives of the Action Area Plan ................................................................................................ 6-8
6.3.5 Proposed interventions .................................................................................................................. 6-8
Infrastructure ............................................................................................................................................................ 6-9
Community Facilities ............................................................................................................................................. 6-10
6.4 ACTION AREA PLAN 3: GATITU JUNCTION ......................................................................................6-11
6.4.1 Introduction ................................................................................................................................. 6-11
6.4.2 Existing Conditions ...................................................................................................................... 6-11
6.4.3 Issues and challenges of Gatitu Junction ..................................................................................... 6-11
6.4.4 Objectives of Gatitu Junction Action Area Plan .......................................................................... 6-11
6.4.5 Proposed Interventions ................................................................................................................ 6-12
6.5 ACTION AREA PLAN 4: REDEVELOPMENT OF COUNTY ESTATES .......................................................6-15
6.5.1 Existing situation ......................................................................................................................... 6-15
6.5.2 Existing land use .......................................................................................................................... 6-17
............................................................................................................................................................................... 6-17
Issues and challenges of the County estates: .......................................................................................................... 6-18
Objectives of the Action Area Plan ........................................................................................................................ 6-18
6.5.3 Proposed interventions ................................................................................................................ 6-18
6.5.4 Bondeni estate calculation ........................................................................................................... 6-18
6.6 ACTION AREA PLAN 5: RIVER FRONT DEVELOPMENT ......................................................................6-21
6.6.1 Introduction ................................................................................................................................. 6-21
6.6.2 River Front Development at Kamuguti River .............................................................................. 6-21
6.6.3 Existing land use of River Front Development Sites .................................................................... 6-23
6.6.4 Status of river front site ............................................................................................................... 6-23
6.6.5 Objectives of river front development .......................................................................................... 6-23
6.6.6 Proposed interventions ................................................................................................................ 6-23
7 Development control and zoning regulations ........................................... 7-1
7.1 INTRODUCTION ............................................................................................................................... 7-1
7.2 IMPLEMENTATION............................................................................................................................ 7-1
7.2.1 Powers and Duties under the Physical Planning Act. Cap 286 (1996) ......................................... 7-1
7.2.2 Application of the Act .................................................................................................................... 7-2
7.2.3 Summary ........................................................................................................................................ 7-5
7.3 ESTABLISHING A MORE EFFICIENT SYSTEM ....................................................................................... 7-5
7.4 ZONING .......................................................................................................................................... 7-8
7.4.1 Why zone? ...................................................................................................................................... 7-8
7.4.2 The problem of rapid change ......................................................................................................... 7-8
7.4.3 The concept of strategic planning .................................................................................................. 7-9
7.4.4 Zoning in the context of strategic planning ................................................................................... 7-9
7.4.5 The need for zoning also to be strategic ........................................................................................ 7-9
Mixed uses ............................................................................................................................................................... 7-9
Consultancy Services for Digital Topographical Mapping and the Preparation of Integrated Strategic Urban
Development Plans for Cluster III Towns-Thika
viii
7.4.6 Residential Areas ......................................................................................................................... 7-10
Activities allowed in Residential Zones ................................................................................................................. 7-14
7.4.7 Industrial Areas ........................................................................................................................... 7-15
Uses Prohibited ...................................................................................................................................................... 7-16
7.4.8 Educational Areas ....................................................................................................................... 7-16
7.4.9 Recreational areas ....................................................................................................................... 7-17
7.4.10 Public purpose areas ............................................................................................................... 7-17
7.4.11 Commercial Areas ................................................................................................................... 7-18
7.4.12 Transportation areas zoning regulations ................................................................................ 7-19
7.4.13 Agricultural Areas ................................................................................................................... 7-20
7.4.14 Conservation areas zoning regulations ................................................................................... 7-21
7.4.15 General Parking Norms: ......................................................................................................... 7-21
8 Implementation ............................................................................................ 8-1
8.1 IMPLEMENTATION PLAN ................................................................................................................... 8-1
8.1.1 Introduction ................................................................................................................................... 8-1
8.1.2 Sectoral implementation charts ..................................................................................................... 8-1
8.2 ADDITIONAL INSTITUTIONAL INITIATIVES FOR PLAN IMPLEMENTATION ................................................8-19
8.3 ACTIONS NEEDED AFTER COMPLETION OF THE ISUDP ....................................................................8-20
8.4 MONITORING AND REVIEW .............................................................................................................8-22
8.4.1 Plan monitoring ........................................................................................................................... 8-22
8.4.2 Plan review .................................................................................................................................. 8-22
8.5 COUNTY ECONOMY .......................................................................................................................8-22
8.5.1 Existing financial status ............................................................................................................... 8-22
8.5.2 Revenue collection efficiency ....................................................................................................... 8-23
8.5.3 Potential additional sources of revenue....................................................................................... 8-23
Rates Revenue ........................................................................................................................................................ 8-23
Single Business Permit (SBP) ................................................................................................................................ 8-24
User fees and charges ............................................................................................................................................. 8-24
9.2.3 Summary of key areas of concern ................................................................................................................. 8-25
8.6 THE URBANISATION DIVIDEND ........................................................................................................8-26
Leveraging land values ........................................................................................................................................... 8-26
Using planning consent as a financial tool ............................................................................................................. 8-29
Maximising the role of the private sector ............................................................................................................... 8-29
Taxation ................................................................................................................................................................. 8-30
8.7 PUBLIC PRIVATE PARTNERSHIPS ...................................................................................................8-30
8.7.1 What are PPPs and why do we need them? ................................................................................. 8-30
8.7.2 What are the advantages of PPPs? .............................................................................................. 8-31
8.7.3 What are the risks of PPPs? ........................................................................................................ 8-31
8.7.4 Project Preparation: the sequence .............................................................................................. 8-31
8.7.5 Project conceptualization ............................................................................................................ 8-32
8.7.6 What type of PPP would be appropriate? ................................................................................... 8-33
Consultancy Services for Digital Topographical Mapping and the Preparation of Integrated Strategic Urban
Development Plans for Cluster III Towns-Thika
ix
8.8 PLANNING IMPLEMENTATION UNDER THE NEW CONSTITUTION ..........................................................8-34
8.8.1 Rights and duties .......................................................................................................................... 8-34
Rights ..................................................................................................................................................................... 8-34
Duties ..................................................................................................................................................................... 8-34
8.8.2 Areas in which citizen participation should be solicited.............................................................. 8-35
8.8.3 Relevant areas for citizen participation in relation to the Kenya Municipal Programme ........... 8-35
Policies and regulations .......................................................................................................................................... 8-35
Development Proposals .......................................................................................................................................... 8-35
8.8.4 Projects and budgets .................................................................................................................... 8-36
8.8.5 The nature of participation .......................................................................................................... 8-36
8.8.6 Implementation of participation .................................................................................................. 8-36
Relationship between the actors ............................................................................................................................. 8-36
8.8.7 Participation process ................................................................................................................... 8-37
8.8.8 Putting participation theory into practice ................................................................................... 8-41
List of Annexures
Annexure 1: Notice of intension of plan: Thika
Annexure 2: List of stakeholders for workshops
Annexure 3: Stakeholder consultations
Annexure 4: Situational analysis and vision workshop report
Annexure 5: Validation workshop report for the Draft ISUDP
Annexure 6: Plot layout as per plot coverage and set backs
Annexure 7: Agriculture and subdivision size
Annexure 8: Class of occupancy of buildings
List of Tables TABLE 1.1: PERCENTAGE OF URBANISED POPULATION BY REGION AND PER CAPITA INCOME IN SELECTED
COUNTRIES .................................................................................................................................................. 1-1
TABLE 1.2: PROJECT OUTPUT AND DELIVERABLES .............................................................................................. 1-4
TABLE 2.1: ADMINISTRATION OF KIAMBU COUNTY ............................................................................................. 2-2
TABLE 2.2: COUNTY ASSEMBLY WARDS IN THIKA TOWN CONSTITUENCY .......................................................... 2-2
TABLE 2.3: POPULATION GROWTH OF THIKA TOWN AND KENYA ........................................................................ 2-7
TABLE 2.4: POPULATION OF THIKA TOWN PLANNING AND AREA ........................................................................ 2-8
TABLE 2.5: URBAN PROPORTION OF POPULATION IN KENYA ............................................................................... 2-8
TABLE 2.6: HOUSEHOLD SIZE ............................................................................................................................... 2-8
TABLE 2.7: HOUSEHOLD SIZE AND NON-RESIDENT CHILDREN ............................................................................. 2-9
TABLE 2.8: REASON FOR CHILDREN BEING AWAY FROM HOME ............................................................................ 2-9
TABLE 2.9: PERCENTAGE OF EMPLOYED POPULATION TO THE TOTAL LABOUR FORCE POPULATION ................ 2-10
TABLE 2.10: PER CAPITA INCOME (USD) ........................................................................................................... 2-10
TABLE 2.11: POVERTY STATUS OF REPRESENTATIVE DISTRICT.......................................................................... 2-10
Consultancy Services for Digital Topographical Mapping and the Preparation of Integrated Strategic Urban
Development Plans for Cluster III Towns-Thika
x
TABLE 2.12: SINGLE BUSINESS PERMIT: COLLECTION PERFORMANCE COUNTY GOVERNMENT OF THIKA SUB-
COUNTY); YEAR: 2013 (AMOUNT IN KSH. MILLION)................................................................................. 2-12
TABLE 2.13: POPULATION AND DISTANCE FROM NAIROBI OF URBAN CENTRES .................................................. 2-17
TABLE 2.14: ALTERNATIVE POPULATION PROJECTIONS ...................................................................................... 2-18
TABLE 2.15 EXISTING LAND USE ........................................................................................................................ 2-19
TABLE 2.16: PROJECTED LAND REQUIREMENTS (HA) ......................................................................................... 2-20
TABLE 4.1: LAND USE OF DEVELOPED AND UNDEVELOPED AREA OF THIKA TOWN PLANNING AREA AND
COMPARISON WITH AVERAGE LAND USE OF TEN TOWNS .............................................................................. 4-1
TABLE 4.2: COMPARISON OF LAND USE WITHIN THIKA TOWN PLANNING AREA (FIGURES IN %) WITH OTHER
TOWNS ......................................................................................................................................................... 4-5
TABLE 4.3: SUB-LOCATION POPULATION DENSITY ............................................................................................... 4-8
TABLE 4.4: PROPOSED POPULATION DENSITY AND LAND REQUIREMENTS .......................................................... 4-9
TABLE 4.5: ALTERNATIVE POPULATION PROJECTIONS ....................................................................................... 4-11
TABLE 4.6: EXISTING AND PROPOSED LAND USE OF THIKA PLANNING AREA ..................................................... 4-13
TABLE 5.1: SINGLE BUSINESS PERMIT: COLLECTION PERFORMANCE COUNTY GOVERNMENT OF THIKA SUB-
COUNTY); YEAR: 2013 (AMOUNT IN KSHS. MILLION) ................................................................................. 5-1
TABLE 5.2: LABOUR FORCE PARTICIPATION RATE (LFPR) AND EMPLOYED POPULATION .................................. 5-3
TABLE 5.3: ESTIMATED WAGE EMPLOYMENT ....................................................................................................... 5-3
TABLE 5.4: ECONOMIC FACILITIES: GAPS AND FUTURE DEMAND ......................................................................... 5-4
TABLE 5.5: ECONOMIC DEVELOPMENT: GOALS, STRATEGIES AND PROJECTS ........................................................ 5-5
TABLE 5.6: THEORETICAL DAILY WATER DEMAND (M3) ..................................................................................... 5-8
TABLE 5.7: EFFECTIVE DAILY FUTURE WATER DEMAND (M3) ............................................................................... 5-8
TABLE 5.8: GOALS, STRATEGIES AND PROJECTS FOR WATER SUPPLY ................................................................... 5-9
TABLE 5.9: THEORETICAL FUTURE DEMAND FOR SEWERAGE (M3) ...................................................................... 5-11
TABLE 5.10: EFFECTIVE FUTURE DEMAND FOR SEWERAGE (M3) ........................................................................ 5-11
TABLE 5.11: GOALS, STRATEGIES AND PROJECTS FOR SEWERAGE AND SANITATION .......................................... 5-11
TABLE 5.12: DEMAND AND GAP ASSESSMENT OF STORMWATER DRAINAGE (KM) .............................................. 5-15
TABLE 5.13: GOALS, STRATEGIES AND PROJECTS FOR STORM WATER DRAINAGE ............................................... 5-17
TABLE 5.14: SOLID WASTE GENERATION DEMAND ASSESSMENT ........................................................................ 5-19
TABLE 5.15: GOALS, STRATEGIES AND PROJECTS FOR SOLID WASTE MANAGEMENT .......................................... 5-21
TABLE 5.16: SUMMARY OF CURRENT FIRE SAFETY STATUS .............................................................................. 5-22
TABLE 5.17: DEMAND GAP ASSESSMENT OF FIRE SAFETY................................................................................. 5-22
TABLE 5.18: GOALS, STRATEGIES AND PROJECTS FOR FIRE FIGHTING ................................................................. 5-24
TABLE 5.19: STREET LIGHTING DEMAND AND GAP ASSESSMENT ...................................................................... 5-25
TABLE 5.20: GOALS, STRATEGIES AND PROJECTS FOR STREET LIGHTING ............................................................ 5-25
TABLE 5.21: TRAFFIC AND CAPACITY OF MAJOR TRUNK ROADS ......................................................................... 5-26
TABLE 5.22: PROJECTED TRAFFIC AND ROAD CAPACITY..................................................................................... 5-26
TABLE 5.23: PRIMARY DISTRIBUTOR ROADS ...................................................................................................... 5-27
TABLE 5.24: INTERSECTION CAPACITY ANALYSIS .............................................................................................. 5-28
TABLE 5.25: PARKING DEMAND ASSESSMENT IN CBD AREA OF THIKA ............................................................ 5-29
Consultancy Services for Digital Topographical Mapping and the Preparation of Integrated Strategic Urban
Development Plans for Cluster III Towns-Thika
xi
TABLE 5.26: EXISTING AND PROPOSED LANE CONFIGURATION OF MAJOR ROADS IN THIKA ............................. 5-31
TABLE 5.27: IMPROVEMENTS AT MAJOR INTERSECTIONS ................................................................................... 5-36
TABLE 5.28: BUS TERMINALS AND ROUTES ........................................................................................................ 5-39
TABLE 5.29: MATATU TERMINALS AND AREA COVERED BY ROUTES .................................................................. 5-43
TABLE 5.30: SCHOOL IN THIKA AREA (PUBLIC AND PRIVATE) ......................................................................... 5-50
TABLE 5.31: DEMAND SUPPLY GAP ASSESSMENT .............................................................................................. 5-52
TABLE 5.32: EDUCATIONAL FACILITIES - GOAL, STRATEGIES AND PROJECTS .................................................... 5-52
TABLE 5.33: HEALTH FACILITIES IN THIKA TOWN ............................................................................................. 5-53
TABLE 5.34: GUIDELINES FOR THE LOCATION OF HEALTH FACILITIES AT VARIOUS LEVELS OF CENTRES ..... 5-53
TABLE 5.35: DEMAND SUPPLY GAP ASSESSMENT AS PER NORMS OF PHYSICAL PLANNING HANDBOOK 2008
.................................................................................................................................................................. 5-53
TABLE 5.36: DEMAND SUPPLY GAP ASSESSMENT OF HEALTH FACILITIES AS PER PROPOSED NORMS ..... 5-55
TABLE 5.37: HEALTH FACILITIES - GOAL, STRATEGIES AND PROJECTS .............................................................. 5-55
TABLE 5.38: SOCIAL FACILITIES: GAPS AND FUTURE DEMAND ........................................................................... 5-56
TABLE 5.39: OTHER COMMUNITY FACILITIES - GOAL, STRATEGIES AND PROJECTS ........................................... 5-57
TABLE 5.40: RECREATIONAL FACILITIES: GAPS AND FUTURE DEMAND .............................................................. 5-60
TABLE 5.41: GOALS, STRATEGIES AND PROJECTS FOR THE ENVIRONMENT ......................................................... 5-66
TABLE 5.42: TYPES OF DISASTERS AND RANKING AS EXPERIENCED IN THE COLLEGES IN THIKA ...................... 5-69
TABLE 5.43: STRATEGIES FOR DISASTER MITIGATION ........................................................................................ 5-69
TABLE 5.44: GOALS, STRATEGIES AND PROJECTS FOR DISASTER MANAGEMENT .............................................. 5-75
TABLE 5.45: POTENTIAL TOURIST SITES ............................................................................................................. 5-77
TABLE 5.46: GOALS, STRATEGIES AND PROJECTS FOR TOURISM AND HERITAGE DEVELOPMENT ........................ 5-79
TABLE 5.47: URBAN INCOMES ............................................................................................................................ 5-81
TABLE 5.48; HOUSING AFFORDABILITY BY INCOME GROUP ................................................................................ 5-82
TABLE 5.49: AFFORDABLE LOANS BY INCOME GROUP ........................................................................................ 5-83
TABLE 5.50: COST OF DIFFERENT SOLUTIONS (KSHS) ......................................................................................... 5-83
TABLE 5.51: SPACE REQUIREMENTS PER 1000 DWELLINGS ................................................................................ 5-83
TABLE 5.52: HOUSING DEMAND BY INCOME GROUP .......................................................................................... 5-84
TABLE 5.53: LAND REQUIRED FOR HOUSING BY INCOME GROUP ........................................................................ 5-84
TABLE 5.54: INFRASTRUCTURE REQUIREMENTS PER TEN YEAR PERIOD (IN KM) ................................................ 5-84
TABLE 5.55: GOALS, STRATEGIES AND PROJECTS FOR HOUSING ........................................................................ 5-84
TABLE 5.56: GOALS, STRATEGIES AND PROJECTS FOR INFORMAL SETTLEMENTS ............................................... 5-87
TABLE 5.57: GOALS, STRATEGIES AND PROJECTS FOR INSTITUTIONAL SET-UP .................................................. 5-88
TABLE 5.58: GOALS, STRATEGIES AND PROJECTS FOR FINANCIAL MANAGEMENT .............................................. 5-89
TABLE 6.1: BASIC INFORMATION ABOUT KIANDUTU ............................................................................................ 6-6
TABLE 6.2: PLOT COVERAGE, RESIDENTIAL DENSITY, PLOT RATIO AND POPULATION TO BE ACCOMMODATED..... 6-9
TABLE 6.3: RECOMMENDED ROAD DESIGN .......................................................................................................... 6-9
TABLE 6.4: COMMUNITY FACILITIES IN KIANDUTU ............................................................................................ 6-10
TABLE 6.5: DETAIL OF COUNTY ESTATES ........................................................................................................... 6-15
TABLE 6.6: BASIC CALCULATION FOR LAND REQUIREMENT FOR REDEVELOPMENT OF BONDENI ESTATE .......... 6-19
Consultancy Services for Digital Topographical Mapping and the Preparation of Integrated Strategic Urban
Development Plans for Cluster III Towns-Thika
xii
TABLE 7.1: PLOT COVERAGE, RESIDENTIAL DENSITY AND PLOT RATIO ............................................................ 7-11
TABLE 7.2: PLOT SIZE, PLOT COVERAGE AND PLOT RATIO ................................................................................ 7-12
TABLE 7.3: GENERAL GUIDELINE FOR PLOT COVERAGE, RESIDENTIAL DENSITY AND PLOT RATIO ................... 7-13
TABLE 7.4: LAND USE ZONES AND REGULATIONS FOR INDUSTRIAL USES ........................................................... 7-15
TABLE 7.5: LAND USE ZONES AND REGULATIONS FOR EDUCATIONAL USES ........................................................ 7-16
TABLE 7.6: LAND USE ZONES AND REGULATIONS FOR RECREATIONAL USES ...................................................... 7-17
TABLE 7.7: LAND USE ZONES AND REGULATIONS FOR PUBLIC PURPOSE FACILITIES ........................................... 7-17
TABLE 7.8: GENERAL GUIDELINES FOR LAND USE ZONES AND REGULATIONS FOR COMMERCIAL AREAS ........... 7-18
TABLE 7.9: ZONING REGULATION FOR COMMERCIAL DEVELOPMENT ................................................................. 7-18
TABLE 7.10: LAND USE ZONES AND REGULATIONS FOR TRANSPORTATION FACILITIES ....................................... 7-20
TABLE 7.11: FARM SIZE, COVERAGE AND PERMISSIBLE ACTIVITIES .................................................................... 7-20
TABLE 7.12: LAND USE ZONES AND REGULATIONS FOR CONSERVATION AREAS ................................................. 7-21
TABLE 7.13: GENERAL CAR PARKING NORMS ................................................................................................... 7-21
TABLE 8.1: ECONOMIC DEVELOPMENT IMPLEMENTATION PLAN ........................................................................... 8-2
TABLE 8.2: ENVIRONMENTAL PROJECTS IMPLEMENTATION PLAN ........................................................................ 8-4
TABLE 8.3: DISASTER MANAGEMENT IMPLEMENTATION PLAN ............................................................................. 8-6
TABLE 8.4: TOURISM AND HERITAGE PROJECT IMPLEMENTATION PLAN ............................................................... 8-8
TABLE 8.5: WATER SUPPLY PROJECTS IMPLEMENTATION PLAN ............................................................................ 8-9
TABLE 8.6: SEWERAGE AND SANITATION PROJECTS IMPLEMENTATION PLAN ..................................................... 8-10
TABLE 8.7: STORM WATER DRAINAGE PROJECTS IMPLEMENTATION PLAN.......................................................... 8-11
TABLE 8.8: SOLID WASTE MANAGEMENT PROJECTS IMPLEMENTATION PLAN ..................................................... 8-12
TABLE 8.9: ROAD AND TRANSPORT SYSTEM IMPLEMENTATION PLAN ............................................................... 8-13
TABLE 8.10: JUNCTION IMPROVEMENT IMPLEMENTATION PLAN ....................................................................... 8-14
TABLE 8.11: FIRE FIGHTING PROJECTS IMPLEMENTATION PLAN ......................................................................... 8-15
TABLE 8.12: STREET LIGHTING PROJECTS IMPLEMENTATION PLAN .................................................................... 8-16
TABLE 8.13: INSTITUTIONAL DEVELOPMENT IMPLEMENTATION PLAN ................................................................ 8-16
TABLE 8.14: FINANCIAL MANAGEMENT IMPLEMENTATION PLAN ....................................................................... 8-18
TABLE 8.15 THIKA SUB-COUNTY – REVENUE SOURCES AND YIELDS IN 2013/14 ............................................... 8-23
TABLE 8.16: THIKA TOWN SUB-COUNTY – OWN REVENUE COLLECTION EFFICIENCY IN 2013/14 ...................... 8-23
TABLE 8.17: THIKA TOWN 1991 VALUATION ROLL SUMMARY AND RATES REVENUE POTENTIAL.................... 8-24
List of Figures FIGURE 1.1: PREPARATION OF DIGITAL TOPOGRAPHICAL MAPPING AND INTEGRATED STRATEGIC URBAN
DEVELOPMENT PLANS FOR CLUSTER III TOWN: THIKA ............................................................................... 1-8
FIGURE 2.1: CLIMATIC CONDITION OF THIKA TOWN ............................................................................................ 2-4
FIGURE 2.2: LOCATION OF KIAMBU COUNTY IN KENYA ...................................................................................... 2-5
FIGURE 2.3: REGIONAL SETTING OF THIKA TOWN ............................................................................................... 2-6
FIGURE 2.4: LOCATION OF THIKA TOWN WITHIN KIAMBU COUNTY ..................................................................... 2-7
FIGURE 2.5: THIKA POPULATION GROWTH 1969-2009 ........................................................................................ 2-14
FIGURE 2.6: THIKA POPULATION PROJECTIONS: NATURAL INCREASE ONLY ........................................................ 2-15
FIGURE 2.7: PERCENTAGE OF URBAN TO TOTAL POPULATION, KENYA ............................................................... 2-16
Consultancy Services for Digital Topographical Mapping and the Preparation of Integrated Strategic Urban
Development Plans for Cluster III Towns-Thika
xiii
FIGURE 2.8 KENYA URBAN GROWTH ................................................................................................................. 2-16
FIGURE 2.9: ALTERNATIVE POPULATION PROJECTIONS ...................................................................................... 2-18
FIGURE 2.10 LAND REQUIREMENTS PROJECTION ................................................................................................ 2-20
FIGURE 3.1: REGIONAL SETTING OF THIKA TOWN (WITHIN 135KM RADIUS) ....................................................... 3-2
FIGURE 3.2: REGIONAL SETTING OF THIKA TOWN WITHIN NAIROBI METROPOLITAN REGION ............................. 3-3
FIGURE 3.3: REGIONAL LINKAGES OF THIKA TOWN ............................................................................................. 3-4
FIGURE 3.4: DEVELOPMENT POTENTIAL AND CONSTRAINTS ................................................................................ 3-5
FIGURE 3.5: DIRECTION OF GROWTH .................................................................................................................... 3-5
FIGURE 3.6: ENVIRONMENTAL SENSITIVITY AND LAND SUITABILITY MAP .......................................................... 3-6
FIGURE 3.7: DIGITAL ELEVATION MODEL ............................................................................................................ 3-7
FIGURE 3.8: SCHEMATIC DIAGRAM PLANNING HIERARCHIES .............................................................................. 3-17
FIGURE 3.9: DIVISION OF TOWN INTO PLANNING SECTORS (SUB-TOWN LEVEL PLANNING DIVISION) ................ 3-18
FIGURE 4.1: EXISTING LAND USE .......................................................................................................................... 4-3
FIGURE 4.2: PROPOSED TOWN BOUNDARY EXTENSION ................................................................................ 4-10
FIGURE 4.3: LAND USE PLAN ............................................................................................................................. 4-14
FIGURE 4.4: EXISTING AND PLANNED RESIDENTIAL AREAS ............................................................................... 4-16
FIGURE 4.5: EXISTING AND PLANNED INDUSTRIAL AREAS ................................................................................ 4-18
FIGURE 4.6: EXISTING AND PROPOSED EDUCATIONAL AREAS ............................................................................. 4-19
FIGURE 4.7: EXISTING AND PROPOSED RECREATIONAL AREA ........................................................................... 4-20
FIGURE 4.8: EXISTING AND PROPOSED PUBLIC PURPOSES AREAS ........................................................................ 4-21
FIGURE 4.9: EXISTING AND PROPOSED COMMERCIAL AREAS ............................................................................. 4-22
FIGURE 4.10: EXISTING AND PLANNED PUBLIC UTILITIES ................................................................................... 4-23
FIGURE 4.11: EXISTING AND PROPOSED TRANSPORTATION AREAS ..................................................................... 4-24
FIGURE 5.1: EXISTING WATER SOURCES ............................................................................................................... 5-7
FIGURE 5.2: EXISTING WATER RETICULATION ..................................................................................................... 5-7
FIGURE 5.3: PLANNED WATER RETICULATION .................................................................................................... 5-10
FIGURE 5.4: SEWERAGE COVERAGE .................................................................................................................... 5-13
FIGURE 5.5: PLANNED SEWER RETICULATION .................................................................................................... 5-14
FIGURE 5.6: EXISTING STORM WATER DRAINAGE ............................................................................................... 5-16
FIGURE 5.7: PLANNED STORMWATER DRAINAGE ............................................................................................... 5-18
FIGURE 5.8: WASTE COLLECTION POINTS ........................................................................................................... 5-20
FIGURE 5.9: FIRE HYDRANTS COVERAGE ........................................................................................................... 5-23
FIGURE 5.10: STREET LIGHTING COVERAGE ....................................................................................................... 5-25
FIGURE 5.11: TYPICAL ROAD CROSS SECTION OF A 30M WIDE ROAD ................................................................. 5-32
FIGURE 5.12: ROADS REQUIRING WIDENING ....................................................................................................... 5-33
FIGURE 5.13: HAILE SELASSIE ROAD AND BLUE POST INTERCHANGE IN THIKA ................................................ 5-34
FIGURE 5.14: PROPOSED BYPASS ROADS ........................................................................................................... 5-35
FIGURE 5.15: TYPICAL CROSS SECTIONS OF A 40 METRE WIDE BYPASS ROAD ..................................................... 5-36
FIGURE 5.16: PROPOSED INTERSECTION IMPROVEMENTS ................................................................................... 5-37
FIGURE 5.17: THIKA INTERCHANGE IMPROVEMENTS ......................................................................................... 5-38
Consultancy Services for Digital Topographical Mapping and the Preparation of Integrated Strategic Urban
Development Plans for Cluster III Towns-Thika
xiv
FIGURE 5-18 : VIEWS OF PROPOSED PEDESTRIAN FACILITIES............................................................................. 5-38
FIGURE 5.19: VIEWS OF PROPOSED NMT FACILITIES ......................................................................................... 5-39
FIGURE 5.20: BUS TERMINAL AND BUS DEPOT LOCATIONS ................................................................................. 5-40
FIGURE 5.21: NEW ACCESS ROUTE FOR GATITU BUS STATION ........................................................................... 5-41
FIGURE 5.22: VIEW OF TYPICAL BUS TERMINAL AND BUS DEPOT ........................................................................ 5-41
FIGURE 5.23: VIEW OF TYPICAL BUS SHELTER .................................................................................................... 5-42
FIGURE 5.24: PLANNED MATATU STATION LOCATIONS ....................................................................................... 5-42
FIGURE 5.25: VIEW OF TYPICAL MATATU TERMINAL ........................................................................................ 5-43
FIGURE 5.26: PROPOSED TRUCK TERMINAL AND LOGISTIC CENTRE LOCATIONS ................................................. 5-44
FIGURE 5.27: VIEW OF TYPICAL TRUCK TERMINAL AND LOGISTIC PARK .......................................................... 5-44
FIGURE 5.28: VIEW OF A CITY BUS SYSTEM IN INDORE, INDIA AND BRT SYSTEM IN BEIJING, CHINA ............... 5-45
FIGURE 5.29: TRAFFIC MANAGEMENT SCHEMES FOR ROADS AROUND CBD ..................................................... 5-46
FIGURE 5.30: LOCATION OF MULTI-STOREY CAR PARK (WITHIN CBD AREA) ..................................................... 5-47
FIGURE 5.31: LOCATION OF THIKA RAILWAY STATION AND VIEW OF A COMMUTER RAIL STATION ................... 5-47
FIGURE 5.32: ISIOLO-NAIROBI LAPSSET CORRIDOR AND LOCATION OF THIKA ................................................ 5-48
FIGURE 5.33: EXISTING AND PROPOSED TRANSPORTATION FACILITIES ............................................................... 5-49
FIGURE 5.34: EXISTING EDUCATION FACILITIES ................................................................................................. 5-51
FIGURE 5.35: EXISTING HEALTH FACILITIES ....................................................................................................... 5-54
FIGURE 5.36: ENVIRONMENTALLY SENSITIVE AREAS AND EXISTING LAND USE .................................................. 5-62
FIGURE 5.37: ENVIRONMENTALLY SENSITIVE AREAS ......................................................................................... 5-63
FIGURE 5.38: PLANNED GREEN/ RECREATIONAL AREAS, PLANTATIONS AND RIPARIAN RESERVES...................... 5-65
FIGURE 5.39: SEISMIC ZONES IN KENYA ............................................................................................................. 5-71
FIGURE 5.40: SEISMIC DISTRIBUTION MAP AND HAZARDS LEVEL ..................................................................... 5-72
FIGURE 5.41: EARTHQUAKE CONTOUR MAP ...................................................................................................... 5-73
FIGURE 5.42: TOURIST AND HERITAGE SITES ...................................................................................................... 5-78
FIGURE 6.1: LOCATION OF THE CBD WITHIN THE THIKA PLANNING AREA .......................................................... 6-1
FIGURE 6.2: EXISTING LAND USE IN THIKA CBD .................................................................................................. 6-2
FIGURE 6.3: PEDESTRIANISED ROADS AND REVISED TRAFFIC CIRCULATION WITHIN CBD AREA .......................... 6-3
FIGURE 6.4: RECOMMENDED DEVELOPMENT WITHIN CBD AREA ........................................................................ 6-4
FIGURE 6.5: RECOMMENDED DEVELOPMENT WITHIN CBD AREA (3DIMENSIONAL VIEW) ................................... 6-5
FIGURE 6.6: LOCATION OF KIANDUTU INFORMAL SETTLEMENT ........................................................................ 6-7
FIGURE 6.7: EXISTING LAND USE OF KIANDUTU INFORMAL SETTLEMENT ........................................................... 6-8
FIGURE 6.8: RECOMMENDED ROAD HIERARCHY ................................................................................................ 6-10
FIGURE 6.9: LOCATION OF GATITU JUNCTION .................................................................................................... 6-11
FIGURE 6.10: PROPOSED GATITU JUNCTION ....................................................................................................... 6-13
FIGURE 6.11: ILLUSTRATION OF AN UNDERPASS AS EXTENSION OF KENYATTA HIGHWAY AT GATITU JUNCTION .. 6-
13
FIGURE 6.12: UNDERPASS AND THROUGH ROAD................................................................................................. 6-14
FIGURE 6.13: FLYOVER CROSSING A THOROUGHFARE ....................................................................................... 6-14
FIGURE 6.14: LOCATION OF THE COUNTY ESTATES WITHIN THE THIKA PLANNING AREA .................................. 6-16
Consultancy Services for Digital Topographical Mapping and the Preparation of Integrated Strategic Urban
Development Plans for Cluster III Towns-Thika
xv
FIGURE 6.15: EXISTING LAND USE IN COUNTY ESTATES ..................................................................................... 6-17
FIGURE 6.16: BROAD REDEVELOPMENT PLAN OF BONDENI ESTATE .................................................................. 6-20
FIGURE 6.17: LOCATION OF RIVER FRONT DEVELOPMENT SITES ....................................................................... 6-22
FIGURE 6.18: EXISTING LAND USE OF RIVER FRONT DEVELOPMENT SITE ON KAMUGUTI RIVER ...................... 6-23
FIGURE 6.19: RECOMMENDED BROAD PLAN OF KAMUGUTI RIVER SITE DEVELOPMENT ................................... 6-25
FIGURE 7.1: PROCEDURE TO ASSESS DEVELOPMENT APPLICATION IN TERMS OF SUBDIVISION .............................. 7-6
FIGURE 7.2: PROCEDURE TO ASSESS DEVELOPMENT APPLICATION IN TERMS OF CHANGE OF USE ......................... 7-7
List of Abbreviations
BAT : British American Tobbacco
BPO : Business Process Outsourcing
BRT : Bus Rapid Transit
CBD : Central Business District
CBOs : Community Based Organization
CDF : Constituency Development Fund
CEC : County Executive Committee
CIP : Capital Investment Plan
CIP : Capital Investment Plan
DA : Development Authority
DRPs : Detailed Project Reports
DTM : Digital Terrain Model
ECD : Early Childhood Development
EIA : Environmental Impact Assessment
EMCA : Environmental Management and Coordination Act
EMCA : Environmental Management and Coordination Act
EPZ : export processing zones
FGDs : Focussed Group Discussions
GDP : Gross Domestic Product
GHG : Green House Gases
GIS : Geographical Information System
H.E : His Excellency
Ha : Hactre
ICT : Information and Communication Technology
IDA : International Development Association
IDA : International Development Association
ISUDP : Intergrated Strategic Urban Development Plan
KCDMC : Kiambu County Disaster Management Committee
KDF : Kenya Defence Force
KISIP : Kenya Informal Settlements Improvement Program
km2
: Kilimeter
KMP : Kenya Municipal Programme
KNBS : Kenya National Bureau of Statistics
LAPSET : Lamu Port-Southern Sudan-Ethiopia Transport
LCDA : LAPSSET Corridor Development Authority
LED : Local Economic Development
LFPR : Labour Force Participation Rate
Consultancy Services for Digital Topographical Mapping and the Preparation of Integrated Strategic Urban
Development Plans for Cluster III Towns-Thika
xvi
LIMS : Land Information Management System
LPDPs : Local Physical Development Plans
M2 : Metre Squared
MCAs : Members of County Assembly
MDGs : Millennium Development Goals
MEAs : Multi-lateral Environmental Agreements
mm : Millimeter
MOU : Memorandum Of Understanding
NEAP : National Environmental Action Plan
NEC : National Environment Council
NEMA : National Environment Management Authority
NGOs : Non-Governmental Organizations
NGOs : Non-Government Organizations
NMR : Nairobi Metropolitan Region
NMT : Non Motorised Transport
NORC’ : National Opinion Research Center
OOP : Otieno Odongo and Partners
PDPs : Part Development Plans
PPPs : Public Private Partnerships
PVC : Polyvinyl chloride
SACCOs : Savings And Credit Cooperative Organization
SEA : Strategic Environmental Assessment
SWOT : Strength Weakness Opportunities and Threats
TDA : Town Development Agency
THWASCO : Thika Water Supply and Sanitation Company
TOD : Transit Oriented Development
UDD : Urban Development Department
UNDP : United nations Development Programme
UNEP : United Nations Environment Programme
US : United State
US$ : United State Dollar
USAID : United States Agency for International Development
USD : United State Dollar
VCT : Voluntary Counselling & Testing
VIP : Ventilated Improved Pit
WC : Water Closet
WFPR : Work Force Participation Rate
WRMA : Water Resources Management Act
WTSF : Water Service Trust Fund
WWII : World War II
Y.M.C.A : Young Men's Christian Association
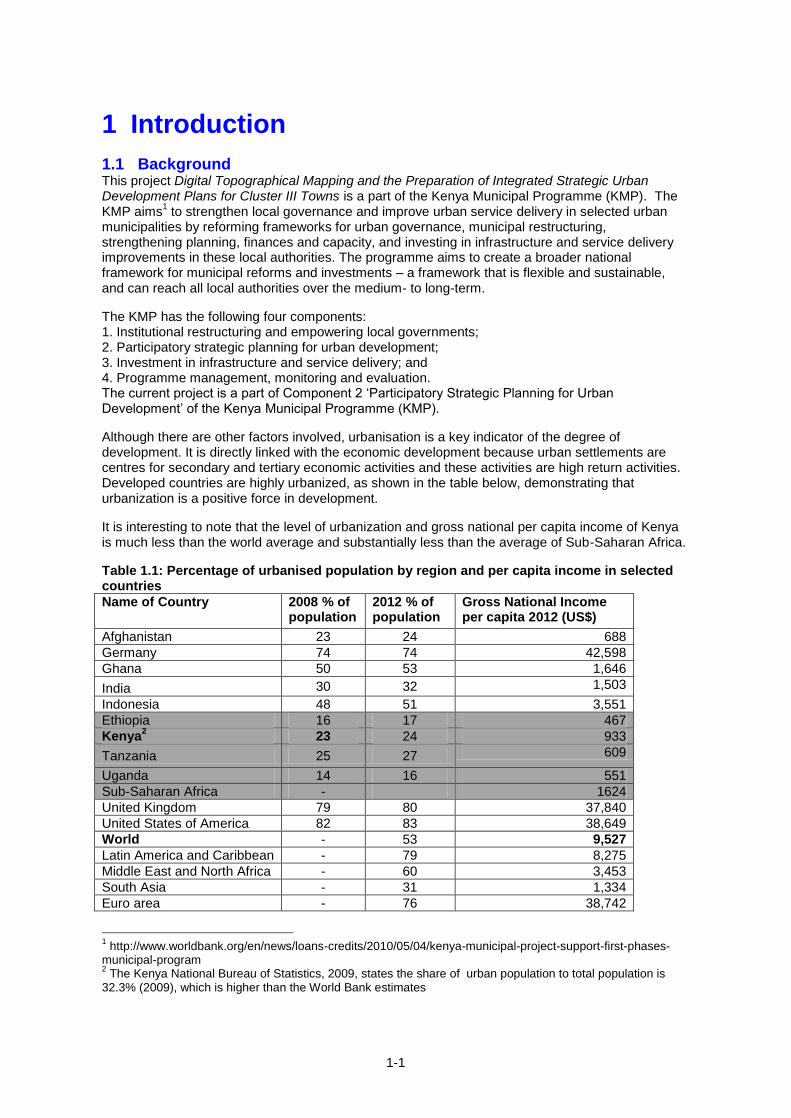
Consultancy Services for Digital Topographical Mapping and the Preparation of Integrated Strategic Urban Development Plans for Cluster III Towns-Thika
1-1
1 Introduction
1.1 Background This project Digital Topographical Mapping and the Preparation of Integrated Strategic Urban Development Plans for Cluster III Towns is a part of the Kenya Municipal Programme (KMP). The KMP aims
1 to strengthen local governance and improve urban service delivery in selected urban
municipalities by reforming frameworks for urban governance, municipal restructuring, strengthening planning, finances and capacity, and investing in infrastructure and service delivery improvements in these local authorities. The programme aims to create a broader national framework for municipal reforms and investments – a framework that is flexible and sustainable, and can reach all local authorities over the medium- to long-term.
The KMP has the following four components: 1. Institutional restructuring and empowering local governments; 2. Participatory strategic planning for urban development; 3. Investment in infrastructure and service delivery; and 4. Programme management, monitoring and evaluation. The current project is a part of Component 2 ‗Participatory Strategic Planning for Urban Development‘ of the Kenya Municipal Programme (KMP).
Although there are other factors involved, urbanisation is a key indicator of the degree of development. It is directly linked with the economic development because urban settlements are centres for secondary and tertiary economic activities and these activities are high return activities. Developed countries are highly urbanized, as shown in the table below, demonstrating that urbanization is a positive force in development.
It is interesting to note that the level of urbanization and gross national per capita income of Kenya is much less than the world average and substantially less than the average of Sub-Saharan Africa.
Table 1.1: Percentage of urbanised population by region and per capita income in selected countries
Name of Country 2008 % of population
2012 % of population
Gross National Income per capita 2012 (US$)
Afghanistan 23 24 688
Germany 74 74 42,598
Ghana 50 53 1,646
India 30 32 1,503
Indonesia 48 51 3,551
Ethiopia 16 17 467
Kenya2 23 24 933
Tanzania 25 27 609
Uganda 14 16 551
Sub-Saharan Africa - 1624
United Kingdom 79 80 37,840
United States of America 82 83 38,649
World - 53 9,527
Latin America and Caribbean - 79 8,275
Middle East and North Africa - 60 3,453
South Asia - 31 1,334
Euro area - 76 38,742
1 http://www.worldbank.org/en/news/loans-credits/2010/05/04/kenya-municipal-project-support-first-phases-
municipal-program 2 The Kenya National Bureau of Statistics, 2009, states the share of urban population to total population is
32.3% (2009), which is higher than the World Bank estimates
Consultancy Services for Digital Topographical Mapping and the Preparation of Integrated Strategic Urban Development Plans for Cluster III Towns-Thika
1-2
Source: http://wdi.worldbank.org/table/3.12# and http://data.worldbank.org/indicator/NY.GDP.PCAP.CD
The above table indicates that Kenya is relatively low in the urbanization scale. Per capita income is correlated with the level of urbanisation which is an important component of economic development. Per capita income increases with the increase in level of urbanisation because the type of economic activities (manufacturing, trade, services, etc.) in urban areas are more productive than the type of economic activities in rural areas (agriculture, forestry, fishing, etc.). Apart from a low level of urbanization, urban settlements in Kenya face many problems such as:
Very low planning capacities terms of staff, technology, equipment and space
Unplanned growth of urban settlements,
Urban sprawl and unsustainable urban growth,
Inadequate provision of infrastructure and services, like roads, water supply, sanitation, electricity, recreational facilities, parking facilities, housing, etc.
Illegal sub-divisions
Growth of informal markets
High rate of unemployment
Inadequate co-ordination among various agencies working in the urban settlements,
Lack of integrated development.
Inadequate capacity of urban authorities to deal with the fast urban expansion
Lack of employment opportunities
Mushrooming of informal settlements
Crime and social distress To address the abovementioned problems and issues, there is an urgent need to integrate physical, economic, social, cultural, and environmental as well as institutional aspects and tap the inherent potential of towns. The integrated strategic urban development plan will be required to attract investments for enhanced revenue collection, growth and development.
To resolve the abovementioned issues and prepare an Integrated Strategic Urban Development Plan (ISUDPs) for Cluster III Town: Machakos, Embu and Thika, the Government of Kenya has received a credit from the International Development Association (IDA) for the implementation of the Kenya Municipal Programme (KMP).
Implementation of the contract for Digital Topographical Mapping and the Preparation of Integrated Strategic Urban Development Plans for Cluster III Towns is intended to help achieve the Kenya‘s Vision 2030. The Kenya 2030 Vision for housing and urbanization is ―an adequately and decently-housed nation in a sustainable environment, which will be attained by preparing and implementing strategic development and investment plans in major urban areas, implementing a decentralization policy, and strengthening local level planning and development departments in local administrations among other initiatives
3‖.
For the Digital Topographical Mapping and the Preparation of Integrated Strategic Urban Development Plans for Cluster III Towns of Machakos, Embu and Thika, the Ministry of Land, Housing and Urban Development, Government of Kenya, appointed Intercontinental Consultants and Technocrats Pvt. Ltd, New Delhi, India in association with Otieno Odongo and Partners (OOP), Kenya and GEODEV (K) Ltd, Kenya.
1.2 Purpose of the ISUDP The purpose of the integrated strategic urban development plan is to:
Define a vision for future growth and development of the areas over the next 10 to 20 years. Overall vision based on ground realities and ethos of the town is to be prepared for midterm (10 year) and long term (20 year).
Provide an overall integrated physical framework for urban growth of the three towns. After digital topographic mapping of the planning areas of three towns and detailed
3 Project Appraisal Document, World Bank,
http://documents.worldbank.org/curated/en/2010/04/12085837/kenya-municipal-program-project.
Consultancy Services for Digital Topographical Mapping and the Preparation of Integrated Strategic Urban Development Plans for Cluster III Towns-Thika
1-3
analysis of existing situation, an overall integrated physical framework is to be prepared to fulfil the current and future requirements.
Provide a basis for co-ordinated programming of projects and budget, thereby serving as a downstream management tool. A realistic implementation plan is also to be prepared for all identified projects along with a capital investment plan.
1.3 Appreciation of ISUDP’s Objectives The main objectives of the assignment are:
To produce accurate up-to-date digital topographic maps
To prepare digital cadastral layers in the same system as the digital topo maps.
To conduct participatory planning exercises in the municipality to identify citizens‘ priorities.
To prepare medium and long term plans to guide urban development, including action area plans, subject plans, advisory or zoning plans and regulations and other reference materials.
To prepare strategic structure plans, showing current and proposed land use and infrastructure
To prepare an Integrated Strategic Urban Development (ISUD) Plan.
To prepare a Capital Investment Plan (CIP).
To provide hands-on training to key staff of the planning department on plan preparation and implementation.
To prepare a monitoring and evaluation strategy to assist the planning department to review and update the plan in line with the ever-changing trends of the city. .
1.4 Scope of Work The scope of work includes Digital Topographical Mapping and the Preparation of Integrated Strategic Urban Development Plans for Cluster III Towns, namely Machakos, Thika and Embu, covering a total area of 739.259 km
2. This report concerns only Thika.
The Thika Planning Area, as agreed with Kiambu County is 113 km2.
The main scope of work of the consultancy is:
Digital Topographical Mapping4
o Preparation of an up-to-date accurate digital topographical map o Placing of acceptable permanent (monumented) and accurate ground control o Ground control survey data o Digitization of all cadastral maps of all registered parcels o Digital Terrain Model (DTM) o A situational analysis of the current socio-economic, physical, environmental and
cultural characteristics of the city
ISUDP
o Formulation of a City Vision o Structure plan with detailed land use and zoning regulations o Strategic Sector Plans:
Transportation Plan Environmental Management Plan Disaster Management Plan Cultural Heritage Conservation Plan
o Development of planning policies and zoning regulations o Capital Investment Plan o Training
It may be noted that though components of Digital Topographic Mapping and ISUDP are mentioned separately these two components are not isolated from each other and are integrated in terms of the analysis and outputs.
1.5 Duration of the work
Under the TOR an implementation period of twelve months was allowed. However, due to delays in
4 Digital Topographical Mapping includes collection of relevant data through survey and as well as mapping
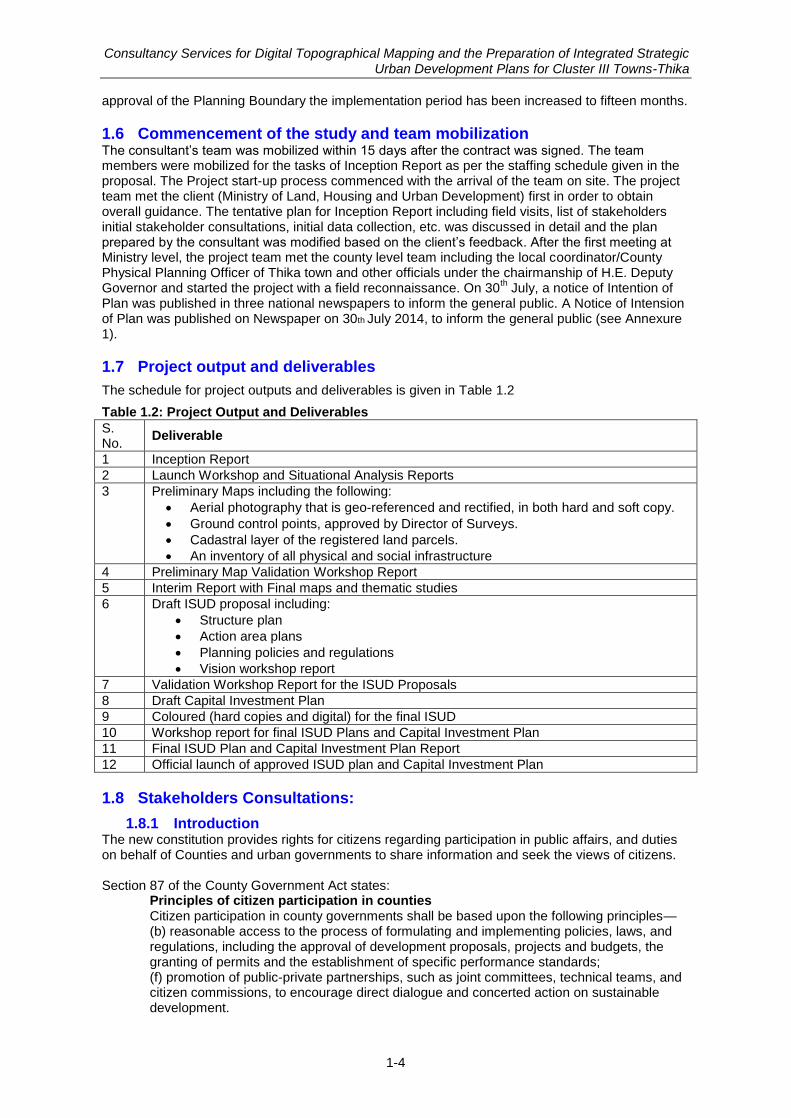
Consultancy Services for Digital Topographical Mapping and the Preparation of Integrated Strategic Urban Development Plans for Cluster III Towns-Thika
1-4
approval of the Planning Boundary the implementation period has been increased to fifteen months.
1.6 Commencement of the study and team mobilization The consultant‘s team was mobilized within 15 days after the contract was signed. The team members were mobilized for the tasks of Inception Report as per the staffing schedule given in the proposal. The Project start-up process commenced with the arrival of the team on site. The project team met the client (Ministry of Land, Housing and Urban Development) first in order to obtain overall guidance. The tentative plan for Inception Report including field visits, list of stakeholders initial stakeholder consultations, initial data collection, etc. was discussed in detail and the plan prepared by the consultant was modified based on the client‘s feedback. After the first meeting at Ministry level, the project team met the county level team including the local coordinator/County Physical Planning Officer of Thika town and other officials under the chairmanship of H.E. Deputy Governor and started the project with a field reconnaissance. On 30
th July, a notice of Intention of
Plan was published in three national newspapers to inform the general public. A Notice of Intension of Plan was published on Newspaper on 30th July 2014, to inform the general public (see Annexure 1).
1.7 Project output and deliverables
The schedule for project outputs and deliverables is given in Table 1.2
Table 1.2: Project Output and Deliverables
S. No.
Deliverable
1 Inception Report
2 Launch Workshop and Situational Analysis Reports
3 Preliminary Maps including the following:
Aerial photography that is geo-referenced and rectified, in both hard and soft copy.
Ground control points, approved by Director of Surveys.
Cadastral layer of the registered land parcels.
An inventory of all physical and social infrastructure
4 Preliminary Map Validation Workshop Report
5 Interim Report with Final maps and thematic studies
6 Draft ISUD proposal including:
Structure plan
Action area plans
Planning policies and regulations
Vision workshop report
7 Validation Workshop Report for the ISUD Proposals
8 Draft Capital Investment Plan
9 Coloured (hard copies and digital) for the final ISUD
10 Workshop report for final ISUD Plans and Capital Investment Plan
11 Final ISUD Plan and Capital Investment Plan Report
12 Official launch of approved ISUD plan and Capital Investment Plan
1.8 Stakeholders Consultations:
1.8.1 Introduction The new constitution provides rights for citizens regarding participation in public affairs, and duties on behalf of Counties and urban governments to share information and seek the views of citizens. Section 87 of the County Government Act states:
Principles of citizen participation in counties Citizen participation in county governments shall be based upon the following principles— (b) reasonable access to the process of formulating and implementing policies, laws, and regulations, including the approval of development proposals, projects and budgets, the granting of permits and the establishment of specific performance standards; (f) promotion of public-private partnerships, such as joint committees, technical teams, and citizen commissions, to encourage direct dialogue and concerted action on sustainable development.
Consultancy Services for Digital Topographical Mapping and the Preparation of Integrated Strategic Urban Development Plans for Cluster III Towns-Thika
1-5
In the context of physical planning, stakeholders‘ participation through face-to-face meetings, discussion and focus groups provides planners with insights and information regarding community needs, and promotes public understanding of the project. Consultation during the project preparation stage as an integral part of the social assessment process not only minimizes the risks and unwanted propaganda against the project but also removes the gap between the community and the project formulators, which helps in the timely completion of the project and makes the project people-friendly. The main purpose of the stakeholder consultation process is to build consensus among key stakeholders.
Stakeholders have been involved through meetings and interviews to gauge the situation in terms of urban infrastructure, services, overall management etc. The key stakeholders of the town have been identified as:
Primary stakeholders, beneficiaries of a development intervention or those directly affected (positively or negatively) by it. They include resource persons, community leaders, resident association, squatters and slum dwellers, religious leaders, trader‘s organizations, transporters, etc. in the planning area
Secondary stakeholders, those who influence a development intervention or are indirectly affected by it. They include the project staff, implementing agencies, local governments, private sector firms, and other development agencies.
1.8.2 Identification of Stakeholders The following categories were identified for stakeholder consultations:
Elected Representatives
Government Officials
Religious organizations (Christian, Muslim, others)
Community Based Organizations (CBOs)
Non-Governmental Organizations (NGOs)
Chamber of Commerce and Industries
Citizen forums/association of Informal areas/ urban poor/ slums
Activists (working in the fields of human rights, livelihood, etc.)
Eminent citizens
Youth association
Women‘s association
Matatu association
Biker‘s association
Others The identified stakeholders were consulted in the form of focussed group discussion as well individual interviews. A complete check list of identified stakeholders was prepared for general consultation and for the purpose of workshops to be organised during the project duration is given in the Annexure 2.
1.8.3 Stakeholder consultation The consultations included focus group discussions with selected stakeholders, one to one discussions and workshops, In most cases the discussions took a form of debate and later exchanges of views. The participants shared their ideas and concerns, and often proposed solutions.
1.8.4 Focussed Ground Discussions and Individual Interviews Details of some of the main focussed group discussions and individual interviews are presented in Annexure 3.
1.8.5 Workshops Two workshops were held.
18 November 2014: Stakeholders Consultation and Visioning Workshop, which was attended by about 120 people. This allowed the consultants the opportunity to present their analysis of the existing situation and for the participants to add to or correct this analysis. Participants were able to work in small groups, each of which concentrated on a specific sector, in making recommendations regarding future planning.
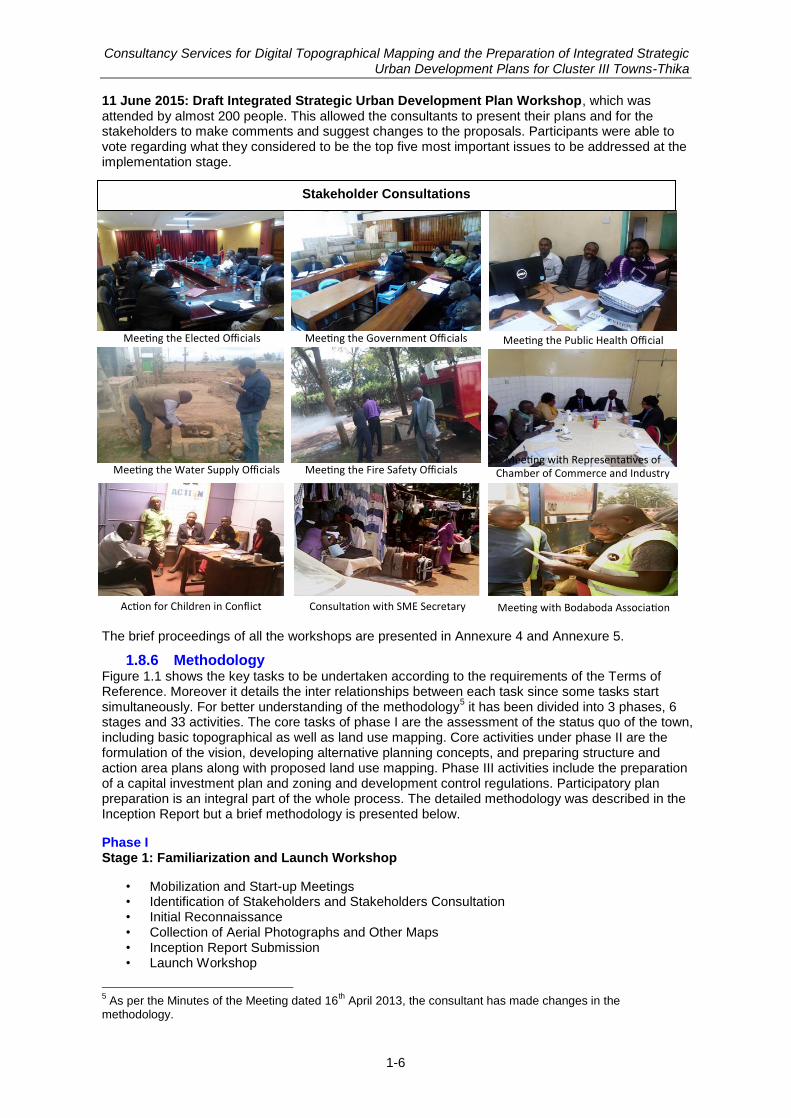
Consultancy Services for Digital Topographical Mapping and the Preparation of Integrated Strategic Urban Development Plans for Cluster III Towns-Thika
1-6
Stakeholderconsulta on
Mee ngtheElectedOfficials Mee ngtheGovernmentOfficials Mee ngthePublicHealthOfficial
Mee ngwithRepresenta vesofChamberofCommerceandIndustryMee ngtheWaterSupplyOfficials Mee ngtheFireSafetyOfficials
Ac onforChildreninConflict Consulta onwithSMESecretary Mee ngwithBodabodaAssocia on
Stakeholder Consultations
11 June 2015: Draft Integrated Strategic Urban Development Plan Workshop, which was attended by almost 200 people. This allowed the consultants to present their plans and for the stakeholders to make comments and suggest changes to the proposals. Participants were able to vote regarding what they considered to be the top five most important issues to be addressed at the implementation stage.
The brief proceedings of all the workshops are presented in Annexure 4 and Annexure 5.
1.8.6 Methodology Figure 1.1 shows the key tasks to be undertaken according to the requirements of the Terms of Reference. Moreover it details the inter relationships between each task since some tasks start simultaneously. For better understanding of the methodology
5 it has been divided into 3 phases, 6
stages and 33 activities. The core tasks of phase I are the assessment of the status quo of the town, including basic topographical as well as land use mapping. Core activities under phase II are the formulation of the vision, developing alternative planning concepts, and preparing structure and action area plans along with proposed land use mapping. Phase III activities include the preparation of a capital investment plan and zoning and development control regulations. Participatory plan preparation is an integral part of the whole process. The detailed methodology was described in the Inception Report but a brief methodology is presented below.
Phase I Stage 1: Familiarization and Launch Workshop
• Mobilization and Start-up Meetings • Identification of Stakeholders and Stakeholders Consultation • Initial Reconnaissance • Collection of Aerial Photographs and Other Maps • Inception Report Submission • Launch Workshop
5 As per the Minutes of the Meeting dated 16
th April 2013, the consultant has made changes in the
methodology.
Consultancy Services for Digital Topographical Mapping and the Preparation of Integrated Strategic Urban Development Plans for Cluster III Towns-Thika
1-7
• Launch Workshop and Situation Analysis Reports Stage 2: Preparation of Existing Land Use Map and Assessment of Existing Situation
• Digital topographical mapping, cadastral map and land use map preparation • Submission of preliminary maps • Preliminary map validation workshop and report • Data Collection
• Primary survey and stakeholders consultations • Aerial Photography - establishing ground control points etc • Cadastral maps • Land use survey • Socio-economic surveys • Traffic and transportation survey • Community/stakeholder consultations
• Secondary data collection and review • Maps: Land Records, Topographic Sheets and Other Maps • Socio-Economic Data: Demography, Economy, • Housing • Infrastructure: Physical and Social Infrastructure • Land Use • Urban Planning and Legal Framework/Urban Governance • Municipal Finance • Transportation • Environment • Disaster Management Plan
Stage 3: Assessment of Existing Status
• Sectoral Analysis • Norms and Standards • Identification of Gaps • SWOT Assessment • Interim Report, Final Maps and Thematic Studies
Phase II Stage 4: Formulation of Vision
• Visioning Workshop • Population Projections
Stage 5: Preparation of Draft Integrated Strategic Urban Development Plan
• Alternative Planning Concepts • Hierarchy of Planning Units • Action Area Plans • Formulation of Proposed Structure Plan and Development Control Regulations • Draft ISUD Plan Proposal Report • Validation workshop for the ISUD Plan Proposals and Report
Phase III Stage 6: Costing, Phasing and Capital Investment Plan
• Phasing and Cost Estimates • City Investment Plan • Institutional Arrangements, Co-ordination and Framework • Monitoring and Evaluation • Draft Capital Investment Plan Report • Coloured (hard and digital copies) for the final ISUD Plan • Workshop for final ISUD Plans and Capital Investment Plan and Report • Final ISUD Plan and Capital Investment Plan Report • Official launch of approved ISUD plan and Capital Investment Plan
The process is shown graphically in the Figure below.
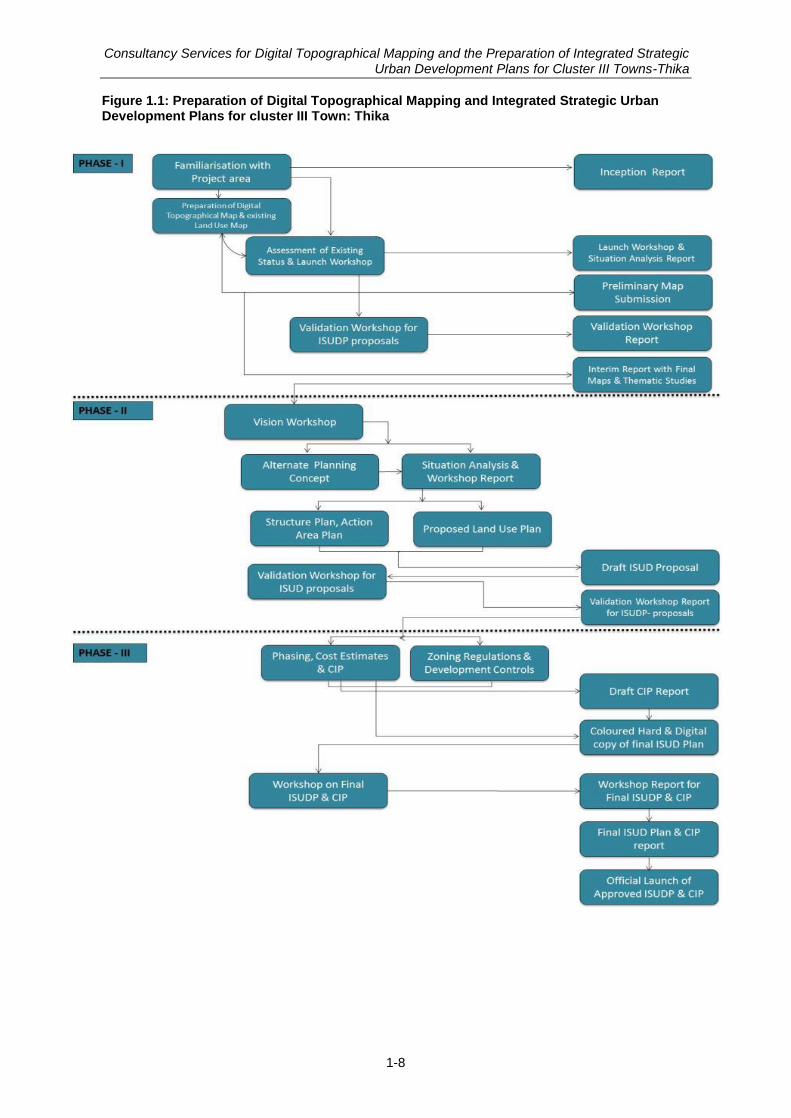
Consultancy Services for Digital Topographical Mapping and the Preparation of Integrated Strategic Urban Development Plans for Cluster III Towns-Thika
1-8
Figure 1.1: Preparation of Digital Topographical Mapping and Integrated Strategic Urban Development Plans for cluster III Town: Thika
Consultancy Services for Digital Topographical Mapping and the Preparation of Integrated Strategic Urban Development Plans for Cluster III Towns-Thika
1-9
1.9 Report structure This report is different from its predecessors. The Situational Analysis has analysed the existing situation in detail, while the Interim Report has taken this analysis and looked to the future in terms of existing gaps, future demand, and spatial management.
This report summarises these points in a compact format, thus providing the basis on which the flesh of spatial planning may be grown.
The structure of this report is as follows:
1. Introduction 2. Town profile, population projection and policies review 3. Development Context
a. Vision b. Planning concept c. Spatial development models d. Proposed Development Concept e. Illustration of Concepts
4. Structure plan a. Existing land use b. Land use norms c. Planning principles d. Spatial development strategy e. Population density f. Future expansion of Thika Planning Boundary g. Population growth scenarios h. Development options i. Land Use Plan
5. Strategic sector plan a. Commerce and industry b. Physical infrastructure c. Roads and transport d. Environment e. Disaster management f. Tourism and heritage g. Institutional set-up h. Financial management
6. Action area plans 7. Development control and zoning regulations
a. Development control b. Zoning
8. Implementation a. Implementation plan b. County economy c. The urban dividend d. Public private partnerships e. Planning under the new constitution
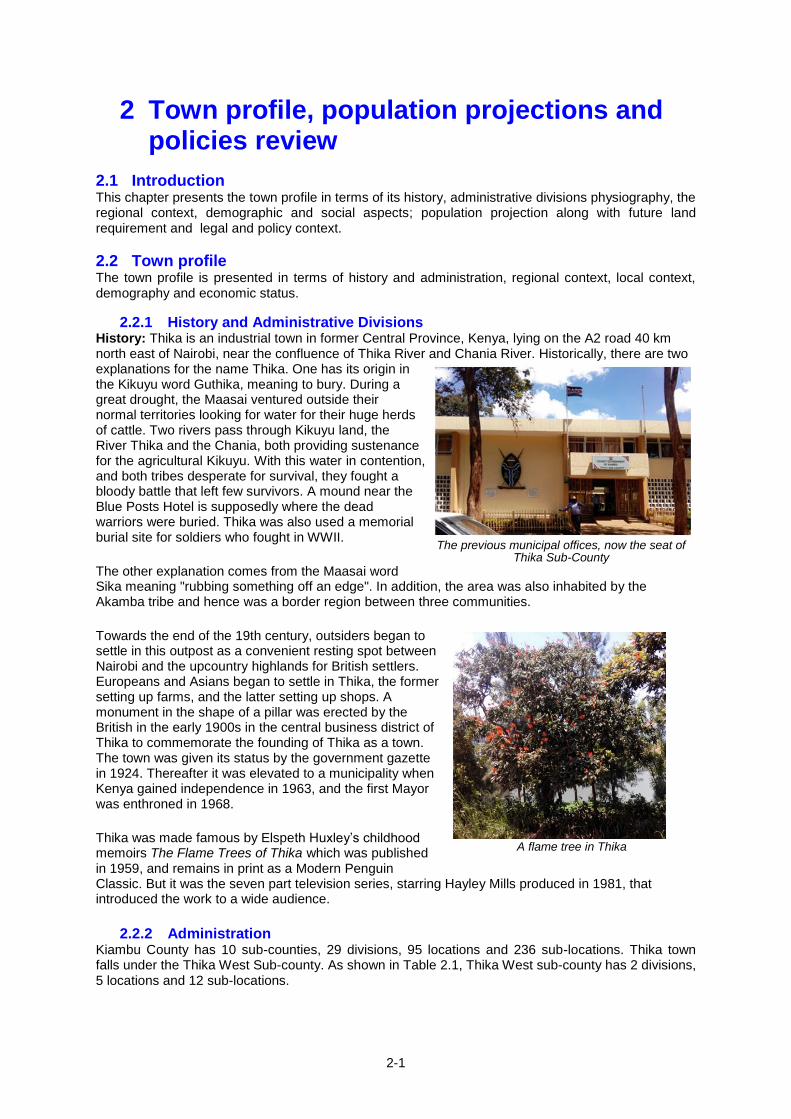
Digital Topographical Mapping and the Preparation of Integrated Strategic Urban Development Plans for Cluster III Town: Thika
2-1
A flame tree in Thika
2 Town profile, population projections and policies review
2.1 Introduction This chapter presents the town profile in terms of its history, administrative divisions physiography, the regional context, demographic and social aspects; population projection along with future land requirement and legal and policy context.
2.2 Town profile The town profile is presented in terms of history and administration, regional context, local context, demography and economic status.
2.2.1 History and Administrative Divisions History: Thika is an industrial town in former Central Province, Kenya, lying on the A2 road 40 km north east of Nairobi, near the confluence of Thika River and Chania River. Historically, there are two explanations for the name Thika. One has its origin in the Kikuyu word Guthika, meaning to bury. During a great drought, the Maasai ventured outside their normal territories looking for water for their huge herds of cattle. Two rivers pass through Kikuyu land, the River Thika and the Chania, both providing sustenance for the agricultural Kikuyu. With this water in contention, and both tribes desperate for survival, they fought a bloody battle that left few survivors. A mound near the Blue Posts Hotel is supposedly where the dead warriors were buried. Thika was also used a memorial burial site for soldiers who fought in WWII.
The other explanation comes from the Maasai word Sika meaning "rubbing something off an edge". In addition, the area was also inhabited by the Akamba tribe and hence was a border region between three communities.
Towards the end of the 19th century, outsiders began to settle in this outpost as a convenient resting spot between Nairobi and the upcountry highlands for British settlers. Europeans and Asians began to settle in Thika, the former setting up farms, and the latter setting up shops. A monument in the shape of a pillar was erected by the British in the early 1900s in the central business district of Thika to commemorate the founding of Thika as a town. The town was given its status by the government gazette in 1924. Thereafter it was elevated to a municipality when Kenya gained independence in 1963, and the first Mayor was enthroned in 1968.
Thika was made famous by Elspeth Huxley‘s childhood memoirs The Flame Trees of Thika which was published in 1959, and remains in print as a Modern Penguin Classic. But it was the seven part television series, starring Hayley Mills produced in 1981, that introduced the work to a wide audience.
2.2.2 Administration Kiambu County has 10 sub-counties, 29 divisions, 95 locations and 236 sub-locations. Thika town falls under the Thika West Sub-county. As shown in Table 2.1, Thika West sub-county has 2 divisions, 5 locations and 12 sub-locations.
The previous municipal offices, now the seat of Thika Sub-County
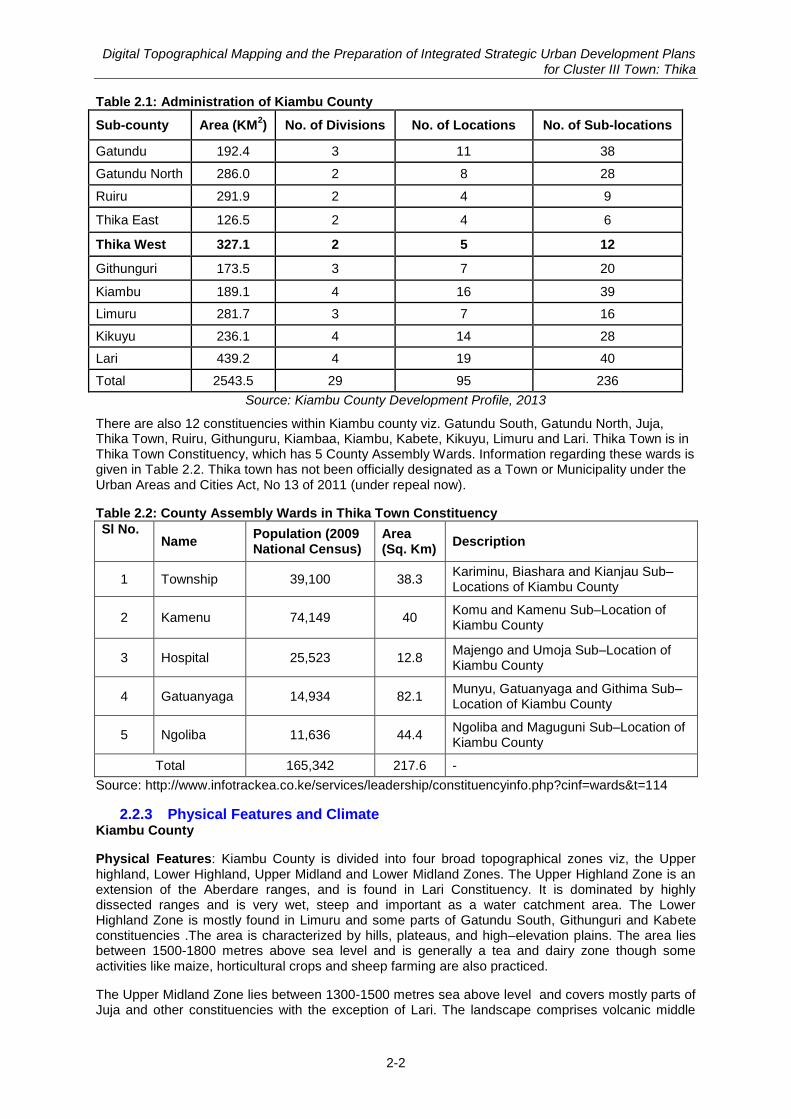
Digital Topographical Mapping and the Preparation of Integrated Strategic Urban Development Plans for Cluster III Town: Thika
2-2
Table 2.1: Administration of Kiambu County
Sub-county Area (KM2) No. of Divisions No. of Locations No. of Sub-locations
Gatundu 192.4 3 11 38
Gatundu North 286.0 2 8 28
Ruiru 291.9 2 4 9
Thika East 126.5 2 4 6
Thika West 327.1 2 5 12
Githunguri 173.5 3 7 20
Kiambu 189.1 4 16 39
Limuru 281.7 3 7 16
Kikuyu 236.1 4 14 28
Lari 439.2 4 19 40
Total 2543.5 29 95 236
Source: Kiambu County Development Profile, 2013
There are also 12 constituencies within Kiambu county viz. Gatundu South, Gatundu North, Juja, Thika Town, Ruiru, Githunguru, Kiambaa, Kiambu, Kabete, Kikuyu, Limuru and Lari. Thika Town is in Thika Town Constituency, which has 5 County Assembly Wards. Information regarding these wards is given in Table 2.2. Thika town has not been officially designated as a Town or Municipality under the Urban Areas and Cities Act, No 13 of 2011 (under repeal now).
Table 2.2: County Assembly Wards in Thika Town Constituency
Sl No. Name
Population (2009 National Census)
Area (Sq. Km)
Description
1 Township 39,100 38.3 Kariminu, Biashara and Kianjau Sub–Locations of Kiambu County
2 Kamenu 74,149 40 Komu and Kamenu Sub–Location of Kiambu County
3 Hospital 25,523 12.8 Majengo and Umoja Sub–Location of Kiambu County
4 Gatuanyaga 14,934 82.1 Munyu, Gatuanyaga and Githima Sub–Location of Kiambu County
5 Ngoliba 11,636 44.4 Ngoliba and Maguguni Sub–Location of Kiambu County
Total 165,342 217.6 -
Source: http://www.infotrackea.co.ke/services/leadership/constituencyinfo.php?cinf=wards&t=114
2.2.3 Physical Features and Climate Kiambu County
Physical Features: Kiambu County is divided into four broad topographical zones viz, the Upper highland, Lower Highland, Upper Midland and Lower Midland Zones. The Upper Highland Zone is an extension of the Aberdare ranges, and is found in Lari Constituency. It is dominated by highly dissected ranges and is very wet, steep and important as a water catchment area. The Lower Highland Zone is mostly found in Limuru and some parts of Gatundu South, Githunguri and Kabete constituencies .The area is characterized by hills, plateaus, and high–elevation plains. The area lies between 1500-1800 metres above sea level and is generally a tea and dairy zone though some activities like maize, horticultural crops and sheep farming are also practiced.
The Upper Midland Zone lies between 1300-1500 metres sea above level and covers mostly parts of Juja and other constituencies with the exception of Lari. The landscape comprises volcanic middle
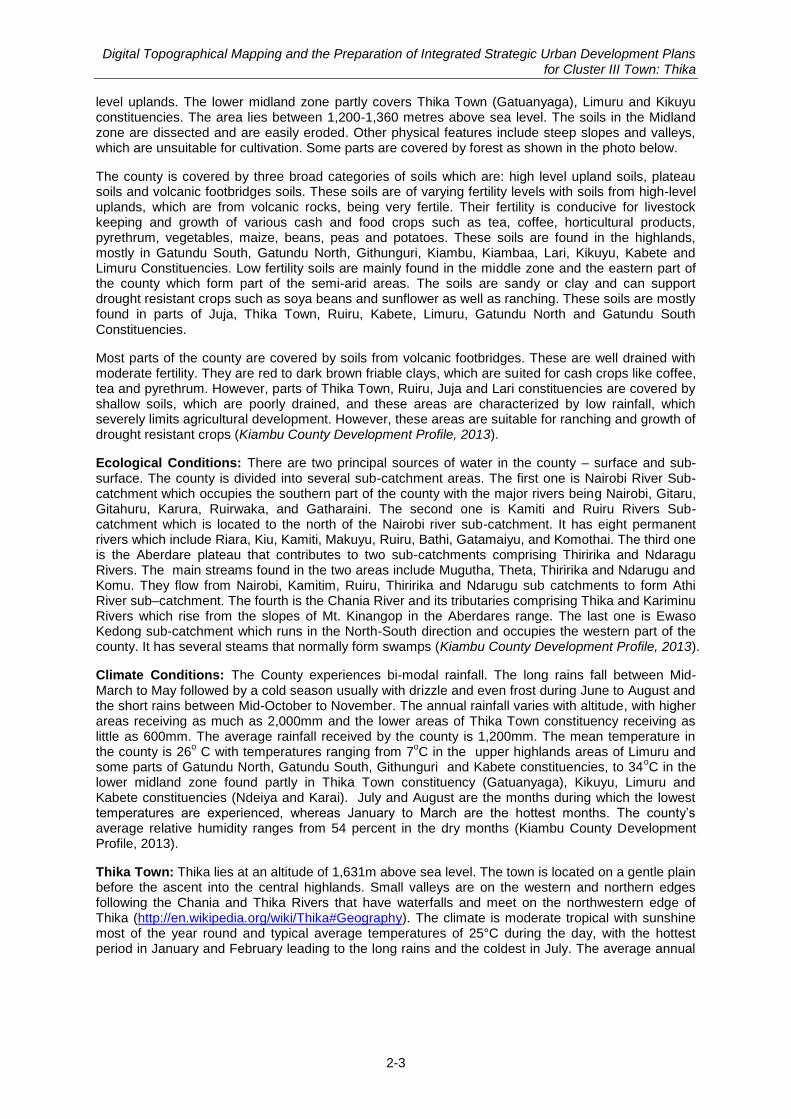
Digital Topographical Mapping and the Preparation of Integrated Strategic Urban Development Plans for Cluster III Town: Thika
2-3
level uplands. The lower midland zone partly covers Thika Town (Gatuanyaga), Limuru and Kikuyu constituencies. The area lies between 1,200-1,360 metres above sea level. The soils in the Midland zone are dissected and are easily eroded. Other physical features include steep slopes and valleys, which are unsuitable for cultivation. Some parts are covered by forest as shown in the photo below.
The county is covered by three broad categories of soils which are: high level upland soils, plateau soils and volcanic footbridges soils. These soils are of varying fertility levels with soils from high-level uplands, which are from volcanic rocks, being very fertile. Their fertility is conducive for livestock keeping and growth of various cash and food crops such as tea, coffee, horticultural products, pyrethrum, vegetables, maize, beans, peas and potatoes. These soils are found in the highlands, mostly in Gatundu South, Gatundu North, Githunguri, Kiambu, Kiambaa, Lari, Kikuyu, Kabete and Limuru Constituencies. Low fertility soils are mainly found in the middle zone and the eastern part of the county which form part of the semi-arid areas. The soils are sandy or clay and can support drought resistant crops such as soya beans and sunflower as well as ranching. These soils are mostly found in parts of Juja, Thika Town, Ruiru, Kabete, Limuru, Gatundu North and Gatundu South Constituencies.
Most parts of the county are covered by soils from volcanic footbridges. These are well drained with moderate fertility. They are red to dark brown friable clays, which are suited for cash crops like coffee, tea and pyrethrum. However, parts of Thika Town, Ruiru, Juja and Lari constituencies are covered by shallow soils, which are poorly drained, and these areas are characterized by low rainfall, which severely limits agricultural development. However, these areas are suitable for ranching and growth of drought resistant crops (Kiambu County Development Profile, 2013).
Ecological Conditions: There are two principal sources of water in the county – surface and sub-surface. The county is divided into several sub-catchment areas. The first one is Nairobi River Sub-catchment which occupies the southern part of the county with the major rivers being Nairobi, Gitaru, Gitahuru, Karura, Ruirwaka, and Gatharaini. The second one is Kamiti and Ruiru Rivers Sub-catchment which is located to the north of the Nairobi river sub-catchment. It has eight permanent rivers which include Riara, Kiu, Kamiti, Makuyu, Ruiru, Bathi, Gatamaiyu, and Komothai. The third one is the Aberdare plateau that contributes to two sub-catchments comprising Thiririka and Ndaragu Rivers. The main streams found in the two areas include Mugutha, Theta, Thiririka and Ndarugu and Komu. They flow from Nairobi, Kamitim, Ruiru, Thiririka and Ndarugu sub catchments to form Athi River sub–catchment. The fourth is the Chania River and its tributaries comprising Thika and Kariminu Rivers which rise from the slopes of Mt. Kinangop in the Aberdares range. The last one is Ewaso Kedong sub-catchment which runs in the North-South direction and occupies the western part of the county. It has several steams that normally form swamps (Kiambu County Development Profile, 2013).
Climate Conditions: The County experiences bi-modal rainfall. The long rains fall between Mid-March to May followed by a cold season usually with drizzle and even frost during June to August and the short rains between Mid-October to November. The annual rainfall varies with altitude, with higher areas receiving as much as 2,000mm and the lower areas of Thika Town constituency receiving as little as 600mm. The average rainfall received by the county is 1,200mm. The mean temperature in the county is 26
o C with temperatures ranging from 7
oC in the upper highlands areas of Limuru and
some parts of Gatundu North, Gatundu South, Githunguri and Kabete constituencies, to 34oC in the
lower midland zone found partly in Thika Town constituency (Gatuanyaga), Kikuyu, Limuru and Kabete constituencies (Ndeiya and Karai). July and August are the months during which the lowest temperatures are experienced, whereas January to March are the hottest months. The county‘s average relative humidity ranges from 54 percent in the dry months (Kiambu County Development Profile, 2013).
Thika Town: Thika lies at an altitude of 1,631m above sea level. The town is located on a gentle plain before the ascent into the central highlands. Small valleys are on the western and northern edges following the Chania and Thika Rivers that have waterfalls and meet on the northwestern edge of Thika (http://en.wikipedia.org/wiki/Thika#Geography). The climate is moderate tropical with sunshine most of the year round and typical average temperatures of 25°C during the day, with the hottest period in January and February leading to the long rains and the coldest in July. The average annual

Digital Topographical Mapping and the Preparation of Integrated Strategic Urban Development Plans for Cluster III Town: Thika
2-4
rainfall in Thika and its environs ranges between 900 mm and 1,250 mm per annum1. Figure 2.1
shows the climatic conditions of Thika town.
Figure 2.1: Climatic Condition of Thika Town
2.2.4 Regional Context
Thika town is located at 01°03′S 37°05′E and lying on the A2 road 40 kilometres north east of Nairobi, near the confluence of the Thika and Chania Rivers. The town was the headquarters of Thika West district following the split of the larger Thika district (created in 1994) into five districts: Thika East and Thika West, Ruiru, Gatundu and Gatanga. It is the seat of the South Central regional commissioner (Deputy Provincial Commissioner) for Central Province who is in charge of the larger Kiambu, Thika and Murang'a districts. However, under Kenya's new constitution, which recognizes only the 47 districts in existence before 1992 as semi-autonomous counties, Thika falls under Kiambu County. The location of Kiambu County within Kenya is shown in Figure 2.2. Although Kiambu Town is the new county headquarter, Thika will remain the main commercial and industrial centre along with headquarters of Thika West Sub-County. The regional setting of Thika and location within Kiambu County is shown in Figure 2.3 and Figure 2.4 respectively.
Thika is serviced by an eight-lane superhighway to Nairobi, a highway to Garissa , Northeast Kenya, Central highlands and also a railway line (with plans to add a passenger light rail to Nairobi). Internally, the town has a well-maintained road network. The town has a railway station, but currently there is only limited passenger service with only cargo trains operating although there are plans to extend the proposed light rail system to Thika in the future. As shown in the below Figure 2.3, the town is well connected with national urban centres and regional urban centres. Figure 2.4 shows the location of Thika town within Kiambu County.
Kiambu County is divided into sub-counties which are headed by a sub-county administrator, appointed by a County Public Service Board. Under the former Constitution of Kenya, the provinces of Kenya were subdivided into a number of districts. In line with restructuring the national administration
1http://www.afdb.org/fileadmin/uploads/afdb/Documents/Environmental-and-Social-Assessments/ADF-BD-IF-
2007-144-EN-KENYA-NAIROBI-THIKA-HIGHWAY-ESIA-SUMMARY-OUMAROU.PDF
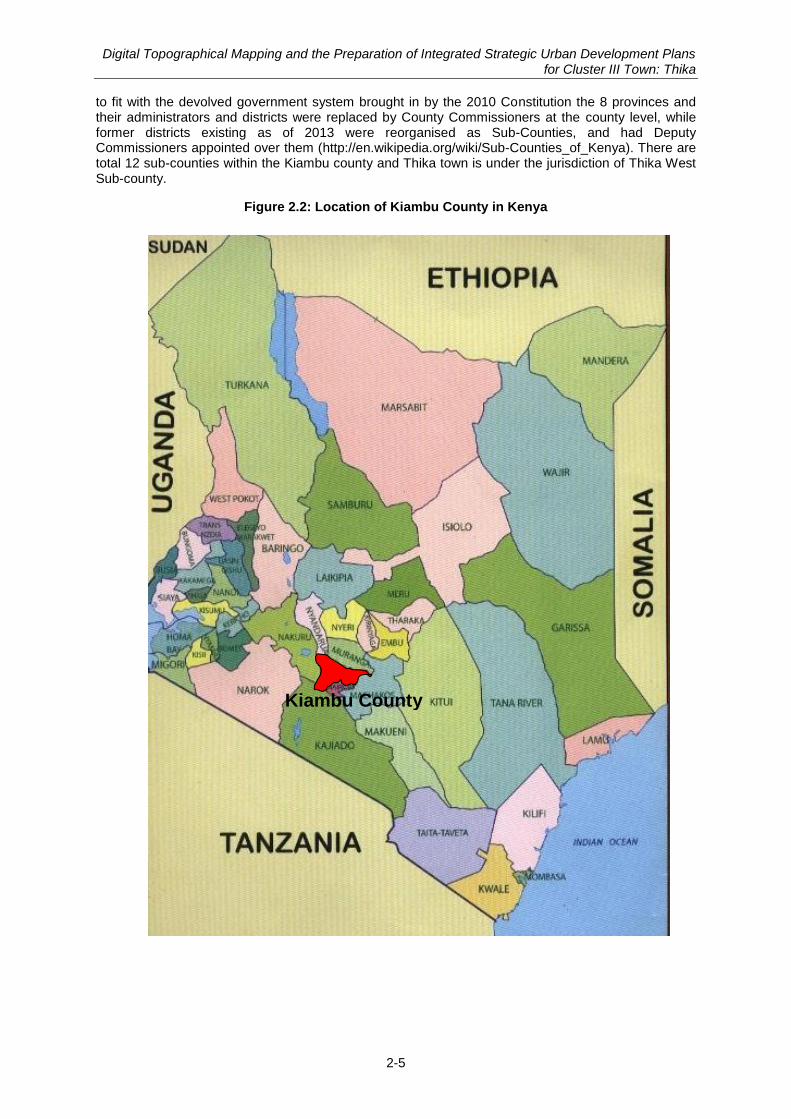
Digital Topographical Mapping and the Preparation of Integrated Strategic Urban Development Plans for Cluster III Town: Thika
2-5
Kiambu County
to fit with the devolved government system brought in by the 2010 Constitution the 8 provinces and their administrators and districts were replaced by County Commissioners at the county level, while former districts existing as of 2013 were reorganised as Sub-Counties, and had Deputy Commissioners appointed over them (http://en.wikipedia.org/wiki/Sub-Counties_of_Kenya). There are total 12 sub-counties within the Kiambu county and Thika town is under the jurisdiction of Thika West Sub-county.
Figure 2.2: Location of Kiambu County in Kenya
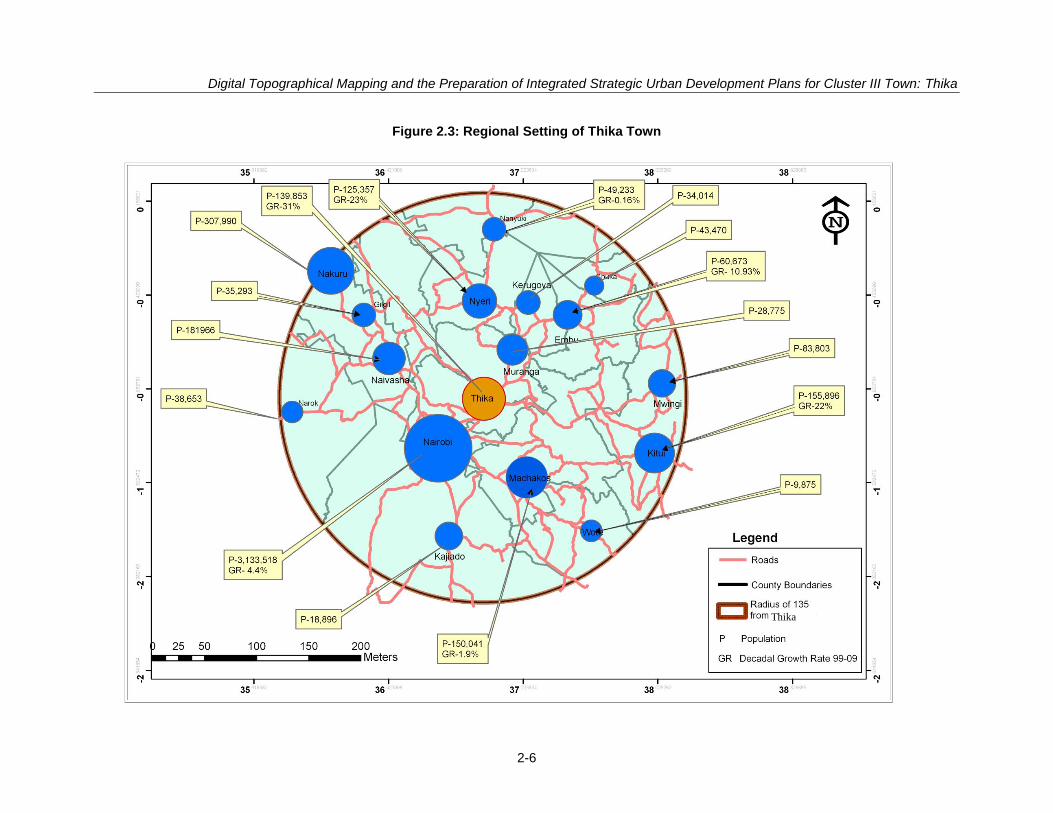
Digital Topographical Mapping and the Preparation of Integrated Strategic Urban Development Plans for Cluster III Town: Thika
2-6
Figure 2.3: Regional Setting of Thika Town
Thika
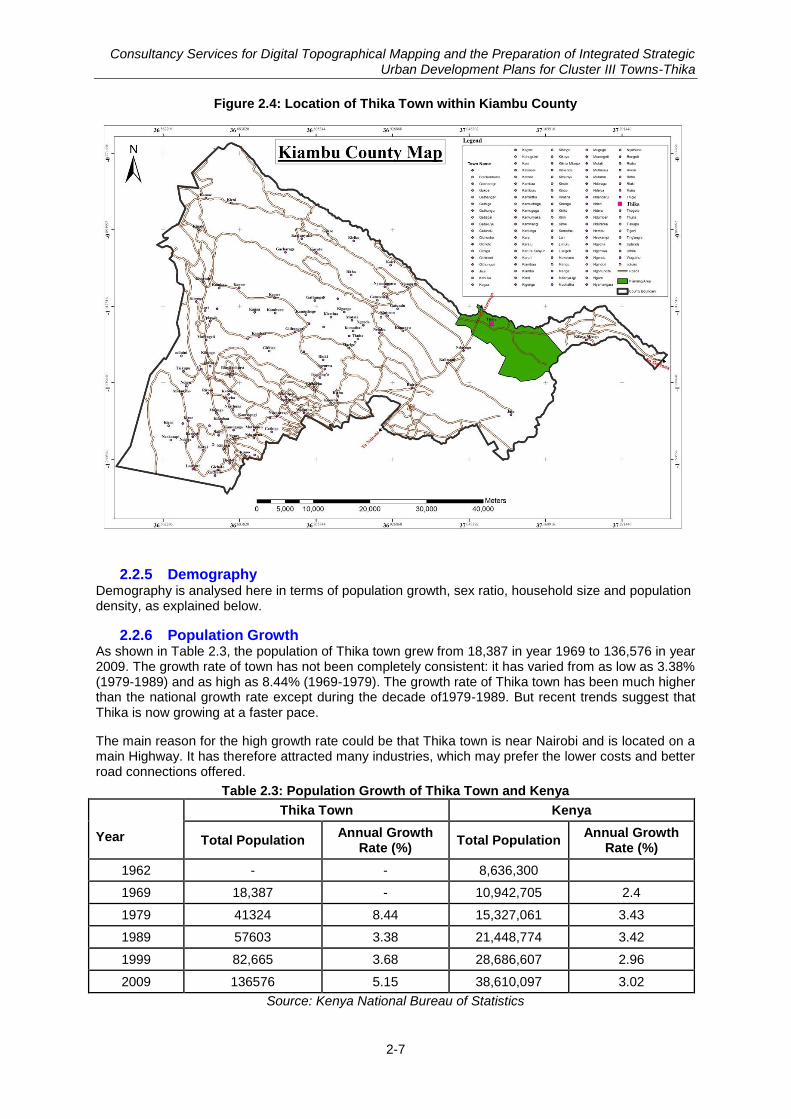
Consultancy Services for Digital Topographical Mapping and the Preparation of Integrated Strategic Urban Development Plans for Cluster III Towns-Thika
2-7
Figure 2.4: Location of Thika Town within Kiambu County
2.2.5 Demography Demography is analysed here in terms of population growth, sex ratio, household size and population density, as explained below.
2.2.6 Population Growth As shown in Table 2.3, the population of Thika town grew from 18,387 in year 1969 to 136,576 in year 2009. The growth rate of town has not been completely consistent: it has varied from as low as 3.38% (1979-1989) and as high as 8.44% (1969-1979). The growth rate of Thika town has been much higher than the national growth rate except during the decade of1979-1989. But recent trends suggest that Thika is now growing at a faster pace.
The main reason for the high growth rate could be that Thika town is near Nairobi and is located on a main Highway. It has therefore attracted many industries, which may prefer the lower costs and better road connections offered.
Table 2.3: Population Growth of Thika Town and Kenya
Year
Thika Town Kenya
Total Population Annual Growth
Rate (%) Total Population
Annual Growth Rate (%)
1962 - - 8,636,300
1969 18,387 - 10,942,705 2.4
1979 41324 8.44 15,327,061 3.43
1989 57603 3.38 21,448,774 3.42
1999 82,665 3.68 28,686,607 2.96
2009 136576 5.15 38,610,097 3.02
Source: Kenya National Bureau of Statistics
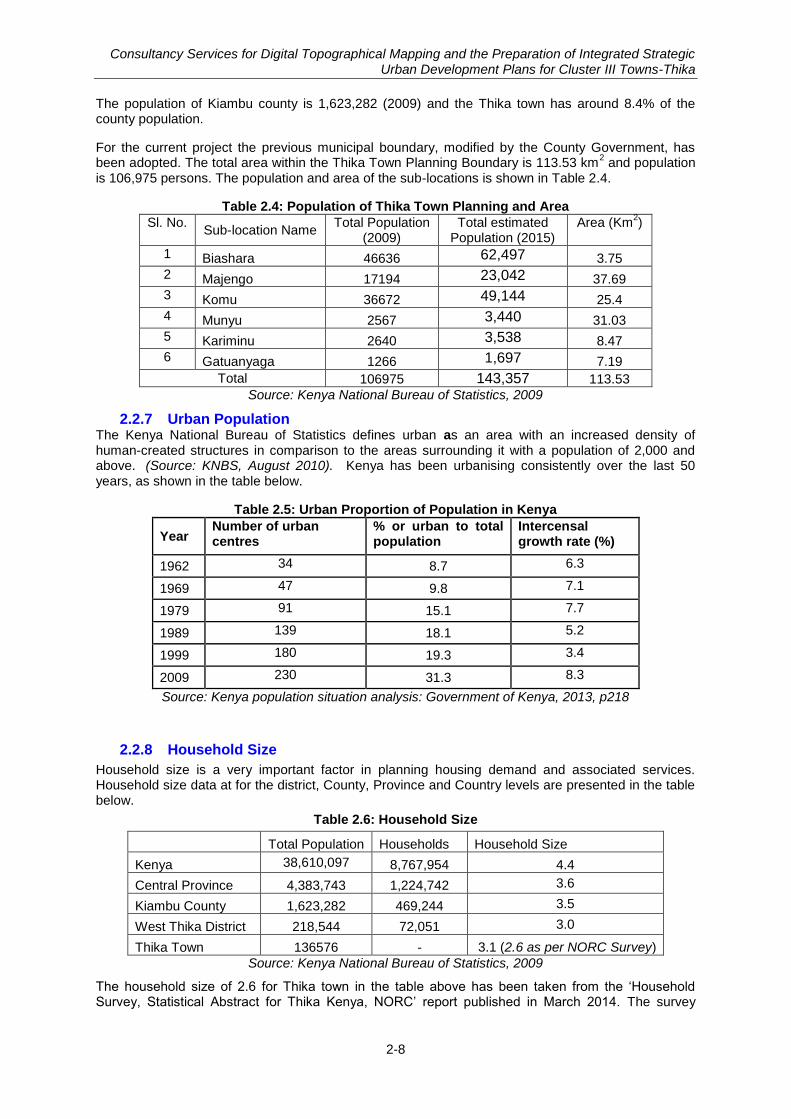
Consultancy Services for Digital Topographical Mapping and the Preparation of Integrated Strategic Urban Development Plans for Cluster III Towns-Thika
2-8
The population of Kiambu county is 1,623,282 (2009) and the Thika town has around 8.4% of the county population.
For the current project the previous municipal boundary, modified by the County Government, has been adopted. The total area within the Thika Town Planning Boundary is 113.53 km
2 and population
is 106,975 persons. The population and area of the sub-locations is shown in Table 2.4.
Table 2.4: Population of Thika Town Planning and Area
Sl. No. Sub-location Name
Total Population (2009)
Total estimated Population (2015)
Area (Km2)
1 Biashara 46636 62,497 3.75
2 Majengo 17194 23,042 37.69
3 Komu 36672 49,144 25.4
4 Munyu 2567 3,440 31.03
5 Kariminu 2640 3,538 8.47
6 Gatuanyaga 1266 1,697 7.19
Total 106975 143,357 113.53
Source: Kenya National Bureau of Statistics, 2009
2.2.7 Urban Population The Kenya National Bureau of Statistics defines urban as an area with an increased density of human-created structures in comparison to the areas surrounding it with a population of 2,000 and above. (Source: KNBS, August 2010). Kenya has been urbanising consistently over the last 50 years, as shown in the table below.
Table 2.5: Urban Proportion of Population in Kenya
Year Number of urban centres
% or urban to total population
Intercensal growth rate (%)
1962 34 8.7 6.3
1969 47 9.8 7.1
1979 91 15.1 7.7
1989 139 18.1 5.2
1999 180 19.3 3.4
2009 230 31.3 8.3
Source: Kenya population situation analysis: Government of Kenya, 2013, p218
2.2.8 Household Size
Household size is a very important factor in planning housing demand and associated services. Household size data at for the district, County, Province and Country levels are presented in the table below.
Table 2.6: Household Size
Total Population Households Household Size
Kenya 38,610,097 8,767,954 4.4
Central Province 4,383,743 1,224,742 3.6
Kiambu County 1,623,282 469,244 3.5
West Thika District 218,544 72,051 3.0
Thika Town 136576 - 3.1 (2.6 as per NORC Survey)
Source: Kenya National Bureau of Statistics, 2009
The household size of 2.6 for Thika town in the table above has been taken from the ‗Household Survey, Statistical Abstract for Thika Kenya, NORC‘ report published in March 2014. The survey
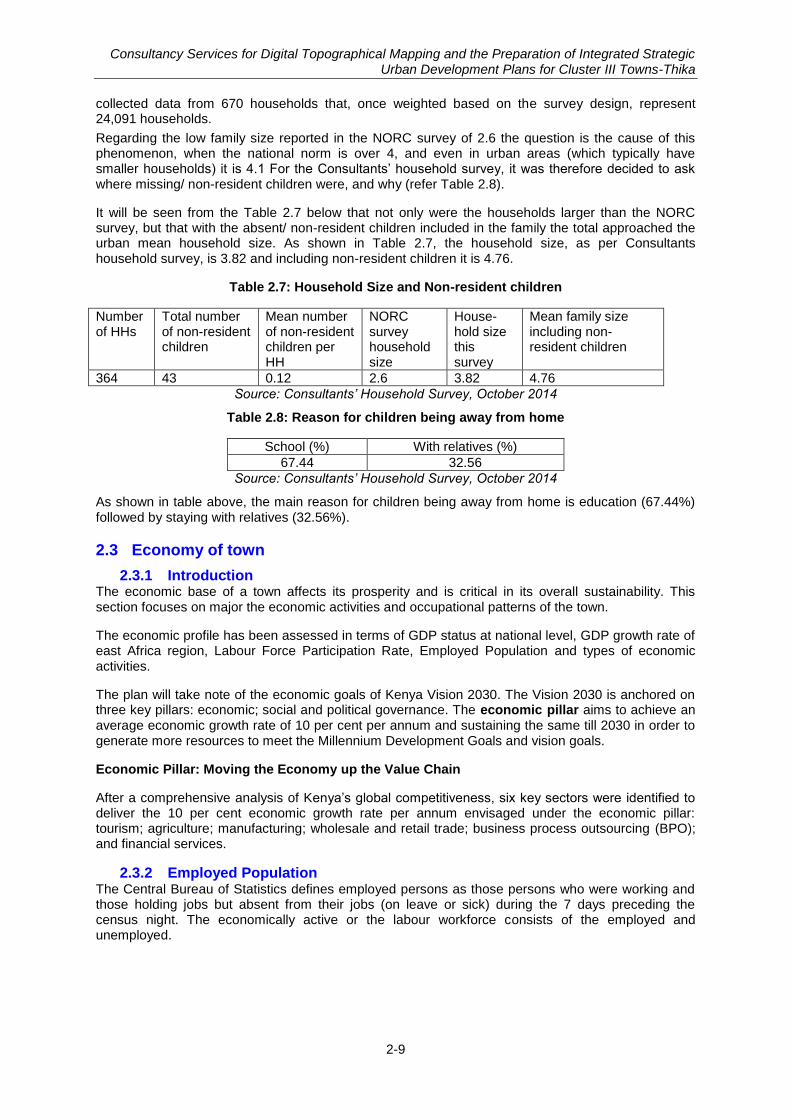
Consultancy Services for Digital Topographical Mapping and the Preparation of Integrated Strategic Urban Development Plans for Cluster III Towns-Thika
2-9
collected data from 670 households that, once weighted based on the survey design, represent 24,091 households.
Regarding the low family size reported in the NORC survey of 2.6 the question is the cause of this phenomenon, when the national norm is over 4, and even in urban areas (which typically have smaller households) it is 4.1 For the Consultants‘ household survey, it was therefore decided to ask where missing/ non-resident children were, and why (refer Table 2.8).
It will be seen from the Table 2.7 below that not only were the households larger than the NORC survey, but that with the absent/ non-resident children included in the family the total approached the urban mean household size. As shown in Table 2.7, the household size, as per Consultants household survey, is 3.82 and including non-resident children it is 4.76.
Table 2.7: Household Size and Non-resident children
Number of HHs
Total number of non-resident children
Mean number of non-resident children per HH
NORC survey household size
House-hold size this survey
Mean family size including non-resident children
364 43 0.12 2.6 3.82 4.76
Source: Consultants’ Household Survey, October 2014
Table 2.8: Reason for children being away from home
School (%) With relatives (%)
67.44 32.56
Source: Consultants’ Household Survey, October 2014
As shown in table above, the main reason for children being away from home is education (67.44%) followed by staying with relatives (32.56%).
2.3 Economy of town
2.3.1 Introduction The economic base of a town affects its prosperity and is critical in its overall sustainability. This section focuses on major the economic activities and occupational patterns of the town.
The economic profile has been assessed in terms of GDP status at national level, GDP growth rate of east Africa region, Labour Force Participation Rate, Employed Population and types of economic activities.
The plan will take note of the economic goals of Kenya Vision 2030. The Vision 2030 is anchored on three key pillars: economic; social and political governance. The economic pillar aims to achieve an average economic growth rate of 10 per cent per annum and sustaining the same till 2030 in order to generate more resources to meet the Millennium Development Goals and vision goals.
Economic Pillar: Moving the Economy up the Value Chain
After a comprehensive analysis of Kenya‘s global competitiveness, six key sectors were identified to deliver the 10 per cent economic growth rate per annum envisaged under the economic pillar: tourism; agriculture; manufacturing; wholesale and retail trade; business process outsourcing (BPO); and financial services.
2.3.2 Employed Population The Central Bureau of Statistics defines employed persons as those persons who were working and those holding jobs but absent from their jobs (on leave or sick) during the 7 days preceding the census night. The economically active or the labour workforce consists of the employed and unemployed.
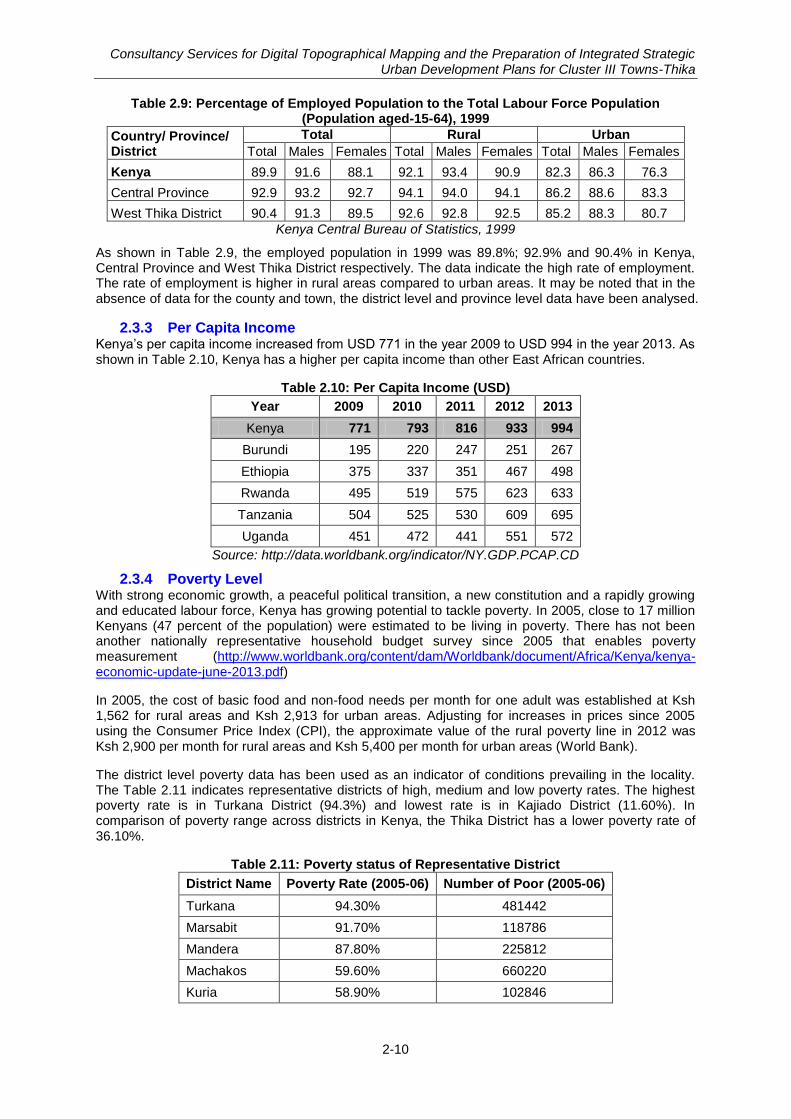
Consultancy Services for Digital Topographical Mapping and the Preparation of Integrated Strategic Urban Development Plans for Cluster III Towns-Thika
2-10
Table 2.9: Percentage of Employed Population to the Total Labour Force Population (Population aged-15-64), 1999
Country/ Province/ District
Total Rural Urban
Total Males Females Total Males Females Total Males Females
Kenya 89.9 91.6 88.1 92.1 93.4 90.9 82.3 86.3 76.3
Central Province 92.9 93.2 92.7 94.1 94.0 94.1 86.2 88.6 83.3
West Thika District 90.4 91.3 89.5 92.6 92.8 92.5 85.2 88.3 80.7
Kenya Central Bureau of Statistics, 1999
As shown in Table 2.9, the employed population in 1999 was 89.8%; 92.9% and 90.4% in Kenya, Central Province and West Thika District respectively. The data indicate the high rate of employment. The rate of employment is higher in rural areas compared to urban areas. It may be noted that in the absence of data for the county and town, the district level and province level data have been analysed.
2.3.3 Per Capita Income Kenya‘s per capita income increased from USD 771 in the year 2009 to USD 994 in the year 2013. As shown in Table 2.10, Kenya has a higher per capita income than other East African countries.
Table 2.10: Per Capita Income (USD)
Year 2009 2010 2011 2012 2013
Kenya 771 793 816 933 994
Burundi 195 220 247 251 267
Ethiopia 375 337 351 467 498
Rwanda 495 519 575 623 633
Tanzania 504 525 530 609 695
Uganda 451 472 441 551 572
Source: http://data.worldbank.org/indicator/NY.GDP.PCAP.CD
2.3.4 Poverty Level With strong economic growth, a peaceful political transition, a new constitution and a rapidly growing and educated labour force, Kenya has growing potential to tackle poverty. In 2005, close to 17 million Kenyans (47 percent of the population) were estimated to be living in poverty. There has not been another nationally representative household budget survey since 2005 that enables poverty measurement (http://www.worldbank.org/content/dam/Worldbank/document/Africa/Kenya/kenya-economic-update-june-2013.pdf)
In 2005, the cost of basic food and non-food needs per month for one adult was established at Ksh 1,562 for rural areas and Ksh 2,913 for urban areas. Adjusting for increases in prices since 2005 using the Consumer Price Index (CPI), the approximate value of the rural poverty line in 2012 was Ksh 2,900 per month for rural areas and Ksh 5,400 per month for urban areas (World Bank).
The district level poverty data has been used as an indicator of conditions prevailing in the locality. The Table 2.11 indicates representative districts of high, medium and low poverty rates. The highest poverty rate is in Turkana District (94.3%) and lowest rate is in Kajiado District (11.60%). In comparison of poverty range across districts in Kenya, the Thika District has a lower poverty rate of 36.10%.
Table 2.11: Poverty status of Representative District
District Name Poverty Rate (2005-06) Number of Poor (2005-06)
Turkana 94.30% 481442
Marsabit 91.70% 118786
Mandera 87.80% 225812
Machakos 59.60% 660220
Kuria 58.90% 102846
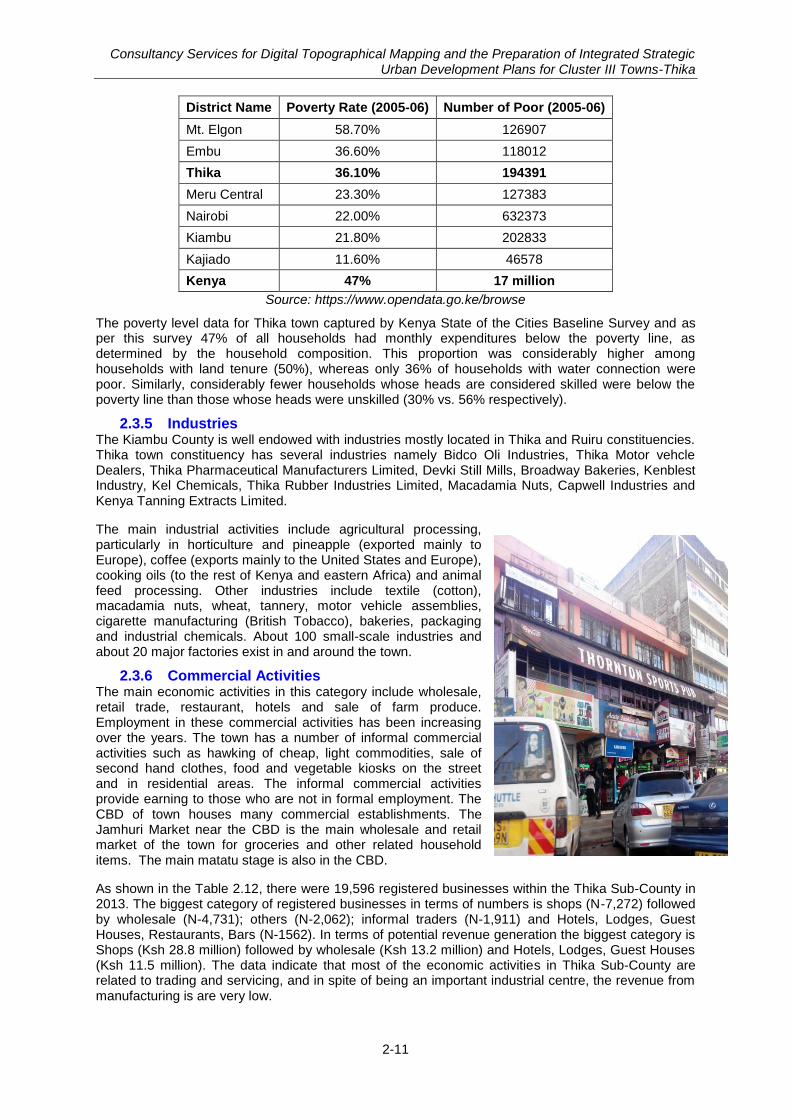
Consultancy Services for Digital Topographical Mapping and the Preparation of Integrated Strategic Urban Development Plans for Cluster III Towns-Thika
2-11
District Name Poverty Rate (2005-06) Number of Poor (2005-06)
Mt. Elgon 58.70% 126907
Embu 36.60% 118012
Thika 36.10% 194391
Meru Central 23.30% 127383
Nairobi 22.00% 632373
Kiambu 21.80% 202833
Kajiado 11.60% 46578
Kenya 47% 17 million
Source: https://www.opendata.go.ke/browse
The poverty level data for Thika town captured by Kenya State of the Cities Baseline Survey and as per this survey 47% of all households had monthly expenditures below the poverty line, as determined by the household composition. This proportion was considerably higher among households with land tenure (50%), whereas only 36% of households with water connection were poor. Similarly, considerably fewer households whose heads are considered skilled were below the poverty line than those whose heads were unskilled (30% vs. 56% respectively).
2.3.5 Industries The Kiambu County is well endowed with industries mostly located in Thika and Ruiru constituencies. Thika town constituency has several industries namely Bidco Oli Industries, Thika Motor vehcle Dealers, Thika Pharmaceutical Manufacturers Limited, Devki Still Mills, Broadway Bakeries, Kenblest Industry, Kel Chemicals, Thika Rubber Industries Limited, Macadamia Nuts, Capwell Industries and Kenya Tanning Extracts Limited.
The main industrial activities include agricultural processing, particularly in horticulture and pineapple (exported mainly to Europe), coffee (exports mainly to the United States and Europe), cooking oils (to the rest of Kenya and eastern Africa) and animal feed processing. Other industries include textile (cotton), macadamia nuts, wheat, tannery, motor vehicle assemblies, cigarette manufacturing (British Tobacco), bakeries, packaging and industrial chemicals. About 100 small-scale industries and about 20 major factories exist in and around the town.
2.3.6 Commercial Activities The main economic activities in this category include wholesale, retail trade, restaurant, hotels and sale of farm produce. Employment in these commercial activities has been increasing over the years. The town has a number of informal commercial activities such as hawking of cheap, light commodities, sale of second hand clothes, food and vegetable kiosks on the street and in residential areas. The informal commercial activities provide earning to those who are not in formal employment. The CBD of town houses many commercial establishments. The Jamhuri Market near the CBD is the main wholesale and retail market of the town for groceries and other related household items. The main matatu stage is also in the CBD.
As shown in the Table 2.12, there were 19,596 registered businesses within the Thika Sub-County in 2013. The biggest category of registered businesses in terms of numbers is shops (N-7,272) followed by wholesale (N-4,731); others (N-2,062); informal traders (N-1,911) and Hotels, Lodges, Guest Houses, Restaurants, Bars (N-1562). In terms of potential revenue generation the biggest category is Shops (Ksh 28.8 million) followed by wholesale (Ksh 13.2 million) and Hotels, Lodges, Guest Houses (Ksh 11.5 million). The data indicate that most of the economic activities in Thika Sub-County are related to trading and servicing, and in spite of being an important industrial centre, the revenue from manufacturing is are very low.
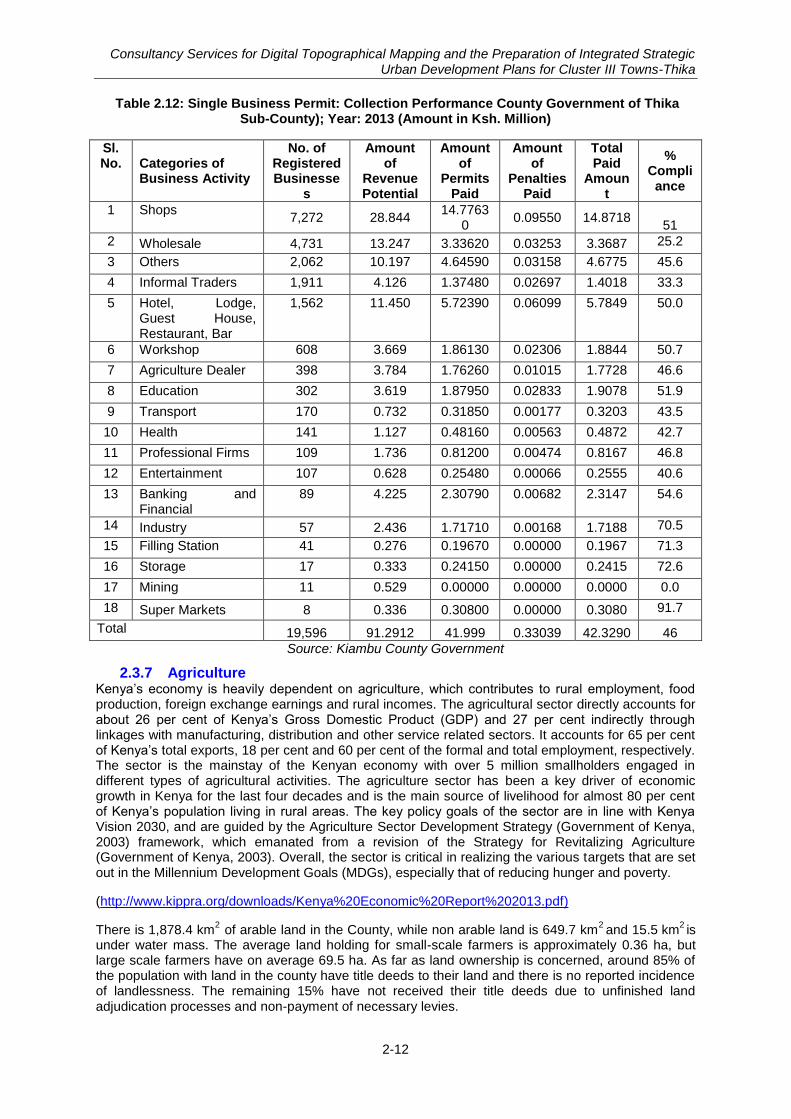
Consultancy Services for Digital Topographical Mapping and the Preparation of Integrated Strategic Urban Development Plans for Cluster III Towns-Thika
2-12
Table 2.12: Single Business Permit: Collection Performance County Government of Thika Sub-County); Year: 2013 (Amount in Ksh. Million)
Sl. No. Categories of
Business Activity
No. of Registered Businesse
s
Amount of
Revenue Potential
Amount of
Permits Paid
Amount of
Penalties Paid
Total Paid
Amount
% Compliance
1 Shops 7,272 28.844
14.77630
0.09550 14.8718 51
2 Wholesale 4,731 13.247 3.33620 0.03253 3.3687 25.2
3 Others 2,062 10.197 4.64590 0.03158 4.6775 45.6
4 Informal Traders 1,911 4.126 1.37480 0.02697 1.4018 33.3
5 Hotel, Lodge, Guest House, Restaurant, Bar
1,562 11.450 5.72390 0.06099 5.7849 50.0
6 Workshop 608 3.669 1.86130 0.02306 1.8844 50.7
7 Agriculture Dealer 398 3.784 1.76260 0.01015 1.7728 46.6
8 Education 302 3.619 1.87950 0.02833 1.9078 51.9
9 Transport 170 0.732 0.31850 0.00177 0.3203 43.5
10 Health 141 1.127 0.48160 0.00563 0.4872 42.7
11 Professional Firms 109 1.736 0.81200 0.00474 0.8167 46.8
12 Entertainment 107 0.628 0.25480 0.00066 0.2555 40.6
13 Banking and Financial
89 4.225 2.30790 0.00682 2.3147 54.6
14 Industry 57 2.436 1.71710 0.00168 1.7188 70.5
15 Filling Station 41 0.276 0.19670 0.00000 0.1967 71.3
16 Storage 17 0.333 0.24150 0.00000 0.2415 72.6
17 Mining 11 0.529 0.00000 0.00000 0.0000 0.0
18 Super Markets 8 0.336 0.30800 0.00000 0.3080 91.7
Total 19,596 91.2912 41.999 0.33039 42.3290 46
Source: Kiambu County Government
2.3.7 Agriculture Kenya‘s economy is heavily dependent on agriculture, which contributes to rural employment, food production, foreign exchange earnings and rural incomes. The agricultural sector directly accounts for about 26 per cent of Kenya‘s Gross Domestic Product (GDP) and 27 per cent indirectly through linkages with manufacturing, distribution and other service related sectors. It accounts for 65 per cent of Kenya‘s total exports, 18 per cent and 60 per cent of the formal and total employment, respectively. The sector is the mainstay of the Kenyan economy with over 5 million smallholders engaged in different types of agricultural activities. The agriculture sector has been a key driver of economic growth in Kenya for the last four decades and is the main source of livelihood for almost 80 per cent of Kenya‘s population living in rural areas. The key policy goals of the sector are in line with Kenya Vision 2030, and are guided by the Agriculture Sector Development Strategy (Government of Kenya, 2003) framework, which emanated from a revision of the Strategy for Revitalizing Agriculture (Government of Kenya, 2003). Overall, the sector is critical in realizing the various targets that are set out in the Millennium Development Goals (MDGs), especially that of reducing hunger and poverty.
(http://www.kippra.org/downloads/Kenya%20Economic%20Report%202013.pdf)
There is 1,878.4 km2
of arable land in the County, while non arable land is 649.7 km2 and 15.5 km
2 is
under water mass. The average land holding for small-scale farmers is approximately 0.36 ha, but large scale farmers have on average 69.5 ha. As far as land ownership is concerned, around 85% of the population with land in the county have title deeds to their land and there is no reported incidence of landlessness. The remaining 15% have not received their title deeds due to unfinished land adjudication processes and non-payment of necessary levies.
Consultancy Services for Digital Topographical Mapping and the Preparation of Integrated Strategic Urban Development Plans for Cluster III Towns-Thika
2-13
Agriculture contributes 17.4% of the county‘s population income. It is the leading sub-sector in terms of employment, food security, income earnings and overall contribution to the socio-economic wellbeing of the people. Coffee and tea are the main cash crops in the county. The main food crops are maize, beans, pineapples and irish potatos. Out of the total arable land of 1,878.4 km
2, a total of
21,447 ha is under food crops and a total of 35,367.41 ha is under cash crops (Kiambu County Development Profile, 2013).
30% of the Thika Town Planning area is under agriculture and horticulture activities. The main cash crops are pineapple and coffee. The main food crops grown with the planning area are maize, beans and potatoes. Considering the cropping pattern within the planning boundary and within Kiambu County, there is a potential for further developing Thika town as an agro-processing hub for the county and region.
2.3.8 Informal Sector The general view of the informal sector is that it comprises activities primarily of petty traders involved in such activities as selling of second-hand clothes, shoe shining, food selling, metalwork, carpentry, vehicle repairs and construction; operating mainly from the streets of the main urban centres. It can also be described as any unregulated activity generating income and profits, though on a small scale, typically using simple skills.
In Kenya, the informal sector is referred to as jua kali, which means fierce sun in Swahili. The name stems from the fact that the workers in the informal sector work have the hot sun beating on their heads and backs while working.
The Kenyan informal sector usually operates on small-scale. Some enterprises are financially strong, while others are at or near subsistence level. Jua Kali businesses have fewer employees (especially home-based enterprises), they operate for a shorter period, and have poor access to water and electricity and few sell outside the establishments where the entrepreneurs live. Kenya‘s informal sector is large and dynamic. (http://www.nayd.org/PDF/The%20informal%20sector%20in%20Kenya.pdf)
Informal sector in the form of a multitude of small/petty trading and casual labour is the outcome of unemployed and under-employed people who do not have wherewithal to start any formal business. In Thika town the following activities constitute the informal sector activities:
• Selling fruits and vegetables in vegetable markets and along roads • Chemicals • Steel fabrication, Car repair, small scale manufacturing, production, construction and repair of
goods • Food items • Selling clothes and shoes (new and second hand) • Kiosks selling various items along roads • Water kiosks • Retailers or hawkers of cereals, home suppliers, fuels and other goods.
The Kenyan labour market is characterized by a large share of informal sector employment, which partly explains the low per capita incomes and productivity. The informal sector is generally characterized by low productivity, vulnerability of employment, and low incomes (Kenya Economic Report 2013, Kenya Institute of Public Policy Research and Analysis)
Specifically, only about 19 per cent of all employment nationally is formal, while the share of informal economy jobs has steadily increased from 70 per cent in 2000 to 83 per cent in 2012. The declining capacity of the formal sector to create employment is evidenced by the fact that out of the 445,900 new jobs created in 2009, 88 per cent were in the informal economy. This trend presents a challenge on the appropriate mix of informal versus formal employment.
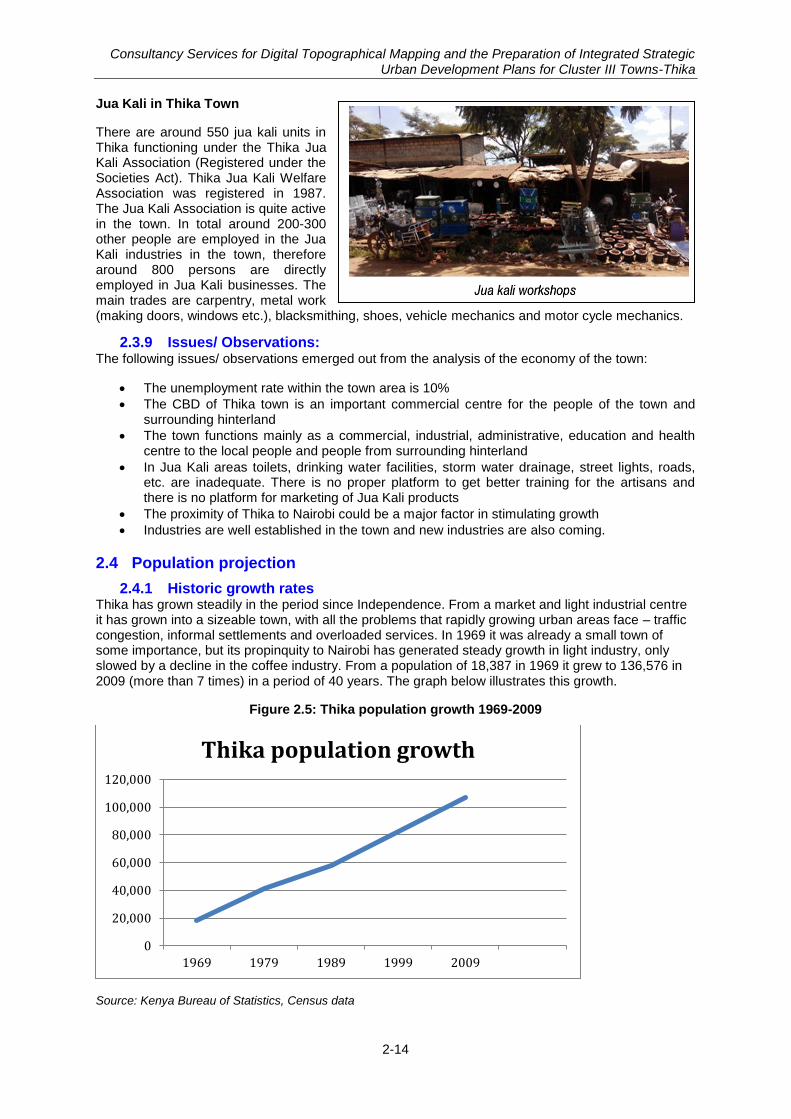
Consultancy Services for Digital Topographical Mapping and the Preparation of Integrated Strategic Urban Development Plans for Cluster III Towns-Thika
2-14
Jua Kali in Thika Town
There are around 550 jua kali units in Thika functioning under the Thika Jua Kali Association (Registered under the Societies Act). Thika Jua Kali Welfare Association was registered in 1987. The Jua Kali Association is quite active in the town. In total around 200-300 other people are employed in the Jua Kali industries in the town, therefore around 800 persons are directly employed in Jua Kali businesses. The main trades are carpentry, metal work (making doors, windows etc.), blacksmithing, shoes, vehicle mechanics and motor cycle mechanics.
2.3.9 Issues/ Observations: The following issues/ observations emerged out from the analysis of the economy of the town:
The unemployment rate within the town area is 10%
The CBD of Thika town is an important commercial centre for the people of the town and surrounding hinterland
The town functions mainly as a commercial, industrial, administrative, education and health centre to the local people and people from surrounding hinterland
In Jua Kali areas toilets, drinking water facilities, storm water drainage, street lights, roads, etc. are inadequate. There is no proper platform to get better training for the artisans and there is no platform for marketing of Jua Kali products
The proximity of Thika to Nairobi could be a major factor in stimulating growth
Industries are well established in the town and new industries are also coming.
2.4 Population projection
2.4.1 Historic growth rates Thika has grown steadily in the period since Independence. From a market and light industrial centre it has grown into a sizeable town, with all the problems that rapidly growing urban areas face – traffic congestion, informal settlements and overloaded services. In 1969 it was already a small town of some importance, but its propinquity to Nairobi has generated steady growth in light industry, only slowed by a decline in the coffee industry. From a population of 18,387 in 1969 it grew to 136,576 in 2009 (more than 7 times) in a period of 40 years. The graph below illustrates this growth.
Figure 2.5: Thika population growth 1969-2009
Source: Kenya Bureau of Statistics, Census data
0
20,000
40,000
60,000
80,000
100,000
120,000
1969 1979 1989 1999 2009
Thika population growth
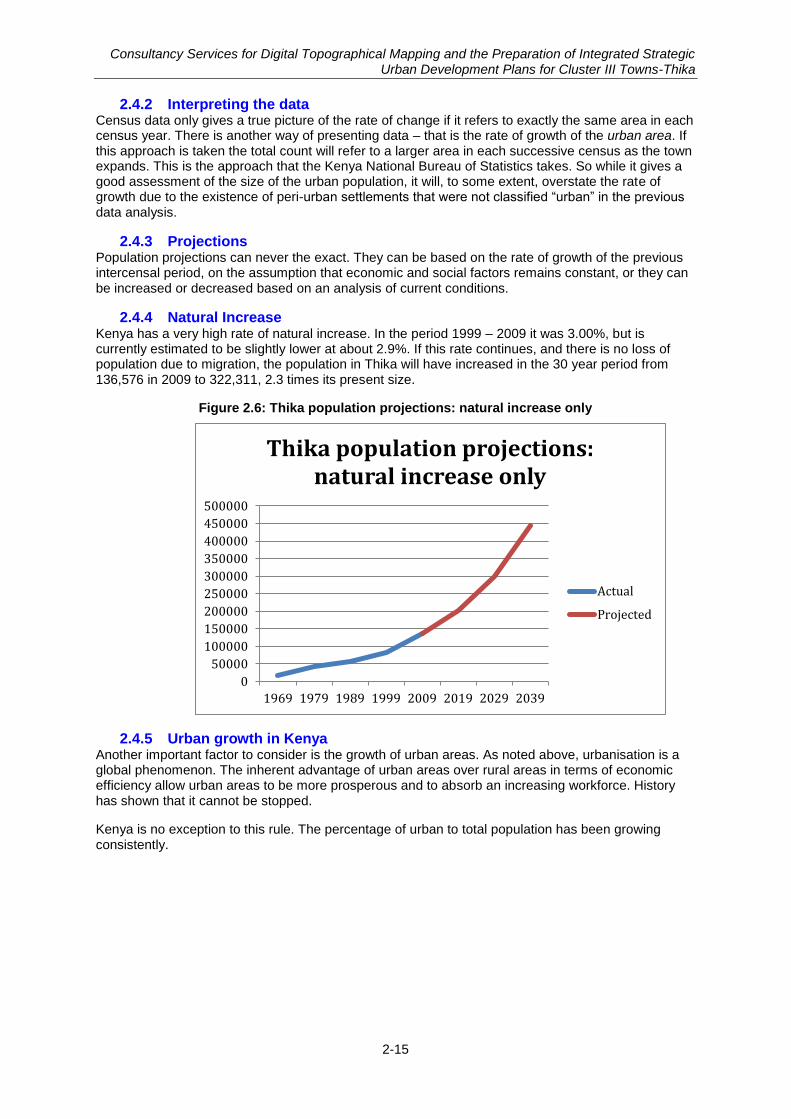
Consultancy Services for Digital Topographical Mapping and the Preparation of Integrated Strategic Urban Development Plans for Cluster III Towns-Thika
2-15
2.4.2 Interpreting the data Census data only gives a true picture of the rate of change if it refers to exactly the same area in each census year. There is another way of presenting data – that is the rate of growth of the urban area. If this approach is taken the total count will refer to a larger area in each successive census as the town expands. This is the approach that the Kenya National Bureau of Statistics takes. So while it gives a good assessment of the size of the urban population, it will, to some extent, overstate the rate of growth due to the existence of peri-urban settlements that were not classified ―urban‖ in the previous data analysis.
2.4.3 Projections Population projections can never the exact. They can be based on the rate of growth of the previous intercensal period, on the assumption that economic and social factors remains constant, or they can be increased or decreased based on an analysis of current conditions.
2.4.4 Natural Increase Kenya has a very high rate of natural increase. In the period 1999 – 2009 it was 3.00%, but is currently estimated to be slightly lower at about 2.9%. If this rate continues, and there is no loss of population due to migration, the population in Thika will have increased in the 30 year period from 136,576 in 2009 to 322,311, 2.3 times its present size.
Figure 2.6: Thika population projections: natural increase only
2.4.5 Urban growth in Kenya Another important factor to consider is the growth of urban areas. As noted above, urbanisation is a global phenomenon. The inherent advantage of urban areas over rural areas in terms of economic efficiency allow urban areas to be more prosperous and to absorb an increasing workforce. History has shown that it cannot be stopped.
Kenya is no exception to this rule. The percentage of urban to total population has been growing consistently.
0
50000
100000
150000
200000
250000
300000
350000
400000
450000
500000
1969 1979 1989 1999 2009 2019 2029 2039
Thika population projections: natural increase only
Actual
Projected
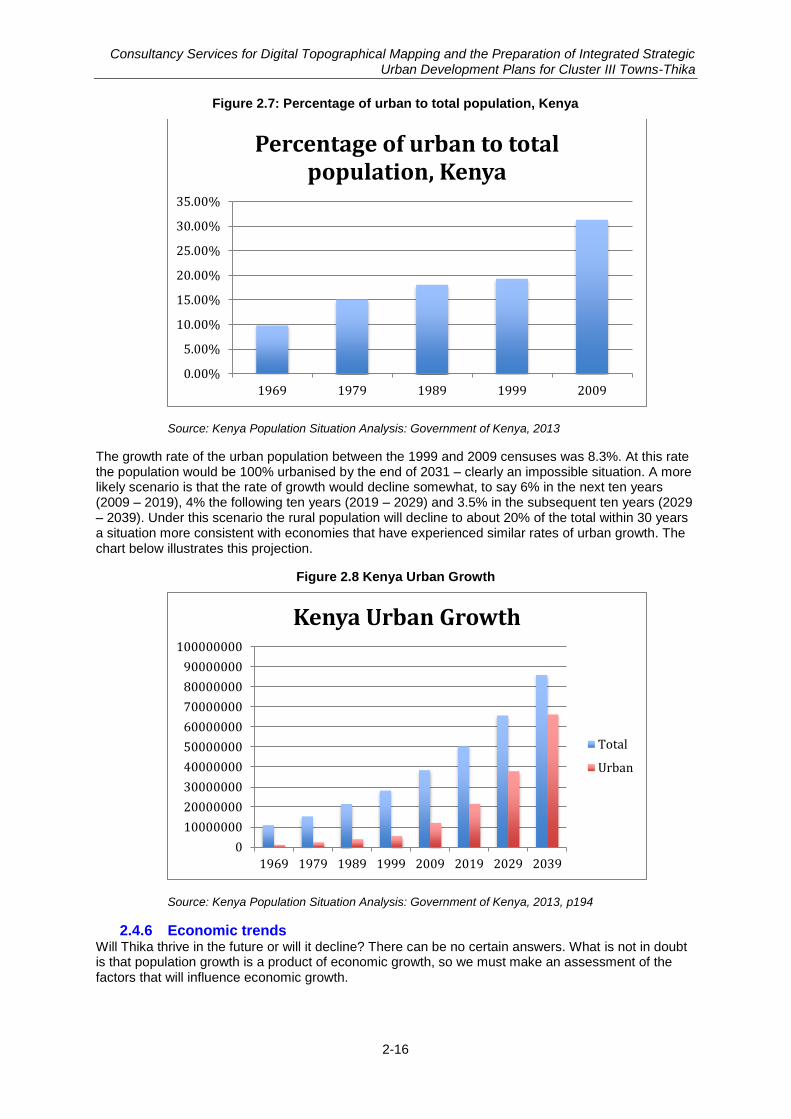
Consultancy Services for Digital Topographical Mapping and the Preparation of Integrated Strategic Urban Development Plans for Cluster III Towns-Thika
2-16
Figure 2.7: Percentage of urban to total population, Kenya
Source: Kenya Population Situation Analysis: Government of Kenya, 2013
The growth rate of the urban population between the 1999 and 2009 censuses was 8.3%. At this rate the population would be 100% urbanised by the end of 2031 – clearly an impossible situation. A more likely scenario is that the rate of growth would decline somewhat, to say 6% in the next ten years (2009 – 2019), 4% the following ten years (2019 – 2029) and 3.5% in the subsequent ten years (2029 – 2039). Under this scenario the rural population will decline to about 20% of the total within 30 years a situation more consistent with economies that have experienced similar rates of urban growth. The chart below illustrates this projection.
Figure 2.8 Kenya Urban Growth
Source: Kenya Population Situation Analysis: Government of Kenya, 2013, p194
2.4.6 Economic trends Will Thika thrive in the future or will it decline? There can be no certain answers. What is not in doubt is that population growth is a product of economic growth, so we must make an assessment of the factors that will influence economic growth.
0.00%
5.00%
10.00%
15.00%
20.00%
25.00%
30.00%
35.00%
1969 1979 1989 1999 2009
Percentage of urban to total population, Kenya
0
10000000
20000000
30000000
40000000
50000000
60000000
70000000
80000000
90000000
100000000
1969 1979 1989 1999 2009 2019 2029 2039
Kenya Urban Growth
Total
Urban
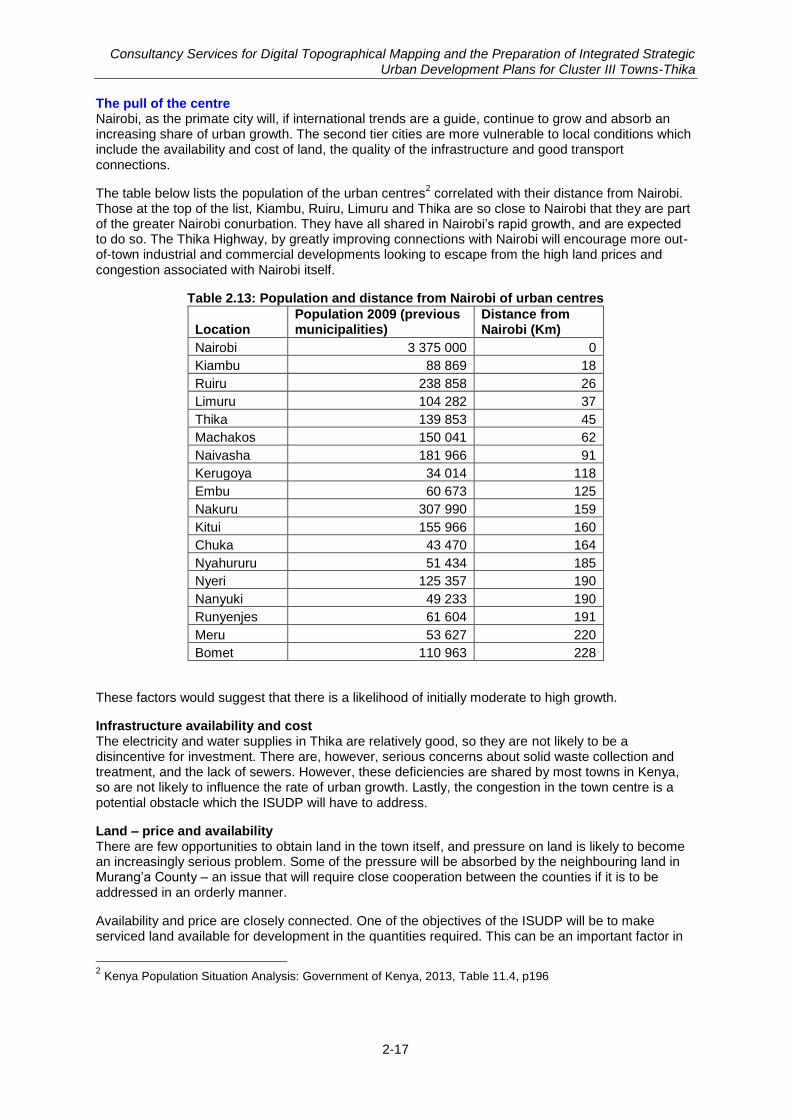
Consultancy Services for Digital Topographical Mapping and the Preparation of Integrated Strategic Urban Development Plans for Cluster III Towns-Thika
2-17
The pull of the centre Nairobi, as the primate city will, if international trends are a guide, continue to grow and absorb an increasing share of urban growth. The second tier cities are more vulnerable to local conditions which include the availability and cost of land, the quality of the infrastructure and good transport connections.
The table below lists the population of the urban centres2 correlated with their distance from Nairobi.
Those at the top of the list, Kiambu, Ruiru, Limuru and Thika are so close to Nairobi that they are part of the greater Nairobi conurbation. They have all shared in Nairobi‘s rapid growth, and are expected to do so. The Thika Highway, by greatly improving connections with Nairobi will encourage more out-of-town industrial and commercial developments looking to escape from the high land prices and congestion associated with Nairobi itself.
Table 2.13: Population and distance from Nairobi of urban centres
Location Population 2009 (previous municipalities)
Distance from Nairobi (Km)
Nairobi 3 375 000 0
Kiambu 88 869 18
Ruiru 238 858 26
Limuru 104 282 37
Thika 139 853 45
Machakos 150 041 62
Naivasha 181 966 91
Kerugoya 34 014 118
Embu 60 673 125
Nakuru 307 990 159
Kitui 155 966 160
Chuka 43 470 164
Nyahururu 51 434 185
Nyeri 125 357 190
Nanyuki 49 233 190
Runyenjes 61 604 191
Meru 53 627 220
Bomet 110 963 228
These factors would suggest that there is a likelihood of initially moderate to high growth.
Infrastructure availability and cost The electricity and water supplies in Thika are relatively good, so they are not likely to be a disincentive for investment. There are, however, serious concerns about solid waste collection and treatment, and the lack of sewers. However, these deficiencies are shared by most towns in Kenya, so are not likely to influence the rate of urban growth. Lastly, the congestion in the town centre is a potential obstacle which the ISUDP will have to address.
Land – price and availability There are few opportunities to obtain land in the town itself, and pressure on land is likely to become an increasingly serious problem. Some of the pressure will be absorbed by the neighbouring land in Murang‘a County – an issue that will require close cooperation between the counties if it is to be addressed in an orderly manner.
Availability and price are closely connected. One of the objectives of the ISUDP will be to make serviced land available for development in the quantities required. This can be an important factor in
2 Kenya Population Situation Analysis: Government of Kenya, 2013, Table 11.4, p196
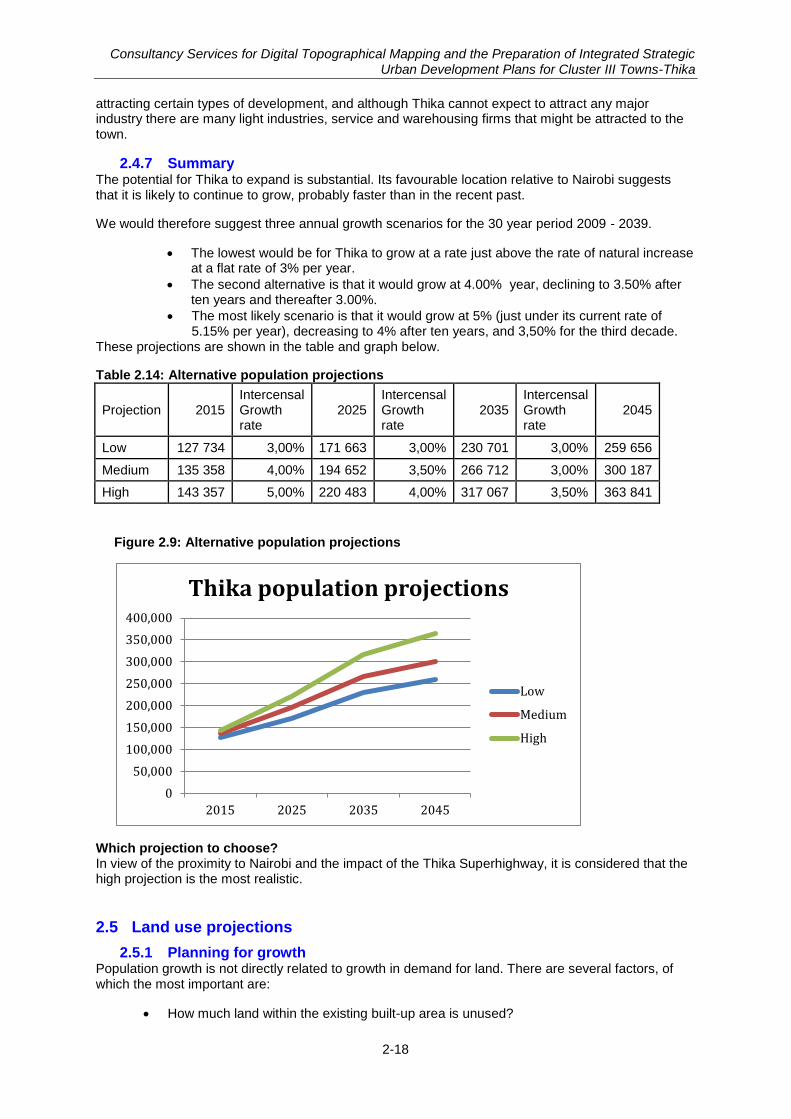
Consultancy Services for Digital Topographical Mapping and the Preparation of Integrated Strategic Urban Development Plans for Cluster III Towns-Thika
2-18
attracting certain types of development, and although Thika cannot expect to attract any major industry there are many light industries, service and warehousing firms that might be attracted to the town.
2.4.7 Summary The potential for Thika to expand is substantial. Its favourable location relative to Nairobi suggests that it is likely to continue to grow, probably faster than in the recent past.
We would therefore suggest three annual growth scenarios for the 30 year period 2009 - 2039.
The lowest would be for Thika to grow at a rate just above the rate of natural increase at a flat rate of 3% per year.
The second alternative is that it would grow at 4.00% year, declining to 3.50% after ten years and thereafter 3.00%.
The most likely scenario is that it would grow at 5% (just under its current rate of 5.15% per year), decreasing to 4% after ten years, and 3,50% for the third decade.
These projections are shown in the table and graph below.
Table 2.14: Alternative population projections
Projection 2015 Intercensal Growth rate
2025 Intercensal Growth rate
2035 Intercensal Growth rate
2045
Low 127 734 3,00% 171 663 3,00% 230 701 3,00% 259 656
Medium 135 358 4,00% 194 652 3,50% 266 712 3,00% 300 187
High 143 357 5,00% 220 483 4,00% 317 067 3,50% 363 841
Figure 2.9: Alternative population projections
Which projection to choose? In view of the proximity to Nairobi and the impact of the Thika Superhighway, it is considered that the high projection is the most realistic.
2.5 Land use projections
2.5.1 Planning for growth Population growth is not directly related to growth in demand for land. There are several factors, of which the most important are:
How much land within the existing built-up area is unused?
0
50,000
100,000
150,000
200,000
250,000
300,000
350,000
400,000
2015 2025 2035 2045
Thika population projections
Low
Medium
High
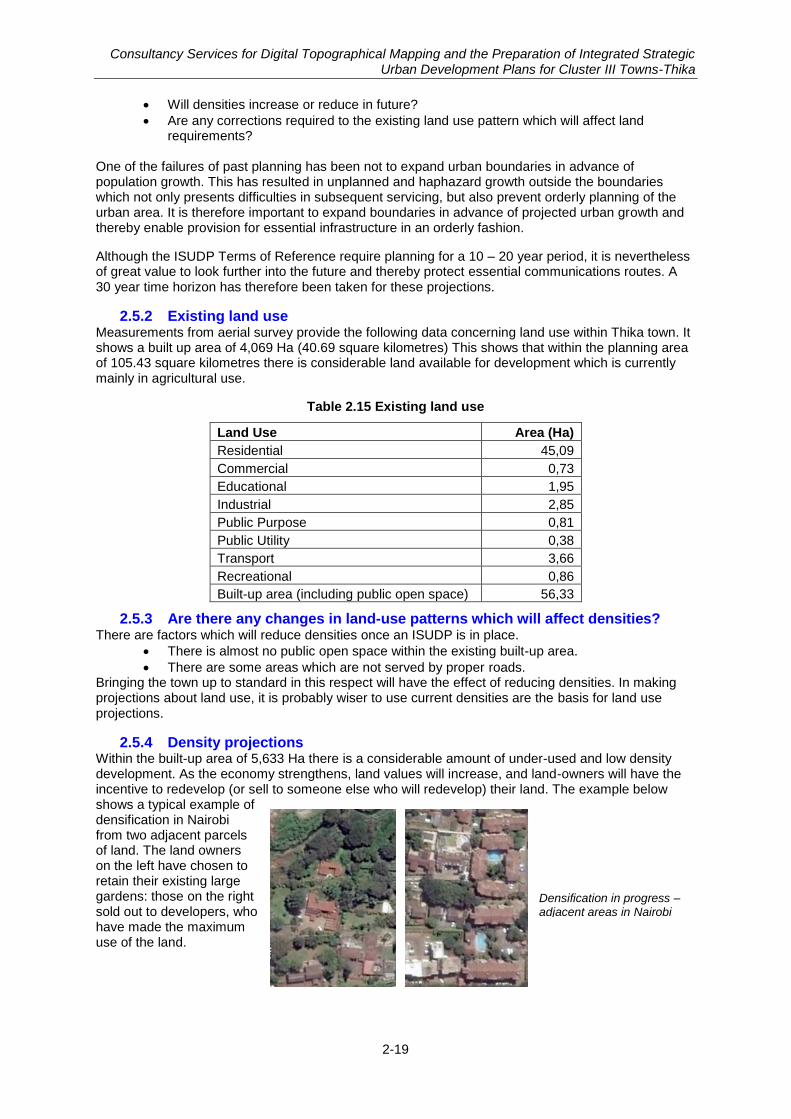
Consultancy Services for Digital Topographical Mapping and the Preparation of Integrated Strategic Urban Development Plans for Cluster III Towns-Thika
2-19
Densification in progress – adjacent areas in Nairobi
Will densities increase or reduce in future?
Are any corrections required to the existing land use pattern which will affect land requirements?
One of the failures of past planning has been not to expand urban boundaries in advance of population growth. This has resulted in unplanned and haphazard growth outside the boundaries which not only presents difficulties in subsequent servicing, but also prevent orderly planning of the urban area. It is therefore important to expand boundaries in advance of projected urban growth and thereby enable provision for essential infrastructure in an orderly fashion.
Although the ISUDP Terms of Reference require planning for a 10 – 20 year period, it is nevertheless of great value to look further into the future and thereby protect essential communications routes. A 30 year time horizon has therefore been taken for these projections.
2.5.2 Existing land use Measurements from aerial survey provide the following data concerning land use within Thika town. It shows a built up area of 4,069 Ha (40.69 square kilometres) This shows that within the planning area of 105.43 square kilometres there is considerable land available for development which is currently mainly in agricultural use.
Table 2.15 Existing land use
Land Use Area (Ha)
Residential 45,09
Commercial 0,73
Educational 1,95
Industrial 2,85
Public Purpose 0,81
Public Utility 0,38
Transport 3,66
Recreational 0,86
Built-up area (including public open space) 56,33
2.5.3 Are there any changes in land-use patterns which will affect densities? There are factors which will reduce densities once an ISUDP is in place.
There is almost no public open space within the existing built-up area.
There are some areas which are not served by proper roads. Bringing the town up to standard in this respect will have the effect of reducing densities. In making projections about land use, it is probably wiser to use current densities are the basis for land use projections.
2.5.4 Density projections Within the built-up area of 5,633 Ha there is a considerable amount of under-used and low density development. As the economy strengthens, land values will increase, and land-owners will have the incentive to redevelop (or sell to someone else who will redevelop) their land. The example below shows a typical example of densification in Nairobi from two adjacent parcels of land. The land owners on the left have chosen to retain their existing large gardens: those on the right sold out to developers, who have made the maximum use of the land.
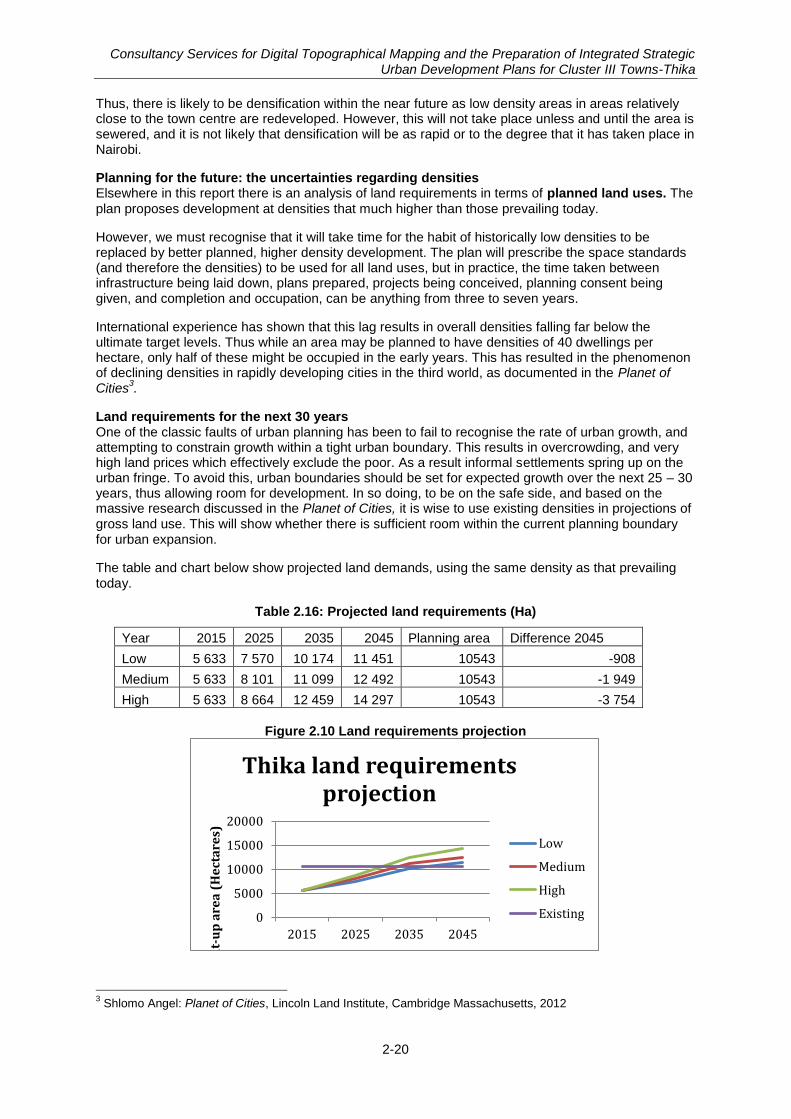
Consultancy Services for Digital Topographical Mapping and the Preparation of Integrated Strategic Urban Development Plans for Cluster III Towns-Thika
2-20
Thus, there is likely to be densification within the near future as low density areas in areas relatively close to the town centre are redeveloped. However, this will not take place unless and until the area is sewered, and it is not likely that densification will be as rapid or to the degree that it has taken place in Nairobi.
Planning for the future: the uncertainties regarding densities Elsewhere in this report there is an analysis of land requirements in terms of planned land uses. The
plan proposes development at densities that much higher than those prevailing today.
However, we must recognise that it will take time for the habit of historically low densities to be replaced by better planned, higher density development. The plan will prescribe the space standards (and therefore the densities) to be used for all land uses, but in practice, the time taken between infrastructure being laid down, plans prepared, projects being conceived, planning consent being given, and completion and occupation, can be anything from three to seven years.
International experience has shown that this lag results in overall densities falling far below the ultimate target levels. Thus while an area may be planned to have densities of 40 dwellings per hectare, only half of these might be occupied in the early years. This has resulted in the phenomenon of declining densities in rapidly developing cities in the third world, as documented in the Planet of Cities
3.
Land requirements for the next 30 years One of the classic faults of urban planning has been to fail to recognise the rate of urban growth, and attempting to constrain growth within a tight urban boundary. This results in overcrowding, and very high land prices which effectively exclude the poor. As a result informal settlements spring up on the urban fringe. To avoid this, urban boundaries should be set for expected growth over the next 25 – 30 years, thus allowing room for development. In so doing, to be on the safe side, and based on the massive research discussed in the Planet of Cities, it is wise to use existing densities in projections of gross land use. This will show whether there is sufficient room within the current planning boundary for urban expansion.
The table and chart below show projected land demands, using the same density as that prevailing today.
Table 2.16: Projected land requirements (Ha)
Year 2015 2025 2035 2045 Planning area Difference 2045
Low 5 633 7 570 10 174 11 451 10543 -908
Medium 5 633 8 101 11 099 12 492 10543 -1 949
High 5 633 8 664 12 459 14 297 10543 -3 754
Figure 2.10 Land requirements projection
3 Shlomo Angel: Planet of Cities, Lincoln Land Institute, Cambridge Massachusetts, 2012
0
5000
10000
15000
20000
2015 2025 2035 2045
Bu
ilt-
up
are
a (
He
cta
res)
Thika land requirements projection
Low
Medium
High
Existing
Consultancy Services for Digital Topographical Mapping and the Preparation of Integrated Strategic Urban Development Plans for Cluster III Towns-Thika
2-21
The projections show that the planning boundary is not sufficient to cope with the land use demands. Based on the high projection, the boundary will need to be expanded by the year 2030. This poses a problem in terms of long-term planning, and should be addressed in the near future.
2.6 Legal and policy context
2.6.1 The Constitution The constitution establishes a system of devolved government based on counties. Governors and Deputy Governors of counties are directly elected as are members of the county assembly. The Governor has the responsibility of appointing, subject to approval by the county assembly, an executive committee. The executive committee and the county assembly constitute the county government. The executive committee must implement county legislation and may also propose it.
In the event that any county is unable to perform its functions or does not operate a financial management system national government may take appropriate steps to ensure that its functions are performed or if necessary assume responsibility for the relevant functions.
2.6.2 Physical Planning Act, Cap 286, 1996 The Physical Planning Act, which became effective in October 1998, and revised in 2009, provides for the establishment of a national physical planning service, headed by a Director, whose duty is primarily to prepare Regional and Local Physical Development Plans. Counties have the responsibility for development control in respect of Regional Plans, while development control in respect of Local Plans is the responsibility of cities, municipalities and towns. Such plans are described as follows:
The Director may prepare a local physical development plan for the general purpose of guiding and co-ordinating development of infrastructural facilities and services for an area referred to in subsection (1), and for the specific control of the use and development of land or for the provision of any land in such area for public purposes.
4
Under the Act neither land subdivision nor development may take place without the approval of the responsible authority. In the case of unauthorized development the responsible authority may issue an enforcement notice requiring that the developer restore the land to its original state.
The Act makes provision for conducting Environmental Impact Assessments in certain cases, and for the preservation of buildings of special architectural value or historic interest.
Appeals in respect of the decision of a local authority must be made to the Local Planning Liaison Committee. If not satisfied with that decision an applicant may appeal to the National Planning Liaison Committee. Appeals against an adverse decision by the National Planning Liaison Committee may then be made to the High Court.
The Act has links with other legislation. Local Authorities may not issue a business permit unless the business premises have planning permission, and the Registrar of Lands ―shall refuse to register a document relating to the development of land unless a development permission has been granted‖.
5
2.6.3 County Governments Act, 2012 This Act establishes the detailed framework for implementing the provisions of Chapter 11 of the Constitution with regard to the management of counties. It makes detailed provision for appointment of persons to the executive committee. The requirements include holding at least a first degree from a university recognised in Kenya and having knowledge and a distinguished career of not less than five years in the field relevant to the portfolio of the department to which the person is being appointed.
The county executive committee shall, among other things,
(a) monitor the process of planning, formulation and adoption of the integrated development plan by a city or municipality within the county;
4 Section 24 (3)
5 Section 37 (1)
Consultancy Services for Digital Topographical Mapping and the Preparation of Integrated Strategic Urban Development Plans for Cluster III Towns-Thika
2-22
(b) assist a city or municipality with the planning, formulation, adoption and review of its integrated development plan;
(c) facilitate the coordination and alignment of integrated development plans of different cities or municipalities within the county and with the plans, strategies and programmes of national and county governments; and
(d) take appropriate steps to resolve any disputes or differences in connection with the planning, formulation, adoption or review of an integrated development plan.
6
The act requires that each sub-county must be managed by a sub-county administrator, who is responsible for the coordination, management and supervision of the general administrative functions including:
(a) the development of policies and plans;
(b) service delivery;
(c) developmental activities to empower the community;
(d) the provision and maintenance of infrastructure and facilities of public services; 7
The Act also requires the appointment of Ward Administrators for each Ward, with the same responsibilities.
Each county must establish a five-year county integrated development plan. This must include a resource mobilisation and management framework including budget projections and financial resources available for capital project developments.
Among the duties of the county planning unit is to ensure the establishment of a GIS based database system. County departments must establish ten year sectoral plans as component parts of the county integrated development plan, and a ten year spatial development plan. This, among other things,
(d) shall indicate where public and private land development and infrastructure investment should take place;
(e) shall indicate desired or undesired utilisation of space in a particular area;
(f) may delineate the urban edges of the municipalities within its jurisdiction and mechanisms
of dealing with the rural urban interfaces;
(g) shall identify areas where strategic intervention is required.
(h) shall indicate areas where priority spending is required8
The Act provides that cities and municipalities must develop land use and zoning plans. Section 111 (1) (c) also refers to urban area building and zoning plans, but since the section as a whole refers only to cities and municipalities it is not clear whether this is supposed to refer to towns.
2.6.4 Urban Areas and Cities Act, 2011 The purpose of this Act is described in the preamble as follows:
AN ACT of Parliament to give effect to Article 184 of the Constitution; to provide for the, classification, governance and management of urban areas and cities; to provide for the criteria of establishing urban areas, to provide for the principle of governance and participation of residents and for connected purposes
6 Section 37
7 Section 50 (3)
8 Section 110 (2)

Consultancy Services for Digital Topographical Mapping and the Preparation of Integrated Strategic Urban Development Plans for Cluster III Towns-Thika
2-23
It establishes criteria for the classification of urban areas as follows:
City – at least 500,000 inhabitants
Municipality – at least 250,000 inhabitants
Town – at least 10,000 inhabitants
In order for any urban area to be so classified it must first have an integrated development plan. The Act lays down the principles of governance and management of urban areas including
(c) institutionalized active participation by its residents in the management of the urban area and city affairs;
(e) efficient and effective service delivery.9
The management of a city and municipality shall be vested in county government and administered on its behalf by a board, a manager and ―such other staff or officers as the county public service may determine‖
10. Towns are to be managed by a town committee. The Act provides for the establishment
of citizen fora which may deliberate or make proposals to the relevant bodies on matters such as the provision of services, policies, budgets and development plans. The Second Schedule to the Act describes the framework for the fora in detail. The Act also provides for the right of citizens to make a request for information in the public interest, though the management board or committee may refuse to provide it if it deems the request unreasonable or has reason to restrict the information due to its confidential nature. The Act makes provision for a board to enter into partnership with a utility company or another city or municipality for the provision of services. The Act requires every city or municipality to ―operate within the framework of integrated development planning‖ which shall
(a) give effect to the development of urban areas and cities as required by this Act and any other written law;
(b) strive to achieve the objects of devolved government as set out in Article 174 of the Constitution;
(c) contribute to the protection and promotion of the fundamental rights and freedoms contained in Chapter Four of the Constitution and the progressive realization of the socio-economic rights;
(d) be the basis for—
(i) the preparation of environmental management plans;
(ii) the preparation of valuation rolls for property taxation;
(iii) provision of physical and social infrastructure and transportation;
(iv) preparation of annual strategic plans for a city or municipality;
(v) disaster preparedness and response;
(vi) overall delivery of service including provision of water, electricity, health, telecommunications and solid waste management; and
(vii) the preparation of a geographic information system for a city or municipality;
(e) nurture and promote development of informal commercial activities in an orderly and sustainable manner;
(f) provide a framework for regulated urban agriculture; and
9 Section 11
10 Section 12 (1) (c)
Consultancy Services for Digital Topographical Mapping and the Preparation of Integrated Strategic Urban Development Plans for Cluster III Towns-Thika
2-24
(g) be the basis for development control.
(2) In addition to the objectives set out in subsection (1), an integrated urban or city development plan shall bind, guide and inform all planning development and decisions and ensure comprehensive inclusion of all functions.
(3) A county government shall initiate an urban planning process for every settlement with a population of at least two thousand residents.
11
It is important to note here that this framework is to be the basis for development control, but is not clear how the provisions of this Act and that of the Physical Planning Act are to be treated. Sections 38 and 39 require a board or town committee to adopt a single inclusive strategic development plan within one year of election.
The plans must be approved by the county assembly and reviewed annually.
2.6.5 The Land Act, 2012 This Act is a comprehensive update of all Land Law in Kenya. It establishes the following values and principles in relation to land management and administration:
equitable access to land;
security of land rights;
sustainable and productive management of land resources;
transparent and cost effective administration of land;
conservation and protection of ecologically sensitive areas;
elimination of gender discrimination in law, customs and practices related to land and property in land;
encouragement of communities to settle land disputes through recognised local community initiatives;
participation, accountability and democratic decision making within communities, the public and the Government;
technical and financial sustainability;
affording equal opportunities to members of all ethnic groups;
non-discrimination and protection of the marginalized; and
democracy, inclusiveness and participation of the people; and
alternative dispute resolution mechanisms in land dispute handling and management. It gives the National Land Commission the responsibility to maintain public land that has endangered or endemic species of flora and fauna, critical habitats or protected areas. It provides procedures for allocating public land, and gives the Commission the power to reserve land for one or more purposes in the public interest.
2.7 Policy and guidelines
2.7.1 Sessional Paper No. 10 of 2012: Vision 2030 Kenya Vision 2030 is a long-term development blueprint for the country aimed at creating a globally competitive and prosperous country with a high quality of life by 2030. The economic, social and political pillars of Kenya Vision 2030 are anchored on macroeconomic stability; continuity in governance reforms; enhanced equity and wealth creation of opportunities for the poor; infrastructure; energy; science, technology and innovation; land reform; human resources development; security; and public sector reforms. The Vision is anchored on three key pillars: economic; social and political governance. The economic pillar aims to achieve an average economic growth rate of 10 per cent per annum and sustaining the same till 2030 in order to generate more resources to meet the Millennium Development Goals and vision goals. The social pillar seeks to create a just, cohesive and equitable social development in a clean and secure environment. The political pillar aims to
realise an issue-based, people-centred, result-oriented and accountable democratic system.
11
Section 36
Consultancy Services for Digital Topographical Mapping and the Preparation of Integrated Strategic Urban Development Plans for Cluster III Towns-Thika
2-25
2.7.2 National Land Policy The National Land Policy was established under Sessional Paper No. 3 of 2009, adopted in August 2009. It was the result of many years of consultation and inputs from a variety of stakeholders. A Draft of the Policy had been adopted in April 2007, and subjected to much debate. The National Land Policy was thus based on views and expert opinions collected and collated through a structured all-inclusive and consultative process that brought together stakeholders drawn from the pubic, private and civil society organizations.
The Sessional Paper was formulated to provide an overall framework and define the key measures required to address the critical issues of land administration, access to land, land use planning, restitution of historical injustices, environmental degradation, conflicts, unplanned proliferation of informal urban settlements, outdated legal framework, institutional framework and information management. It also addressed constitutional issues, such as compulsory acquisition and development control as well as tenure. It recognized the need for security of tenure for all Kenyans (all socio-economic groups, women, pastoral communities, informal settlement residents and other marginalized groups).
The Sessional Paper designated all land in Kenya as Public, Community or Private. The Paper laid the basis for the government to ensure that all land was put into productive use on a sustainable basis by facilitating the implementation of key principles on land use, productivity targets and guidelines as well as conservation.
It stated that planning principles and guidelines would be formulated for national, regional, urban, peri-urban, spontaneous settlements and implemented in a transparent, accountable, sustainable, comprehensive and participatory manner.
It further stated that land administration and management problems would be addressed through streamlining and strengthening surveying and mapping systems, adjudication procedures and processes, land registration and allocation systems and land markets. To ensure access to justice in land related matters, land dispute institutions and mechanisms would be streamlined through the establishment of independent, accountable and democratic systems and mechanisms including Alternative Dispute Management regimes.
It proposed that the Government would prepare and implement national guidelines to improve the quality and quantity of land information through computerization at both national and local levels. This covered all aspects such as standards, geo-referencing, prerequisites for LIMS (Land Information Management System), security, intellectual property rights and land information dissemination and pricing.
Land issues requiring special intervention, such as historical injustices, land rights of minority communities (such as hunter-gatherers, forest-dwellers and pastoralists) and vulnerable groups would be addressed. The rights of these groups would be recognized and protected. Measures would be initiated to identify such groups and ensure their access to land and participation in decision making over land and land based resources.
It stated that the institutional framework would be reformed to ensure devolution of power and authority, participation and representation, justice, equity and sustainability. Three institutions would be set up: the National Land Commission, the District Land Boards and Community Land Boards. District Land Tribunals would also be established, as would a National Land Trust Fund to mobilize finances. Land matters could, in addition, be referred to the land division of the High Court. The Ministry in charge of Lands would continue performing residual roles including policy formulation and enforcement, resource mobilization, and monitoring and evaluation. It noted that implementation of the Land Policy would require building of in-house capacity to plan, prepare and implement the policy recommendations.
2.7.3 Urban Development Policy A National Urban Development Policy has been drafted and is awaiting Cabinet approval. The key points, as indicated in the Urban Policy Concept Paper, published by the Ministry of Local Government‘s Urban Development Department in December 2008, are summarised as follows.
Unprecedented urban growth has contributed to a myriad of problems faced in urban centres today,
Consultancy Services for Digital Topographical Mapping and the Preparation of Integrated Strategic Urban Development Plans for Cluster III Towns-Thika
2-26
and which can only be addressed by development based on sound national urban development policy.
Some of the main problems include weak and poor urban management capacities, the growth of slums and unauthorized development and lack of clear tenure, environmental degradation, poor traffic management, congestion and poor transportation systems, unemployment, delinquency, crime, inadequacy of clean water, inadequate drainage and sanitation, ill managed informal trading activities, poor location of industries, residential and commercial facilities.
Rapid urbanization in Kenya has also not been accompanied by the necessary growth of infrastructure and services and industrialisation.
The Urban Development Policy is expected to be comprehensive and at the same time focuses on key issues, so that it can meet its stated objectives, such as:
Ensuring the legal personality of cities to recognise cities as legitimate and legally empowered entities with independent organizational and self administration status. The policy will for the first time provide clear criteria of classifying towns and of bestowing city and metropolitan status to urban centres and regions.
Ensuring planned, inclusive and sustainable urban development that implies the recognition of urban centres as entities that strive to harmonize physical planning with economic development planning and are sensitive to stakeholders‘ participation and environment.
Ensuring plan based administration of urban land under various land tenure arrangements and systems thereby recognizing urban centres as entities that strive towards achieving effective urban land management and administration.
Enhancing sustained improvement in the quality and coverage of infrastructure facilities along with government‘s key role, cities should strive to maximize the participation and contribution of the private sector and the community sector in infrastructure provision
Ensuring a sustained improvement in the quality and coverage of service provision through a partnership framework that acknowledges the key roles of all key actors.
Facilitating production and access to decent and affordable housing for all and eradicating slums
Alleviating urban poverty through employment generation by maximizing local economic development (LED) and adopting pro-growth policies and strategies.
Ensuring sustainable environmental management which entails the recognition of cities as
entities that strive to work towards the reduction of poverty and promotion of a sustainable
urban environment.
Ensuring the promotion of an effective financial management system.
Ensuring effective rural-urban and urban-urban linkages thereby promoting of the
development of urban centres as loci for enhancing sustainable development with linkages
to their rural counterparts
Ensuring the creation of effective coordination mechanisms for the roles and mandates of
different actors in urban development
Ensuring a stable, peaceful and safe urban life
2.7.4 Physical Planning Handbook The purpose of this handbook, which was drafted in 2007, was to provide clear and digestible user-friendly guidelines and minimum standards on the process and practice of physical planning. Its aim was to rationalize the rules, regulations, guidelines and performance standards that existed in various statutes, relevant subsidiary legislation, technical standards and principles that applied under relevant professional and technical disciplines.
It covers the legislative and institutional context of planning, regional planning, urban planning and development control. It is a handbook to assist practitioners in urban and regional planning to observe and apply the relevant standards and guidelines in the process of preparing physical development plans and submission of applications for development permission.
Topics covered include:
Sustainable development
Consultancy Services for Digital Topographical Mapping and the Preparation of Integrated Strategic Urban Development Plans for Cluster III Towns-Thika
2-27
Relevant parliamentary statutes
Stakeholder involvement
Need for stakeholder participation
Institutional linkages
Local Development Plan and Part Development Plans, Action Plans, Advisory or Zoning Plans and Subject Plans
Regional Physical Development Plans
Development Permission application procedure
Public notification procedure
Regional planning principles, guidelines and standards
Human settlement development strategies
Patterns of urban development It provides spatial planning standards and norms for concerned aspects including:
o Planning for infrastructure services (space standards and supporting population) including Schools, Health facilities, Post offices, Roads, Police stations, Airports, Electricity, Railways,Water supplies and Community centres
o Environmental conservation and development including Development along river reserves, development of Coastal areas, Development in lake areas, Preservation of natural topography etc.
Urban Sector Types of plans Methodology
o Procedure for land use allocation on a plan o Residential Planning standards o Industrial planning guidelines o Commercial Uses, Plot size, proportions o Educational facilities: land requirements catchment areas etc o Recreational facilities, catchment areas, land uses etc o Tourism Planning
2.8 Planning implementation under the new constitution
2.8.1 Environment Policy and Guidelines The environment has been an essential feature of Kenya‘s development policy. Environmental imperatives were initially captured through periodic development planning cycles. But modern day environment management and planning in Kenya can be traced to the Rio Earth Summit of 1992, which helped a great deal in raising the understanding of the link between environment and development. Following the Summit, Kenya initiated the National Environment Action Plan (NEAP) process. This was completed in 1994. It recommended the need for a national policy and law on the environment. It is significant therefore that the global environment body UNEP is located in Nairobi. The policy making process at that time resulted in the Sessional Paper No. 6 of 1999 entitled Environment and Development. The legislative process gave forth the Environmental Management and Coordination Act (EMCA) No. 8 of 1999 as Kenya‘s first framework environmental law. The policy formulation process started again in 2007 but slowed down towards the end of 2008 after thorough stakeholder consultations.
Upon the promulgation of Constitution of Kenya 2010, it was found necessary to review the draft policy of 2008 to accommodate any new developments due to time lapse and to align it to the Constitution. The National Environment Policy of 2013 was therefore a product of a wide participation and consultation with various stakeholders within the academia, non-governmental organisations, interest groups, government ministries, chief executives and officers from the relevant public and private sector organisations from September 2011 to February 2013.
The Policy starts by underscoring the importance and contribution of environment and natural resources to the local and national economy, people‘s livelihoods and the provision of environmental services such as watershed protection and carbon sequestration. It also highlights the existing policy instruments and the reasons that necessitated the formulation of a new National Environment Policy.
Consultancy Services for Digital Topographical Mapping and the Preparation of Integrated Strategic Urban Development Plans for Cluster III Towns-Thika
2-28
Following a review of the status of environment in Kenya and the key environmental issues and challenges, it spells out the goal, objectives and guiding principles of the Policy, namely:
(a) Environmental Right: Every person in Kenya has a right to a clean and healthy environment and a duty to safeguard and enhance the environment.
(b) Right to Development: The right to development will be exercised taking into consideration sustainability, resource efficiency and economic, social and environmental needs.
(c) Ecosystem Approach: An integrated ecosystem approach to conserving environmental resources will be adopted and enhanced to ensure that all ecosystems are managed in an integrated manner while also providing a range of benefits to the citizenry.
(d) Total Economic Value: The benefits that ecosystems generate will be integrated into the national
accounting system, programmes and projects.
(e) Sustainable Resource Use: Environmental resources will be utilised in a manner that does not compromise the quality and value of the resource or decrease the carrying capacity of supporting ecosystems.
(f) Equity: The management of the environment and natural resources will ensure equitable access to
resources for present and future generations.
(g) Public Participation: A coordinated and participatory approach to environmental protection and management will be enhanced to ensure that the relevant government agencies, county governments, private sector, civil society and communities are involved in planning, implementation and decision making processes.
(h) Subsidiarity: The management of the environment and natural resources will be through
decentralisation and devolution of authority and responsibilities to the lowest level possible.
(i) Precautionary Principle: Where there are credible threats of serious or irreversible damage to key environmental resources, lack of full scientific certainty will not be used as a reason for postponing cost-effective measures to prevent environmental degradation.
(j) Polluter Pays Principle: The polluter and users of environmental and natural resources shall bear the full environmental and social costs of their activities.
(k) International Cooperation: MEAs and regional instruments will be domesticated and implemented cooperatively for better environmental management of shared resources.
(l) Good Governance: Rule of law, effective institutions, transparency and accountability, respect for human rights and the meaningful participation of citizens will be integrated in environmental management.
(m) Benefit sharing: Where benefits will accrue from utilisation of biodiversity, these will be shared in
order to promote conservation and sustainable use of biodiversity.
(n) Community Empowerment: Communities will be involved in decision making and empowered in
the implementation of such decisions.
It then identifies Kenya‘s critical ecosystems and natural resources. It proposes measures to enhance conservation and management of ecosystems and sustainable use of natural resources. Key among these are forests, freshwater and wetalnds, coastal and marine ecosystems, mountains, arid arid and semi-arid lands. It also addresses the broad issues of land, soil and minerals management. Lastly it stresses the importance of bio-diversity and wild life., as well as the issues concerning sustainable livestock and fisheries management.
From this it goes to environmental stewardship. The issues covered include natural capital and valuation, trade and environment, tourism, consumption and production patterns, industrialisation, infrastructural development, management of chemicals, human settlements, energy use, climate
Consultancy Services for Digital Topographical Mapping and the Preparation of Integrated Strategic Urban Development Plans for Cluster III Towns-Thika
2-29
change, emergency preparedness and disaster management, gender, invasive alien species. Concerning human settlements, the policy will:
1. Integrate demographic issues into environmental management and natural resources conservation.
2. Develop and implement an Integrated Housing Policy and Housing Master Plan that takes into account environmental considerations.
3. Develop and enforce integrated land use planning at all levels. 4. Develop and promote a policy on eco-settlement centres including informal settlements. 5. Mainstream environmental considerations in the refugee policy and legislation.
The Policy addresses a wide range of issues relating to environmental quality and health. The areas covered include air quality, water and sanitation, waste management, radiation, toxic and hazardous substances, noise, HIV and AIDS and environmental diseases. It also provides a framework for environmental research, education and monitoring.
Concerning environmental governance it underscores the importance of legal reforms. Among these is the need to review the Environmental Management and Coordination Act (EMCA) of 1999. It discusses institutional arrangements, notably the National Environment Management Authority (NEMA) which is the national regulatory agency coordinating with the decentralised entities. It points out that here are various committees on standards enforcement and action plans to support NEMA‘s performance in matters of environment quality standards and planning. The multi-sectoral National Environment Council (NEC) is the apex national environment policy making organ while the Directorate of Environment in the Ministry plays an oversight role in policy formulation as well as monitoring the implementation in relation to other sectoral policies.
It discusses the need for partnerships, regional and international cooperation, human resource development and capacity building and funding mechanism for the sector.
The document concludes by outlining strategies and actions to ensure effective implementation of this Policy and the Environmental Management and Coordination Act.
2.8.2 National Housing Policy The National Housing Policy for Kenya was published by the Ministry of Housing as Sessional Paper No. 3 of 2004.
The main policy thrusts are:
1. Land Use Planning and Management
The lack of a comprehensive land use planning and management policy has led to development of substandard settlements with inadequate infrastructure, services and open spaces. Land supply and delivery mechanisms are characterised by formal and informal sub-divisions undertaken by both the public and private sectors. Formal subdivisions are complex, expensive and slow. On the other hand informal subdivisions often fall short of planning requirements set by the approving authorities hence cannot be registered. Among the policy measures proposed are:
Partnerships between the public sector agencies and private developers to provide serviced land for housing development will be encouraged
A land bank for public housing will be established
Private developers will be given incentives to increase the supply of developed land for lower-income groups
A tax over and above the current land rents and rates on vacant urban land will be imposed
Incentives will be given to squatters to buy the land they occupy for shelter development
Land management and land allocation will be decentralised in urban areas
Development control will be intensified to avoid illegal development. 2. Infrastructure
Accessibility to adequate urban basic services will greatly improve people's economic capacities, health and the quality of life in general. The lack of trunk infrastructure is a serious constraint to private sector housing development. Action to expand and improve infrastructure and services will be undertaken through the following:
Consultancy Services for Digital Topographical Mapping and the Preparation of Integrated Strategic Urban Development Plans for Cluster III Towns-Thika
2-30
Encouraging local authorities to enter into joint ventures with land-owners in peri-urban areas and employing land re-adjustment models,
Embracing reforms aimed at improving the financial capacity of local authorities and other local agencies; and enhancing their ability to maintain and extend infrastructural services;
Facilitating community groups willing to contribute their labour and resources towards the improvement of on-site infrastructure, for example, by community labour contracting for small infrastructure development and maintenance works;
Funds collected for provision of the services will be ploughed back for further provision of the services.
Infrastructural maintenance guidelines will be developed, clearly articulating various roles for developers, local authorities and communities.
3. Financial Resources for Housing
Limited access to finance is a major limiting factor in housing development and the lending institutions have not reached the target groups. Qualifying terms for mortgages are still too stringent. Inappropriate fiscal policies on real estate financing, inability to finance house loans to groups, low affordability due to poverty, high interest rates on mortgages, absence of graduated payments of mortgages and lack of access to the large deposits of retirement benefit funds have hindered the development of the housing sector. Currently, mortgage lending by formal financial institutions only benefits the high-income households besides being concentrated almost exclusively in the urban areas.
Housing finance institutions have had to source funds at high market rates which in turn has resulted in very high house prices. Housing Development Bonds have been used by mortgage finance institutions to mobilize deposits for housing finance but taxation makes the Bonds less attractive to investors. The following are some of the policy measures proposed:
The Government will amend the Banking Act, the Building Society Act, the Insurance Act
and the various Acts relating to land and housing development to removes sections that are a hindrance to the sourcing of housing finance;
Legislation will be proposed to amend the Retirement Benefits Authority Act, to recognise retirement benefits for workers as a suitable security against mortgages.
The Government will urgently facilitate the establishment of a Secondary Mortgage Market in order to mobilize additional resources for housing development to overcome the constraint in the primary mortgage market;
Legislation will be proposed to allow 10% of statutory and pension funds such as NHIF and NSSF to be lent out directly to low-cost housing developers against collateral security;
Legislation will be proposed to compel banks to give out 5% of their lending portfolio to low-cost housing against appropriate collateral security;
Interest charges on home ownership loans should be deductable from taxable income and be subject to review every 3 years.
First time home buyers should be exempted from payment of stamp duty;
The Government will review the current withholding tax payable on Housing Development Bonds to make them more attractive.
Low-cost housing developers in all regions will be given a 100% investment deduction on tax payable in line with other investment incentives existing in the Tourism and Manufacturing sectors;
Employers will be encouraged to facilitate loans to their employees for the purpose of acquiring residential properties;
To assist the low income groups, low-start mortgage schemes or the graduated payment mortgages will be encouraged.
Micro financing and informal funding mechanisms will be encouraged and harnessed for the delivery of housing for the very low income groups especially in informal settlements.
2.8.3 Building By-laws The Kenya Standards Building Code (2009) is probably the most comprehensive and up-to-date such code on the continent. It covers all aspects of construction and on-site planning. To give an idea of the scope it consists of over 600 pages. Volume 1 consists of definitions and procedures with examples of forms etc. Volume 2 covers physical planning, siting and site preparations. This includes
Consultancy Services for Digital Topographical Mapping and the Preparation of Integrated Strategic Urban Development Plans for Cluster III Towns-Thika
2-31
matters such as applications for planning permission, subdivisions, enforcement notices, access to plots, boundary walls, road widths and standards, car parking requirements, space around domestic buildings, use of buildings for dangerous trade, access for persons with disabilities, lighting and ventilation, storey height, window sizes, fire fighting and swimming pools. Separate sections cover advertisements, demolitions works, site preparations and site operations. Volume 3 covers structure and materials, Volume 4 covers building services such as water, drainage etc, and Volume 5 covers safety, disaster risk, management and maintenance.
In addition to deemed-to-satisfy specifications, the Code also has science based definitions, thus allowing innovation.
It is also remarkable in that it covers the needs of the poor, for example in terms of the minimum room size (7 m
2), wall thickness (150mm) and sanitation arrangements (pit latrines).
2.8.4 Previous Plans
Thika Town Development Plan, 1982: A development plan was prepared for Thika town in 1982 for the total area of 21.6km
2. The core town area including the CBD were planned in the Development
Plan.
Strategic Plan 2008-2012, Municipal Council of Thika, 2008: This was the first strategic plan for Municipal Council of Thika and in the past, the Council has carried out its mandate without any strategic plan. This strategic plan has been formulated in the context of the ongoing Public Sector Reforms (PSR) that was aimed at improving the performance of government ministries and departments and their delivery of public services. The plan was aligned to the vision 2030 ‗A globally competitive and prosperous nation with a high quality of life by 2030‘
The philosophy of plan was ‗Quality Service and Development‘ and motto was to develop Thika as ‗‗the industrial hub of Kenya‘. The outcomes of the strategic plan were in the form of strategies, activities and performance indicators along with costs were for the following Key Issues:
Learning and Growth
Research and Development
Legal and Constitutional Framework.
Policies
Information and Communication Technology (ICT) and e-Government
Good Governance.
Monitoring and Evaluation.
Service Delivery
Land Use Planning and Development
Infrastructure Development
Water and Sanitation
Energy
Environment.
HIV / AIDS in Council
Gender
Finance The costing of all the measures suggested in the Strategic Plan was around Ksh 1677 million. As far as implementation of strategic plan is concerned, it was not implemented as per the final recommendations mainly because of lack of adequate resources and due to implementation of new constitution.
2.9 Institutional Framework
2.9.1 County Government Under the Counties Government Act, as noted above, Counties are responsible for strategic planning, though it would appear that the Department of Physical Planning still has some role.
Consultancy Services for Digital Topographical Mapping and the Preparation of Integrated Strategic Urban Development Plans for Cluster III Towns-Thika
2-32
2.9.2 Town Government Although no Town Committee or Municipal Board has yet been established, the county has appointed a sub-county administrator to take responsibility for the urban area of Thika.
2.9.3 Department of Urban Development The Department of Urban Development acts as the arm of the client on behalf of the Ministry of Land, Housing and Urban Development of which it is a part. It has also been appointed as the agency responsible for managing the World Bank funded Kenya Municipal Program.
2.9.4 Infrastructure Service Providers Electricity: Electricity is a national function and is provided by the Kenya Power and Lighting Company.
Water: Water is provided by commercialised companies wholly owned by the previous Municipalities, whose powers are now vested in the Counties.
2.10 Conclusion The project operates under comprehensive and complex legislation which has been summarised above. The final plan has considered all the guidelines and tried to accommodate as much as possible considering the broad nature of plan.
Consultancy Services for Digital Topographical Mapping and the Preparation of Integrated Strategic
Urban Development Plans for Cluster III Towns-Thika
3-1
3 Development concept
3.1 Introduction This chapter deals with the proposed planning development concept, town vision, goals and planning strategies for all the development sectors.
3.2 Vision Thika town is known as industrial town and major satellite town of Nairobi Metropolitan Region. A stakeholder workshop was organized on 18
th November 2014 for formulation of the
vision for Thika town. The key stakeholders invited for the visioning workshop included Members of County Assembly (MCAs); County Officials; members of organisations representing Commerce and Industry, Religions, Matatus, Bodabodas, Hawkers, Jua Kali, informal settlements, Police, Development Practitioners, Opinion Leaders, Farmers, Cultural Groups, Education, other community based organisations and civil society organisations, etc. Around 120 participants attended the workshop and expressed their view about the town vision. The consultants have compiled all the vision statements stated by various participants during the group discussion and also considered the various critical issues and challenges of the town; and formulated the following city vision for Thika for year 2035:
“Thika to be developed as an industrial hub of Kenya that is environmentally and economically sustainable; a town that provide adequate and affordable modern infrastructure facilities along with security, good health, inclusiveness, transparency and affordable quality education; a town that involves its citizen in decision making process; a town that is globally competitive and provides better present and bright future to its all citizens.”
The detailed proceedings of the visioning workshop including attendance sheet, copy of presentation, copy of invitation letter, list of stakeholders, etc. was prepared and submitted in the form a report in December 2014 and brief proceeding of the workshop is given in Annexure 4.
3.3 Planning concept The development planning concept of the planning area has been developed out of an in depth understanding of the existing situation, regional settings, development constraint and potential, environmental sensitivity, digital elevation model, direction of growth, spatial development models, planning hierarchies, development scenario, etc., which are explained below:
3.3.1 Understanding of the regional setting
As it is shown in Figures 3.1 and 3.2, Thika is on a national highway, and is very close to Nairobi. It is the 3
rd largest town after Machakos within the Nairobi Metropolitan Region
(NMR). The impact of better connectivity and nearness to Nairobi has been considered and analysed in formulating future proposals which are presented in various chapters of this report.
Thika is serviced by an eight-lane superhighway to Nairobi, a highway to Garissa, North East Kenya, the central highlands and also a railway line (with plans to add a passenger light rail to Nairobi). Internally, the town has a well-maintained road network. The town has a railway station, but currently it is unused although there are plans to extend a light rail system to Thika in the future. The town is well connected with national urban centres and regional urban centres. As shown in Figure 3.3, Thika is also located on a proposed LAPSET corridor from Nairobi to Isiolo, which will also work as positive factor for future development of Thika.
In the future the level of urbanisation will increase with fast pace as also has been indicated in the Kenya Vision 2030, which states that by 2030 the proportion of the Kenyan population living in urban areas is estimated to reach 60 per cent.
Thika town is an important urban centre within the Nairobi Metropolitan Region (NMR) and it has been proposed as Sub-Regional Centre under the proposed settlement hierarchy within the NMR for 2030, in the „Development of a Spatial Planning Concept for Nairobi Metropolitan Region, Final Plan, January 2012‟, with the following characteristics:
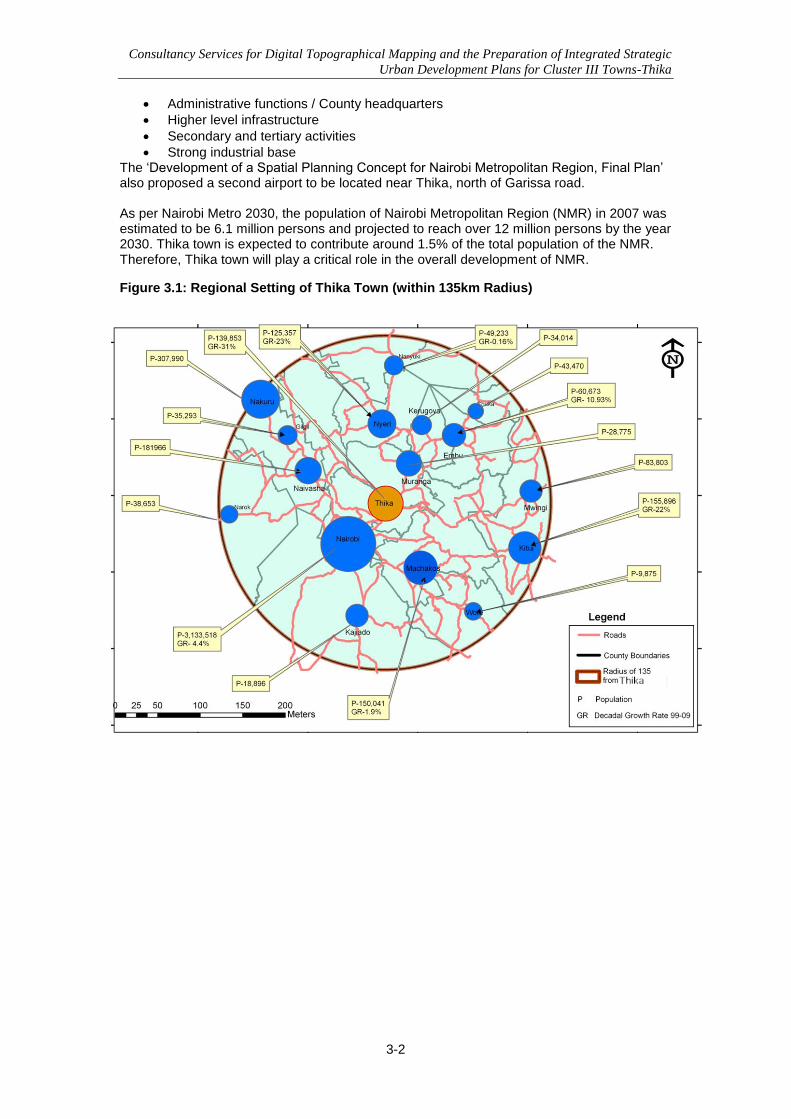
Consultancy Services for Digital Topographical Mapping and the Preparation of Integrated Strategic
Urban Development Plans for Cluster III Towns-Thika
3-2
Administrative functions / County headquarters
Higher level infrastructure
Secondary and tertiary activities
Strong industrial base The „Development of a Spatial Planning Concept for Nairobi Metropolitan Region, Final Plan‟ also proposed a second airport to be located near Thika, north of Garissa road. As per Nairobi Metro 2030, the population of Nairobi Metropolitan Region (NMR) in 2007 was estimated to be 6.1 million persons and projected to reach over 12 million persons by the year 2030. Thika town is expected to contribute around 1.5% of the total population of the NMR. Therefore, Thika town will play a critical role in the overall development of NMR.
Figure 3.1: Regional Setting of Thika Town (within 135km Radius)
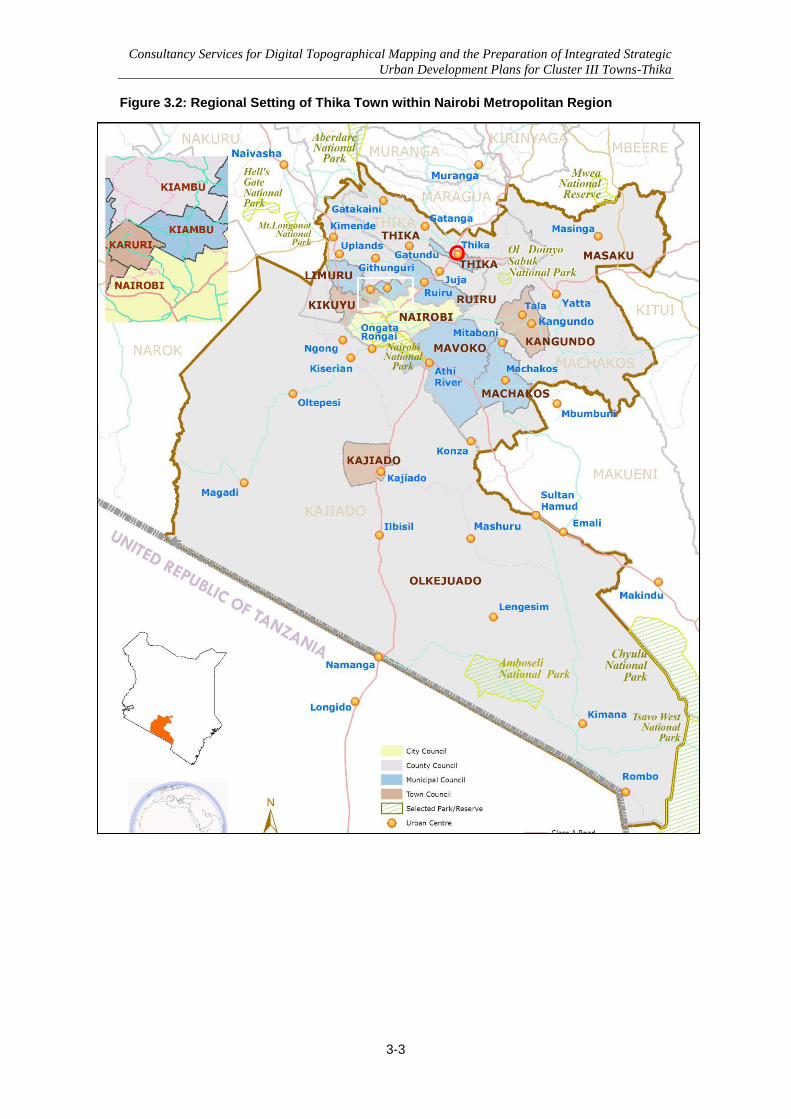
Consultancy Services for Digital Topographical Mapping and the Preparation of Integrated Strategic
Urban Development Plans for Cluster III Towns-Thika
3-3
Figure 3.2: Regional Setting of Thika Town within Nairobi Metropolitan Region
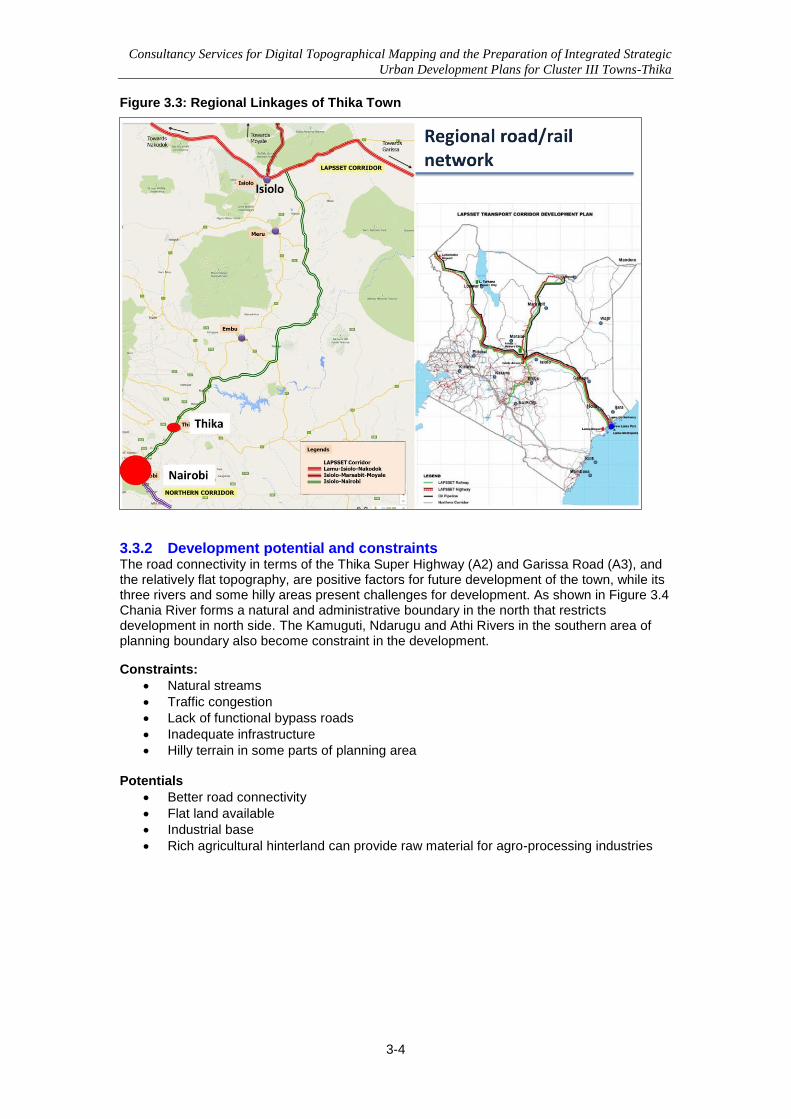
Consultancy Services for Digital Topographical Mapping and the Preparation of Integrated Strategic
Urban Development Plans for Cluster III Towns-Thika
3-4
Figure 3.3: Regional Linkages of Thika Town
3.3.2 Development potential and constraints The road connectivity in terms of the Thika Super Highway (A2) and Garissa Road (A3), and the relatively flat topography, are positive factors for future development of the town, while its three rivers and some hilly areas present challenges for development. As shown in Figure 3.4 Chania River forms a natural and administrative boundary in the north that restricts development in north side. The Kamuguti, Ndarugu and Athi Rivers in the southern area of planning boundary also become constraint in the development.
Constraints:
Natural streams
Traffic congestion
Lack of functional bypass roads
Inadequate infrastructure
Hilly terrain in some parts of planning area Potentials
Better road connectivity
Flat land available
Industrial base
Rich agricultural hinterland can provide raw material for agro-processing industries
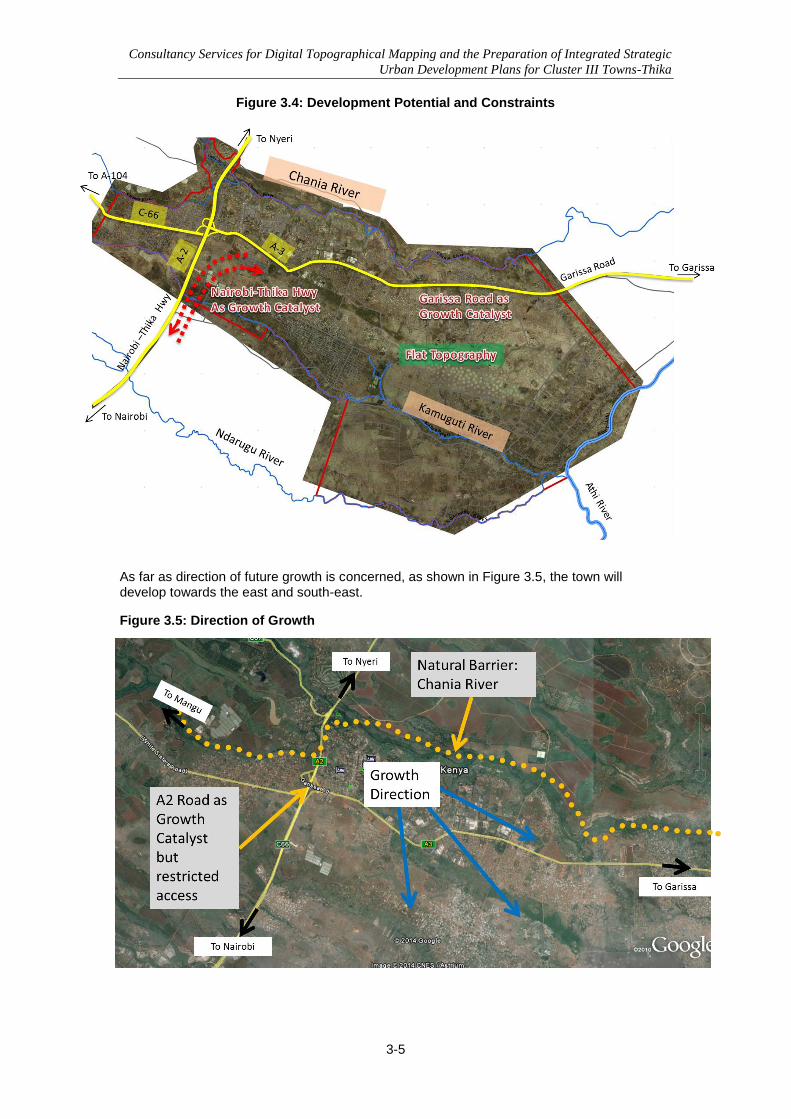
Consultancy Services for Digital Topographical Mapping and the Preparation of Integrated Strategic
Urban Development Plans for Cluster III Towns-Thika
3-5
Figure 3.4: Development Potential and Constraints
As far as direction of future growth is concerned, as shown in Figure 3.5, the town will develop towards the east and south-east.
Figure 3.5: Direction of Growth
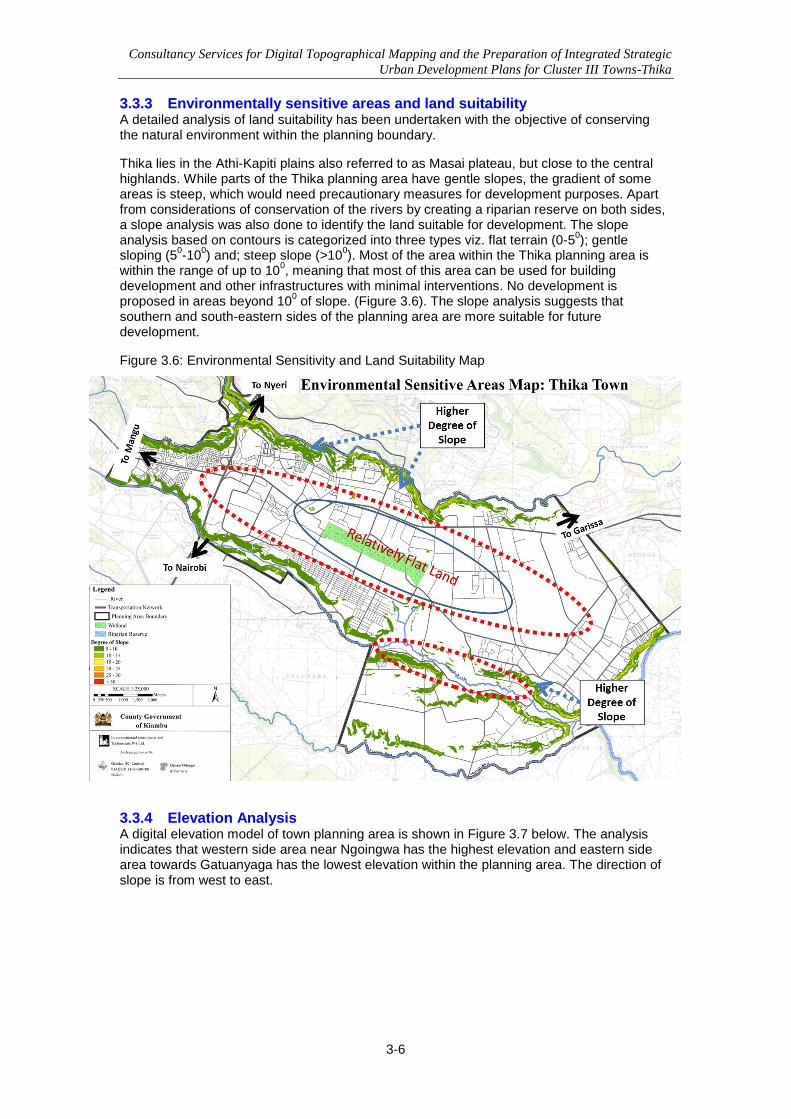
Consultancy Services for Digital Topographical Mapping and the Preparation of Integrated Strategic
Urban Development Plans for Cluster III Towns-Thika
3-6
3.3.3 Environmentally sensitive areas and land suitability A detailed analysis of land suitability has been undertaken with the objective of conserving the natural environment within the planning boundary.
Thika lies in the Athi-Kapiti plains also referred to as Masai plateau, but close to the central highlands. While parts of the Thika planning area have gentle slopes, the gradient of some areas is steep, which would need precautionary measures for development purposes. Apart from considerations of conservation of the rivers by creating a riparian reserve on both sides, a slope analysis was also done to identify the land suitable for development. The slope analysis based on contours is categorized into three types viz. flat terrain (0-5
0); gentle
sloping (50-10
0) and; steep slope (>10
0). Most of the area within the Thika planning area is
within the range of up to 100, meaning that most of this area can be used for building
development and other infrastructures with minimal interventions. No development is proposed in areas beyond 10
0 of slope. (Figure 3.6). The slope analysis suggests that
southern and south-eastern sides of the planning area are more suitable for future development.
Figure 3.6: Environmental Sensitivity and Land Suitability Map
3.3.4 Elevation Analysis A digital elevation model of town planning area is shown in Figure 3.7 below. The analysis indicates that western side area near Ngoingwa has the highest elevation and eastern side area towards Gatuanyaga has the lowest elevation within the planning area. The direction of slope is from west to east.
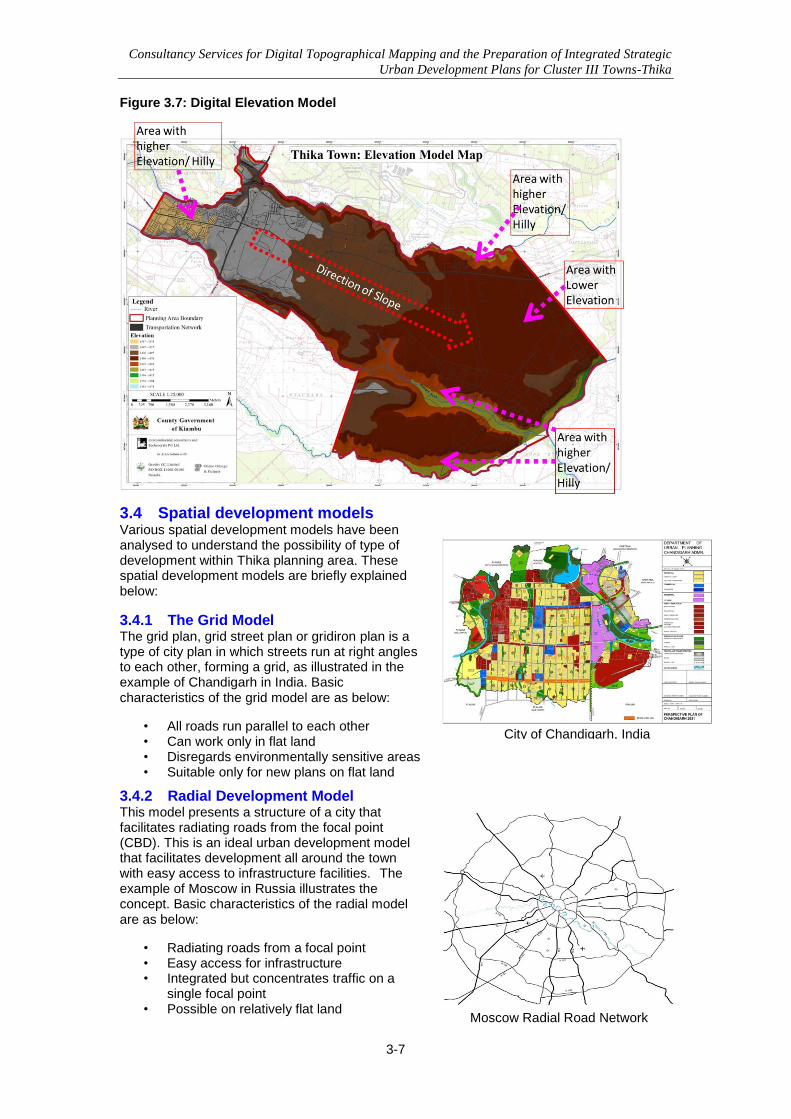
Consultancy Services for Digital Topographical Mapping and the Preparation of Integrated Strategic
Urban Development Plans for Cluster III Towns-Thika
3-7
Moscow Radial Road Network
Figure 3.7: Digital Elevation Model
3.4 Spatial development models Various spatial development models have been analysed to understand the possibility of type of development within Thika planning area. These spatial development models are briefly explained below:
3.4.1 The Grid Model The grid plan, grid street plan or gridiron plan is a type of city plan in which streets run at right angles to each other, forming a grid, as illustrated in the example of Chandigarh in India. Basic characteristics of the grid model are as below:
• All roads run parallel to each other • Can work only in flat land • Disregards environmentally sensitive areas • Suitable only for new plans on flat land
3.4.2 Radial Development Model This model presents a structure of a city that facilitates radiating roads from the focal point (CBD). This is an ideal urban development model that facilitates development all around the town with easy access to infrastructure facilities. The example of Moscow in Russia illustrates the concept. Basic characteristics of the radial model are as below:
• Radiating roads from a focal point • Easy access for infrastructure • Integrated but concentrates traffic on a
single focal point • Possible on relatively flat land
City of Chandigarh, India
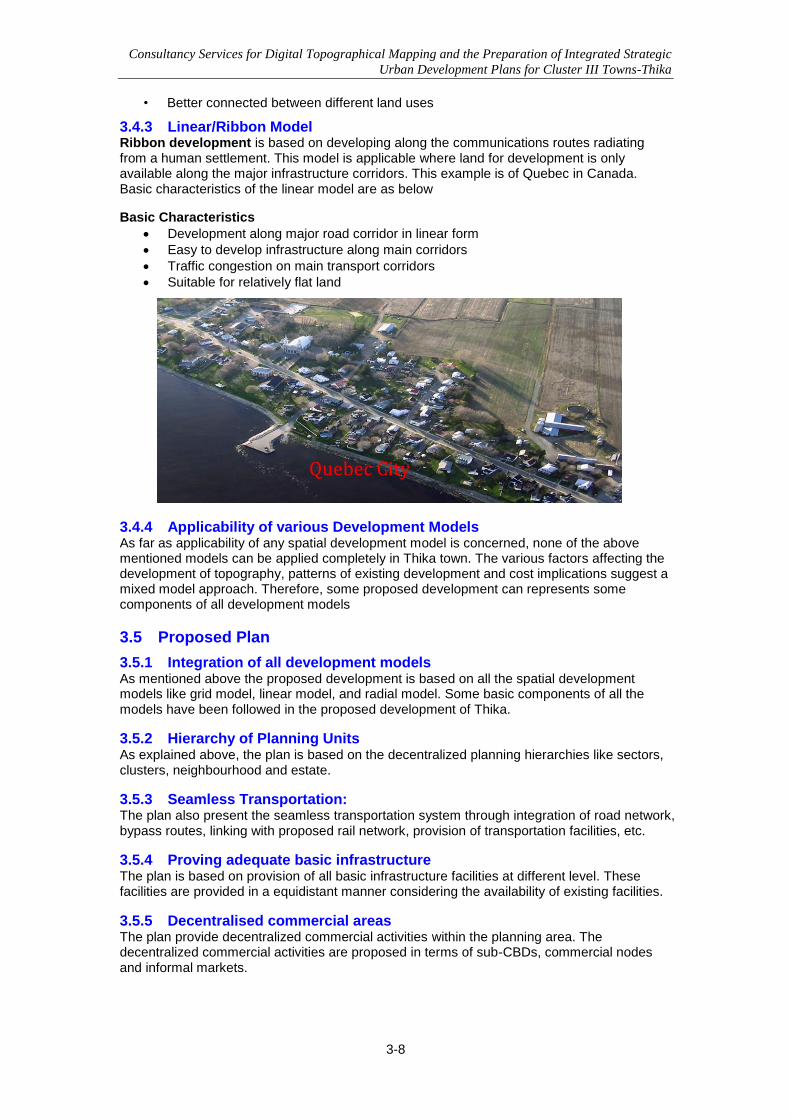
Consultancy Services for Digital Topographical Mapping and the Preparation of Integrated Strategic
Urban Development Plans for Cluster III Towns-Thika
3-8
Quebec City
• Better connected between different land uses
3.4.3 Linear/Ribbon Model Ribbon development is based on developing along the communications routes radiating from a human settlement. This model is applicable where land for development is only available along the major infrastructure corridors. This example is of Quebec in Canada. Basic characteristics of the linear model are as below
Basic Characteristics
Development along major road corridor in linear form
Easy to develop infrastructure along main corridors
Traffic congestion on main transport corridors
Suitable for relatively flat land
3.4.4 Applicability of various Development Models As far as applicability of any spatial development model is concerned, none of the above mentioned models can be applied completely in Thika town. The various factors affecting the development of topography, patterns of existing development and cost implications suggest a mixed model approach. Therefore, some proposed development can represents some components of all development models
3.5 Proposed Plan
3.5.1 Integration of all development models As mentioned above the proposed development is based on all the spatial development models like grid model, linear model, and radial model. Some basic components of all the models have been followed in the proposed development of Thika.
3.5.2 Hierarchy of Planning Units As explained above, the plan is based on the decentralized planning hierarchies like sectors, clusters, neighbourhood and estate.
3.5.3 Seamless Transportation: The plan also present the seamless transportation system through integration of road network, bypass routes, linking with proposed rail network, provision of transportation facilities, etc.
3.5.4 Proving adequate basic infrastructure The plan is based on provision of all basic infrastructure facilities at different level. These facilities are provided in a equidistant manner considering the availability of existing facilities.
3.5.5 Decentralised commercial areas The plan provide decentralized commercial activities within the planning area. The decentralized commercial activities are proposed in terms of sub-CBDs, commercial nodes and informal markets.
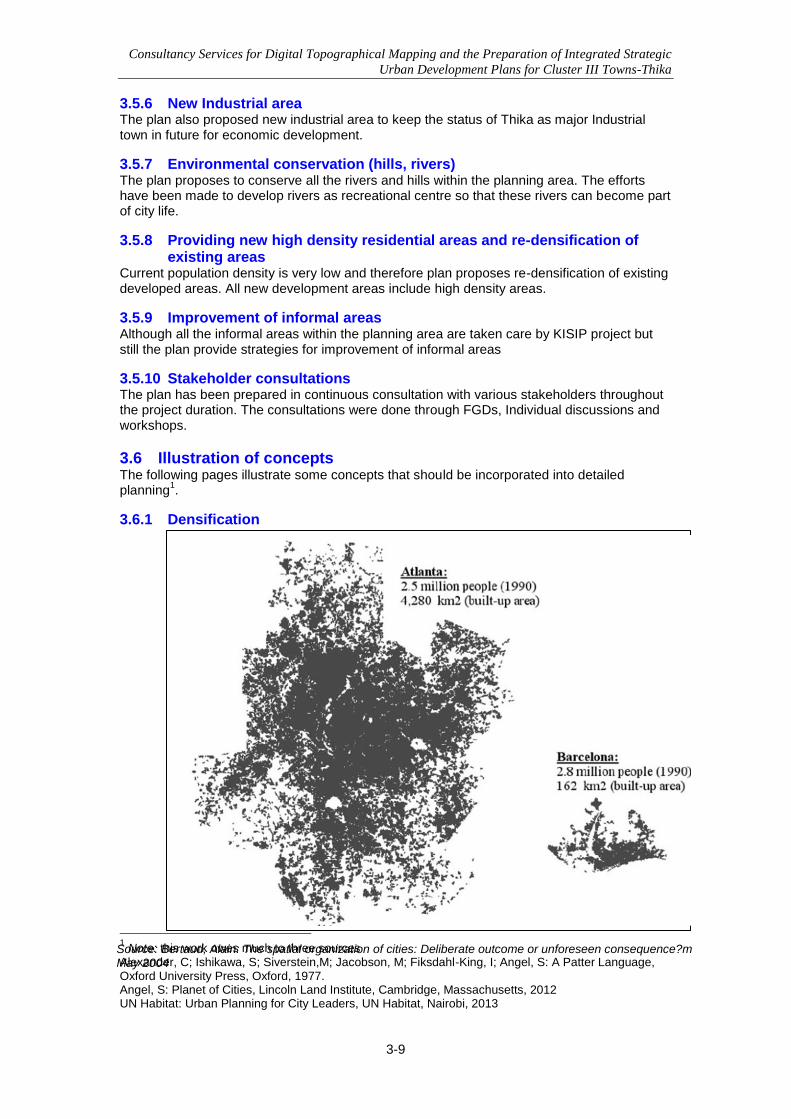
Consultancy Services for Digital Topographical Mapping and the Preparation of Integrated Strategic
Urban Development Plans for Cluster III Towns-Thika
3-9
Source: Bertaud, Alain: The spatial organization of cities: Deliberate outcome or unforeseen consequence?m May 2004
3.5.6 New Industrial area The plan also proposed new industrial area to keep the status of Thika as major Industrial town in future for economic development.
3.5.7 Environmental conservation (hills, rivers) The plan proposes to conserve all the rivers and hills within the planning area. The efforts have been made to develop rivers as recreational centre so that these rivers can become part of city life.
3.5.8 Providing new high density residential areas and re-densification of existing areas
Current population density is very low and therefore plan proposes re-densification of existing developed areas. All new development areas include high density areas.
3.5.9 Improvement of informal areas Although all the informal areas within the planning area are taken care by KISIP project but still the plan provide strategies for improvement of informal areas
3.5.10 Stakeholder consultations The plan has been prepared in continuous consultation with various stakeholders throughout the project duration. The consultations were done through FGDs, Individual discussions and workshops.
3.6 Illustration of concepts The following pages illustrate some concepts that should be incorporated into detailed planning
1.
3.6.1 Densification
1 Note: this work owes much to three sources
Alexander, C; Ishikawa, S; Siverstein,M; Jacobson, M; Fiksdahl-King, I; Angel, S: A Patter Language, Oxford University Press, Oxford, 1977. Angel, S: Planet of Cities, Lincoln Land Institute, Cambridge, Massachusetts, 2012 UN Habitat: Urban Planning for City Leaders, UN Habitat, Nairobi, 2013
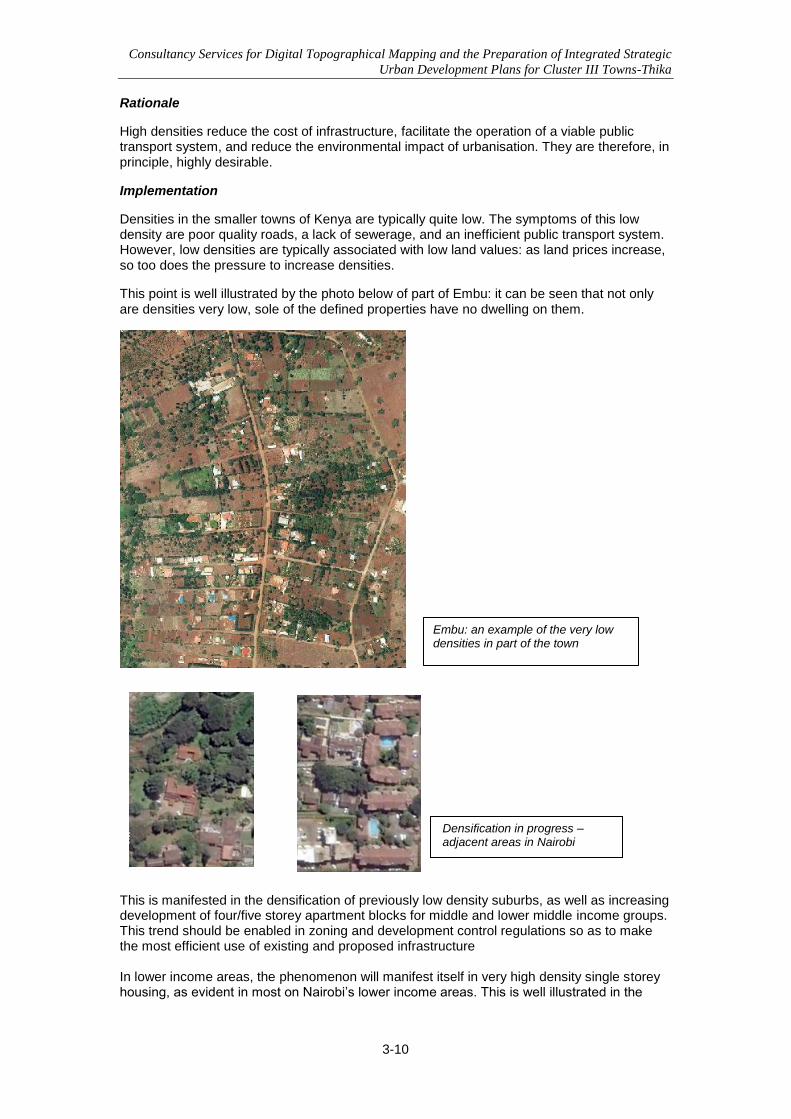
Consultancy Services for Digital Topographical Mapping and the Preparation of Integrated Strategic
Urban Development Plans for Cluster III Towns-Thika
3-10
Rationale
High densities reduce the cost of infrastructure, facilitate the operation of a viable public transport system, and reduce the environmental impact of urbanisation. They are therefore, in principle, highly desirable.
Implementation
Densities in the smaller towns of Kenya are typically quite low. The symptoms of this low density are poor quality roads, a lack of sewerage, and an inefficient public transport system. However, low densities are typically associated with low land values: as land prices increase, so too does the pressure to increase densities.
This point is well illustrated by the photo below of part of Embu: it can be seen that not only are densities very low, sole of the defined properties have no dwelling on them.
This is manifested in the densification of previously low density suburbs, as well as increasing development of four/five storey apartment blocks for middle and lower middle income groups. This trend should be enabled in zoning and development control regulations so as to make the most efficient use of existing and proposed infrastructure In lower income areas, the phenomenon will manifest itself in very high density single storey housing, as evident in most on Nairobi‟s lower income areas. This is well illustrated in the
Densification in progress – adjacent areas in Nairobi
Embu: an example of the very low densities in part of the town
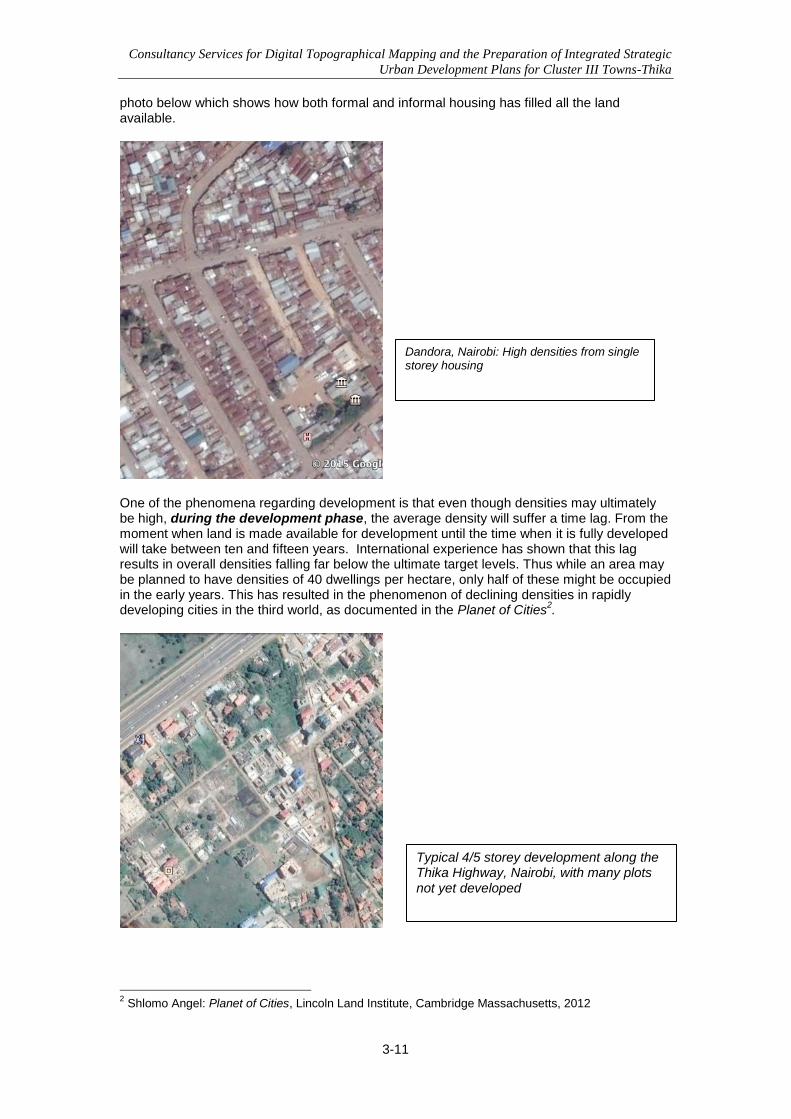
Consultancy Services for Digital Topographical Mapping and the Preparation of Integrated Strategic
Urban Development Plans for Cluster III Towns-Thika
3-11
photo below which shows how both formal and informal housing has filled all the land available.
One of the phenomena regarding development is that even though densities may ultimately be high, during the development phase, the average density will suffer a time lag. From the moment when land is made available for development until the time when it is fully developed will take between ten and fifteen years. International experience has shown that this lag results in overall densities falling far below the ultimate target levels. Thus while an area may be planned to have densities of 40 dwellings per hectare, only half of these might be occupied in the early years. This has resulted in the phenomenon of declining densities in rapidly developing cities in the third world, as documented in the Planet of Cities
2.
2 Shlomo Angel: Planet of Cities, Lincoln Land Institute, Cambridge Massachusetts, 2012
Dandora, Nairobi: High densities from single storey housing
Typical 4/5 storey development along the Thika Highway, Nairobi, with many plots not yet developed
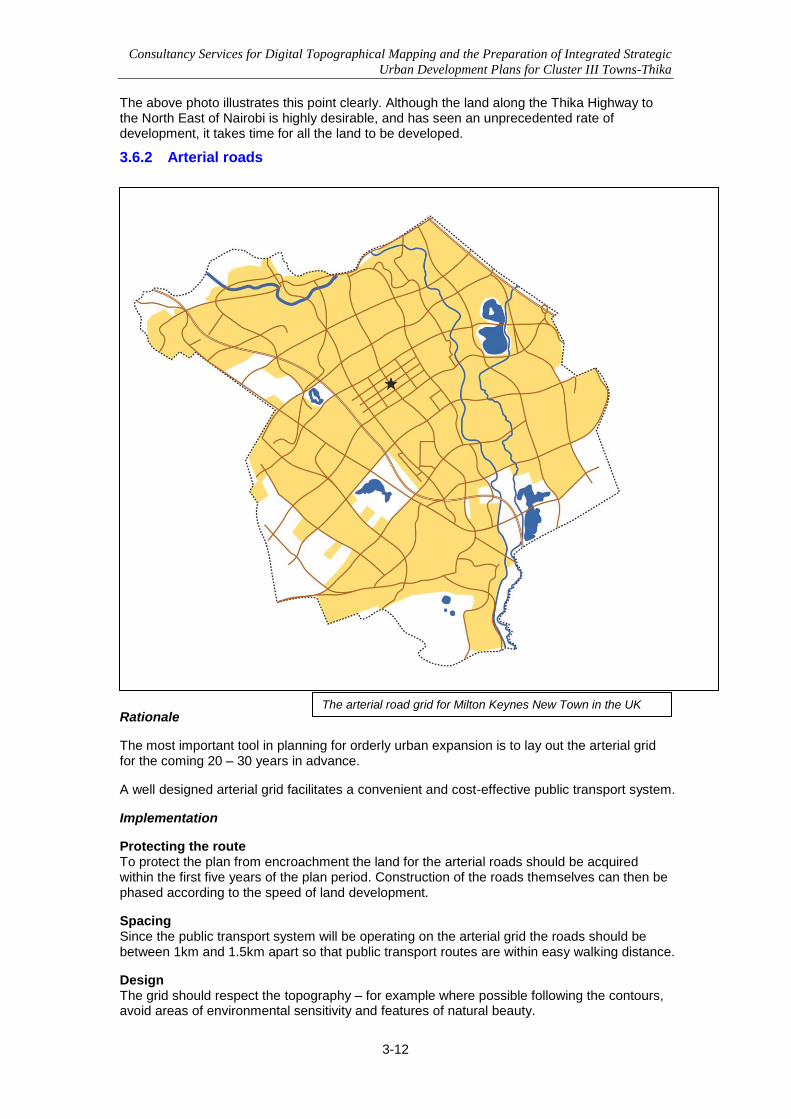
Consultancy Services for Digital Topographical Mapping and the Preparation of Integrated Strategic
Urban Development Plans for Cluster III Towns-Thika
3-12
The above photo illustrates this point clearly. Although the land along the Thika Highway to the North East of Nairobi is highly desirable, and has seen an unprecedented rate of development, it takes time for all the land to be developed.
3.6.2 Arterial roads
Rationale
The most important tool in planning for orderly urban expansion is to lay out the arterial grid for the coming 20 – 30 years in advance.
A well designed arterial grid facilitates a convenient and cost-effective public transport system.
Implementation
Protecting the route To protect the plan from encroachment the land for the arterial roads should be acquired within the first five years of the plan period. Construction of the roads themselves can then be phased according to the speed of land development.
Spacing Since the public transport system will be operating on the arterial grid the roads should be between 1km and 1.5km apart so that public transport routes are within easy walking distance.
Design The grid should respect the topography – for example where possible following the contours, avoid areas of environmental sensitivity and features of natural beauty.
The arterial road grid for Milton Keynes New Town in the UK
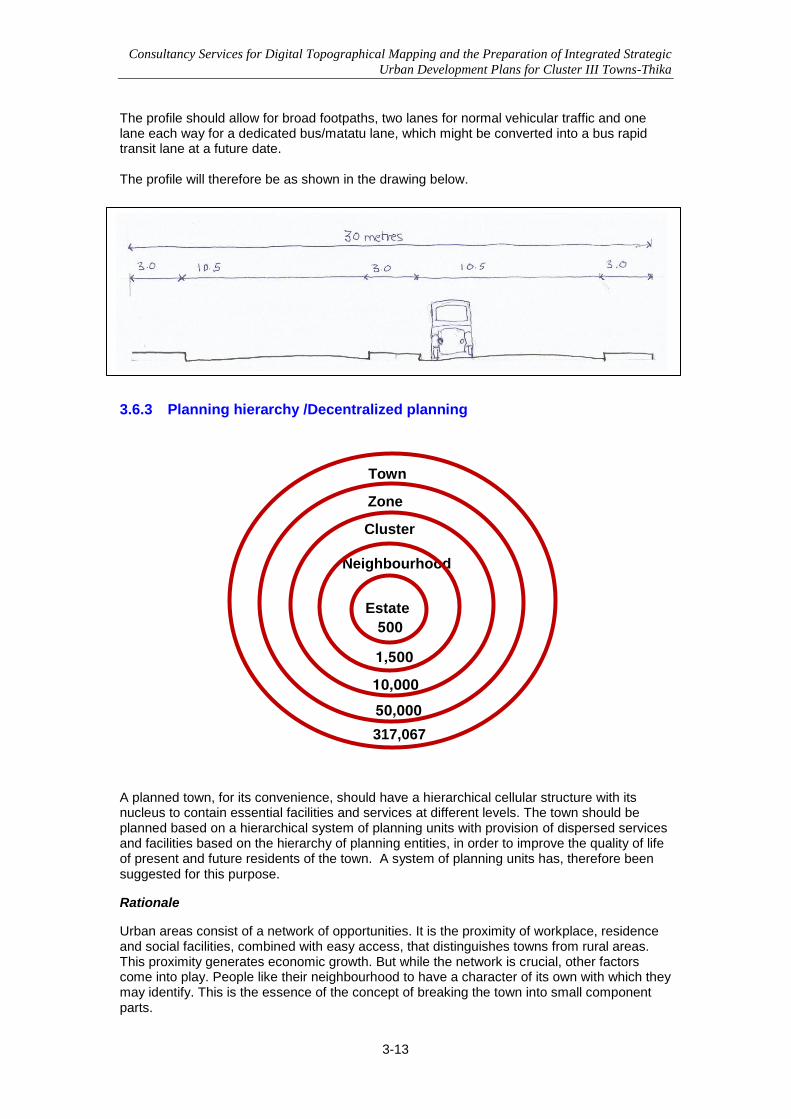
Consultancy Services for Digital Topographical Mapping and the Preparation of Integrated Strategic
Urban Development Plans for Cluster III Towns-Thika
3-13
The profile should allow for broad footpaths, two lanes for normal vehicular traffic and one lane each way for a dedicated bus/matatu lane, which might be converted into a bus rapid transit lane at a future date. The profile will therefore be as shown in the drawing below.
3.6.3 Planning hierarchy /Decentralized planning
A planned town, for its convenience, should have a hierarchical cellular structure with its nucleus to contain essential facilities and services at different levels. The town should be planned based on a hierarchical system of planning units with provision of dispersed services and facilities based on the hierarchy of planning entities, in order to improve the quality of life of present and future residents of the town. A system of planning units has, therefore been suggested for this purpose.
Rationale
Urban areas consist of a network of opportunities. It is the proximity of workplace, residence and social facilities, combined with easy access, that distinguishes towns from rural areas. This proximity generates economic growth. But while the network is crucial, other factors come into play. People like their neighbourhood to have a character of its own with which they may identify. This is the essence of the concept of breaking the town into small component parts.
Estate
Neighbourhood
Cluster
Zone
Town
500
1,500
10,000
50,000
317,067

Consultancy Services for Digital Topographical Mapping and the Preparation of Integrated Strategic
Urban Development Plans for Cluster III Towns-Thika
3-14
Implementation
There is a natural hierarchy in urban planning related to the number of persons required to support each type of facility – be it commercial or social.
Planning should therefore capitalise on this hierarchy to combine individuality at the local level with connectivity with the town as a whole.
There are two hierarchies of spatial planning units, as per Physical Planning Handbook viz. Estate and Neighbourhood. The characteristics of these planning units are given below:
Level 1: the Estate An estate is a spatial planning unit, which is adequately provided for in terms of basic community facilities and has an identity. The service centre which forms the focal point of the estate satisfies the minimum walking distance from the perimeter. The population of an estate should be able to support the services within the physical entity. The Physical Planning Handbook suggest 100 household for estate, which comes around 400 persons but the Consultants suggest 1000 population (250HHs) for an estate. It has all of the following characteristics:
Common housing design
Common services
Common entry and exit
Uniformity in plot size and design
Well-defined development period.
Population around 1000 Level 2: the Neighbourhood This can be defined as a comprehensive planning unit with some of the following characteristics:
Socio-economic identity
Common facilities such as schools, recreational, shopping centres, etc.
An almost self-contained unit
It may include several estates
Population is 5000 It may be noted that beyond neighbourhood, there are no planning units given in the Physical Planning Handbook but to cover mid-level and higher level, the consultants suggest the following additional planning units: Amenities/Infrastructure services No of Units
Neighbourhood park 1
Kindergarten 1
Bakery 1
Dispensary/ Small Clinic with Chemist Shop 1
Nursery school 1
Primary school 1
Police post 1
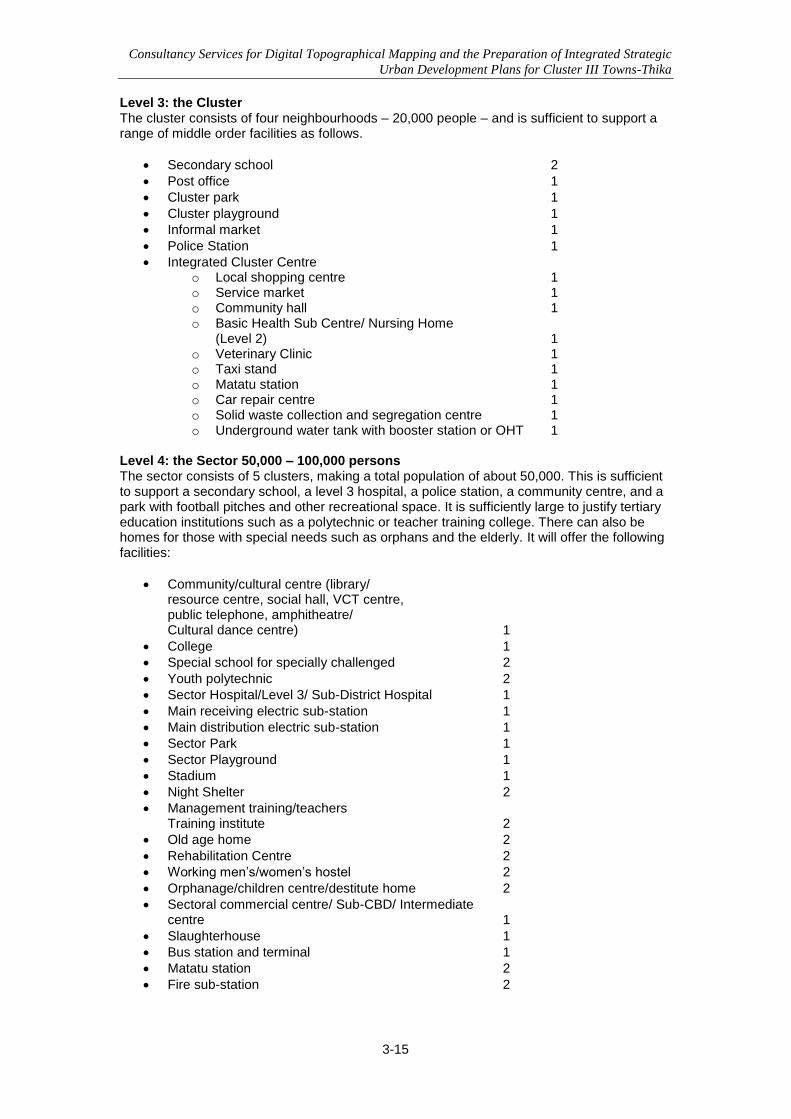
Consultancy Services for Digital Topographical Mapping and the Preparation of Integrated Strategic
Urban Development Plans for Cluster III Towns-Thika
3-15
Level 3: the Cluster The cluster consists of four neighbourhoods – 20,000 people – and is sufficient to support a range of middle order facilities as follows.
Secondary school 2
Post office 1
Cluster park 1
Cluster playground 1
Informal market 1
Police Station 1
Integrated Cluster Centre o Local shopping centre 1 o Service market 1 o Community hall 1 o Basic Health Sub Centre/ Nursing Home
(Level 2) 1 o Veterinary Clinic 1 o Taxi stand 1 o Matatu station 1 o Car repair centre 1 o Solid waste collection and segregation centre 1 o Underground water tank with booster station or OHT 1
Level 4: the Sector 50,000 – 100,000 persons The sector consists of 5 clusters, making a total population of about 50,000. This is sufficient to support a secondary school, a level 3 hospital, a police station, a community centre, and a park with football pitches and other recreational space. It is sufficiently large to justify tertiary education institutions such as a polytechnic or teacher training college. There can also be homes for those with special needs such as orphans and the elderly. It will offer the following facilities:
Community/cultural centre (library/ resource centre, social hall, VCT centre, public telephone, amphitheatre/ Cultural dance centre) 1
College 1
Special school for specially challenged 2
Youth polytechnic 2
Sector Hospital/Level 3/ Sub-District Hospital 1
Main receiving electric sub-station 1
Main distribution electric sub-station 1
Sector Park 1
Sector Playground 1
Stadium 1
Night Shelter 2
Management training/teachers Training institute 2
Old age home 2
Rehabilitation Centre 2
Working men‟s/women‟s hostel 2
Orphanage/children centre/destitute home 2
Sectoral commercial centre/ Sub-CBD/ Intermediate centre 1
Slaughterhouse 1
Bus station and terminal 1
Matatu station 2
Fire sub-station 2
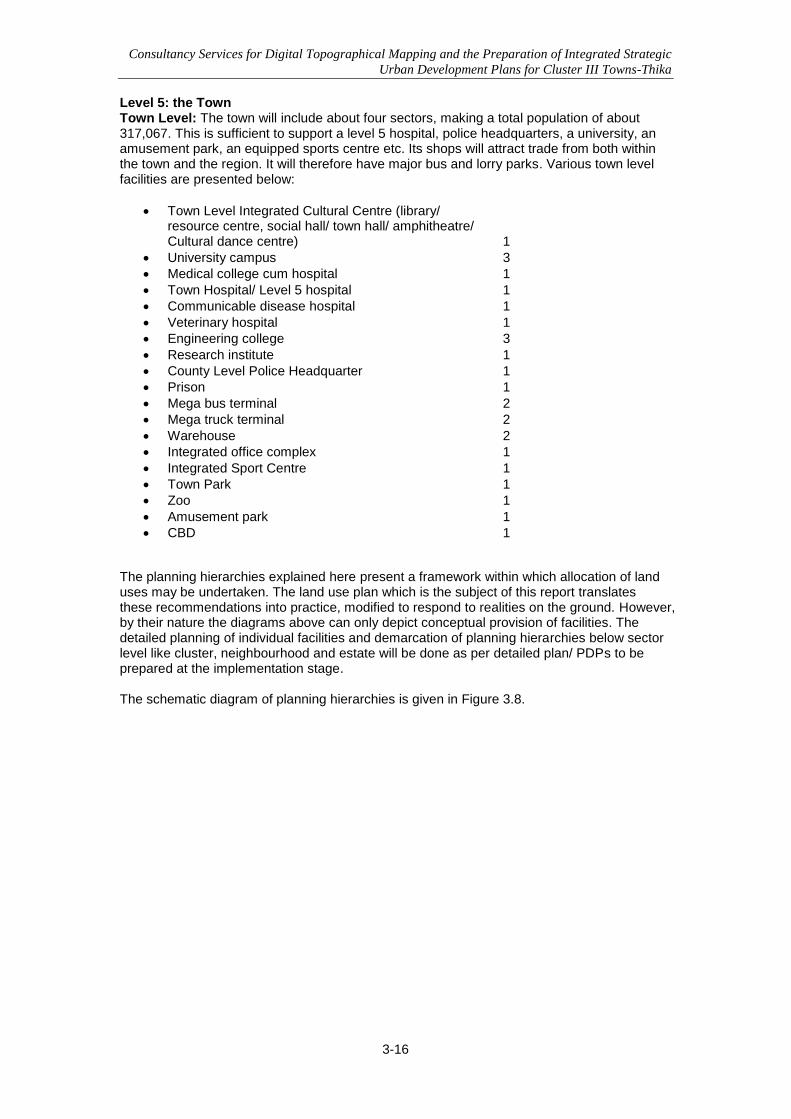
Consultancy Services for Digital Topographical Mapping and the Preparation of Integrated Strategic
Urban Development Plans for Cluster III Towns-Thika
3-16
Level 5: the Town Town Level: The town will include about four sectors, making a total population of about 317,067. This is sufficient to support a level 5 hospital, police headquarters, a university, an amusement park, an equipped sports centre etc. Its shops will attract trade from both within the town and the region. It will therefore have major bus and lorry parks. Various town level facilities are presented below:
Town Level Integrated Cultural Centre (library/ resource centre, social hall/ town hall/ amphitheatre/ Cultural dance centre) 1
University campus 3
Medical college cum hospital 1
Town Hospital/ Level 5 hospital 1
Communicable disease hospital 1
Veterinary hospital 1
Engineering college 3
Research institute 1
County Level Police Headquarter 1
Prison 1
Mega bus terminal 2
Mega truck terminal 2
Warehouse 2
Integrated office complex 1
Integrated Sport Centre 1
Town Park 1
Zoo 1
Amusement park 1
CBD 1
The planning hierarchies explained here present a framework within which allocation of land uses may be undertaken. The land use plan which is the subject of this report translates these recommendations into practice, modified to respond to realities on the ground. However, by their nature the diagrams above can only depict conceptual provision of facilities. The detailed planning of individual facilities and demarcation of planning hierarchies below sector level like cluster, neighbourhood and estate will be done as per detailed plan/ PDPs to be prepared at the implementation stage. The schematic diagram of planning hierarchies is given in Figure 3.8.
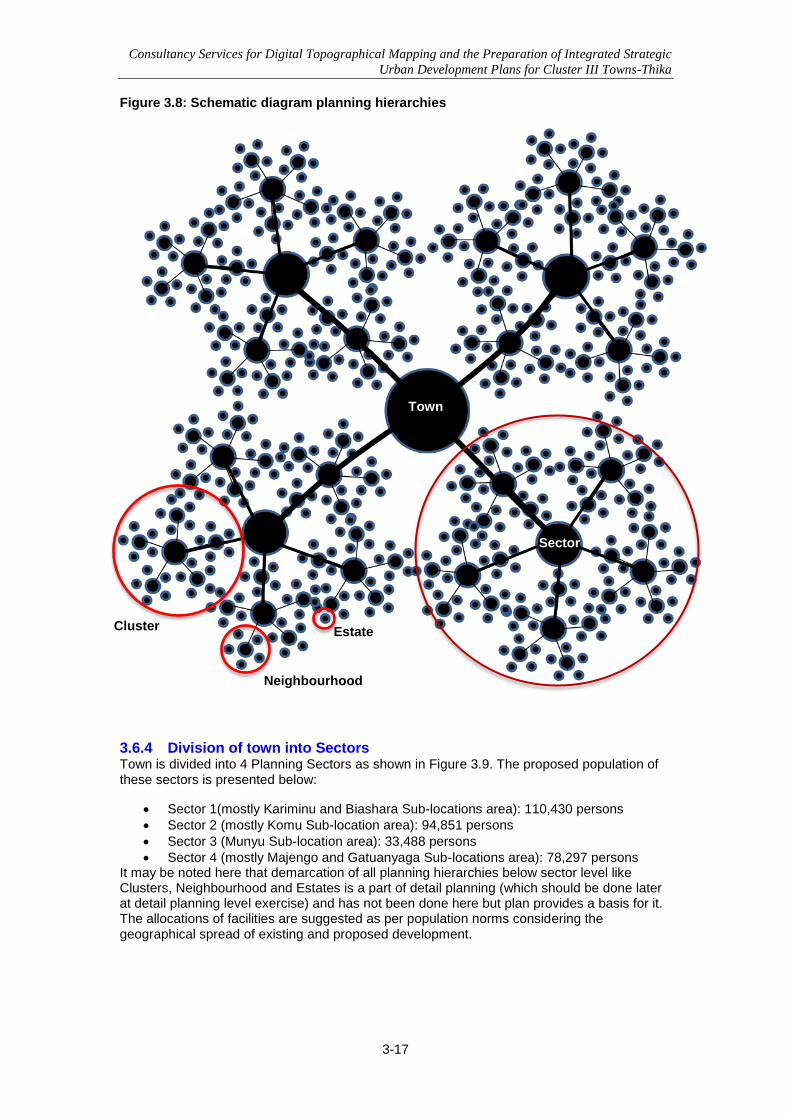
Consultancy Services for Digital Topographical Mapping and the Preparation of Integrated Strategic
Urban Development Plans for Cluster III Towns-Thika
3-17
Figure 3.8: Schematic diagram planning hierarchies
3.6.4 Division of town into Sectors Town is divided into 4 Planning Sectors as shown in Figure 3.9. The proposed population of these sectors is presented below:
Sector 1(mostly Kariminu and Biashara Sub-locations area): 110,430 persons
Sector 2 (mostly Komu Sub-location area): 94,851 persons
Sector 3 (Munyu Sub-location area): 33,488 persons
Sector 4 (mostly Majengo and Gatuanyaga Sub-locations area): 78,297 persons It may be noted here that demarcation of all planning hierarchies below sector level like Clusters, Neighbourhood and Estates is a part of detail planning (which should be done later at detail planning level exercise) and has not been done here but plan provides a basis for it. The allocations of facilities are suggested as per population norms considering the geographical spread of existing and proposed development.
Cluster
Neighbourhood
Estate
Town
Sector
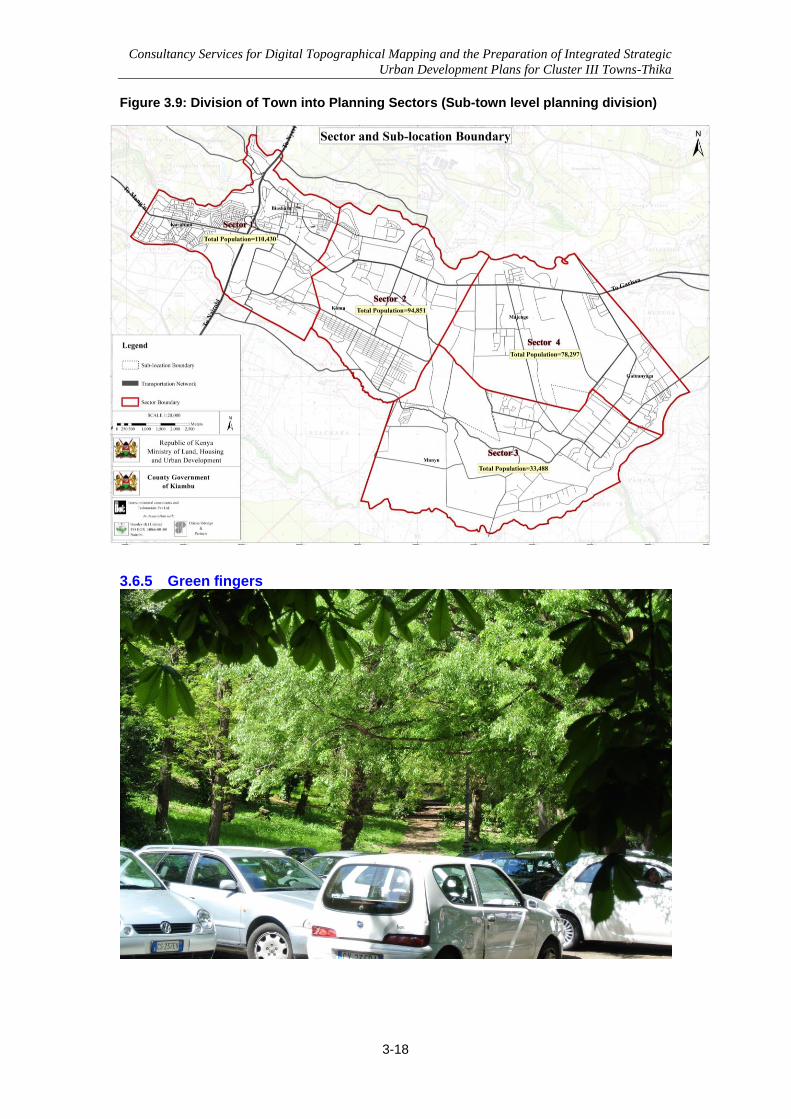
Consultancy Services for Digital Topographical Mapping and the Preparation of Integrated Strategic
Urban Development Plans for Cluster III Towns-Thika
3-18
Figure 3.9: Division of Town into Planning Sectors (Sub-town level planning division)
3.6.5 Green fingers
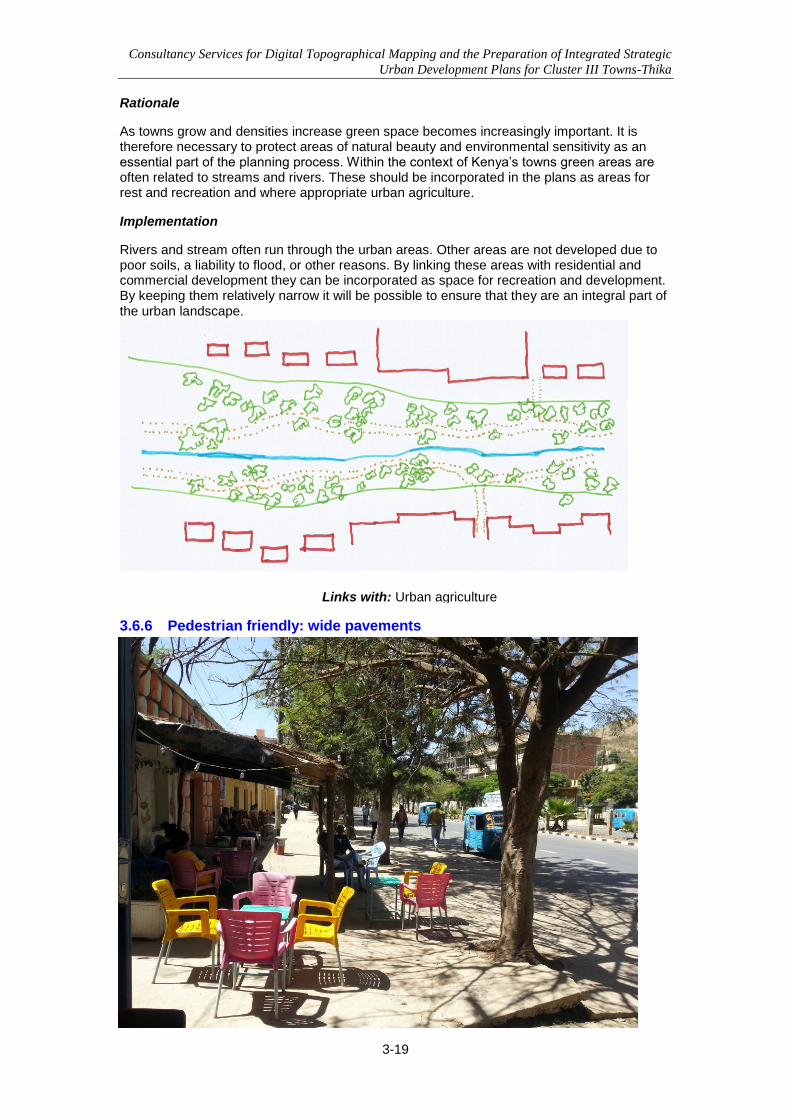
Consultancy Services for Digital Topographical Mapping and the Preparation of Integrated Strategic
Urban Development Plans for Cluster III Towns-Thika
3-19
Rationale
As towns grow and densities increase green space becomes increasingly important. It is therefore necessary to protect areas of natural beauty and environmental sensitivity as an essential part of the planning process. Within the context of Kenya‟s towns green areas are often related to streams and rivers. These should be incorporated in the plans as areas for rest and recreation and where appropriate urban agriculture.
Implementation
Rivers and stream often run through the urban areas. Other areas are not developed due to poor soils, a liability to flood, or other reasons. By linking these areas with residential and commercial development they can be incorporated as space for recreation and development. By keeping them relatively narrow it will be possible to ensure that they are an integral part of the urban landscape.
3.6.6 Pedestrian friendly: wide pavements
Links with: Urban agriculture
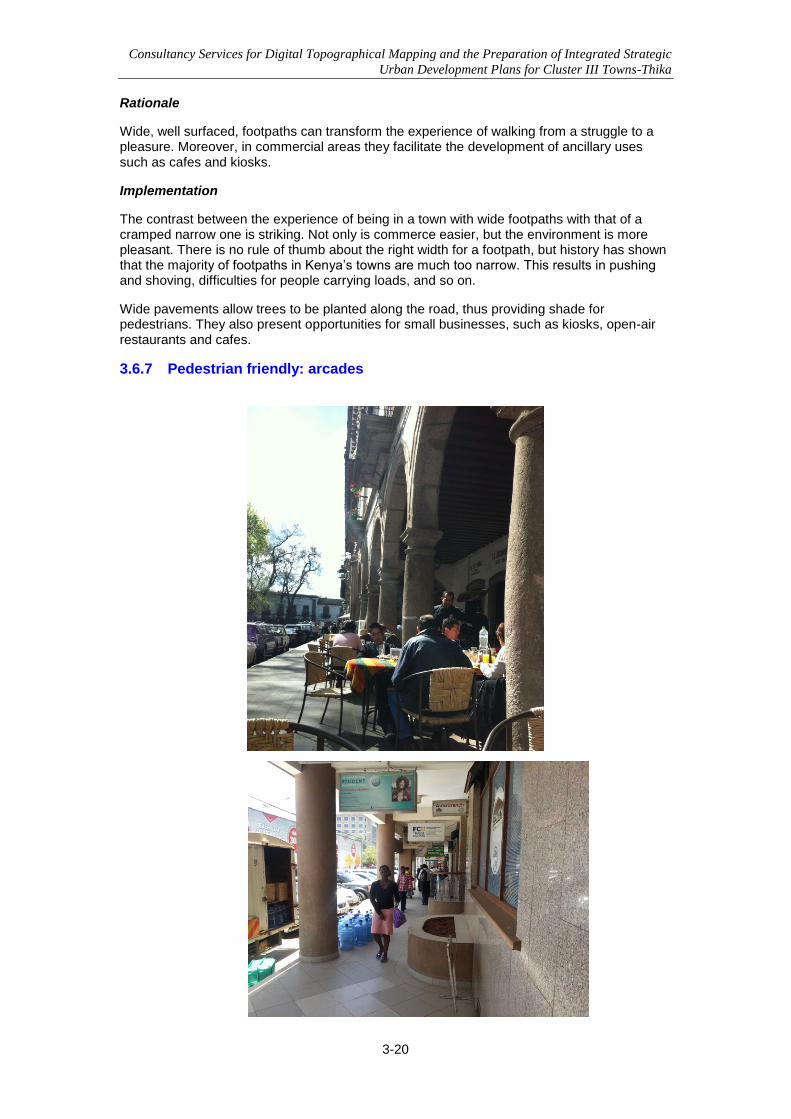
Consultancy Services for Digital Topographical Mapping and the Preparation of Integrated Strategic
Urban Development Plans for Cluster III Towns-Thika
3-20
Rationale
Wide, well surfaced, footpaths can transform the experience of walking from a struggle to a pleasure. Moreover, in commercial areas they facilitate the development of ancillary uses such as cafes and kiosks.
Implementation
The contrast between the experience of being in a town with wide footpaths with that of a cramped narrow one is striking. Not only is commerce easier, but the environment is more pleasant. There is no rule of thumb about the right width for a footpath, but history has shown that the majority of footpaths in Kenya‟s towns are much too narrow. This results in pushing and shoving, difficulties for people carrying loads, and so on.
Wide pavements allow trees to be planted along the road, thus providing shade for pedestrians. They also present opportunities for small businesses, such as kiosks, open-air restaurants and cafes.
3.6.7 Pedestrian friendly: arcades
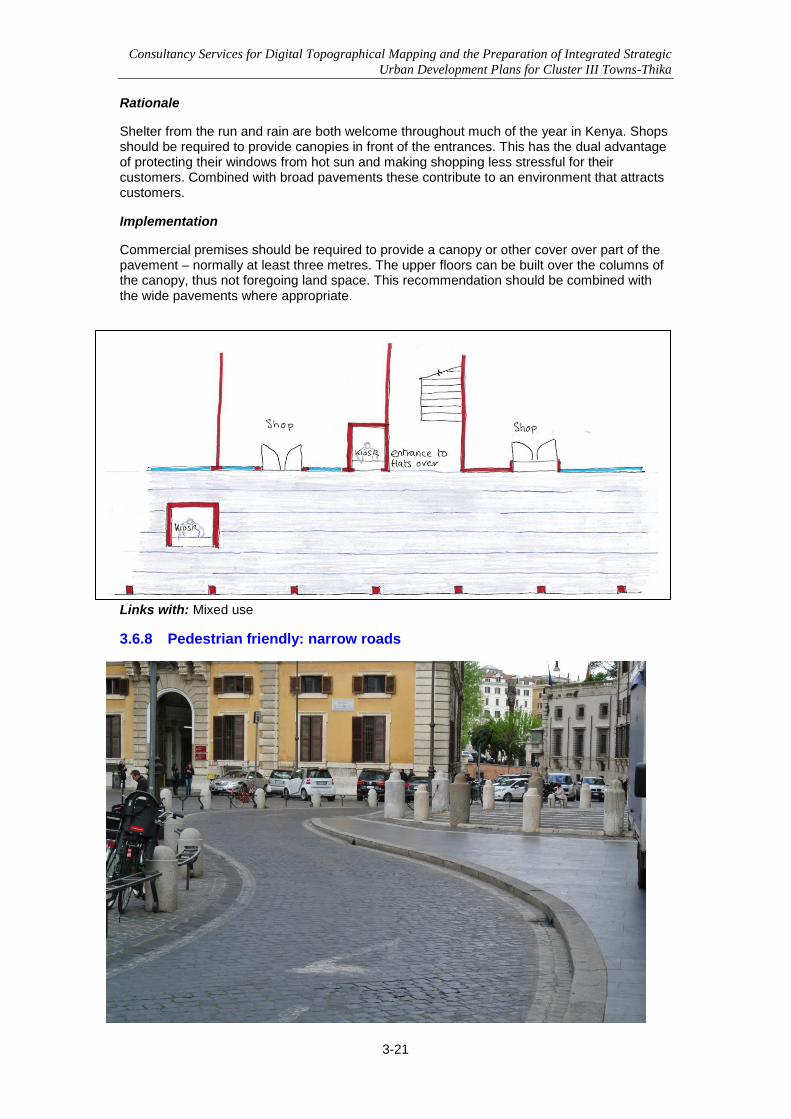
Consultancy Services for Digital Topographical Mapping and the Preparation of Integrated Strategic
Urban Development Plans for Cluster III Towns-Thika
3-21
Rationale
Shelter from the run and rain are both welcome throughout much of the year in Kenya. Shops should be required to provide canopies in front of the entrances. This has the dual advantage of protecting their windows from hot sun and making shopping less stressful for their customers. Combined with broad pavements these contribute to an environment that attracts customers.
Implementation
Commercial premises should be required to provide a canopy or other cover over part of the pavement – normally at least three metres. The upper floors can be built over the columns of the canopy, thus not foregoing land space. This recommendation should be combined with the wide pavements where appropriate.
Links with: Mixed use
3.6.8 Pedestrian friendly: narrow roads
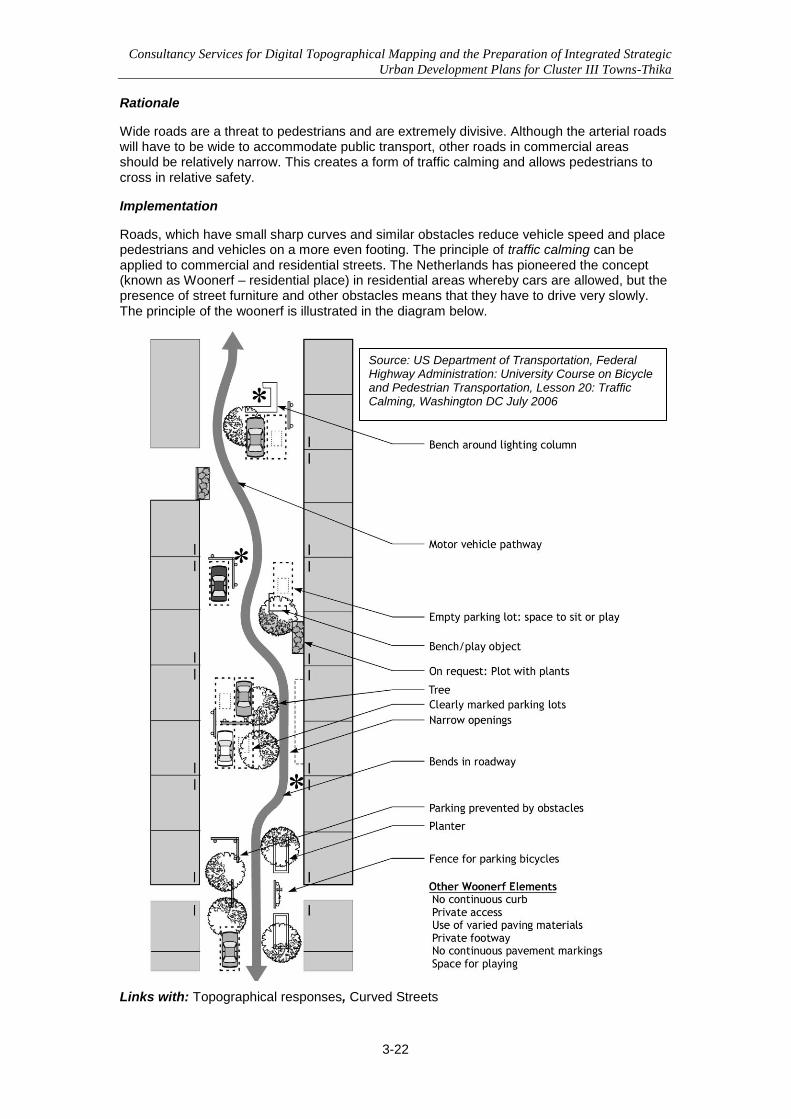
Consultancy Services for Digital Topographical Mapping and the Preparation of Integrated Strategic
Urban Development Plans for Cluster III Towns-Thika
3-22
Rationale
Wide roads are a threat to pedestrians and are extremely divisive. Although the arterial roads will have to be wide to accommodate public transport, other roads in commercial areas should be relatively narrow. This creates a form of traffic calming and allows pedestrians to cross in relative safety.
Implementation
Roads, which have small sharp curves and similar obstacles reduce vehicle speed and place pedestrians and vehicles on a more even footing. The principle of traffic calming can be applied to commercial and residential streets. The Netherlands has pioneered the concept (known as Woonerf – residential place) in residential areas whereby cars are allowed, but the presence of street furniture and other obstacles means that they have to drive very slowly. The principle of the woonerf is illustrated in the diagram below.
Links with: Topographical responses, Curved Streets
Source: US Department of Transportation, Federal Highway Administration: University Course on Bicycle and Pedestrian Transportation, Lesson 20: Traffic Calming, Washington DC July 2006
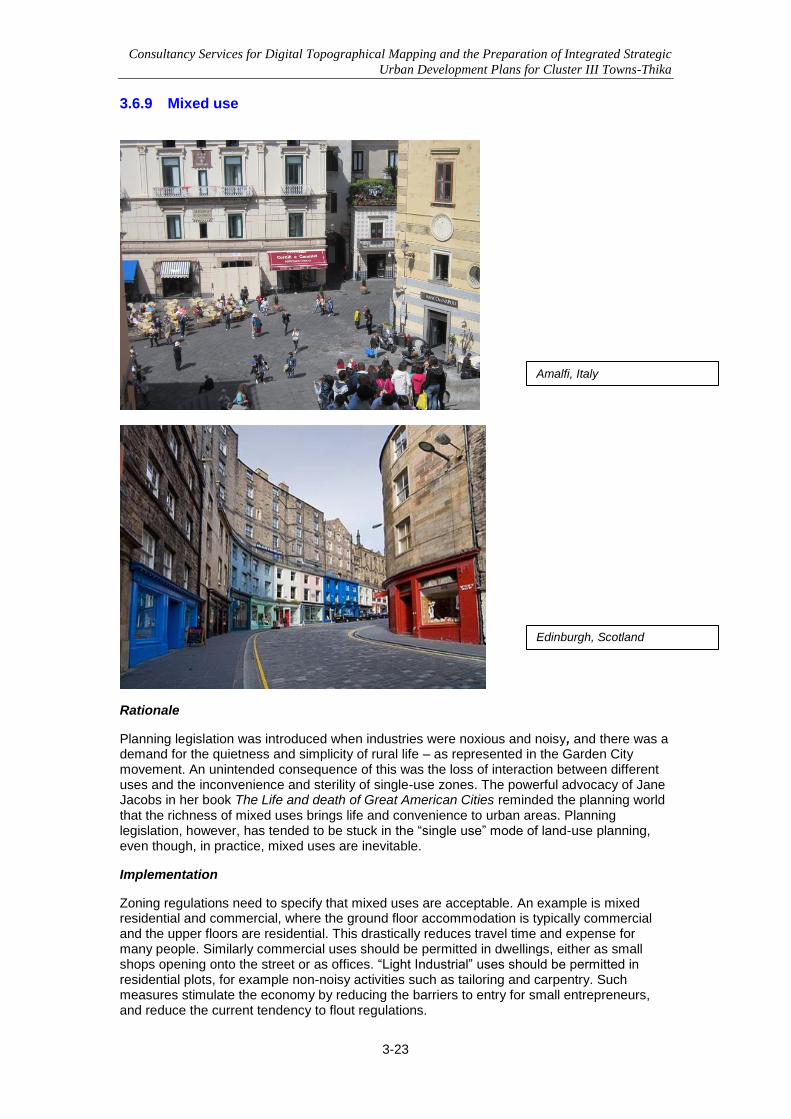
Consultancy Services for Digital Topographical Mapping and the Preparation of Integrated Strategic
Urban Development Plans for Cluster III Towns-Thika
3-23
3.6.9 Mixed use
Rationale
Planning legislation was introduced when industries were noxious and noisy, and there was a demand for the quietness and simplicity of rural life – as represented in the Garden City movement. An unintended consequence of this was the loss of interaction between different uses and the inconvenience and sterility of single-use zones. The powerful advocacy of Jane Jacobs in her book The Life and death of Great American Cities reminded the planning world that the richness of mixed uses brings life and convenience to urban areas. Planning legislation, however, has tended to be stuck in the “single use” mode of land-use planning, even though, in practice, mixed uses are inevitable.
Implementation
Zoning regulations need to specify that mixed uses are acceptable. An example is mixed residential and commercial, where the ground floor accommodation is typically commercial and the upper floors are residential. This drastically reduces travel time and expense for many people. Similarly commercial uses should be permitted in dwellings, either as small shops opening onto the street or as offices. “Light Industrial” uses should be permitted in residential plots, for example non-noisy activities such as tailoring and carpentry. Such measures stimulate the economy by reducing the barriers to entry for small entrepreneurs, and reduce the current tendency to flout regulations.
Amalfi, Italy
Edinburgh, Scotland
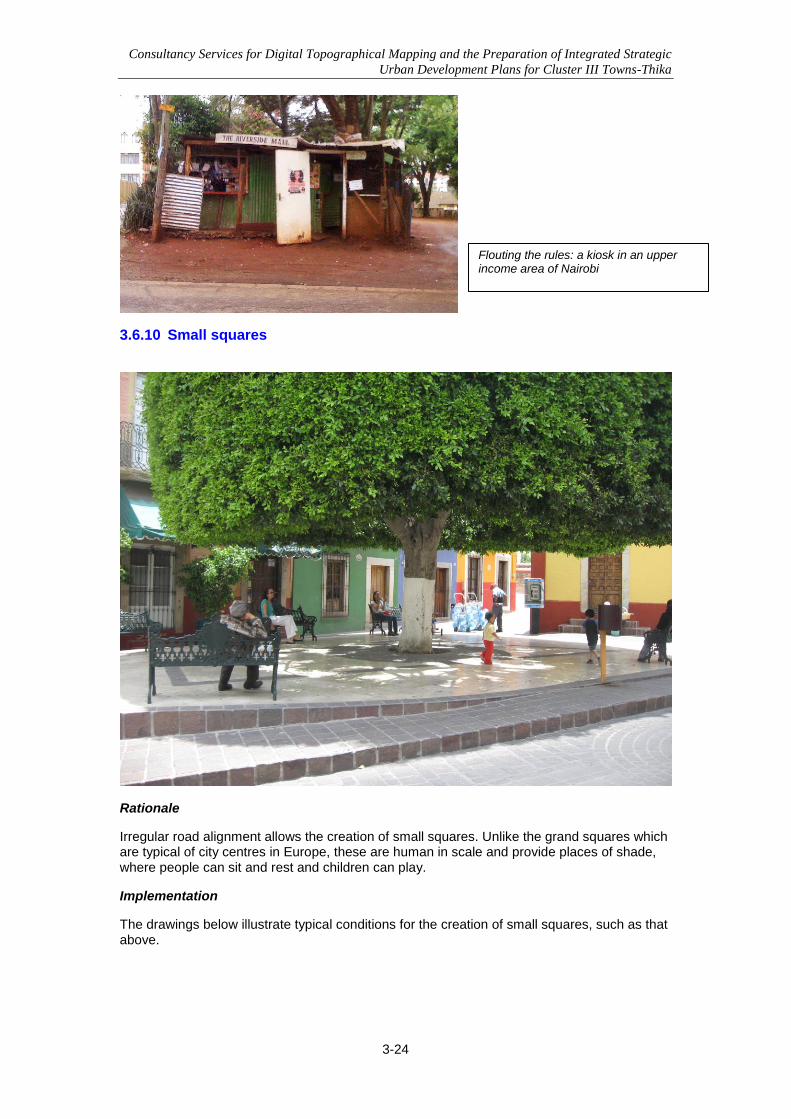
Consultancy Services for Digital Topographical Mapping and the Preparation of Integrated Strategic
Urban Development Plans for Cluster III Towns-Thika
3-24
3.6.10 Small squares
Rationale
Irregular road alignment allows the creation of small squares. Unlike the grand squares which are typical of city centres in Europe, these are human in scale and provide places of shade, where people can sit and rest and children can play.
Implementation
The drawings below illustrate typical conditions for the creation of small squares, such as that above.
Flouting the rules: a kiosk in an upper income area of Nairobi
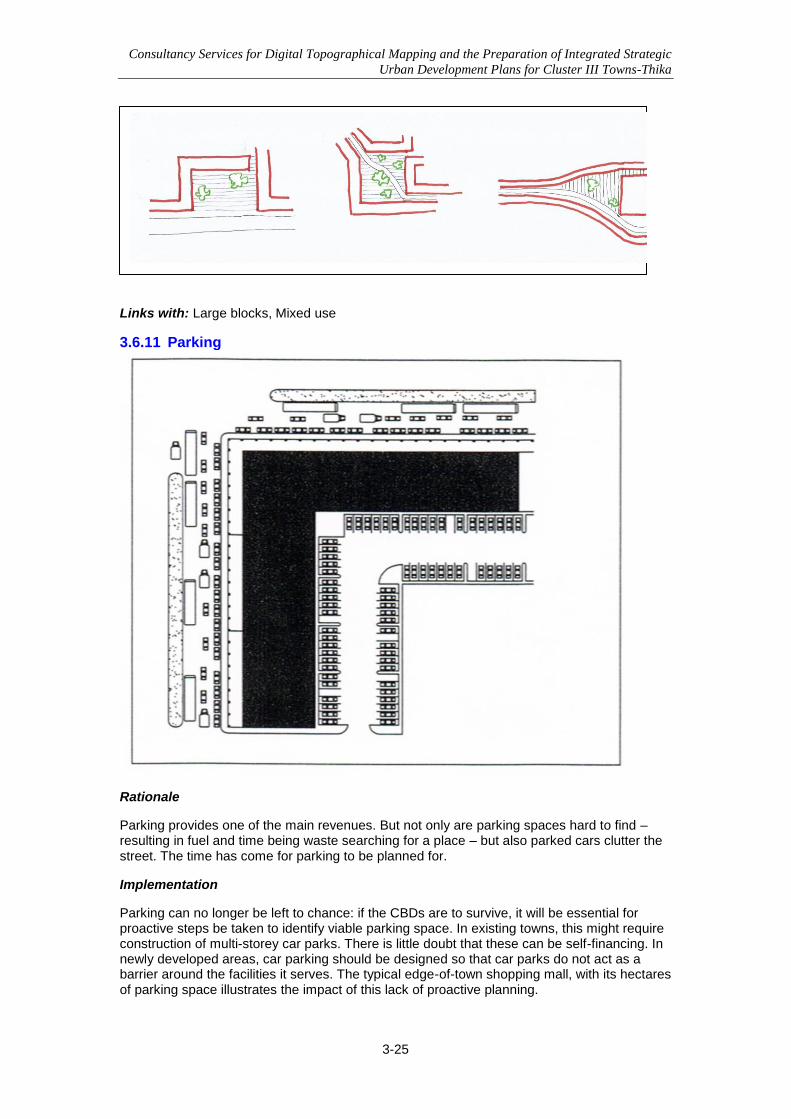
Consultancy Services for Digital Topographical Mapping and the Preparation of Integrated Strategic
Urban Development Plans for Cluster III Towns-Thika
3-25
Links with: Large blocks, Mixed use
3.6.11 Parking
Rationale
Parking provides one of the main revenues. But not only are parking spaces hard to find – resulting in fuel and time being waste searching for a place – but also parked cars clutter the street. The time has come for parking to be planned for.
Implementation
Parking can no longer be left to chance: if the CBDs are to survive, it will be essential for proactive steps be taken to identify viable parking space. In existing towns, this might require construction of multi-storey car parks. There is little doubt that these can be self-financing. In newly developed areas, car parking should be designed so that car parks do not act as a barrier around the facilities it serves. The typical edge-of-town shopping mall, with its hectares of parking space illustrates the impact of this lack of proactive planning.
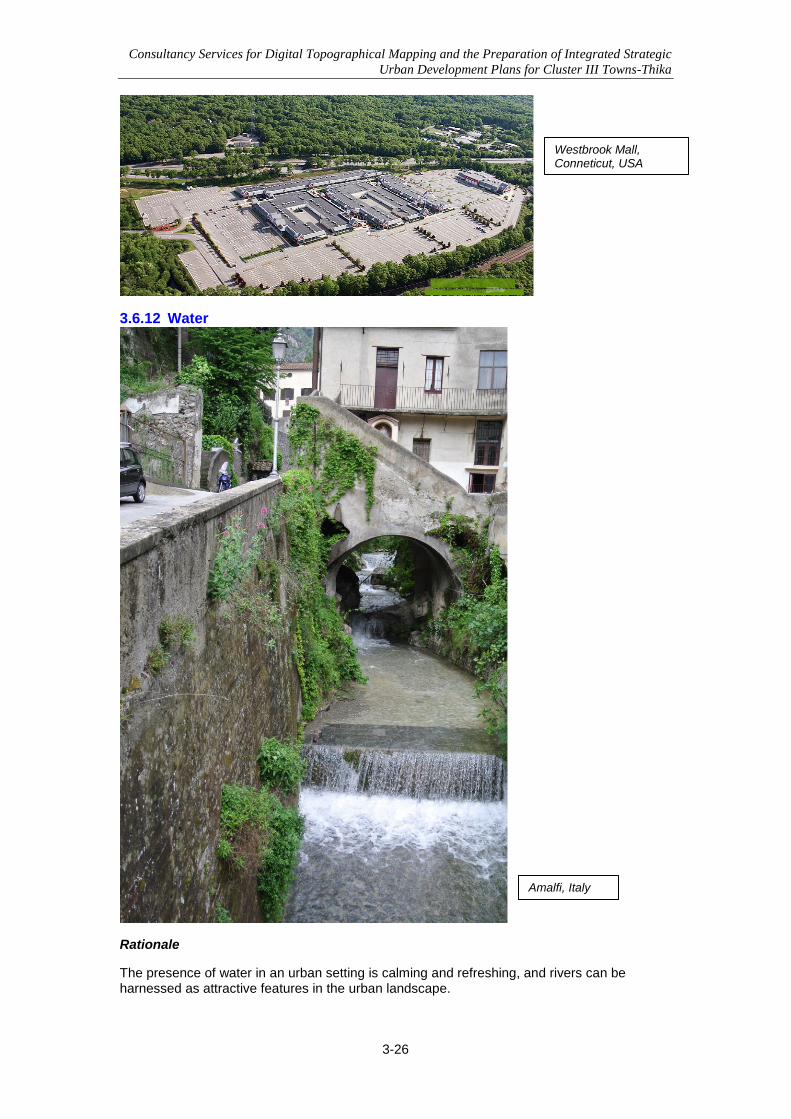
Consultancy Services for Digital Topographical Mapping and the Preparation of Integrated Strategic
Urban Development Plans for Cluster III Towns-Thika
3-26
Westbrook Mall, Conneticut, USA
3.6.12 Water
Rationale
The presence of water in an urban setting is calming and refreshing, and rivers can be harnessed as attractive features in the urban landscape.
Amalfi, Italy
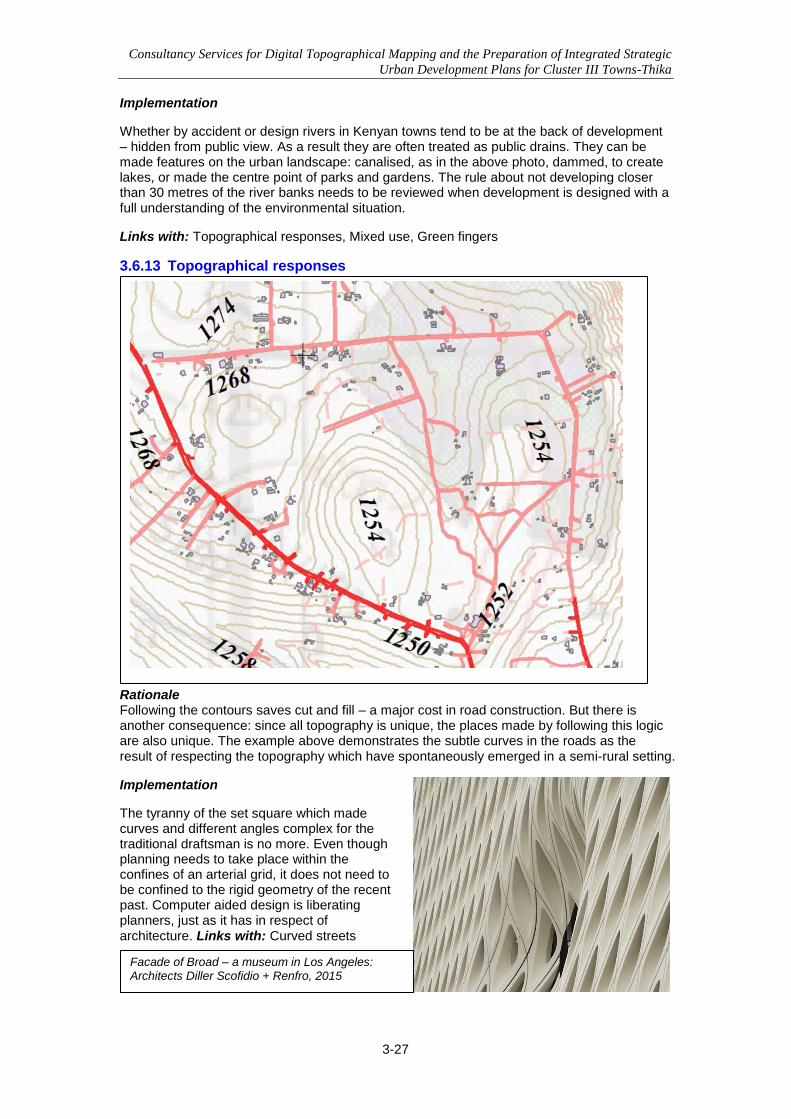
Consultancy Services for Digital Topographical Mapping and the Preparation of Integrated Strategic
Urban Development Plans for Cluster III Towns-Thika
3-27
Facade of Broad – a museum in Los Angeles: Architects Diller Scofidio + Renfro, 2015
Implementation
Whether by accident or design rivers in Kenyan towns tend to be at the back of development – hidden from public view. As a result they are often treated as public drains. They can be made features on the urban landscape: canalised, as in the above photo, dammed, to create lakes, or made the centre point of parks and gardens. The rule about not developing closer than 30 metres of the river banks needs to be reviewed when development is designed with a full understanding of the environmental situation.
Links with: Topographical responses, Mixed use, Green fingers
3.6.13 Topographical responses
Rationale Following the contours saves cut and fill – a major cost in road construction. But there is another consequence: since all topography is unique, the places made by following this logic are also unique. The example above demonstrates the subtle curves in the roads as the result of respecting the topography which have spontaneously emerged in a semi-rural setting.
Implementation
The tyranny of the set square which made curves and different angles complex for the traditional draftsman is no more. Even though planning needs to take place within the confines of an arterial grid, it does not need to be confined to the rigid geometry of the recent past. Computer aided design is liberating planners, just as it has in respect of architecture. Links with: Curved streets
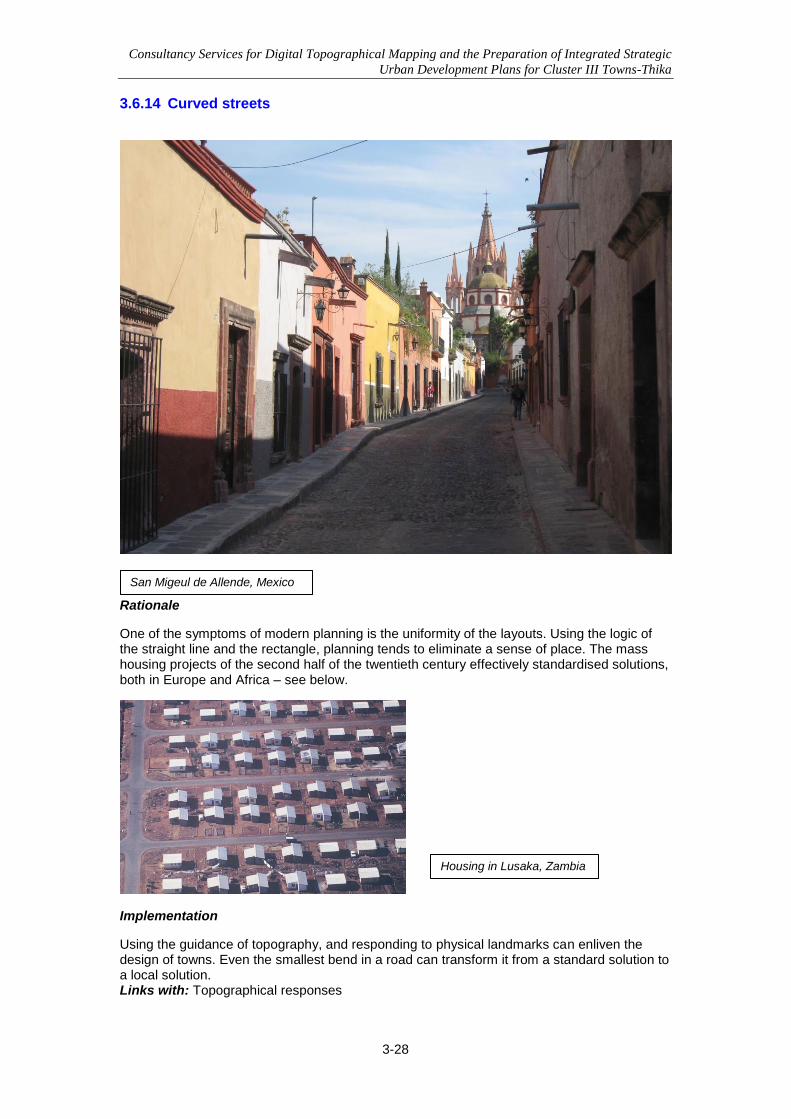
Consultancy Services for Digital Topographical Mapping and the Preparation of Integrated Strategic
Urban Development Plans for Cluster III Towns-Thika
3-28
San Migeul de Allende, Mexico
3.6.14 Curved streets
Rationale
One of the symptoms of modern planning is the uniformity of the layouts. Using the logic of the straight line and the rectangle, planning tends to eliminate a sense of place. The mass housing projects of the second half of the twentieth century effectively standardised solutions, both in Europe and Africa – see below.
Implementation
Using the guidance of topography, and responding to physical landmarks can enliven the design of towns. Even the smallest bend in a road can transform it from a standard solution to a local solution. Links with: Topographical responses
Housing in Lusaka, Zambia
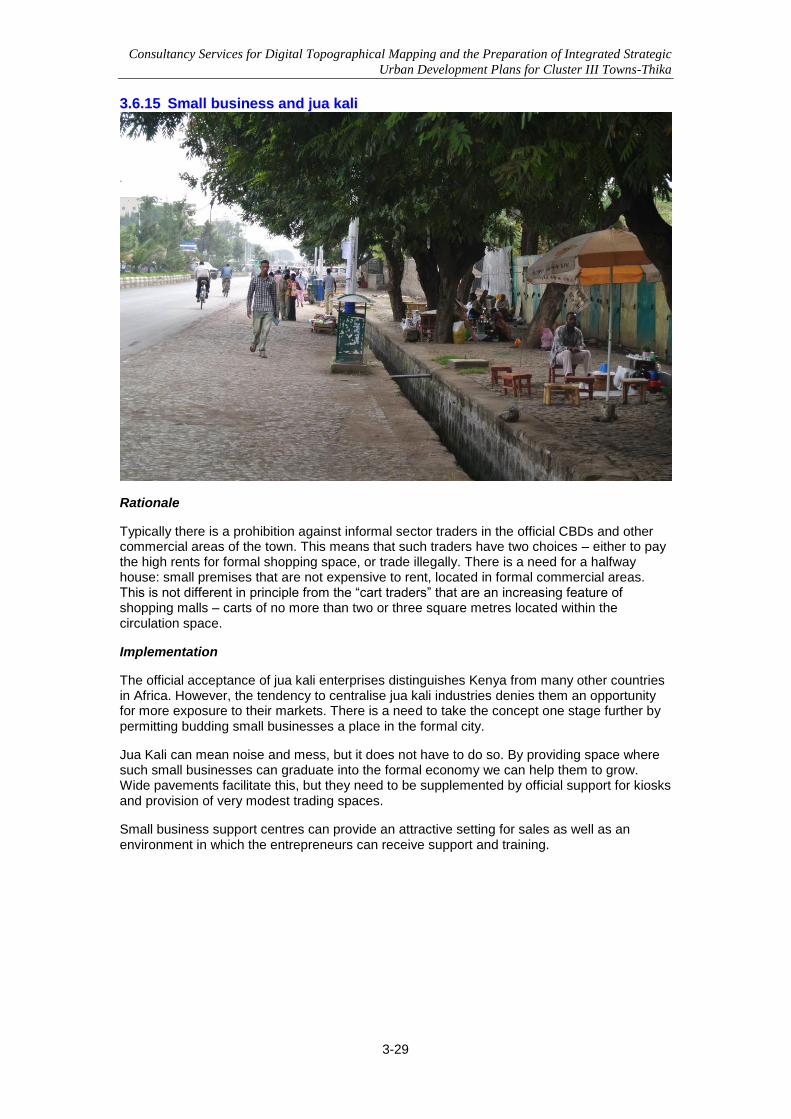
Consultancy Services for Digital Topographical Mapping and the Preparation of Integrated Strategic
Urban Development Plans for Cluster III Towns-Thika
3-29
3.6.15 Small business and jua kali
Rationale
Typically there is a prohibition against informal sector traders in the official CBDs and other commercial areas of the town. This means that such traders have two choices – either to pay the high rents for formal shopping space, or trade illegally. There is a need for a halfway house: small premises that are not expensive to rent, located in formal commercial areas. This is not different in principle from the “cart traders” that are an increasing feature of shopping malls – carts of no more than two or three square metres located within the circulation space.
Implementation
The official acceptance of jua kali enterprises distinguishes Kenya from many other countries in Africa. However, the tendency to centralise jua kali industries denies them an opportunity for more exposure to their markets. There is a need to take the concept one stage further by permitting budding small businesses a place in the formal city.
Jua Kali can mean noise and mess, but it does not have to do so. By providing space where such small businesses can graduate into the formal economy we can help them to grow. Wide pavements facilitate this, but they need to be supplemented by official support for kiosks and provision of very modest trading spaces.
Small business support centres can provide an attractive setting for sales as well as an environment in which the entrepreneurs can receive support and training.
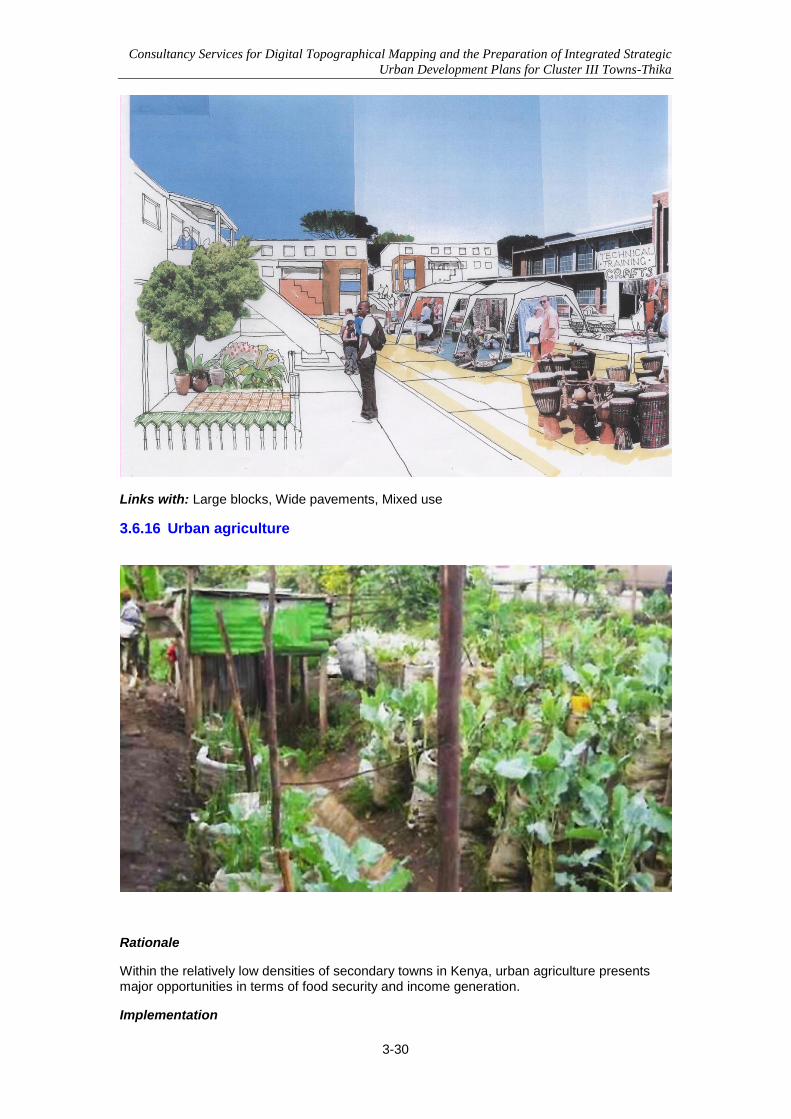
Consultancy Services for Digital Topographical Mapping and the Preparation of Integrated Strategic
Urban Development Plans for Cluster III Towns-Thika
3-30
Links with: Large blocks, Wide pavements, Mixed use
3.6.16 Urban agriculture
Rationale
Within the relatively low densities of secondary towns in Kenya, urban agriculture presents major opportunities in terms of food security and income generation.
Implementation
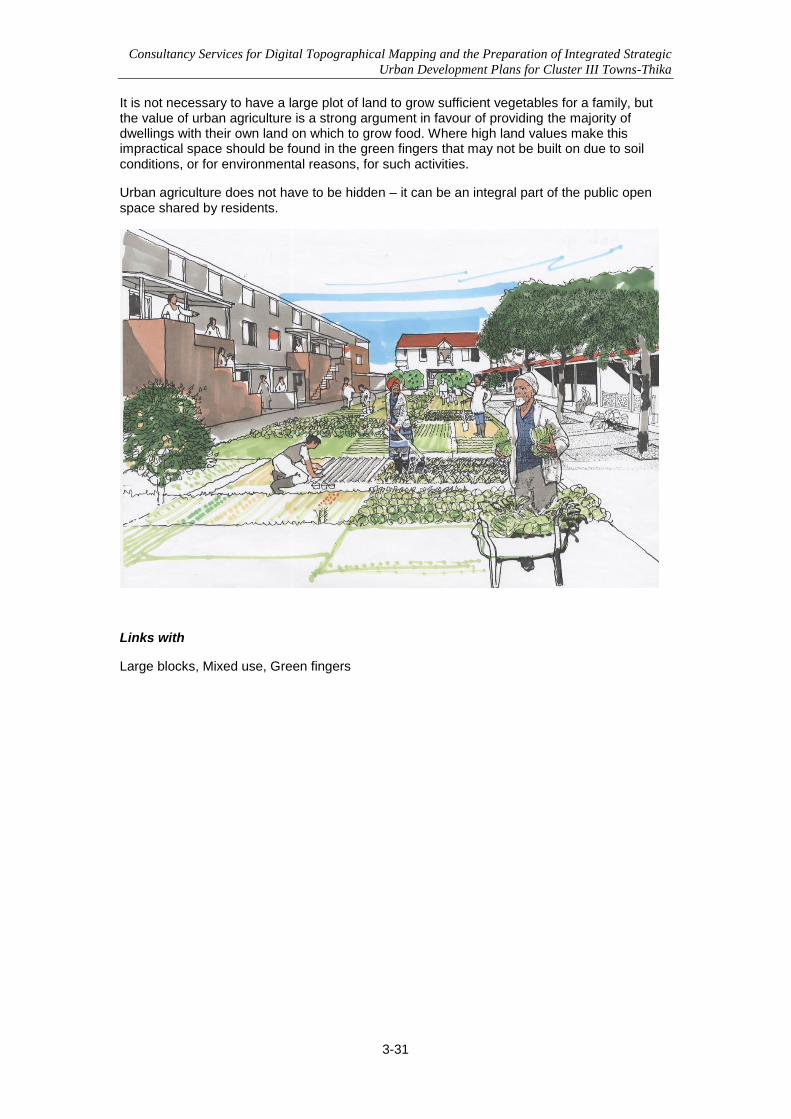
Consultancy Services for Digital Topographical Mapping and the Preparation of Integrated Strategic
Urban Development Plans for Cluster III Towns-Thika
3-31
It is not necessary to have a large plot of land to grow sufficient vegetables for a family, but the value of urban agriculture is a strong argument in favour of providing the majority of dwellings with their own land on which to grow food. Where high land values make this impractical space should be found in the green fingers that may not be built on due to soil conditions, or for environmental reasons, for such activities.
Urban agriculture does not have to be hidden – it can be an integral part of the public open space shared by residents.
Links with
Large blocks, Mixed use, Green fingers
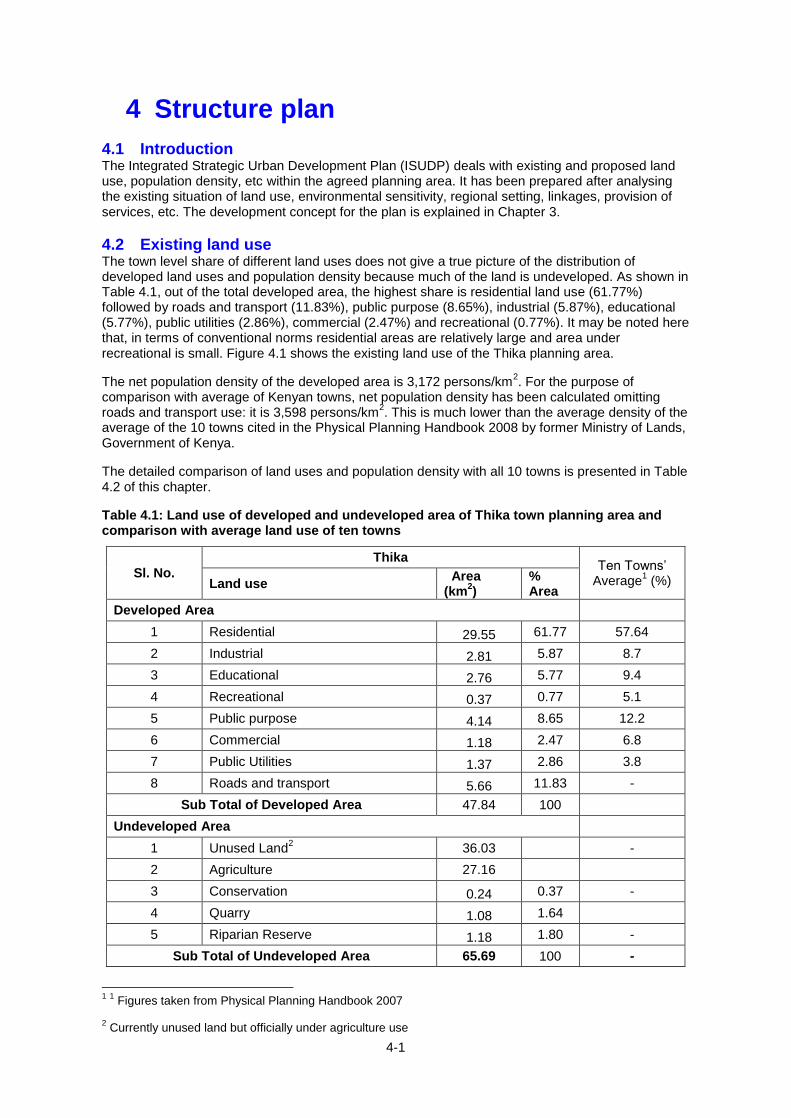
Consultancy Services for Digital Topographical Mapping and the Preparation of Integrated Strategic Urban Development Plans for Cluster III Towns-Thika
4-1
4 Structure plan
4.1 Introduction The Integrated Strategic Urban Development Plan (ISUDP) deals with existing and proposed land use, population density, etc within the agreed planning area. It has been prepared after analysing the existing situation of land use, environmental sensitivity, regional setting, linkages, provision of services, etc. The development concept for the plan is explained in Chapter 3.
4.2 Existing land use The town level share of different land uses does not give a true picture of the distribution of developed land uses and population density because much of the land is undeveloped. As shown in Table 4.1, out of the total developed area, the highest share is residential land use (61.77%) followed by roads and transport (11.83%), public purpose (8.65%), industrial (5.87%), educational (5.77%), public utilities (2.86%), commercial (2.47%) and recreational (0.77%). It may be noted here that, in terms of conventional norms residential areas are relatively large and area under recreational is small. Figure 4.1 shows the existing land use of the Thika planning area.
The net population density of the developed area is 3,172 persons/km2. For the purpose of
comparison with average of Kenyan towns, net population density has been calculated omitting roads and transport use: it is 3,598 persons/km
2. This is much lower than the average density of the
average of the 10 towns cited in the Physical Planning Handbook 2008 by former Ministry of Lands, Government of Kenya.
The detailed comparison of land uses and population density with all 10 towns is presented in Table 4.2 of this chapter.
Table 4.1: Land use of developed and undeveloped area of Thika town planning area and comparison with average land use of ten towns
Sl. No.
Thika Ten Towns’
Average1 (%) Land use
Area (km
2)
% Area
Developed Area
1 Residential 29.55 61.77 57.64
2 Industrial 2.81 5.87 8.7
3 Educational 2.76 5.77 9.4
4 Recreational 0.37 0.77 5.1
5 Public purpose 4.14 8.65 12.2
6 Commercial 1.18 2.47 6.8
7 Public Utilities 1.37 2.86 3.8
8 Roads and transport 5.66 11.83 -
Sub Total of Developed Area 47.84 100
Undeveloped Area
1 Unused Land2 36.03 -
2 Agriculture 27.16
3 Conservation 0.24 0.37 -
4 Quarry 1.08 1.64
5 Riparian Reserve 1.18 1.80 -
Sub Total of Undeveloped Area 65.69 100 -
1 1 Figures taken from Physical Planning Handbook 2007
2 Currently unused land but officially under agriculture use
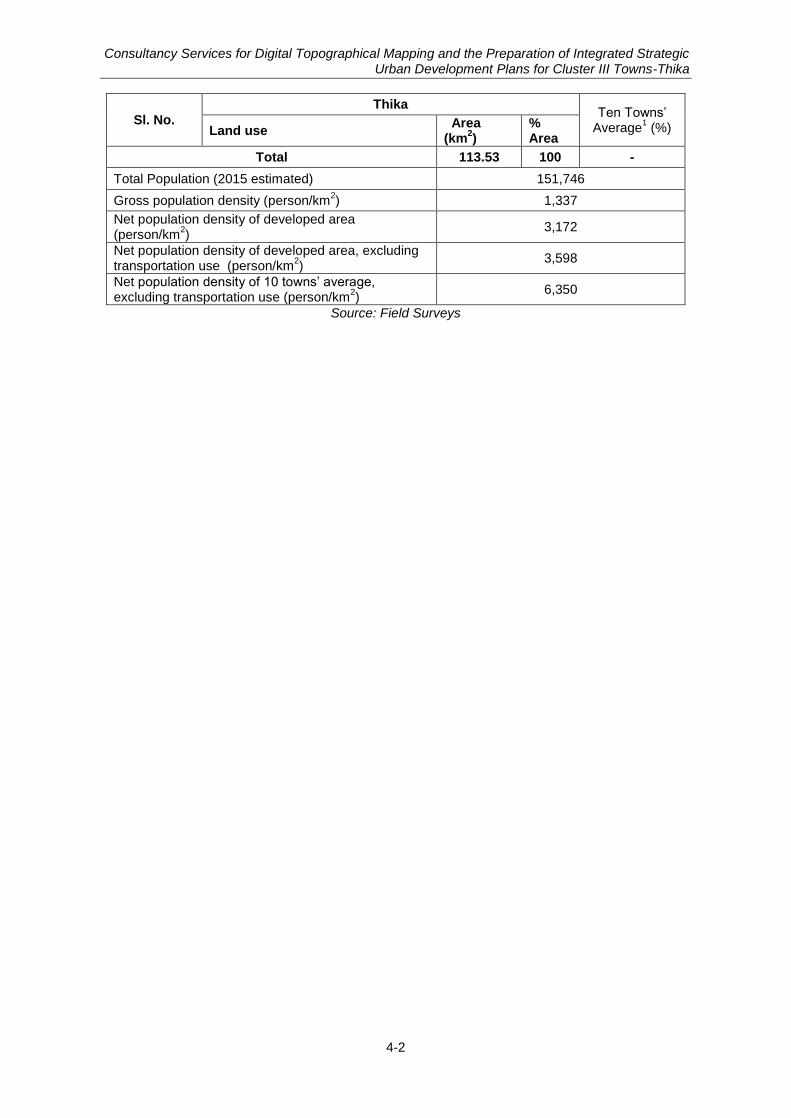
Consultancy Services for Digital Topographical Mapping and the Preparation of Integrated Strategic Urban Development Plans for Cluster III Towns-Thika
4-2
Sl. No.
Thika Ten Towns’
Average1 (%) Land use
Area (km
2)
% Area
Total 113.53 100 -
Total Population (2015 estimated) 151,746
Gross population density (person/km2) 1,337
Net population density of developed area (person/km
2)
3,172
Net population density of developed area, excluding transportation use (person/km
2)
3,598
Net population density of 10 towns’ average, excluding transportation use (person/km
2)
6,350
Source: Field Surveys
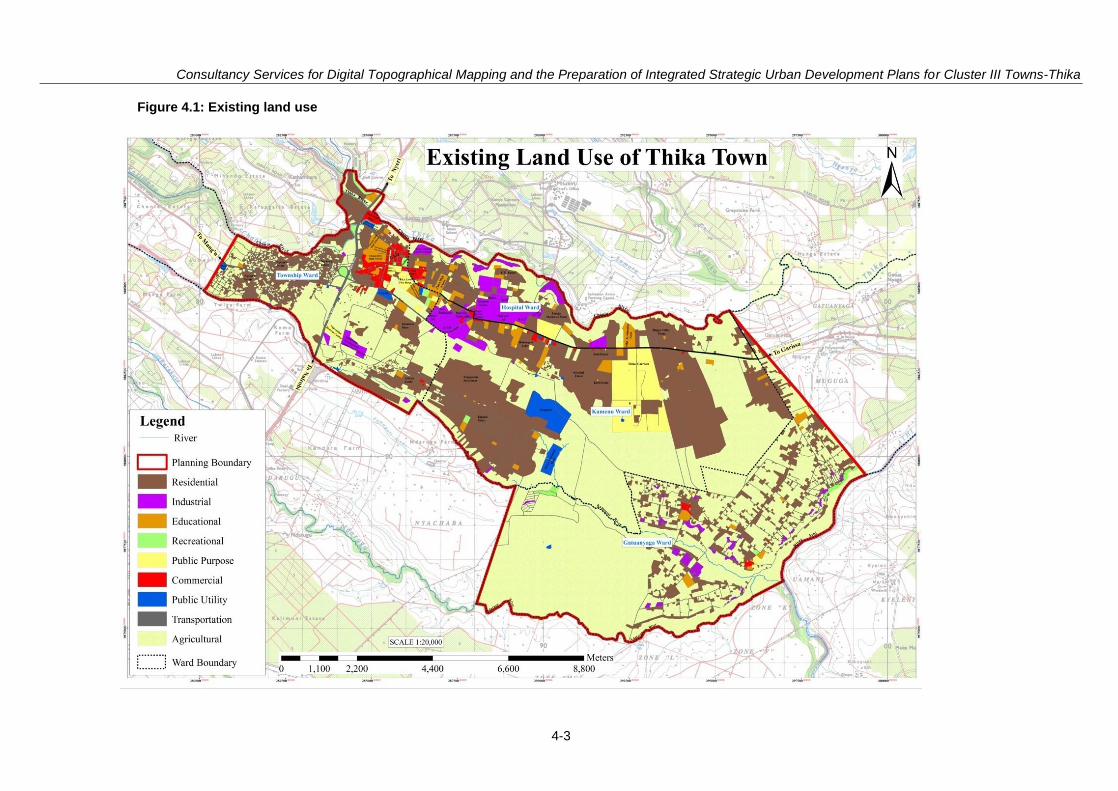
Consultancy Services for Digital Topographical Mapping and the Preparation of Integrated Strategic Urban Development Plans for Cluster III Towns-Thika
4-3
Figure 4.1: Existing land use
Consultancy Services for Digital Topographical Mapping and the Preparation of Integrated Strategic Urban Development Plans for Cluster III Towns-Thika
4-4
4.2.1 Issues/ Observations The current population growth is relatively high, possibly due to an influx of people from Nairobi
due to ease of transportation via the new Thika Super Highway. The main directions of growth are expected to be along the A2 Highway (Nairobi-Thika-Makuyu) and the A3 Highway (Garissa Road).
The growth of the town has been haphazard and unplanned
There is a lack of hierarchy of commercial spaces.
In the town, especially in the peripheral areas, development control has not always been effective
Infrastructure services and amenities are not always provided in a planned manner and distribution of these facilities does not meet the needs
Currently ministries and departmental offices are scattered widely and occupy large tracts of land. There is need to re-organize them so that they are located together. This will enhance coordination and efficiency and make the land they currently occupy available for other uses.
There is a rapid increase in land values due to increased demand.
The unused/vacant public land could be allocated to the private sector to build low cost houses
Most of the informal settlements are on public land with inadequate provision of infrastructure and services
4.3 Land use norms For comparative purposes it is useful to refer to the norms for land use given in the Physical Planning Handbook, 2008. The Table 4.2 below shows the percentage share of each land use in 10 different towns in Kenya along with the average of all towns. The data for Thika town planning area are included for comparison.
Thika’s distribution of existing land uses (2014) is very different from the average of all 10 towns. The share of different land uses of Thika neither matches the average nor any individual towns.
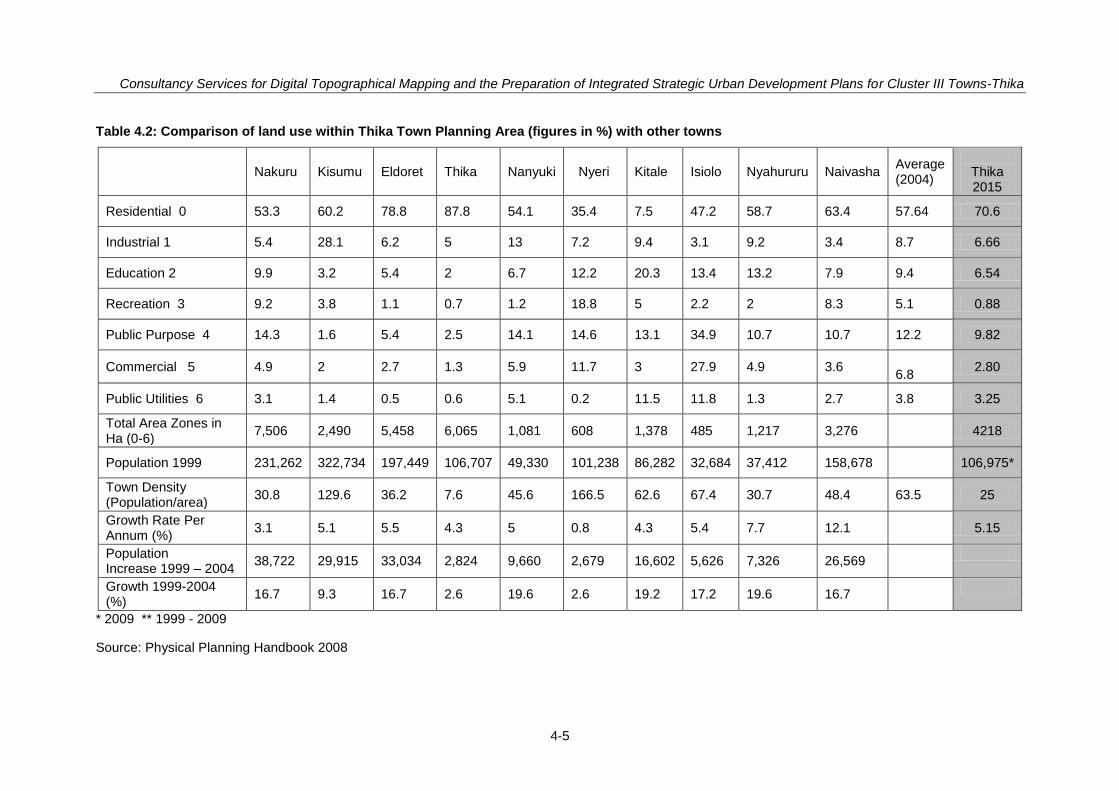
Consultancy Services for Digital Topographical Mapping and the Preparation of Integrated Strategic Urban Development Plans for Cluster III Towns-Thika
4-5
Table 4.2: Comparison of land use within Thika Town Planning Area (figures in %) with other towns
Nakuru Kisumu Eldoret Thika Nanyuki Nyeri Kitale Isiolo Nyahururu Naivasha Average (2004)
Thika 2015
Residential 0 53.3 60.2 78.8 87.8 54.1 35.4 7.5 47.2 58.7 63.4 57.64 70.6
Industrial 1 5.4 28.1 6.2 5 13 7.2 9.4 3.1 9.2 3.4 8.7 6.66
Education 2 9.9 3.2 5.4 2 6.7 12.2 20.3 13.4 13.2 7.9 9.4 6.54
Recreation 3 9.2 3.8 1.1 0.7 1.2 18.8 5 2.2 2 8.3 5.1 0.88
Public Purpose 4 14.3 1.6 5.4 2.5 14.1 14.6 13.1 34.9 10.7 10.7 12.2 9.82
Commercial 5 4.9 2 2.7 1.3 5.9 11.7 3 27.9 4.9 3.6 6.8
2.80
Public Utilities 6 3.1 1.4 0.5 0.6 5.1 0.2 11.5 11.8 1.3 2.7 3.8 3.25
Total Area Zones in Ha (0-6)
7,506 2,490 5,458 6,065 1,081 608 1,378 485 1,217 3,276 4218
Population 1999 231,262 322,734 197,449 106,707 49,330 101,238 86,282 32,684 37,412 158,678 106,975*
Town Density (Population/area)
30.8 129.6 36.2 7.6 45.6 166.5 62.6 67.4 30.7 48.4 63.5 25
Growth Rate Per Annum (%)
3.1 5.1 5.5 4.3 5 0.8 4.3 5.4 7.7 12.1 5.15
Population Increase 1999 – 2004
38,722 29,915 33,034 2,824 9,660 2,679 16,602 5,626 7,326 26,569
Growth 1999-2004 (%)
16.7 9.3 16.7 2.6 19.6 2.6 19.2 17.2 19.6 16.7
* 2009 ** 1999 - 2009
Source: Physical Planning Handbook 2008
Consultancy Services for Digital Topographical Mapping and the Preparation of Integrated Strategic Urban Development Plans for Cluster III Towns-Thika
4-6
4.4 Planning principles The ISUDFP is based on the following planning principles:
Mixed Use Development − A mix of functions and housing types creates a more efficient and lively environment with a variety of activities and people. However, incompatible uses must be confined to specific locations with specific regulations.
Inclusiveness − The process of plan-making is most likely to succeed if it involves the real target population and development actors, especially the urban poor, who are usually left out of such activities.
Progressive and incremental development − considering the limited resources available, urban plans should be based on a step-by-step approach through which the basic minimum is met first. This incremental approach is the most cost effective method of land development and provision of infrastructure. Rights of way or wayleaves for all infrastructure components must be established for the horizon year but the actual implementation of investment in infrastructure should be in accordance with the requirements of different phases.
Phasing – Extension areas should be divided into blocks to be developed according to development phases. This is to maximize efficiency and provide infrastructure and services at the same time.
Integrated planning − the best use of the limited resources should be considered. There should be a special focus on closely related activities carried out by line Ministries and other agencies as appropriate in the provision of utilities (roads, water, and electricity). Such initiatives need to be planned and implemented in a coordinated manner.
4.5 Spatial development strategy The goal of spatial development is to promote and provide for sustainable development to enable Thika town to accommodate the needs of existing and future residents and also facilitate its functionality as a regional development centre.
The strategic aim of spatial development is as follows:
To protect the sensitive areas and enhance the natural environment while providing high quality accessible recreational areas.
To conserve the urban heritage and maintain an ecological balance especially with reference to rivers and other water bodies
To develop a functional balance between residential areas, community facilities and employment centres.
To develop an integrated transport strategy linked to the land use, which facilitates access to better public transport and safer and environmentally friendly travel choices.
To facilitate access to the physical and social infrastructure and community facilities for the citizens including access to housing across a cross section of society.
The objective of the ISUDP is to promote and provide for sustainable development of the town enabling it to accommodate the needs of existing and future residents, and also to facilitate its function as a regional urban centre. The following development strategies have been adopted in preparing the plan:
4.5.1 Low and high rise development with overall medium density The plan is based upon low and high rise development with medium and high density character by year 2035 with harmonious and coherent interrelationships between various uses and activities. The average density recommended in total developable area is 60 persons/ hectare. The proposed population density is stated as medium density at town level. The existing developed area is proposed to be less dense than the newly development areas.
4.5.2 New planned development in urban extension areas The town has spread in an elongated manner toward north-west to south-east direction. The new development is expected to be mainly along Garissa Road and south of Garissa Road, and most will be between Chania River and Kamuguti River. All the projected population for the year 2035 will be accommodated within the current planning area. The new development/urban extension areas are planned primarily as residential areas with integrated work centres in terms of commercial/ industrial/institutional developments. Although there is sufficient developable land available across the
Consultancy Services for Digital Topographical Mapping and the Preparation of Integrated Strategic Urban Development Plans for Cluster III Towns-Thika
4-7
town for future developments within the proposed population density, to control the unplanned development of peripheral areas, especially towards the north-west, which is part of Murang’a County, the planning area should be increased. Moreover, planned expansion along the urban fringes and adjoining areas will not only control unplanned development but also release the pressure of congested development from the existing core areas and relieve the infrastructure from extra burdens.
4.5.3 Renewal of the old town area The entire inner area of Thika Town including the CBD is highly congested due to inefficient use of the available space and lack of other planned commercial centres, and requires urban renewal. Therefore, a renewal area should be identified and prioritized for implementation. In order to reduce the gap between planning proposals and the existing situation on ground the urban renewal programme has to be carried out and realistically programmed for implementation in phased manner.
The following areas of the existing town need urgent attention for renewal:
The informal settlements
The CBD
4.5.4 Control of fringe development Thika town is witnessing rapid ribbon development on both sides of the A2 Highway in the areas both under Kiambu County and Murang’a County. Future uncontrolled development immediately outside the ISUDP area can ruin the ambience of the town. In order to curb such development, it is suggested that a corridor development plan is prepared separately.
4.6 Population density Population density is defined here as the number of persons per hectare, obtained by dividing the population in a given area by the size of area, expressed in persons per hectare. The population density over the total area including developed (residential, commercial, industrial, roads, etc.) as well undeveloped (agriculture, vacant, forests, river, etc.) is termed as gross population density; and the population density over the developed area is termed as net population density.
4.6.1 Density matters for sustainability A compact rather than dispersed development pattern is more cost efficient: it is easier to administer for the local authorities, and it is better organized and more effective use of the facilities that provide services. The World Bank Report on “Enhanced Spatial Planning as a precondition for Sustainable Urban Development”, December 26th, 2013, argues that the promotion of dense development patterns can help cities become more sustainable. Dense cities require less investment in public services, infrastructure development and maintenance (roads, water networks, sewer lines, street lighting, solid waste management, public transport, etc.); they allow higher profitability for public transport operators (since every transit stop serves on average more people than in less dense cities); they enable walking and biking as means of commuting; they discourage car use and transport-related pollution; they can help lower greenhouse gas (GHG) emissions; they require less energy expenditure for the delivery of key public services (e.g., pump costs for water, fuel costs for garbage collection); and, most importantly, they can usually offer a better quality of life for people to the extent that diseconomies of scale and agglomeration are properly controlled. To take one of the above-listed examples, it is estimated that the energy consumed for transport needs in a city with a density of less than 25 people per hectare may reach an annual average of 55,000 mega joules per person. By comparison, in an urban area with a density of 100 people per hectare, this figure is about three times lower (World Bank). It can be concluded that population density of about 100 persons/hectare is ideal to maximise the investment on infrastructure. Beyond that investment in infrastructure will not be cost-effective.
4.6.2 Existing population density As shown in Table 4.3, the gross population density of Thika Town Planning area is 13.37 persons/ hectare. Based on the current land use analysis, the total developed area in town is 4784ha. The net density based on the projected 2015 population is 32 persons/hectare.
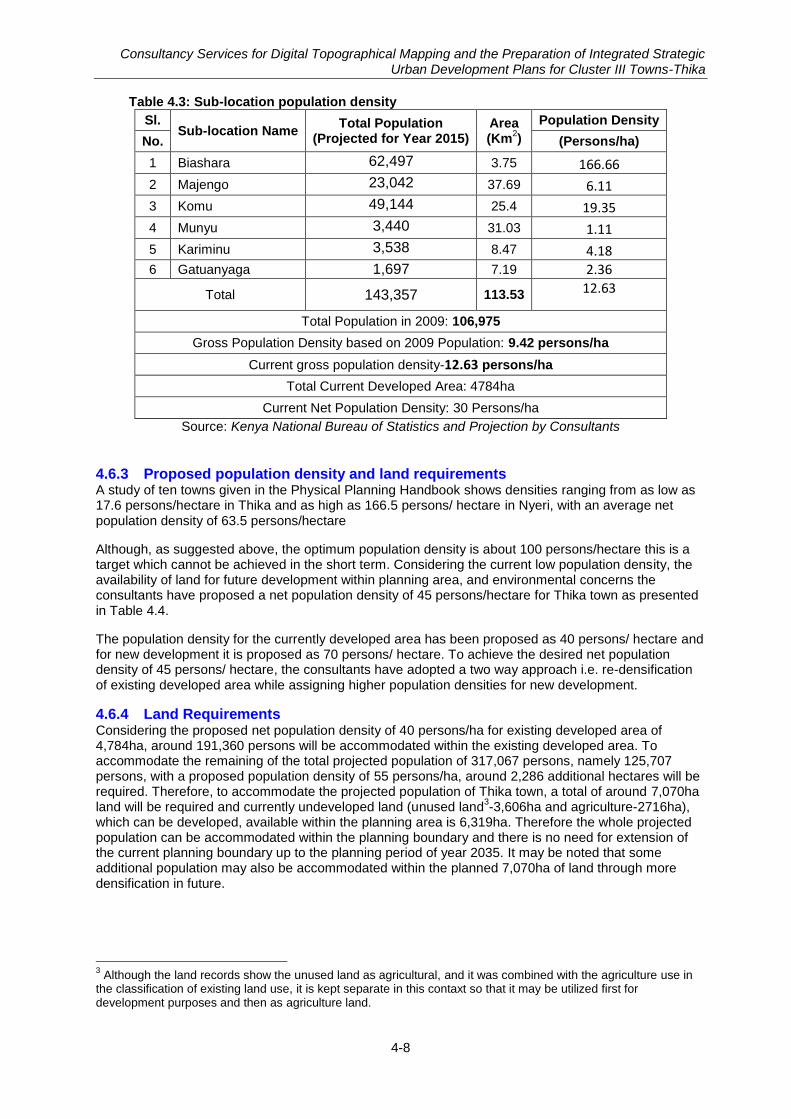
Consultancy Services for Digital Topographical Mapping and the Preparation of Integrated Strategic Urban Development Plans for Cluster III Towns-Thika
4-8
Table 4.3: Sub-location population density
Sl. Sub-location Name
Total Population (Projected for Year 2015)
Area (Km
2)
Population Density
No. (Persons/ha)
1 Biashara 62,497 3.75 166.66
2 Majengo 23,042 37.69 6.11
3 Komu 49,144 25.4 19.35
4 Munyu 3,440 31.03 1.11
5 Kariminu 3,538 8.47 4.18
6 Gatuanyaga 1,697 7.19 2.36
Total 143,357 113.53 12.63
Total Population in 2009: 106,975
Gross Population Density based on 2009 Population: 9.42 persons/ha
Current gross population density-12.63 persons/ha
Total Current Developed Area: 4784ha
Current Net Population Density: 30 Persons/ha
Source: Kenya National Bureau of Statistics and Projection by Consultants
4.6.3 Proposed population density and land requirements A study of ten towns given in the Physical Planning Handbook shows densities ranging from as low as 17.6 persons/hectare in Thika and as high as 166.5 persons/ hectare in Nyeri, with an average net population density of 63.5 persons/hectare
Although, as suggested above, the optimum population density is about 100 persons/hectare this is a target which cannot be achieved in the short term. Considering the current low population density, the availability of land for future development within planning area, and environmental concerns the consultants have proposed a net population density of 45 persons/hectare for Thika town as presented in Table 4.4.
The population density for the currently developed area has been proposed as 40 persons/ hectare and for new development it is proposed as 70 persons/ hectare. To achieve the desired net population density of 45 persons/ hectare, the consultants have adopted a two way approach i.e. re-densification of existing developed area while assigning higher population densities for new development.
4.6.4 Land Requirements Considering the proposed net population density of 40 persons/ha for existing developed area of 4,784ha, around 191,360 persons will be accommodated within the existing developed area. To accommodate the remaining of the total projected population of 317,067 persons, namely 125,707 persons, with a proposed population density of 55 persons/ha, around 2,286 additional hectares will be required. Therefore, to accommodate the projected population of Thika town, a total of around 7,070ha land will be required and currently undeveloped land (unused land
3-3,606ha and agriculture-2716ha),
which can be developed, available within the planning area is 6,319ha. Therefore the whole projected population can be accommodated within the planning boundary and there is no need for extension of the current planning boundary up to the planning period of year 2035. It may be noted that some additional population may also be accommodated within the planned 7,070ha of land through more densification in future.
3 Although the land records show the unused land as agricultural, and it was combined with the agriculture use in
the classification of existing land use, it is kept separate in this contaxt so that it may be utilized first for development purposes and then as agriculture land.
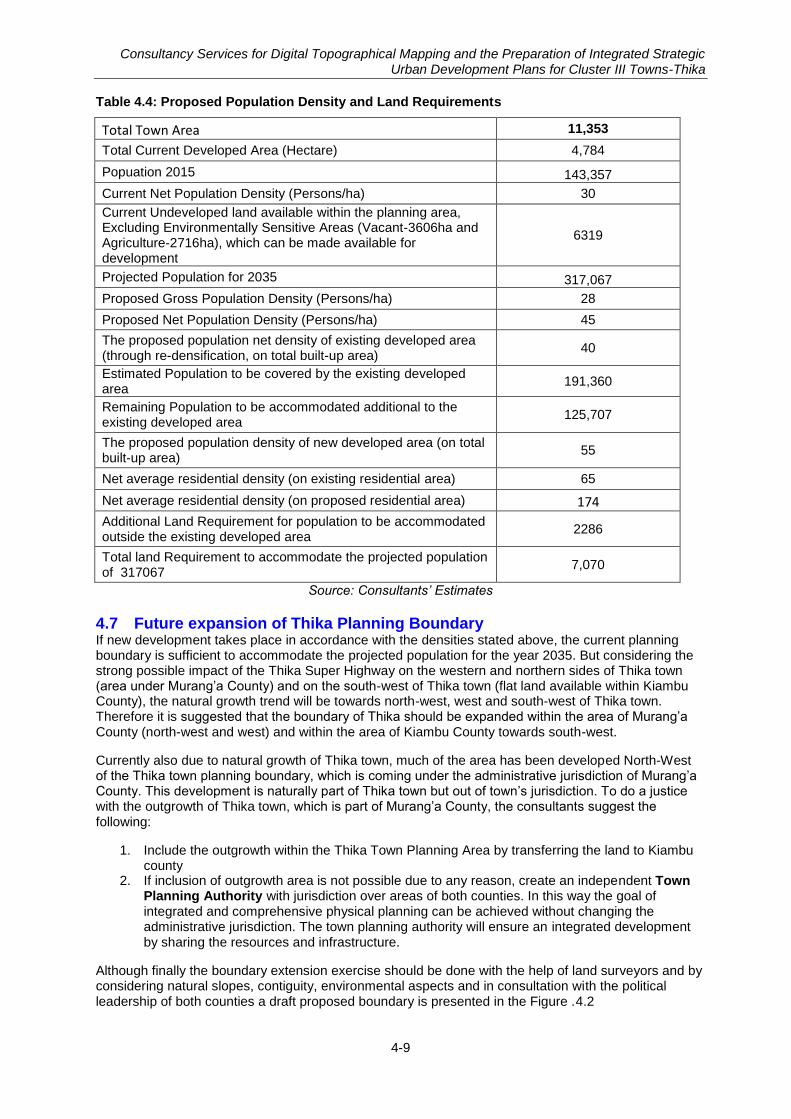
Consultancy Services for Digital Topographical Mapping and the Preparation of Integrated Strategic Urban Development Plans for Cluster III Towns-Thika
4-9
Table 4.4: Proposed Population Density and Land Requirements
Total Town Area 11,353
Total Current Developed Area (Hectare) 4,784
Popuation 2015 143,357
Current Net Population Density (Persons/ha) 30
Current Undeveloped land available within the planning area, Excluding Environmentally Sensitive Areas (Vacant-3606ha and Agriculture-2716ha), which can be made available for development
6319
Projected Population for 2035 317,067
Proposed Gross Population Density (Persons/ha) 28
Proposed Net Population Density (Persons/ha) 45
The proposed population net density of existing developed area (through re-densification, on total built-up area)
40
Estimated Population to be covered by the existing developed area
191,360
Remaining Population to be accommodated additional to the existing developed area
125,707
The proposed population density of new developed area (on total built-up area)
55
Net average residential density (on existing residential area) 65
Net average residential density (on proposed residential area) 174
Additional Land Requirement for population to be accommodated outside the existing developed area
2286
Total land Requirement to accommodate the projected population of 317067
7,070
Source: Consultants’ Estimates
4.7 Future expansion of Thika Planning Boundary If new development takes place in accordance with the densities stated above, the current planning boundary is sufficient to accommodate the projected population for the year 2035. But considering the strong possible impact of the Thika Super Highway on the western and northern sides of Thika town (area under Murang’a County) and on the south-west of Thika town (flat land available within Kiambu County), the natural growth trend will be towards north-west, west and south-west of Thika town. Therefore it is suggested that the boundary of Thika should be expanded within the area of Murang’a County (north-west and west) and within the area of Kiambu County towards south-west.
Currently also due to natural growth of Thika town, much of the area has been developed North-West of the Thika town planning boundary, which is coming under the administrative jurisdiction of Murang’a County. This development is naturally part of Thika town but out of town’s jurisdiction. To do a justice with the outgrowth of Thika town, which is part of Murang’a County, the consultants suggest the following:
1. Include the outgrowth within the Thika Town Planning Area by transferring the land to Kiambu county
2. If inclusion of outgrowth area is not possible due to any reason, create an independent Town Planning Authority with jurisdiction over areas of both counties. In this way the goal of integrated and comprehensive physical planning can be achieved without changing the administrative jurisdiction. The town planning authority will ensure an integrated development by sharing the resources and infrastructure.
Although finally the boundary extension exercise should be done with the help of land surveyors and by considering natural slopes, contiguity, environmental aspects and in consultation with the political leadership of both counties a draft proposed boundary is presented in the Figure .4.2
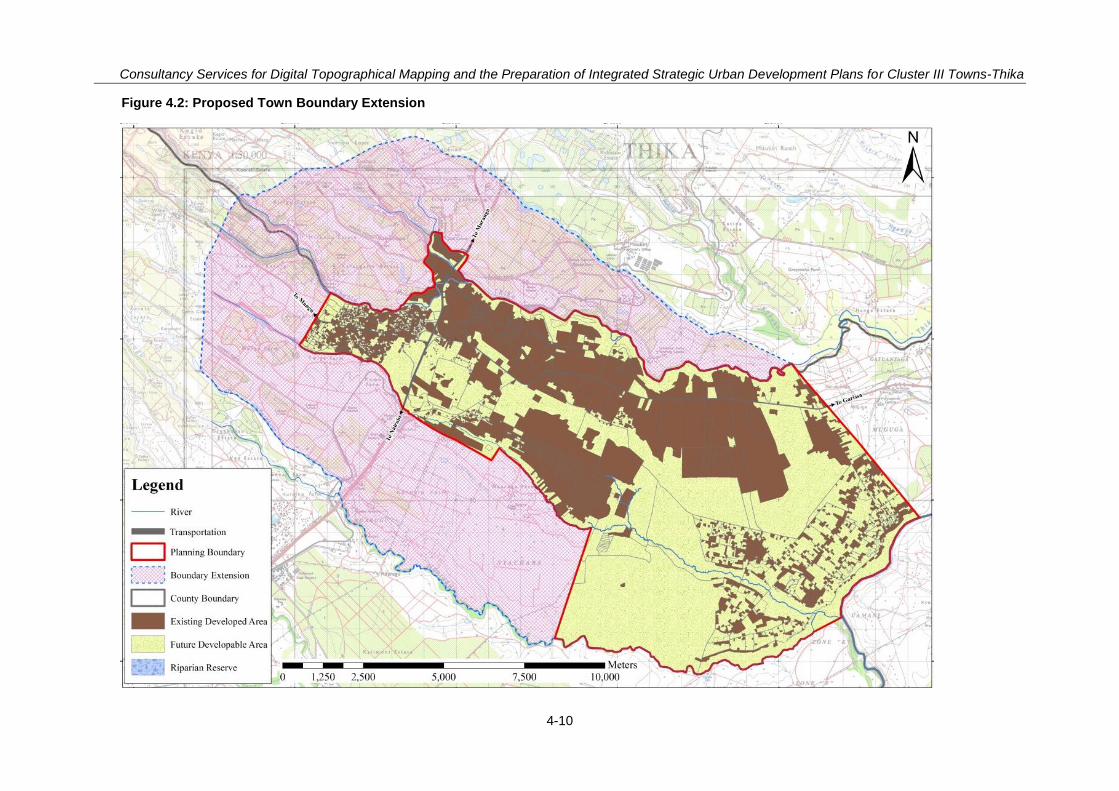
Consultancy Services for Digital Topographical Mapping and the Preparation of Integrated Strategic Urban Development Plans for Cluster III Towns-Thika
4-10
Figure 4.2: Proposed Town Boundary Extension
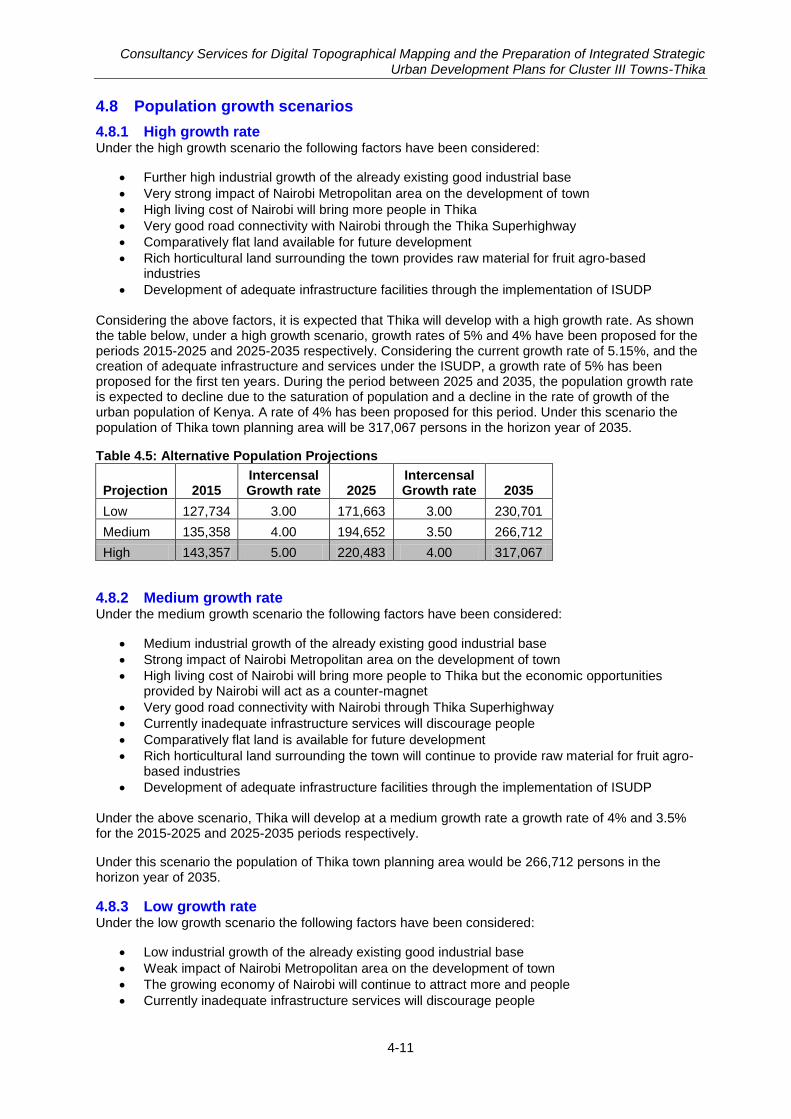
Consultancy Services for Digital Topographical Mapping and the Preparation of Integrated Strategic Urban Development Plans for Cluster III Towns-Thika
4-11
4.8 Population growth scenarios
4.8.1 High growth rate Under the high growth scenario the following factors have been considered:
Further high industrial growth of the already existing good industrial base
Very strong impact of Nairobi Metropolitan area on the development of town
High living cost of Nairobi will bring more people in Thika
Very good road connectivity with Nairobi through the Thika Superhighway
Comparatively flat land available for future development
Rich horticultural land surrounding the town provides raw material for fruit agro-based industries
Development of adequate infrastructure facilities through the implementation of ISUDP
Considering the above factors, it is expected that Thika will develop with a high growth rate. As shown the table below, under a high growth scenario, growth rates of 5% and 4% have been proposed for the periods 2015-2025 and 2025-2035 respectively. Considering the current growth rate of 5.15%, and the creation of adequate infrastructure and services under the ISUDP, a growth rate of 5% has been proposed for the first ten years. During the period between 2025 and 2035, the population growth rate is expected to decline due to the saturation of population and a decline in the rate of growth of the urban population of Kenya. A rate of 4% has been proposed for this period. Under this scenario the population of Thika town planning area will be 317,067 persons in the horizon year of 2035.
Table 4.5: Alternative Population Projections
Projection 2015 Intercensal Growth rate 2025
Intercensal Growth rate 2035
Low 127,734 3.00 171,663 3.00 230,701
Medium 135,358 4.00 194,652 3.50 266,712
High 143,357 5.00 220,483 4.00 317,067
4.8.2 Medium growth rate Under the medium growth scenario the following factors have been considered:
Medium industrial growth of the already existing good industrial base
Strong impact of Nairobi Metropolitan area on the development of town
High living cost of Nairobi will bring more people to Thika but the economic opportunities provided by Nairobi will act as a counter-magnet
Very good road connectivity with Nairobi through Thika Superhighway
Currently inadequate infrastructure services will discourage people
Comparatively flat land is available for future development
Rich horticultural land surrounding the town will continue to provide raw material for fruit agro-based industries
Development of adequate infrastructure facilities through the implementation of ISUDP
Under the above scenario, Thika will develop at a medium growth rate a growth rate of 4% and 3.5% for the 2015-2025 and 2025-2035 periods respectively.
Under this scenario the population of Thika town planning area would be 266,712 persons in the horizon year of 2035.
4.8.3 Low growth rate Under the low growth scenario the following factors have been considered:
Low industrial growth of the already existing good industrial base
Weak impact of Nairobi Metropolitan area on the development of town
The growing economy of Nairobi will continue to attract more and people
Currently inadequate infrastructure services will discourage people
Consultancy Services for Digital Topographical Mapping and the Preparation of Integrated Strategic Urban Development Plans for Cluster III Towns-Thika
4-12
Lack of financial resources and implementation capacity of the county government to implement ISUDP and provide adequate infrastructure for future development
Outmigration due to inadequate infrastructure and better employment opportunities in Nairobi
Considering the above factors, under this scenario Thika would develop at an annual rate of 3%. Under the low growth scenario the population of Thika town planning area would be 230,701 persons in the horizon year of 2035.
4.8.4 Selection of growth scenario Considering all factors and recent development trends in the town, the Consultants consider that Thika town will develop at the high growth rate.
4.9 Development options Three development options have been considered for the future development pattern of the town. These options will help in deciding the future development pattern which will become the base for all planning proposals. The applicability of each option is described below:
4.9.1 Option 1: Linear/ ribbon development The current development pattern of Thika town is in linear form mainly along Garissa Road. Chania River in the north and the relatively undulating terrain and agriculture land without any infrastructure to the South has led to a linear form of development. The proposal for future linear development depends upon the associated opportunities and issues. On the one hand linear development makes infrastructure development easy, and reduces transportation costs. On the other it puts extra pressure on transport and other infrastructure networks, and it is difficult to avoid land use incompatibility/ conflicts in a linear development model.
4.9.2 Option 2: Compact radial development Although the current development pattern is in an elongated shape, there are some signs of compact radial structure especially around the CBD area. The radial development pattern is best possible with flat land with development of infrastructure. The suitability of compact radial development depends upon associated opportunities and issues. Compact radial development allows the best utilisation of land along with easy accessibility to infrastructure and services.
4.9.3 Option 3: Polynuclear/decentralised development Although Thika’s current development pattern is quite elongated with some compact development in the CBD, there are some signs of decentralised development, for example in the small commercial developments along Garissa Road. The suitability of polynuclear forms of development for future proposals depends upon associated opportunities and issues. The most important advantage of polynuclear development is that the whole area of the town may be served with adequate services and it is not necessary for everyone to go to the CBD to obtain services. However this model needs more land and infrastructure is likely to be more costly.
4.9.4 Selection of the development option None of the above mentioned development models can be applied directly to the development of Thika town. The consultants suggest a combination of approaches which incorporates components of the linear, radial and polynuclear models.
4.10 Land Use Plan The Physical Planning Handbook provides guidelines for determining the allocation of land for various uses. The one main reference has been taken from the average land uses of ten towns. Conditions in Thika differ from the averages of ten towns due to the following reasons:
Currently inadequate land is available for recreational activities
The current residential area is mostly spread horizontally with low densities, and can be re-densified
Industrial activities are already established in the town and there is potential to develop more industries to create economies of scale
Increasing the share of educational and public purposes will help to create more educational and public facilities in the town
Existing vacant land can be used for future development
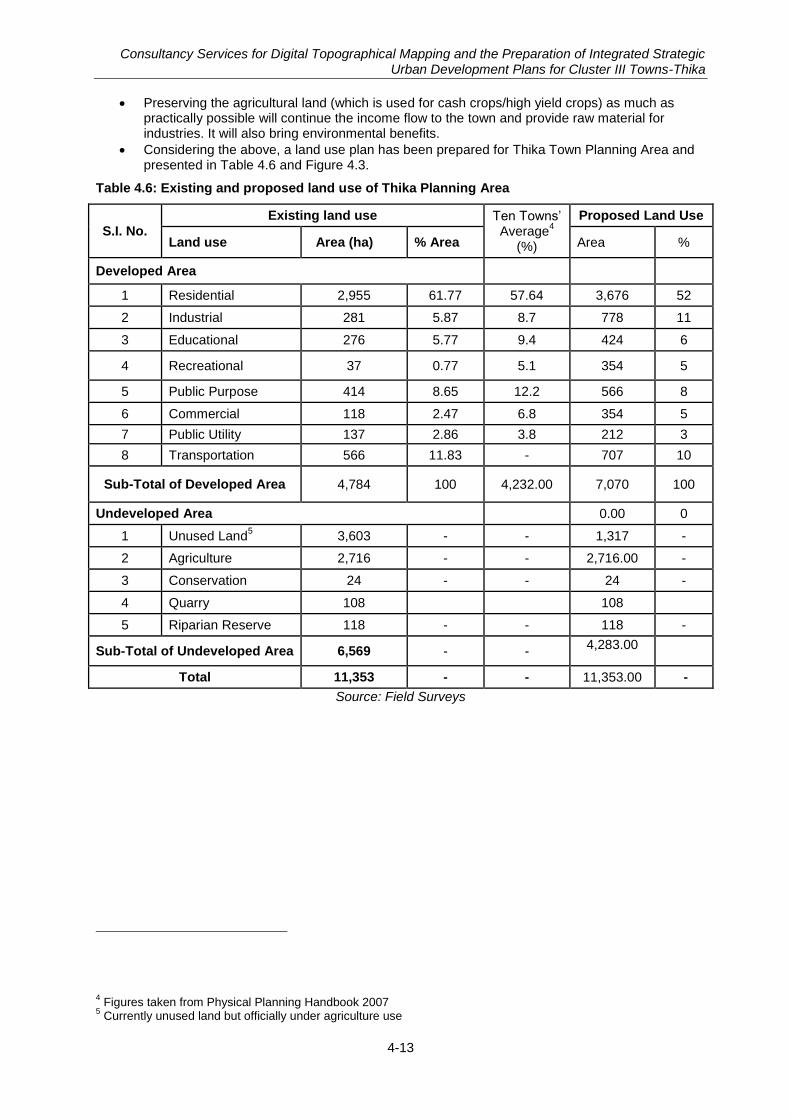
Consultancy Services for Digital Topographical Mapping and the Preparation of Integrated Strategic Urban Development Plans for Cluster III Towns-Thika
4-13
Preserving the agricultural land (which is used for cash crops/high yield crops) as much as practically possible will continue the income flow to the town and provide raw material for industries. It will also bring environmental benefits.
Considering the above, a land use plan has been prepared for Thika Town Planning Area and presented in Table 4.6 and Figure 4.3.
Table 4.6: Existing and proposed land use of Thika Planning Area
S.I. No.
Existing land use Ten Towns’ Average
4
(%)
Proposed Land Use
Land use Area (ha) % Area Area %
Developed Area
1 Residential 2,955 61.77 57.64 3,676 52
2 Industrial 281 5.87 8.7 778 11
3 Educational 276 5.77 9.4 424 6
4 Recreational 37 0.77 5.1 354 5
5 Public Purpose 414 8.65 12.2 566 8
6 Commercial 118 2.47 6.8 354 5
7 Public Utility 137 2.86 3.8 212 3
8 Transportation 566 11.83 - 707 10
Sub-Total of Developed Area 4,784 100 4,232.00 7,070 100
Undeveloped Area 0.00 0
1 Unused Land5 3,603 - - 1,317 -
2 Agriculture 2,716 - - 2,716.00 -
3 Conservation 24 - - 24 -
4 Quarry 108 108
5 Riparian Reserve 118 - - 118 -
Sub-Total of Undeveloped Area 6,569 - - 4,283.00
Total 11,353 - - 11,353.00 -
Source: Field Surveys
4 Figures taken from Physical Planning Handbook 2007
5 Currently unused land but officially under agriculture use
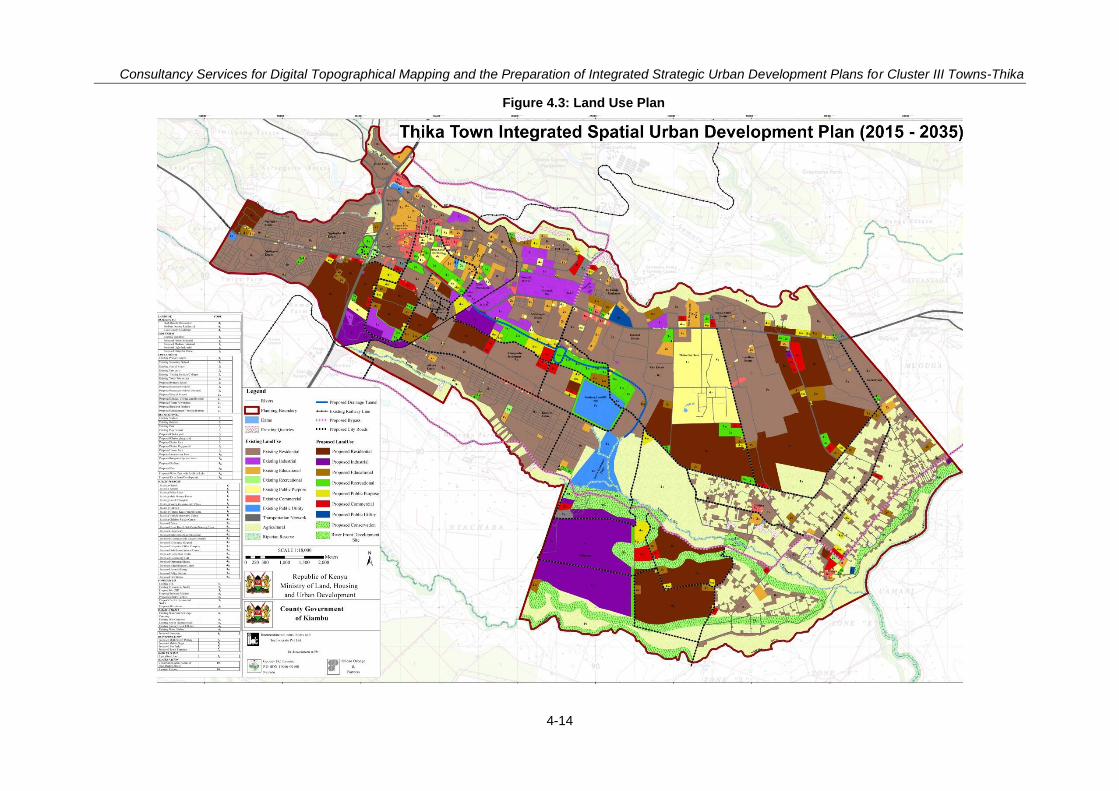
Consultancy Services for Digital Topographical Mapping and the Preparation of Integrated Strategic Urban Development Plans for Cluster III Towns-Thika
4-14
Figure 4.3: Land Use Plan
Consultancy Services for Digital Topographical Mapping and the Preparation of Integrated Strategic Urban Development Plans for Cluster III Towns-Thika
4-15
4.10.1 Residential land use The current residential area is 61.77% of the total developed area and for the planning period residential will constitute 52% of the total. Currently the residential areas have a low population density of 30 persons/ha. With suitable policy and measures to simply procedures, existing residential areas have much scope for re-densification. The density of existing residential areas is to be increased to 40 persons/ha and new development will be at 65 persons/ha
The existing developed area has been proposed at 40 persons/ha and new development has been proposed at 65 persons/ha (on total built-up area) but the net residential density (high density, medium density and low density) is different from the net population density on total built-up area, which is mentioned in the respective section below.. There are four types of residential area:
High density residential areas
Medium density residential areas
Low density residential areas
Mixed use (residential-cum-commercial) High density residential The high density residential areas include any existing developed areas as well as new residential areas. The following areas, as shown in Figure 4.4, are planned as high density residential areas:
1. Existing developed area: Some of the high density areas within the existing developed area: Majengo, Pilot, Kiandutu, Athena Estate, Kiaganjo estate, Makogeni estate, etc. The population density of existing residential areas under high density is proposed to be 150 persons per hectare.
2. New areas: Some of the high density areas within the residential areas are Ngoingwa, Athena Estate, Area near Kianduti Slums, Muthaara Estate, etc. The population density of new high density residential areas is to be 280p/ha (70 dwellings/ha
Medium density residential The medium density residential area includes the existing developed area as well as new residential areas. The following areas, as demarcated on the Figure 4.4, are medium density residential areas:
3. Existing developed area: Some of the medium density areas within the existing developed residential areas are Ngoingwa Estate, Kisii Estate, Athena Estate, Kiganjo Estate, Kiang’ombe Estate, Makongeni Estate, Happy Valley Estate, Thika Landless Estate, etc. The population density of existing medium density residential areas is128p/ha (32 dwellings/ha)
4. New areas: Some of the medium density areas within the new residential areas are Kibute Estate (near Ngoingwa), area behind Thika Garrison, the area near Thika Landless, etc. The population density of existing residential areas under medium density is proposed to be 128p/ha (32 dwellings/ha).
Low density residential The low density residential area includes some of the existing developed area. The following, as demarcated in the Figure 4.4, are low density residential areas:
Existing developed area: Some of the low density areas within the existing developed residential areas are Bendor Estate, Githima, Munyu, etc. The population density of existing residential areas under low density is set at 40p/ha (10 dwellings/ha)
New areas: No additional areas are planned for low density housing.
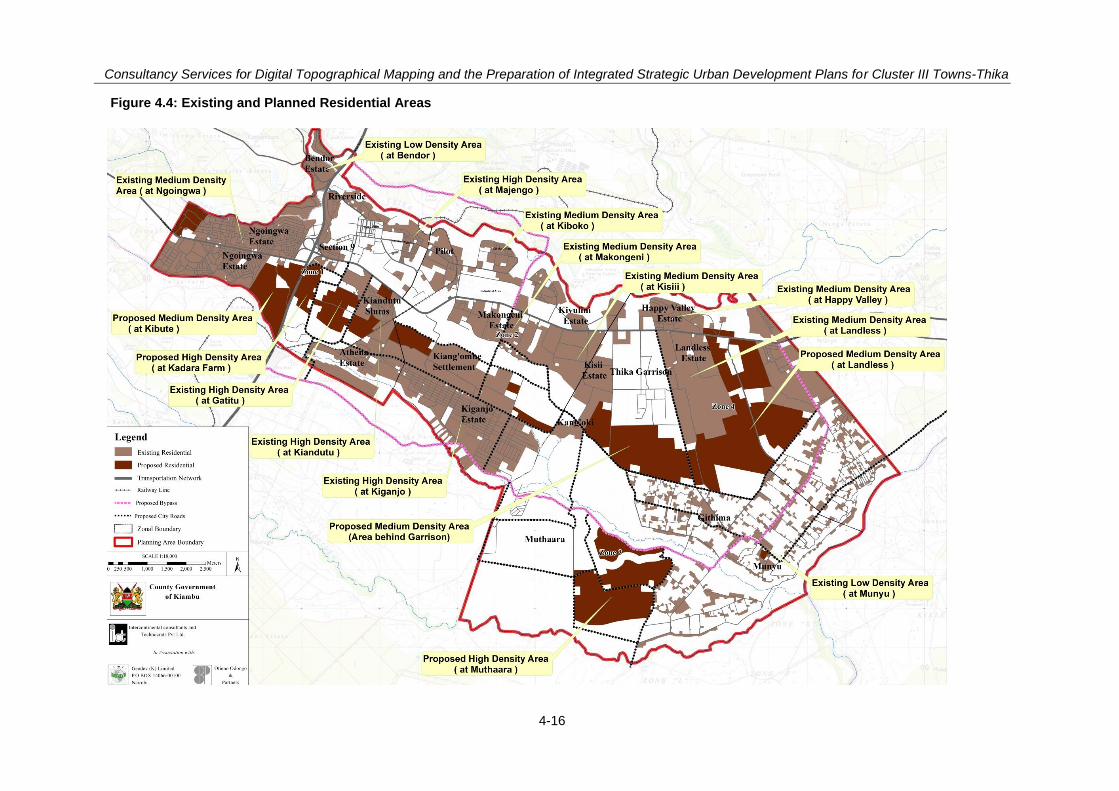
Consultancy Services for Digital Topographical Mapping and the Preparation of Integrated Strategic Urban Development Plans for Cluster III Towns-Thika
4-16
Figure 4.4: Existing and Planned Residential Areas
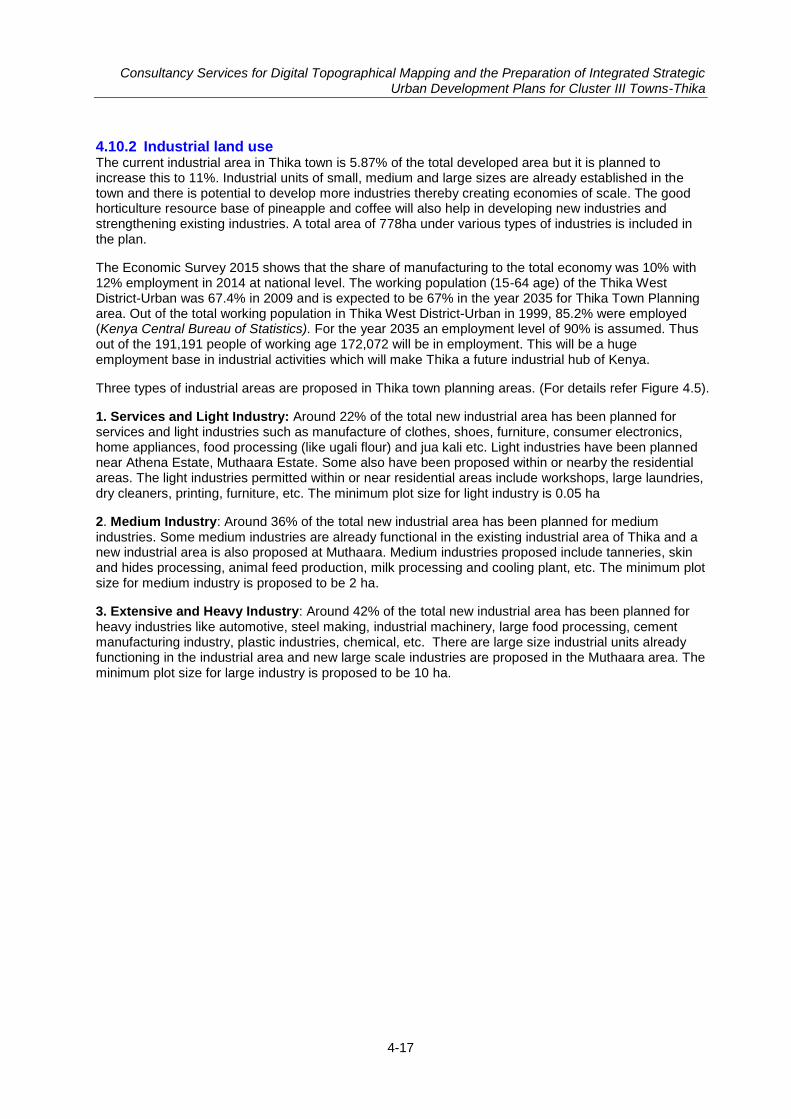
Consultancy Services for Digital Topographical Mapping and the Preparation of Integrated Strategic Urban Development Plans for Cluster III Towns-Thika
4-17
4.10.2 Industrial land use The current industrial area in Thika town is 5.87% of the total developed area but it is planned to increase this to 11%. Industrial units of small, medium and large sizes are already established in the town and there is potential to develop more industries thereby creating economies of scale. The good horticulture resource base of pineapple and coffee will also help in developing new industries and strengthening existing industries. A total area of 778ha under various types of industries is included in the plan.
The Economic Survey 2015 shows that the share of manufacturing to the total economy was 10% with 12% employment in 2014 at national level. The working population (15-64 age) of the Thika West District-Urban was 67.4% in 2009 and is expected to be 67% in the year 2035 for Thika Town Planning area. Out of the total working population in Thika West District-Urban in 1999, 85.2% were employed (Kenya Central Bureau of Statistics). For the year 2035 an employment level of 90% is assumed. Thus out of the 191,191 people of working age 172,072 will be in employment. This will be a huge employment base in industrial activities which will make Thika a future industrial hub of Kenya.
Three types of industrial areas are proposed in Thika town planning areas. (For details refer Figure 4.5).
1. Services and Light Industry: Around 22% of the total new industrial area has been planned for services and light industries such as manufacture of clothes, shoes, furniture, consumer electronics, home appliances, food processing (like ugali flour) and jua kali etc. Light industries have been planned near Athena Estate, Muthaara Estate. Some also have been proposed within or nearby the residential areas. The light industries permitted within or near residential areas include workshops, large laundries, dry cleaners, printing, furniture, etc. The minimum plot size for light industry is 0.05 ha
2. Medium Industry: Around 36% of the total new industrial area has been planned for medium industries. Some medium industries are already functional in the existing industrial area of Thika and a new industrial area is also proposed at Muthaara. Medium industries proposed include tanneries, skin and hides processing, animal feed production, milk processing and cooling plant, etc. The minimum plot size for medium industry is proposed to be 2 ha.
3. Extensive and Heavy Industry: Around 42% of the total new industrial area has been planned for heavy industries like automotive, steel making, industrial machinery, large food processing, cement manufacturing industry, plastic industries, chemical, etc. There are large size industrial units already functioning in the industrial area and new large scale industries are proposed in the Muthaara area. The minimum plot size for large industry is proposed to be 10 ha.
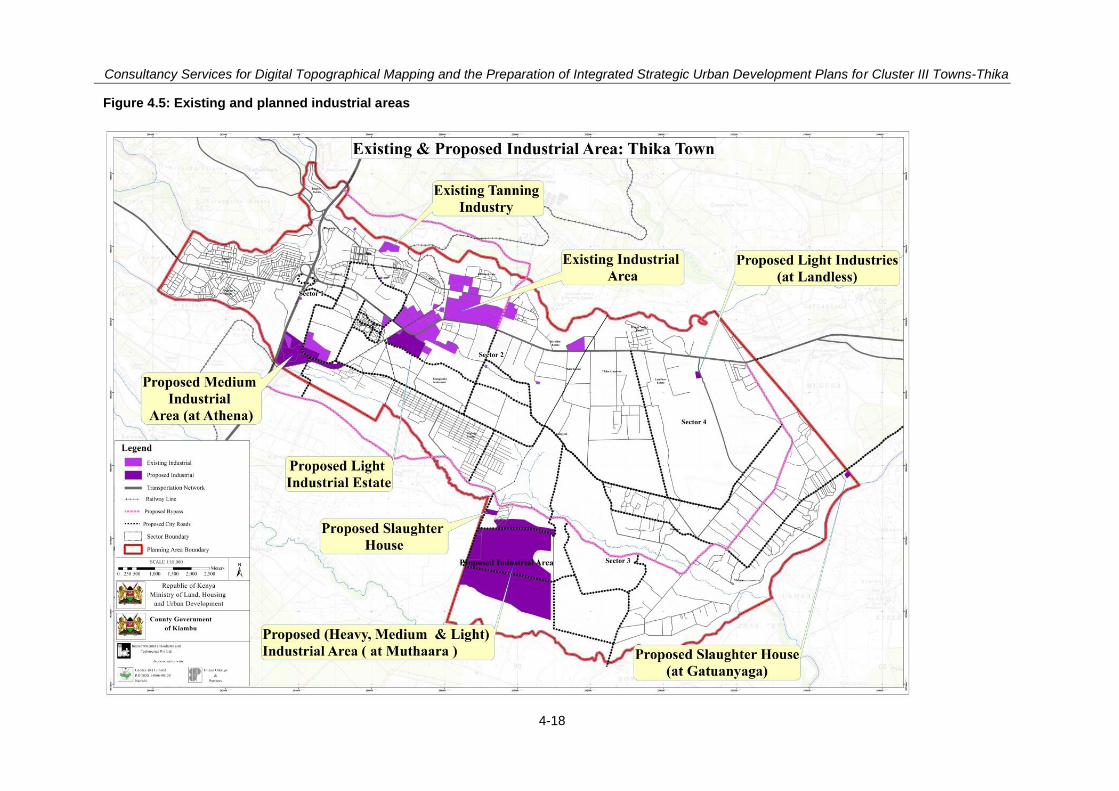
Consultancy Services for Digital Topographical Mapping and the Preparation of Integrated Strategic Urban Development Plans for Cluster III Towns-Thika
4-18
Figure 4.5: Existing and planned industrial areas
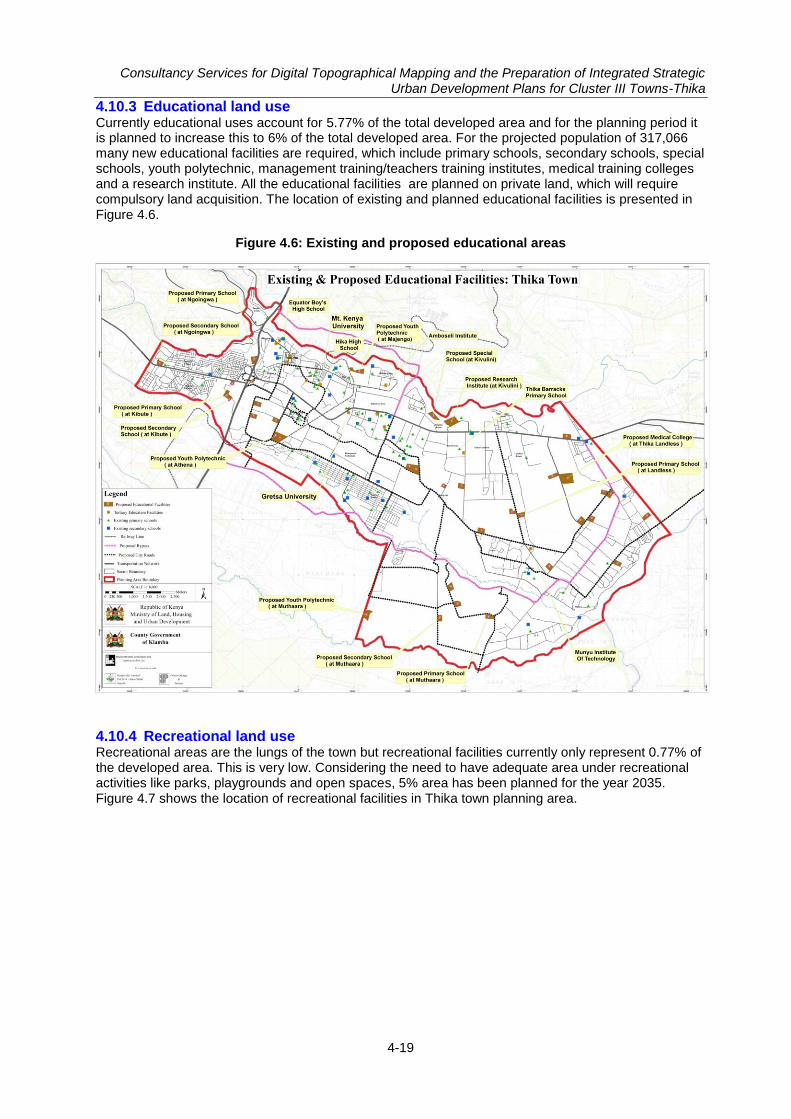
Consultancy Services for Digital Topographical Mapping and the Preparation of Integrated Strategic Urban Development Plans for Cluster III Towns-Thika
4-19
4.10.3 Educational land use Currently educational uses account for 5.77% of the total developed area and for the planning period it is planned to increase this to 6% of the total developed area. For the projected population of 317,066 many new educational facilities are required, which include primary schools, secondary schools, special schools, youth polytechnic, management training/teachers training institutes, medical training colleges and a research institute. All the educational facilities are planned on private land, which will require compulsory land acquisition. The location of existing and planned educational facilities is presented in Figure 4.6.
Figure 4.6: Existing and proposed educational areas
4.10.4 Recreational land use Recreational areas are the lungs of the town but recreational facilities currently only represent 0.77% of the developed area. This is very low. Considering the need to have adequate area under recreational activities like parks, playgrounds and open spaces, 5% area has been planned for the year 2035. Figure 4.7 shows the location of recreational facilities in Thika town planning area.
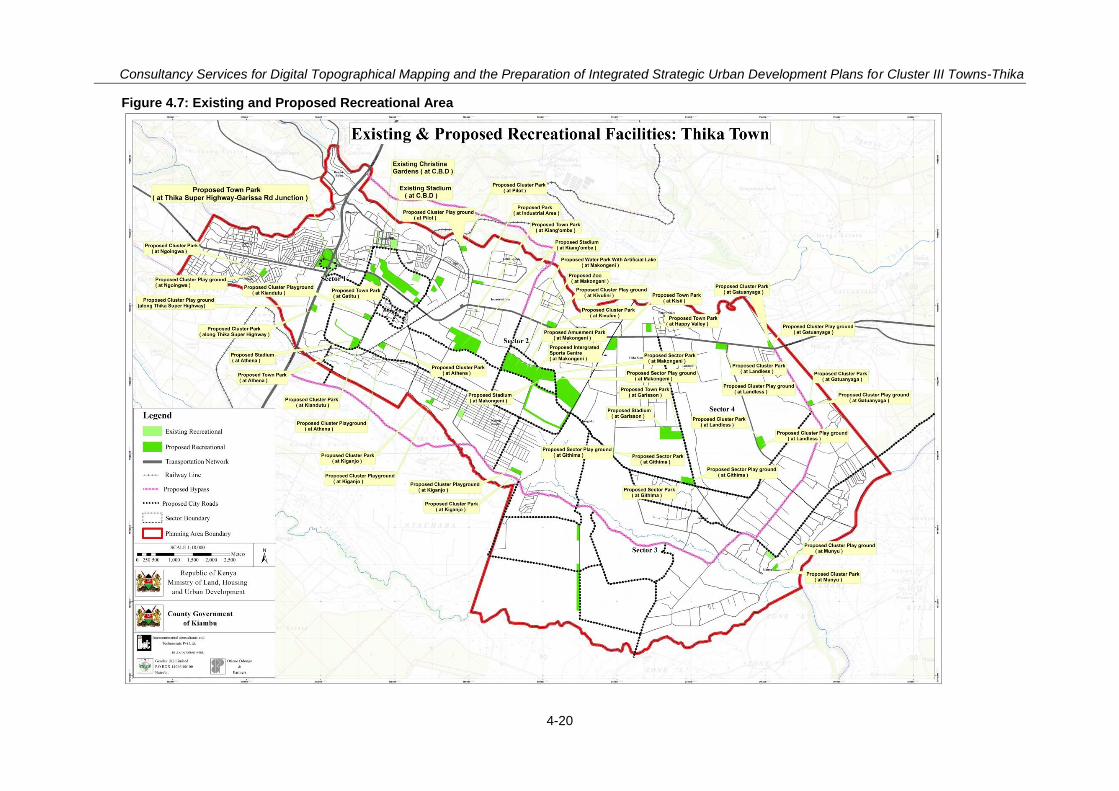
Consultancy Services for Digital Topographical Mapping and the Preparation of Integrated Strategic Urban Development Plans for Cluster III Towns-Thika
4-20
Figure 4.7: Existing and Proposed Recreational Area
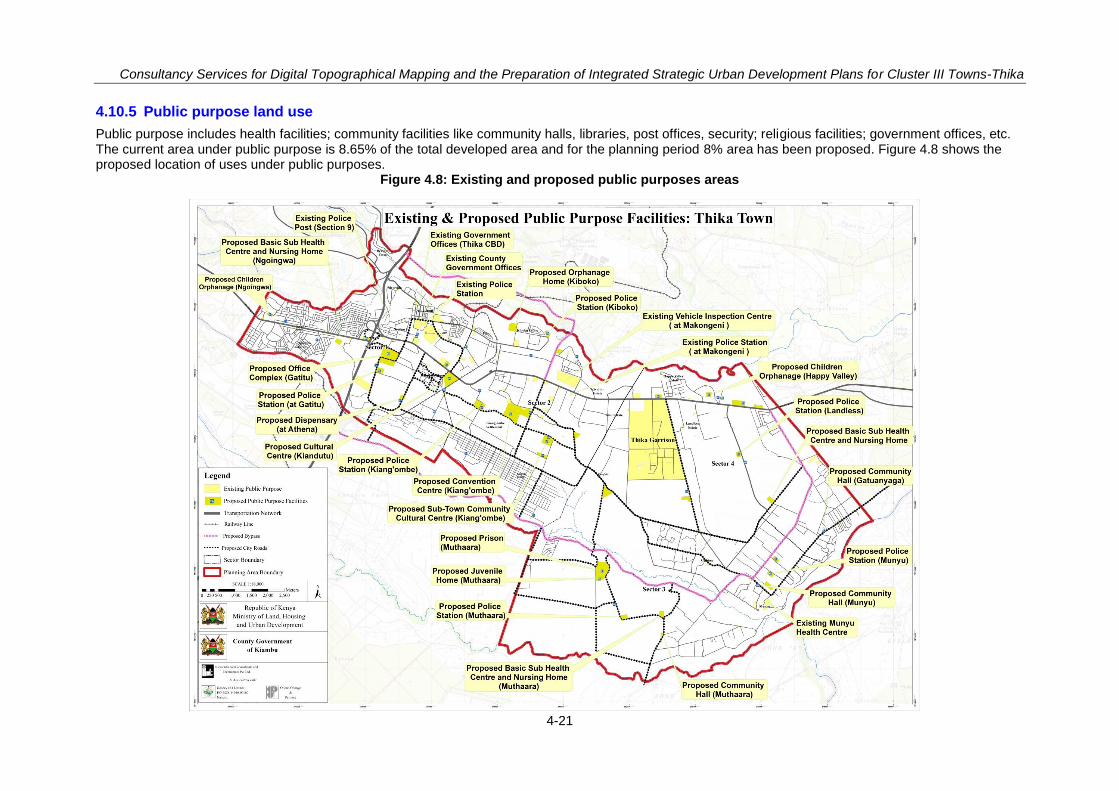
Consultancy Services for Digital Topographical Mapping and the Preparation of Integrated Strategic Urban Development Plans for Cluster III Towns-Thika
4-21
4.10.5 Public purpose land use
Public purpose includes health facilities; community facilities like community halls, libraries, post offices, security; religious facilities; government offices, etc. The current area under public purpose is 8.65% of the total developed area and for the planning period 8% area has been proposed. Figure 4.8 shows the proposed location of uses under public purposes.
Figure 4.8: Existing and proposed public purposes areas

Consultancy Services for Digital Topographical Mapping and the Preparation of Integrated Strategic Urban Development Plans for Cluster III Towns-Thika
4-22
4.10.6 Commercial land use Currently 2.47% of the total developed area is used for commercial activities. For the planning period this has been increased to 5%. The types of commercial activities like sub-CBDs, Cluster Commercial centres and informal markets are provided adequately across the planning area. The demand of commercial activities is expected to be increased further in the town due to the expected growth of industrial activities in the town. Figure 4.9 shows the proposed location of commercial areas in planning area.
Figure 4.9: Existing and proposed commercial areas
4.10.7 Public utilities land use With 2.86% of the total area there is currently adequate land for public utilities in the town. However, the proportion has been increased slightly (3%) so that adequate land can be provided to serve the town with infrastructure and services in future. The Figure 4.10 below indicates the location of public utilities in planning area.
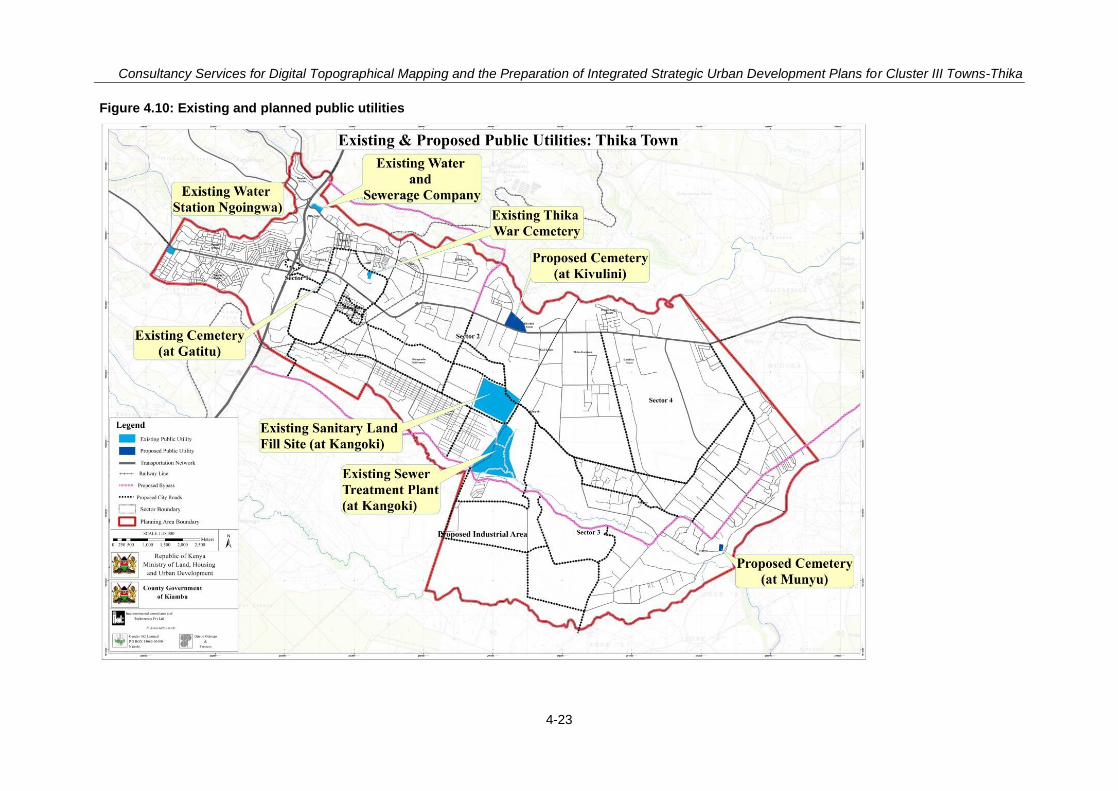
Consultancy Services for Digital Topographical Mapping and the Preparation of Integrated Strategic Urban Development Plans for Cluster III Towns-Thika
4-23
Figure 4.10: Existing and planned public utilities
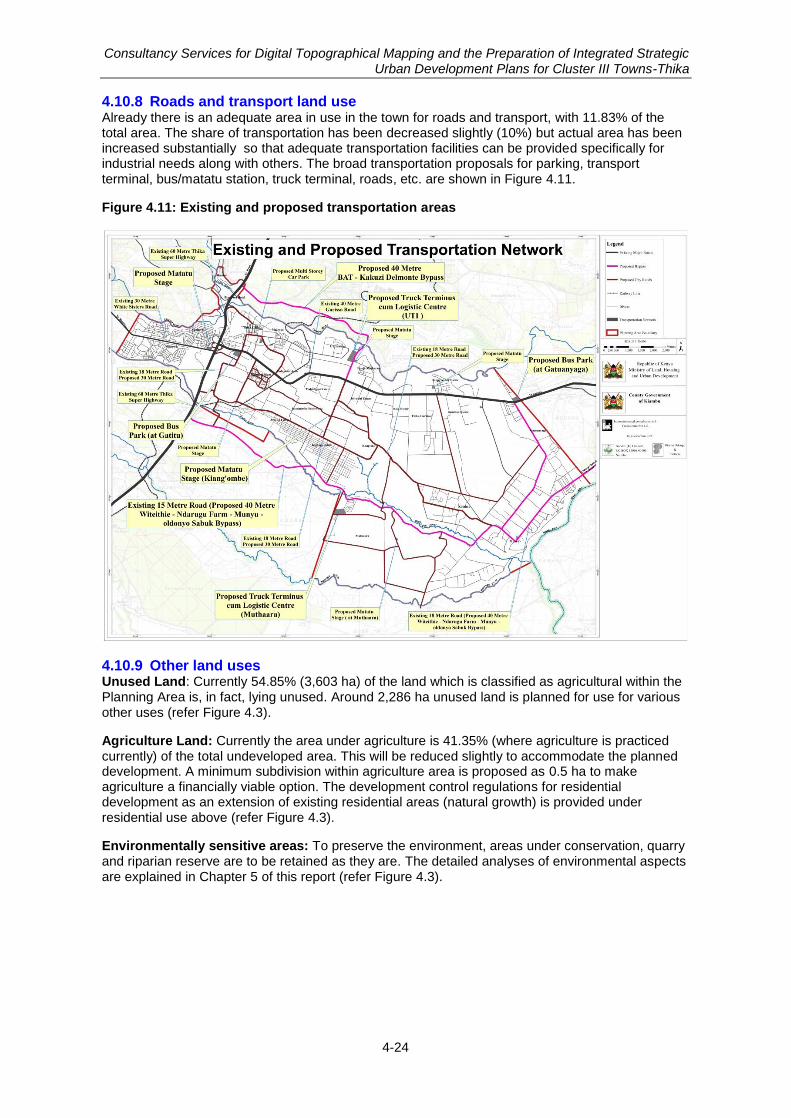
Consultancy Services for Digital Topographical Mapping and the Preparation of Integrated Strategic Urban Development Plans for Cluster III Towns-Thika
4-24
4.10.8 Roads and transport land use Already there is an adequate area in use in the town for roads and transport, with 11.83% of the total area. The share of transportation has been decreased slightly (10%) but actual area has been increased substantially so that adequate transportation facilities can be provided specifically for industrial needs along with others. The broad transportation proposals for parking, transport terminal, bus/matatu station, truck terminal, roads, etc. are shown in Figure 4.11.
Figure 4.11: Existing and proposed transportation areas
4.10.9 Other land uses Unused Land: Currently 54.85% (3,603 ha) of the land which is classified as agricultural within the Planning Area is, in fact, lying unused. Around 2,286 ha unused land is planned for use for various other uses (refer Figure 4.3).
Agriculture Land: Currently the area under agriculture is 41.35% (where agriculture is practiced currently) of the total undeveloped area. This will be reduced slightly to accommodate the planned development. A minimum subdivision within agriculture area is proposed as 0.5 ha to make agriculture a financially viable option. The development control regulations for residential development as an extension of existing residential areas (natural growth) is provided under residential use above (refer Figure 4.3).
Environmentally sensitive areas: To preserve the environment, areas under conservation, quarry and riparian reserve are to be retained as they are. The detailed analyses of environmental aspects are explained in Chapter 5 of this report (refer Figure 4.3).
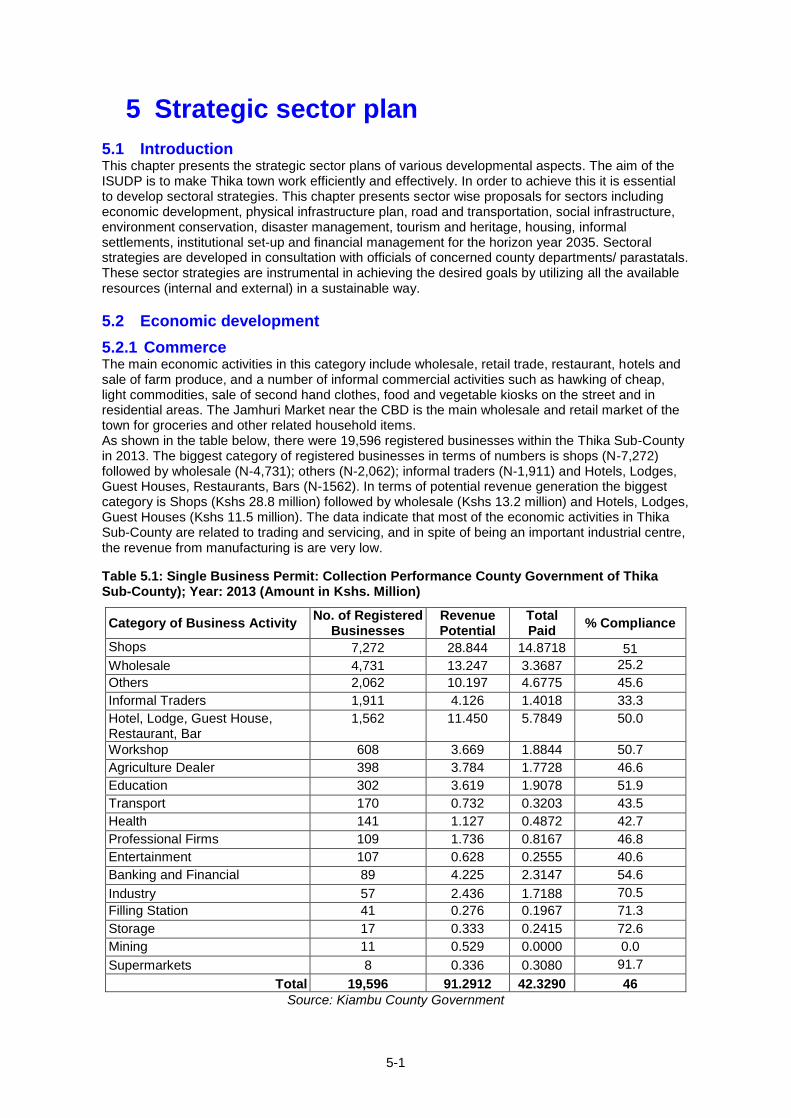
Consultancy Services for Digital Topographical Mapping and the Preparation of Integrated Strategic Urban Development Plans for Cluster III Towns-Thika
5-1
5 Strategic sector plan
5.1 Introduction This chapter presents the strategic sector plans of various developmental aspects. The aim of the ISUDP is to make Thika town work efficiently and effectively. In order to achieve this it is essential to develop sectoral strategies. This chapter presents sector wise proposals for sectors including economic development, physical infrastructure plan, road and transportation, social infrastructure, environment conservation, disaster management, tourism and heritage, housing, informal settlements, institutional set-up and financial management for the horizon year 2035. Sectoral strategies are developed in consultation with officials of concerned county departments/ parastatals. These sector strategies are instrumental in achieving the desired goals by utilizing all the available resources (internal and external) in a sustainable way.
5.2 Economic development
5.2.1 Commerce The main economic activities in this category include wholesale, retail trade, restaurant, hotels and sale of farm produce, and a number of informal commercial activities such as hawking of cheap, light commodities, sale of second hand clothes, food and vegetable kiosks on the street and in residential areas. The Jamhuri Market near the CBD is the main wholesale and retail market of the town for groceries and other related household items. As shown in the table below, there were 19,596 registered businesses within the Thika Sub-County in 2013. The biggest category of registered businesses in terms of numbers is shops (N-7,272) followed by wholesale (N-4,731); others (N-2,062); informal traders (N-1,911) and Hotels, Lodges, Guest Houses, Restaurants, Bars (N-1562). In terms of potential revenue generation the biggest category is Shops (Kshs 28.8 million) followed by wholesale (Kshs 13.2 million) and Hotels, Lodges, Guest Houses (Kshs 11.5 million). The data indicate that most of the economic activities in Thika Sub-County are related to trading and servicing, and in spite of being an important industrial centre, the revenue from manufacturing is are very low.
Table 5.1: Single Business Permit: Collection Performance County Government of Thika Sub-County); Year: 2013 (Amount in Kshs. Million)
Category of Business Activity No. of Registered
Businesses Revenue Potential
Total Paid
% Compliance
Shops 7,272 28.844 14.8718 51
Wholesale 4,731 13.247 3.3687 25.2
Others 2,062 10.197 4.6775 45.6
Informal Traders 1,911 4.126 1.4018 33.3
Hotel, Lodge, Guest House, Restaurant, Bar
1,562 11.450 5.7849 50.0
Workshop 608 3.669 1.8844 50.7
Agriculture Dealer 398 3.784 1.7728 46.6
Education 302 3.619 1.9078 51.9
Transport 170 0.732 0.3203 43.5
Health 141 1.127 0.4872 42.7
Professional Firms 109 1.736 0.8167 46.8
Entertainment 107 0.628 0.2555 40.6
Banking and Financial 89 4.225 2.3147 54.6
Industry 57 2.436 1.7188 70.5
Filling Station 41 0.276 0.1967 71.3
Storage 17 0.333 0.2415 72.6
Mining 11 0.529 0.0000 0.0
Supermarkets 8 0.336 0.3080 91.7
Total 19,596 91.2912 42.3290 46
Source: Kiambu County Government
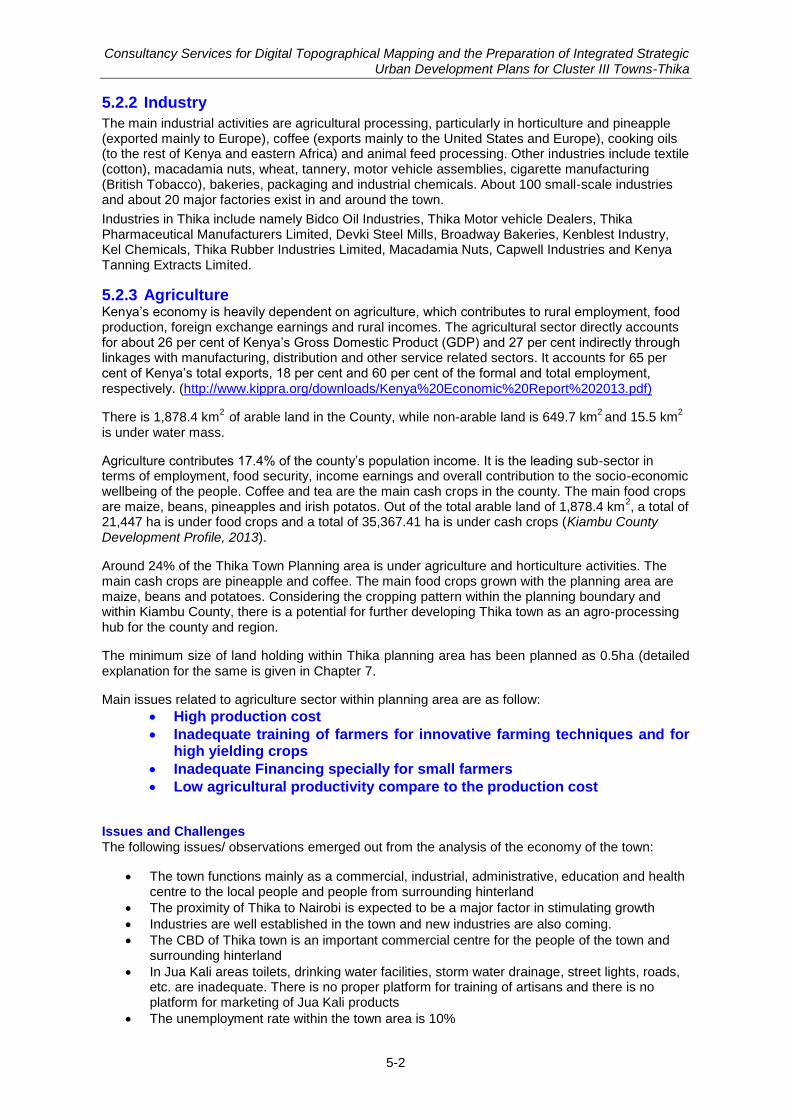
Consultancy Services for Digital Topographical Mapping and the Preparation of Integrated Strategic Urban Development Plans for Cluster III Towns-Thika
5-2
5.2.2 Industry
The main industrial activities are agricultural processing, particularly in horticulture and pineapple (exported mainly to Europe), coffee (exports mainly to the United States and Europe), cooking oils (to the rest of Kenya and eastern Africa) and animal feed processing. Other industries include textile (cotton), macadamia nuts, wheat, tannery, motor vehicle assemblies, cigarette manufacturing (British Tobacco), bakeries, packaging and industrial chemicals. About 100 small-scale industries and about 20 major factories exist in and around the town.
Industries in Thika include namely Bidco Oil Industries, Thika Motor vehicle Dealers, Thika Pharmaceutical Manufacturers Limited, Devki Steel Mills, Broadway Bakeries, Kenblest Industry, Kel Chemicals, Thika Rubber Industries Limited, Macadamia Nuts, Capwell Industries and Kenya Tanning Extracts Limited.
5.2.3 Agriculture Kenya‟s economy is heavily dependent on agriculture, which contributes to rural employment, food production, foreign exchange earnings and rural incomes. The agricultural sector directly accounts for about 26 per cent of Kenya‟s Gross Domestic Product (GDP) and 27 per cent indirectly through linkages with manufacturing, distribution and other service related sectors. It accounts for 65 per cent of Kenya‟s total exports, 18 per cent and 60 per cent of the formal and total employment, respectively. (http://www.kippra.org/downloads/Kenya%20Economic%20Report%202013.pdf)
There is 1,878.4 km2
of arable land in the County, while non-arable land is 649.7 km2 and 15.5 km
2
is under water mass.
Agriculture contributes 17.4% of the county‟s population income. It is the leading sub-sector in terms of employment, food security, income earnings and overall contribution to the socio-economic wellbeing of the people. Coffee and tea are the main cash crops in the county. The main food crops are maize, beans, pineapples and irish potatos. Out of the total arable land of 1,878.4 km
2, a total of
21,447 ha is under food crops and a total of 35,367.41 ha is under cash crops (Kiambu County Development Profile, 2013).
Around 24% of the Thika Town Planning area is under agriculture and horticulture activities. The main cash crops are pineapple and coffee. The main food crops grown with the planning area are maize, beans and potatoes. Considering the cropping pattern within the planning boundary and within Kiambu County, there is a potential for further developing Thika town as an agro-processing hub for the county and region.
The minimum size of land holding within Thika planning area has been planned as 0.5ha (detailed explanation for the same is given in Chapter 7.
Main issues related to agriculture sector within planning area are as follow:
High production cost
Inadequate training of farmers for innovative farming techniques and for high yielding crops
Inadequate Financing specially for small farmers
Low agricultural productivity compare to the production cost
Issues and Challenges
The following issues/ observations emerged out from the analysis of the economy of the town:
The town functions mainly as a commercial, industrial, administrative, education and health centre to the local people and people from surrounding hinterland
The proximity of Thika to Nairobi is expected to be a major factor in stimulating growth
Industries are well established in the town and new industries are also coming.
The CBD of Thika town is an important commercial centre for the people of the town and surrounding hinterland
In Jua Kali areas toilets, drinking water facilities, storm water drainage, street lights, roads, etc. are inadequate. There is no proper platform for training of artisans and there is no platform for marketing of Jua Kali products
The unemployment rate within the town area is 10%
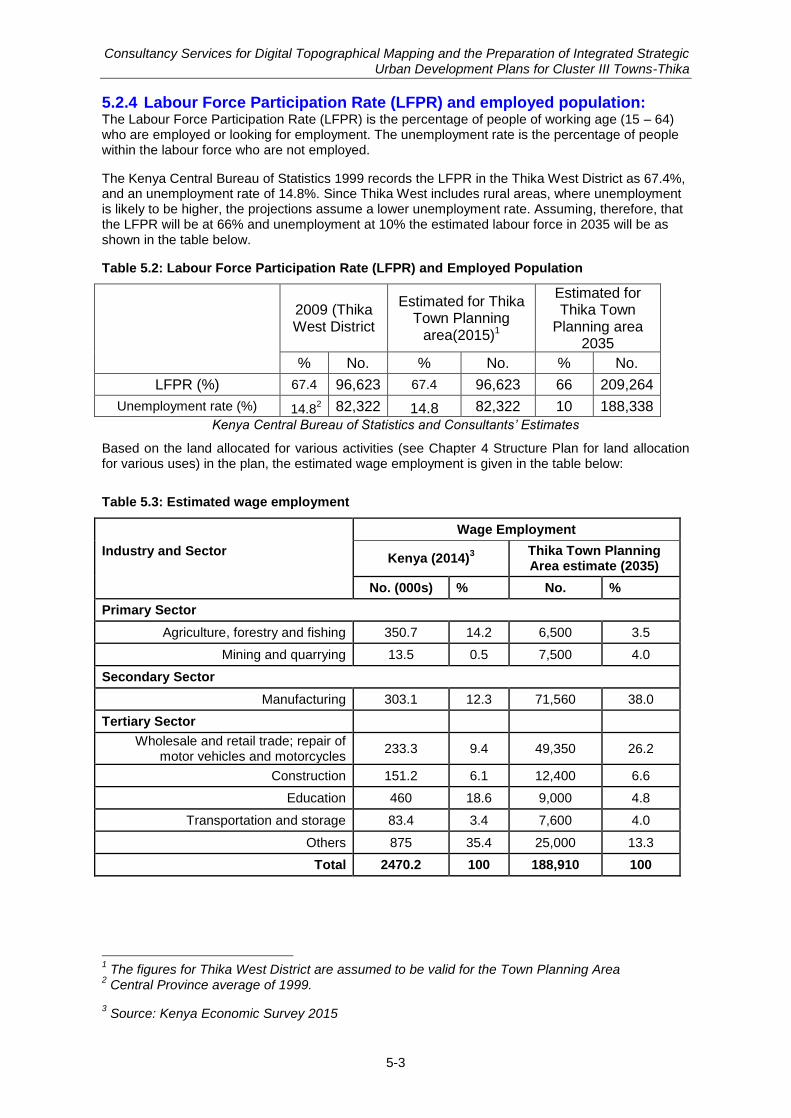
Consultancy Services for Digital Topographical Mapping and the Preparation of Integrated Strategic Urban Development Plans for Cluster III Towns-Thika
5-3
5.2.4 Labour Force Participation Rate (LFPR) and employed population: The Labour Force Participation Rate (LFPR) is the percentage of people of working age (15 – 64) who are employed or looking for employment. The unemployment rate is the percentage of people within the labour force who are not employed.
The Kenya Central Bureau of Statistics 1999 records the LFPR in the Thika West District as 67.4%, and an unemployment rate of 14.8%. Since Thika West includes rural areas, where unemployment is likely to be higher, the projections assume a lower unemployment rate. Assuming, therefore, that the LFPR will be at 66% and unemployment at 10% the estimated labour force in 2035 will be as shown in the table below.
Table 5.2: Labour Force Participation Rate (LFPR) and Employed Population
2009 (Thika West District
Estimated for Thika Town Planning
area(2015)1
Estimated for Thika Town
Planning area 2035
% No. % No. % No.
LFPR (%) 67.4 96,623 67.4 96,623 66 209,264
Unemployment rate (%) 14.82 82,322 14.8 82,322 10 188,338
Kenya Central Bureau of Statistics and Consultants’ Estimates
Based on the land allocated for various activities (see Chapter 4 Structure Plan for land allocation for various uses) in the plan, the estimated wage employment is given in the table below:
Table 5.3: Estimated wage employment
Industry and Sector
Wage Employment
Kenya (2014)3
Thika Town Planning Area estimate (2035)
No. (000s) % No. %
Primary Sector
Agriculture, forestry and fishing 350.7 14.2 6,500 3.5
Mining and quarrying 13.5 0.5 7,500 4.0
Secondary Sector
Manufacturing 303.1 12.3 71,560 38.0
Tertiary Sector
Wholesale and retail trade; repair of motor vehicles and motorcycles
233.3 9.4 49,350 26.2
Construction 151.2 6.1 12,400 6.6
Education 460 18.6 9,000 4.8
Transportation and storage 83.4 3.4 7,600 4.0
Others 875 35.4 25,000 13.3
Total 2470.2 100 188,910 100
1 The figures for Thika West District are assumed to be valid for the Town Planning Area
2 Central Province average of 1999.
3 Source: Kenya Economic Survey 2015

Consultancy Services for Digital Topographical Mapping and the Preparation of Integrated Strategic Urban Development Plans for Cluster III Towns-Thika
5-4
5.2.5 Existing gap and Future Demand The tables below summarise the situation relative to the standards stated in the Planning Handbook, and indicate the gap in provision, if any, at present and at the end of the planning period.
Table 5.4: Economic facilities: Gaps and future demand
Catchment population/ unit
Land requirement per unit (Ha)
Current availability
Demand Gap
2015 2035 2015 2035
Population 143,357 317,067
Informal Market 25,000 2,00 5 6 13 0 8
Integrated cluster commercial centre 25,000 5,00 0 6 13 5 13
Sector Commercial Centre 125,000 10,00 0 1 3 1 3
CBD Town level
1 1 1 0 0
Slaughterhouse 100,000 2,00 1 1 3 0 2
Warehousing 150,000 10,00 1 1 2 0 1
Matatu Station 50,000 0,50 2 3 6 0 4
Bus Terminal 150,000 5,00 0 1 2 1 2
Truck Terminal-cum-logistic centre 150,000 10,00 0 1 2 1 2
Banking Institutions: Financial institutions play a critical role in economic development by fulfilling the need of capital for entrepreneurs, traders and people in general. In Thika there are two types of financial institutions: commercial banks and microfinance institutions (MFIs). With approximately 15 commercial banks and 5 micro-financial institutions there is no gap in the banking facilities within Thika town. These services are supplemented by M-pesa and similar digital phone-operated services.
5.2.6 Project identification for economic development Economic development includes development of industries and trade and commerce. Currently Thika town is an established industrial town and commercial centre. Ancillary activities to support industrial and commercial development are available in the town. Developing Thika as an industrial and commercial hub makes sense and the presence of these activities (economies of scale) will stimulate further development. Considering the potential of horticulture (pineapple and coffee) and agriculture; small and medium scale agro-processing industries have potential. The goals, strategies and projects that have been identified for overall economic development are presented in table below.
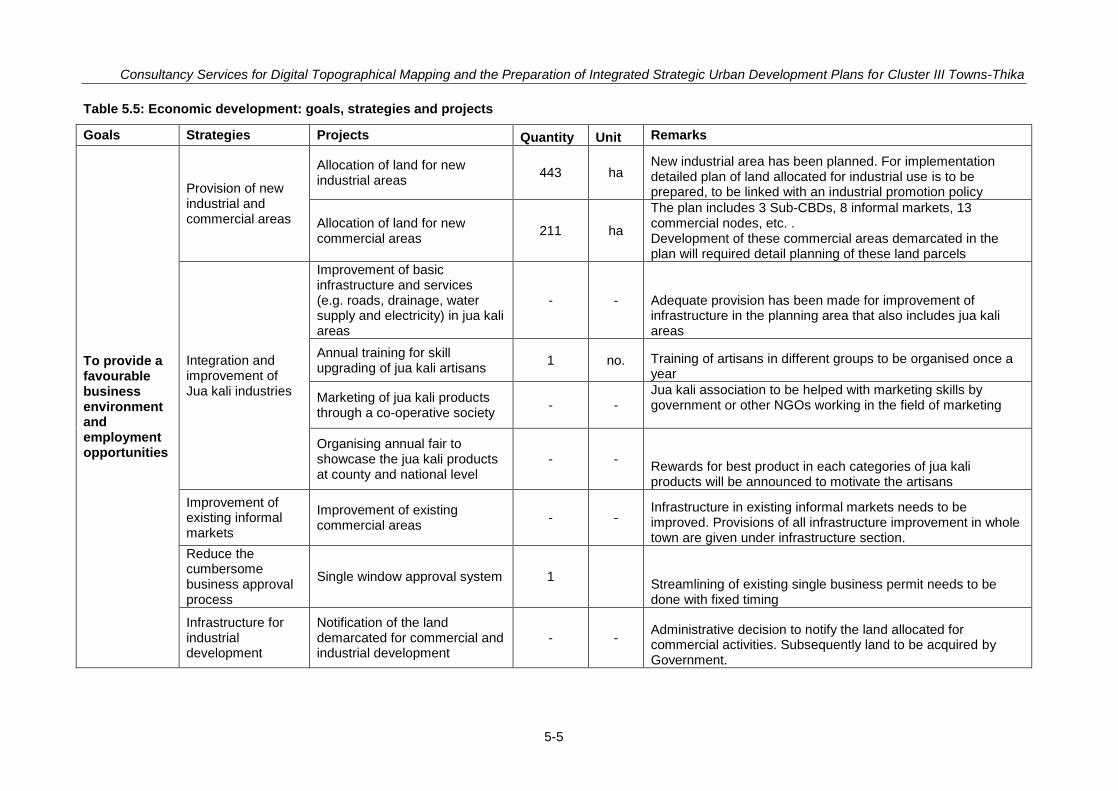
Consultancy Services for Digital Topographical Mapping and the Preparation of Integrated Strategic Urban Development Plans for Cluster III Towns-Thika
5-5
Table 5.5: Economic development: goals, strategies and projects
Goals Strategies Projects Quantity Unit Remarks
To provide a favourable business environment and employment opportunities
Provision of new industrial and commercial areas
Allocation of land for new industrial areas
443 ha New industrial area has been planned. For implementation detailed plan of land allocated for industrial use is to be prepared, to be linked with an industrial promotion policy
Allocation of land for new commercial areas
211 ha
The plan includes 3 Sub-CBDs, 8 informal markets, 13 commercial nodes, etc. . Development of these commercial areas demarcated in the plan will required detail planning of these land parcels
Integration and improvement of Jua kali industries
Improvement of basic infrastructure and services (e.g. roads, drainage, water supply and electricity) in jua kali areas
- - Adequate provision has been made for improvement of infrastructure in the planning area that also includes jua kali areas
Annual training for skill upgrading of jua kali artisans
1 no. Training of artisans in different groups to be organised once a year
Marketing of jua kali products through a co-operative society
- - Jua kali association to be helped with marketing skills by government or other NGOs working in the field of marketing
Organising annual fair to showcase the jua kali products at county and national level
- - Rewards for best product in each categories of jua kali products will be announced to motivate the artisans
Improvement of existing informal markets
Improvement of existing commercial areas
- - Infrastructure in existing informal markets needs to be improved. Provisions of all infrastructure improvement in whole town are given under infrastructure section.
Reduce the cumbersome business approval process
Single window approval system 1 Streamlining of existing single business permit needs to be
done with fixed timing
Infrastructure for industrial development
Notification of the land demarcated for commercial and industrial development
- - Administrative decision to notify the land allocated for commercial activities. Subsequently land to be acquired by Government.
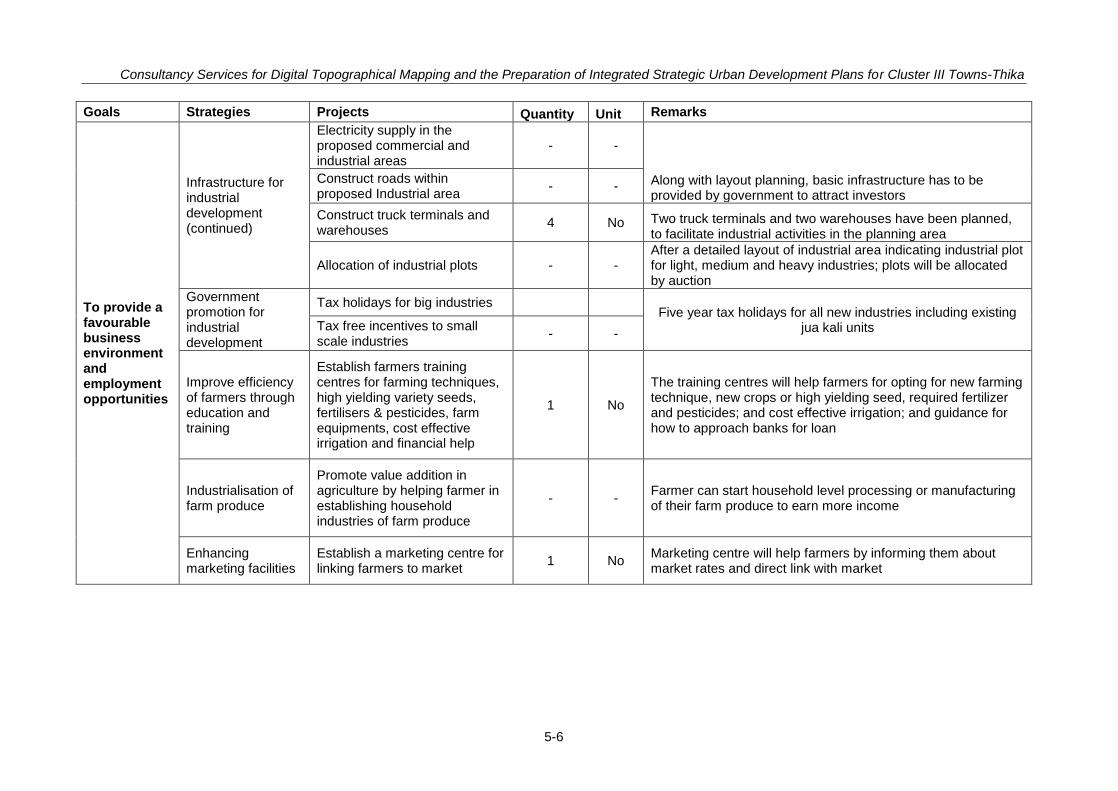
Consultancy Services for Digital Topographical Mapping and the Preparation of Integrated Strategic Urban Development Plans for Cluster III Towns-Thika
5-6
Goals Strategies Projects Quantity Unit Remarks
To provide a favourable business environment and employment opportunities
Infrastructure for industrial development (continued)
Electricity supply in the proposed commercial and industrial areas
- -
Along with layout planning, basic infrastructure has to be provided by government to attract investors
Construct roads within proposed Industrial area
- -
Construct truck terminals and warehouses
4 No Two truck terminals and two warehouses have been planned, to facilitate industrial activities in the planning area
Allocation of industrial plots - - After a detailed layout of industrial area indicating industrial plot for light, medium and heavy industries; plots will be allocated by auction
Government promotion for industrial development
Tax holidays for big industries Five year tax holidays for all new industries including existing
jua kali units
Tax free incentives to small scale industries
- -
Improve efficiency of farmers through education and training
Establish farmers training centres for farming techniques, high yielding variety seeds, fertilisers & pesticides, farm equipments, cost effective irrigation and financial help
1 No
The training centres will help farmers for opting for new farming technique, new crops or high yielding seed, required fertilizer and pesticides; and cost effective irrigation; and guidance for how to approach banks for loan
Industrialisation of farm produce
Promote value addition in agriculture by helping farmer in establishing household industries of farm produce
- - Farmer can start household level processing or manufacturing of their farm produce to earn more income
Enhancing marketing facilities
Establish a marketing centre for linking farmers to market
1 No Marketing centre will help farmers by informing them about market rates and direct link with market
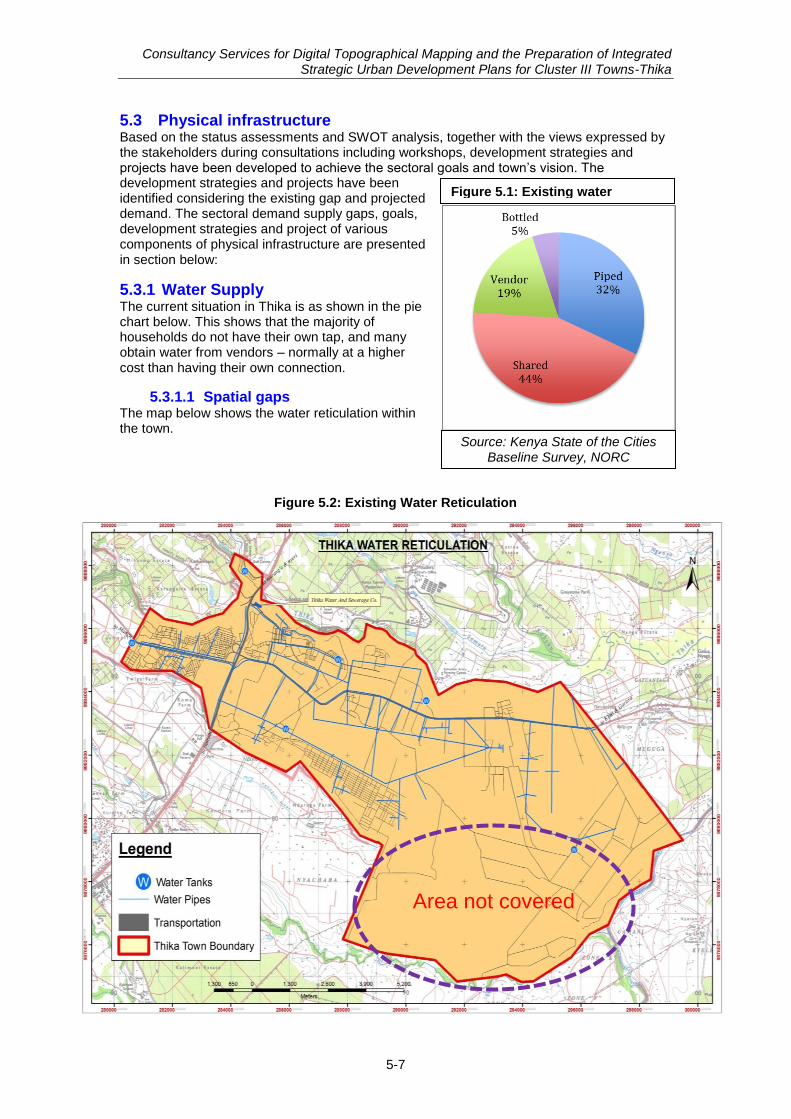
Consultancy Services for Digital Topographical Mapping and the Preparation of Integrated Strategic Urban Development Plans for Cluster III Towns-Thika
5-7
5.3 Physical infrastructure Based on the status assessments and SWOT analysis, together with the views expressed by the stakeholders during consultations including workshops, development strategies and projects have been developed to achieve the sectoral goals and town‟s vision. The development strategies and projects have been identified considering the existing gap and projected demand. The sectoral demand supply gaps, goals, development strategies and project of various components of physical infrastructure are presented in section below:
5.3.1 Water Supply The current situation in Thika is as shown in the pie chart below. This shows that the majority of households do not have their own tap, and many obtain water from vendors – normally at a higher cost than having their own connection.
5.3.1.1 Spatial gaps The map below shows the water reticulation within the town.
Figure 5.2: Existing Water Reticulation
Area not covered
Figure 5.1: Existing water sources
Source: Kenya State of the Cities Baseline Survey, NORC
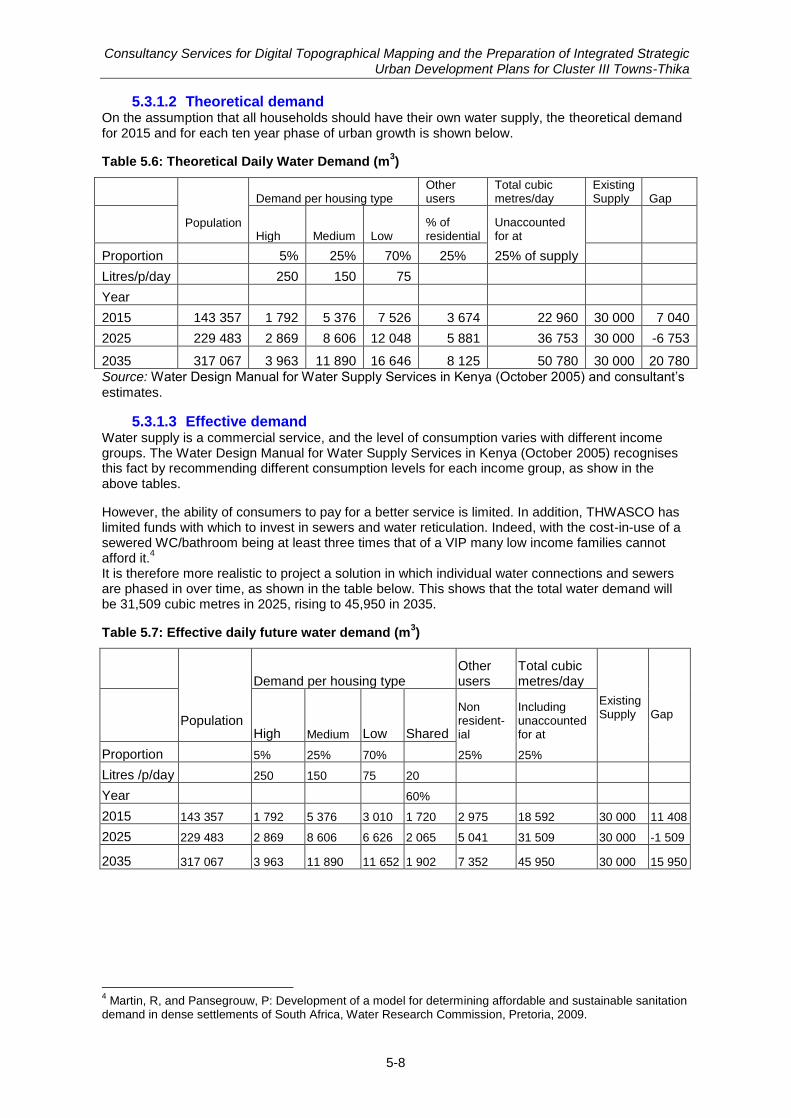
Consultancy Services for Digital Topographical Mapping and the Preparation of Integrated Strategic Urban Development Plans for Cluster III Towns-Thika
5-8
5.3.1.2 Theoretical demand On the assumption that all households should have their own water supply, the theoretical demand for 2015 and for each ten year phase of urban growth is shown below.
Table 5.6: Theoretical Daily Water Demand (m3)
Population
Demand per housing type Other users
Total cubic metres/day
Existing Supply Gap
High Medium Low % of residential
Unaccounted for at
Proportion 5% 25% 70% 25% 25% of supply
Litres/p/day 250 150 75
Year
2015 143 357 1 792 5 376 7 526 3 674 22 960 30 000 7 040
2025 229 483 2 869 8 606 12 048 5 881 36 753 30 000 -6 753
2035 317 067 3 963 11 890 16 646 8 125 50 780 30 000 20 780
Source: Water Design Manual for Water Supply Services in Kenya (October 2005) and consultant‟s
estimates.
5.3.1.3 Effective demand Water supply is a commercial service, and the level of consumption varies with different income groups. The Water Design Manual for Water Supply Services in Kenya (October 2005) recognises this fact by recommending different consumption levels for each income group, as show in the above tables.
However, the ability of consumers to pay for a better service is limited. In addition, THWASCO has limited funds with which to invest in sewers and water reticulation. Indeed, with the cost-in-use of a sewered WC/bathroom being at least three times that of a VIP many low income families cannot afford it.
4
It is therefore more realistic to project a solution in which individual water connections and sewers are phased in over time, as shown in the table below. This shows that the total water demand will be 31,509 cubic metres in 2025, rising to 45,950 in 2035.
Table 5.7: Effective daily future water demand (m3)
Population
Demand per housing type Other users
Total cubic metres/day
Existing Supply
Gap
High Medium Low Shared
Non resident-ial
Including unaccounted for at
Proportion 5% 25% 70% 25% 25%
Litres /p/day 250 150 75 20
Year 60%
2015 143 357 1 792 5 376 3 010 1 720 2 975 18 592 30 000 11 408
2025 229 483 2 869 8 606 6 626 2 065 5 041 31 509 30 000 -1 509
2035 317 067 3 963 11 890 11 652 1 902 7 352 45 950 30 000 15 950
4 Martin, R, and Pansegrouw, P: Development of a model for determining affordable and sustainable sanitation
demand in dense settlements of South Africa, Water Research Commission, Pretoria, 2009.
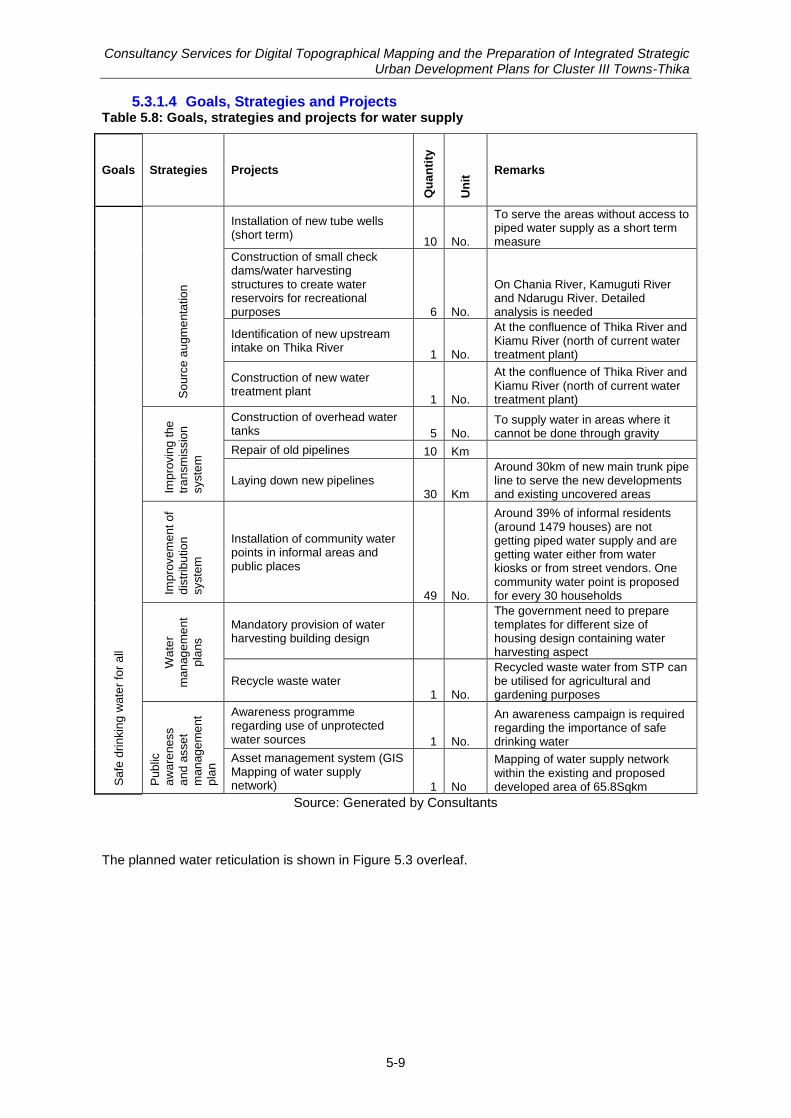
Consultancy Services for Digital Topographical Mapping and the Preparation of Integrated Strategic Urban Development Plans for Cluster III Towns-Thika
5-9
5.3.1.4 Goals, Strategies and Projects Table 5.8: Goals, strategies and projects for water supply
Goals Strategies Projects
Qu
an
tity
Un
it Remarks
Sa
fe d
rin
kin
g w
ate
r fo
r a
ll
So
urc
e a
ugm
enta
tio
n
Installation of new tube wells (short term)
10 No.
To serve the areas without access to piped water supply as a short term measure
Construction of small check dams/water harvesting structures to create water reservoirs for recreational purposes 6 No.
On Chania River, Kamuguti River and Ndarugu River. Detailed analysis is needed
Identification of new upstream intake on Thika River
1 No.
At the confluence of Thika River and Kiamu River (north of current water treatment plant)
Construction of new water treatment plant
1 No.
At the confluence of Thika River and Kiamu River (north of current water treatment plant)
Imp
rovin
g t
he
tra
nsm
issio
n
syste
m
Construction of overhead water tanks 5 No.
To supply water in areas where it cannot be done through gravity
Repair of old pipelines 10 Km
Laying down new pipelines 30 Km
Around 30km of new main trunk pipe line to serve the new developments and existing uncovered areas
Imp
rovem
en
t o
f
dis
trib
utio
n
syste
m
Installation of community water points in informal areas and public places
49 No.
Around 39% of informal residents (around 1479 houses) are not getting piped water supply and are getting water either from water kiosks or from street vendors. One community water point is proposed for every 30 households
Wa
ter
ma
nag
em
en
t
pla
ns
Mandatory provision of water harvesting building design
The government need to prepare templates for different size of housing design containing water harvesting aspect
Recycle waste water 1 No.
Recycled waste water from STP can be utilised for agricultural and gardening purposes
Pu
blic
aw
are
ness
an
d a
sse
t
ma
nag
em
en
t
pla
n
Awareness programme regarding use of unprotected water sources 1 No.
An awareness campaign is required regarding the importance of safe drinking water
Asset management system (GIS Mapping of water supply network) 1 No
Mapping of water supply network within the existing and proposed developed area of 65.8Sqkm
Source: Generated by Consultants
The planned water reticulation is shown in Figure 5.3 overleaf.
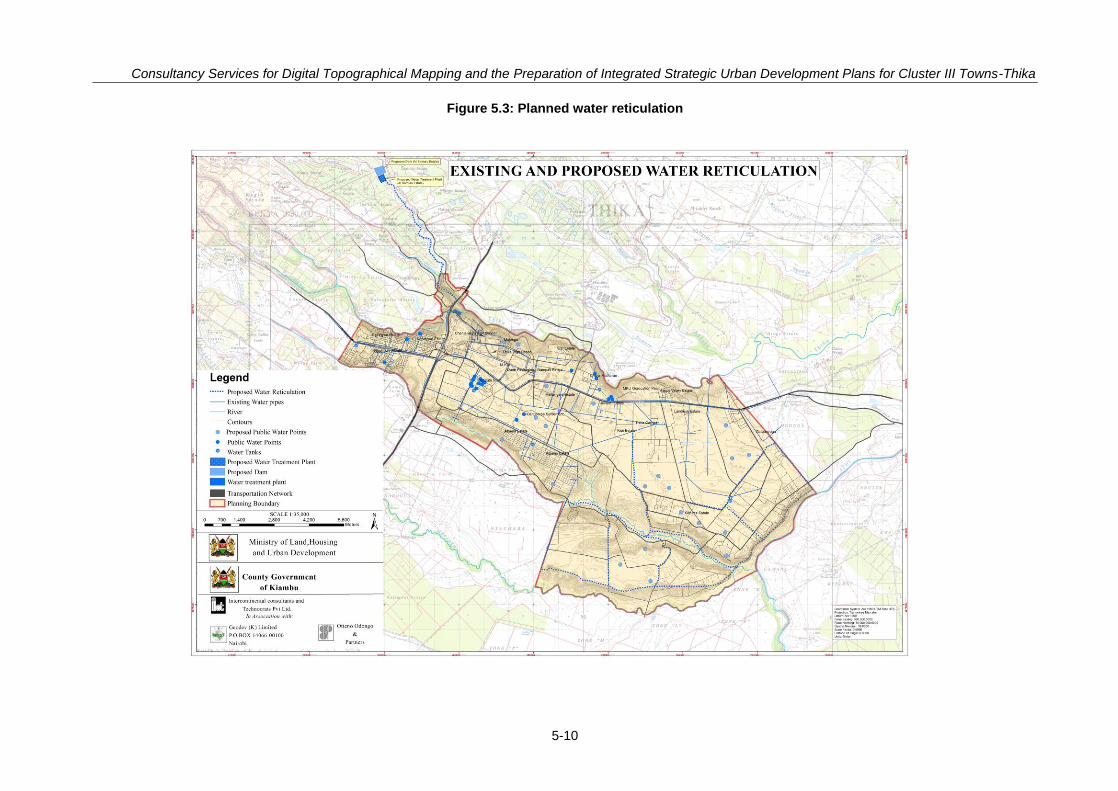
Consultancy Services for Digital Topographical Mapping and the Preparation of Integrated Strategic Urban Development Plans for Cluster III Towns-Thika
5-10
Figure 5.3: Planned water reticulation
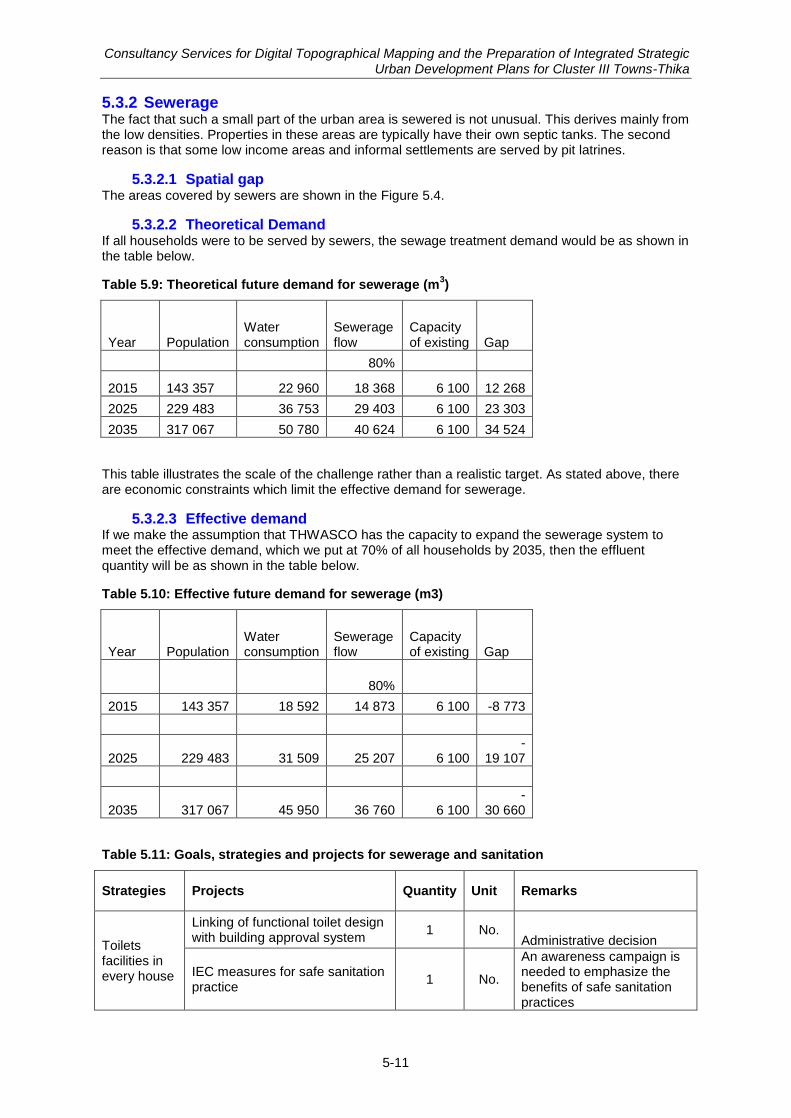
Consultancy Services for Digital Topographical Mapping and the Preparation of Integrated Strategic Urban Development Plans for Cluster III Towns-Thika
5-11
5.3.2 Sewerage The fact that such a small part of the urban area is sewered is not unusual. This derives mainly from the low densities. Properties in these areas are typically have their own septic tanks. The second reason is that some low income areas and informal settlements are served by pit latrines.
5.3.2.1 Spatial gap The areas covered by sewers are shown in the Figure 5.4.
5.3.2.2 Theoretical Demand If all households were to be served by sewers, the sewage treatment demand would be as shown in the table below.
Table 5.9: Theoretical future demand for sewerage (m3)
Year Population Water consumption
Sewerage flow
Capacity of existing Gap
80%
2015 143 357 22 960 18 368 6 100 12 268
2025 229 483 36 753 29 403 6 100 23 303
2035 317 067 50 780 40 624 6 100 34 524
This table illustrates the scale of the challenge rather than a realistic target. As stated above, there are economic constraints which limit the effective demand for sewerage.
5.3.2.3 Effective demand If we make the assumption that THWASCO has the capacity to expand the sewerage system to meet the effective demand, which we put at 70% of all households by 2035, then the effluent quantity will be as shown in the table below.
Table 5.10: Effective future demand for sewerage (m3)
Year Population Water consumption
Sewerage flow
Capacity of existing Gap
80%
2015 143 357 18 592 14 873 6 100 -8 773
2025 229 483 31 509 25 207 6 100 -
19 107
2035 317 067 45 950 36 760 6 100 -
30 660
Table 5.11: Goals, strategies and projects for sewerage and sanitation
Strategies Projects Quantity Unit Remarks
Toilets facilities in every house
Linking of functional toilet design with building approval system
1 No. Administrative decision
IEC measures for safe sanitation practice
1 No.
An awareness campaign is needed to emphasize the benefits of safe sanitation practices

Consultancy Services for Digital Topographical Mapping and the Preparation of Integrated Strategic Urban Development Plans for Cluster III Towns-Thika
5-12
Strategies Projects Quantity Unit Remarks
Providing sewer system in whole town area
Construction of new sewerage treatment plant (35,000m
3/day)
in Nanga area near Gatuanyaga 1 no
The new sewerage treatment plant will serve the northern part of the planning area
Increase the number of ponds in the current STP to cater for Witeithie, Kiganjo and Kamuthi areas
5 No. Adding of 5 ponds will increase the capacity of the existing STP.
Implementation of study on feasibility and comprehensive design for sewer network
1 No.
Administrative decision
Replacement of the pitch fibre pipes in Biafra estate with PVC
3 Km -
Replace overloaded 225mm pipes in Makongeni phase V and Phase IV to 375mm, and in other areas as required
5 Km
-
Provide sewer connections in Kisii Estate
1 No. Administrative decision
Providing community and public toilets
Construction of community toilets in informal areas (1/25 families)
18 No.
Around 12% of informal residents (around 461 houses) do not have household toilets. One community toilet is proposed for every 25 households
Public toilets in market areas and public buildings
20 No. Public toilets are proposed in all the existing and proposed market areas
Source: Generated by Consultants
The planned sewer coverage is shown in Figure 5.5.
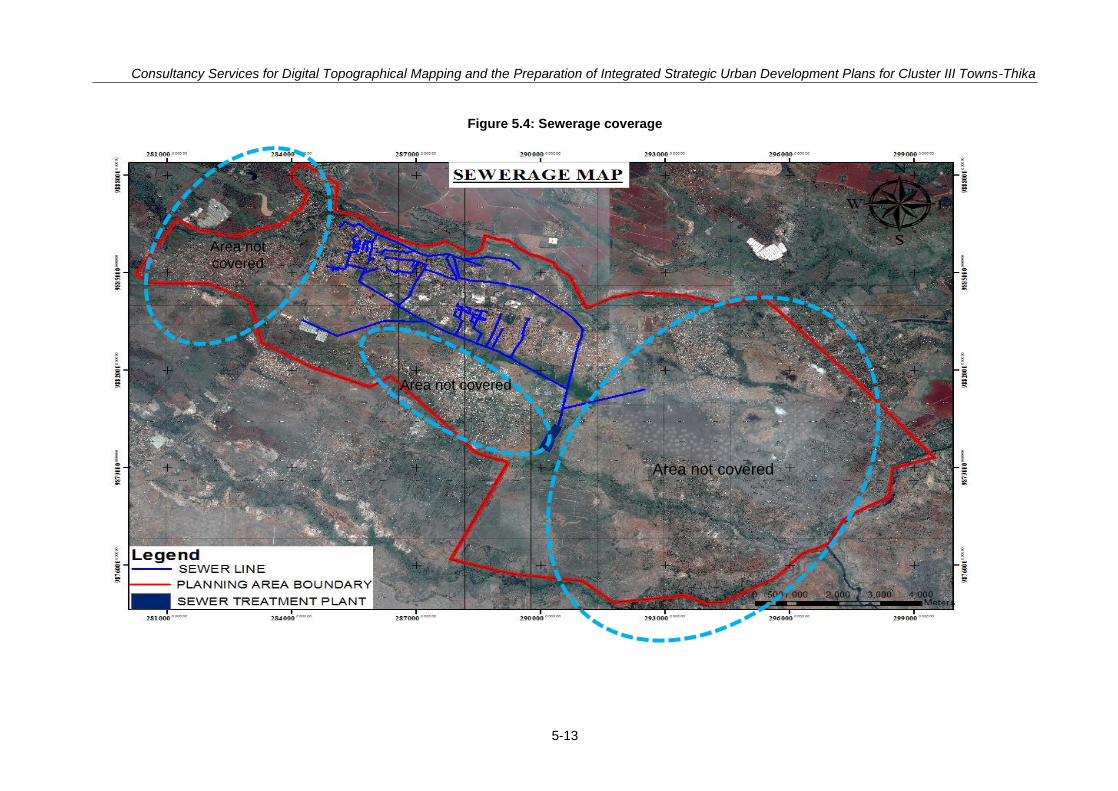
Consultancy Services for Digital Topographical Mapping and the Preparation of Integrated Strategic Urban Development Plans for Cluster III Towns-Thika
5-13
Area not covered
Area not covered
Area not covered
Figure 5.4: Sewerage coverage
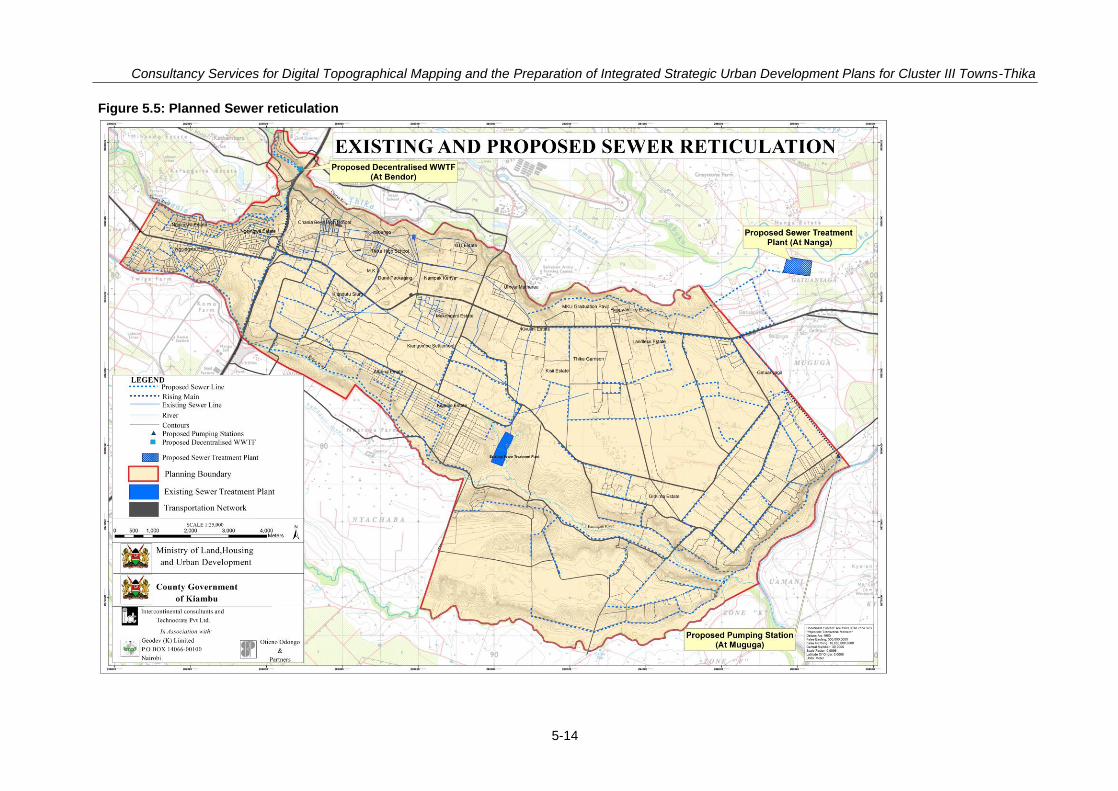
Consultancy Services for Digital Topographical Mapping and the Preparation of Integrated Strategic Urban Development Plans for Cluster III Towns-Thika
5-14
Figure 5.5: Planned Sewer reticulation

Consultancy Services for Digital Topographical Mapping and the Preparation of Integrated Strategic Urban Development Plans for Cluster III Towns-Thika
5-15
5.3.3 Stormwater drainage 5.3.3.1 Summary of the current stormwater drainage status
About 5% (20km of 410km) of all roads within Thika town planning area have drainage with about 6-10km of the same paved or underground.
The drains along Garissa and Kenyatta Highways are surface drains and cover approximately 70% of the entire length of these roads. 4.2km of the Garissa road has unlined, 2m wide drains. 0.9km near the Kenyatta Highway junction is paved and lined. About 3.3 km, (width ranging from 05 to 1.5m) of the entire road length within the planning area up to the Ngoriba area is unpaved and unlined
Kenyatta Highway is drained (1.5m width) for 3.5km of its 4.4km. The width of these drainage channels ranges from 2m (along Garissa road near the junction with Kenyatta highway and along Kenyatta highway next to Nakumatt supermarket) to about 0.5m (at Makongeni along Garissa road and near Tuskys supermarket and Namsap Industry along Kenyatta highway).
4km of the 5km total road length in the CBD are served with mainly piped storm water drains. 1.2km of General Kago Road (which is 2km in total) is drained, of which 0.75km unlined and 0.4km lined. Other roads are Haile Selassie Avenue (0.8km of 1.5km covered), Mangu Road about 1km, Workshop Road (0.6km lined), Upper Road 0.4km lined and along Thika Superhigway which is about 3km (lined) of the 5km within the planning area. The width of these drains range from 0.5m to 1.5m.
The overall town level coverage in terms of storm water drains is shown in the Figure 5.6 on the next page.
5.3.3.2 Demand supply gap Garissa Road needs drainage channels of 2m width on one side from Metro Fill to Engen junction where there is not much development, and 1 – 1.5m width channels on either side of the roads from Engen to past Kivulini estate. Kenyatta Highway requires proper drainage channels especially in the Pilot area and along Nampak Industry (1 – 1.5m width). Other areas that require drainage include General Kago Road, the road serving Thika High School, Moi and Jamhuri Markets and most residential estates especially Makongeni, Kisii, Ziwani, Pilot and Starehe
The demand supply gap of planning area for stormwater drains is given in table below:
Table 5.12: Demand and gap assessment of stormwater drainage (km)
Facilities Norms Current Availability in Town
Demand Gap
2015* 2035** 2015 2035
Primary drains (2 to 5 m
3)
As per natural drainage and slope
10 40 60 20 50
Secondary drains (1 m3)
Along both sides of major roads (around 25% of tertiary drain length)
20 205 255 185 235
Tertiary drains (1 to 5 cubic feet) Both sides of all other roads
0 820 1020 820 1020
*Total road length 410km ** Total road length 520km Source: Consultants‟ Estimation
Area covered
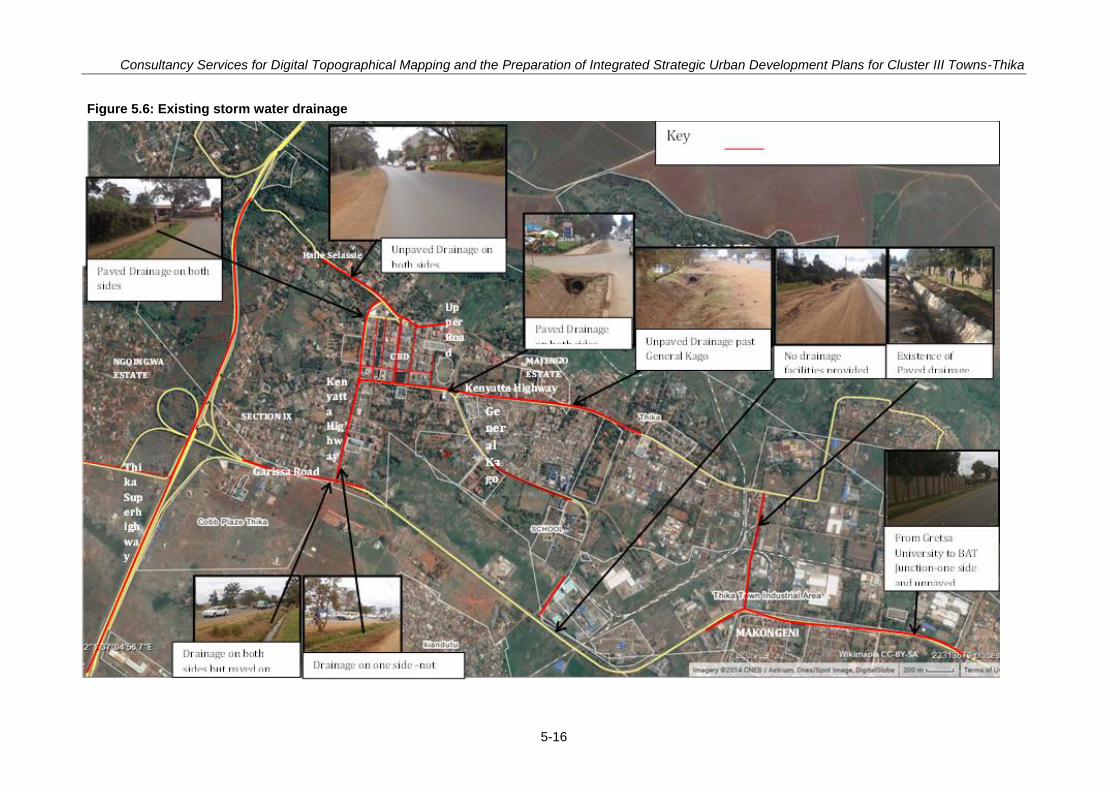
Consultancy Services for Digital Topographical Mapping and the Preparation of Integrated Strategic Urban Development Plans for Cluster III Towns-Thika
5-16
Figure 5.6: Existing storm water drainage
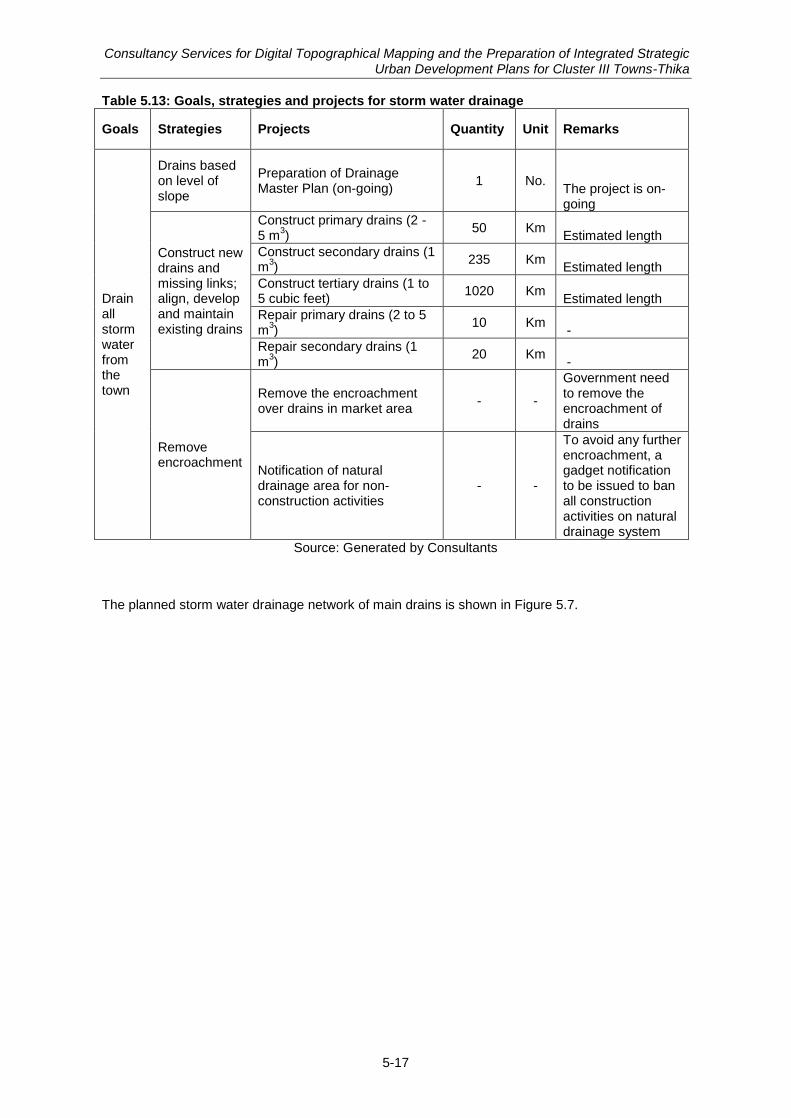
Consultancy Services for Digital Topographical Mapping and the Preparation of Integrated Strategic Urban Development Plans for Cluster III Towns-Thika
5-17
Table 5.13: Goals, strategies and projects for storm water drainage
Goals Strategies Projects Quantity Unit Remarks
Drain all storm water from the town
Drains based on level of slope
Preparation of Drainage Master Plan (on-going)
1 No. The project is on-going
Construct new drains and missing links; align, develop and maintain existing drains
Construct primary drains (2 - 5 m
3)
50 Km Estimated length
Construct secondary drains (1 m
3)
235 Km Estimated length
Construct tertiary drains (1 to 5 cubic feet)
1020 Km Estimated length
Repair primary drains (2 to 5 m
3)
10 Km -
Repair secondary drains (1 m
3)
20 Km -
Remove encroachment
Remove the encroachment over drains in market area
- -
Government need to remove the encroachment of drains
Notification of natural drainage area for non-construction activities
- -
To avoid any further encroachment, a gadget notification to be issued to ban all construction activities on natural drainage system
Source: Generated by Consultants
The planned storm water drainage network of main drains is shown in Figure 5.7.
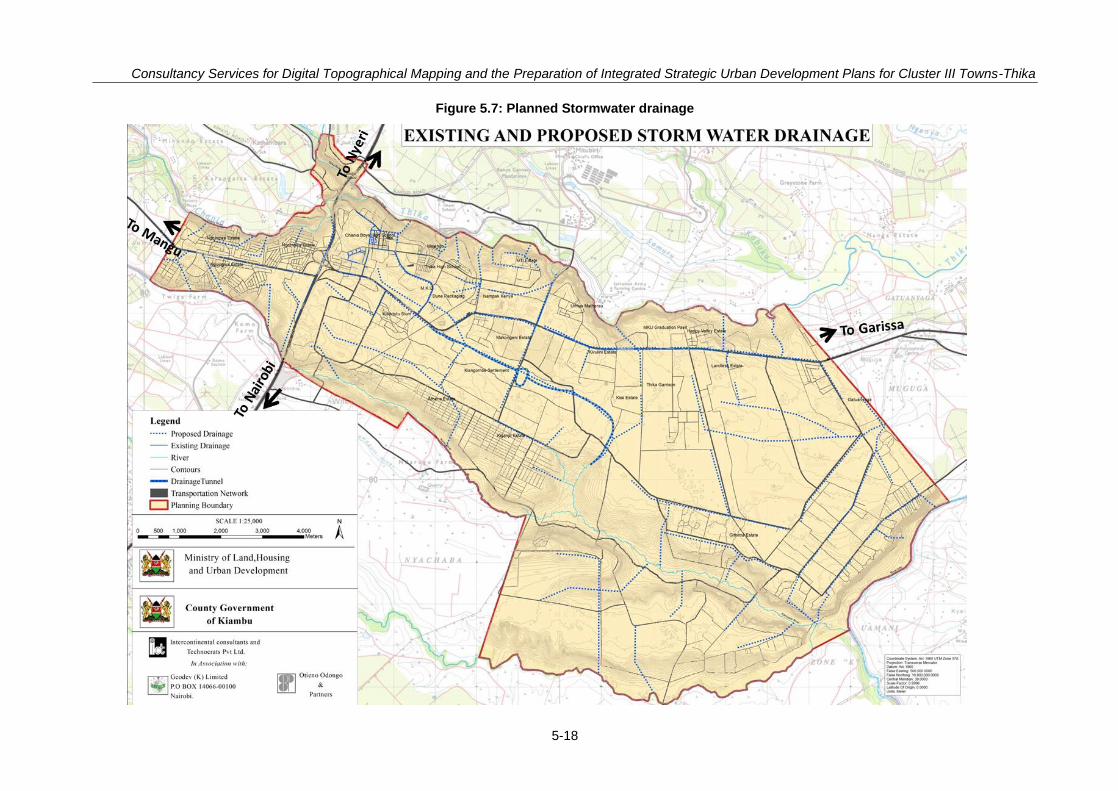
Consultancy Services for Digital Topographical Mapping and the Preparation of Integrated Strategic Urban Development Plans for Cluster III Towns-Thika
5-18
Figure 5.7: Planned Stormwater drainage
Consultancy Services for Digital Topographical Mapping and the Preparation of Integrated Strategic Urban Development Plans for Cluster III Towns-Thika
5-19
5.3.4 Solid waste 5.3.4.1 Existing situation
The main areas in which there is a waste collection service are Kamenu and Township wards. These are areas where major commercial activities occur and they include the CBD, markets and parts of Makongeni and also Industrial areas. The County Government lacks enough vehicles to serve all areas. This can be attributed to the lack of more efficient containerization and purpose-built vehicles.
Generally, waste collection rates are directly related to income levels. Low-income areas have low collection rates. In Thika town, collection of waste in these areas is poor or inadequate due to lack of enough transport vehicles or even prioritization factors where the highly commercialized areas like markets and CBD are given more priority. Most waste collection is concentrated in the CBD and markets as these are the areas that produce the highest waste quantities. Waste collection in the informal areas is as follows:
Kamenu Ward
Makongeni estate –waste collection is inadequate
Kiganjo –waste collection is very poor
Landless –inadequate solid waste collection
Township ward
Kiandutu – Kiandutu slum residents lacked organized solid waste disposal methods. Most of the residents said they dumped their solid waste on any open spaces available and preferably short distances from their houses while over 80% of the households disposed of their waste by dumping outside their houses, on the roads. This situation depicts a high potential for an Integrated Solid Waste Management in the slum. Solid waste is collected once per week by the County Government.
Generation vs Collection/Transportation/Disposal or Treatment: The generation curve for solid waste is higher than the ability to collect and many areas (especially Makongeni, Kamenu and Kisii estates) are left with waste uncollected either completely or on time. Only 70% (150 tons) is collected daily. With the expected growth of the town the situation will only get worse unless more vehicles are acquired to match the supply. The coverage of solid waste collection system is shown in Figure 5.8 on next page.
5.3.4.2 Demand assessment The demand calculation below assumes that all waste is collected, and that demand increases at the same rate as population. In fact the tendency is for solid waste generation to increase with incomes. Therefore it is quite possible that the figures in the table below will be exceeded.
Table 5.14: Solid waste generation demand assessment
Year Population
Quantity per head/ day (kg)
Total/day (kg)
Other sources
Total/day (tonnes)
2015 143 357 0,80 114 686 100 000 215
2025 229 483 0,80 183 586 160 078 344
2035 317 067 0,80 253 654 221 173 475
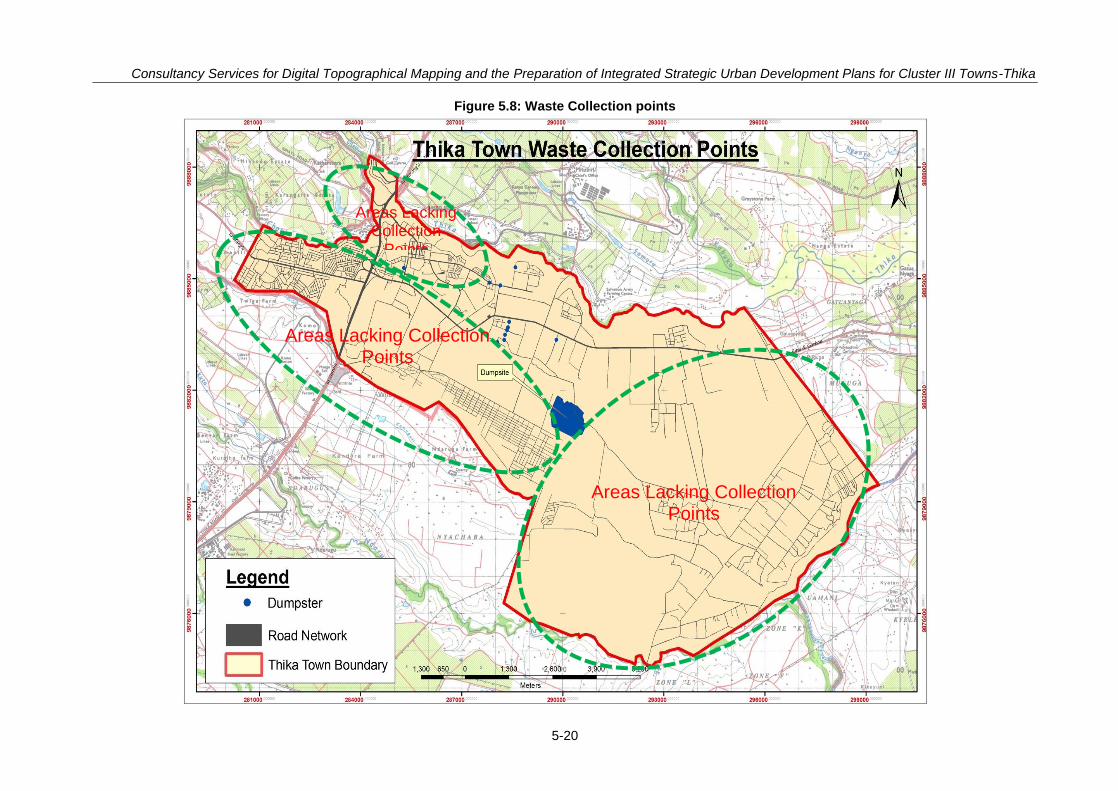
Consultancy Services for Digital Topographical Mapping and the Preparation of Integrated Strategic Urban Development Plans for Cluster III Towns-Thika
5-20
Figure 5.8: Waste Collection points
Areas Lacking Collection Points
Areas Lacking Collection Points
Areas Lacking Collection
Points
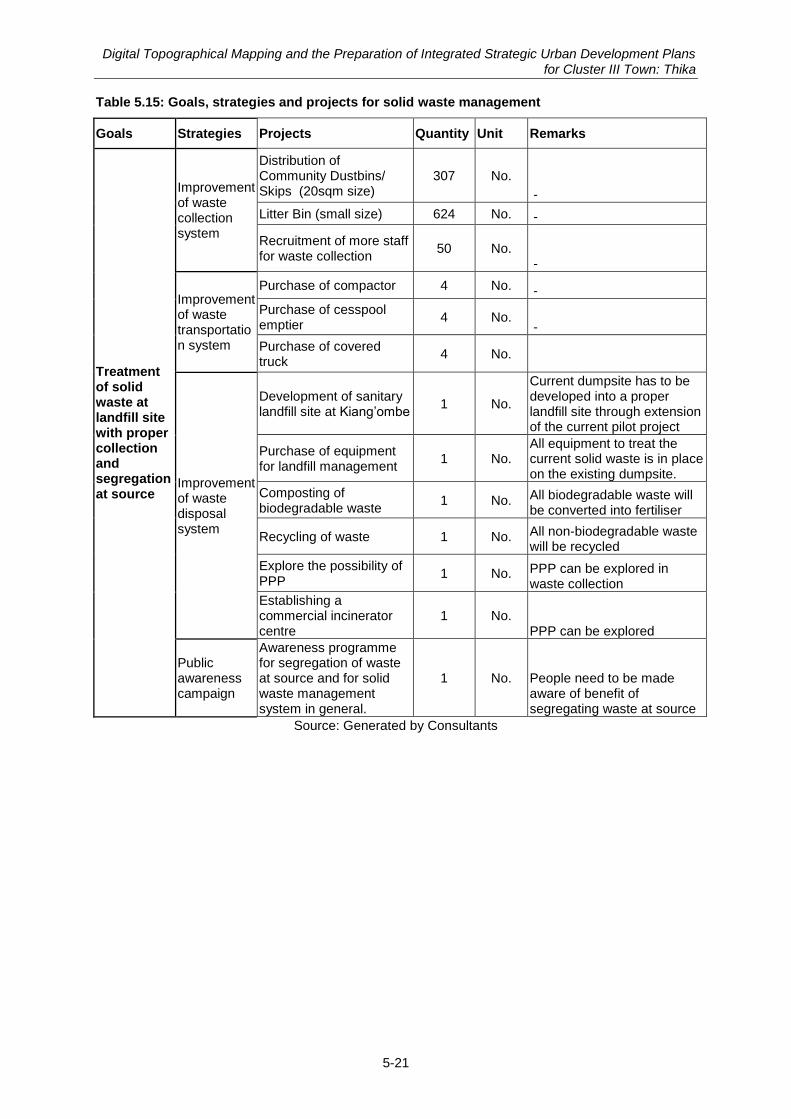
Digital Topographical Mapping and the Preparation of Integrated Strategic Urban Development Plans for Cluster III Town: Thika
5-21
Table 5.15: Goals, strategies and projects for solid waste management
Goals Strategies Projects Quantity Unit Remarks
Treatment of solid waste at landfill site with proper collection and segregation at source
Improvement of waste collection system
Distribution of Community Dustbins/ Skips (20sqm size)
307 No.
-
Litter Bin (small size) 624 No. -
Recruitment of more staff for waste collection
50 No. -
Improvement of waste transportation system
Purchase of compactor 4 No. -
Purchase of cesspool emptier
4 No. -
Purchase of covered truck
4 No.
Improvement of waste disposal system
Development of sanitary landfill site at Kiang‟ombe
1 No.
Current dumpsite has to be developed into a proper landfill site through extension of the current pilot project
Purchase of equipment for landfill management
1 No. All equipment to treat the current solid waste is in place on the existing dumpsite.
Composting of biodegradable waste
1 No. All biodegradable waste will be converted into fertiliser
Recycling of waste 1 No. All non-biodegradable waste will be recycled
Explore the possibility of PPP
1 No. PPP can be explored in waste collection
Establishing a commercial incinerator centre
1 No. PPP can be explored
Public awareness campaign
Awareness programme for segregation of waste at source and for solid waste management system in general.
1 No. People need to be made aware of benefit of segregating waste at source
Source: Generated by Consultants

Digital Topographical Mapping and the Preparation of Integrated Strategic Urban Development Plans for Cluster III Town: Thika
5-22
5.3.5 Fire safety The County Government of Kiambu Fire Rescue Service is the agency responsible for fire safety in Thika town. There is one fire station in Thika town. It operates 24 hours, and is the headquarters of Kiambu County and a Resource Centre in terms of personnel and appliances. The other sub-counties in Kiambu County have only a Land Rover and an ambulance and rely heavily on Thika Sub-County for backup.
The existing fire fighting capacity is shown in table below.
Table 5.16: Summary of Current Fire Safety Status
Number of fire stations 1
Number and type of fire engines
Mercedes truck with a capacity of 4500 litres of water and 500 litres of foam
Land Rover with a capacity of 400 litres
Volvo truck with a capacity of 1800 litres
Dennis truck with a capacity of 1400 litres and equipment for mixing foam
Ambulance with rescue services and injuries equipment
Water tanker
Number of fire hydrants About 100
Number of staff 3 fire officers
3 shift officers in charge
22 fire fighters
14 drivers – minimum of 3 drivers per shift
The location of the fire hydrants and fire station is shown in Figure 5.9.
5.3.5.1 Demand and supply for fire services Demand supply gap of fire services is presented in table below:
Table 5.17: Demand Gap Assessment of Fire Safety
Facility (1 per catchment population)
Level
Land required in hectares
Current Availability in Town
Demand Gap
2015 (Pop:143357)
2035 (Pop: 317067)
2015 2035
Fire Sub-Station
50,000 Sector level
0.2 0 3 6 3 6
Fire Station 100,000
Town Level
0.4 1 1 3 0 2
Source: Adopted from the Physical Planning Handbook, 2008
Goals, strategies and projects for fire fighting are presented in Table 5.18
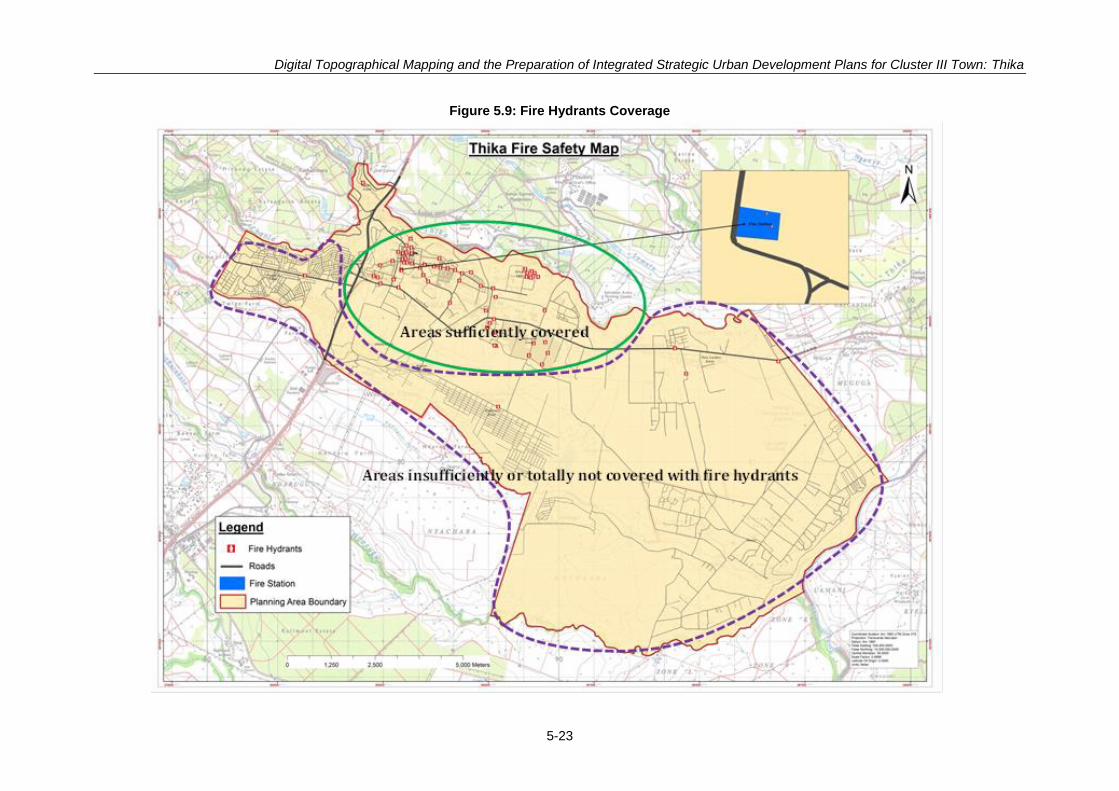
Digital Topographical Mapping and the Preparation of Integrated Strategic Urban Development Plans for Cluster III Town: Thika
5-23
Figure 5.9: Fire Hydrants Coverage
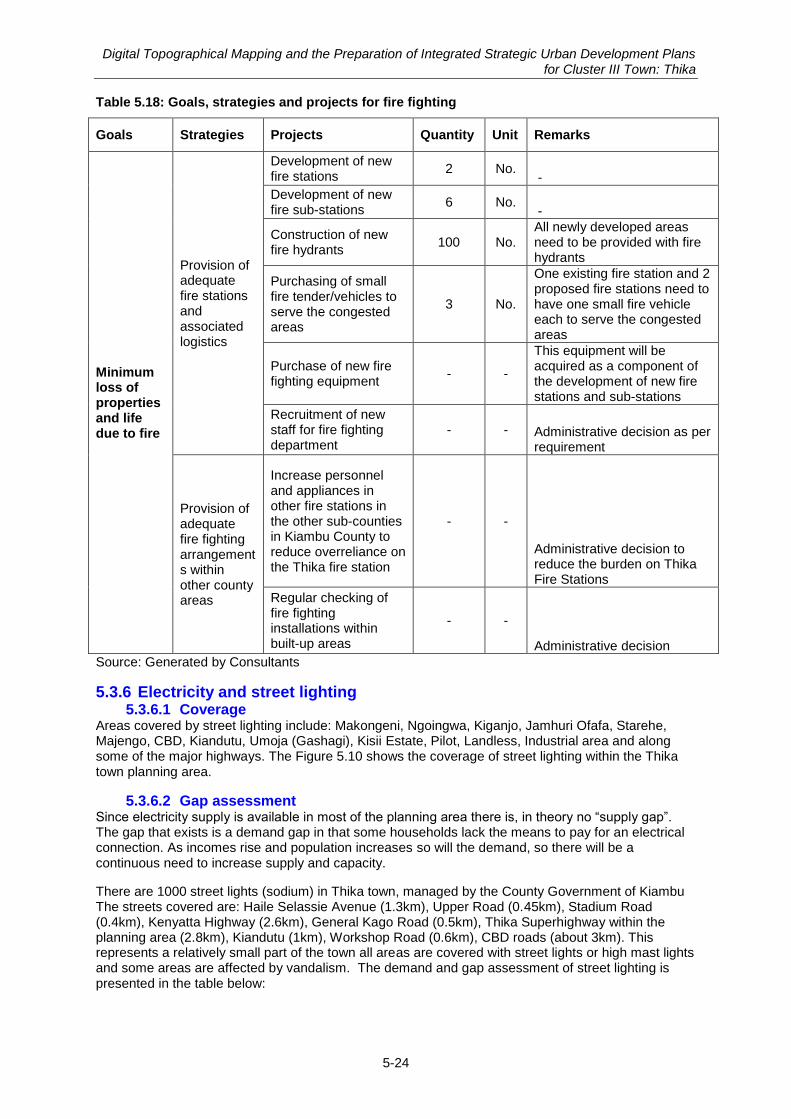
Digital Topographical Mapping and the Preparation of Integrated Strategic Urban Development Plans for Cluster III Town: Thika
5-24
Table 5.18: Goals, strategies and projects for fire fighting
Goals Strategies Projects Quantity Unit Remarks
Minimum loss of properties and life due to fire
Provision of adequate fire stations and associated logistics
Development of new fire stations
2 No. -
Development of new fire sub-stations
6 No. -
Construction of new fire hydrants
100 No. All newly developed areas need to be provided with fire hydrants
Purchasing of small fire tender/vehicles to serve the congested areas
3 No.
One existing fire station and 2 proposed fire stations need to have one small fire vehicle each to serve the congested areas
Purchase of new fire fighting equipment
- -
This equipment will be acquired as a component of the development of new fire stations and sub-stations
Recruitment of new staff for fire fighting department
- - Administrative decision as per requirement
Provision of adequate fire fighting arrangements within other county areas
Increase personnel and appliances in other fire stations in the other sub-counties in Kiambu County to reduce overreliance on the Thika fire station
- -
Administrative decision to reduce the burden on Thika Fire Stations
Regular checking of fire fighting installations within built-up areas
- -
Administrative decision
Source: Generated by Consultants
5.3.6 Electricity and street lighting 5.3.6.1 Coverage
Areas covered by street lighting include: Makongeni, Ngoingwa, Kiganjo, Jamhuri Ofafa, Starehe, Majengo, CBD, Kiandutu, Umoja (Gashagi), Kisii Estate, Pilot, Landless, Industrial area and along some of the major highways. The Figure 5.10 shows the coverage of street lighting within the Thika town planning area.
5.3.6.2 Gap assessment Since electricity supply is available in most of the planning area there is, in theory no “supply gap”. The gap that exists is a demand gap in that some households lack the means to pay for an electrical connection. As incomes rise and population increases so will the demand, so there will be a continuous need to increase supply and capacity.
There are 1000 street lights (sodium) in Thika town, managed by the County Government of Kiambu The streets covered are: Haile Selassie Avenue (1.3km), Upper Road (0.45km), Stadium Road (0.4km), Kenyatta Highway (2.6km), General Kago Road (0.5km), Thika Superhighway within the planning area (2.8km), Kiandutu (1km), Workshop Road (0.6km), CBD roads (about 3km). This represents a relatively small part of the town all areas are covered with street lights or high mast lights and some areas are affected by vandalism. The demand and gap assessment of street lighting is presented in the table below:
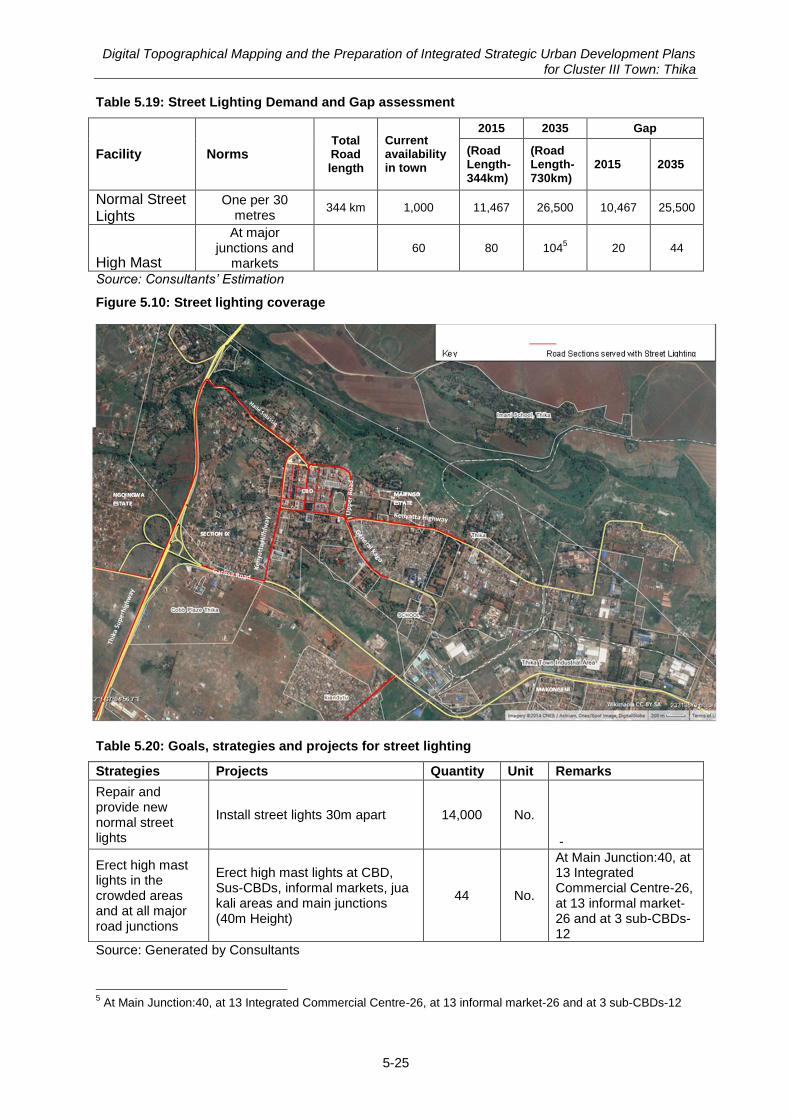
Digital Topographical Mapping and the Preparation of Integrated Strategic Urban Development Plans for Cluster III Town: Thika
5-25
Table 5.19: Street Lighting Demand and Gap assessment
Facility Norms
Total Road length
Current availability in town
2015 2035 Gap
(Road Length-344km)
(Road Length-730km)
2015 2035
Normal Street Lights
One per 30 metres
344 km 1,000 11,467 26,500 10,467 25,500
High Mast
At major junctions and
markets
60 80 1045 20 44
Source: Consultants’ Estimation
Figure 5.10: Street lighting coverage
Table 5.20: Goals, strategies and projects for street lighting
Strategies Projects Quantity Unit Remarks
Repair and provide new normal street lights
Install street lights 30m apart 14,000 No.
-
Erect high mast lights in the crowded areas and at all major road junctions
Erect high mast lights at CBD, Sus-CBDs, informal markets, jua kali areas and main junctions (40m Height)
44 No.
At Main Junction:40, at 13 Integrated Commercial Centre-26, at 13 informal market-26 and at 3 sub-CBDs-12
Source: Generated by Consultants
5 At Main Junction:40, at 13 Integrated Commercial Centre-26, at 13 informal market-26 and at 3 sub-CBDs-12

Digital Topographical Mapping and the Preparation of Integrated Strategic Urban Development Plans for Cluster III Town: Thika
5-26
5.4 Roads and Transport
5.4.1 Traffic volumes and road capacity Major international trunk roads those pass through Thika town are Nairobi Thika Highway (A2) and Garissa Road (A3). Thika-Mangu Road (C-66) is an intercity road which originates in Thika. The Kenya National Highway Authority (KeNHA) designs and maintains these roads. Major internal roads in Thika are Kenyatta Highway, Upper Road, Workshop road, General Kago Road, Haile Selassie Road etc.
Existing traffic volume on these roads and their capacities have been analysed to assess the existing road space demand. Traffic figures on these roads are projected for the horizon year. Future demand is analysed based on projected road capacity as committed. Road capacity standards are obtained from “Road Design Guidelines for Urban Roads, 2001 – Ministry of Local Government, Government of Kenya”. Table below shows peak hour traffic on major trunk roads passing through Thika.
Table 5.21: Traffic and capacity of major trunk roads
Road Name Location Lane Configuration
Capacity* Peak Hour Traffic 2015
Volume to Capacity Ratio (V/C)
Nairobi-Thika Super Highway (A2)
North of Thika Interchange
4- Lane Divided 4,400
2,827 0.64
Garissa Road (A3) East of Thika Interchange
Two Lane with Exclusive Left Turn Lane
2,200 3,478 1.58
Garissa Road (A3) East of Factory Road, Thika
Two Lane Undivided
1,800 1,904 1.06
*Road Design Guidelines for Urban Roads, 2001 - Ministry of Local Government, Government of Kenya
Existing peak hour traffic on the Nairobi-Thika Road (A2) is within its capacity and volume to capacity ratio 0.64 is within acceptable limits. However, peak hour traffic volume on Garissa Road (A3) immediately east of the Thika interchange exceeds its capacity and its volume to capacity ratio is 1.58 and 1.06 East of Factory Road.
Capacity analyses of other roads in Thika are presented in Table below. Traffic on the Garissa Road (A3) exceeds its capacity from Thika interchange to General Kago Road under existing traffic conditions. The road‟s capacity is also exceeded from General Kago Road to British American Tobacco stage and from British American Tobacco stage to Mount Kenya University in 2020 and 2025 projected traffic condition. Likewise, traffic on General Kago Road from Thika High School to Garissa Road and Kenyatta Highway from Upper Road to Kithimani Road exceed its capacity.
Table 5.22: Projected traffic and road capacity
Road Section From To
Lane Configuration
Capa-city* 2015 2020 2025 2030 2035
Garissa Road (A-3)
Gatitu Junction
General Kago Road
Two Lane undivided 1,800 2,127 2,563 2,903 3,257 3,640
Garissa Road (A-3)
General Kago Road
British American Tobacco Stage
Two Lane undivided
1,800 1,611 1,941 2,198 2,466 2,756
Garissa Road (A-3)
British American Tobacco Stage
Mt Kenya University
Two Lane undivided
1,800 1,357 1,635 1,852 2,078 2,323
General Kago Road
Thika High School
BIDCO Oil Two lane undivided 1,800 1,416 1,706 1,932 2,168 2,423
General Kago
BIDCO Oil Garissa Road (A-
Two lane undivided
1,800 2,030 2,446 2,770 3,108 3,474
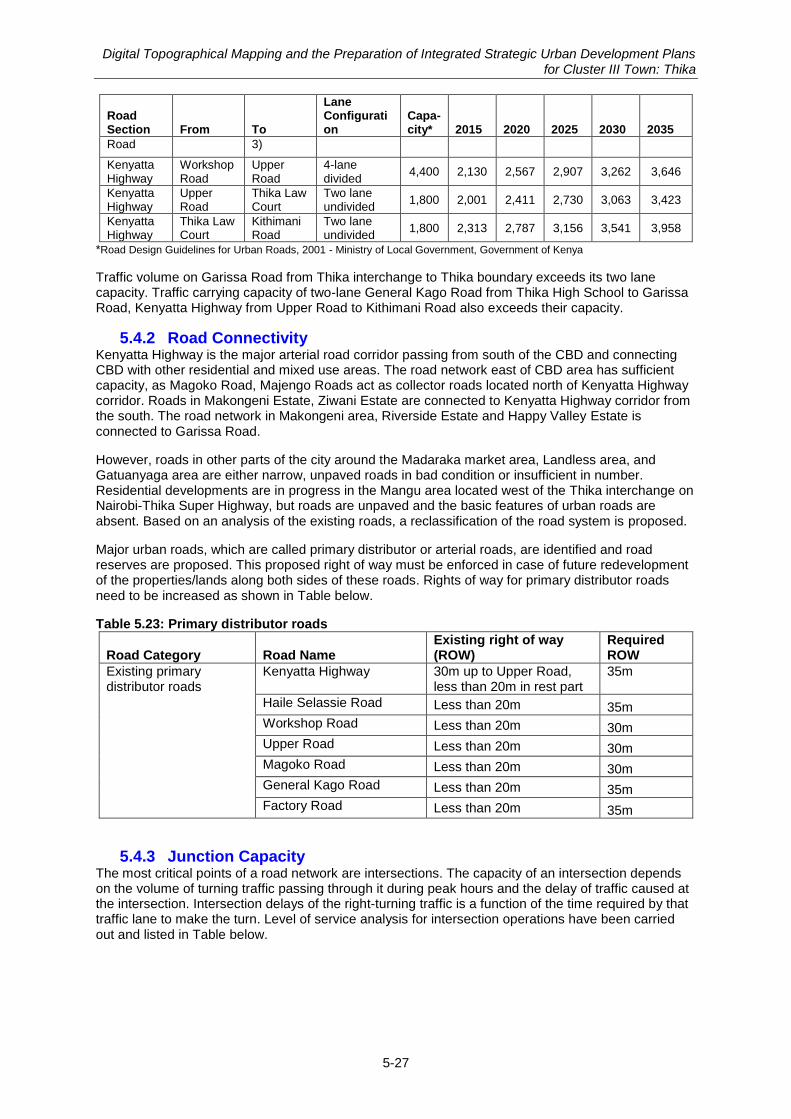
Digital Topographical Mapping and the Preparation of Integrated Strategic Urban Development Plans for Cluster III Town: Thika
5-27
Road Section From To
Lane Configuration
Capa-city* 2015 2020 2025 2030 2035
Road 3)
Kenyatta Highway
Workshop Road
Upper Road
4-lane divided
4,400 2,130 2,567 2,907 3,262 3,646
Kenyatta Highway
Upper Road
Thika Law Court
Two lane undivided
1,800 2,001 2,411 2,730 3,063 3,423
Kenyatta Highway
Thika Law Court
Kithimani Road
Two lane undivided
1,800 2,313 2,787 3,156 3,541 3,958
*Road Design Guidelines for Urban Roads, 2001 - Ministry of Local Government, Government of Kenya
Traffic volume on Garissa Road from Thika interchange to Thika boundary exceeds its two lane capacity. Traffic carrying capacity of two-lane General Kago Road from Thika High School to Garissa Road, Kenyatta Highway from Upper Road to Kithimani Road also exceeds their capacity.
5.4.2 Road Connectivity Kenyatta Highway is the major arterial road corridor passing from south of the CBD and connecting CBD with other residential and mixed use areas. The road network east of CBD area has sufficient capacity, as Magoko Road, Majengo Roads act as collector roads located north of Kenyatta Highway corridor. Roads in Makongeni Estate, Ziwani Estate are connected to Kenyatta Highway corridor from the south. The road network in Makongeni area, Riverside Estate and Happy Valley Estate is connected to Garissa Road.
However, roads in other parts of the city around the Madaraka market area, Landless area, and Gatuanyaga area are either narrow, unpaved roads in bad condition or insufficient in number. Residential developments are in progress in the Mangu area located west of the Thika interchange on Nairobi-Thika Super Highway, but roads are unpaved and the basic features of urban roads are absent. Based on an analysis of the existing roads, a reclassification of the road system is proposed.
Major urban roads, which are called primary distributor or arterial roads, are identified and road reserves are proposed. This proposed right of way must be enforced in case of future redevelopment of the properties/lands along both sides of these roads. Rights of way for primary distributor roads need to be increased as shown in Table below.
Table 5.23: Primary distributor roads
Road Category Road Name Existing right of way (ROW)
Required ROW
Existing primary distributor roads
Kenyatta Highway 30m up to Upper Road, less than 20m in rest part
35m
Haile Selassie Road Less than 20m 35m
Workshop Road Less than 20m 30m
Upper Road Less than 20m 30m
Magoko Road Less than 20m 30m
General Kago Road Less than 20m 35m
Factory Road Less than 20m 35m
5.4.3 Junction Capacity The most critical points of a road network are intersections. The capacity of an intersection depends on the volume of turning traffic passing through it during peak hours and the delay of traffic caused at the intersection. Intersection delays of the right-turning traffic is a function of the time required by that traffic lane to make the turn. Level of service analysis for intersection operations have been carried out and listed in Table below.
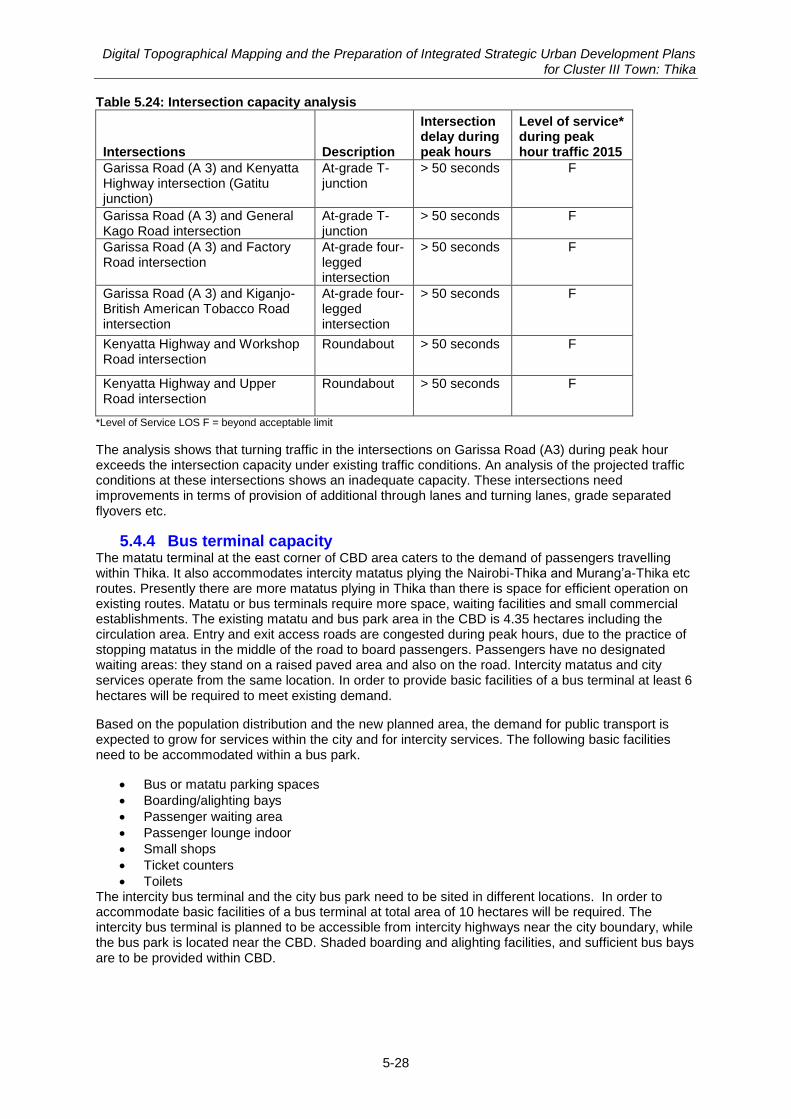
Digital Topographical Mapping and the Preparation of Integrated Strategic Urban Development Plans for Cluster III Town: Thika
5-28
Table 5.24: Intersection capacity analysis
Intersections Description
Intersection delay during peak hours
Level of service* during peak hour traffic 2015
Garissa Road (A 3) and Kenyatta Highway intersection (Gatitu junction)
At-grade T-junction
> 50 seconds F
Garissa Road (A 3) and General Kago Road intersection
At-grade T-junction
> 50 seconds F
Garissa Road (A 3) and Factory Road intersection
At-grade four- legged intersection
> 50 seconds F
Garissa Road (A 3) and Kiganjo-British American Tobacco Road intersection
At-grade four- legged intersection
> 50 seconds F
Kenyatta Highway and Workshop Road intersection
Roundabout > 50 seconds F
Kenyatta Highway and Upper Road intersection
Roundabout > 50 seconds F
*Level of Service LOS F = beyond acceptable limit
The analysis shows that turning traffic in the intersections on Garissa Road (A3) during peak hour exceeds the intersection capacity under existing traffic conditions. An analysis of the projected traffic conditions at these intersections shows an inadequate capacity. These intersections need improvements in terms of provision of additional through lanes and turning lanes, grade separated flyovers etc.
5.4.4 Bus terminal capacity The matatu terminal at the east corner of CBD area caters to the demand of passengers travelling within Thika. It also accommodates intercity matatus plying the Nairobi-Thika and Murang‟a-Thika etc routes. Presently there are more matatus plying in Thika than there is space for efficient operation on existing routes. Matatu or bus terminals require more space, waiting facilities and small commercial establishments. The existing matatu and bus park area in the CBD is 4.35 hectares including the circulation area. Entry and exit access roads are congested during peak hours, due to the practice of stopping matatus in the middle of the road to board passengers. Passengers have no designated waiting areas: they stand on a raised paved area and also on the road. Intercity matatus and city services operate from the same location. In order to provide basic facilities of a bus terminal at least 6 hectares will be required to meet existing demand.
Based on the population distribution and the new planned area, the demand for public transport is expected to grow for services within the city and for intercity services. The following basic facilities need to be accommodated within a bus park.
Bus or matatu parking spaces
Boarding/alighting bays
Passenger waiting area
Passenger lounge indoor
Small shops
Ticket counters
Toilets The intercity bus terminal and the city bus park need to be sited in different locations. In order to accommodate basic facilities of a bus terminal at total area of 10 hectares will be required. The intercity bus terminal is planned to be accessible from intercity highways near the city boundary, while the bus park is located near the CBD. Shaded boarding and alighting facilities, and sufficient bus bays are to be provided within CBD.
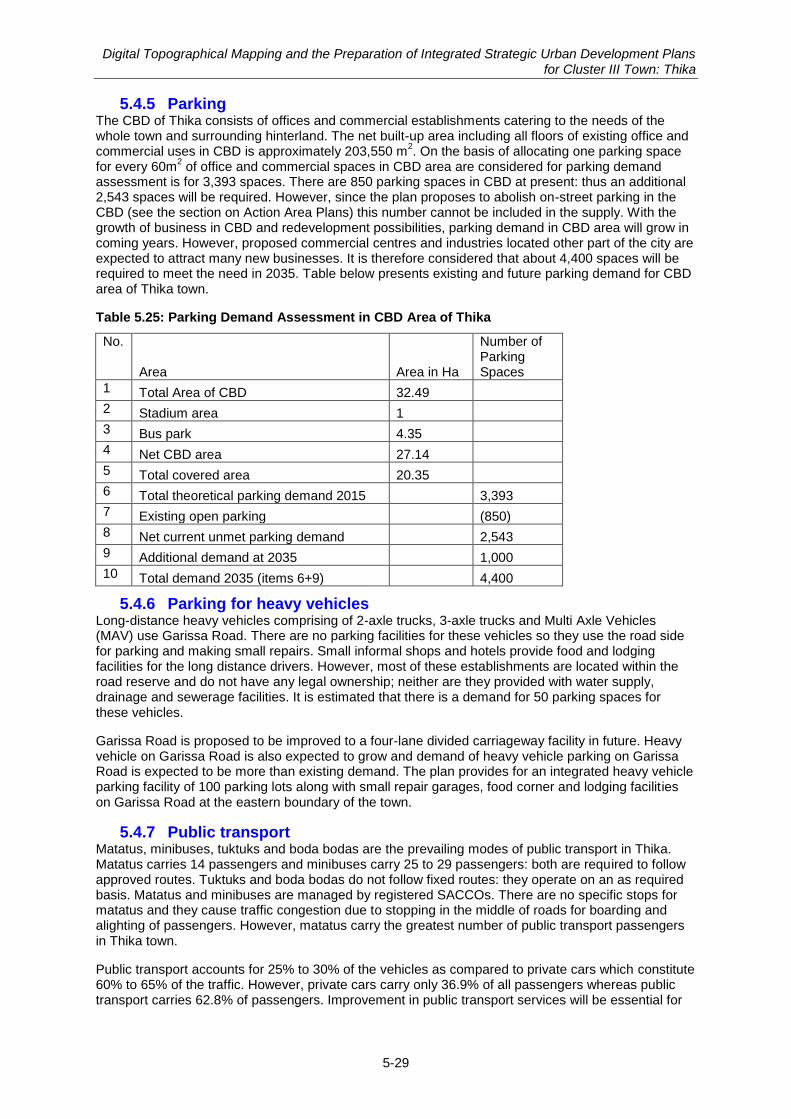
Digital Topographical Mapping and the Preparation of Integrated Strategic Urban Development Plans for Cluster III Town: Thika
5-29
5.4.5 Parking The CBD of Thika consists of offices and commercial establishments catering to the needs of the whole town and surrounding hinterland. The net built-up area including all floors of existing office and commercial uses in CBD is approximately 203,550 m
2. On the basis of allocating one parking space
for every 60m2 of office and commercial spaces in CBD area are considered for parking demand
assessment is for 3,393 spaces. There are 850 parking spaces in CBD at present: thus an additional 2,543 spaces will be required. However, since the plan proposes to abolish on-street parking in the CBD (see the section on Action Area Plans) this number cannot be included in the supply. With the growth of business in CBD and redevelopment possibilities, parking demand in CBD area will grow in coming years. However, proposed commercial centres and industries located other part of the city are expected to attract many new businesses. It is therefore considered that about 4,400 spaces will be required to meet the need in 2035. Table below presents existing and future parking demand for CBD area of Thika town.
Table 5.25: Parking Demand Assessment in CBD Area of Thika
No.
Area Area in Ha
Number of Parking Spaces
1 Total Area of CBD 32.49
2 Stadium area 1
3 Bus park 4.35
4 Net CBD area 27.14
5 Total covered area 20.35
6 Total theoretical parking demand 2015 3,393
7 Existing open parking (850)
8 Net current unmet parking demand 2,543
9 Additional demand at 2035 1,000
10 Total demand 2035 (items 6+9) 4,400
5.4.6 Parking for heavy vehicles Long-distance heavy vehicles comprising of 2-axle trucks, 3-axle trucks and Multi Axle Vehicles (MAV) use Garissa Road. There are no parking facilities for these vehicles so they use the road side for parking and making small repairs. Small informal shops and hotels provide food and lodging facilities for the long distance drivers. However, most of these establishments are located within the road reserve and do not have any legal ownership; neither are they provided with water supply, drainage and sewerage facilities. It is estimated that there is a demand for 50 parking spaces for these vehicles.
Garissa Road is proposed to be improved to a four-lane divided carriageway facility in future. Heavy vehicle on Garissa Road is also expected to grow and demand of heavy vehicle parking on Garissa Road is expected to be more than existing demand. The plan provides for an integrated heavy vehicle parking facility of 100 parking lots along with small repair garages, food corner and lodging facilities on Garissa Road at the eastern boundary of the town.
5.4.7 Public transport Matatus, minibuses, tuktuks and boda bodas are the prevailing modes of public transport in Thika. Matatus carries 14 passengers and minibuses carry 25 to 29 passengers: both are required to follow approved routes. Tuktuks and boda bodas do not follow fixed routes: they operate on an as required basis. Matatus and minibuses are managed by registered SACCOs. There are no specific stops for matatus and they cause traffic congestion due to stopping in the middle of roads for boarding and alighting of passengers. However, matatus carry the greatest number of public transport passengers in Thika town.
Public transport accounts for 25% to 30% of the vehicles as compared to private cars which constitute 60% to 65% of the traffic. However, private cars carry only 36.9% of all passengers whereas public transport carries 62.8% of passengers. Improvement in public transport services will be essential for
Digital Topographical Mapping and the Preparation of Integrated Strategic Urban Development Plans for Cluster III Town: Thika
5-30
Thika to cater to the future travel demand of the city. A public transport share of 75% can be achieved through improvement of the existing system and introduction of new public transport systems.
5.4.8 Goals and Strategies Goal of transport sector is to provide transport infrastructure to improve mobility and accessibility for its residents and supporting population within Thika planning area to support a sustainable future development.
Transport strategies are combination of identified essential improvements on road network, integration of all components of transport, efficient passenger travel and organized goods movements to achieve mobility and accessibility goal. Development projects include,
Road infrastructure improvement o Road Widening o New Roads o Intersection Improvements
Pedestrian and NMT facility improvement
Bus Terminals & Truck Terminals
Public Transport
Parking
Traffic Management Railway Link
Transport sector improvement strategies are also to be supported by development and inclusion of the following components.
5.4.8.1 Establishment of Hierarchal Classification of Roads
Existing road classification in Thika is proposed to be reviewed considering the function of each road. The purpose of road classification system is to identify basic facilities required for each section of urban and rural roads in Thika. As per the road classification system in Kenya, Class A, B, C, D, E, F and G falls under rural road category and Class H,J, K, L, M, N and P are urban roads categories.
5.4.8.2 Enhancement of public transport An organized public transport system is presently unavailable in Thika. Matatu and inter-city buses offer services within urbanized area and rural areas inside Thika and outside of the planning area and connect Thika with other towns in Kenya.
Travel demand and increase in traffic on the roads are associated with economic development of any city. In order to address the issue of ever increasing traffic on road, a reliable public transport system is essential to cater for increased passenger travel demand and reduce the over reliance on the private cars. With introduction of new public transport system and improvement of existing bus/matatu service, an integrated public transport system can be achieved in Thika. Transport and Infrastructure department of the County need to take initiative to sensitize people of Thika to use public transport and discourage private car usage.
5.4.8.3 Promotion Transit Oriented Development (TOD) Viability of public transport depends on the concentration of passenger demand which has relationship with land use. Transit Oriented Development (TOD) is conceptualized as the land use system which supports viability of public transport which reduces the use of private vehicles.
5.4.8.4 Non-Motorised Transport (NMT) Non-Motorized Transport includes Bicycle and it offer a no-pollution alternative mode for short distance trips such as access/egress trips for bus, matatu and rail trips. Development
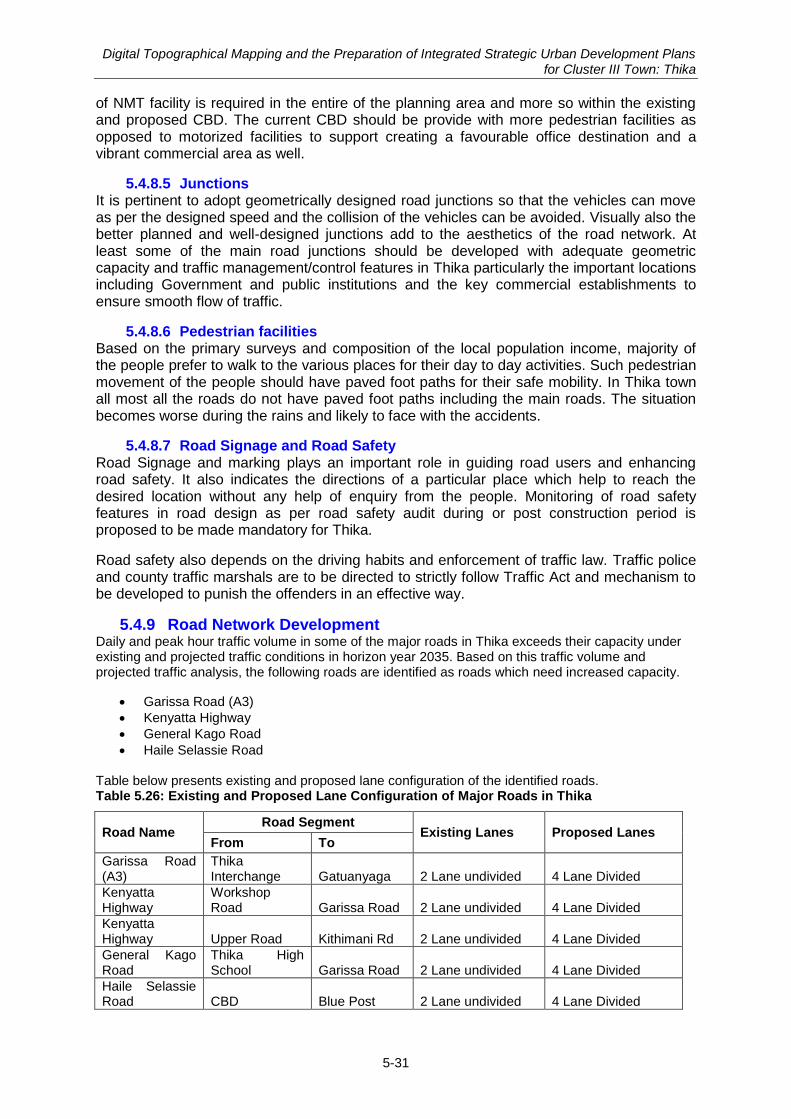
Digital Topographical Mapping and the Preparation of Integrated Strategic Urban Development Plans for Cluster III Town: Thika
5-31
of NMT facility is required in the entire of the planning area and more so within the existing and proposed CBD. The current CBD should be provide with more pedestrian facilities as opposed to motorized facilities to support creating a favourable office destination and a vibrant commercial area as well.
5.4.8.5 Junctions It is pertinent to adopt geometrically designed road junctions so that the vehicles can move as per the designed speed and the collision of the vehicles can be avoided. Visually also the better planned and well-designed junctions add to the aesthetics of the road network. At least some of the main road junctions should be developed with adequate geometric capacity and traffic management/control features in Thika particularly the important locations including Government and public institutions and the key commercial establishments to ensure smooth flow of traffic.
5.4.8.6 Pedestrian facilities Based on the primary surveys and composition of the local population income, majority of the people prefer to walk to the various places for their day to day activities. Such pedestrian movement of the people should have paved foot paths for their safe mobility. In Thika town all most all the roads do not have paved foot paths including the main roads. The situation becomes worse during the rains and likely to face with the accidents.
5.4.8.7 Road Signage and Road Safety Road Signage and marking plays an important role in guiding road users and enhancing road safety. It also indicates the directions of a particular place which help to reach the desired location without any help of enquiry from the people. Monitoring of road safety features in road design as per road safety audit during or post construction period is proposed to be made mandatory for Thika.
Road safety also depends on the driving habits and enforcement of traffic law. Traffic police and county traffic marshals are to be directed to strictly follow Traffic Act and mechanism to be developed to punish the offenders in an effective way.
5.4.9 Road Network Development Daily and peak hour traffic volume in some of the major roads in Thika exceeds their capacity under existing and projected traffic conditions in horizon year 2035. Based on this traffic volume and projected traffic analysis, the following roads are identified as roads which need increased capacity.
Garissa Road (A3)
Kenyatta Highway
General Kago Road
Haile Selassie Road
Table below presents existing and proposed lane configuration of the identified roads. Table 5.26: Existing and Proposed Lane Configuration of Major Roads in Thika
Road Name Road Segment
Existing Lanes Proposed Lanes From To
Garissa Road (A3)
Thika Interchange Gatuanyaga 2 Lane undivided 4 Lane Divided
Kenyatta Highway
Workshop Road Garissa Road 2 Lane undivided 4 Lane Divided
Kenyatta Highway Upper Road Kithimani Rd 2 Lane undivided 4 Lane Divided
General Kago Road
Thika High School Garissa Road 2 Lane undivided 4 Lane Divided
Haile Selassie Road CBD Blue Post 2 Lane undivided 4 Lane Divided
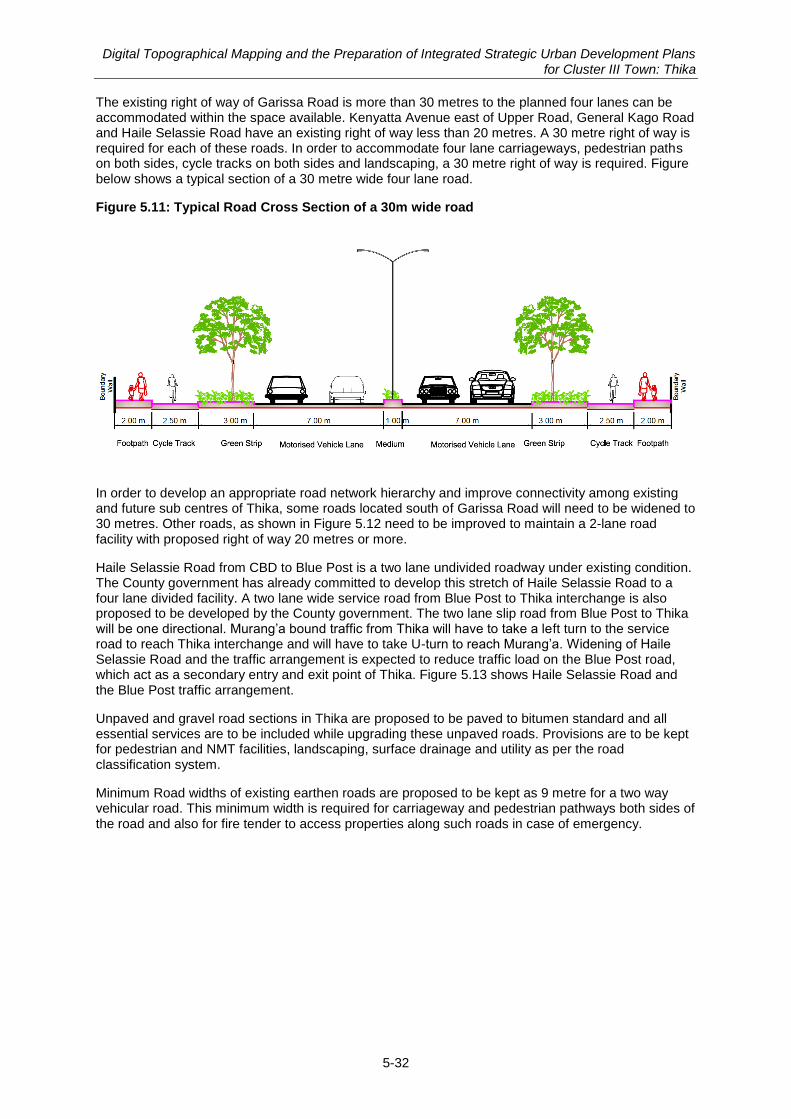
Digital Topographical Mapping and the Preparation of Integrated Strategic Urban Development Plans for Cluster III Town: Thika
5-32
The existing right of way of Garissa Road is more than 30 metres to the planned four lanes can be accommodated within the space available. Kenyatta Avenue east of Upper Road, General Kago Road and Haile Selassie Road have an existing right of way less than 20 metres. A 30 metre right of way is required for each of these roads. In order to accommodate four lane carriageways, pedestrian paths on both sides, cycle tracks on both sides and landscaping, a 30 metre right of way is required. Figure below shows a typical section of a 30 metre wide four lane road.
Figure 5.11: Typical Road Cross Section of a 30m wide road
In order to develop an appropriate road network hierarchy and improve connectivity among existing and future sub centres of Thika, some roads located south of Garissa Road will need to be widened to 30 metres. Other roads, as shown in Figure 5.12 need to be improved to maintain a 2-lane road facility with proposed right of way 20 metres or more.
Haile Selassie Road from CBD to Blue Post is a two lane undivided roadway under existing condition. The County government has already committed to develop this stretch of Haile Selassie Road to a four lane divided facility. A two lane wide service road from Blue Post to Thika interchange is also proposed to be developed by the County government. The two lane slip road from Blue Post to Thika will be one directional. Murang‟a bound traffic from Thika will have to take a left turn to the service road to reach Thika interchange and will have to take U-turn to reach Murang‟a. Widening of Haile Selassie Road and the traffic arrangement is expected to reduce traffic load on the Blue Post road, which act as a secondary entry and exit point of Thika. Figure 5.13 shows Haile Selassie Road and the Blue Post traffic arrangement.
Unpaved and gravel road sections in Thika are proposed to be paved to bitumen standard and all essential services are to be included while upgrading these unpaved roads. Provisions are to be kept for pedestrian and NMT facilities, landscaping, surface drainage and utility as per the road classification system.
Minimum Road widths of existing earthen roads are proposed to be kept as 9 metre for a two way vehicular road. This minimum width is required for carriageway and pedestrian pathways both sides of the road and also for fire tender to access properties along such roads in case of emergency.
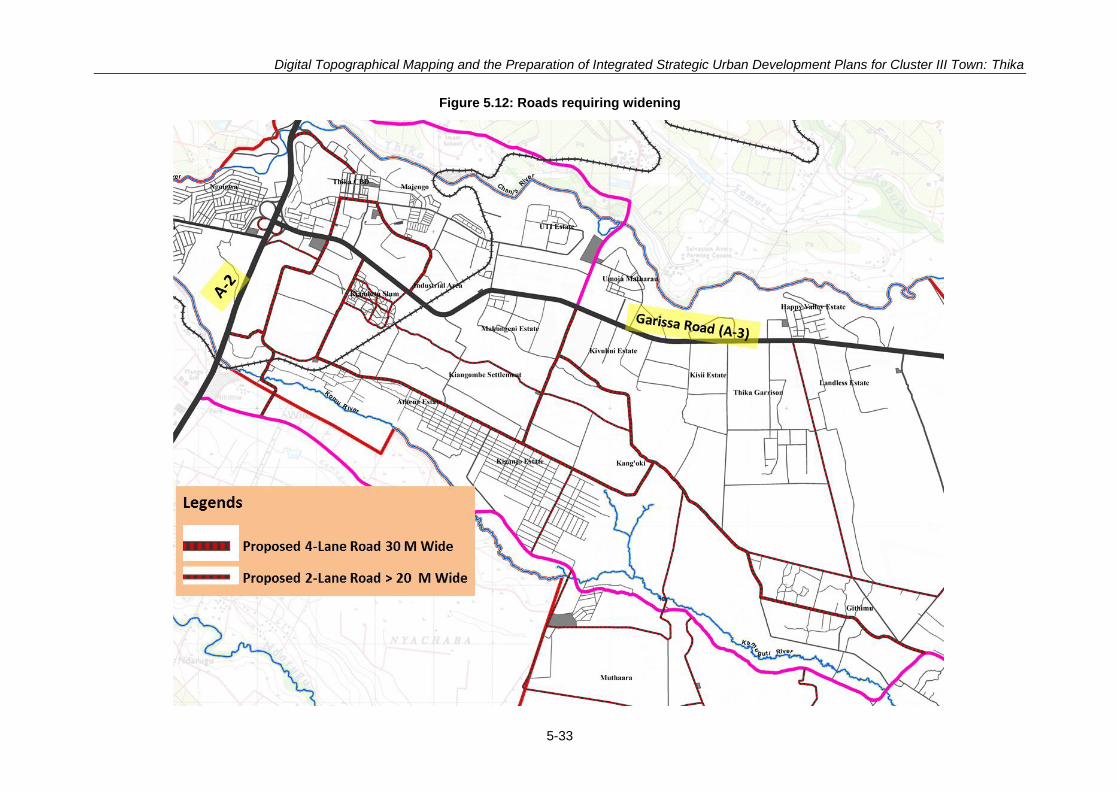
Digital Topographical Mapping and the Preparation of Integrated Strategic Urban Development Plans for Cluster III Town: Thika
5-33
Figure 5.12: Roads requiring widening
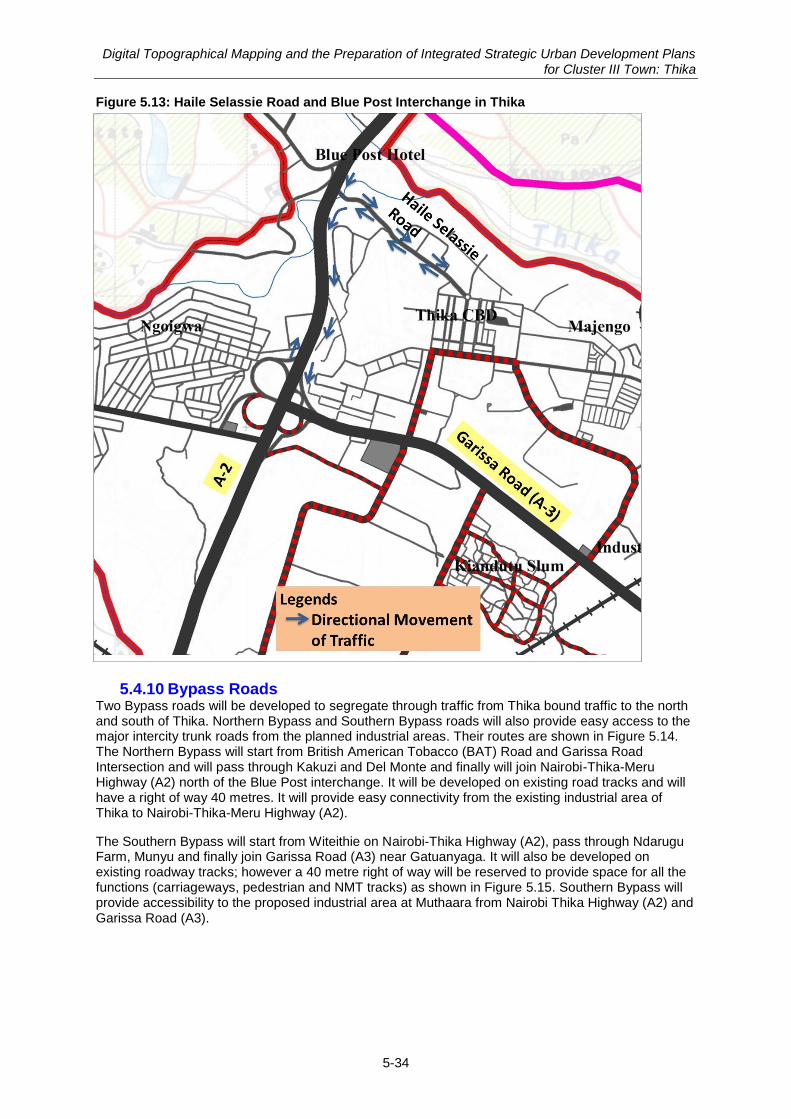
Digital Topographical Mapping and the Preparation of Integrated Strategic Urban Development Plans for Cluster III Town: Thika
5-34
Figure 5.13: Haile Selassie Road and Blue Post Interchange in Thika
5.4.10 Bypass Roads Two Bypass roads will be developed to segregate through traffic from Thika bound traffic to the north and south of Thika. Northern Bypass and Southern Bypass roads will also provide easy access to the major intercity trunk roads from the planned industrial areas. Their routes are shown in Figure 5.14. The Northern Bypass will start from British American Tobacco (BAT) Road and Garissa Road Intersection and will pass through Kakuzi and Del Monte and finally will join Nairobi-Thika-Meru Highway (A2) north of the Blue Post interchange. It will be developed on existing road tracks and will have a right of way 40 metres. It will provide easy connectivity from the existing industrial area of Thika to Nairobi-Thika-Meru Highway (A2).
The Southern Bypass will start from Witeithie on Nairobi-Thika Highway (A2), pass through Ndarugu Farm, Munyu and finally join Garissa Road (A3) near Gatuanyaga. It will also be developed on existing roadway tracks; however a 40 metre right of way will be reserved to provide space for all the functions (carriageways, pedestrian and NMT tracks) as shown in Figure 5.15. Southern Bypass will provide accessibility to the proposed industrial area at Muthaara from Nairobi Thika Highway (A2) and Garissa Road (A3).
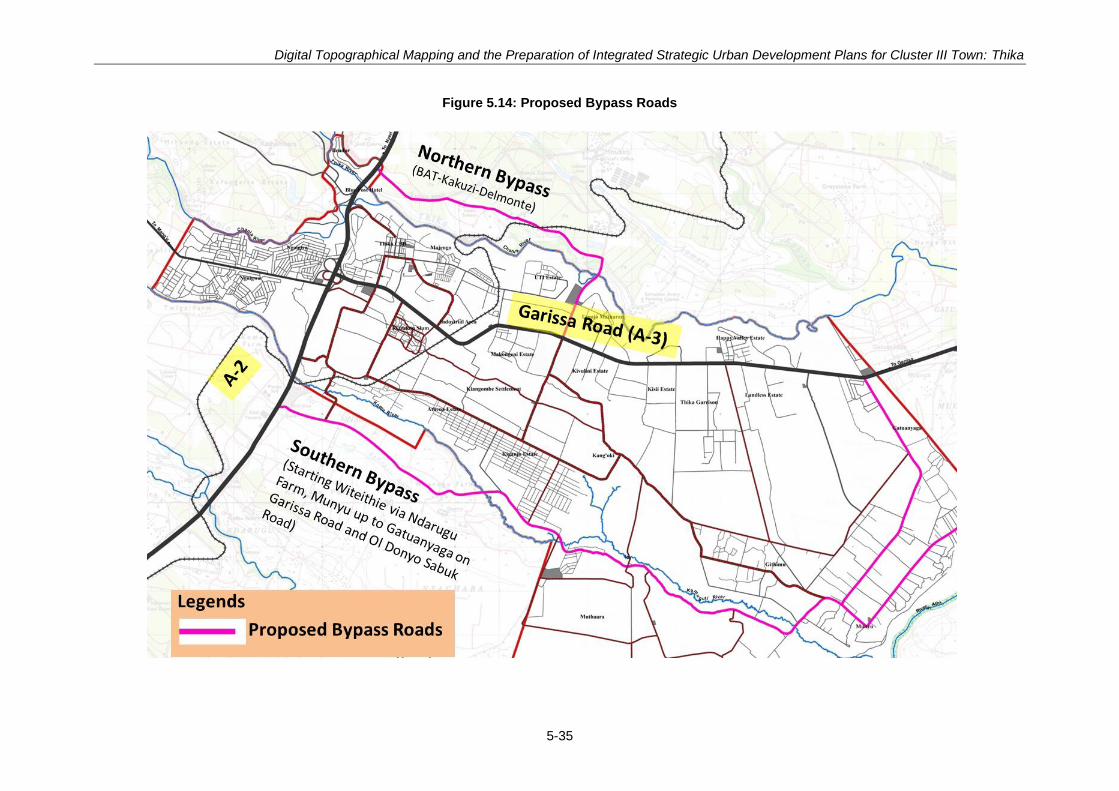
Digital Topographical Mapping and the Preparation of Integrated Strategic Urban Development Plans for Cluster III Town: Thika
5-35
Figure 5.14: Proposed Bypass Roads
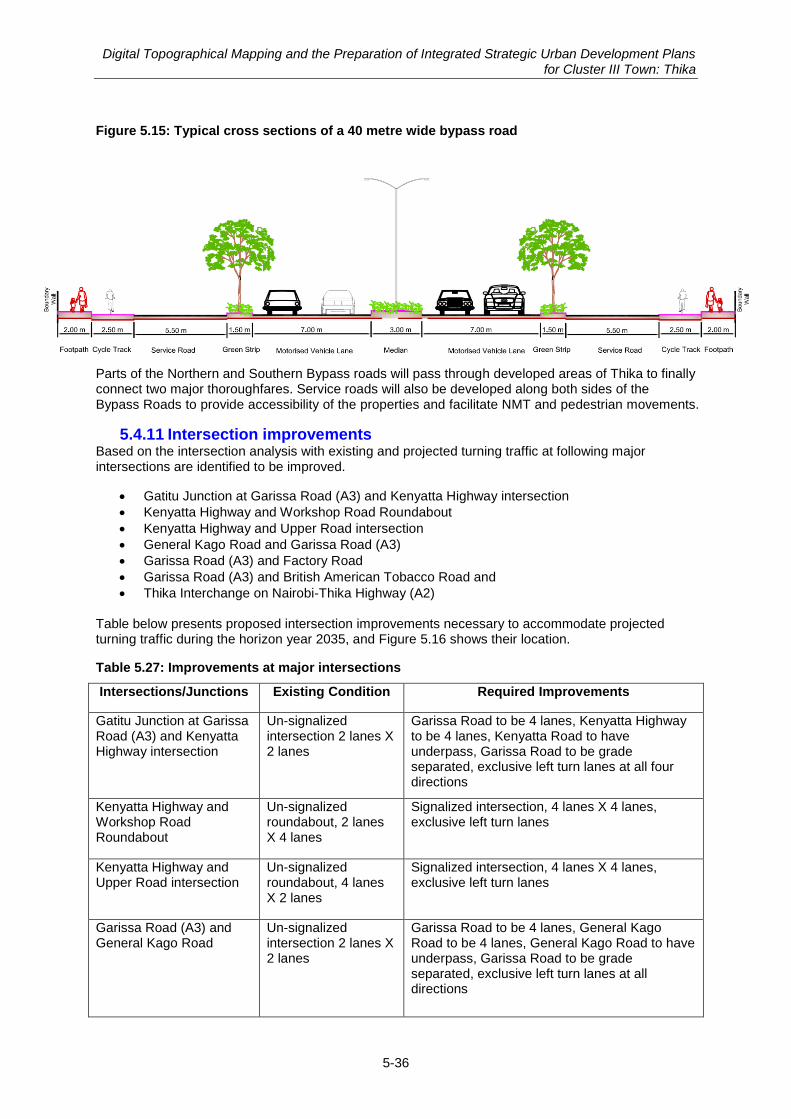
Digital Topographical Mapping and the Preparation of Integrated Strategic Urban Development Plans for Cluster III Town: Thika
5-36
Figure 5.15: Typical cross sections of a 40 metre wide bypass road
Parts of the Northern and Southern Bypass roads will pass through developed areas of Thika to finally connect two major thoroughfares. Service roads will also be developed along both sides of the Bypass Roads to provide accessibility of the properties and facilitate NMT and pedestrian movements.
5.4.11 Intersection improvements Based on the intersection analysis with existing and projected turning traffic at following major intersections are identified to be improved.
Gatitu Junction at Garissa Road (A3) and Kenyatta Highway intersection
Kenyatta Highway and Workshop Road Roundabout
Kenyatta Highway and Upper Road intersection
General Kago Road and Garissa Road (A3)
Garissa Road (A3) and Factory Road
Garissa Road (A3) and British American Tobacco Road and
Thika Interchange on Nairobi-Thika Highway (A2)
Table below presents proposed intersection improvements necessary to accommodate projected turning traffic during the horizon year 2035, and Figure 5.16 shows their location.
Table 5.27: Improvements at major intersections
Intersections/Junctions Existing Condition Required Improvements
Gatitu Junction at Garissa Road (A3) and Kenyatta Highway intersection
Un-signalized intersection 2 lanes X 2 lanes
Garissa Road to be 4 lanes, Kenyatta Highway to be 4 lanes, Kenyatta Road to have underpass, Garissa Road to be grade separated, exclusive left turn lanes at all four directions
Kenyatta Highway and Workshop Road Roundabout
Un-signalized roundabout, 2 lanes X 4 lanes
Signalized intersection, 4 lanes X 4 lanes, exclusive left turn lanes
Kenyatta Highway and Upper Road intersection
Un-signalized roundabout, 4 lanes X 2 lanes
Signalized intersection, 4 lanes X 4 lanes, exclusive left turn lanes
Garissa Road (A3) and General Kago Road
Un-signalized intersection 2 lanes X 2 lanes
Garissa Road to be 4 lanes, General Kago Road to be 4 lanes, General Kago Road to have underpass, Garissa Road to be grade separated, exclusive left turn lanes at all directions
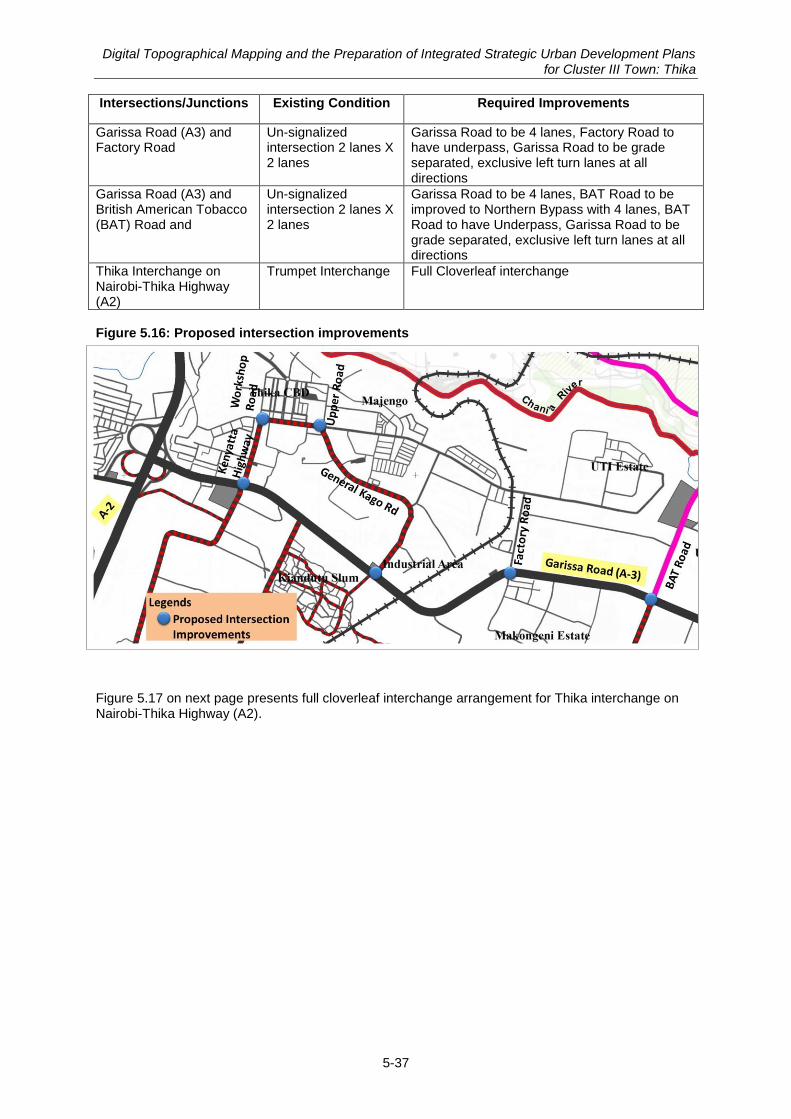
Digital Topographical Mapping and the Preparation of Integrated Strategic Urban Development Plans for Cluster III Town: Thika
5-37
Intersections/Junctions Existing Condition Required Improvements
Garissa Road (A3) and Factory Road
Un-signalized intersection 2 lanes X 2 lanes
Garissa Road to be 4 lanes, Factory Road to have underpass, Garissa Road to be grade separated, exclusive left turn lanes at all directions
Garissa Road (A3) and British American Tobacco (BAT) Road and
Un-signalized intersection 2 lanes X 2 lanes
Garissa Road to be 4 lanes, BAT Road to be improved to Northern Bypass with 4 lanes, BAT Road to have Underpass, Garissa Road to be grade separated, exclusive left turn lanes at all directions
Thika Interchange on Nairobi-Thika Highway (A2)
Trumpet Interchange Full Cloverleaf interchange
Figure 5.16: Proposed intersection improvements
Figure 5.17 on next page presents full cloverleaf interchange arrangement for Thika interchange on Nairobi-Thika Highway (A2).
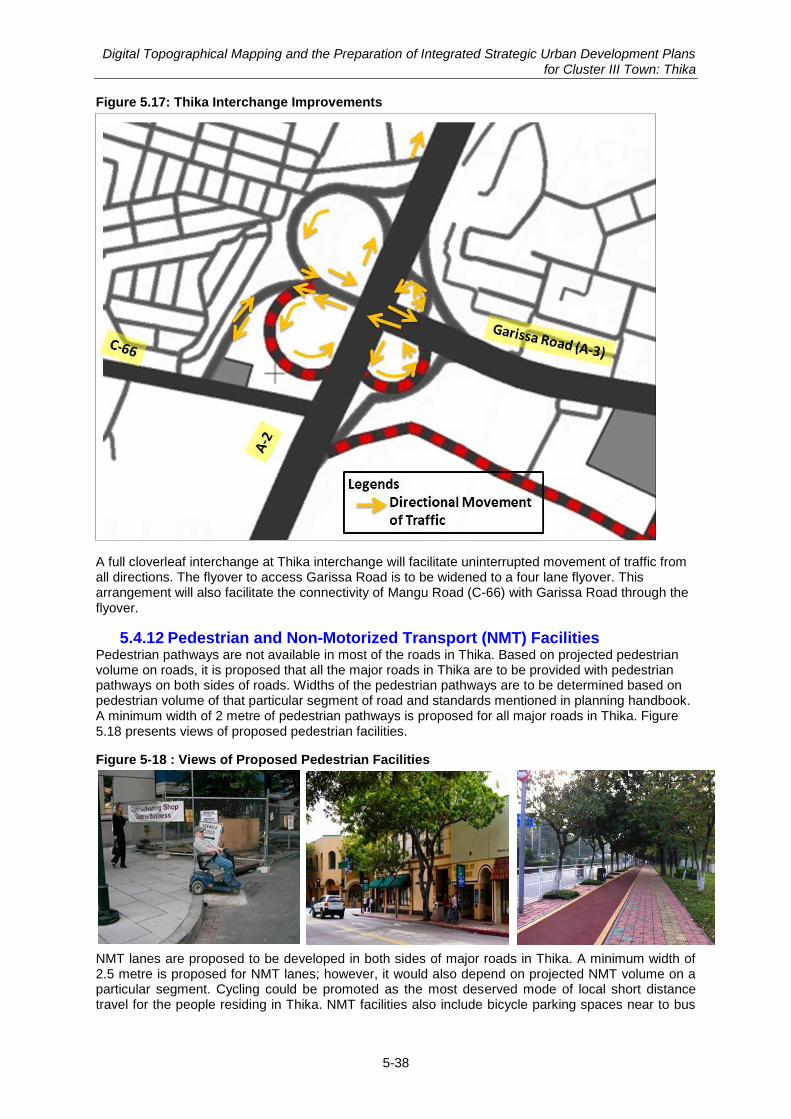
Digital Topographical Mapping and the Preparation of Integrated Strategic Urban Development Plans for Cluster III Town: Thika
5-38
Figure 5.17: Thika Interchange Improvements
A full cloverleaf interchange at Thika interchange will facilitate uninterrupted movement of traffic from all directions. The flyover to access Garissa Road is to be widened to a four lane flyover. This arrangement will also facilitate the connectivity of Mangu Road (C-66) with Garissa Road through the flyover.
5.4.12 Pedestrian and Non-Motorized Transport (NMT) Facilities Pedestrian pathways are not available in most of the roads in Thika. Based on projected pedestrian volume on roads, it is proposed that all the major roads in Thika are to be provided with pedestrian pathways on both sides of roads. Widths of the pedestrian pathways are to be determined based on pedestrian volume of that particular segment of road and standards mentioned in planning handbook. A minimum width of 2 metre of pedestrian pathways is proposed for all major roads in Thika. Figure 5.18 presents views of proposed pedestrian facilities.
Figure 5-18 : Views of Proposed Pedestrian Facilities
NMT lanes are proposed to be developed in both sides of major roads in Thika. A minimum width of 2.5 metre is proposed for NMT lanes; however, it would also depend on projected NMT volume on a particular segment. Cycling could be promoted as the most deserved mode of local short distance travel for the people residing in Thika. NMT facilities also include bicycle parking spaces near to bus
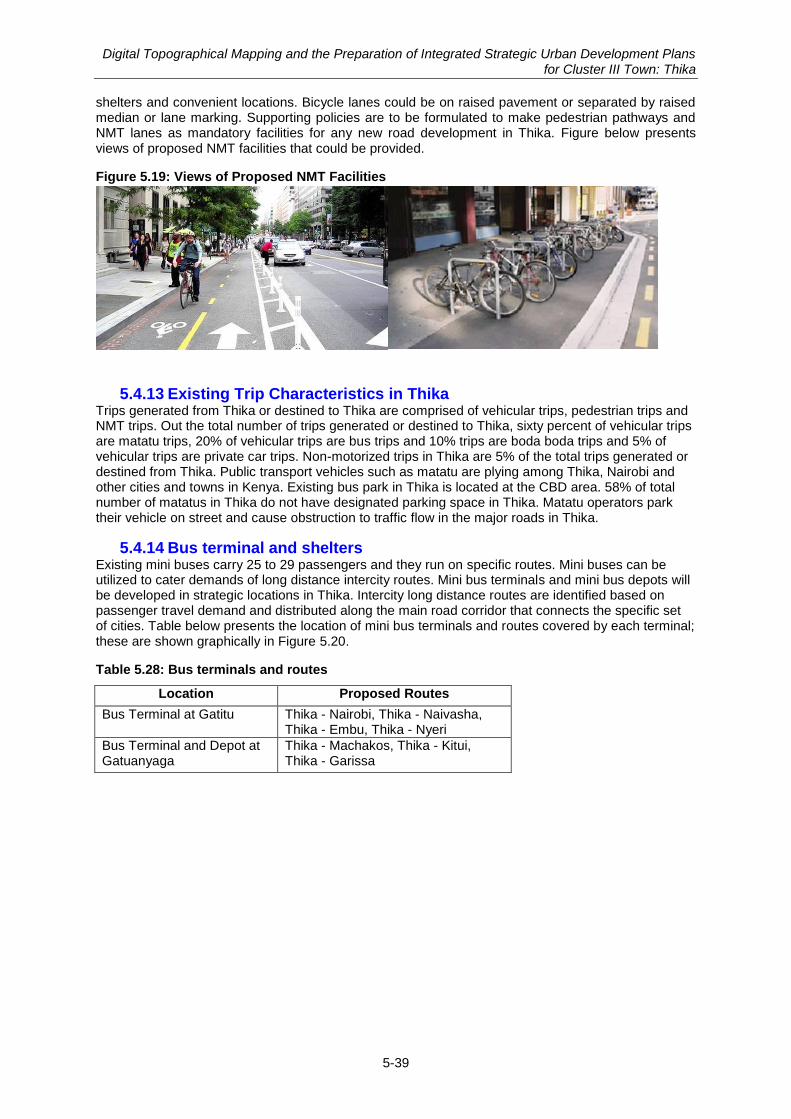
Digital Topographical Mapping and the Preparation of Integrated Strategic Urban Development Plans for Cluster III Town: Thika
5-39
shelters and convenient locations. Bicycle lanes could be on raised pavement or separated by raised median or lane marking. Supporting policies are to be formulated to make pedestrian pathways and NMT lanes as mandatory facilities for any new road development in Thika. Figure below presents views of proposed NMT facilities that could be provided.
Figure 5.19: Views of Proposed NMT Facilities
5.4.13 Existing Trip Characteristics in Thika Trips generated from Thika or destined to Thika are comprised of vehicular trips, pedestrian trips and NMT trips. Out the total number of trips generated or destined to Thika, sixty percent of vehicular trips are matatu trips, 20% of vehicular trips are bus trips and 10% trips are boda boda trips and 5% of vehicular trips are private car trips. Non-motorized trips in Thika are 5% of the total trips generated or destined from Thika. Public transport vehicles such as matatu are plying among Thika, Nairobi and other cities and towns in Kenya. Existing bus park in Thika is located at the CBD area. 58% of total number of matatus in Thika do not have designated parking space in Thika. Matatu operators park their vehicle on street and cause obstruction to traffic flow in the major roads in Thika.
5.4.14 Bus terminal and shelters Existing mini buses carry 25 to 29 passengers and they run on specific routes. Mini buses can be utilized to cater demands of long distance intercity routes. Mini bus terminals and mini bus depots will be developed in strategic locations in Thika. Intercity long distance routes are identified based on passenger travel demand and distributed along the main road corridor that connects the specific set of cities. Table below presents the location of mini bus terminals and routes covered by each terminal; these are shown graphically in Figure 5.20.
Table 5.28: Bus terminals and routes
Location Proposed Routes
Bus Terminal at Gatitu Thika - Nairobi, Thika - Naivasha, Thika - Embu, Thika - Nyeri
Bus Terminal and Depot at Gatuanyaga
Thika - Machakos, Thika - Kitui, Thika - Garissa
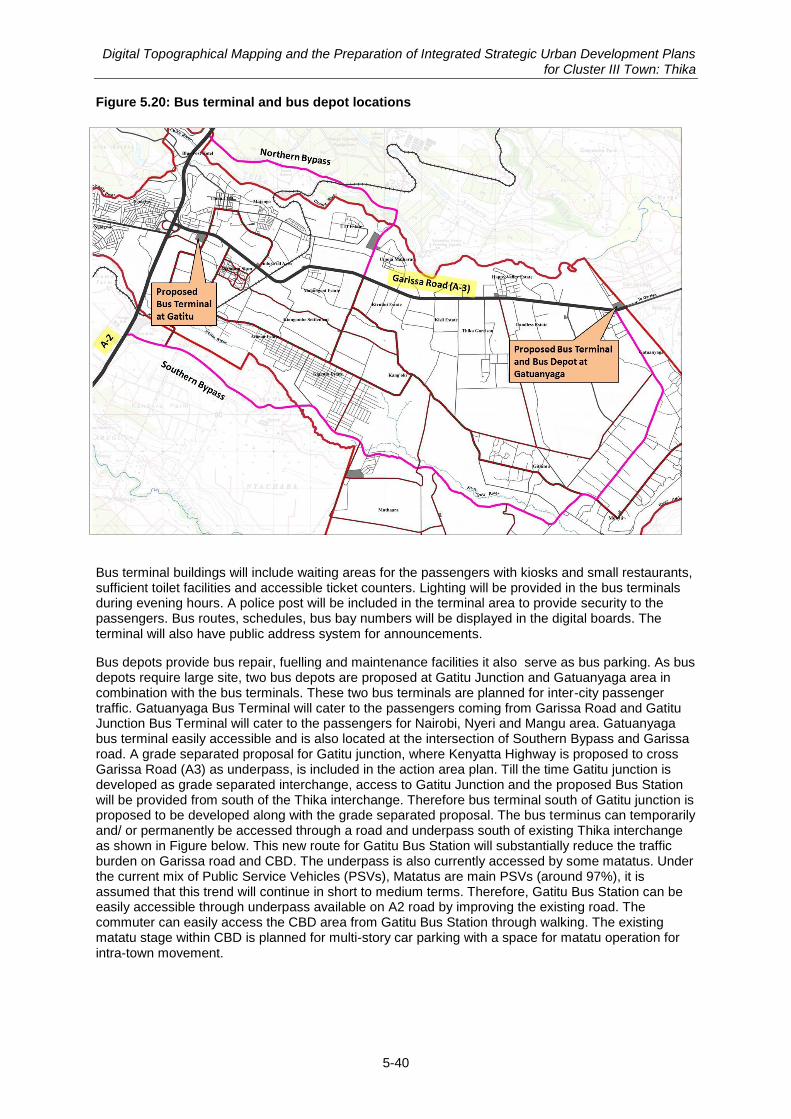
Digital Topographical Mapping and the Preparation of Integrated Strategic Urban Development Plans for Cluster III Town: Thika
5-40
Figure 5.20: Bus terminal and bus depot locations
Bus terminal buildings will include waiting areas for the passengers with kiosks and small restaurants, sufficient toilet facilities and accessible ticket counters. Lighting will be provided in the bus terminals during evening hours. A police post will be included in the terminal area to provide security to the passengers. Bus routes, schedules, bus bay numbers will be displayed in the digital boards. The terminal will also have public address system for announcements.
Bus depots provide bus repair, fuelling and maintenance facilities it also serve as bus parking. As bus depots require large site, two bus depots are proposed at Gatitu Junction and Gatuanyaga area in combination with the bus terminals. These two bus terminals are planned for inter-city passenger traffic. Gatuanyaga Bus Terminal will cater to the passengers coming from Garissa Road and Gatitu Junction Bus Terminal will cater to the passengers for Nairobi, Nyeri and Mangu area. Gatuanyaga bus terminal easily accessible and is also located at the intersection of Southern Bypass and Garissa road. A grade separated proposal for Gatitu junction, where Kenyatta Highway is proposed to cross Garissa Road (A3) as underpass, is included in the action area plan. Till the time Gatitu junction is developed as grade separated interchange, access to Gatitu Junction and the proposed Bus Station will be provided from south of the Thika interchange. Therefore bus terminal south of Gatitu junction is proposed to be developed along with the grade separated proposal. The bus terminus can temporarily and/ or permanently be accessed through a road and underpass south of existing Thika interchange as shown in Figure below. This new route for Gatitu Bus Station will substantially reduce the traffic burden on Garissa road and CBD. The underpass is also currently accessed by some matatus. Under the current mix of Public Service Vehicles (PSVs), Matatus are main PSVs (around 97%), it is assumed that this trend will continue in short to medium terms. Therefore, Gatitu Bus Station can be easily accessible through underpass available on A2 road by improving the existing road. The commuter can easily access the CBD area from Gatitu Bus Station through walking. The existing matatu stage within CBD is planned for multi-story car parking with a space for matatu operation for intra-town movement.
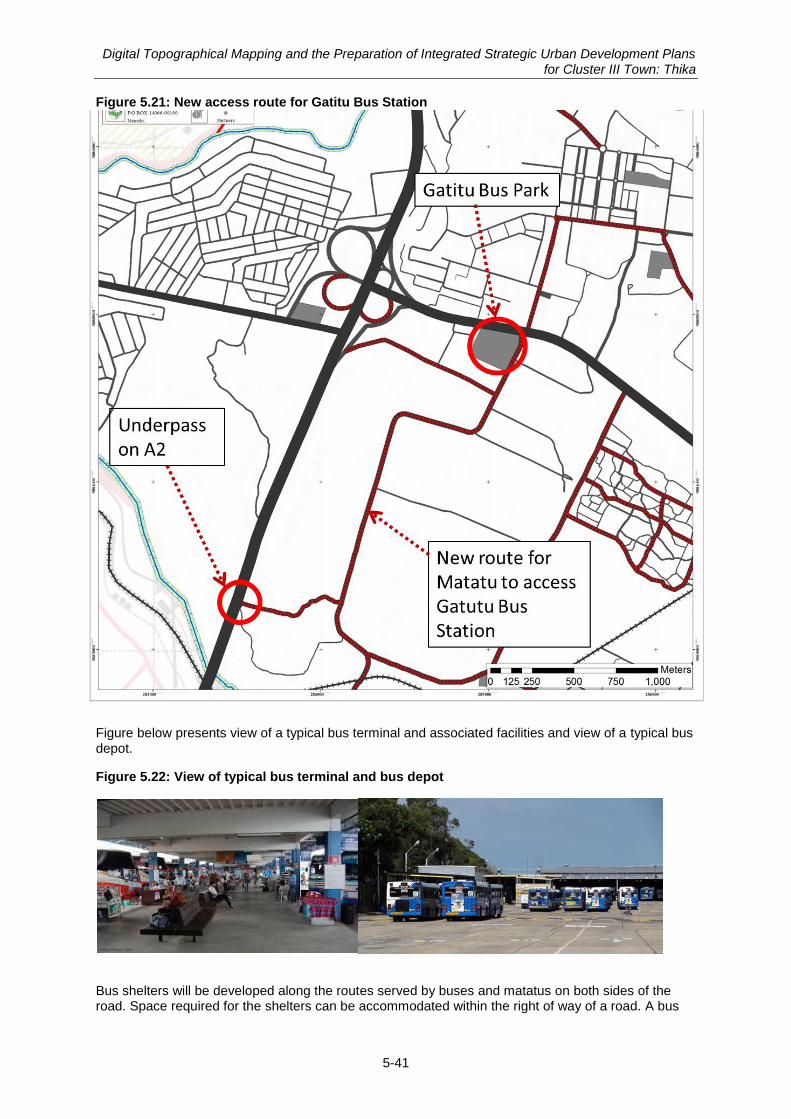
Digital Topographical Mapping and the Preparation of Integrated Strategic Urban Development Plans for Cluster III Town: Thika
5-41
Figure 5.21: New access route for Gatitu Bus Station
Figure below presents view of a typical bus terminal and associated facilities and view of a typical bus depot.
Figure 5.22: View of typical bus terminal and bus depot
Bus shelters will be developed along the routes served by buses and matatus on both sides of the road. Space required for the shelters can be accommodated within the right of way of a road. A bus
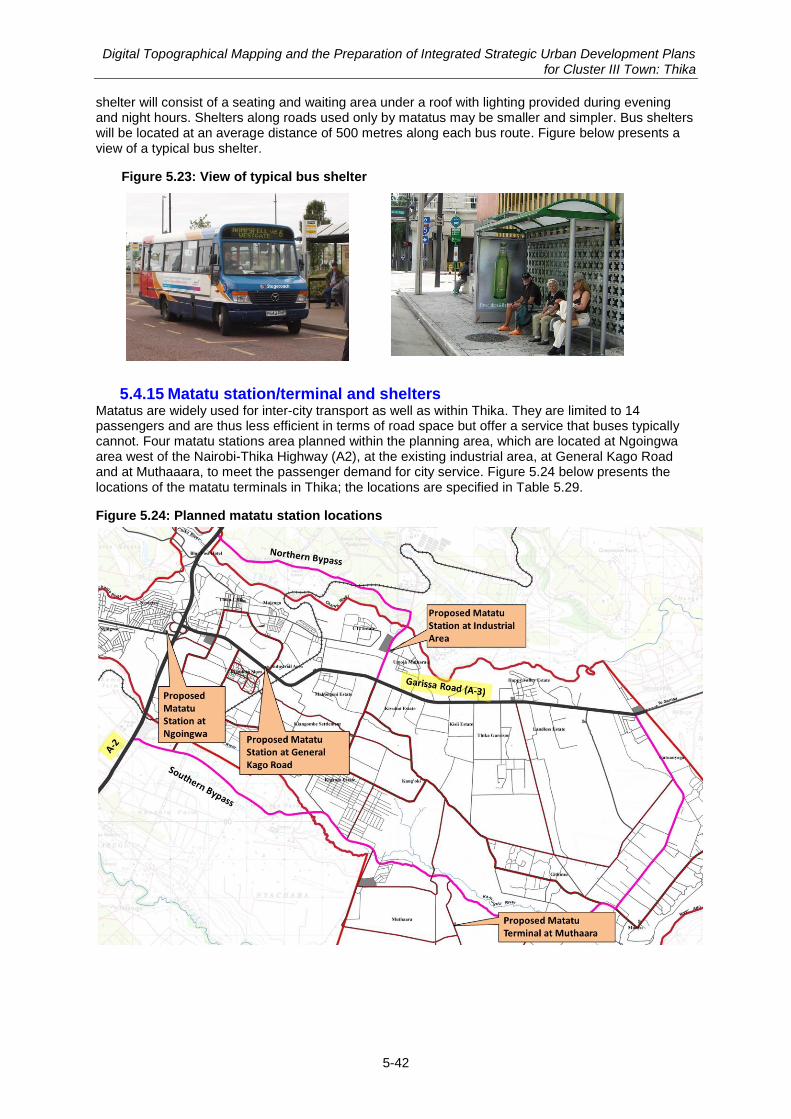
Digital Topographical Mapping and the Preparation of Integrated Strategic Urban Development Plans for Cluster III Town: Thika
5-42
shelter will consist of a seating and waiting area under a roof with lighting provided during evening and night hours. Shelters along roads used only by matatus may be smaller and simpler. Bus shelters will be located at an average distance of 500 metres along each bus route. Figure below presents a view of a typical bus shelter.
Figure 5.23: View of typical bus shelter
5.4.15 Matatu station/terminal and shelters Matatus are widely used for inter-city transport as well as within Thika. They are limited to 14 passengers and are thus less efficient in terms of road space but offer a service that buses typically cannot. Four matatu stations area planned within the planning area, which are located at Ngoingwa area west of the Nairobi-Thika Highway (A2), at the existing industrial area, at General Kago Road and at Muthaaara, to meet the passenger demand for city service. Figure 5.24 below presents the locations of the matatu terminals in Thika; the locations are specified in Table 5.29.
Figure 5.24: Planned matatu station locations
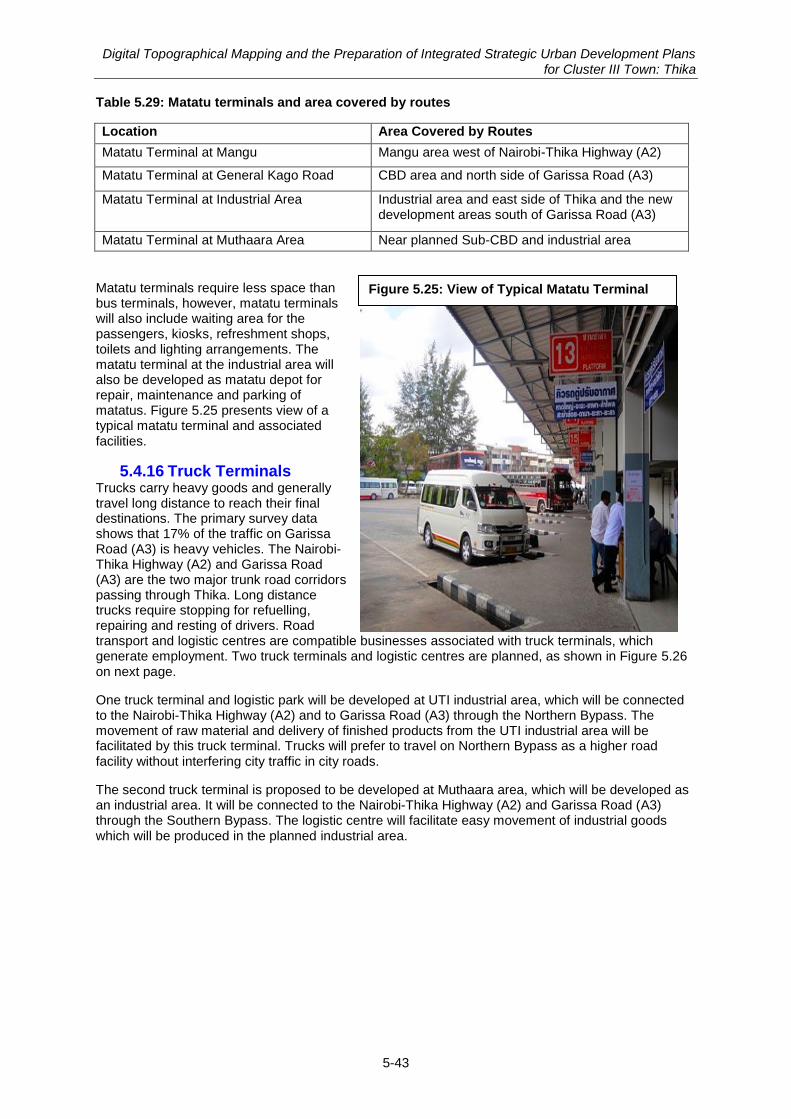
Digital Topographical Mapping and the Preparation of Integrated Strategic Urban Development Plans for Cluster III Town: Thika
5-43
Table 5.29: Matatu terminals and area covered by routes
Location Area Covered by Routes
Matatu Terminal at Mangu Mangu area west of Nairobi-Thika Highway (A2)
Matatu Terminal at General Kago Road CBD area and north side of Garissa Road (A3)
Matatu Terminal at Industrial Area Industrial area and east side of Thika and the new development areas south of Garissa Road (A3)
Matatu Terminal at Muthaara Area Near planned Sub-CBD and industrial area
Matatu terminals require less space than bus terminals, however, matatu terminals will also include waiting area for the passengers, kiosks, refreshment shops, toilets and lighting arrangements. The matatu terminal at the industrial area will also be developed as matatu depot for repair, maintenance and parking of matatus. Figure 5.25 presents view of a typical matatu terminal and associated facilities.
5.4.16 Truck Terminals Trucks carry heavy goods and generally travel long distance to reach their final destinations. The primary survey data shows that 17% of the traffic on Garissa Road (A3) is heavy vehicles. The Nairobi-Thika Highway (A2) and Garissa Road (A3) are the two major trunk road corridors passing through Thika. Long distance trucks require stopping for refuelling, repairing and resting of drivers. Road transport and logistic centres are compatible businesses associated with truck terminals, which generate employment. Two truck terminals and logistic centres are planned, as shown in Figure 5.26 on next page.
One truck terminal and logistic park will be developed at UTI industrial area, which will be connected to the Nairobi-Thika Highway (A2) and to Garissa Road (A3) through the Northern Bypass. The movement of raw material and delivery of finished products from the UTI industrial area will be facilitated by this truck terminal. Trucks will prefer to travel on Northern Bypass as a higher road facility without interfering city traffic in city roads.
The second truck terminal is proposed to be developed at Muthaara area, which will be developed as an industrial area. It will be connected to the Nairobi-Thika Highway (A2) and Garissa Road (A3) through the Southern Bypass. The logistic centre will facilitate easy movement of industrial goods which will be produced in the planned industrial area.
Figure 5.25: View of Typical Matatu Terminal
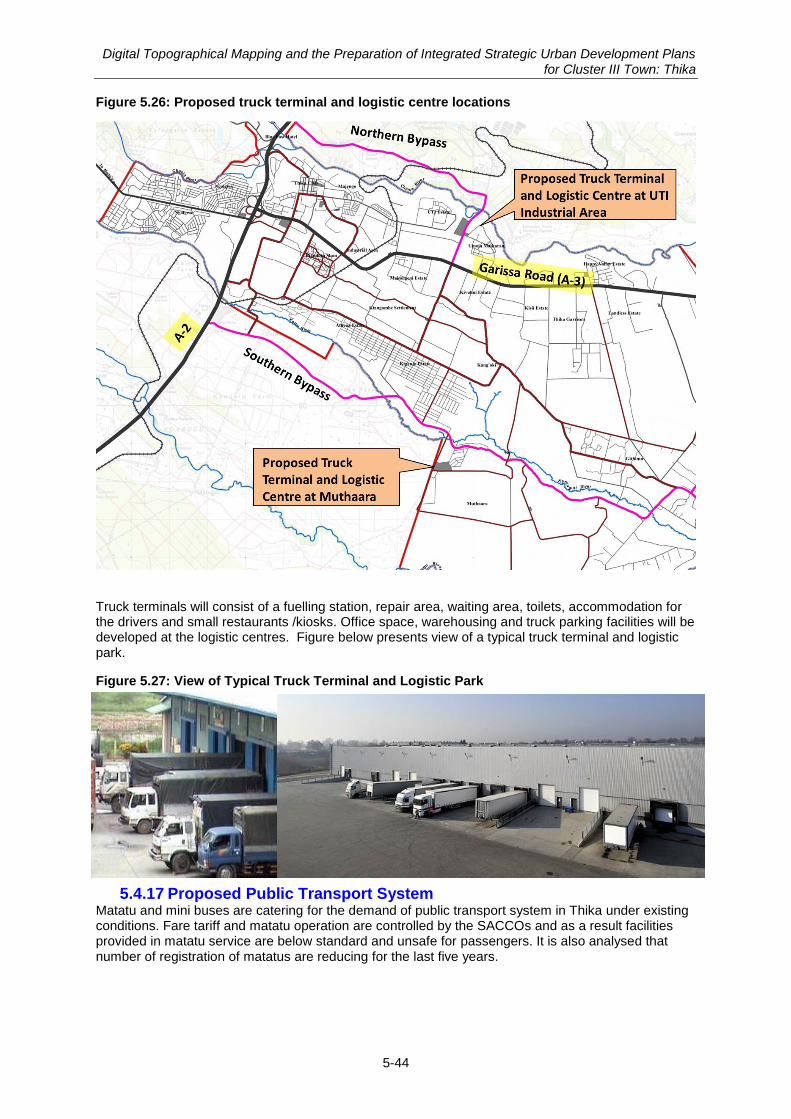
Digital Topographical Mapping and the Preparation of Integrated Strategic Urban Development Plans for Cluster III Town: Thika
5-44
Figure 5.26: Proposed truck terminal and logistic centre locations
Truck terminals will consist of a fuelling station, repair area, waiting area, toilets, accommodation for the drivers and small restaurants /kiosks. Office space, warehousing and truck parking facilities will be developed at the logistic centres. Figure below presents view of a typical truck terminal and logistic park.
Figure 5.27: View of Typical Truck Terminal and Logistic Park
5.4.17 Proposed Public Transport System Matatu and mini buses are catering for the demand of public transport system in Thika under existing conditions. Fare tariff and matatu operation are controlled by the SACCOs and as a result facilities provided in matatu service are below standard and unsafe for passengers. It is also analysed that number of registration of matatus are reducing for the last five years.
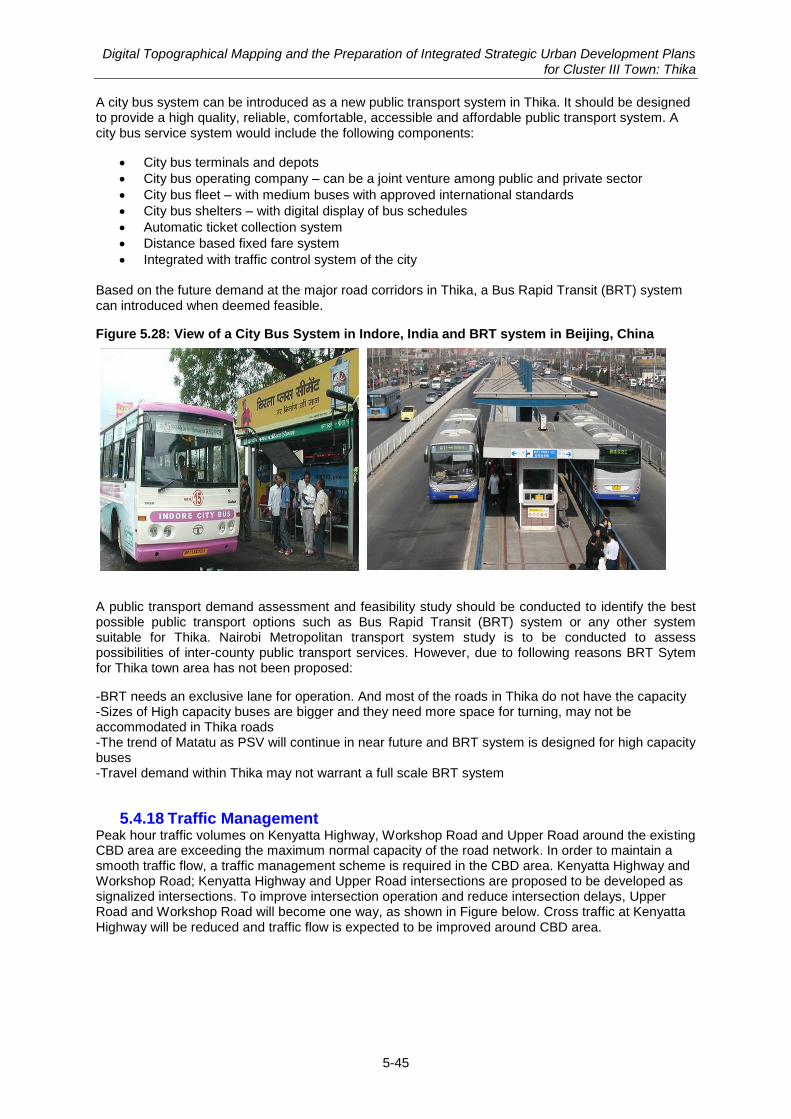
Digital Topographical Mapping and the Preparation of Integrated Strategic Urban Development Plans for Cluster III Town: Thika
5-45
A city bus system can be introduced as a new public transport system in Thika. It should be designed to provide a high quality, reliable, comfortable, accessible and affordable public transport system. A city bus service system would include the following components:
City bus terminals and depots
City bus operating company – can be a joint venture among public and private sector
City bus fleet – with medium buses with approved international standards
City bus shelters – with digital display of bus schedules
Automatic ticket collection system
Distance based fixed fare system
Integrated with traffic control system of the city
Based on the future demand at the major road corridors in Thika, a Bus Rapid Transit (BRT) system can introduced when deemed feasible.
Figure 5.28: View of a City Bus System in Indore, India and BRT system in Beijing, China
A public transport demand assessment and feasibility study should be conducted to identify the best possible public transport options such as Bus Rapid Transit (BRT) system or any other system suitable for Thika. Nairobi Metropolitan transport system study is to be conducted to assess possibilities of inter-county public transport services. However, due to following reasons BRT Sytem for Thika town area has not been proposed:
-BRT needs an exclusive lane for operation. And most of the roads in Thika do not have the capacity -Sizes of High capacity buses are bigger and they need more space for turning, may not be accommodated in Thika roads -The trend of Matatu as PSV will continue in near future and BRT system is designed for high capacity buses -Travel demand within Thika may not warrant a full scale BRT system
5.4.18 Traffic Management Peak hour traffic volumes on Kenyatta Highway, Workshop Road and Upper Road around the existing CBD area are exceeding the maximum normal capacity of the road network. In order to maintain a smooth traffic flow, a traffic management scheme is required in the CBD area. Kenyatta Highway and Workshop Road; Kenyatta Highway and Upper Road intersections are proposed to be developed as signalized intersections. To improve intersection operation and reduce intersection delays, Upper Road and Workshop Road will become one way, as shown in Figure below. Cross traffic at Kenyatta Highway will be reduced and traffic flow is expected to be improved around CBD area.

Digital Topographical Mapping and the Preparation of Integrated Strategic Urban Development Plans for Cluster III Town: Thika
5-46
Figure 5.29: Traffic Management Schemes for Roads around CBD
Kenyatta Highway will operate with two-way traffic, which will facilitate accesses to the business along Kenyatta Highway.
Feasibility study is proposed to be conducted to assess signalization plan, Intelligent Transport System (ITS) plan, central control system and passenger information system plan for traffic management of Thika planning area.
5.4.19 Parking Based on projected parking demand, a multi-storey car park will be developed at the existing matatu stage area located northeast corner of the CBD. This will accommodate commercial establishments and two wheeler/boda boda parking at ground floor level. Entry to the car park building will be from Upper Road located east side of the CBD and exit will be designed towards north, which will comply with the proposed traffic management scheme.
Figure 5.30 presents the location of the multi-storey car park and traffic flow directions in CBD in more detail.
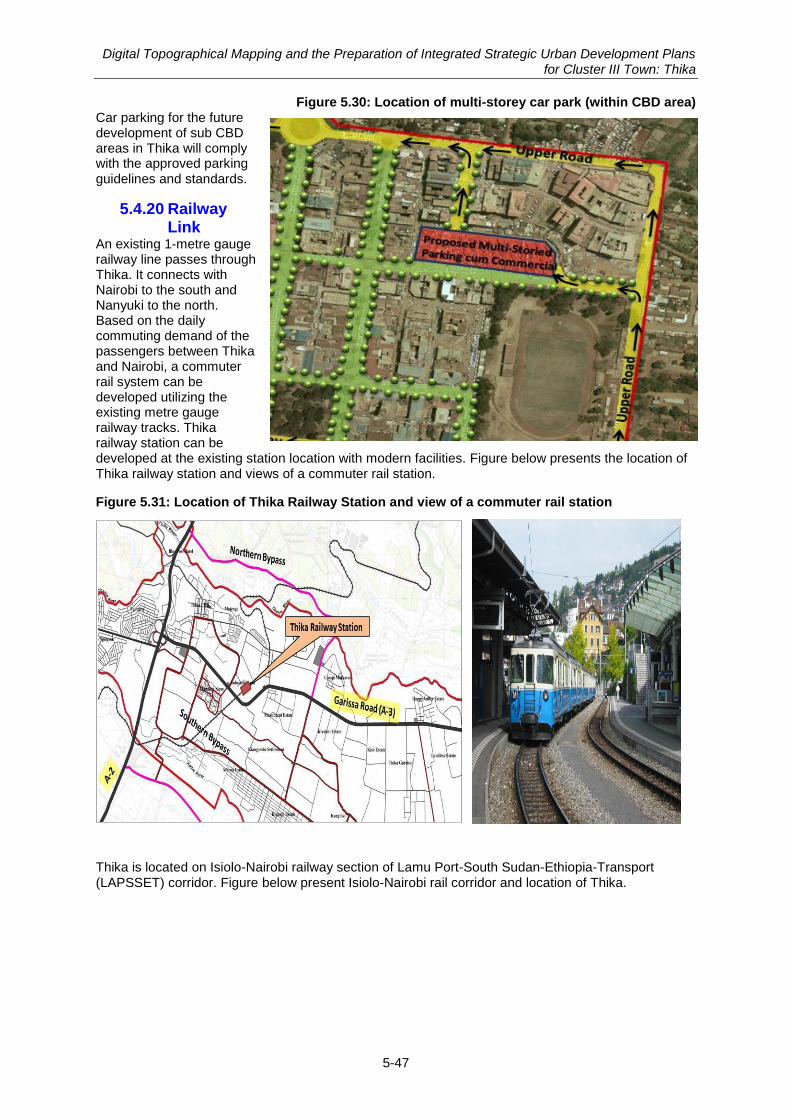
Digital Topographical Mapping and the Preparation of Integrated Strategic Urban Development Plans for Cluster III Town: Thika
5-47
Figure 5.30: Location of multi-storey car park (within CBD area) Car parking for the future development of sub CBD areas in Thika will comply with the approved parking guidelines and standards.
5.4.20 Railway Link
An existing 1-metre gauge railway line passes through Thika. It connects with Nairobi to the south and Nanyuki to the north. Based on the daily commuting demand of the passengers between Thika and Nairobi, a commuter rail system can be developed utilizing the existing metre gauge railway tracks. Thika railway station can be developed at the existing station location with modern facilities. Figure below presents the location of Thika railway station and views of a commuter rail station.
Figure 5.31: Location of Thika Railway Station and view of a commuter rail station
Thika is located on Isiolo-Nairobi railway section of Lamu Port-South Sudan-Ethiopia-Transport (LAPSSET) corridor. Figure below present Isiolo-Nairobi rail corridor and location of Thika.
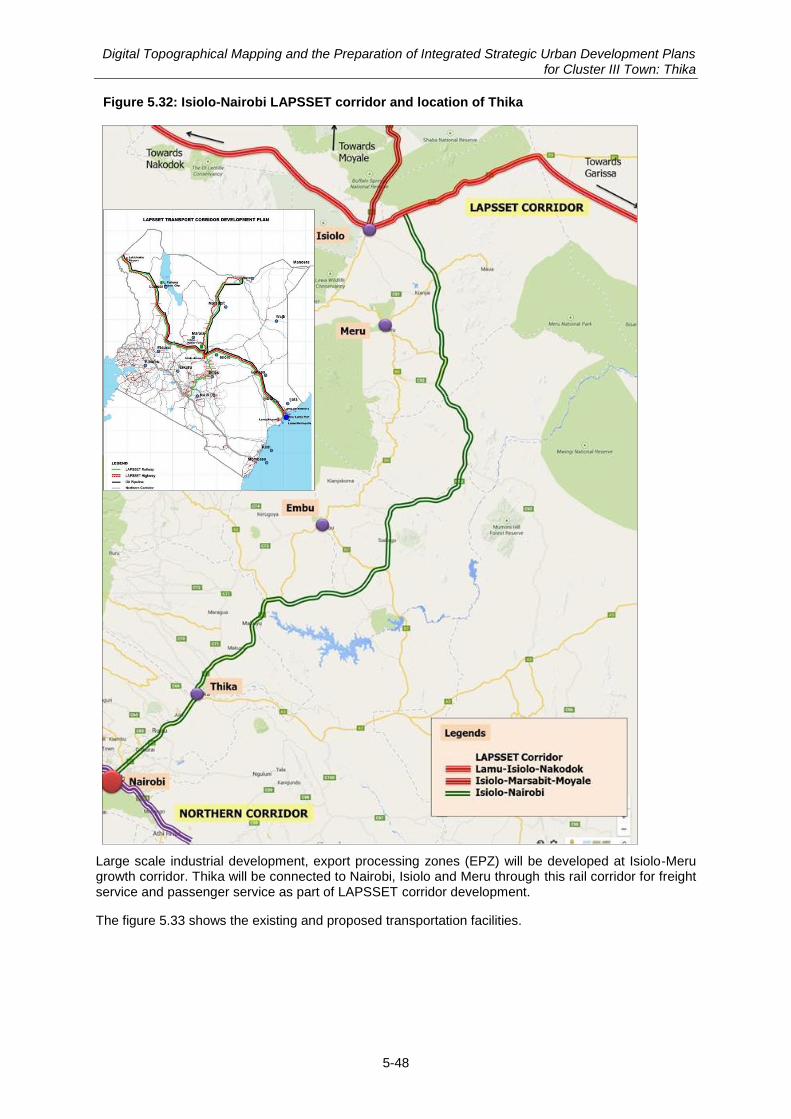
Digital Topographical Mapping and the Preparation of Integrated Strategic Urban Development Plans for Cluster III Town: Thika
5-48
Figure 5.32: Isiolo-Nairobi LAPSSET corridor and location of Thika
Large scale industrial development, export processing zones (EPZ) will be developed at Isiolo-Meru growth corridor. Thika will be connected to Nairobi, Isiolo and Meru through this rail corridor for freight service and passenger service as part of LAPSSET corridor development.
The figure 5.33 shows the existing and proposed transportation facilities.
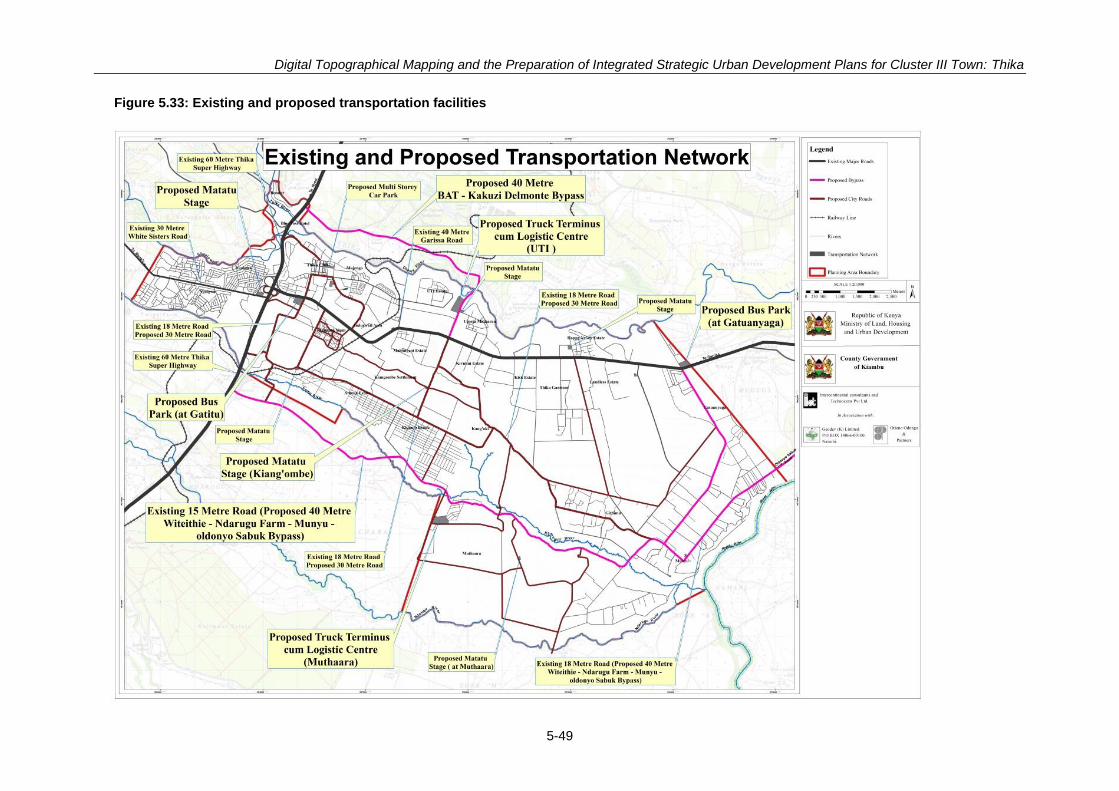
Digital Topographical Mapping and the Preparation of Integrated Strategic Urban Development Plans for Cluster III Town: Thika
5-49
Figure 5.33: Existing and proposed transportation facilities
Digital Topographical Mapping and the Preparation of Integrated Strategic Urban Development Plans for Cluster III Town: Thika
5-50
5.5 Social infrastructure
5.5.1 Education Education facilities within the planning area include pre-primary/ ECD schools, primary, secondary and tertiary educational facilities both private and public. Educational land use covers approximately 2.43% of the planning area. Special schools within the area include the Thika Primary School for the Blind, Thika Secondary School for the Blind, Joy Town Primary School for the Physically Challenged Joy Town Secondary School and St Patrick‟s Special School for the Mentally Challenged. As shown in the table below, there are 81 primary schools, 32 secondary schools and 5 special schools in Thika town. The locations of primary and secondary schools are shown in Figure 5.34. In terms of spatial distribution of primary and secondary schools, most of these schools are concentrated within the core town area where population density is high but some are located in peripheral areas.
Table 5.30: School in Thika Area (Public and Private)
Type Number
Primary School 81
Secondary School 32
Special School 5
Source: https://www.opendata.go.ke
Tertiary Education Facilities in Thika Town Planning Area: In Thika town there are the following tertiary education facilities:
Mount Kenya University
Umma University
Gretsa University
Jordan College
Uzuri College
Kilimambogo TTC
Chania institute
Amboseli Institute/College
Thika school of medical health sciences
Kenya school of medical health sciences
Thika Institute of Business Studies
Hemland college
Excel institute
Munyu institute of technology
International center of technology
Thika technical training institute
Thika Institute of Computer and Engineering
Success Professional Institute Thika
Matric school of nursing
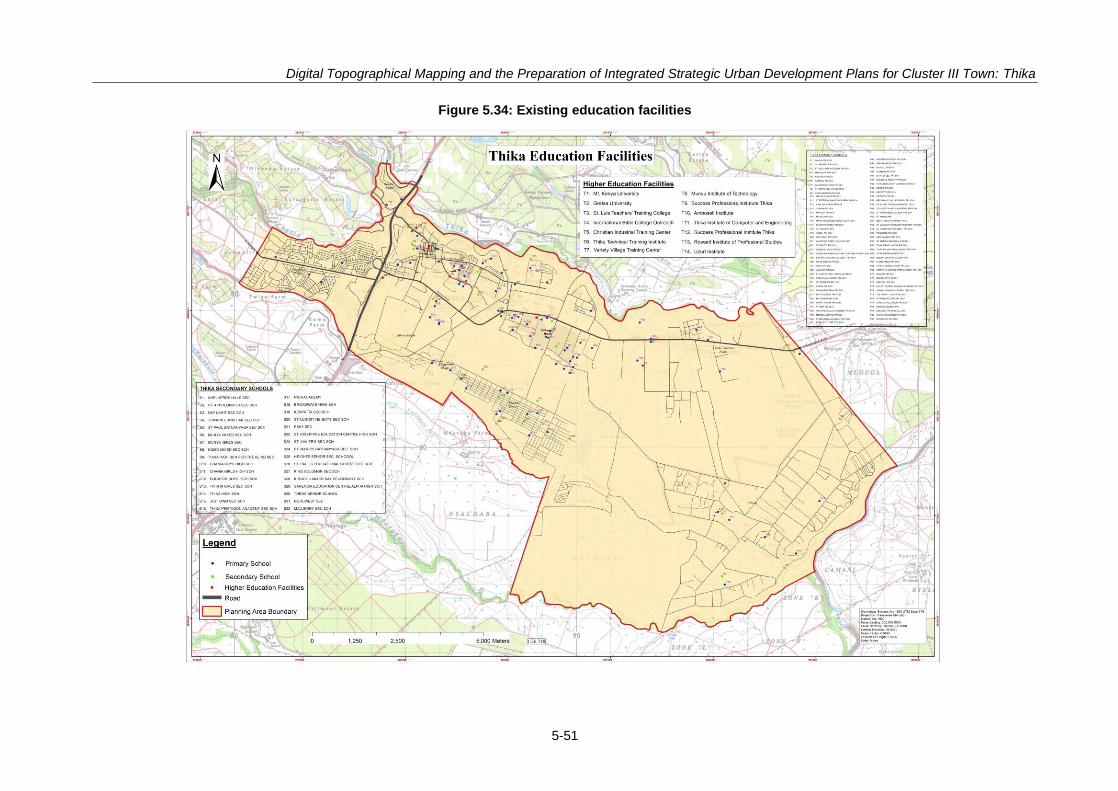
Digital Topographical Mapping and the Preparation of Integrated Strategic Urban Development Plans for Cluster III Town: Thika
5-51
Figure 5.34: Existing education facilities
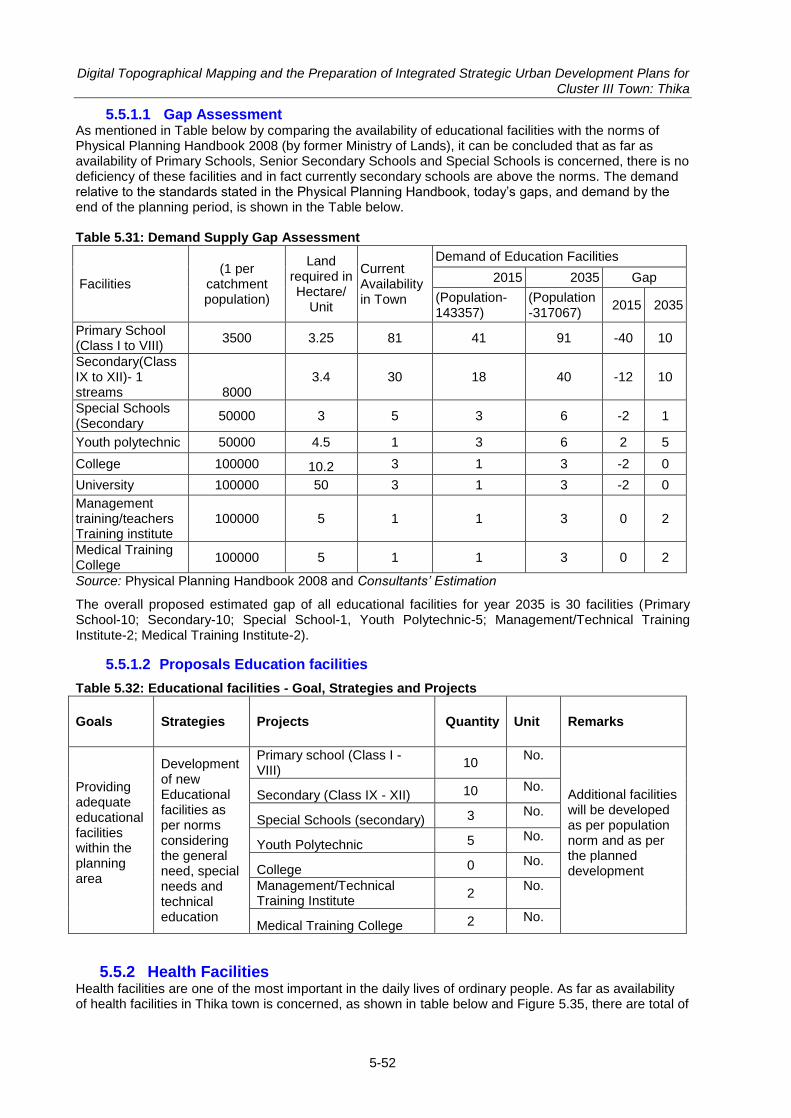
Digital Topographical Mapping and the Preparation of Integrated Strategic Urban Development Plans for Cluster III Town: Thika
5-52
5.5.1.1 Gap Assessment As mentioned in Table below by comparing the availability of educational facilities with the norms of Physical Planning Handbook 2008 (by former Ministry of Lands), it can be concluded that as far as availability of Primary Schools, Senior Secondary Schools and Special Schools is concerned, there is no deficiency of these facilities and in fact currently secondary schools are above the norms. The demand relative to the standards stated in the Physical Planning Handbook, today‟s gaps, and demand by the end of the planning period, is shown in the Table below. Table 5.31: Demand Supply Gap Assessment
Facilities (1 per
catchment population)
Land required in Hectare/
Unit
Current Availability in Town
Demand of Education Facilities
2015 2035 Gap
(Population-143357)
(Population-317067)
2015 2035
Primary School (Class I to VIII)
3500 3.25 81 41 91 -40 10
Secondary(Class IX to XII)- 1 streams 8000
3.4 30 18 40 -12 10
Special Schools (Secondary
50000 3 5 3 6 -2 1
Youth polytechnic 50000 4.5 1 3 6 2 5
College 100000 10.2 3 1 3 -2 0
University 100000 50 3 1 3 -2 0
Management training/teachers Training institute
100000 5 1 1 3 0 2
Medical Training College
100000 5 1 1 3 0 2
Source: Physical Planning Handbook 2008 and Consultants’ Estimation
The overall proposed estimated gap of all educational facilities for year 2035 is 30 facilities (Primary School-10; Secondary-10; Special School-1, Youth Polytechnic-5; Management/Technical Training Institute-2; Medical Training Institute-2).
5.5.1.2 Proposals Education facilities
Table 5.32: Educational facilities - Goal, Strategies and Projects
Goals Strategies Projects Quantity Unit Remarks
Providing adequate educational facilities within the planning area
Development of new Educational facilities as per norms considering the general need, special needs and technical education
Primary school (Class I - VIII)
10 No.
Additional facilities will be developed as per population norm and as per the planned development
Secondary (Class IX - XII) 10 No.
Special Schools (secondary) 3 No.
Youth Polytechnic 5 No.
College 0 No.
Management/Technical Training Institute
2 No.
Medical Training College 2 No.
5.5.2 Health Facilities Health facilities are one of the most important in the daily lives of ordinary people. As far as availability of health facilities in Thika town is concerned, as shown in table below and Figure 5.35, there are total of
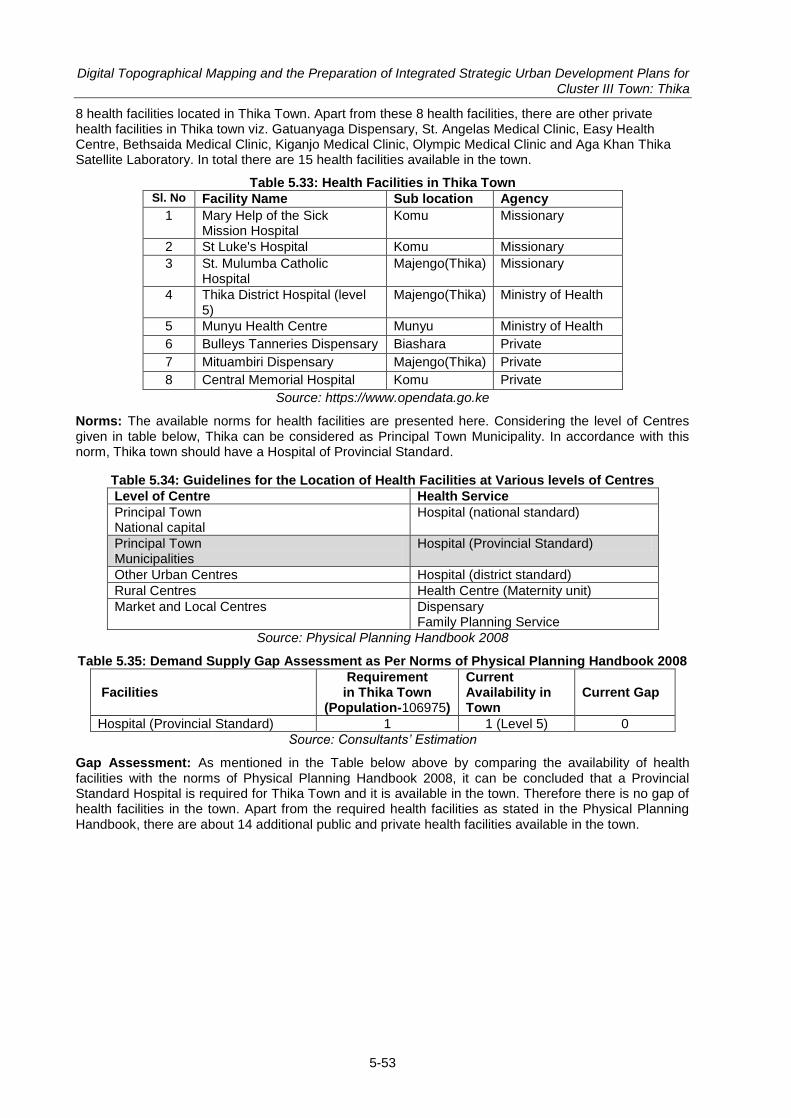
Digital Topographical Mapping and the Preparation of Integrated Strategic Urban Development Plans for Cluster III Town: Thika
5-53
8 health facilities located in Thika Town. Apart from these 8 health facilities, there are other private health facilities in Thika town viz. Gatuanyaga Dispensary, St. Angelas Medical Clinic, Easy Health Centre, Bethsaida Medical Clinic, Kiganjo Medical Clinic, Olympic Medical Clinic and Aga Khan Thika Satellite Laboratory. In total there are 15 health facilities available in the town.
Table 5.33: Health Facilities in Thika Town Sl. No Facility Name Sub location Agency
1 Mary Help of the Sick Mission Hospital
Komu Missionary
2 St Luke's Hospital Komu Missionary
3 St. Mulumba Catholic Hospital
Majengo(Thika) Missionary
4 Thika District Hospital (level 5)
Majengo(Thika) Ministry of Health
5 Munyu Health Centre Munyu Ministry of Health
6 Bulleys Tanneries Dispensary Biashara Private
7 Mituambiri Dispensary Majengo(Thika) Private
8 Central Memorial Hospital Komu Private
Source: https://www.opendata.go.ke
Norms: The available norms for health facilities are presented here. Considering the level of Centres given in table below, Thika can be considered as Principal Town Municipality. In accordance with this norm, Thika town should have a Hospital of Provincial Standard.
Table 5.34: Guidelines for the Location of Health Facilities at Various levels of Centres
Level of Centre Health Service
Principal Town National capital
Hospital (national standard)
Principal Town Municipalities
Hospital (Provincial Standard)
Other Urban Centres Hospital (district standard)
Rural Centres Health Centre (Maternity unit)
Market and Local Centres Dispensary Family Planning Service
Source: Physical Planning Handbook 2008
Table 5.35: Demand Supply Gap Assessment as Per Norms of Physical Planning Handbook 2008
Facilities Requirement
in Thika Town (Population-106975)
Current Availability in Town
Current Gap
Hospital (Provincial Standard) 1 1 (Level 5) 0
Source: Consultants’ Estimation
Gap Assessment: As mentioned in the Table below above by comparing the availability of health facilities with the norms of Physical Planning Handbook 2008, it can be concluded that a Provincial Standard Hospital is required for Thika Town and it is available in the town. Therefore there is no gap of health facilities in the town. Apart from the required health facilities as stated in the Physical Planning Handbook, there are about 14 additional public and private health facilities available in the town.
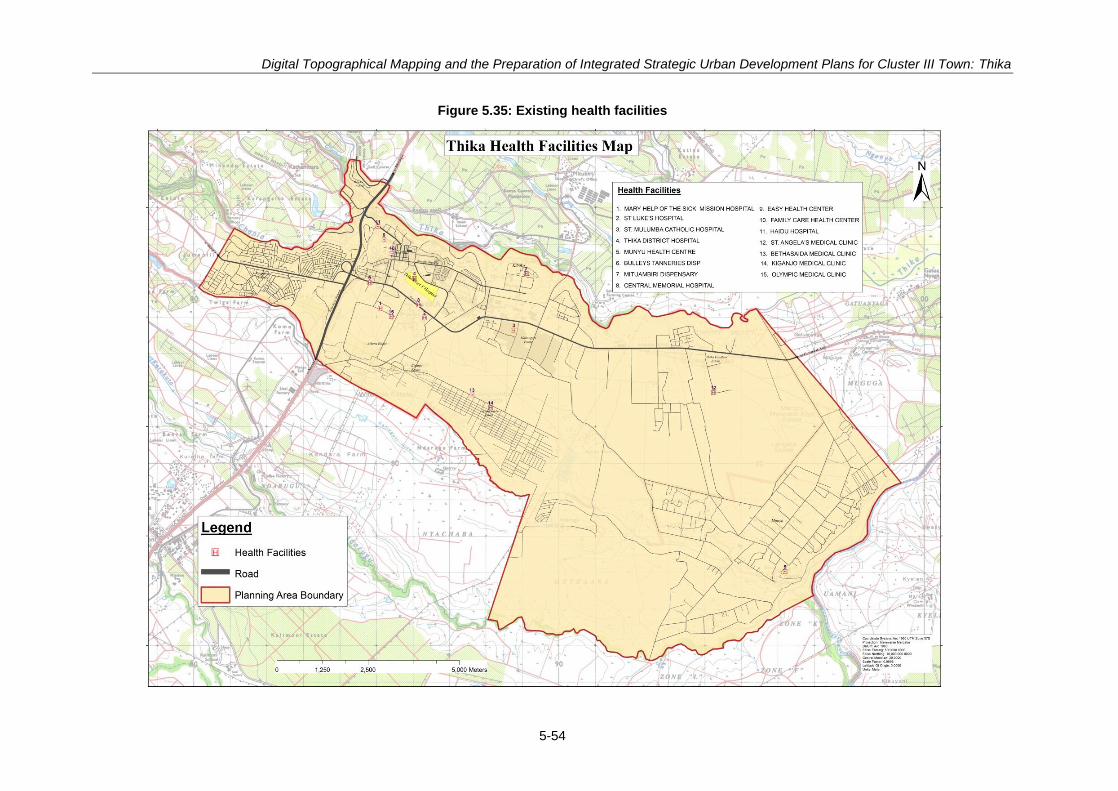
Digital Topographical Mapping and the Preparation of Integrated Strategic Urban Development Plans for Cluster III Town: Thika
5-54
Figure 5.35: Existing health facilities
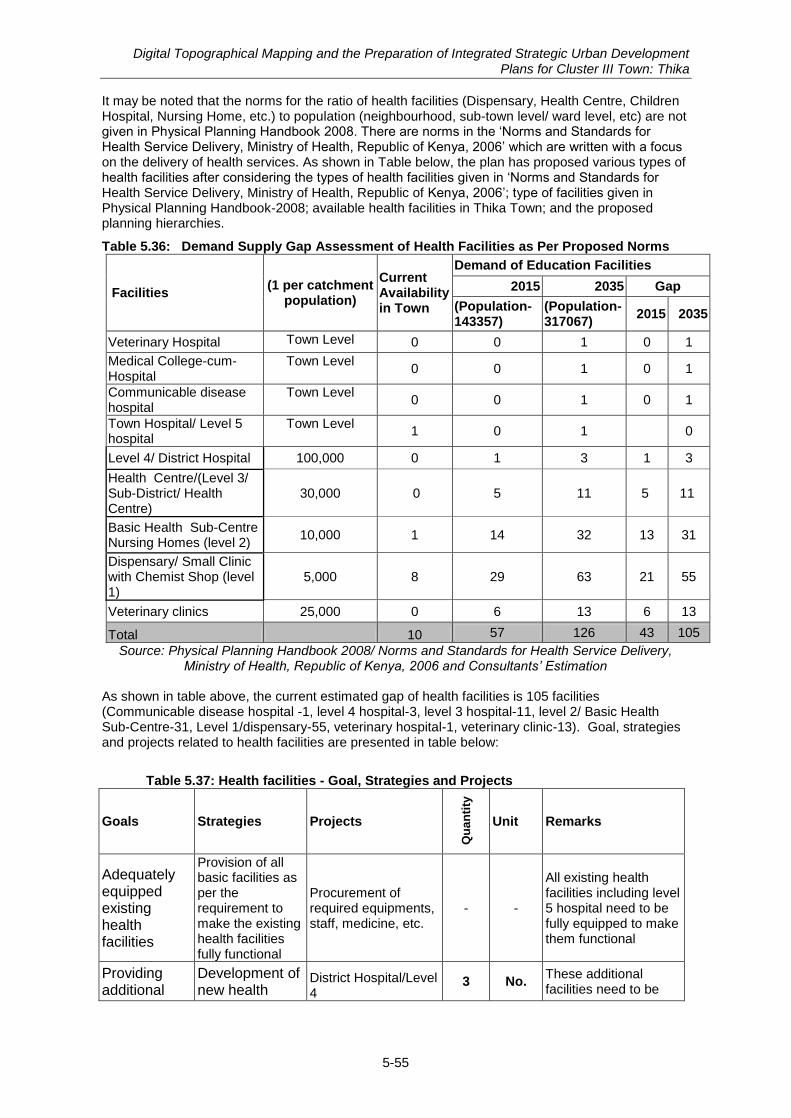
Digital Topographical Mapping and the Preparation of Integrated Strategic Urban Development Plans for Cluster III Town: Thika
5-55
It may be noted that the norms for the ratio of health facilities (Dispensary, Health Centre, Children Hospital, Nursing Home, etc.) to population (neighbourhood, sub-town level/ ward level, etc) are not given in Physical Planning Handbook 2008. There are norms in the „Norms and Standards for Health Service Delivery, Ministry of Health, Republic of Kenya, 2006‟ which are written with a focus on the delivery of health services. As shown in Table below, the plan has proposed various types of health facilities after considering the types of health facilities given in „Norms and Standards for Health Service Delivery, Ministry of Health, Republic of Kenya, 2006‟; type of facilities given in Physical Planning Handbook-2008; available health facilities in Thika Town; and the proposed planning hierarchies.
Table 5.36: Demand Supply Gap Assessment of Health Facilities as Per Proposed Norms
Facilities (1 per catchment
population)
Current Availability in Town
Demand of Education Facilities
2015 2035 Gap
(Population-143357)
(Population-317067)
2015 2035
Veterinary Hospital Town Level 0 0 1 0 1
Medical College-cum-Hospital
Town Level 0 0 1 0 1
Communicable disease hospital
Town Level 0 0 1 0 1
Town Hospital/ Level 5 hospital
Town Level 1 0 1 0
Level 4/ District Hospital 100,000 0 1 3 1 3
Health Centre/(Level 3/ Sub-District/ Health Centre)
30,000 0 5 11 5 11
Basic Health Sub-Centre Nursing Homes (level 2)
10,000 1 14 32 13 31
Dispensary/ Small Clinic with Chemist Shop (level 1)
5,000 8 29 63 21 55
Veterinary clinics 25,000 0 6 13 6 13
Total 10 57 126 43 105
Source: Physical Planning Handbook 2008/ Norms and Standards for Health Service Delivery, Ministry of Health, Republic of Kenya, 2006 and Consultants’ Estimation
As shown in table above, the current estimated gap of health facilities is 105 facilities (Communicable disease hospital -1, level 4 hospital-3, level 3 hospital-11, level 2/ Basic Health Sub-Centre-31, Level 1/dispensary-55, veterinary hospital-1, veterinary clinic-13). Goal, strategies and projects related to health facilities are presented in table below:
Table 5.37: Health facilities - Goal, Strategies and Projects
Goals Strategies Projects
Qu
an
tity
Unit Remarks
Adequately equipped existing health facilities
Provision of all basic facilities as per the requirement to make the existing health facilities fully functional
Procurement of required equipments, staff, medicine, etc.
- -
All existing health facilities including level 5 hospital need to be fully equipped to make them functional
Providing additional
Development of new health
District Hospital/Level 4
3 No. These additional facilities need to be
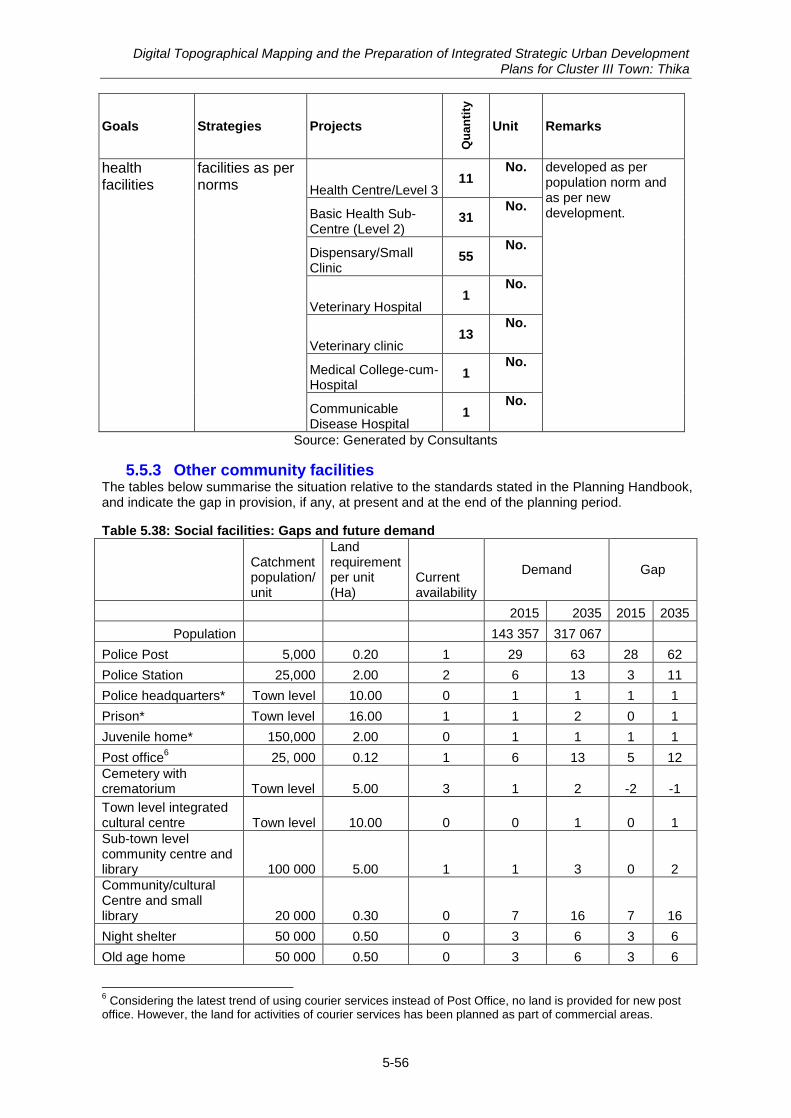
Digital Topographical Mapping and the Preparation of Integrated Strategic Urban Development Plans for Cluster III Town: Thika
5-56
Goals Strategies Projects
Qu
an
tity
Unit Remarks
health facilities
facilities as per norms Health Centre/Level 3
11 No. developed as per
population norm and as per new development. Basic Health Sub-
Centre (Level 2) 31
No.
Dispensary/Small Clinic
55 No.
Veterinary Hospital 1
No.
Veterinary clinic 13
No.
Medical College-cum-Hospital
1 No.
Communicable Disease Hospital
1 No.
Source: Generated by Consultants
5.5.3 Other community facilities The tables below summarise the situation relative to the standards stated in the Planning Handbook, and indicate the gap in provision, if any, at present and at the end of the planning period.
Table 5.38: Social facilities: Gaps and future demand
Catchment population/ unit
Land requirement per unit (Ha)
Current availability
Demand Gap
2015 2035 2015 2035
Population 143 357 317 067
Police Post 5,000 0.20 1 29 63 28 62
Police Station 25,000 2.00 2 6 13 3 11
Police headquarters* Town level 10.00 0 1 1 1 1
Prison* Town level 16.00 1 1 2 0 1
Juvenile home* 150,000 2.00 0 1 1 1 1
Post office6 25, 000 0.12 1 6 13 5 12
Cemetery with crematorium Town level 5.00 3 1 2 -2 -1
Town level integrated cultural centre Town level 10.00 0 0 1 0 1
Sub-town level community centre and library 100 000 5.00 1 1 3 0 2
Community/cultural Centre and small library 20 000 0.30 0 7 16 7 16
Night shelter 50 000 0.50 0 3 6 3 6
Old age home 50 000 0.50 0 3 6 3 6
6 Considering the latest trend of using courier services instead of Post Office, no land is provided for new post
office. However, the land for activities of courier services has been planned as part of commercial areas.
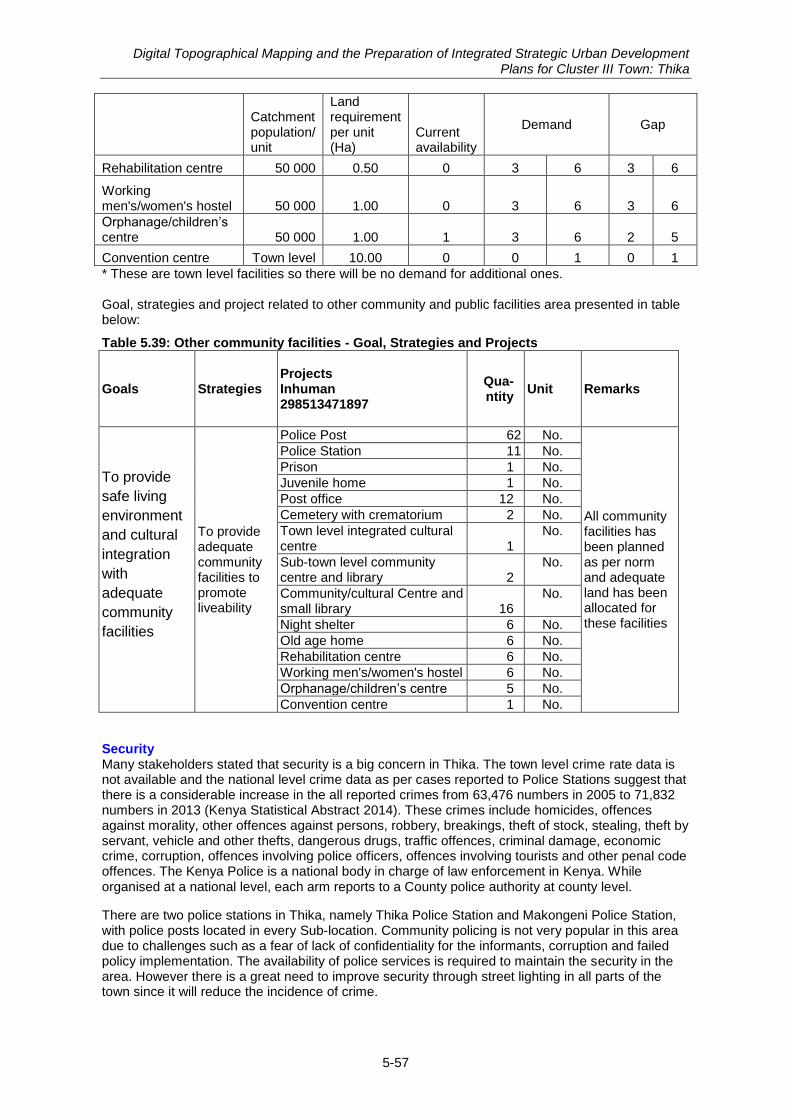
Digital Topographical Mapping and the Preparation of Integrated Strategic Urban Development Plans for Cluster III Town: Thika
5-57
Catchment population/ unit
Land requirement per unit (Ha)
Current availability
Demand Gap
Rehabilitation centre 50 000 0.50 0 3 6 3 6
Working men's/women's hostel 50 000 1.00 0 3 6 3 6
Orphanage/children‟s centre 50 000 1.00 1 3 6 2 5
Convention centre Town level 10.00 0 0 1 0 1
* These are town level facilities so there will be no demand for additional ones. Goal, strategies and project related to other community and public facilities area presented in table below:
Table 5.39: Other community facilities - Goal, Strategies and Projects
Goals Strategies Projects Inhuman 298513471897
Qua-ntity
Unit Remarks
To provide
safe living
environment
and cultural
integration
with
adequate
community
facilities
To provide adequate community facilities to promote liveability
Police Post 62 No.
All community facilities has been planned as per norm and adequate land has been allocated for these facilities
Police Station 11 No.
Prison 1 No.
Juvenile home 1 No.
Post office 12 No.
Cemetery with crematorium 2 No.
Town level integrated cultural centre 1
No.
Sub-town level community centre and library 2
No.
Community/cultural Centre and small library 16
No.
Night shelter 6 No.
Old age home 6 No.
Rehabilitation centre 6 No.
Working men's/women's hostel 6 No.
Orphanage/children‟s centre 5 No.
Convention centre 1 No.
Security Many stakeholders stated that security is a big concern in Thika. The town level crime rate data is not available and the national level crime data as per cases reported to Police Stations suggest that there is a considerable increase in the all reported crimes from 63,476 numbers in 2005 to 71,832 numbers in 2013 (Kenya Statistical Abstract 2014). These crimes include homicides, offences against morality, other offences against persons, robbery, breakings, theft of stock, stealing, theft by servant, vehicle and other thefts, dangerous drugs, traffic offences, criminal damage, economic crime, corruption, offences involving police officers, offences involving tourists and other penal code offences. The Kenya Police is a national body in charge of law enforcement in Kenya. While organised at a national level, each arm reports to a County police authority at county level.
There are two police stations in Thika, namely Thika Police Station and Makongeni Police Station, with police posts located in every Sub-location. Community policing is not very popular in this area due to challenges such as a fear of lack of confidentiality for the informants, corruption and failed policy implementation. The availability of police services is required to maintain the security in the area. However there is a great need to improve security through street lighting in all parts of the town since it will reduce the incidence of crime.
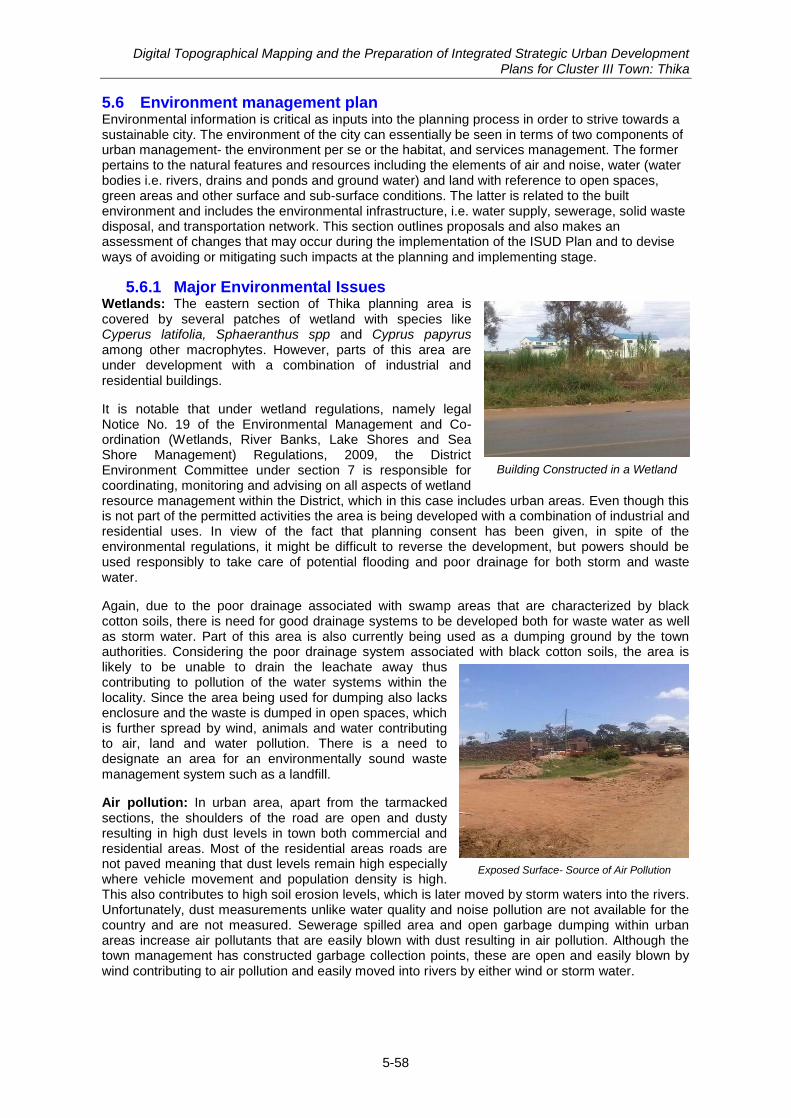
Digital Topographical Mapping and the Preparation of Integrated Strategic Urban Development Plans for Cluster III Town: Thika
5-58
5.6 Environment management plan Environmental information is critical as inputs into the planning process in order to strive towards a sustainable city. The environment of the city can essentially be seen in terms of two components of urban management- the environment per se or the habitat, and services management. The former pertains to the natural features and resources including the elements of air and noise, water (water bodies i.e. rivers, drains and ponds and ground water) and land with reference to open spaces, green areas and other surface and sub-surface conditions. The latter is related to the built environment and includes the environmental infrastructure, i.e. water supply, sewerage, solid waste disposal, and transportation network. This section outlines proposals and also makes an assessment of changes that may occur during the implementation of the ISUD Plan and to devise ways of avoiding or mitigating such impacts at the planning and implementing stage.
5.6.1 Major Environmental Issues Wetlands: The eastern section of Thika planning area is covered by several patches of wetland with species like Cyperus latifolia, Sphaeranthus spp and Cyprus papyrus among other macrophytes. However, parts of this area are under development with a combination of industrial and residential buildings.
It is notable that under wetland regulations, namely legal Notice No. 19 of the Environmental Management and Co-ordination (Wetlands, River Banks, Lake Shores and Sea Shore Management) Regulations, 2009, the District Environment Committee under section 7 is responsible for coordinating, monitoring and advising on all aspects of wetland resource management within the District, which in this case includes urban areas. Even though this is not part of the permitted activities the area is being developed with a combination of industrial and residential uses. In view of the fact that planning consent has been given, in spite of the environmental regulations, it might be difficult to reverse the development, but powers should be used responsibly to take care of potential flooding and poor drainage for both storm and waste water.
Again, due to the poor drainage associated with swamp areas that are characterized by black cotton soils, there is need for good drainage systems to be developed both for waste water as well as storm water. Part of this area is also currently being used as a dumping ground by the town authorities. Considering the poor drainage system associated with black cotton soils, the area is likely to be unable to drain the leachate away thus contributing to pollution of the water systems within the locality. Since the area being used for dumping also lacks enclosure and the waste is dumped in open spaces, which is further spread by wind, animals and water contributing to air, land and water pollution. There is a need to designate an area for an environmentally sound waste management system such as a landfill.
Air pollution: In urban area, apart from the tarmacked sections, the shoulders of the road are open and dusty resulting in high dust levels in town both commercial and residential areas. Most of the residential areas roads are not paved meaning that dust levels remain high especially where vehicle movement and population density is high. This also contributes to high soil erosion levels, which is later moved by storm waters into the rivers. Unfortunately, dust measurements unlike water quality and noise pollution are not available for the country and are not measured. Sewerage spilled area and open garbage dumping within urban areas increase air pollutants that are easily blown with dust resulting in air pollution. Although the town management has constructed garbage collection points, these are open and easily blown by wind contributing to air pollution and easily moved into rivers by either wind or storm water.
Building Constructed in a Wetland
Exposed Surface- Source of Air Pollution
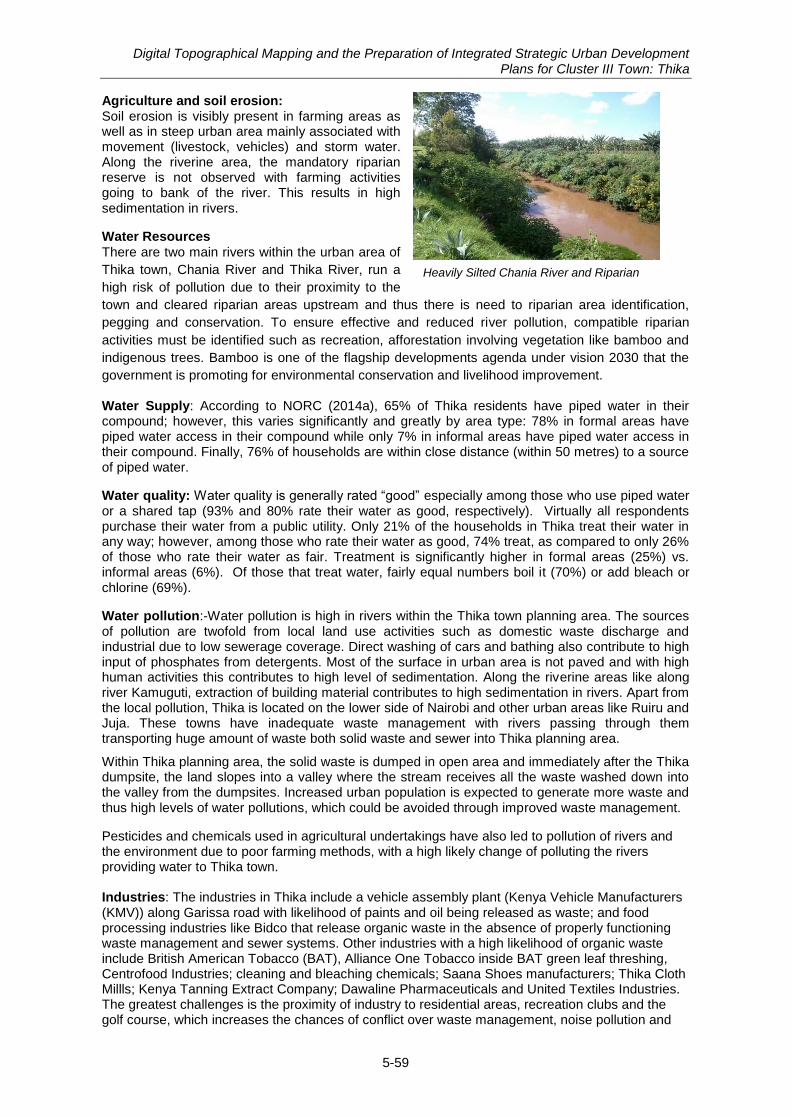
Digital Topographical Mapping and the Preparation of Integrated Strategic Urban Development Plans for Cluster III Town: Thika
5-59
Agriculture and soil erosion: Soil erosion is visibly present in farming areas as well as in steep urban area mainly associated with movement (livestock, vehicles) and storm water. Along the riverine area, the mandatory riparian reserve is not observed with farming activities going to bank of the river. This results in high sedimentation in rivers.
Water Resources
There are two main rivers within the urban area of
Thika town, Chania River and Thika River, run a
high risk of pollution due to their proximity to the
town and cleared riparian areas upstream and thus there is need to riparian area identification,
pegging and conservation. To ensure effective and reduced river pollution, compatible riparian
activities must be identified such as recreation, afforestation involving vegetation like bamboo and
indigenous trees. Bamboo is one of the flagship developments agenda under vision 2030 that the
government is promoting for environmental conservation and livelihood improvement.
Water Supply: According to NORC (2014a), 65% of Thika residents have piped water in their compound; however, this varies significantly and greatly by area type: 78% in formal areas have piped water access in their compound while only 7% in informal areas have piped water access in their compound. Finally, 76% of households are within close distance (within 50 metres) to a source of piped water.
Water quality: Water quality is generally rated “good” especially among those who use piped water or a shared tap (93% and 80% rate their water as good, respectively). Virtually all respondents purchase their water from a public utility. Only 21% of the households in Thika treat their water in any way; however, among those who rate their water as good, 74% treat, as compared to only 26% of those who rate their water as fair. Treatment is significantly higher in formal areas (25%) vs. informal areas (6%). Of those that treat water, fairly equal numbers boil it (70%) or add bleach or chlorine (69%).
Water pollution:-Water pollution is high in rivers within the Thika town planning area. The sources of pollution are twofold from local land use activities such as domestic waste discharge and industrial due to low sewerage coverage. Direct washing of cars and bathing also contribute to high input of phosphates from detergents. Most of the surface in urban area is not paved and with high human activities this contributes to high level of sedimentation. Along the riverine areas like along river Kamuguti, extraction of building material contributes to high sedimentation in rivers. Apart from the local pollution, Thika is located on the lower side of Nairobi and other urban areas like Ruiru and Juja. These towns have inadequate waste management with rivers passing through them transporting huge amount of waste both solid waste and sewer into Thika planning area.
Within Thika planning area, the solid waste is dumped in open area and immediately after the Thika dumpsite, the land slopes into a valley where the stream receives all the waste washed down into the valley from the dumpsites. Increased urban population is expected to generate more waste and thus high levels of water pollutions, which could be avoided through improved waste management.
Pesticides and chemicals used in agricultural undertakings have also led to pollution of rivers and the environment due to poor farming methods, with a high likely change of polluting the rivers providing water to Thika town. Industries: The industries in Thika include a vehicle assembly plant (Kenya Vehicle Manufacturers (KMV)) along Garissa road with likelihood of paints and oil being released as waste; and food processing industries like Bidco that release organic waste in the absence of properly functioning waste management and sewer systems. Other industries with a high likelihood of organic waste include British American Tobacco (BAT), Alliance One Tobacco inside BAT green leaf threshing, Centrofood Industries; cleaning and bleaching chemicals; Saana Shoes manufacturers; Thika Cloth Millls; Kenya Tanning Extract Company; Dawaline Pharmaceuticals and United Textiles Industries. The greatest challenges is the proximity of industry to residential areas, recreation clubs and the golf course, which increases the chances of conflict over waste management, noise pollution and
Heavily Silted Chania River and Riparian Farming
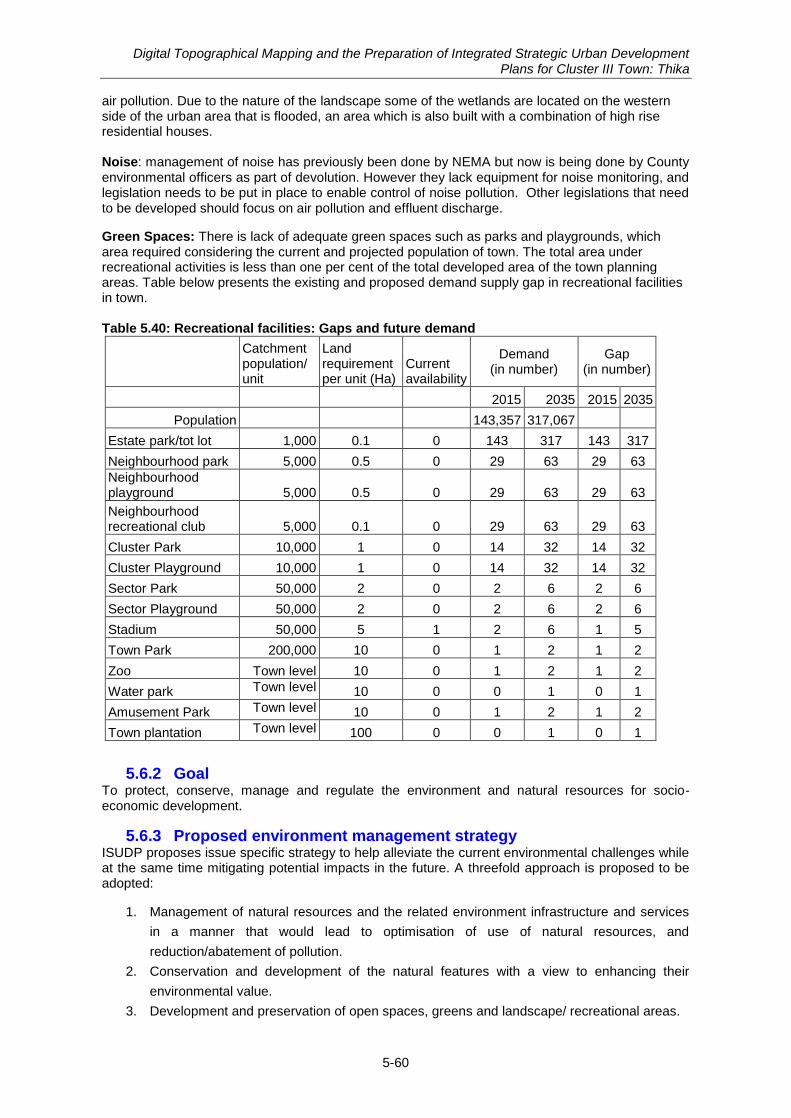
Digital Topographical Mapping and the Preparation of Integrated Strategic Urban Development Plans for Cluster III Town: Thika
5-60
air pollution. Due to the nature of the landscape some of the wetlands are located on the western side of the urban area that is flooded, an area which is also built with a combination of high rise residential houses. Noise: management of noise has previously been done by NEMA but now is being done by County environmental officers as part of devolution. However they lack equipment for noise monitoring, and legislation needs to be put in place to enable control of noise pollution. Other legislations that need to be developed should focus on air pollution and effluent discharge.
Green Spaces: There is lack of adequate green spaces such as parks and playgrounds, which area required considering the current and projected population of town. The total area under recreational activities is less than one per cent of the total developed area of the town planning areas. Table below presents the existing and proposed demand supply gap in recreational facilities in town. Table 5.40: Recreational facilities: Gaps and future demand
Catchment population/ unit
Land requirement per unit (Ha)
Current availability
Demand (in number)
Gap (in number)
2015 2035 2015 2035
Population 143,357 317,067
Estate park/tot lot 1,000 0.1 0 143 317 143 317
Neighbourhood park 5,000 0.5 0 29 63 29 63
Neighbourhood playground 5,000 0.5 0 29 63 29 63
Neighbourhood recreational club 5,000 0.1 0 29 63 29 63
Cluster Park 10,000 1 0 14 32 14 32
Cluster Playground 10,000 1 0 14 32 14 32
Sector Park 50,000 2 0 2 6 2 6
Sector Playground 50,000 2 0 2 6 2 6
Stadium 50,000 5 1 2 6 1 5
Town Park 200,000 10 0 1 2 1 2
Zoo Town level 10 0 1 2 1 2
Water park Town level 10 0 0 1 0 1
Amusement Park Town level 10 0 1 2 1 2
Town plantation Town level 100 0 0 1 0 1
5.6.2 Goal To protect, conserve, manage and regulate the environment and natural resources for socio-economic development.
5.6.3 Proposed environment management strategy ISUDP proposes issue specific strategy to help alleviate the current environmental challenges while at the same time mitigating potential impacts in the future. A threefold approach is proposed to be adopted:
1. Management of natural resources and the related environment infrastructure and services
in a manner that would lead to optimisation of use of natural resources, and
reduction/abatement of pollution.
2. Conservation and development of the natural features with a view to enhancing their
environmental value.
3. Development and preservation of open spaces, greens and landscape/ recreational areas.
Digital Topographical Mapping and the Preparation of Integrated Strategic Urban Development Plans for Cluster III Town: Thika
5-61
The following are some of the major strategies and projects that may be undertaken as a priority in Thika town:
5.6.4 Protect Environmentally Sensitive Areas Thika is located before the ascent to central highlands in the north – a short distance from Aberdare ranges to the west. The Chania and Thika rivers from these mountainous ecosystems pass through the town. This ensures a continuous supply of water. The two rivers have attractive waterfalls complemented by the relatively close Fourteen Falls on the Athi River and Ol Donyo Sabuk National Park. A detailed analysis of environment of Thika Town in terms of climatic condition, geology, soils, eco-system and biodiversity, air pollution, water resources, sanitation, etc. was included in the Interim Report. Therefore here only mapping of the environmentally sensitive areas is presented here along with proposals. This section covers mapping of environmentally sensitive areas, a land suitability analysis, green areas, riparian reserves and mapping of all possible land use conflicts and matters relating to heritage conservation. Existing environmental sensitive areas are shown in Figure 5.36 and Figure 5.37.
Rivers and Wetlands: There are three rivers i.e. Chania River, Kamuguti River and Ndarugu River, passing through the town planning area and Athi River touches the planning boundary to the south-east. A wetland is located in the centre of the town planning area (Figure 5.36 and Figure 5.37).
Land Suitability Analysis: The Consultants has considered the degree of slope for identification of land suitable for development. Three types of areas have been identified in terms of land suitability, namely land suitable for development without any intervention, land suitable for development with intervention (adequate precaution measures mentioned in foregoing paragraph) and land not suitable for development. Land considered suitable for development has a slope of less than10
degrees. The land coming under the slope of 10.10 to 15
0 has been considered as steep slope area
and development is also proposed on this slope with extra measures to manage the slope to avoid any soil erosion and concerns about safety. All the areas beyond the slope of 15
0 are considered as
highly steep slope and not suitable for any kind of development. The slope analysis suggests that southern and south-eastern sides of the planning area are more suitable for future development. (Figure 5.37)
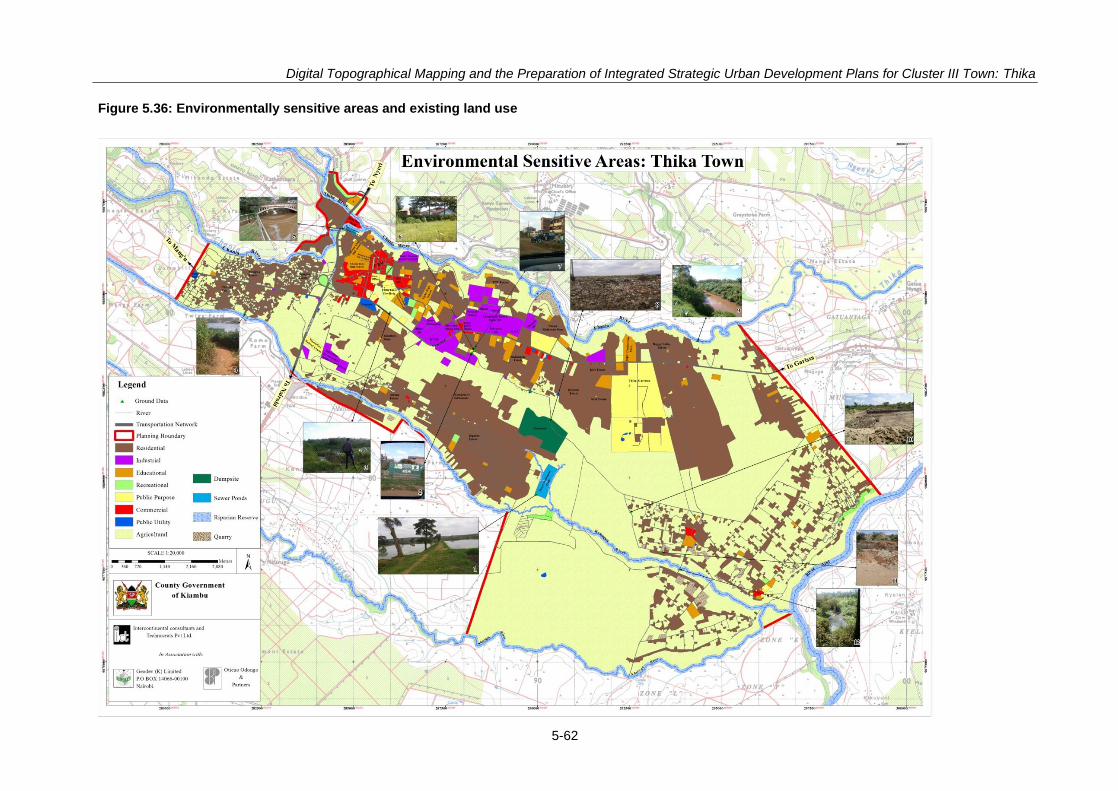
Digital Topographical Mapping and the Preparation of Integrated Strategic Urban Development Plans for Cluster III Town: Thika
5-62
Figure 5.36: Environmentally sensitive areas and existing land use
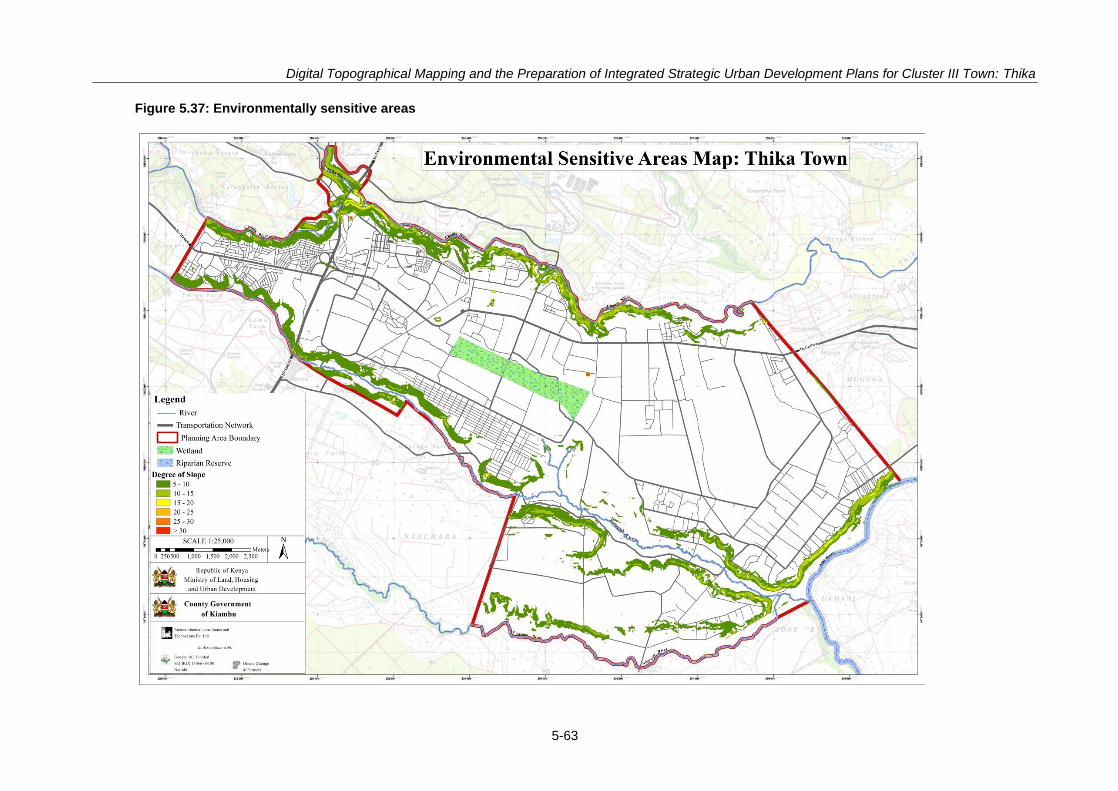
Digital Topographical Mapping and the Preparation of Integrated Strategic Urban Development Plans for Cluster III Town: Thika
5-63
Figure 5.37: Environmentally sensitive areas
Digital Topographical Mapping and the Preparation of Integrated Strategic Urban Development Plans for Cluster III Town: Thika
5-64
Specification of forest and green zone and development: There is no existing forest area within the planning area but areas with a high degree of slope, as shown in Figure 5.37, are planned for plantation. Most of these plantation areas are south of Kamuguti River, near Muthaara, and north of Athi River in Munyu.
Apart from the plantations, other green/ recreational areas are included in the plan, namely a town level park, water park, amusement park, sub-town level parks, cluster level park, etc. Around 5% of the total developed area is planned for recreational activities.
Protection of the water catchment area and riparian reserves: The mapped rivers and wetlands are all protected under the plan. The riparian areas of the Thika and Chania rivers are faced with two major threats, one is pollution caused by poor waste disposal since the town lacks a waste management system, and the other is encroachment by building. The water intake for the town near the Blue Post Hotel is below a busy road serving the town. There is a high possibility of pollution from vehicular transport, and the fact that the water is turbid demonstrates that land management upstream is poor. An intake in the forested area upstream of the farming activities, to eliminate the risk of farm chemicals getting into the water, would make a dramatic impact on the quality of the raw water supply.
Due to rock being close to the surface as result of the geological formation of the Athi-Kapiti plains, there are several quarries in the area, most of which are located along ridges of river valleys and along the Ndarugu River. They generate considerable solids which flow into the river valleys along with other pollutants. These quarrying areas are poorly developed in terms of infrastructure: they lack paved roads, sanitation and housing. After extraction of the stone, the quarries are not rehabilitated but left open. In the northern and part of the western area, the rivers are mainly threatened by building encroachment and incompatible development such as waste dumping.
Riparian management is one of major concerns in the planning area as in many cases the banks of the rivers have been built on or used for farming. The size of the area to be conserved (as riparian reserve) has been calculated based on the width of the river, which also involves water reservoirs protection as well. Planting of bamboo along the riverine area will help stabilize soils, restore nature and provide livelihood sources. Consideration should also be given to using the riparian reserves for public green space, including nature trails. All the rivers have been provided with adequate riparian reserve on both sides of the rivers as shown in Figure below.
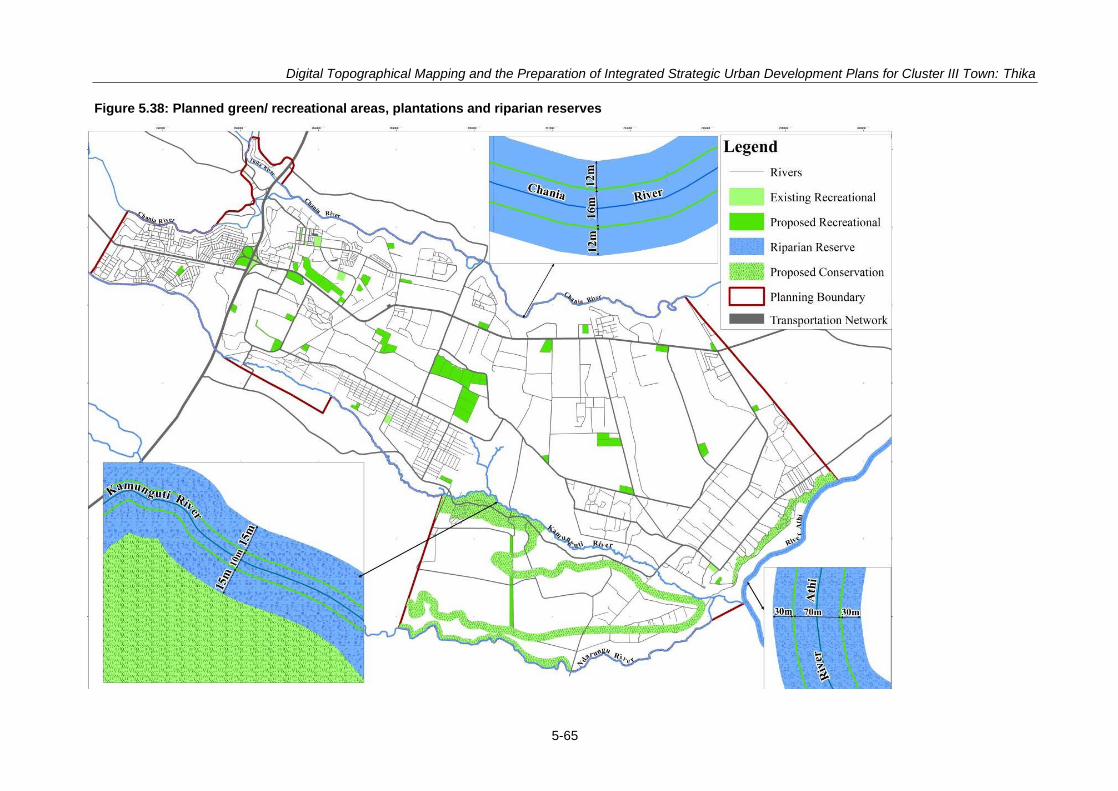
Digital Topographical Mapping and the Preparation of Integrated Strategic Urban Development Plans for Cluster III Town: Thika
5-65
Figure 5.38: Planned green/ recreational areas, plantations and riparian reserves
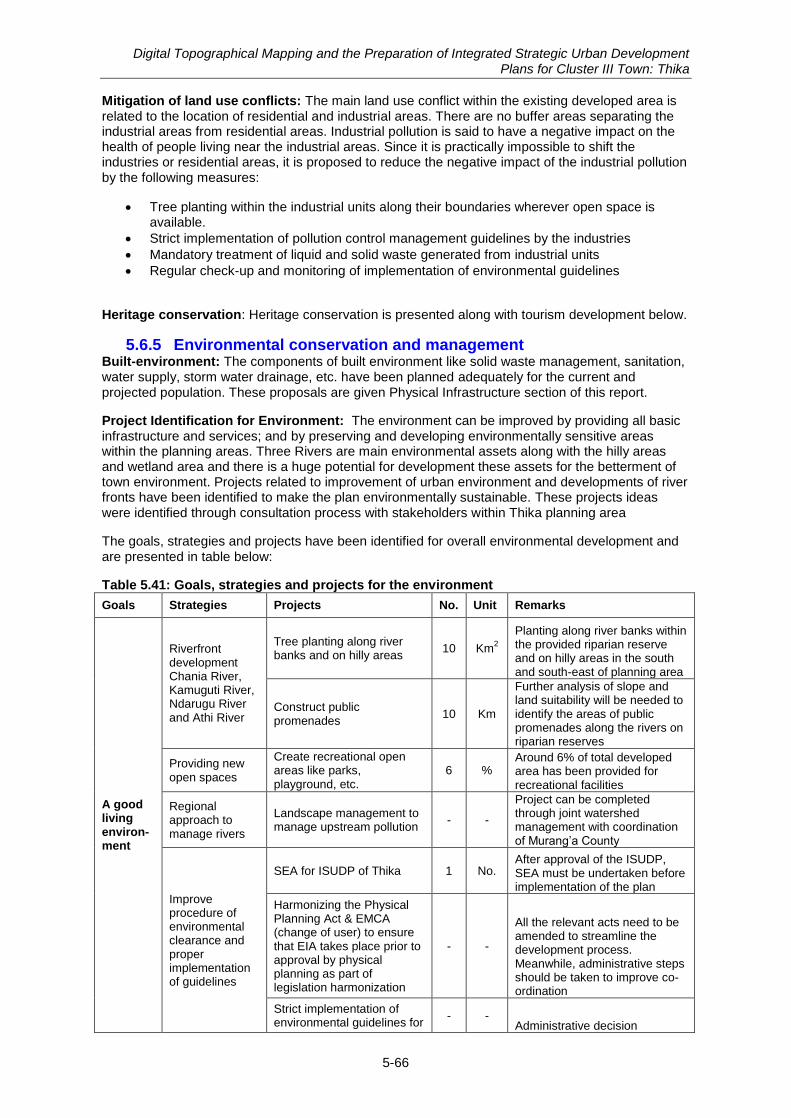
Digital Topographical Mapping and the Preparation of Integrated Strategic Urban Development Plans for Cluster III Town: Thika
5-66
Mitigation of land use conflicts: The main land use conflict within the existing developed area is related to the location of residential and industrial areas. There are no buffer areas separating the industrial areas from residential areas. Industrial pollution is said to have a negative impact on the health of people living near the industrial areas. Since it is practically impossible to shift the industries or residential areas, it is proposed to reduce the negative impact of the industrial pollution by the following measures:
Tree planting within the industrial units along their boundaries wherever open space is available.
Strict implementation of pollution control management guidelines by the industries
Mandatory treatment of liquid and solid waste generated from industrial units
Regular check-up and monitoring of implementation of environmental guidelines
Heritage conservation: Heritage conservation is presented along with tourism development below.
5.6.5 Environmental conservation and management Built-environment: The components of built environment like solid waste management, sanitation, water supply, storm water drainage, etc. have been planned adequately for the current and projected population. These proposals are given Physical Infrastructure section of this report.
Project Identification for Environment: The environment can be improved by providing all basic infrastructure and services; and by preserving and developing environmentally sensitive areas within the planning areas. Three Rivers are main environmental assets along with the hilly areas and wetland area and there is a huge potential for development these assets for the betterment of town environment. Projects related to improvement of urban environment and developments of river fronts have been identified to make the plan environmentally sustainable. These projects ideas were identified through consultation process with stakeholders within Thika planning area
The goals, strategies and projects have been identified for overall environmental development and are presented in table below:
Table 5.41: Goals, strategies and projects for the environment
Goals Strategies Projects No. Unit Remarks
A good living environ-ment
Riverfront development Chania River, Kamuguti River, Ndarugu River and Athi River
Tree planting along river banks and on hilly areas
10 Km2
Planting along river banks within the provided riparian reserve and on hilly areas in the south and south-east of planning area
Construct public promenades
10 Km
Further analysis of slope and land suitability will be needed to identify the areas of public promenades along the rivers on riparian reserves
Providing new open spaces
Create recreational open areas like parks, playground, etc.
6 % Around 6% of total developed area has been provided for recreational facilities
Regional approach to manage rivers
Landscape management to manage upstream pollution
- -
Project can be completed through joint watershed management with coordination of Murang‟a County
Improve procedure of environmental clearance and proper implementation of guidelines
SEA for ISUDP of Thika 1 No. After approval of the ISUDP, SEA must be undertaken before implementation of the plan
Harmonizing the Physical Planning Act & EMCA (change of user) to ensure that EIA takes place prior to approval by physical planning as part of legislation harmonization
- -
All the relevant acts need to be amended to streamline the development process. Meanwhile, administrative steps should be taken to improve co-ordination
Strict implementation of environmental guidelines for
- - Administrative decision
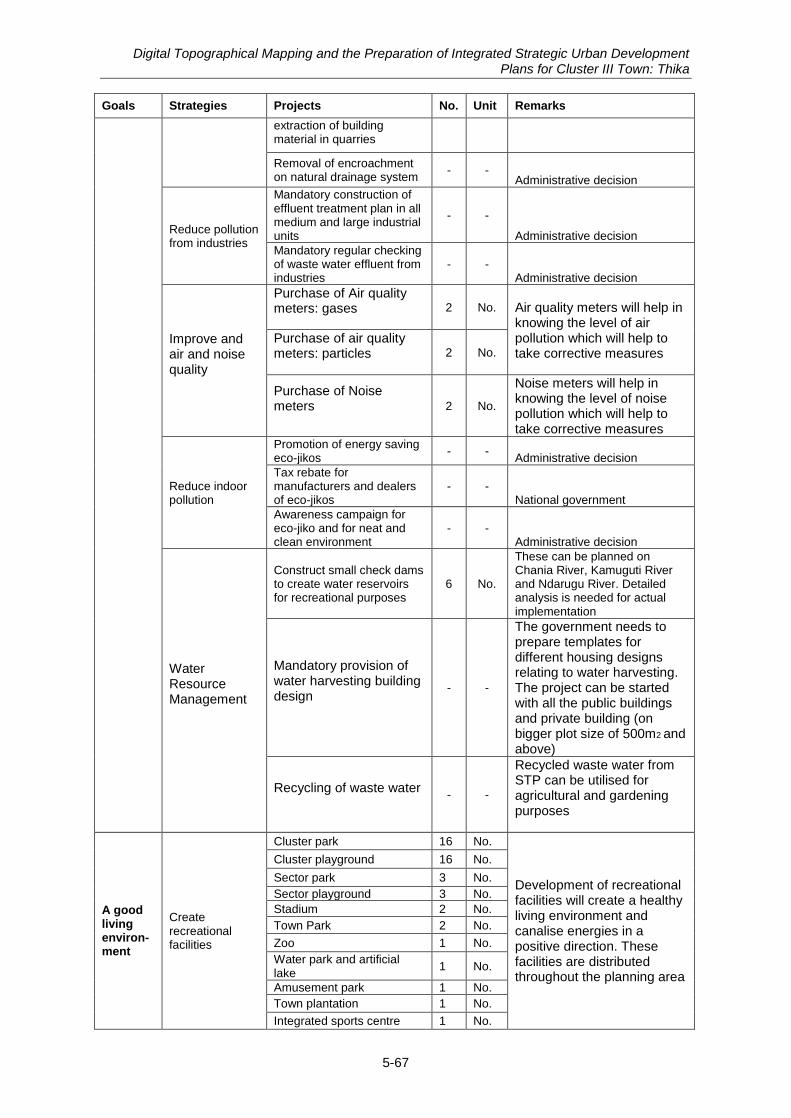
Digital Topographical Mapping and the Preparation of Integrated Strategic Urban Development Plans for Cluster III Town: Thika
5-67
Goals Strategies Projects No. Unit Remarks
extraction of building material in quarries
Removal of encroachment on natural drainage system
- - Administrative decision
Reduce pollution from industries
Mandatory construction of effluent treatment plan in all medium and large industrial units
- -
Administrative decision
Mandatory regular checking of waste water effluent from industries
- - Administrative decision
Improve and air and noise quality
Purchase of Air quality meters: gases
2 No. Air quality meters will help in knowing the level of air pollution which will help to take corrective measures
Purchase of air quality meters: particles
2 No.
Purchase of Noise meters
2 No.
Noise meters will help in knowing the level of noise pollution which will help to take corrective measures
Reduce indoor pollution
Promotion of energy saving eco-jikos
- - Administrative decision
Tax rebate for manufacturers and dealers of eco-jikos
- - National government
Awareness campaign for eco-jiko and for neat and clean environment
- - Administrative decision
Water Resource Management
Construct small check dams to create water reservoirs for recreational purposes
6 No.
These can be planned on Chania River, Kamuguti River and Ndarugu River. Detailed analysis is needed for actual implementation
Mandatory provision of water harvesting building design
- -
The government needs to prepare templates for different housing designs relating to water harvesting. The project can be started with all the public buildings and private building (on bigger plot size of 500m2 and above)
Recycling of waste water
- -
Recycled waste water from STP can be utilised for agricultural and gardening purposes
A good living environ-ment
Create recreational facilities
Cluster park 16 No.
Development of recreational facilities will create a healthy living environment and canalise energies in a positive direction. These facilities are distributed throughout the planning area
Cluster playground 16 No.
Sector park 3 No.
Sector playground 3 No.
Stadium 2 No.
Town Park 2 No.
Zoo 1 No.
Water park and artificial lake
1 No.
Amusement park 1 No.
Town plantation 1 No.
Integrated sports centre 1 No.
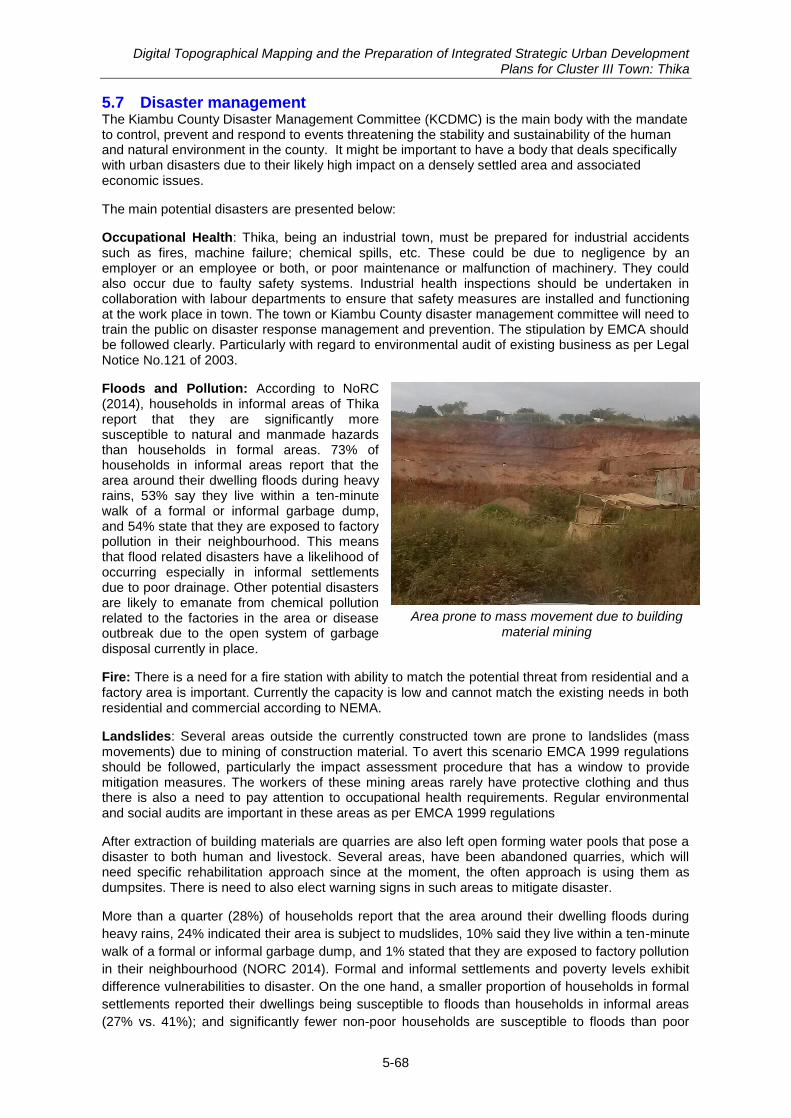
Digital Topographical Mapping and the Preparation of Integrated Strategic Urban Development Plans for Cluster III Town: Thika
5-68
Area prone to mass movement due to building material mining
5.7 Disaster management The Kiambu County Disaster Management Committee (KCDMC) is the main body with the mandate to control, prevent and respond to events threatening the stability and sustainability of the human and natural environment in the county. It might be important to have a body that deals specifically with urban disasters due to their likely high impact on a densely settled area and associated economic issues.
The main potential disasters are presented below:
Occupational Health: Thika, being an industrial town, must be prepared for industrial accidents such as fires, machine failure; chemical spills, etc. These could be due to negligence by an employer or an employee or both, or poor maintenance or malfunction of machinery. They could also occur due to faulty safety systems. Industrial health inspections should be undertaken in collaboration with labour departments to ensure that safety measures are installed and functioning at the work place in town. The town or Kiambu County disaster management committee will need to train the public on disaster response management and prevention. The stipulation by EMCA should be followed clearly. Particularly with regard to environmental audit of existing business as per Legal Notice No.121 of 2003.
Floods and Pollution: According to NoRC (2014), households in informal areas of Thika report that they are significantly more susceptible to natural and manmade hazards than households in formal areas. 73% of households in informal areas report that the area around their dwelling floods during heavy rains, 53% say they live within a ten-minute walk of a formal or informal garbage dump, and 54% state that they are exposed to factory pollution in their neighbourhood. This means that flood related disasters have a likelihood of occurring especially in informal settlements due to poor drainage. Other potential disasters are likely to emanate from chemical pollution related to the factories in the area or disease outbreak due to the open system of garbage disposal currently in place.
Fire: There is a need for a fire station with ability to match the potential threat from residential and a factory area is important. Currently the capacity is low and cannot match the existing needs in both residential and commercial according to NEMA.
Landslides: Several areas outside the currently constructed town are prone to landslides (mass movements) due to mining of construction material. To avert this scenario EMCA 1999 regulations should be followed, particularly the impact assessment procedure that has a window to provide mitigation measures. The workers of these mining areas rarely have protective clothing and thus there is also a need to pay attention to occupational health requirements. Regular environmental and social audits are important in these areas as per EMCA 1999 regulations
After extraction of building materials are quarries are also left open forming water pools that pose a disaster to both human and livestock. Several areas, have been abandoned quarries, which will need specific rehabilitation approach since at the moment, the often approach is using them as dumpsites. There is need to also elect warning signs in such areas to mitigate disaster.
More than a quarter (28%) of households report that the area around their dwelling floods during
heavy rains, 24% indicated their area is subject to mudslides, 10% said they live within a ten-minute
walk of a formal or informal garbage dump, and 1% stated that they are exposed to factory pollution
in their neighbourhood (NORC 2014). Formal and informal settlements and poverty levels exhibit
difference vulnerabilities to disaster. On the one hand, a smaller proportion of households in formal
settlements reported their dwellings being susceptible to floods than households in informal areas
(27% vs. 41%); and significantly fewer non-poor households are susceptible to floods than poor
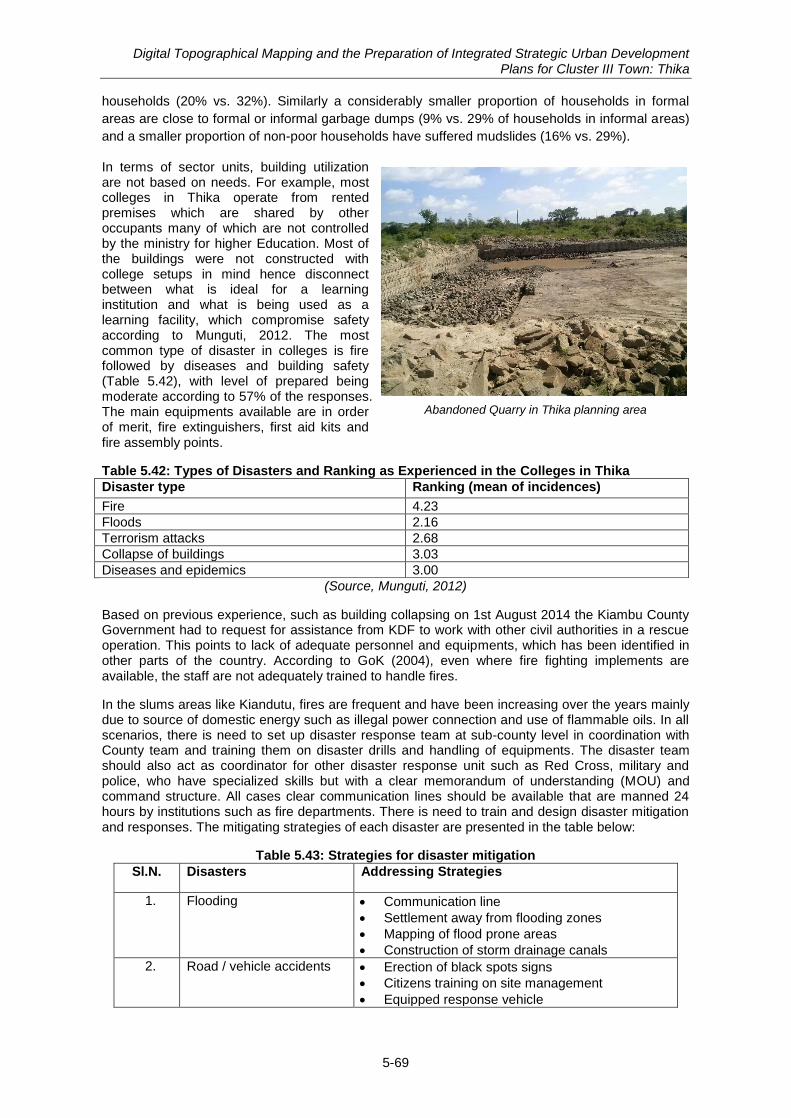
Digital Topographical Mapping and the Preparation of Integrated Strategic Urban Development Plans for Cluster III Town: Thika
5-69
Abandoned Quarry in Thika planning area
households (20% vs. 32%). Similarly a considerably smaller proportion of households in formal
areas are close to formal or informal garbage dumps (9% vs. 29% of households in informal areas)
and a smaller proportion of non-poor households have suffered mudslides (16% vs. 29%).
In terms of sector units, building utilization are not based on needs. For example, most colleges in Thika operate from rented premises which are shared by other occupants many of which are not controlled by the ministry for higher Education. Most of the buildings were not constructed with college setups in mind hence disconnect between what is ideal for a learning institution and what is being used as a learning facility, which compromise safety according to Munguti, 2012. The most common type of disaster in colleges is fire followed by diseases and building safety (Table 5.42), with level of prepared being moderate according to 57% of the responses. The main equipments available are in order of merit, fire extinguishers, first aid kits and fire assembly points.
Table 5.42: Types of Disasters and Ranking as Experienced in the Colleges in Thika
Disaster type Ranking (mean of incidences)
Fire 4.23
Floods 2.16
Terrorism attacks 2.68
Collapse of buildings 3.03
Diseases and epidemics 3.00
(Source, Munguti, 2012)
Based on previous experience, such as building collapsing on 1st August 2014 the Kiambu County Government had to request for assistance from KDF to work with other civil authorities in a rescue operation. This points to lack of adequate personnel and equipments, which has been identified in other parts of the country. According to GoK (2004), even where fire fighting implements are available, the staff are not adequately trained to handle fires.
In the slums areas like Kiandutu, fires are frequent and have been increasing over the years mainly due to source of domestic energy such as illegal power connection and use of flammable oils. In all scenarios, there is need to set up disaster response team at sub-county level in coordination with County team and training them on disaster drills and handling of equipments. The disaster team should also act as coordinator for other disaster response unit such as Red Cross, military and police, who have specialized skills but with a clear memorandum of understanding (MOU) and command structure. All cases clear communication lines should be available that are manned 24 hours by institutions such as fire departments. There is need to train and design disaster mitigation and responses. The mitigating strategies of each disaster are presented in the table below:
Table 5.43: Strategies for disaster mitigation
Sl.N. Disasters Addressing Strategies
1. Flooding Communication line
Settlement away from flooding zones
Mapping of flood prone areas
Construction of storm drainage canals
2. Road / vehicle accidents Erection of black spots signs
Citizens training on site management
Equipped response vehicle
Digital Topographical Mapping and the Preparation of Integrated Strategic Urban Development Plans for Cluster III Town: Thika
5-70
Sl.N. Disasters Addressing Strategies
3. Building fire Installation of smoke detectors in all buildings upgrade slums and create fire engine passages
Broadcast communication networks in case of fire
fire drill training
4. Building collapsing and safety
Evacuation team training
Rescue equipment presence and training on use
5. Diseases outbreak Presence of surveillance team
Response procedure
6. Quarrying accidents Training on accidents prevention and management
Safe procedure drafted
Implementation of occupation health procedures
7. Earth quake Ensure compliance with seismic levels requirements
Training residents on response to earth tremors and quakes
Seismicity of Kenya: Seismicity can be expressed in terms of the number of earthquake occurrences, intensities, distribution of epicenters and seismic energy maps. Generally, the seismicity of Kenya can be termed as low-medium in reference to historical earthquakes and magnitudes recorded. Most of the research and discussion on seismicity haa been concentrated in the Rift Valley due to the fact that it has the highest seismic activity in Kenya and in the larger eastern Africa region (Olango, 1992). According to (Kataka 1996) the Rift Valley system forms both a major tectonic zone and also volcanic zone in Kenya and is thus the most seismically active zone (Loupekine 1971; Kianji 2003; Rodrigues 1970). One of the strongest Africa earthquakes on the rift floor was the Subukia earthquake of 1928, measuring 7.1 on the Richter scale. The only other big earthquake was in Kisumu in 1968 measuring 6.0.
This also indicates that the seismicity is highly varied and unpredictable. Historical analysis of earthquake occurrences indicates that the seismic magnitude is on the rise in the eastern Africa region (Olang, 1992). Moderate quakes of magnitude 4.6 were experienced in Nairobi in 2012.This similarly shows the nature of seismic activity in Kenya.
In Kenya, seismic energy distribution is spatially heterogeneous with no defined pattern, although the activity seems to concentrate on the western and southwestern side of the country. Characteristically, the clusters of high seismic activity concentrate on the southern Rift Valley zone of Kenya and north Tanzania.
Smaller structures, which appear to be unconnected with the rift are evident in central Kenya, according to (Kataka, 1996). One such fault-zone, extending from Kitui southwards to Korogwe in Tanzania shows significant seismic activities. This fault forms the western margin of the Karroo outcrop (Saggerson, 1972). Seismic zoning maps (according to FEMA, 2004) are based on subjective estimates of intensity from available information on earthquake occurrence, geology and tectonics of the country, indicating the level of seismic risk and hazard. The Seismicity of Kenya can be grouped roughly into five main zones (Figure 5.39).
South Rift zone …………………..1 Central Kenya ………………….. .2 (Thika) Western Rift zone ……… . ……..3 Northern Rift zone………………..4 Southeast zone…………………..5
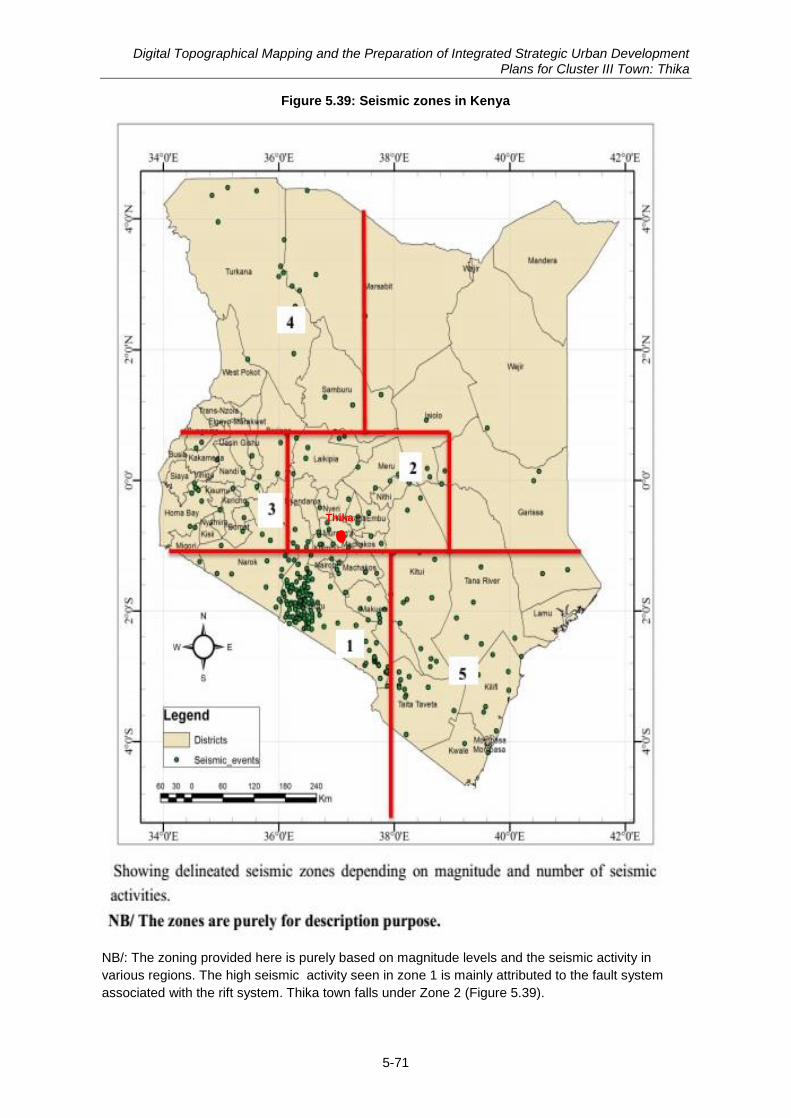
Digital Topographical Mapping and the Preparation of Integrated Strategic Urban Development Plans for Cluster III Town: Thika
5-71
Thika
Figure 5.39: Seismic zones in Kenya
NB/: The zoning provided here is purely based on magnitude levels and the seismic activity in
various regions. The high seismic activity seen in zone 1 is mainly attributed to the fault system
associated with the rift system. Thika town falls under Zone 2 (Figure 5.39).
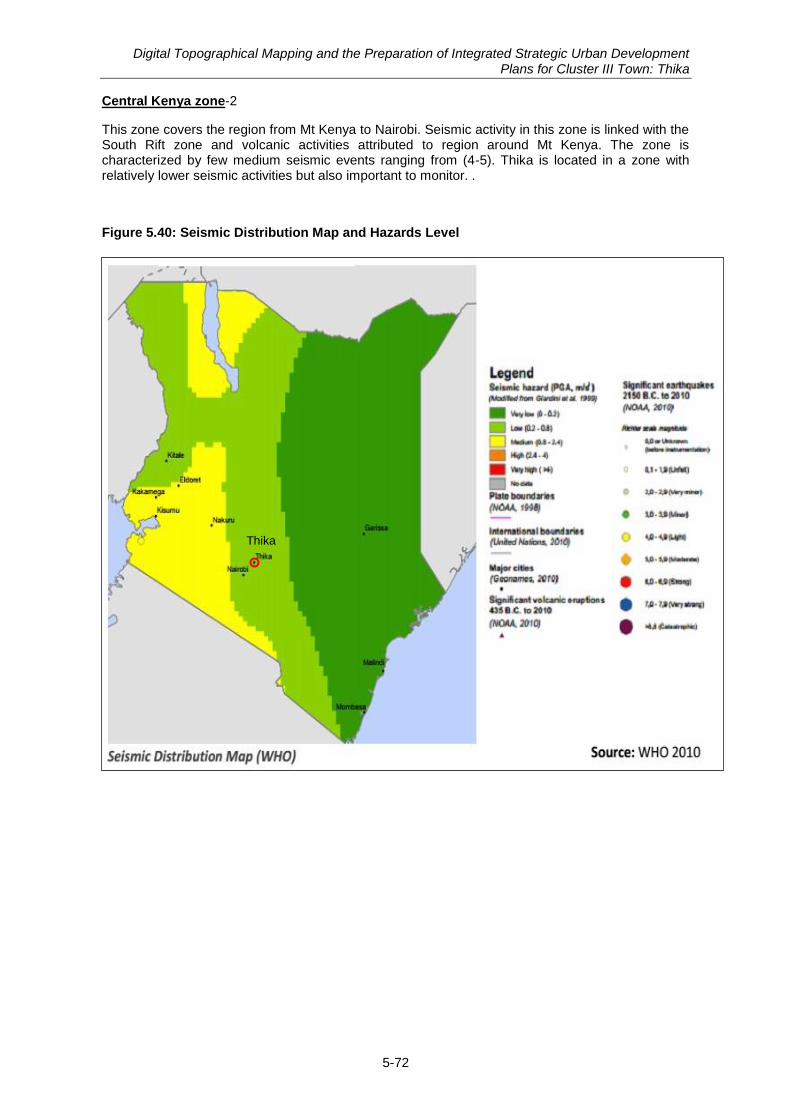
Digital Topographical Mapping and the Preparation of Integrated Strategic Urban Development Plans for Cluster III Town: Thika
5-72
Central Kenya zone-2
This zone covers the region from Mt Kenya to Nairobi. Seismic activity in this zone is linked with the South Rift zone and volcanic activities attributed to region around Mt Kenya. The zone is characterized by few medium seismic events ranging from (4-5). Thika is located in a zone with relatively lower seismic activities but also important to monitor. .
Figure 5.40: Seismic Distribution Map and Hazards Level
Thika
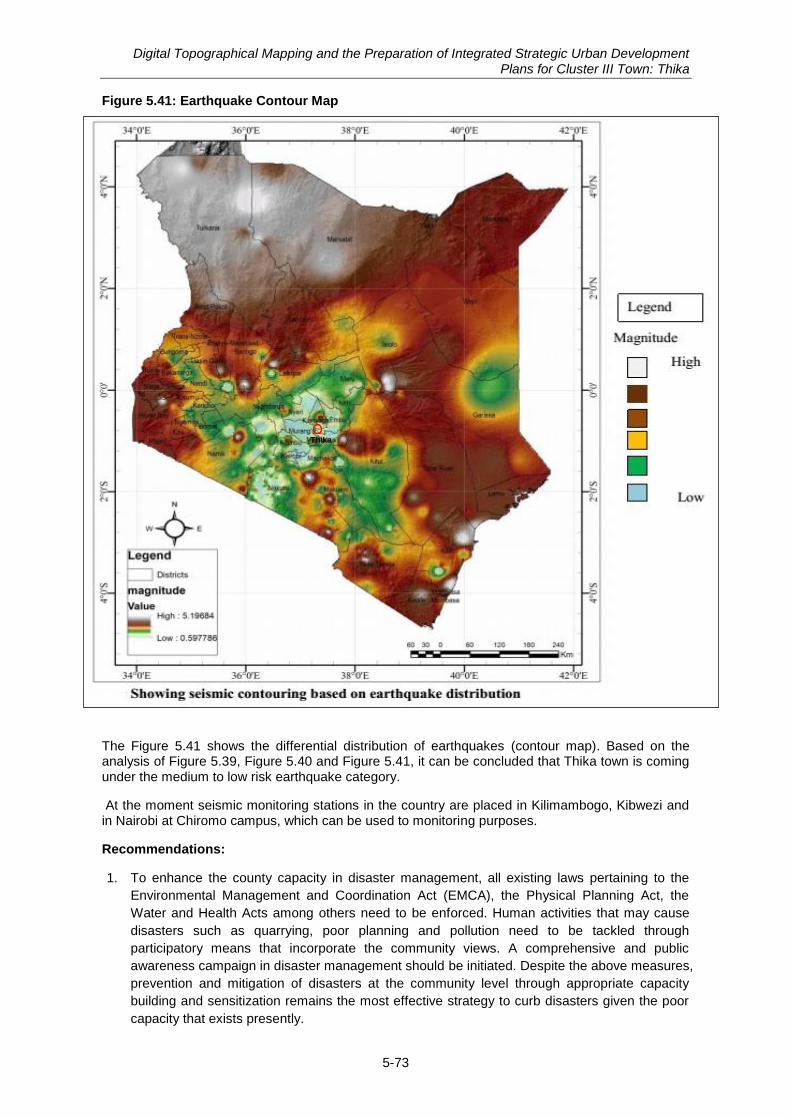
Digital Topographical Mapping and the Preparation of Integrated Strategic Urban Development Plans for Cluster III Town: Thika
5-73
Figure 5.41: Earthquake Contour Map
The Figure 5.41 shows the differential distribution of earthquakes (contour map). Based on the analysis of Figure 5.39, Figure 5.40 and Figure 5.41, it can be concluded that Thika town is coming under the medium to low risk earthquake category.
At the moment seismic monitoring stations in the country are placed in Kilimambogo, Kibwezi and in Nairobi at Chiromo campus, which can be used to monitoring purposes.
Recommendations:
1. To enhance the county capacity in disaster management, all existing laws pertaining to the
Environmental Management and Coordination Act (EMCA), the Physical Planning Act, the
Water and Health Acts among others need to be enforced. Human activities that may cause
disasters such as quarrying, poor planning and pollution need to be tackled through
participatory means that incorporate the community views. A comprehensive and public
awareness campaign in disaster management should be initiated. Despite the above measures,
prevention and mitigation of disasters at the community level through appropriate capacity
building and sensitization remains the most effective strategy to curb disasters given the poor
capacity that exists presently.
Thika
Digital Topographical Mapping and the Preparation of Integrated Strategic Urban Development Plans for Cluster III Town: Thika
5-74
2. In order to ensure effective and integrated sustainable development, there is a need to develop
a strategic environmental assessment framework (SEA) for town.
3. Private companies could be used to manage disaster in conjunction with government under
public-private partnerships.
4. The County environmental officers will need to generate legislation to facilitate enforcement
and purchase equipment to manage waste with NEMA and County officers working together
for improved enforcement.
5. For environmental compliance to be effective, especially implementation of environmental
impact assessment (EIA) recommendations, the political regime needs to back implementation
and enforcement.
6. NEMA should use the Environment Management Act to ensure industries operating within the
town treat their effluents to the required standards so as to reduce pollution.
7. There is need by NEMA to ensure that the building materials being used in the fast expanding
town are sourced from sustainable sources by ensuring compliance with EMCA and other
regulations as provided. This should cover both extraction, site management for occupation
health and construction sites compliance with both occupational health and damping.
8. As part of environmental management, impact mitigation must be enforced as part of the urban
development cycle for individual investments. The design stage will be crucial as the point
where all mitigation activity will be planned for and resources allocated.
9. Environmental and social management should be inbuilt into each project development cycle
Major Challenges
Lack of a county policy on disaster management
Information on disasters is not widely disseminated.
Under-developed systems of monitoring disaster risks.
Inadequate capacity in terms of facilities, equipment and human resource to deal with
incidences of disaster in county
Insufficient funding and uncoordinated response when disaster strikes.
This ISUDP aims to establish Thika town as a sustainable disaster resilient and healthy town and has taken into account the measures for reduction of disaster impacts as an integral part of the planning process while designing of the proposed Land Use Plan 2035 of the town. This Plan also underlines the formulation of broad level strategies for disaster mitigation.
Goal: To develop effective and efficient firefighting and disaster management unit in Thika town to
enhance efficient response to disasters.
Disaster Management Strategy
Disaster management in terms of response alone is not sufficient, as it yields temporary results at a very high cost; therefore, ISUDP proposes that disaster prevention, mitigation and preparedness are better than disaster response in achieving the goals and objectives of vulnerability reduction and are essential to integrated disaster management. ISUDP proposes following broad strategies to deal with disaster management:
1. To develop better coordination among institutions responding to disaster incidences
2. To create Town Disaster Management Authority
3. To identify indicators of disaster risks and disaster prone areas in town
4. To develop an early warning system including guidance on how to act upon warnings
5. To enhance capacity of human resource, equipment and infrastructure.
6. To reduce response time for any disasters within the town
7. To decentralize and equip disaster management units.
8. To integrate disaster risk reduction in building approvals and other development policies
Project Identification for Disaster Management: The goals, strategies and projects have been
identified for disaster management and are presented in table below:
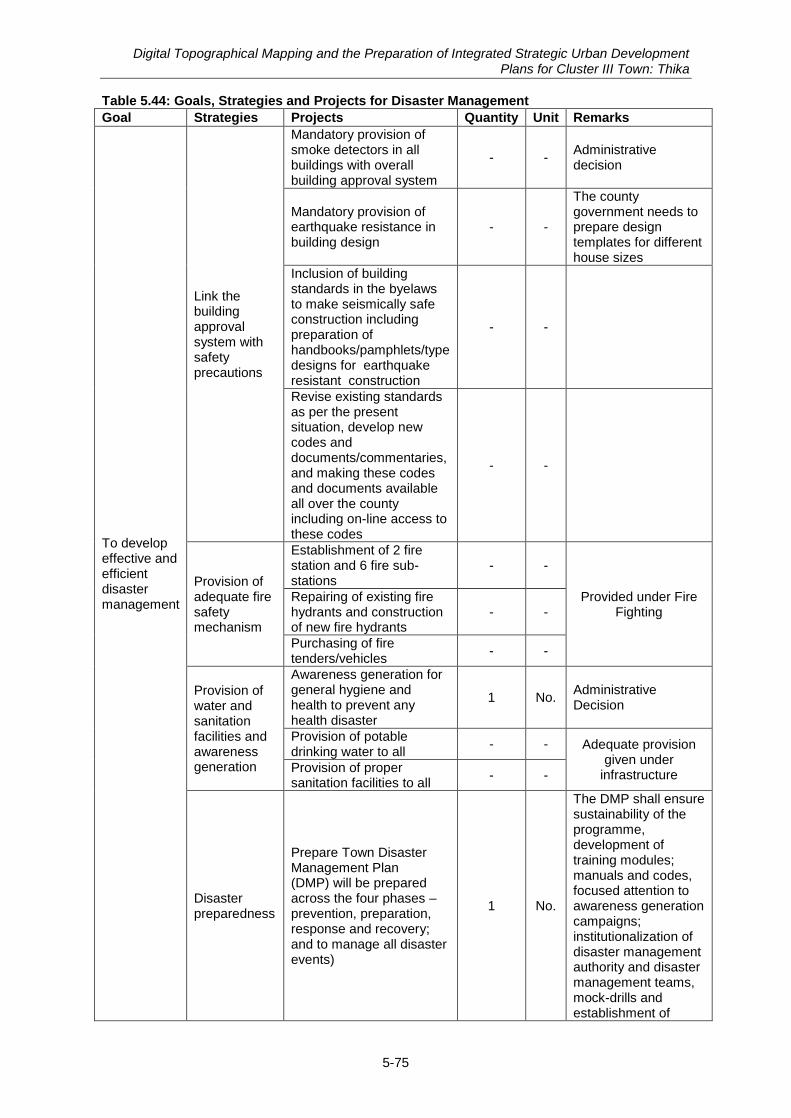
Digital Topographical Mapping and the Preparation of Integrated Strategic Urban Development Plans for Cluster III Town: Thika
5-75
Table 5.44: Goals, Strategies and Projects for Disaster Management
Goal Strategies Projects Quantity Unit Remarks
To develop effective and efficient disaster management
Link the building approval system with safety precautions
Mandatory provision of smoke detectors in all buildings with overall building approval system
- - Administrative decision
Mandatory provision of earthquake resistance in building design
- -
The county government needs to prepare design templates for different house sizes
Inclusion of building standards in the byelaws to make seismically safe construction including preparation of handbooks/pamphlets/type designs for earthquake resistant construction
- -
Revise existing standards as per the present situation, develop new codes and documents/commentaries, and making these codes and documents available all over the county including on-line access to these codes
- -
Provision of adequate fire safety mechanism
Establishment of 2 fire station and 6 fire sub-stations
- -
Provided under Fire Fighting
Repairing of existing fire hydrants and construction of new fire hydrants
- -
Purchasing of fire tenders/vehicles
- -
Provision of water and sanitation facilities and awareness generation
Awareness generation for general hygiene and health to prevent any health disaster
1 No. Administrative Decision
Provision of potable drinking water to all
- - Adequate provision given under
infrastructure Provision of proper sanitation facilities to all
- -
Disaster preparedness
Prepare Town Disaster Management Plan (DMP) will be prepared across the four phases – prevention, preparation, response and recovery; and to manage all disaster events)
1 No.
The DMP shall ensure sustainability of the programme, development of training modules; manuals and codes, focused attention to awareness generation campaigns; institutionalization of disaster management authority and disaster management teams, mock-drills and establishment of
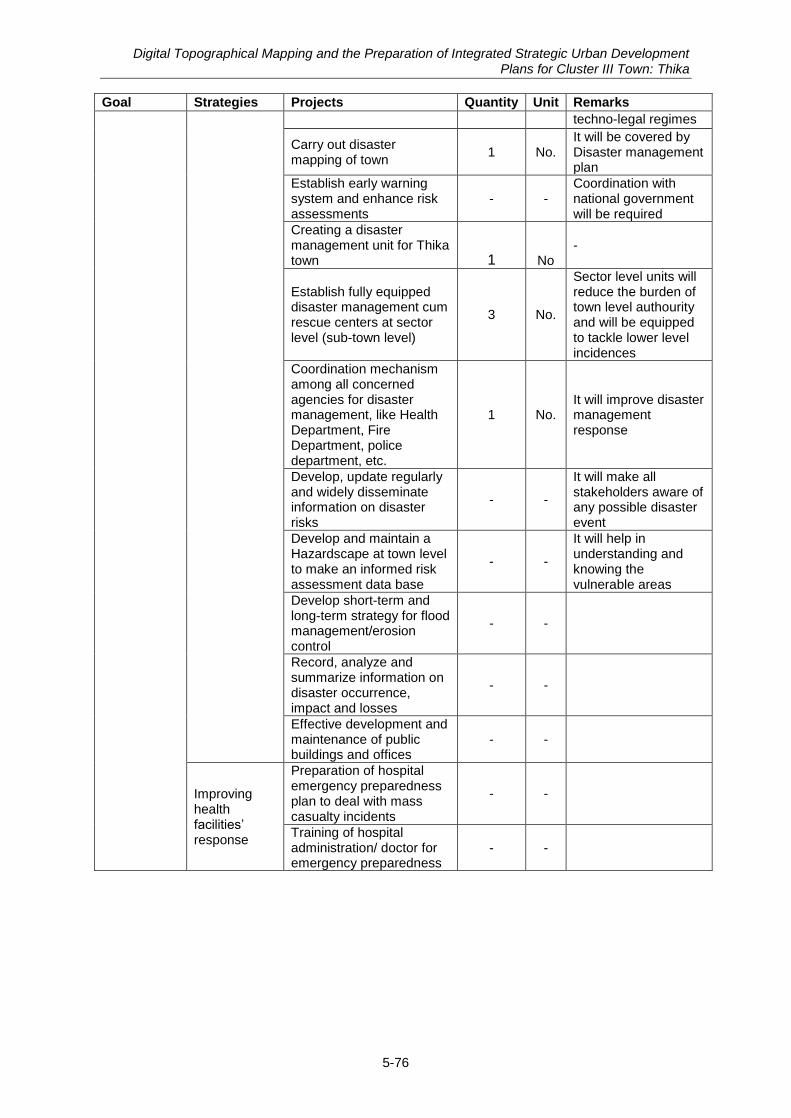
Digital Topographical Mapping and the Preparation of Integrated Strategic Urban Development Plans for Cluster III Town: Thika
5-76
Goal Strategies Projects Quantity Unit Remarks
techno-legal regimes
Carry out disaster mapping of town
1 No. It will be covered by Disaster management plan
Establish early warning system and enhance risk assessments
- - Coordination with national government will be required
Creating a disaster management unit for Thika town 1 No
-
Establish fully equipped disaster management cum rescue centers at sector level (sub-town level)
3 No.
Sector level units will reduce the burden of town level authourity and will be equipped to tackle lower level incidences
Coordination mechanism among all concerned agencies for disaster management, like Health Department, Fire Department, police department, etc.
1 No. It will improve disaster management response
Develop, update regularly and widely disseminate information on disaster risks
- -
It will make all stakeholders aware of any possible disaster event
Develop and maintain a Hazardscape at town level to make an informed risk assessment data base
- -
It will help in understanding and knowing the vulnerable areas
Develop short-term and long-term strategy for flood management/erosion control
- -
Record, analyze and summarize information on disaster occurrence, impact and losses
- -
Effective development and maintenance of public buildings and offices
- -
Improving health facilities‟ response
Preparation of hospital emergency preparedness plan to deal with mass casualty incidents
- -
Training of hospital administration/ doctor for emergency preparedness
- -
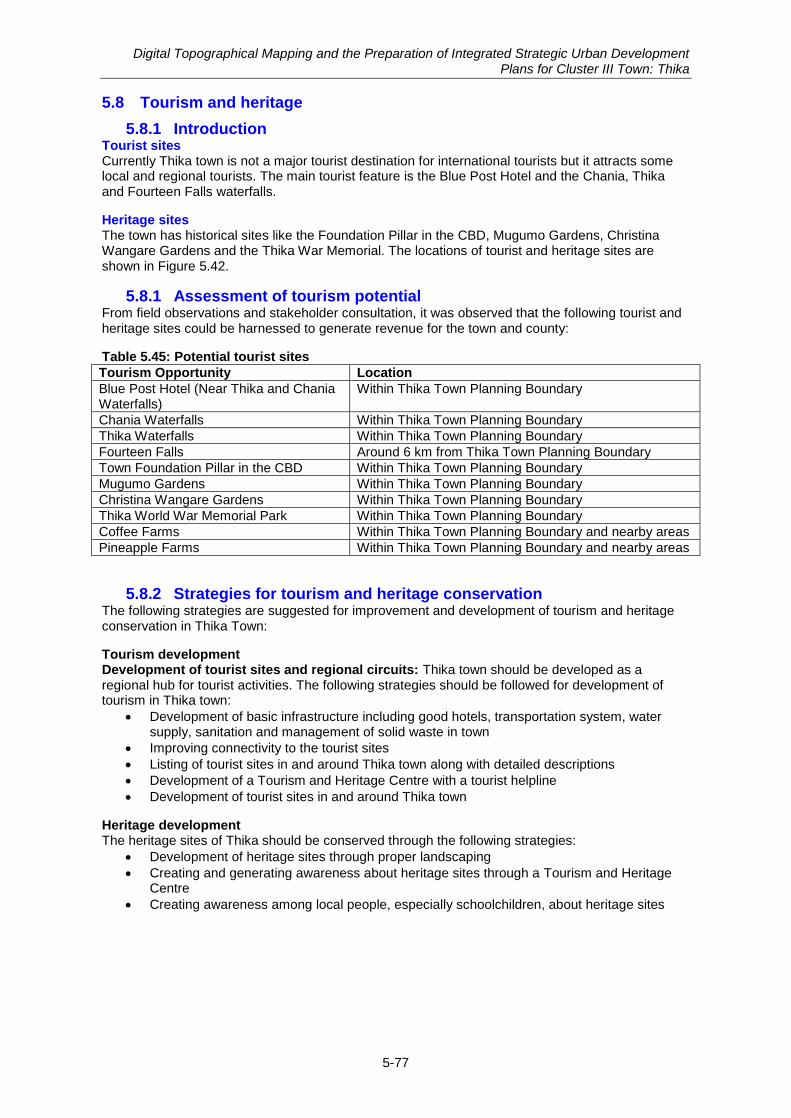
Digital Topographical Mapping and the Preparation of Integrated Strategic Urban Development Plans for Cluster III Town: Thika
5-77
5.8 Tourism and heritage
5.8.1 Introduction Tourist sites Currently Thika town is not a major tourist destination for international tourists but it attracts some local and regional tourists. The main tourist feature is the Blue Post Hotel and the Chania, Thika and Fourteen Falls waterfalls.
Heritage sites The town has historical sites like the Foundation Pillar in the CBD, Mugumo Gardens, Christina Wangare Gardens and the Thika War Memorial. The locations of tourist and heritage sites are shown in Figure 5.42.
5.8.1 Assessment of tourism potential From field observations and stakeholder consultation, it was observed that the following tourist and heritage sites could be harnessed to generate revenue for the town and county:
Table 5.45: Potential tourist sites
Tourism Opportunity Location
Blue Post Hotel (Near Thika and Chania Waterfalls)
Within Thika Town Planning Boundary
Chania Waterfalls Within Thika Town Planning Boundary
Thika Waterfalls Within Thika Town Planning Boundary
Fourteen Falls Around 6 km from Thika Town Planning Boundary
Town Foundation Pillar in the CBD Within Thika Town Planning Boundary
Mugumo Gardens Within Thika Town Planning Boundary
Christina Wangare Gardens Within Thika Town Planning Boundary
Thika World War Memorial Park Within Thika Town Planning Boundary
Coffee Farms Within Thika Town Planning Boundary and nearby areas
Pineapple Farms Within Thika Town Planning Boundary and nearby areas
5.8.2 Strategies for tourism and heritage conservation The following strategies are suggested for improvement and development of tourism and heritage conservation in Thika Town:
Tourism development Development of tourist sites and regional circuits: Thika town should be developed as a regional hub for tourist activities. The following strategies should be followed for development of tourism in Thika town:
Development of basic infrastructure including good hotels, transportation system, water supply, sanitation and management of solid waste in town
Improving connectivity to the tourist sites
Listing of tourist sites in and around Thika town along with detailed descriptions
Development of a Tourism and Heritage Centre with a tourist helpline
Development of tourist sites in and around Thika town
Heritage development The heritage sites of Thika should be conserved through the following strategies:
Development of heritage sites through proper landscaping
Creating and generating awareness about heritage sites through a Tourism and Heritage Centre
Creating awareness among local people, especially schoolchildren, about heritage sites
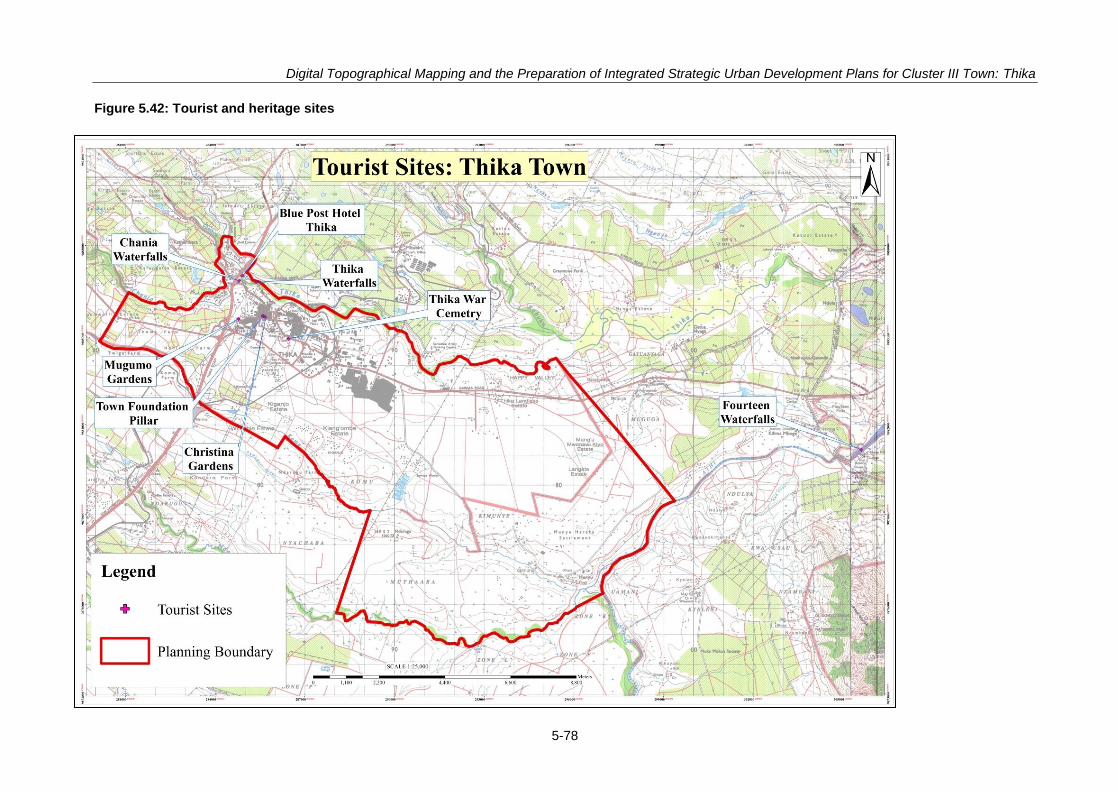
Digital Topographical Mapping and the Preparation of Integrated Strategic Urban Development Plans for Cluster III Town: Thika
5-78
Figure 5.42: Tourist and heritage sites
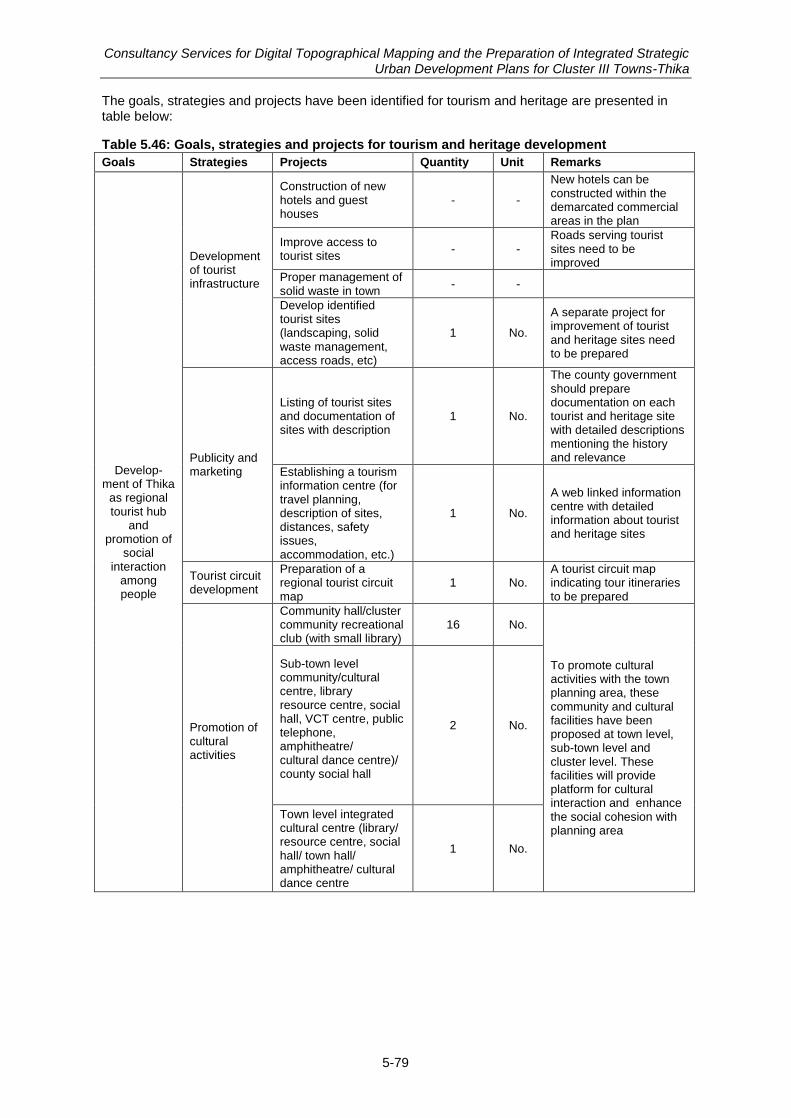
Consultancy Services for Digital Topographical Mapping and the Preparation of Integrated Strategic Urban Development Plans for Cluster III Towns-Thika
5-79
The goals, strategies and projects have been identified for tourism and heritage are presented in table below:
Table 5.46: Goals, strategies and projects for tourism and heritage development
Goals Strategies Projects Quantity Unit Remarks
Develop-ment of Thika
as regional tourist hub
and promotion of
social interaction
among people
Development of tourist infrastructure
Construction of new hotels and guest houses
- -
New hotels can be constructed within the demarcated commercial areas in the plan
Improve access to tourist sites
- - Roads serving tourist sites need to be improved
Proper management of solid waste in town
- -
Develop identified tourist sites (landscaping, solid waste management, access roads, etc)
1 No.
A separate project for improvement of tourist and heritage sites need to be prepared
Publicity and marketing
Listing of tourist sites and documentation of sites with description
1 No.
The county government should prepare documentation on each tourist and heritage site with detailed descriptions mentioning the history and relevance
Establishing a tourism information centre (for travel planning, description of sites, distances, safety issues, accommodation, etc.)
1 No.
A web linked information centre with detailed information about tourist and heritage sites
Tourist circuit development
Preparation of a regional tourist circuit map
1 No. A tourist circuit map indicating tour itineraries to be prepared
Promotion of cultural activities
Community hall/cluster community recreational club (with small library)
16 No.
To promote cultural activities with the town planning area, these community and cultural facilities have been proposed at town level, sub-town level and cluster level. These facilities will provide platform for cultural interaction and enhance the social cohesion with planning area
Sub-town level community/cultural centre, library resource centre, social hall, VCT centre, public telephone, amphitheatre/ cultural dance centre)/ county social hall
2 No.
Town level integrated cultural centre (library/ resource centre, social hall/ town hall/ amphitheatre/ cultural dance centre
1 No.
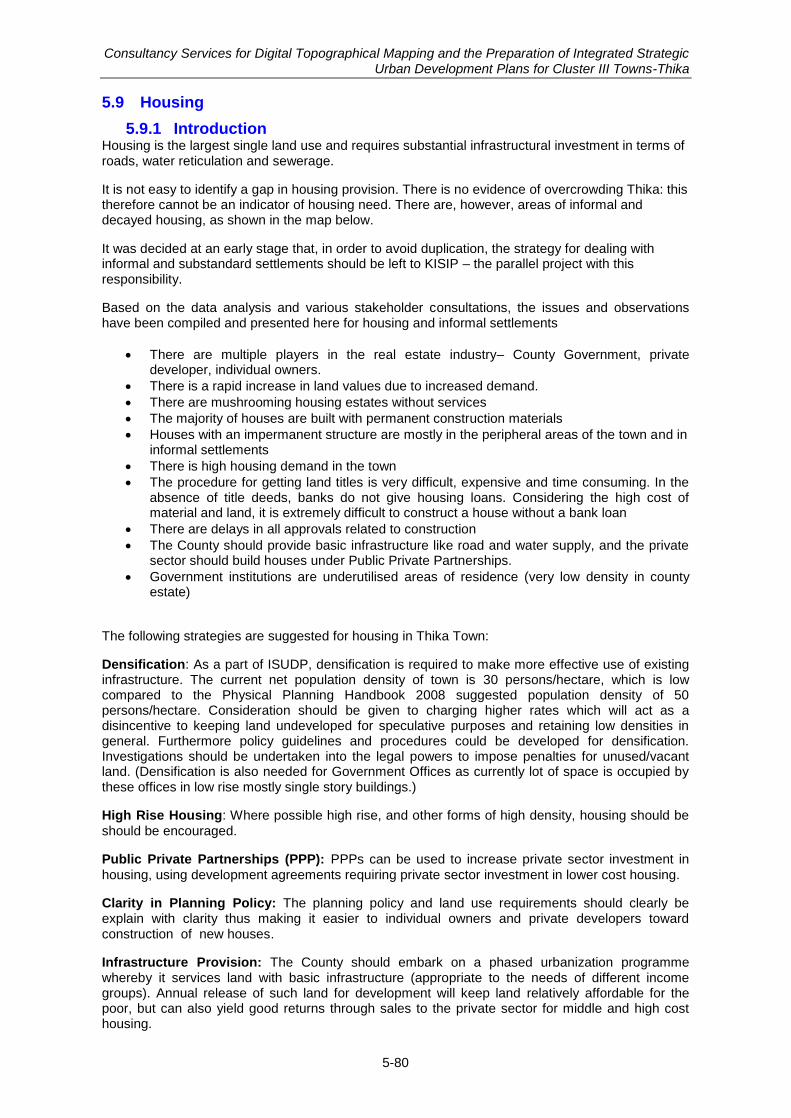
Consultancy Services for Digital Topographical Mapping and the Preparation of Integrated Strategic Urban Development Plans for Cluster III Towns-Thika
5-80
5.9 Housing
5.9.1 Introduction Housing is the largest single land use and requires substantial infrastructural investment in terms of roads, water reticulation and sewerage.
It is not easy to identify a gap in housing provision. There is no evidence of overcrowding Thika: this therefore cannot be an indicator of housing need. There are, however, areas of informal and decayed housing, as shown in the map below.
It was decided at an early stage that, in order to avoid duplication, the strategy for dealing with informal and substandard settlements should be left to KISIP – the parallel project with this responsibility.
Based on the data analysis and various stakeholder consultations, the issues and observations have been compiled and presented here for housing and informal settlements
There are multiple players in the real estate industry– County Government, private developer, individual owners.
There is a rapid increase in land values due to increased demand.
There are mushrooming housing estates without services
The majority of houses are built with permanent construction materials
Houses with an impermanent structure are mostly in the peripheral areas of the town and in informal settlements
There is high housing demand in the town
The procedure for getting land titles is very difficult, expensive and time consuming. In the absence of title deeds, banks do not give housing loans. Considering the high cost of material and land, it is extremely difficult to construct a house without a bank loan
There are delays in all approvals related to construction
The County should provide basic infrastructure like road and water supply, and the private sector should build houses under Public Private Partnerships.
Government institutions are underutilised areas of residence (very low density in county estate)
The following strategies are suggested for housing in Thika Town:
Densification: As a part of ISUDP, densification is required to make more effective use of existing infrastructure. The current net population density of town is 30 persons/hectare, which is low compared to the Physical Planning Handbook 2008 suggested population density of 50 persons/hectare. Consideration should be given to charging higher rates which will act as a disincentive to keeping land undeveloped for speculative purposes and retaining low densities in general. Furthermore policy guidelines and procedures could be developed for densification. Investigations should be undertaken into the legal powers to impose penalties for unused/vacant land. (Densification is also needed for Government Offices as currently lot of space is occupied by these offices in low rise mostly single story buildings.)
High Rise Housing: Where possible high rise, and other forms of high density, housing should be
should be encouraged.
Public Private Partnerships (PPP): PPPs can be used to increase private sector investment in
housing, using development agreements requiring private sector investment in lower cost housing.
Clarity in Planning Policy: The planning policy and land use requirements should clearly be explain with clarity thus making it easier to individual owners and private developers toward construction of new houses.
Infrastructure Provision: The County should embark on a phased urbanization programme whereby it services land with basic infrastructure (appropriate to the needs of different income groups). Annual release of such land for development will keep land relatively affordable for the poor, but can also yield good returns through sales to the private sector for middle and high cost housing.
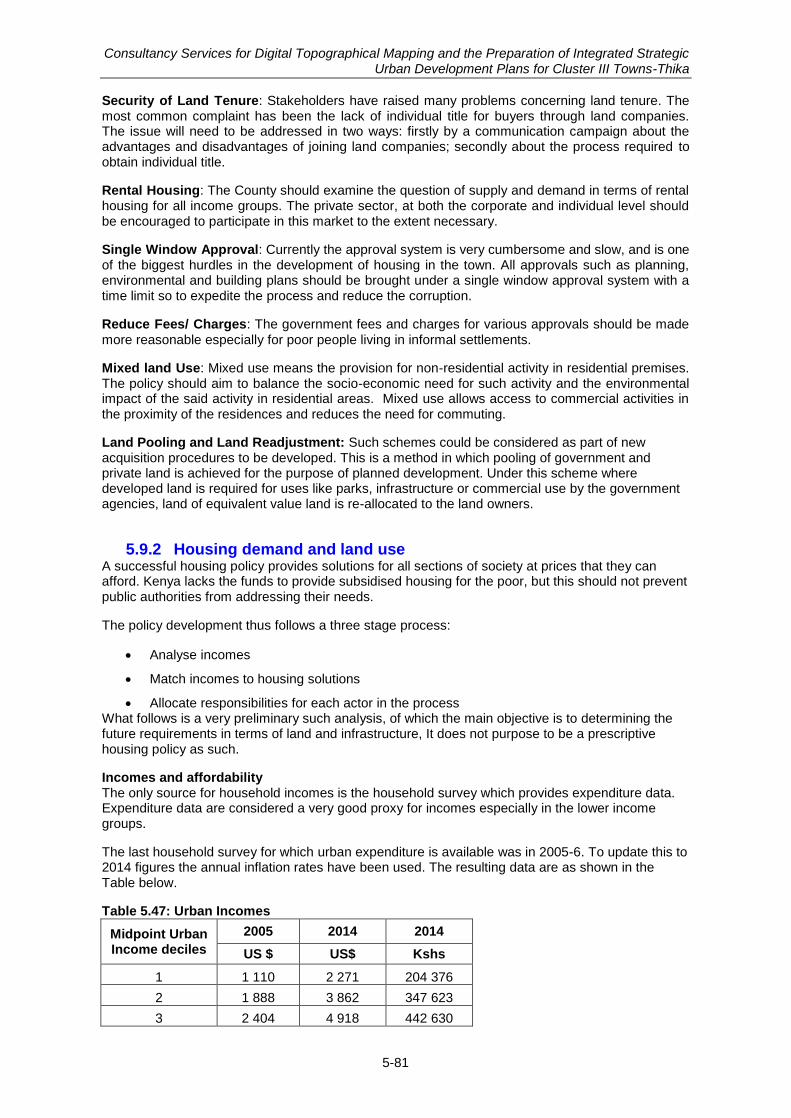
Consultancy Services for Digital Topographical Mapping and the Preparation of Integrated Strategic Urban Development Plans for Cluster III Towns-Thika
5-81
Security of Land Tenure: Stakeholders have raised many problems concerning land tenure. The most common complaint has been the lack of individual title for buyers through land companies. The issue will need to be addressed in two ways: firstly by a communication campaign about the advantages and disadvantages of joining land companies; secondly about the process required to obtain individual title.
Rental Housing: The County should examine the question of supply and demand in terms of rental housing for all income groups. The private sector, at both the corporate and individual level should be encouraged to participate in this market to the extent necessary.
Single Window Approval: Currently the approval system is very cumbersome and slow, and is one of the biggest hurdles in the development of housing in the town. All approvals such as planning, environmental and building plans should be brought under a single window approval system with a time limit so to expedite the process and reduce the corruption.
Reduce Fees/ Charges: The government fees and charges for various approvals should be made
more reasonable especially for poor people living in informal settlements.
Mixed land Use: Mixed use means the provision for non-residential activity in residential premises. The policy should aim to balance the socio-economic need for such activity and the environmental impact of the said activity in residential areas. Mixed use allows access to commercial activities in the proximity of the residences and reduces the need for commuting.
Land Pooling and Land Readjustment: Such schemes could be considered as part of new acquisition procedures to be developed. This is a method in which pooling of government and private land is achieved for the purpose of planned development. Under this scheme where developed land is required for uses like parks, infrastructure or commercial use by the government agencies, land of equivalent value land is re-allocated to the land owners.
5.9.2 Housing demand and land use A successful housing policy provides solutions for all sections of society at prices that they can afford. Kenya lacks the funds to provide subsidised housing for the poor, but this should not prevent public authorities from addressing their needs.
The policy development thus follows a three stage process:
Analyse incomes
Match incomes to housing solutions
Allocate responsibilities for each actor in the process What follows is a very preliminary such analysis, of which the main objective is to determining the future requirements in terms of land and infrastructure, It does not purpose to be a prescriptive housing policy as such.
Incomes and affordability The only source for household incomes is the household survey which provides expenditure data. Expenditure data are considered a very good proxy for incomes especially in the lower income groups.
The last household survey for which urban expenditure is available was in 2005-6. To update this to 2014 figures the annual inflation rates have been used. The resulting data are as shown in the Table below.
Table 5.47: Urban Incomes
Midpoint Urban Income deciles
2005 2014 2014
US $ US$ Kshs
1 1 110 2 271 204 376
2 1 888 3 862 347 623
3 2 404 4 918 442 630
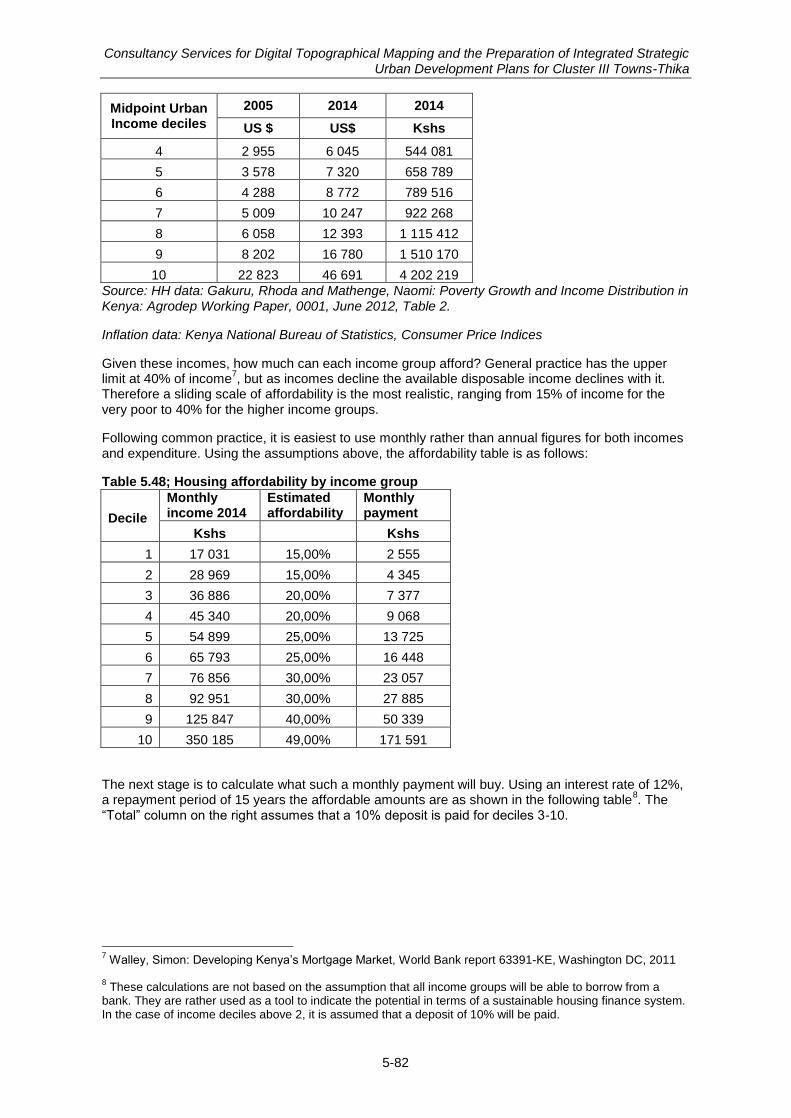
Consultancy Services for Digital Topographical Mapping and the Preparation of Integrated Strategic Urban Development Plans for Cluster III Towns-Thika
5-82
Midpoint Urban Income deciles
2005 2014 2014
US $ US$ Kshs
4 2 955 6 045 544 081
5 3 578 7 320 658 789
6 4 288 8 772 789 516
7 5 009 10 247 922 268
8 6 058 12 393 1 115 412
9 8 202 16 780 1 510 170
10 22 823 46 691 4 202 219
Source: HH data: Gakuru, Rhoda and Mathenge, Naomi: Poverty Growth and Income Distribution in Kenya: Agrodep Working Paper, 0001, June 2012, Table 2.
Inflation data: Kenya National Bureau of Statistics, Consumer Price Indices
Given these incomes, how much can each income group afford? General practice has the upper limit at 40% of income
7, but as incomes decline the available disposable income declines with it.
Therefore a sliding scale of affordability is the most realistic, ranging from 15% of income for the very poor to 40% for the higher income groups.
Following common practice, it is easiest to use monthly rather than annual figures for both incomes and expenditure. Using the assumptions above, the affordability table is as follows:
Table 5.48; Housing affordability by income group
Decile
Monthly income 2014
Estimated affordability
Monthly payment
Kshs
Kshs
1 17 031 15,00% 2 555
2 28 969 15,00% 4 345
3 36 886 20,00% 7 377
4 45 340 20,00% 9 068
5 54 899 25,00% 13 725
6 65 793 25,00% 16 448
7 76 856 30,00% 23 057
8 92 951 30,00% 27 885
9 125 847 40,00% 50 339
10 350 185 49,00% 171 591
The next stage is to calculate what such a monthly payment will buy. Using an interest rate of 12%, a repayment period of 15 years the affordable amounts are as shown in the following table
8. The
“Total” column on the right assumes that a 10% deposit is paid for deciles 3-10.
7 Walley, Simon: Developing Kenya‟s Mortgage Market, World Bank report 63391-KE, Washington DC, 2011
8 These calculations are not based on the assumption that all income groups will be able to borrow from a
bank. They are rather used as a tool to indicate the potential in terms of a sustainable housing finance system. In the case of income deciles above 2, it is assumed that a deposit of 10% will be paid.
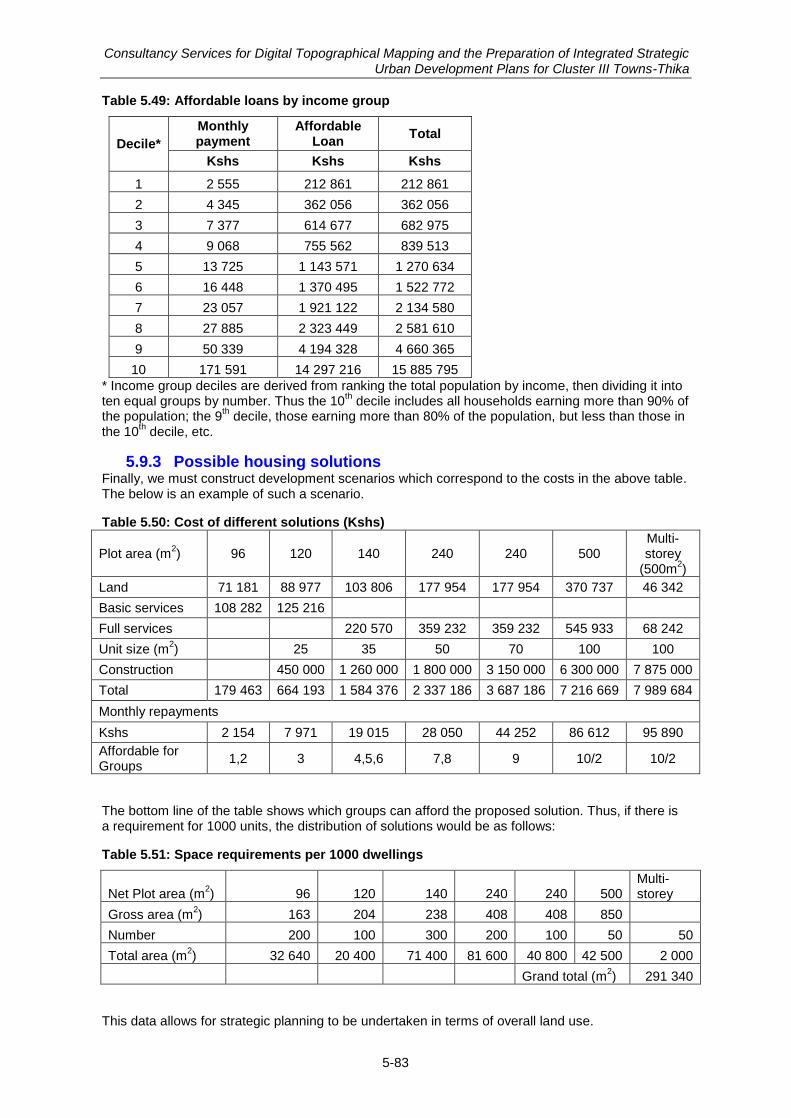
Consultancy Services for Digital Topographical Mapping and the Preparation of Integrated Strategic Urban Development Plans for Cluster III Towns-Thika
5-83
Table 5.49: Affordable loans by income group
Decile*
Monthly payment
Affordable Loan
Total
Kshs Kshs Kshs
1 2 555 212 861 212 861
2 4 345 362 056 362 056
3 7 377 614 677 682 975
4 9 068 755 562 839 513
5 13 725 1 143 571 1 270 634
6 16 448 1 370 495 1 522 772
7 23 057 1 921 122 2 134 580
8 27 885 2 323 449 2 581 610
9 50 339 4 194 328 4 660 365
10 171 591 14 297 216 15 885 795
* Income group deciles are derived from ranking the total population by income, then dividing it into ten equal groups by number. Thus the 10
th decile includes all households earning more than 90% of
the population; the 9th decile, those earning more than 80% of the population, but less than those in
the 10th decile, etc.
5.9.3 Possible housing solutions Finally, we must construct development scenarios which correspond to the costs in the above table. The below is an example of such a scenario.
Table 5.50: Cost of different solutions (Kshs)
Plot area (m2) 96 120 140 240 240 500
Multi-storey
(500m2)
Land 71 181 88 977 103 806 177 954 177 954 370 737 46 342
Basic services 108 282 125 216
Full services 220 570 359 232 359 232 545 933 68 242
Unit size (m2)
25 35 50 70 100 100
Construction
450 000 1 260 000 1 800 000 3 150 000 6 300 000 7 875 000
Total 179 463 664 193 1 584 376 2 337 186 3 687 186 7 216 669 7 989 684
Monthly repayments
Kshs 2 154 7 971 19 015 28 050 44 252 86 612 95 890
Affordable for Groups
1,2 3 4,5,6 7,8 9 10/2 10/2
The bottom line of the table shows which groups can afford the proposed solution. Thus, if there is a requirement for 1000 units, the distribution of solutions would be as follows:
Table 5.51: Space requirements per 1000 dwellings
Net Plot area (m2) 96 120 140 240 240 500
Multi-storey
Gross area (m2) 163 204 238 408 408 850
Number 200 100 300 200 100 50 50
Total area (m2) 32 640 20 400 71 400 81 600 40 800 42 500 2 000
Grand total (m2) 291 340
This data allows for strategic planning to be undertaken in terms of overall land use.
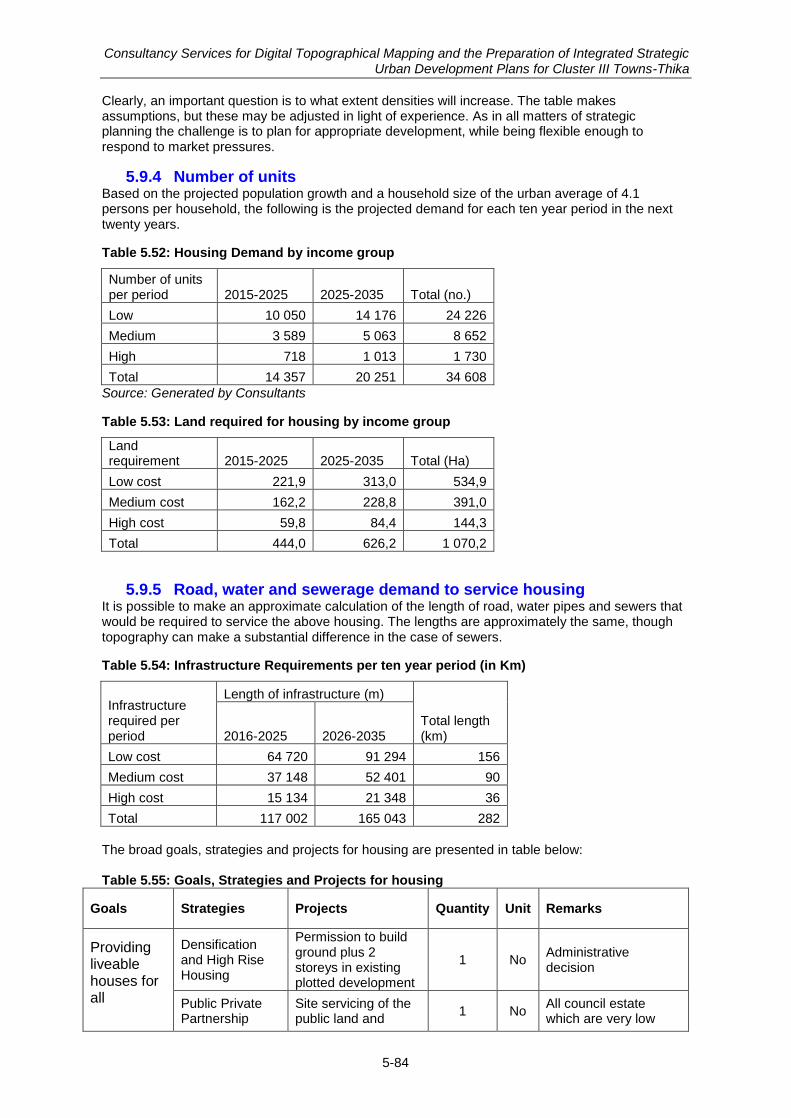
Consultancy Services for Digital Topographical Mapping and the Preparation of Integrated Strategic Urban Development Plans for Cluster III Towns-Thika
5-84
Clearly, an important question is to what extent densities will increase. The table makes assumptions, but these may be adjusted in light of experience. As in all matters of strategic planning the challenge is to plan for appropriate development, while being flexible enough to respond to market pressures.
5.9.4 Number of units Based on the projected population growth and a household size of the urban average of 4.1 persons per household, the following is the projected demand for each ten year period in the next twenty years.
Table 5.52: Housing Demand by income group
Number of units per period 2015-2025 2025-2035 Total (no.)
Low 10 050 14 176 24 226
Medium 3 589 5 063 8 652
High 718 1 013 1 730
Total 14 357 20 251 34 608
Source: Generated by Consultants
Table 5.53: Land required for housing by income group
Land requirement 2015-2025 2025-2035 Total (Ha)
Low cost 221,9 313,0 534,9
Medium cost 162,2 228,8 391,0
High cost 59,8 84,4 144,3
Total 444,0 626,2 1 070,2
5.9.5 Road, water and sewerage demand to service housing It is possible to make an approximate calculation of the length of road, water pipes and sewers that would be required to service the above housing. The lengths are approximately the same, though topography can make a substantial difference in the case of sewers.
Table 5.54: Infrastructure Requirements per ten year period (in Km)
Infrastructure required per period
Length of infrastructure (m)
Total length (km) 2016-2025 2026-2035
Low cost 64 720 91 294 156
Medium cost 37 148 52 401 90
High cost 15 134 21 348 36
Total 117 002 165 043 282
The broad goals, strategies and projects for housing are presented in table below: Table 5.55: Goals, Strategies and Projects for housing
Goals Strategies Projects Quantity Unit Remarks
Providing liveable houses for all
Densification and High Rise Housing
Permission to build ground plus 2 storeys in existing plotted development
1 No Administrative decision
Public Private Partnership
Site servicing of the public land and
1 No All council estate which are very low
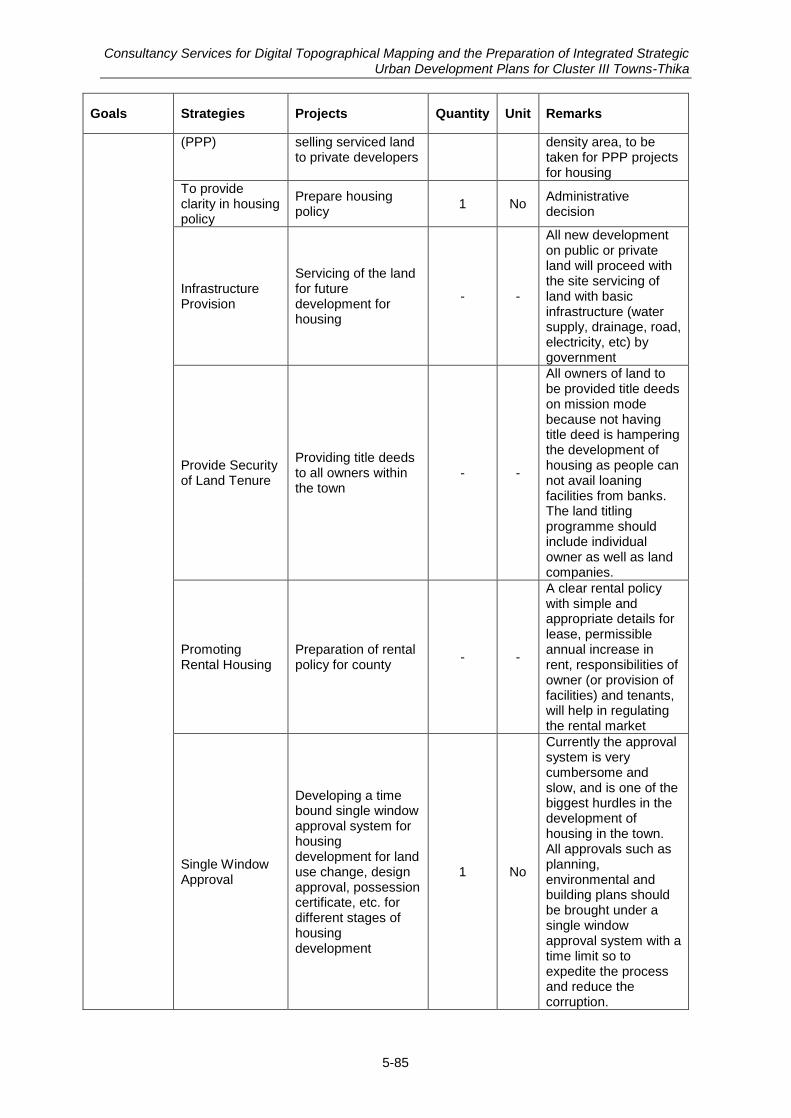
Consultancy Services for Digital Topographical Mapping and the Preparation of Integrated Strategic Urban Development Plans for Cluster III Towns-Thika
5-85
Goals Strategies Projects Quantity Unit Remarks
(PPP) selling serviced land to private developers
density area, to be taken for PPP projects for housing
To provide clarity in housing policy
Prepare housing policy
1 No Administrative decision
Infrastructure Provision
Servicing of the land for future development for housing
- -
All new development on public or private land will proceed with the site servicing of land with basic infrastructure (water supply, drainage, road, electricity, etc) by government
Provide Security of Land Tenure
Providing title deeds to all owners within the town
- -
All owners of land to be provided title deeds on mission mode because not having title deed is hampering the development of housing as people can not avail loaning facilities from banks. The land titling programme should include individual owner as well as land companies.
Promoting Rental Housing
Preparation of rental policy for county
- -
A clear rental policy with simple and appropriate details for lease, permissible annual increase in rent, responsibilities of owner (or provision of facilities) and tenants, will help in regulating the rental market
Single Window Approval
Developing a time bound single window approval system for housing development for land use change, design approval, possession certificate, etc. for different stages of housing development
1 No
Currently the approval system is very cumbersome and slow, and is one of the biggest hurdles in the development of housing in the town. All approvals such as planning, environmental and building plans should be brought under a single window approval system with a time limit so to expedite the process and reduce the corruption.
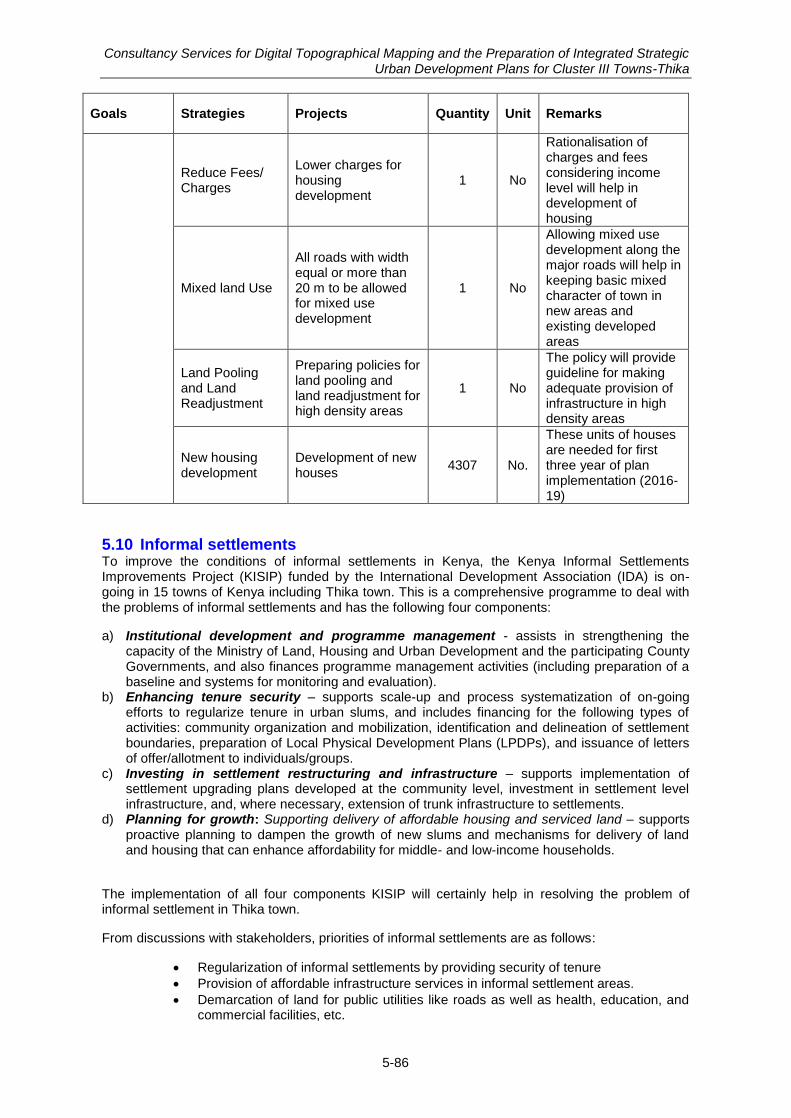
Consultancy Services for Digital Topographical Mapping and the Preparation of Integrated Strategic Urban Development Plans for Cluster III Towns-Thika
5-86
Goals Strategies Projects Quantity Unit Remarks
Reduce Fees/ Charges
Lower charges for housing development
1 No
Rationalisation of charges and fees considering income level will help in development of housing
Mixed land Use
All roads with width equal or more than 20 m to be allowed for mixed use development
1 No
Allowing mixed use development along the major roads will help in keeping basic mixed character of town in new areas and existing developed areas
Land Pooling and Land Readjustment
Preparing policies for land pooling and land readjustment for high density areas
1 No
The policy will provide guideline for making adequate provision of infrastructure in high density areas
New housing development
Development of new houses
4307 No.
These units of houses are needed for first three year of plan implementation (2016-19)
5.10 Informal settlements To improve the conditions of informal settlements in Kenya, the Kenya Informal Settlements Improvements Project (KISIP) funded by the International Development Association (IDA) is on-going in 15 towns of Kenya including Thika town. This is a comprehensive programme to deal with the problems of informal settlements and has the following four components:
a) Institutional development and programme management - assists in strengthening the capacity of the Ministry of Land, Housing and Urban Development and the participating County Governments, and also finances programme management activities (including preparation of a baseline and systems for monitoring and evaluation).
b) Enhancing tenure security – supports scale-up and process systematization of on-going efforts to regularize tenure in urban slums, and includes financing for the following types of activities: community organization and mobilization, identification and delineation of settlement boundaries, preparation of Local Physical Development Plans (LPDPs), and issuance of letters of offer/allotment to individuals/groups.
c) Investing in settlement restructuring and infrastructure – supports implementation of settlement upgrading plans developed at the community level, investment in settlement level infrastructure, and, where necessary, extension of trunk infrastructure to settlements.
d) Planning for growth: Supporting delivery of affordable housing and serviced land – supports proactive planning to dampen the growth of new slums and mechanisms for delivery of land and housing that can enhance affordability for middle- and low-income households.
The implementation of all four components KISIP will certainly help in resolving the problem of informal settlement in Thika town.
From discussions with stakeholders, priorities of informal settlements are as follows:
Regularization of informal settlements by providing security of tenure
Provision of affordable infrastructure services in informal settlement areas.
Demarcation of land for public utilities like roads as well as health, education, and commercial facilities, etc.

Consultancy Services for Digital Topographical Mapping and the Preparation of Integrated Strategic Urban Development Plans for Cluster III Towns-Thika
5-87
Land pooling for infrastructure and services in a transparent manner. The land taken from individual occupants should be readjusted from remaining occupants.
Relaxed building byelaws for informal settlements. Since the land is not sufficient for expansion of houses and for community facilities, the minimum requirements of byelaws should be relaxed to suit the existing realities.
A suitable financing system should be developed for the needs of low-income households. Lots of people living in informal settlement, who are poor, are currently dependent upon the informal system of SACCOs (Savings and Credit Cooperative Organization). A formal finance system considering the needs of poor people with minimum interest rates and formalities is needed to help the poor in long run. Two solutions that have worked elsewhere are Housing Cooperatives or housing associations, which receive government technical assistance and (usually) loan funds for project preparation; and government guaranteed mortgages which will encourage banks to go down-market.
The table below presents the goal, strategies and project for informal settlement of Thika. Table 5.56: Goals, Strategies and Projects for informal settlements
Goals Strategies Projects Quantity Unit Remarks9
Formalising the informal settlement with provision of infrastructure and services
Formalisation of informal settlement Areas
Notification for formalisation of all informal settlements
- -
Policy decision. All informal settlements to be notified as formal
To ascertain the land and people
Conduct land and household surveys
- -
The survey will ascertain the amount of land available and numbers of people living in that area
Conduct land sub-division and entitling
Providing title deed as per land subdivision
- -
After keeping land for common facilities, land will be allotted to individual household
Providing infrastructure facilities
Demarcation of land for common facilities and provision of basic infrastructure facilities s
- -
The settlement will be provided with all basic infrastructure by linking with main town trunk infrastructure
5.11 Institutional set-up Based on the status and SWOT assessments and views of the stakeholders expressed during various consultations including workshops, development strategies and projects have been developed to achieve the sectoral goals and town‟s vision. The development strategies and projects have been identified considering the existing gap and projected demand. The goals, development strategies and project for institutional set-up are presented in the table below:
9 KISIP is dealing separately with informal settlements with four components viz. Institutional
development and programme management, Enhancing tenure security, Investing in settlement restructuring and infrastructure and Planning for growth
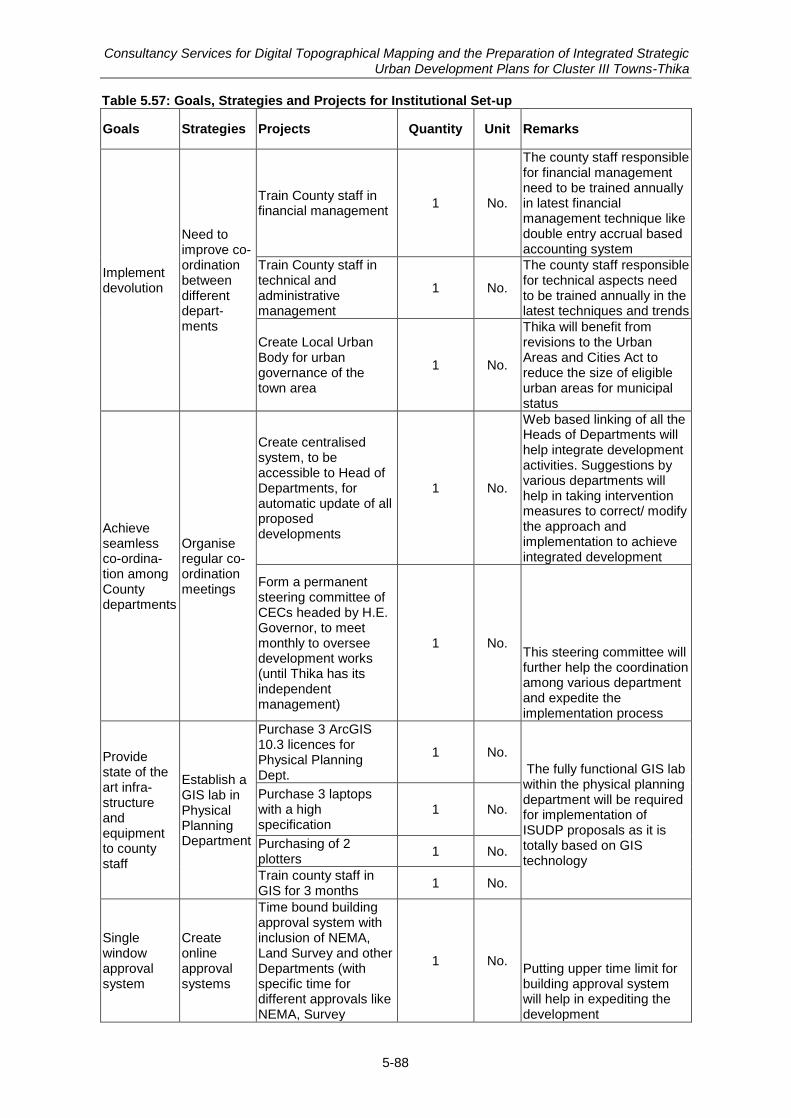
Consultancy Services for Digital Topographical Mapping and the Preparation of Integrated Strategic Urban Development Plans for Cluster III Towns-Thika
5-88
Table 5.57: Goals, Strategies and Projects for Institutional Set-up
Goals Strategies Projects Quantity Unit Remarks
Implement devolution
Need to improve co-ordination between different depart-ments
Train County staff in financial management
1 No.
The county staff responsible for financial management need to be trained annually in latest financial management technique like double entry accrual based accounting system
Train County staff in technical and administrative management
1 No.
The county staff responsible for technical aspects need to be trained annually in the latest techniques and trends
Create Local Urban Body for urban governance of the town area
1 No.
Thika will benefit from revisions to the Urban Areas and Cities Act to reduce the size of eligible urban areas for municipal status
Achieve seamless co-ordina-tion among County departments
Organise regular co-ordination meetings
Create centralised system, to be accessible to Head of Departments, for automatic update of all proposed developments
1 No.
Web based linking of all the Heads of Departments will help integrate development activities. Suggestions by various departments will help in taking intervention measures to correct/ modify the approach and implementation to achieve integrated development
Form a permanent steering committee of CECs headed by H.E. Governor, to meet monthly to oversee development works (until Thika has its independent management)
1 No. This steering committee will further help the coordination among various department and expedite the implementation process
Provide state of the art infra-structure and equipment to county staff
Establish a GIS lab in Physical Planning Department
Purchase 3 ArcGIS 10.3 licences for Physical Planning Dept.
1 No.
The fully functional GIS lab within the physical planning department will be required for implementation of ISUDP proposals as it is totally based on GIS technology
Purchase 3 laptops with a high specification
1 No.
Purchasing of 2 plotters
1 No.
Train county staff in GIS for 3 months
1 No.
Single window approval system
Create online approval systems
Time bound building approval system with inclusion of NEMA, Land Survey and other Departments (with specific time for different approvals like NEMA, Survey
1 No. Putting upper time limit for building approval system will help in expediting the development
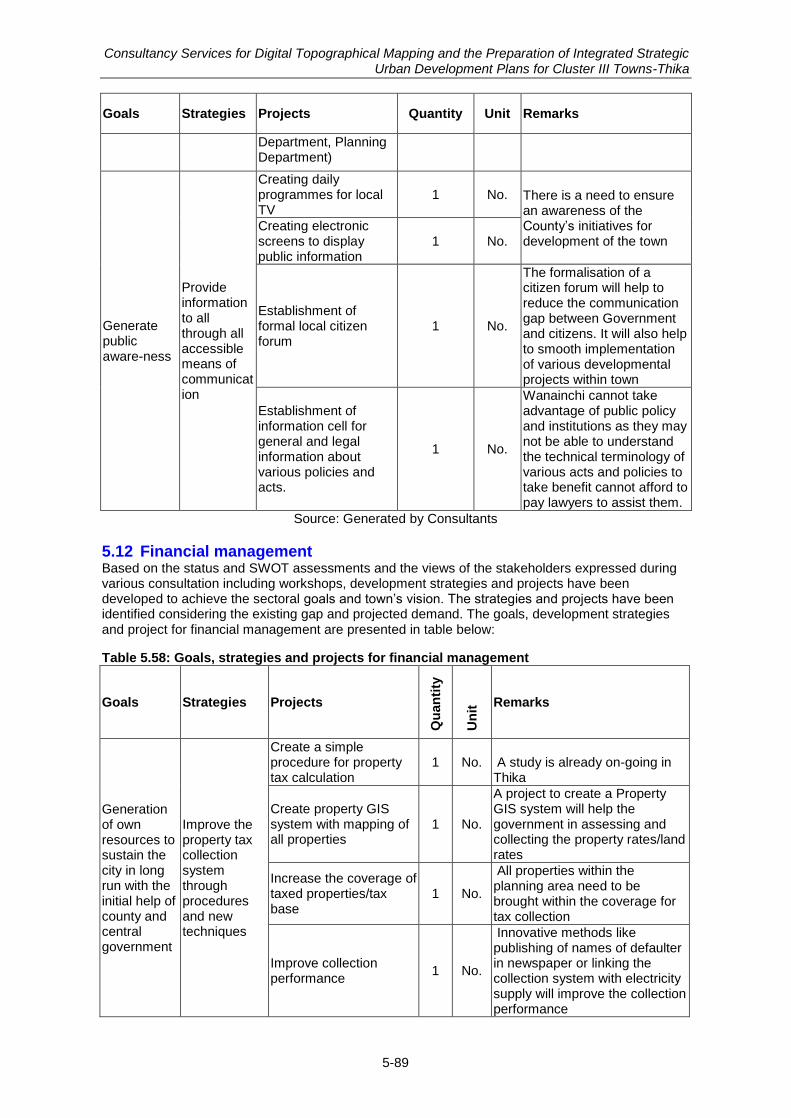
Consultancy Services for Digital Topographical Mapping and the Preparation of Integrated Strategic Urban Development Plans for Cluster III Towns-Thika
5-89
Goals Strategies Projects Quantity Unit Remarks
Department, Planning Department)
Generate public aware-ness
Provide information to all through all accessible means of communication
Creating daily programmes for local TV
1 No. There is a need to ensure an awareness of the County‟s initiatives for development of the town
Creating electronic screens to display public information
1 No.
Establishment of formal local citizen forum
1 No.
The formalisation of a citizen forum will help to reduce the communication gap between Government and citizens. It will also help to smooth implementation of various developmental projects within town
Establishment of information cell for general and legal information about various policies and acts.
1 No.
Wanainchi cannot take advantage of public policy and institutions as they may not be able to understand the technical terminology of various acts and policies to take benefit cannot afford to pay lawyers to assist them.
Source: Generated by Consultants
5.12 Financial management Based on the status and SWOT assessments and the views of the stakeholders expressed during various consultation including workshops, development strategies and projects have been developed to achieve the sectoral goals and town‟s vision. The strategies and projects have been identified considering the existing gap and projected demand. The goals, development strategies and project for financial management are presented in table below:
Table 5.58: Goals, strategies and projects for financial management
Goals Strategies Projects
Qu
an
tity
Un
it Remarks
Generation of own resources to sustain the city in long run with the initial help of county and central government
Improve the property tax collection system through procedures and new techniques
Create a simple procedure for property tax calculation
1 No. A study is already on-going in Thika
Create property GIS system with mapping of all properties
1 No.
A project to create a Property GIS system will help the government in assessing and collecting the property rates/land rates
Increase the coverage of taxed properties/tax base
1 No.
All properties within the planning area need to be brought within the coverage for tax collection
Improve collection performance
1 No.
Innovative methods like publishing of names of defaulter in newspaper or linking the collection system with electricity supply will improve the collection performance
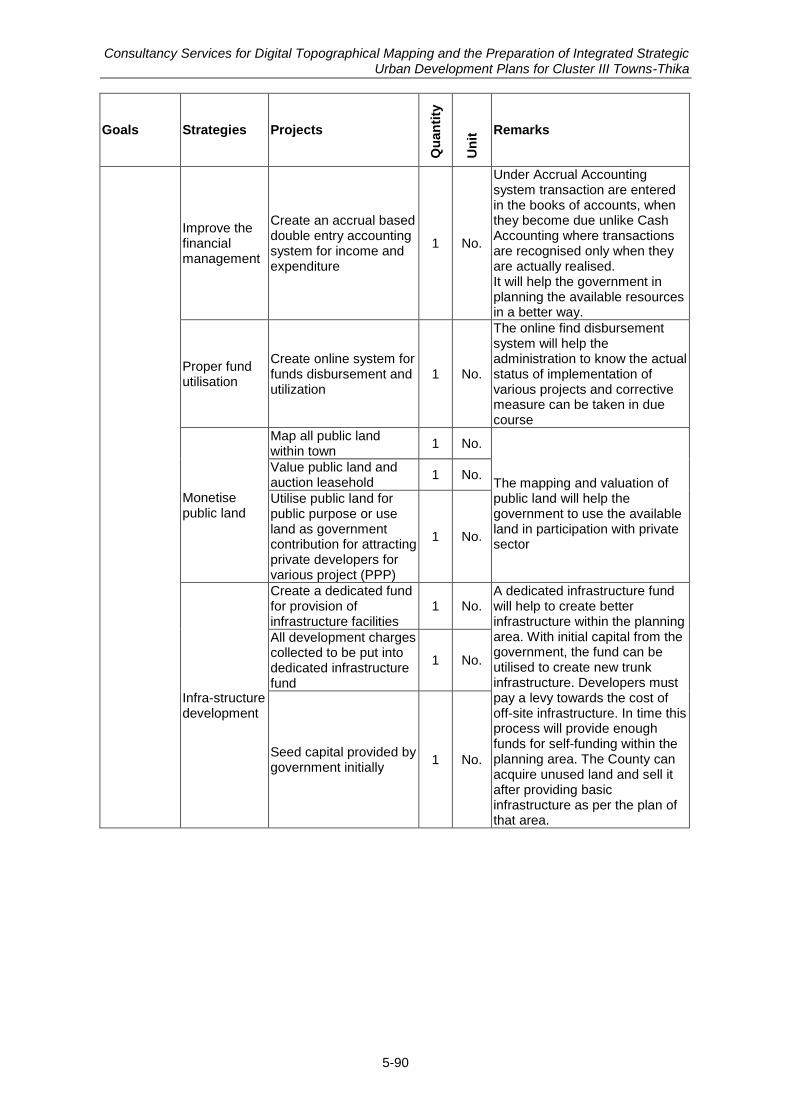
Consultancy Services for Digital Topographical Mapping and the Preparation of Integrated Strategic Urban Development Plans for Cluster III Towns-Thika
5-90
Goals Strategies Projects
Qu
an
tity
Un
it Remarks
Improve the financial management
Create an accrual based double entry accounting system for income and expenditure
1 No.
Under Accrual Accounting system transaction are entered in the books of accounts, when they become due unlike Cash Accounting where transactions are recognised only when they are actually realised. It will help the government in planning the available resources in a better way.
Proper fund utilisation
Create online system for funds disbursement and utilization
1 No.
The online find disbursement system will help the administration to know the actual status of implementation of various projects and corrective measure can be taken in due course
Monetise public land
Map all public land within town
1 No.
The mapping and valuation of public land will help the government to use the available land in participation with private sector
Value public land and auction leasehold
1 No.
Utilise public land for public purpose or use land as government contribution for attracting private developers for various project (PPP)
1 No.
Infra-structure development
Create a dedicated fund for provision of infrastructure facilities
1 No. A dedicated infrastructure fund will help to create better infrastructure within the planning area. With initial capital from the government, the fund can be utilised to create new trunk infrastructure. Developers must pay a levy towards the cost of off-site infrastructure. In time this process will provide enough funds for self-funding within the planning area. The County can acquire unused land and sell it after providing basic infrastructure as per the plan of that area.
All development charges collected to be put into dedicated infrastructure fund
1 No.
Seed capital provided by government initially
1 No.
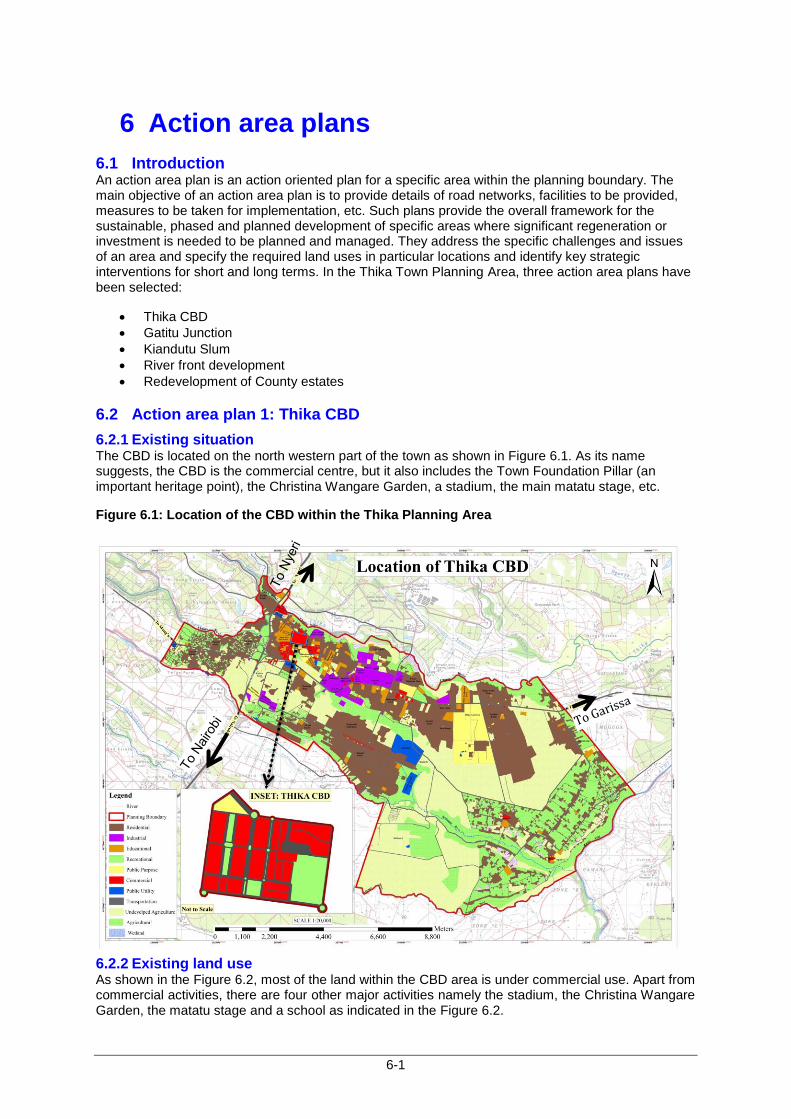
Digital Topographical Mapping and the Preparation of Integrated Strategic Urban Development Plans for Cluster III Town: Thika
6-1
6 Action area plans
6.1 Introduction An action area plan is an action oriented plan for a specific area within the planning boundary. The main objective of an action area plan is to provide details of road networks, facilities to be provided, measures to be taken for implementation, etc. Such plans provide the overall framework for the sustainable, phased and planned development of specific areas where significant regeneration or investment is needed to be planned and managed. They address the specific challenges and issues of an area and specify the required land uses in particular locations and identify key strategic interventions for short and long terms. In the Thika Town Planning Area, three action area plans have been selected:
Thika CBD
Gatitu Junction
Kiandutu Slum
River front development
Redevelopment of County estates
6.2 Action area plan 1: Thika CBD
6.2.1 Existing situation The CBD is located on the north western part of the town as shown in Figure 6.1. As its name suggests, the CBD is the commercial centre, but it also includes the Town Foundation Pillar (an important heritage point), the Christina Wangare Garden, a stadium, the main matatu stage, etc.
Figure 6.1: Location of the CBD within the Thika Planning Area
6.2.2 Existing land use As shown in the Figure 6.2, most of the land within the CBD area is under commercial use. Apart from commercial activities, there are four other major activities namely the stadium, the Christina Wangare Garden, the matatu stage and a school as indicated in the Figure 6.2.
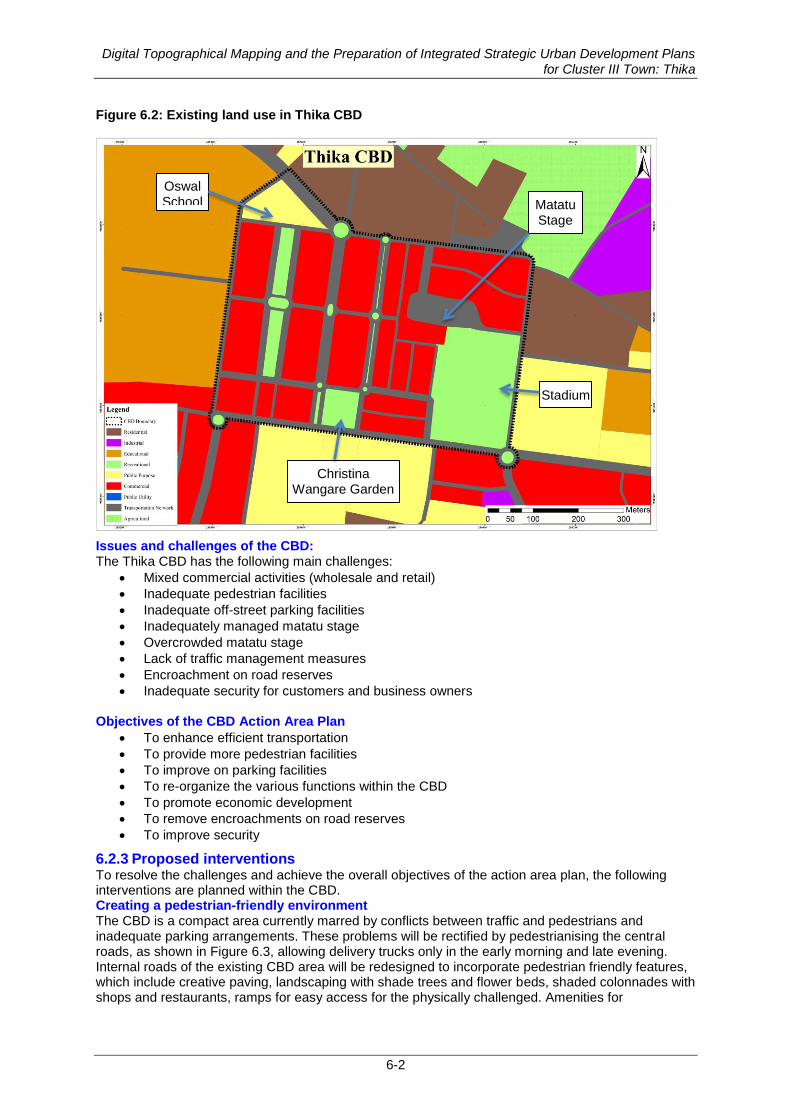
Digital Topographical Mapping and the Preparation of Integrated Strategic Urban Development Plans for Cluster III Town: Thika
6-2
Figure 6.2: Existing land use in Thika CBD
Issues and challenges of the CBD: The Thika CBD has the following main challenges:
Mixed commercial activities (wholesale and retail)
Inadequate pedestrian facilities
Inadequate off-street parking facilities
Inadequately managed matatu stage
Overcrowded matatu stage
Lack of traffic management measures
Encroachment on road reserves
Inadequate security for customers and business owners
Objectives of the CBD Action Area Plan
To enhance efficient transportation
To provide more pedestrian facilities
To improve on parking facilities
To re-organize the various functions within the CBD
To promote economic development
To remove encroachments on road reserves
To improve security
6.2.3 Proposed interventions To resolve the challenges and achieve the overall objectives of the action area plan, the following interventions are planned within the CBD. Creating a pedestrian-friendly environment The CBD is a compact area currently marred by conflicts between traffic and pedestrians and inadequate parking arrangements. These problems will be rectified by pedestrianising the central roads, as shown in Figure 6.3, allowing delivery trucks only in the early morning and late evening. Internal roads of the existing CBD area will be redesigned to incorporate pedestrian friendly features, which include creative paving, landscaping with shade trees and flower beds, shaded colonnades with shops and restaurants, ramps for easy access for the physically challenged. Amenities for
Stadium
Oswal School
Christina Wangare Garden
Matatu Stage
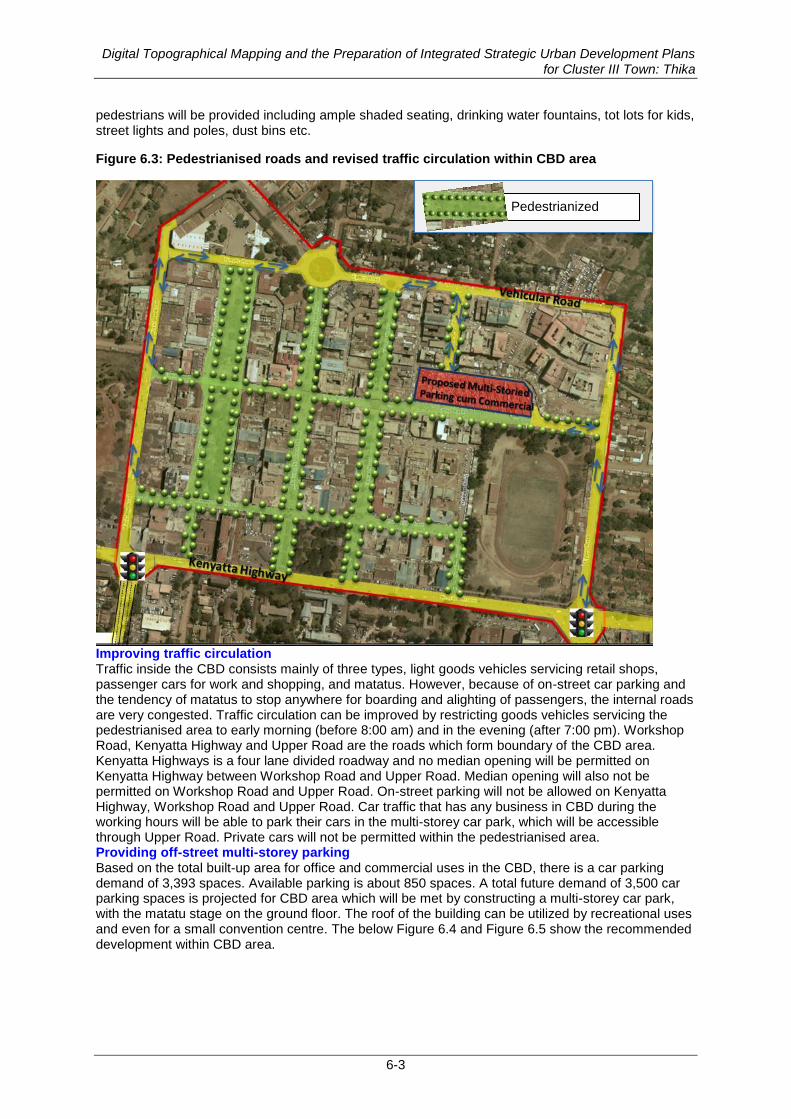
Digital Topographical Mapping and the Preparation of Integrated Strategic Urban Development Plans for Cluster III Town: Thika
6-3
pedestrians will be provided including ample shaded seating, drinking water fountains, tot lots for kids, street lights and poles, dust bins etc.
Figure 6.3: Pedestrianised roads and revised traffic circulation within CBD area
Improving traffic circulation Traffic inside the CBD consists mainly of three types, light goods vehicles servicing retail shops, passenger cars for work and shopping, and matatus. However, because of on-street car parking and the tendency of matatus to stop anywhere for boarding and alighting of passengers, the internal roads are very congested. Traffic circulation can be improved by restricting goods vehicles servicing the pedestrianised area to early morning (before 8:00 am) and in the evening (after 7:00 pm). Workshop Road, Kenyatta Highway and Upper Road are the roads which form boundary of the CBD area. Kenyatta Highways is a four lane divided roadway and no median opening will be permitted on Kenyatta Highway between Workshop Road and Upper Road. Median opening will also not be permitted on Workshop Road and Upper Road. On-street parking will not be allowed on Kenyatta Highway, Workshop Road and Upper Road. Car traffic that has any business in CBD during the working hours will be able to park their cars in the multi-storey car park, which will be accessible through Upper Road. Private cars will not be permitted within the pedestrianised area. Providing off-street multi-storey parking Based on the total built-up area for office and commercial uses in the CBD, there is a car parking demand of 3,393 spaces. Available parking is about 850 spaces. A total future demand of 3,500 car parking spaces is projected for CBD area which will be met by constructing a multi-storey car park, with the matatu stage on the ground floor. The roof of the building can be utilized by recreational uses and even for a small convention centre. The below Figure 6.4 and Figure 6.5 show the recommended development within CBD area.
Pedestrianized roads
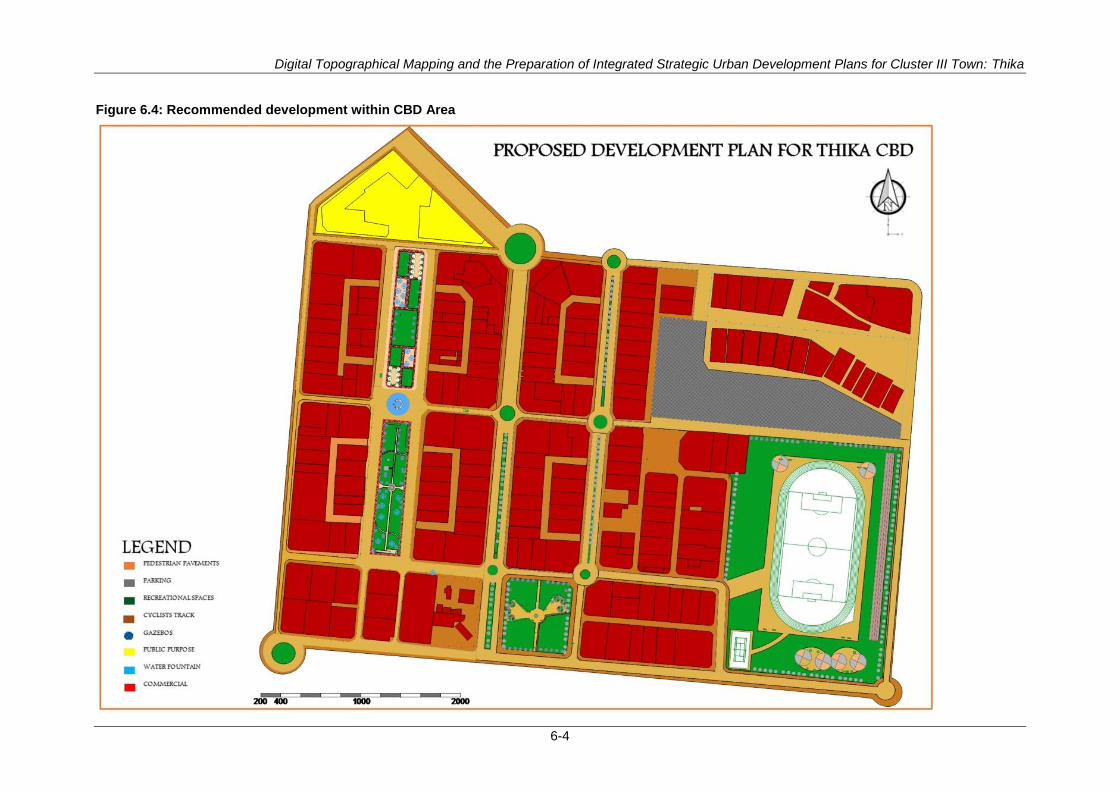
Digital Topographical Mapping and the Preparation of Integrated Strategic Urban Development Plans for Cluster III Town: Thika
6-4
Figure 6.4: Recommended development within CBD Area
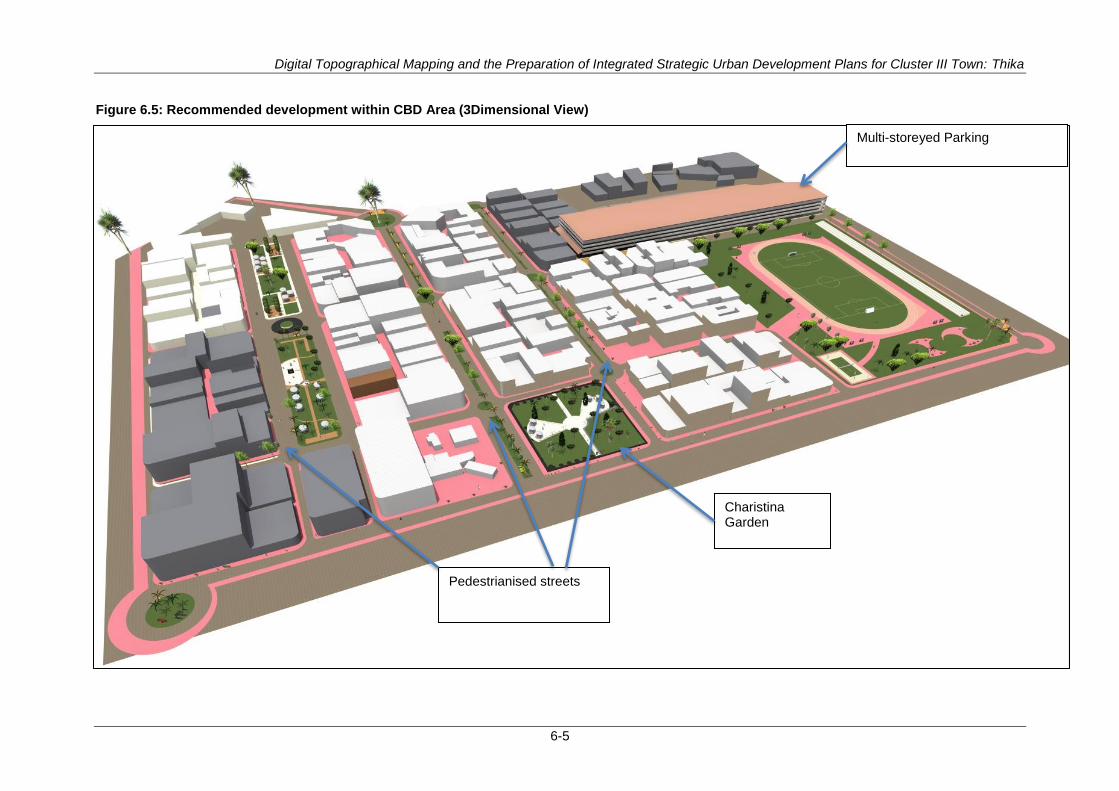
Digital Topographical Mapping and the Preparation of Integrated Strategic Urban Development Plans for Cluster III Town: Thika
6-5
Figure 6.5: Recommended development within CBD Area (3Dimensional View)
Multi-storeyed Parking
Charistina Garden
Pedestrianised streets
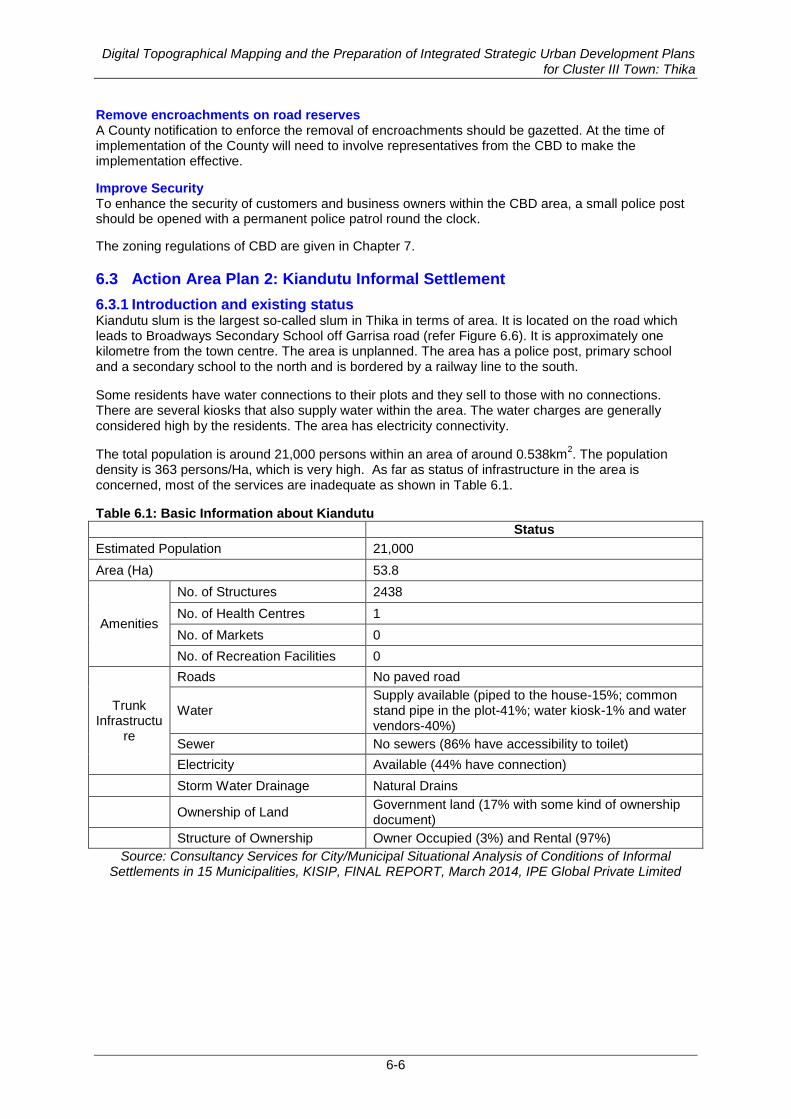
Digital Topographical Mapping and the Preparation of Integrated Strategic Urban Development Plans for Cluster III Town: Thika
6-6
Remove encroachments on road reserves A County notification to enforce the removal of encroachments should be gazetted. At the time of implementation of the County will need to involve representatives from the CBD to make the implementation effective.
Improve Security To enhance the security of customers and business owners within the CBD area, a small police post should be opened with a permanent police patrol round the clock.
The zoning regulations of CBD are given in Chapter 7.
6.3 Action Area Plan 2: Kiandutu Informal Settlement
6.3.1 Introduction and existing status Kiandutu slum is the largest so-called slum in Thika in terms of area. It is located on the road which leads to Broadways Secondary School off Garrisa road (refer Figure 6.6). It is approximately one kilometre from the town centre. The area is unplanned. The area has a police post, primary school and a secondary school to the north and is bordered by a railway line to the south.
Some residents have water connections to their plots and they sell to those with no connections. There are several kiosks that also supply water within the area. The water charges are generally considered high by the residents. The area has electricity connectivity.
The total population is around 21,000 persons within an area of around 0.538km2. The population
density is 363 persons/Ha, which is very high. As far as status of infrastructure in the area is concerned, most of the services are inadequate as shown in Table 6.1.
Table 6.1: Basic Information about Kiandutu
Status
Estimated Population 21,000
Area (Ha) 53.8
Amenities
No. of Structures 2438
No. of Health Centres 1
No. of Markets 0
No. of Recreation Facilities 0
Trunk Infrastructu
re
Roads No paved road
Water Supply available (piped to the house-15%; common stand pipe in the plot-41%; water kiosk-1% and water vendors-40%)
Sewer No sewers (86% have accessibility to toilet)
Electricity Available (44% have connection)
Storm Water Drainage Natural Drains
Ownership of Land
Government land (17% with some kind of ownership document)
Structure of Ownership Owner Occupied (3%) and Rental (97%)
Source: Consultancy Services for City/Municipal Situational Analysis of Conditions of Informal Settlements in 15 Municipalities, KISIP, FINAL REPORT, March 2014, IPE Global Private Limited
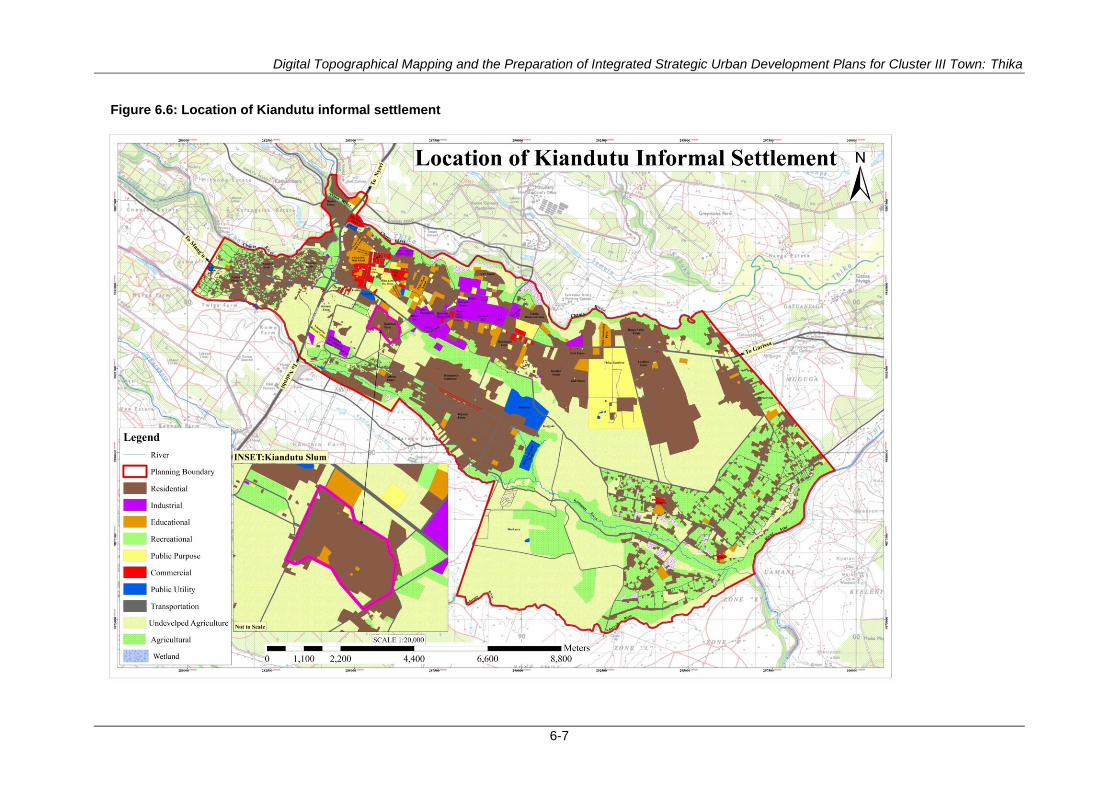
Digital Topographical Mapping and the Preparation of Integrated Strategic Urban Development Plans for Cluster III Town: Thika
6-7
Figure 6.6: Location of Kiandutu informal settlement
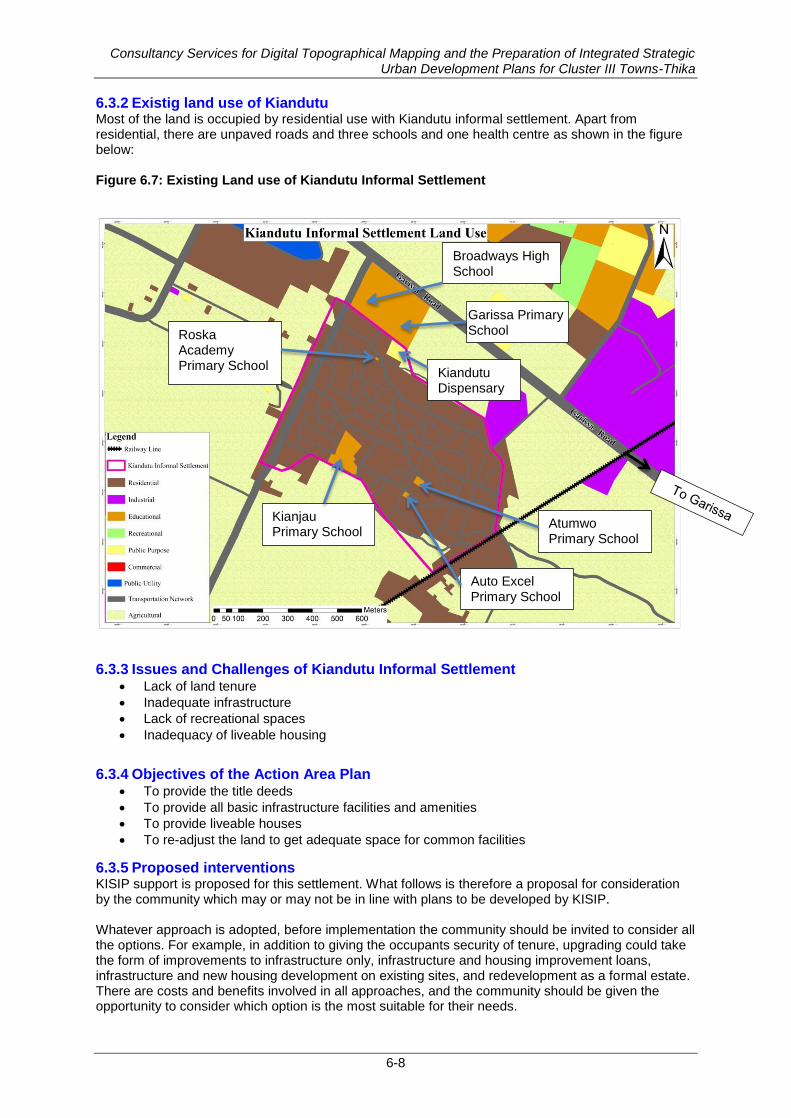
Consultancy Services for Digital Topographical Mapping and the Preparation of Integrated Strategic Urban Development Plans for Cluster III Towns-Thika
6-8
6.3.2 Existig land use of Kiandutu Most of the land is occupied by residential use with Kiandutu informal settlement. Apart from residential, there are unpaved roads and three schools and one health centre as shown in the figure below: Figure 6.7: Existing Land use of Kiandutu Informal Settlement
6.3.3 Issues and Challenges of Kiandutu Informal Settlement Lack of land tenure
Inadequate infrastructure
Lack of recreational spaces
Inadequacy of liveable housing
6.3.4 Objectives of the Action Area Plan To provide the title deeds
To provide all basic infrastructure facilities and amenities
To provide liveable houses
To re-adjust the land to get adequate space for common facilities
6.3.5 Proposed interventions KISIP support is proposed for this settlement. What follows is therefore a proposal for consideration by the community which may or may not be in line with plans to be developed by KISIP. Whatever approach is adopted, before implementation the community should be invited to consider all the options. For example, in addition to giving the occupants security of tenure, upgrading could take the form of improvements to infrastructure only, infrastructure and housing improvement loans, infrastructure and new housing development on existing sites, and redevelopment as a formal estate. There are costs and benefits involved in all approaches, and the community should be given the opportunity to consider which option is the most suitable for their needs.
Broadways High School
Roska Academy Primary School
Kianjau Primary School
Atumwo Primary School
Auto Excel Primary School
Garissa Primary School
Kiandutu Dispensary
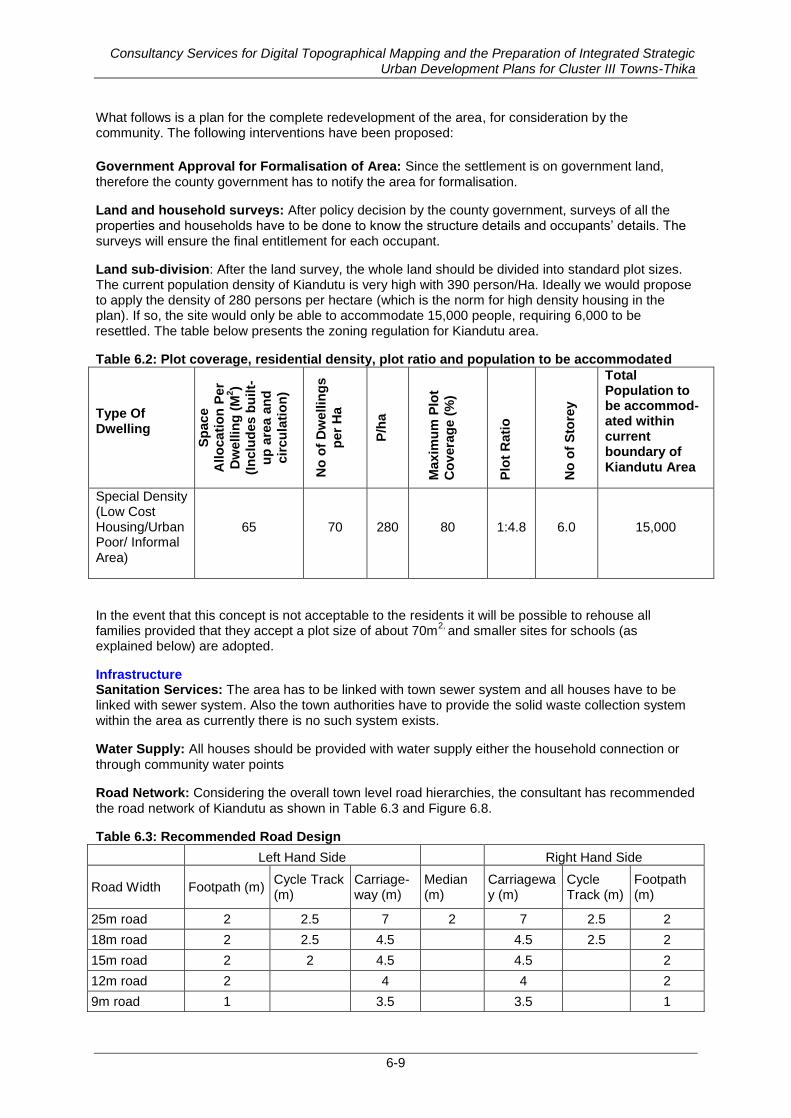
Consultancy Services for Digital Topographical Mapping and the Preparation of Integrated Strategic Urban Development Plans for Cluster III Towns-Thika
6-9
What follows is a plan for the complete redevelopment of the area, for consideration by the community. The following interventions have been proposed:
Government Approval for Formalisation of Area: Since the settlement is on government land,
therefore the county government has to notify the area for formalisation.
Land and household surveys: After policy decision by the county government, surveys of all the properties and households have to be done to know the structure details and occupants’ details. The surveys will ensure the final entitlement for each occupant.
Land sub-division: After the land survey, the whole land should be divided into standard plot sizes. The current population density of Kiandutu is very high with 390 person/Ha. Ideally we would propose to apply the density of 280 persons per hectare (which is the norm for high density housing in the plan). If so, the site would only be able to accommodate 15,000 people, requiring 6,000 to be resettled. The table below presents the zoning regulation for Kiandutu area.
Table 6.2: Plot coverage, residential density, plot ratio and population to be accommodated
Type Of Dwelling
Sp
ac
e
Allo
cati
on
Per
Dw
ellin
g (
M2)
(In
clu
des b
uilt-
up
are
a a
nd
cir
cu
lati
on
)
No
of
Dw
ellin
gs
per
Ha
P/h
a
Maxim
um
Plo
t
Co
vera
ge (
%)
Plo
t R
ati
o
No
of
Sto
rey
Total Population to be accommod-ated within current boundary of Kiandutu Area
Special Density (Low Cost Housing/Urban Poor/ Informal Area)
65 70 280 80 1:4.8 6.0 15,000
In the event that this concept is not acceptable to the residents it will be possible to rehouse all families provided that they accept a plot size of about 70m
2, and smaller sites for schools (as
explained below) are adopted.
Infrastructure Sanitation Services: The area has to be linked with town sewer system and all houses have to be linked with sewer system. Also the town authorities have to provide the solid waste collection system within the area as currently there is no such system exists.
Water Supply: All houses should be provided with water supply either the household connection or
through community water points
Road Network: Considering the overall town level road hierarchies, the consultant has recommended
the road network of Kiandutu as shown in Table 6.3 and Figure 6.8.
Table 6.3: Recommended Road Design
Left Hand Side
Right Hand Side
Road Width Footpath (m) Cycle Track (m)
Carriage-way (m)
Median (m)
Carriageway (m)
Cycle Track (m)
Footpath (m)
25m road 2 2.5 7 2 7 2.5 2
18m road 2 2.5 4.5
4.5 2.5 2
15m road 2 2 4.5
4.5 2
12m road 2 4 4 2
9m road 1 3.5 3.5 1
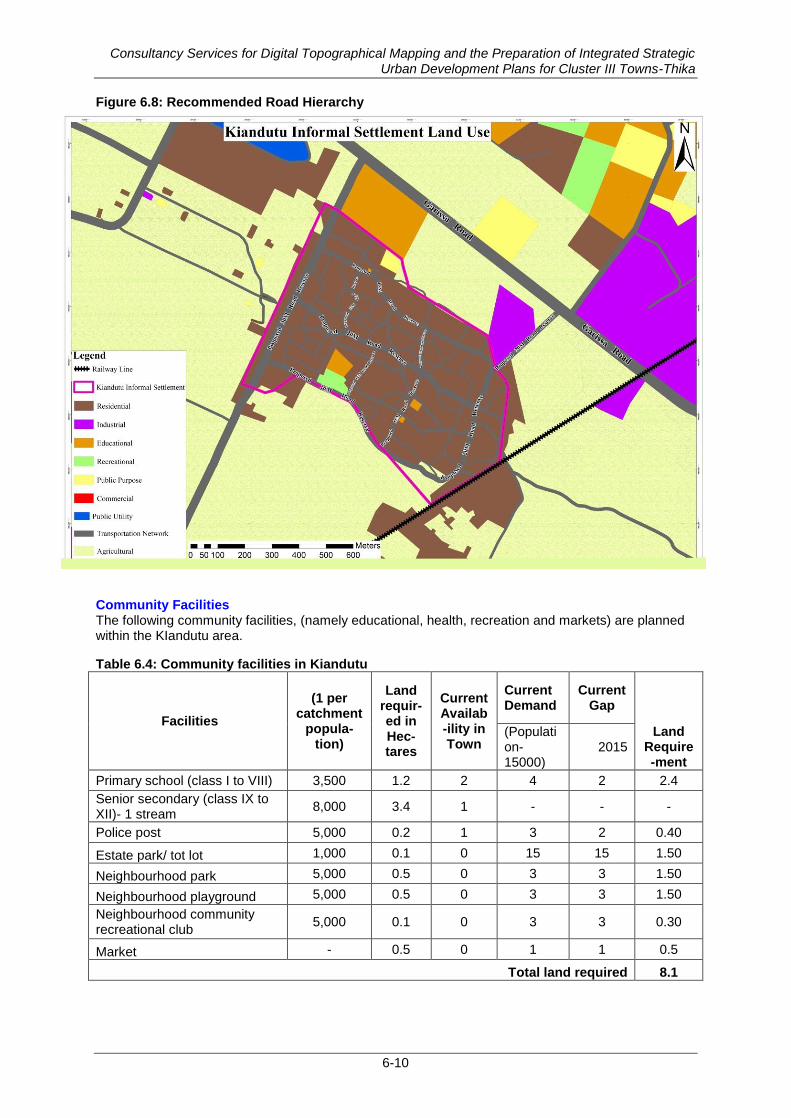
Consultancy Services for Digital Topographical Mapping and the Preparation of Integrated Strategic Urban Development Plans for Cluster III Towns-Thika
6-10
Figure 6.8: Recommended Road Hierarchy
Community Facilities The following community facilities, (namely educational, health, recreation and markets) are planned within the KIandutu area.
Table 6.4: Community facilities in Kiandutu
Facilities
(1 per catchment
popula-tion)
Land requir-ed in Hec-tares
Current Availab-ility in Town
Current Demand
Current Gap
Land Require-ment
(Population-15000)
2015
Primary school (class I to VIII) 3,500 1.2 2 4 2 2.4
Senior secondary (class IX to XII)- 1 stream
8,000 3.4 1 - - -
Police post 5,000 0.2 1 3 2 0.40
Estate park/ tot lot 1,000 0.1 0 15 15 1.50
Neighbourhood park 5,000 0.5 0 3 3 1.50
Neighbourhood playground 5,000 0.5 0 3 3 1.50
Neighbourhood community recreational club
5,000 0.1 0 3 3 0.30
Market - 0.5 0 1 1 0.5
Total land required 8.1
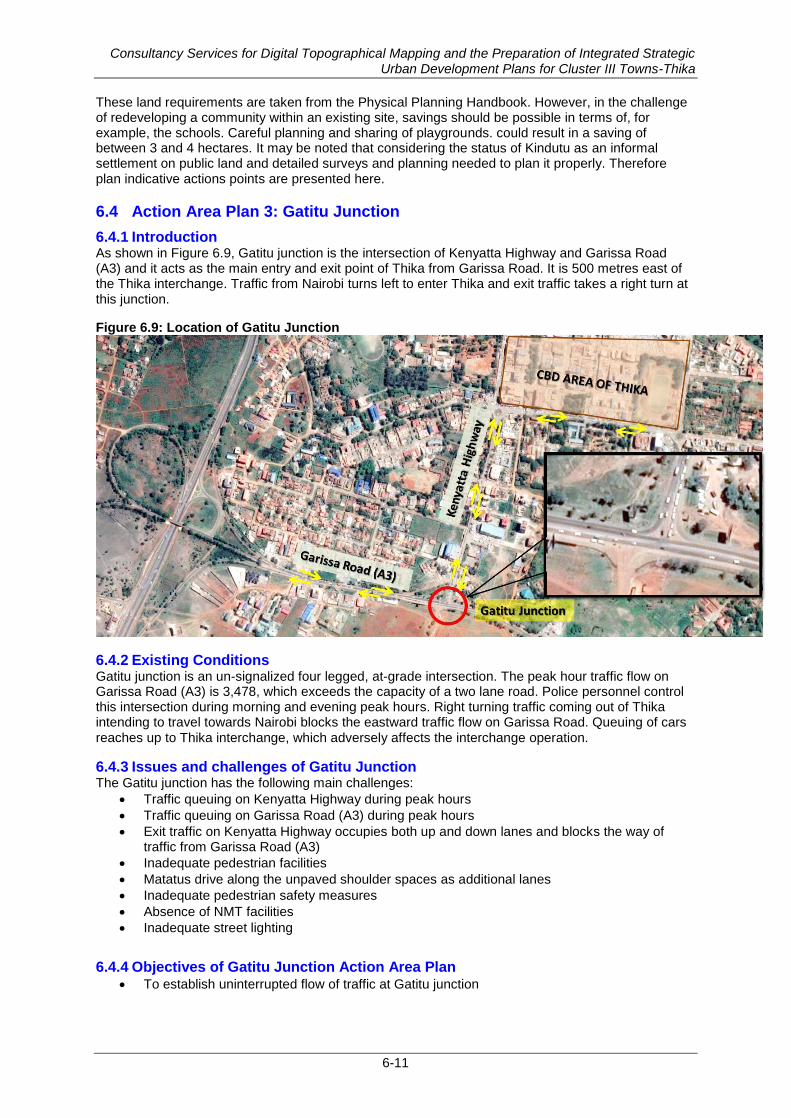
Consultancy Services for Digital Topographical Mapping and the Preparation of Integrated Strategic Urban Development Plans for Cluster III Towns-Thika
6-11
These land requirements are taken from the Physical Planning Handbook. However, in the challenge of redeveloping a community within an existing site, savings should be possible in terms of, for example, the schools. Careful planning and sharing of playgrounds. could result in a saving of between 3 and 4 hectares. It may be noted that considering the status of Kindutu as an informal settlement on public land and detailed surveys and planning needed to plan it properly. Therefore plan indicative actions points are presented here.
6.4 Action Area Plan 3: Gatitu Junction
6.4.1 Introduction As shown in Figure 6.9, Gatitu junction is the intersection of Kenyatta Highway and Garissa Road (A3) and it acts as the main entry and exit point of Thika from Garissa Road. It is 500 metres east of the Thika interchange. Traffic from Nairobi turns left to enter Thika and exit traffic takes a right turn at this junction.
Figure 6.9: Location of Gatitu Junction
6.4.2 Existing Conditions Gatitu junction is an un-signalized four legged, at-grade intersection. The peak hour traffic flow on Garissa Road (A3) is 3,478, which exceeds the capacity of a two lane road. Police personnel control this intersection during morning and evening peak hours. Right turning traffic coming out of Thika intending to travel towards Nairobi blocks the eastward traffic flow on Garissa Road. Queuing of cars reaches up to Thika interchange, which adversely affects the interchange operation.
6.4.3 Issues and challenges of Gatitu Junction The Gatitu junction has the following main challenges:
Traffic queuing on Kenyatta Highway during peak hours
Traffic queuing on Garissa Road (A3) during peak hours
Exit traffic on Kenyatta Highway occupies both up and down lanes and blocks the way of traffic from Garissa Road (A3)
Inadequate pedestrian facilities
Matatus drive along the unpaved shoulder spaces as additional lanes
Inadequate pedestrian safety measures
Absence of NMT facilities
Inadequate street lighting
6.4.4 Objectives of Gatitu Junction Action Area Plan To establish uninterrupted flow of traffic at Gatitu junction
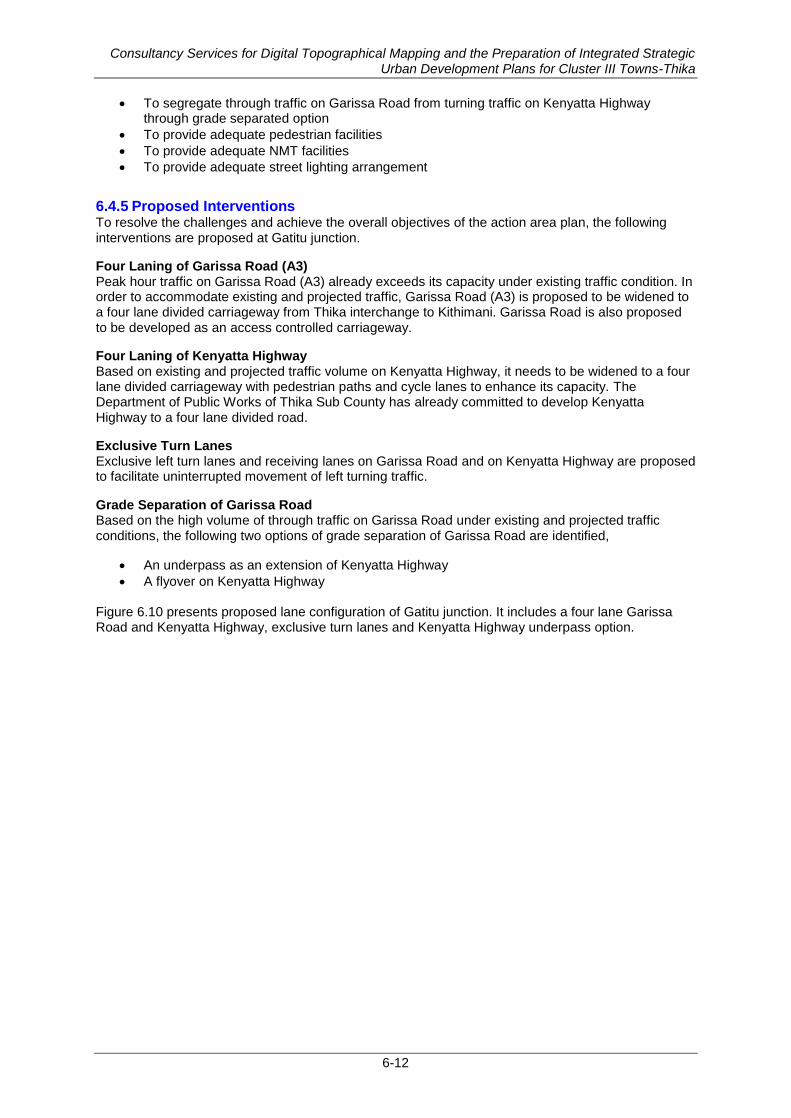
Consultancy Services for Digital Topographical Mapping and the Preparation of Integrated Strategic Urban Development Plans for Cluster III Towns-Thika
6-12
To segregate through traffic on Garissa Road from turning traffic on Kenyatta Highway through grade separated option
To provide adequate pedestrian facilities
To provide adequate NMT facilities
To provide adequate street lighting arrangement
6.4.5 Proposed Interventions To resolve the challenges and achieve the overall objectives of the action area plan, the following interventions are proposed at Gatitu junction.
Four Laning of Garissa Road (A3) Peak hour traffic on Garissa Road (A3) already exceeds its capacity under existing traffic condition. In order to accommodate existing and projected traffic, Garissa Road (A3) is proposed to be widened to a four lane divided carriageway from Thika interchange to Kithimani. Garissa Road is also proposed to be developed as an access controlled carriageway.
Four Laning of Kenyatta Highway Based on existing and projected traffic volume on Kenyatta Highway, it needs to be widened to a four lane divided carriageway with pedestrian paths and cycle lanes to enhance its capacity. The Department of Public Works of Thika Sub County has already committed to develop Kenyatta Highway to a four lane divided road.
Exclusive Turn Lanes Exclusive left turn lanes and receiving lanes on Garissa Road and on Kenyatta Highway are proposed to facilitate uninterrupted movement of left turning traffic.
Grade Separation of Garissa Road Based on the high volume of through traffic on Garissa Road under existing and projected traffic conditions, the following two options of grade separation of Garissa Road are identified,
An underpass as an extension of Kenyatta Highway
A flyover on Kenyatta Highway
Figure 6.10 presents proposed lane configuration of Gatitu junction. It includes a four lane Garissa Road and Kenyatta Highway, exclusive turn lanes and Kenyatta Highway underpass option.
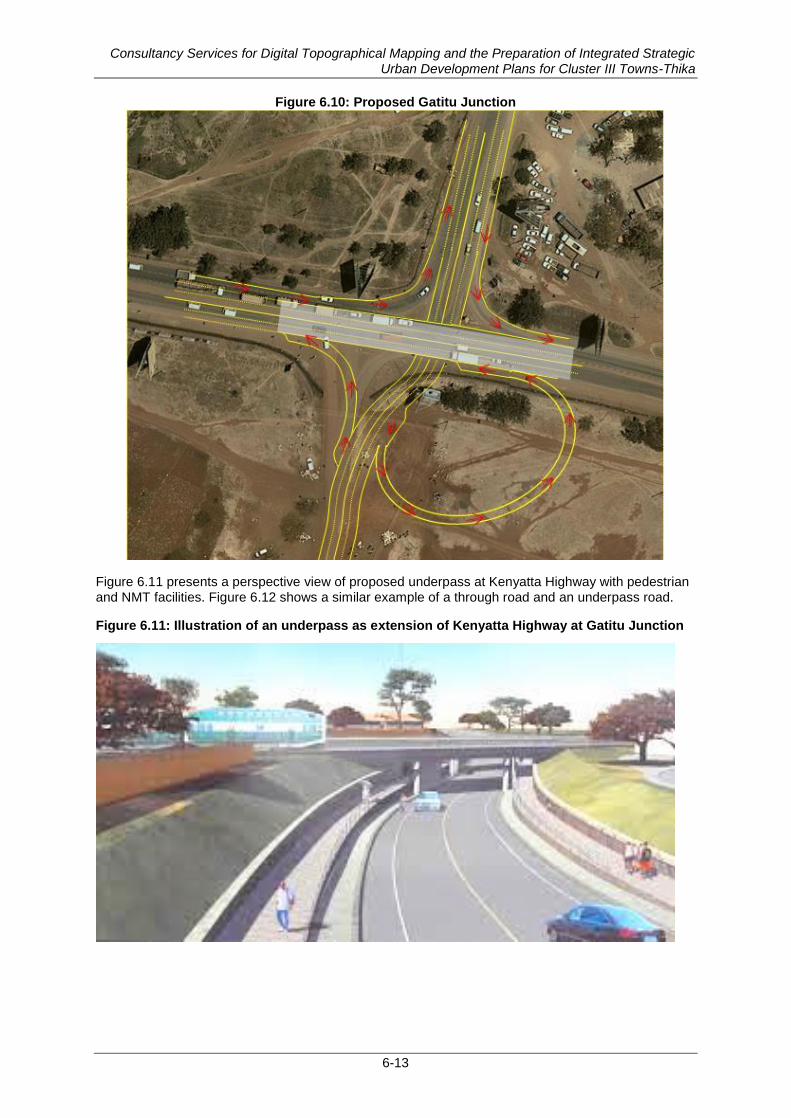
Consultancy Services for Digital Topographical Mapping and the Preparation of Integrated Strategic Urban Development Plans for Cluster III Towns-Thika
6-13
Figure 6.10: Proposed Gatitu Junction
Figure 6.11 presents a perspective view of proposed underpass at Kenyatta Highway with pedestrian and NMT facilities. Figure 6.12 shows a similar example of a through road and an underpass road.
Figure 6.11: Illustration of an underpass as extension of Kenyatta Highway at Gatitu Junction

Consultancy Services for Digital Topographical Mapping and the Preparation of Integrated Strategic Urban Development Plans for Cluster III Towns-Thika
6-14
Figure 6.12: Underpass and through road
A flyover on Kenyatta Highway to cross over Garissa Road (A3) at Gatitu junction is also a possibility. Figure 6.13 shows an example of a flyover crossing over a major thoroughfare.
Figure 6.13: Flyover Crossing a Thoroughfare
Based on the availability of an existing right of way on Garissa Road and Kenyatta Highway, the best option is for Gatitu junction to be developed with an underpass for Kenyatta Highway with a loop road access to Garissa Road. The following facilities will be provided along with junction improvements.
Street lighting arrangements at regular intervals
Pedestrian walkways both side of Kenyatta Highway and the proposed underpass
Cycle tracks both side of Kenyatta Highway and the proposed underpass
Ramps and railings at all entry and exit points
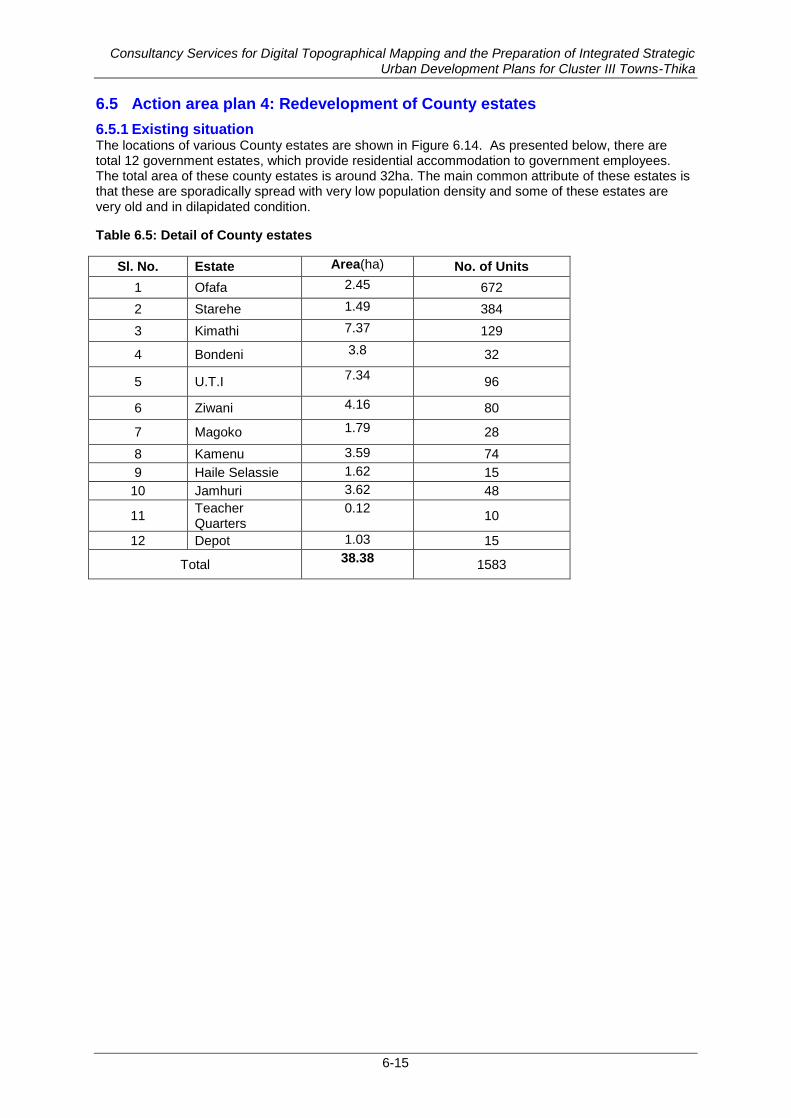
Consultancy Services for Digital Topographical Mapping and the Preparation of Integrated Strategic Urban Development Plans for Cluster III Towns-Thika
6-15
6.5 Action area plan 4: Redevelopment of County estates
6.5.1 Existing situation The locations of various County estates are shown in Figure 6.14. As presented below, there are total 12 government estates, which provide residential accommodation to government employees. The total area of these county estates is around 32ha. The main common attribute of these estates is that these are sporadically spread with very low population density and some of these estates are very old and in dilapidated condition.
Table 6.5: Detail of County estates
Sl. No. Estate Area(ha) No. of Units
1 Ofafa 2.45 672
2 Starehe 1.49 384
3 Kimathi 7.37 129
4 Bondeni 3.8 32
5 U.T.I 7.34
96
6 Ziwani 4.16 80
7 Magoko 1.79 28
8 Kamenu 3.59 74
9 Haile Selassie 1.62 15
10 Jamhuri 3.62 48
11 Teacher Quarters
0.12 10
12 Depot 1.03 15
Total 38.38
1583
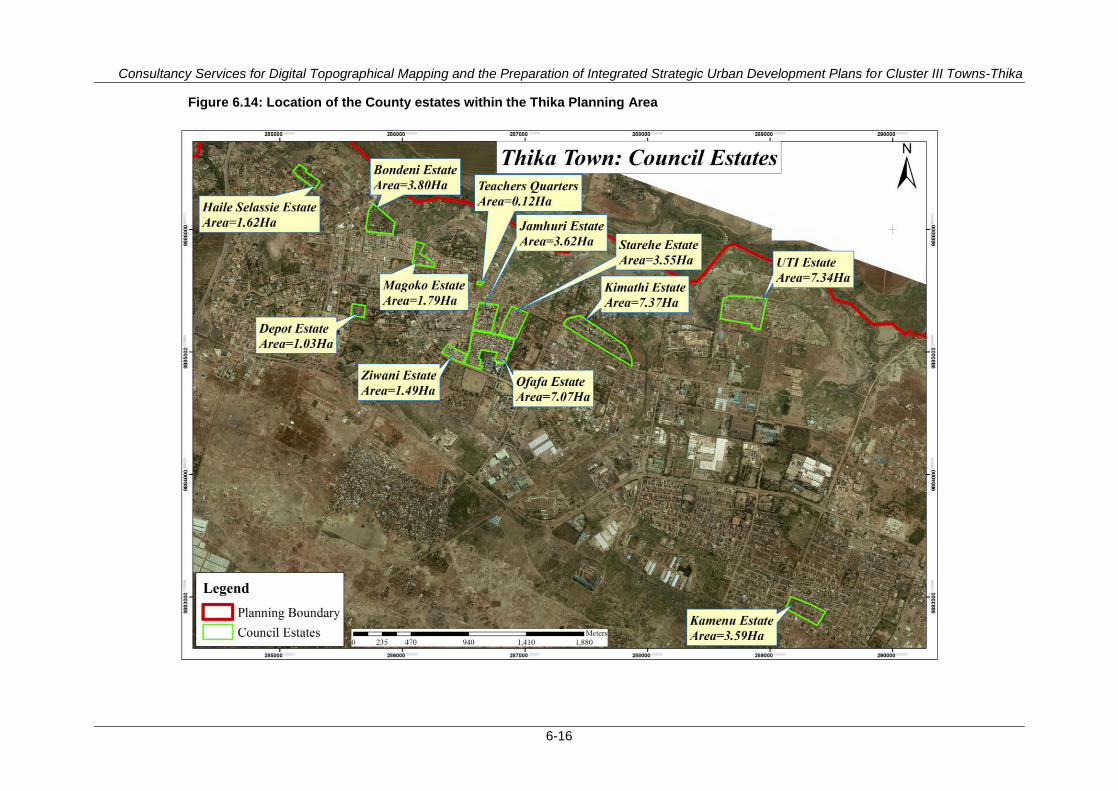
Consultancy Services for Digital Topographical Mapping and the Preparation of Integrated Strategic Urban Development Plans for Cluster III Towns-Thika
6-16
Figure 6.14: Location of the County estates within the Thika Planning Area
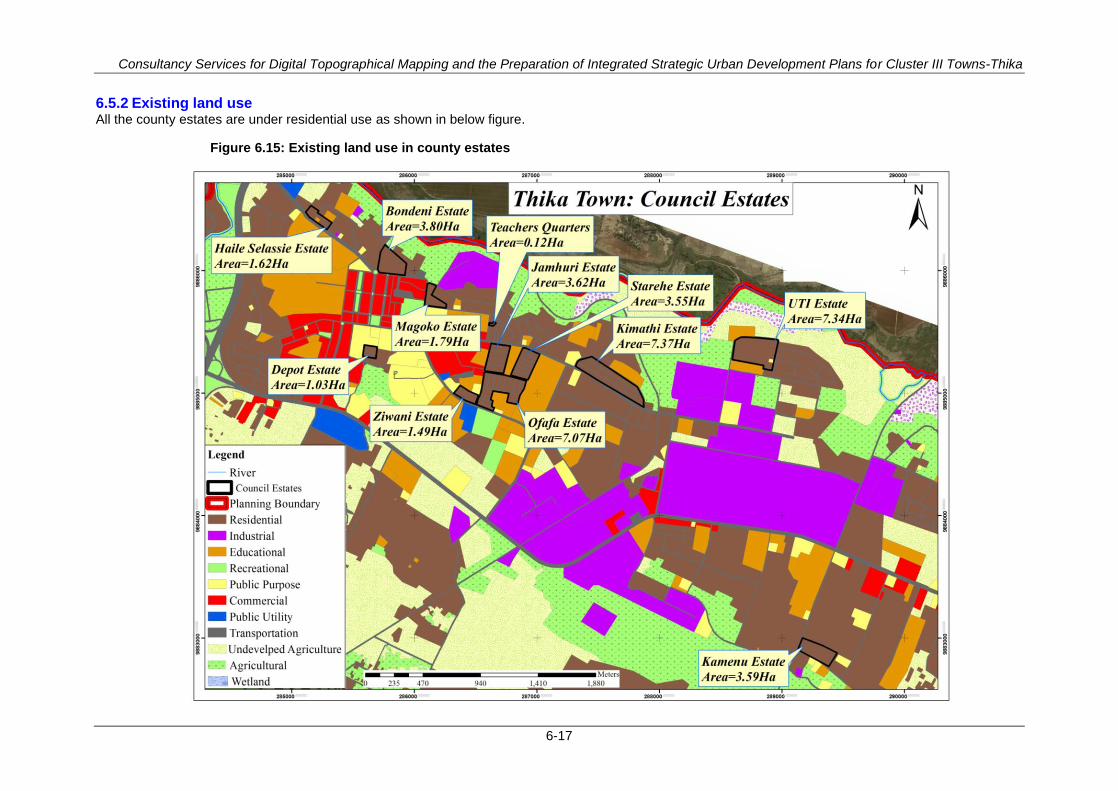
Consultancy Services for Digital Topographical Mapping and the Preparation of Integrated Strategic Urban Development Plans for Cluster III Towns-Thika
6-17
6.5.2 Existing land use All the county estates are under residential use as shown in below figure.
Figure 6.15: Existing land use in county estates
Consultancy Services for Digital Topographical Mapping and the Preparation of Integrated Strategic Urban Development Plans for Cluster III Towns-Thika
6-18
Issues and challenges of the County estates: The County estates have the following main challenges:
Low density development
Old dilapidated buildings
Encroachment of undeveloped land
Inadequate basic infrastructures
Objectives of the Action Area Plan
To enhance the density
To redevelop the estates
To remove the encroachment
To provide basic infrastructure
6.5.3 Proposed interventions To resolve the challenges and achieve the overall objectives of the action area plan, the following interventions are planned within the County estates.
Remove encroachments on road reserves: A County notification to enforce the removal of encroachments should be issued. At the time of implementation of the County will need to involve representatives from the local citizens to make the implementation effective.
Demolish the old dilapidated estate: After removing the encroachment, the old low density houses will be demolished to create space for new development. The county may start with the oldest county estate for redevelopment.
Plan the estate for high density new development: A detailed plan of each county estate shall be prepared by the County with land allocation for different sizes of plots or multi-dwelling units/flats. The detail plan will also indicate the layout of all infrastructure aspects like water supply, drainage, road network, sewerage, street light, etc.
Service the land with basic infrastructure: As per the detailed plan of individual estates, the county
shall service the land with basic infrastructure on ground.
Develop the land for high density development: After servicing the land, the County will construct
the houses as per the zoning regulation of individual estates.
Option of Public Private Partnership (PPP): The County may like to involve the private developers for the redevelopment of estates if it is not possible for county to do the same due to limitation of resources. Under the PPP option the County can engage the private developer by offering the land. Based on the type of development and quantity of various housing units, commercial area, park, etc. will be known and the County can discuss and negotiate with the private developer and based on agreement, the developer will be allowed to sell some developed units to recover the cost of all development and remaining units will be transferred to the County.
The zoning regulations of county estate as part of residential development are given in Chapter 7.
6.5.4 Bondeni estate calculation As an example, the basic calculation for one County estate i.e. Bondeni estate, is presented for general reference. As shown in the table below, the total area of the estate is 3.8ha and with a
population density of 70 family per ha (280 person/ha), around 266 dwelling units can be constructed on the land available within Bondeni estate. Currently only 32 housing units are developed in the whole area, which states that the land is highly underutilised.
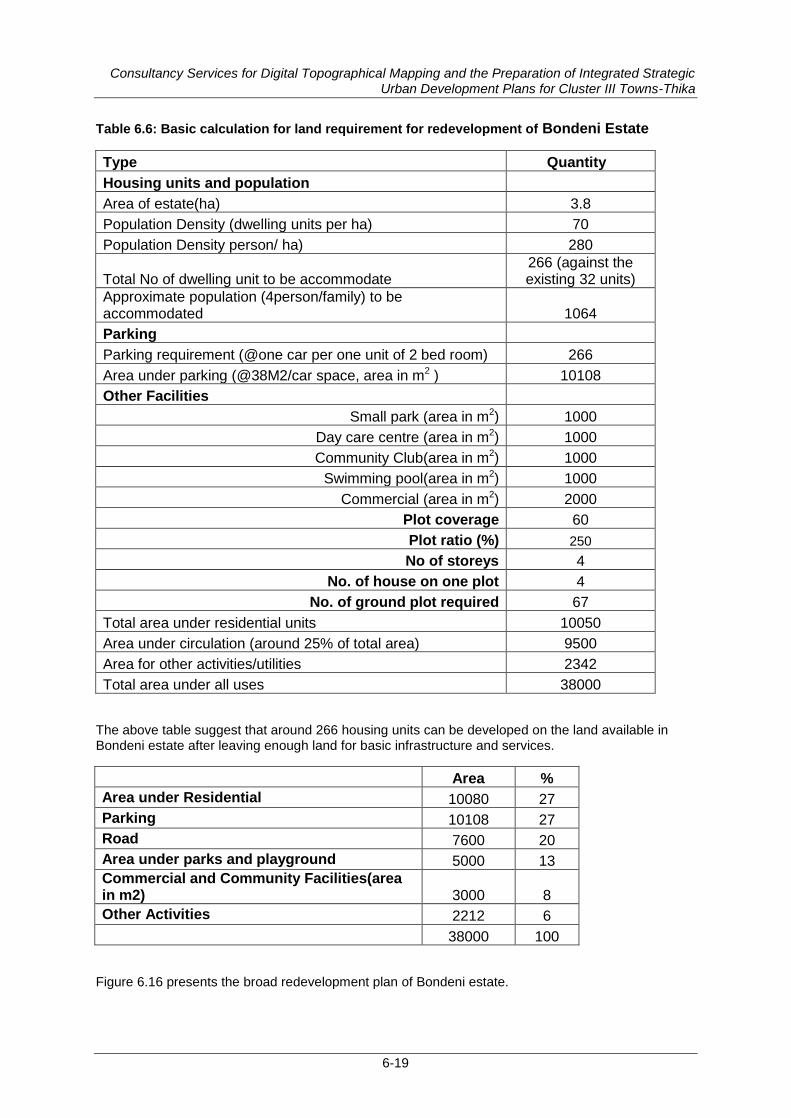
Consultancy Services for Digital Topographical Mapping and the Preparation of Integrated Strategic Urban Development Plans for Cluster III Towns-Thika
6-19
Table 6.6: Basic calculation for land requirement for redevelopment of Bondeni Estate
Type Quantity
Housing units and population
Area of estate(ha) 3.8
Population Density (dwelling units per ha) 70
Population Density person/ ha) 280
Total No of dwelling unit to be accommodate 266 (against the existing 32 units)
Approximate population (4person/family) to be accommodated 1064
Parking
Parking requirement (@one car per one unit of 2 bed room) 266
Area under parking (@38M2/car space, area in m2 ) 10108
Other Facilities
Small park (area in m2) 1000
Day care centre (area in m2) 1000
Community Club(area in m2) 1000
Swimming pool(area in m2) 1000
Commercial (area in m2) 2000
Plot coverage 60
Plot ratio (%) 250
No of storeys 4
No. of house on one plot 4
No. of ground plot required 67
Total area under residential units 10050
Area under circulation (around 25% of total area) 9500
Area for other activities/utilities 2342
Total area under all uses 38000
The above table suggest that around 266 housing units can be developed on the land available in Bondeni estate after leaving enough land for basic infrastructure and services.
Area %
Area under Residential 10080 27
Parking 10108 27
Road 7600 20
Area under parks and playground 5000 13
Commercial and Community Facilities(area in m2) 3000 8
Other Activities 2212 6
38000 100
Figure 6.16 presents the broad redevelopment plan of Bondeni estate.
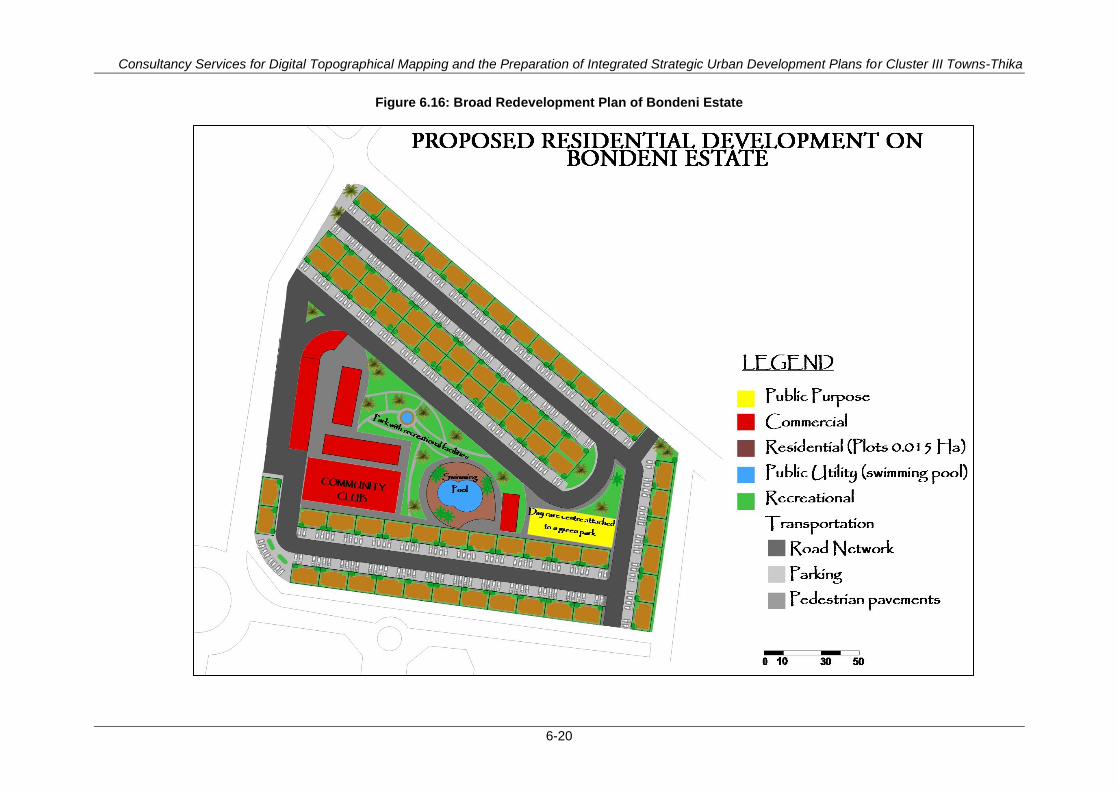
Consultancy Services for Digital Topographical Mapping and the Preparation of Integrated Strategic Urban Development Plans for Cluster III Towns-Thika
6-20
Figure 6.16: Broad Redevelopment Plan of Bondeni Estate
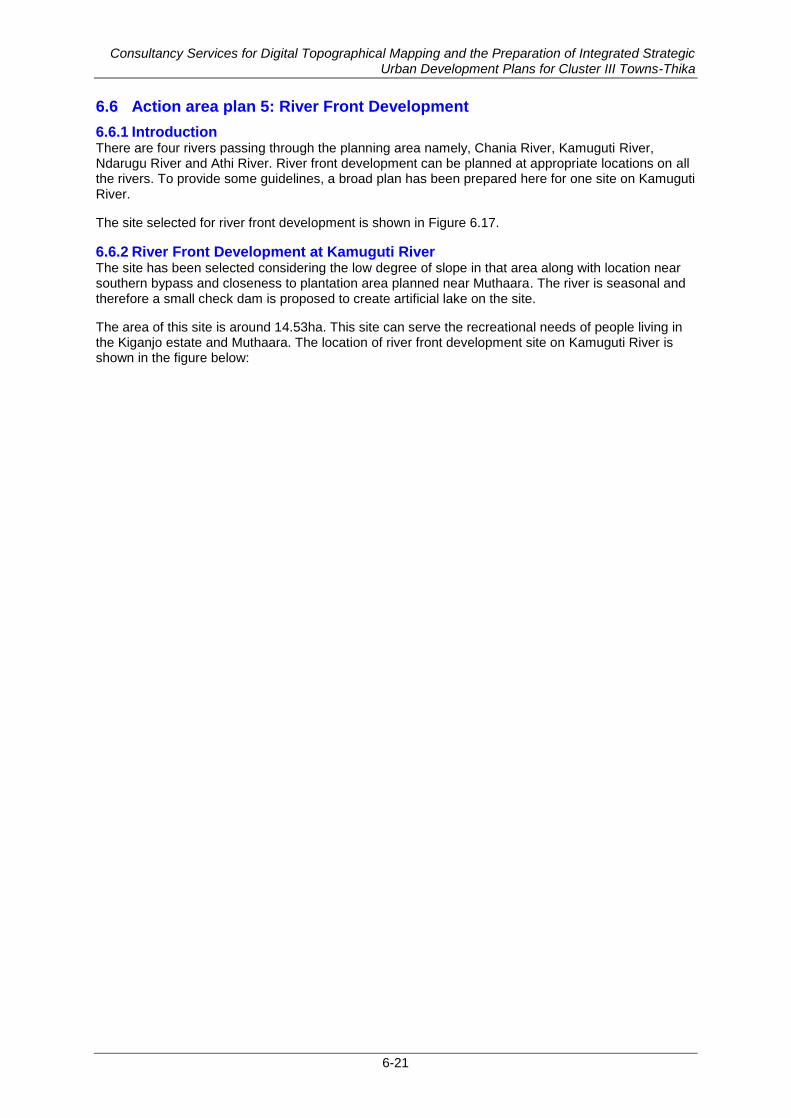
Consultancy Services for Digital Topographical Mapping and the Preparation of Integrated Strategic Urban Development Plans for Cluster III Towns-Thika
6-21
6.6 Action area plan 5: River Front Development
6.6.1 Introduction There are four rivers passing through the planning area namely, Chania River, Kamuguti River, Ndarugu River and Athi River. River front development can be planned at appropriate locations on all the rivers. To provide some guidelines, a broad plan has been prepared here for one site on Kamuguti River.
The site selected for river front development is shown in Figure 6.17.
6.6.2 River Front Development at Kamuguti River The site has been selected considering the low degree of slope in that area along with location near southern bypass and closeness to plantation area planned near Muthaara. The river is seasonal and therefore a small check dam is proposed to create artificial lake on the site.
The area of this site is around 14.53ha. This site can serve the recreational needs of people living in the Kiganjo estate and Muthaara. The location of river front development site on Kamuguti River is shown in the figure below:
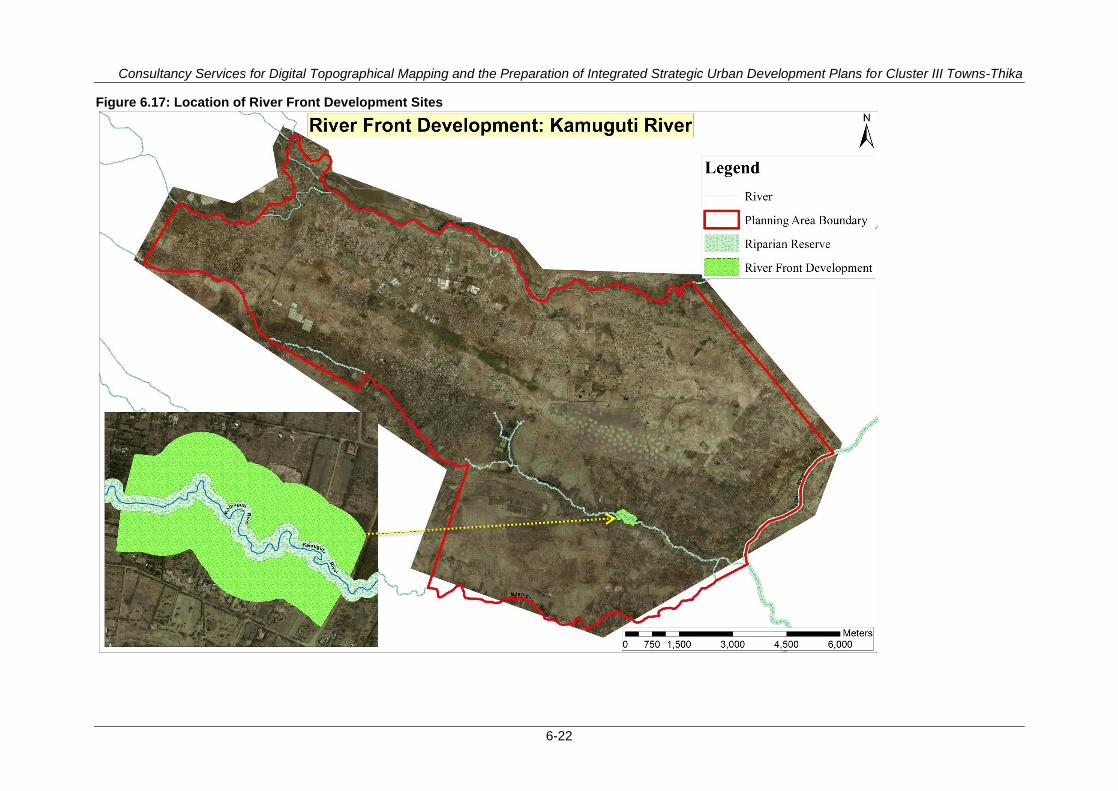
Consultancy Services for Digital Topographical Mapping and the Preparation of Integrated Strategic Urban Development Plans for Cluster III Towns-Thika
6-22
Figure 6.17: Location of River Front Development Sites
Consultancy Services for Digital Topographical Mapping and the Preparation of Integrated Strategic Urban Development Plans for Cluster III Towns-Thika
6-23
6.6.3 Existing land use of River Front Development Sites The current use of both sites is agriculture. The existing land use of both sites along with immidiate surrounding is shown in figure below.
Figure 6.18: Existing Land use of River Front Development Site on Kamuguti River
6.6.4 Status of river front site The area is currently used for agriculture
The river is not linked with town’s life
The river is not used as a place of recreational activities
6.6.5 Objectives of river front development To provide link the river with town’s life
To develop areas along the river for recreational activities
To construct a dam on river to create an artificial lake for water sport activities
6.6.6 Proposed interventions To resolve the challenges and achieve the overall objectives of the action area plan, the following interventions have been proposed within the selected sites for river front development: Construct a Check Dam: A check dam is planned to be constructed to create an artificial lake at planned sites for river front development. This will ensure water throughout the year, which can be used for water sport activities. A separate study will be needed for the construction of the dam.
Conduct Land Survey: The area has to be surveyed to know the ownership status.
Listing of Activities to be proposed/ Land use: After land survey, a list of activities to be planned has to be prepared, which will indicate the land use of the planned site. A suggestive list of all the activities considering the environmental sensitivity of the area is as below:
Public Promenades or pedestrian pathways: The walkways can be provided along the riparian reserve on both side of the river.

Consultancy Services for Digital Topographical Mapping and the Preparation of Integrated Strategic Urban Development Plans for Cluster III Towns-Thika
6-24
Paved spaces: paved spaces for general movement area proposed.
Sports activities: A small football playground, basketball court and volleyball court area planned for sport activities.
Food Plaza/ Commercial space: A food plazas has been suggested on both sides of the rivers.
Water features: artificial lake, fountain and aquarium are planed for water recreational activities.
Green open spaces: Some picnic spots on both sides of the river is planned.
Parking Site: One parking site on south side of river is planned to cater the parking demand of visitors.
As per the above list of suggestive land uses, a broad land use plan is prepared and shown in below Figure 6.19. It may be noted that for a detailed plan, detailed site investigation will be required and here only indicative plan is presented.
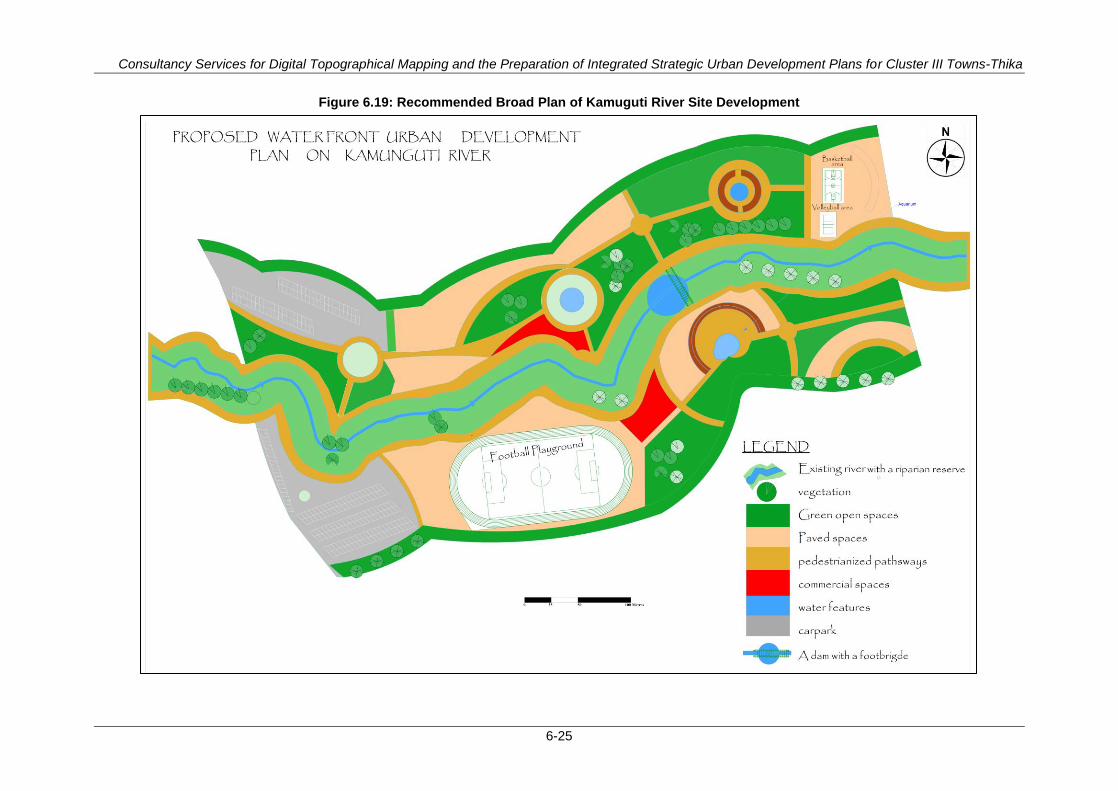
Consultancy Services for Digital Topographical Mapping and the Preparation of Integrated Strategic Urban Development Plans for Cluster III Towns-Thika
6-25
Figure 6.19: Recommended Broad Plan of Kamuguti River Site Development

Consultancy Services for Digital Topographical Mapping and the Preparation of Integrated Strategic Urban Development Plans for Cluster III Towns-Thika
26
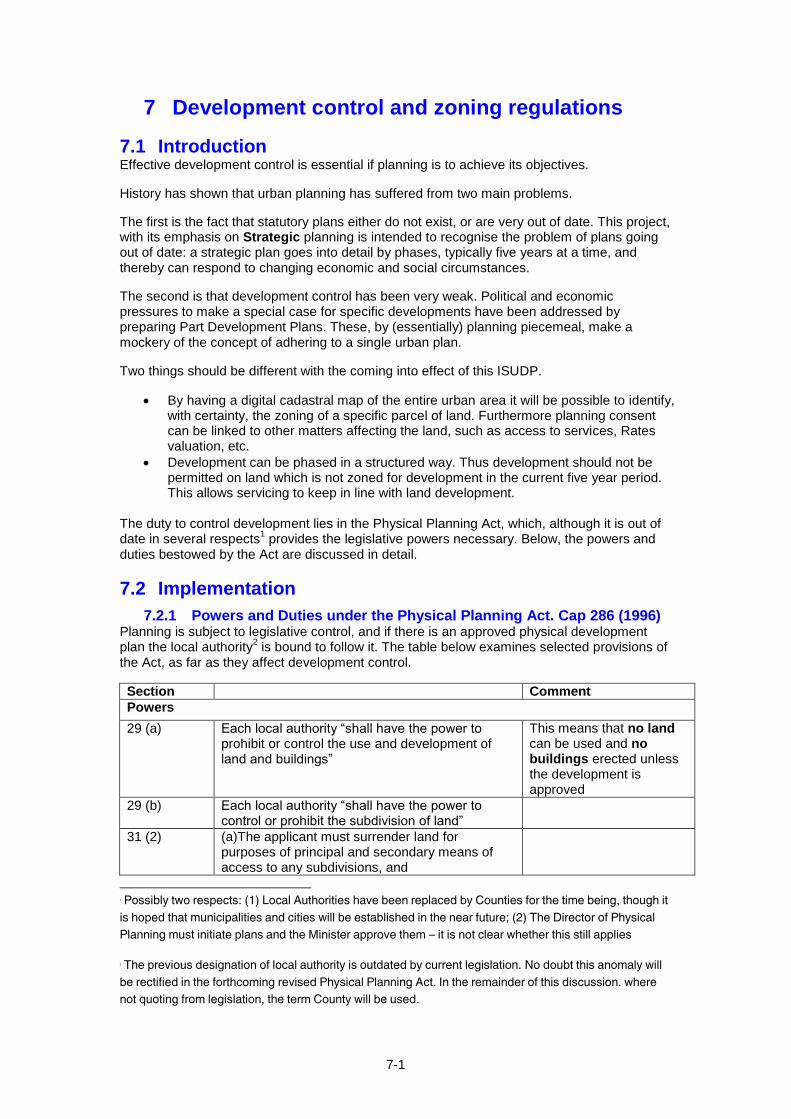
7-1
7 Development control and zoning regulations
7.1 Introduction Effective development control is essential if planning is to achieve its objectives.
History has shown that urban planning has suffered from two main problems.
The first is the fact that statutory plans either do not exist, or are very out of date. This project, with its emphasis on Strategic planning is intended to recognise the problem of plans going out of date: a strategic plan goes into detail by phases, typically five years at a time, and thereby can respond to changing economic and social circumstances.
The second is that development control has been very weak. Political and economic pressures to make a special case for specific developments have been addressed by preparing Part Development Plans. These, by (essentially) planning piecemeal, make a mockery of the concept of adhering to a single urban plan.
Two things should be different with the coming into effect of this ISUDP.
By having a digital cadastral map of the entire urban area it will be possible to identify, with certainty, the zoning of a specific parcel of land. Furthermore planning consent can be linked to other matters affecting the land, such as access to services, Rates valuation, etc.
Development can be phased in a structured way. Thus development should not be permitted on land which is not zoned for development in the current five year period. This allows servicing to keep in line with land development.
The duty to control development lies in the Physical Planning Act, which, although it is out of date in several respects
1 provides the legislative powers necessary. Below, the powers and
duties bestowed by the Act are discussed in detail.
7.2 Implementation
7.2.1 Powers and Duties under the Physical Planning Act. Cap 286 (1996) Planning is subject to legislative control, and if there is an approved physical development plan the local authority
2 is bound to follow it. The table below examines selected provisions of
the Act, as far as they affect development control.
Section Comment
Powers
29 (a) Each local authority “shall have the power to prohibit or control the use and development of land and buildings”
This means that no land can be used and no buildings erected unless the development is approved
29 (b) Each local authority “shall have the power to control or prohibit the subdivision of land”
31 (2) (a)The applicant must surrender land for purposes of principal and secondary means of access to any subdivisions, and
1 Possibly two respects: (1) Local Authorities have been replaced by Counties for the time being, though it
is hoped that municipalities and cities will be established in the near future; (2) The Director of Physical
Planning must initiate plans and the Minister approve them – it is not clear whether this still applies
2 The previous designation of local authority is outdated by current legislation. No doubt this anomaly will
be rectified in the forthcoming revised Physical Planning Act. In the remainder of this discussion. where
not quoting from legislation, the term County will be used.
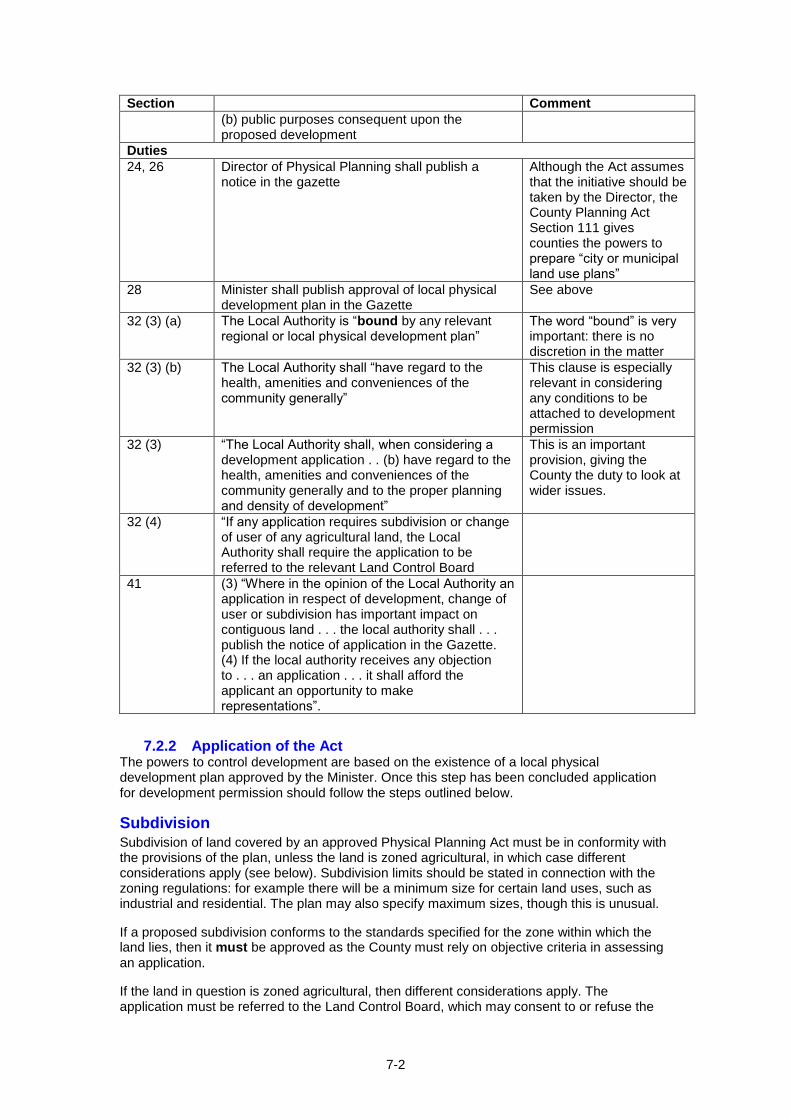
7-2
Section Comment
(b) public purposes consequent upon the proposed development
Duties
24, 26 Director of Physical Planning shall publish a notice in the gazette
Although the Act assumes that the initiative should be taken by the Director, the County Planning Act Section 111 gives counties the powers to prepare “city or municipal land use plans”
28 Minister shall publish approval of local physical development plan in the Gazette
See above
32 (3) (a) The Local Authority is “bound by any relevant regional or local physical development plan”
The word “bound” is very important: there is no discretion in the matter
32 (3) (b) The Local Authority shall “have regard to the health, amenities and conveniences of the community generally”
This clause is especially relevant in considering any conditions to be attached to development permission
32 (3) “The Local Authority shall, when considering a development application . . (b) have regard to the health, amenities and conveniences of the community generally and to the proper planning and density of development”
This is an important provision, giving the County the duty to look at wider issues.
32 (4) “If any application requires subdivision or change of user of any agricultural land, the Local Authority shall require the application to be referred to the relevant Land Control Board
41 (3) “Where in the opinion of the Local Authority an application in respect of development, change of user or subdivision has important impact on contiguous land . . . the local authority shall . . . publish the notice of application in the Gazette. (4) If the local authority receives any objection to . . . an application . . . it shall afford the applicant an opportunity to make representations”.
7.2.2 Application of the Act The powers to control development are based on the existence of a local physical development plan approved by the Minister. Once this step has been concluded application for development permission should follow the steps outlined below.
Subdivision Subdivision of land covered by an approved Physical Planning Act must be in conformity with the provisions of the plan, unless the land is zoned agricultural, in which case different considerations apply (see below). Subdivision limits should be stated in connection with the zoning regulations: for example there will be a minimum size for certain land uses, such as industrial and residential. The plan may also specify maximum sizes, though this is unusual.
If a proposed subdivision conforms to the standards specified for the zone within which the land lies, then it must be approved as the County must rely on objective criteria in assessing
an application.
If the land in question is zoned agricultural, then different considerations apply. The application must be referred to the Land Control Board, which may consent to or refuse the
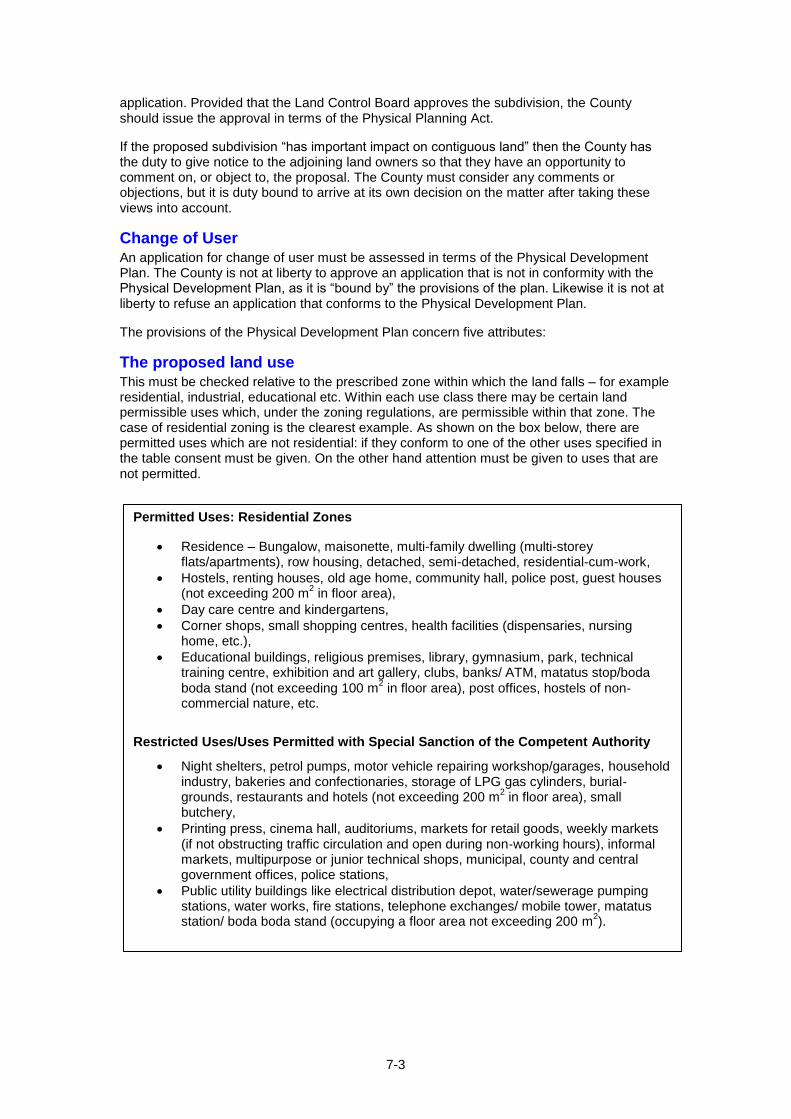
7-3
application. Provided that the Land Control Board approves the subdivision, the County should issue the approval in terms of the Physical Planning Act.
If the proposed subdivision “has important impact on contiguous land” then the County has the duty to give notice to the adjoining land owners so that they have an opportunity to comment on, or object to, the proposal. The County must consider any comments or objections, but it is duty bound to arrive at its own decision on the matter after taking these views into account.
Change of User An application for change of user must be assessed in terms of the Physical Development Plan. The County is not at liberty to approve an application that is not in conformity with the Physical Development Plan, as it is “bound by” the provisions of the plan. Likewise it is not at liberty to refuse an application that conforms to the Physical Development Plan.
The provisions of the Physical Development Plan concern five attributes:
The proposed land use This must be checked relative to the prescribed zone within which the land falls – for example residential, industrial, educational etc. Within each use class there may be certain land permissible uses which, under the zoning regulations, are permissible within that zone. The case of residential zoning is the clearest example. As shown on the box below, there are permitted uses which are not residential: if they conform to one of the other uses specified in the table consent must be given. On the other hand attention must be given to uses that are not permitted.
Permitted Uses: Residential Zones
Residence – Bungalow, maisonette, multi-family dwelling (multi-storey flats/apartments), row housing, detached, semi-detached, residential-cum-work,
Hostels, renting houses, old age home, community hall, police post, guest houses (not exceeding 200 m
2 in floor area),
Day care centre and kindergartens,
Corner shops, small shopping centres, health facilities (dispensaries, nursing home, etc.),
Educational buildings, religious premises, library, gymnasium, park, technical training centre, exhibition and art gallery, clubs, banks/ ATM, matatus stop/boda
boda stand (not exceeding 100 m2 in floor area), post offices, hostels of non‐
commercial nature, etc.
Restricted Uses/Uses Permitted with Special Sanction of the Competent Authority
Night shelters, petrol pumps, motor vehicle repairing workshop/garages, household industry, bakeries and confectionaries, storage of LPG gas cylinders, burial‐grounds, restaurants and hotels (not exceeding 200 m
2 in floor area), small
butchery,
Printing press, cinema hall, auditoriums, markets for retail goods, weekly markets (if not obstructing traffic circulation and open during non‐working hours), informal markets, multipurpose or junior technical shops, municipal, county and central government offices, police stations,
Public utility buildings like electrical distribution depot, water/sewerage pumping stations, water works, fire stations, telephone exchanges/ mobile tower, matatus station/ boda boda stand (occupying a floor area not exceeding 200 m
2).

7-4
Subdivision size Under the zoning regulations there are regulations regarding subdivision size. In the table below are typical regulations regarding minimum subdivision sizes for different types of industrial development, each of which have been zoned on the plan.
Land utilization Columns 4, 5 and 6 above (ground coverage, plot ratio, and number of floors) illustrate the land use criteria for a particular use class. The application must “show the proposed use and density”, and for this building plans are required. These must include a site plan showing the percentage of land covered and the location of the building(s) in relation to the boundaries. In addition the application must show the building design in sufficient detail to demonstrate that it conforms to the requirements of the table above.
If a proposed building does not conform to the zoning requirements, whether in terms of user or utilisation of the land relative to the appropriate specification for that use class, development permission must be refused.
Land for public purpose The developer of the land must be willing to “surrender land for purposes of principal and secondary means of access” (s 31(2) (a)). In practice this means that land required for roads is transferred from private to public ownership, and the plans must demonstrate that sufficient provision is made for roads. The County has the duty to ensure that the road widths are sufficient for the purpose, as demonstrated by their policy on road widths for different classes of road.
It must also be willing to surrender land for “public purposes consequent upon the proposed development” (s 31(2) (b)). In determining the amount of land to be set aside the County will need to have regard to the scale of the development. The Physical Development Plan should include guidance on this matter. For example under this ISUDP for each neighbourhood of 5,000 people 3.25Ha must be provided for a Primary School.
Prohibited Uses All uses not specifically permitted as above are prohibited in residential zones including the following:
Heavy, large and extensive industries : noxious, obnoxious and hazardous industries,
Warehousing, storage go‐downs of perishables, hazardous, inflammable goods,
Workshops for matatus/ boda boda/buses etc.,
Slaughterhouses, hospitals treating contagious diseases (TB)
Wholesale market, sewage treatment plant/disposal work, water treatment plant, solid waste dumping yards, outdoor games stadium, indoor games stadium, shooting range, international conference centre, courts, sports training centre, reformatory, garrisons, etc.
Zone Type
Min
. P
lot
Siz
e (
Ha) Max.
Ground Coverage (%)
Plo
t R
atio
Maxim
um
No. of
floors
Set-Backs
Front Side Rear
13 Light Industry
0.05 75 1.5 2.00 6 3 3
12 Medium Industry
2 75 2.25 3.00 9 5 5
11 Large Industry
10 75 1.5 2.00 12 9 9
14 Slaughter House
2 75 1.5 2.00 9 5 5
7-5
Health, amenities and convenience of the community generally The County, “when considering a development application” “shall have regard to the health amenities and conveniences of the community generally and to the proper planning and density of development”. This requires that if a development is proposed that is not linked to a water supply and sanitary sewers, and/or is remotely located so that the residents cannot enjoy the convenience of proper planning there are good grounds for refusal even though the zoning may be in conformity with the approved Plan. It should be noted, however, that refusal on grounds of this requirement must only be done if the facts are very clear. If not the decision could be attacked on grounds of irrationality.
7.2.3 Summary If the application meets the requirements of all of the following it must be approved.
Zoning
Subdivision size
Land use/plot coverage criteria
Provision of land for public purposes
Having regard to aspects of health and amenities
If it does not conform to any one of the above criteria is must be rejected.
7.3 Establishing a more efficient system Stakeholder consultations revealed many complaints about the current development control system. It is recommended that the following procedures should be adopted.
1. All fees for planning applications and building permits should be ring-fenced to pay the salaries of the staff employed. This should allow a stronger team of planning staff and building inspectors.
2. All planning should be linked to a GIS data base, thus allowing consistent and fair application of the subdivision and zoning regulations.
Procedure to assess development application in terms of subdivision is presented in Figure 7.1 and Procedure to assess development application in terms of change of use is presented in Figure 7.2.
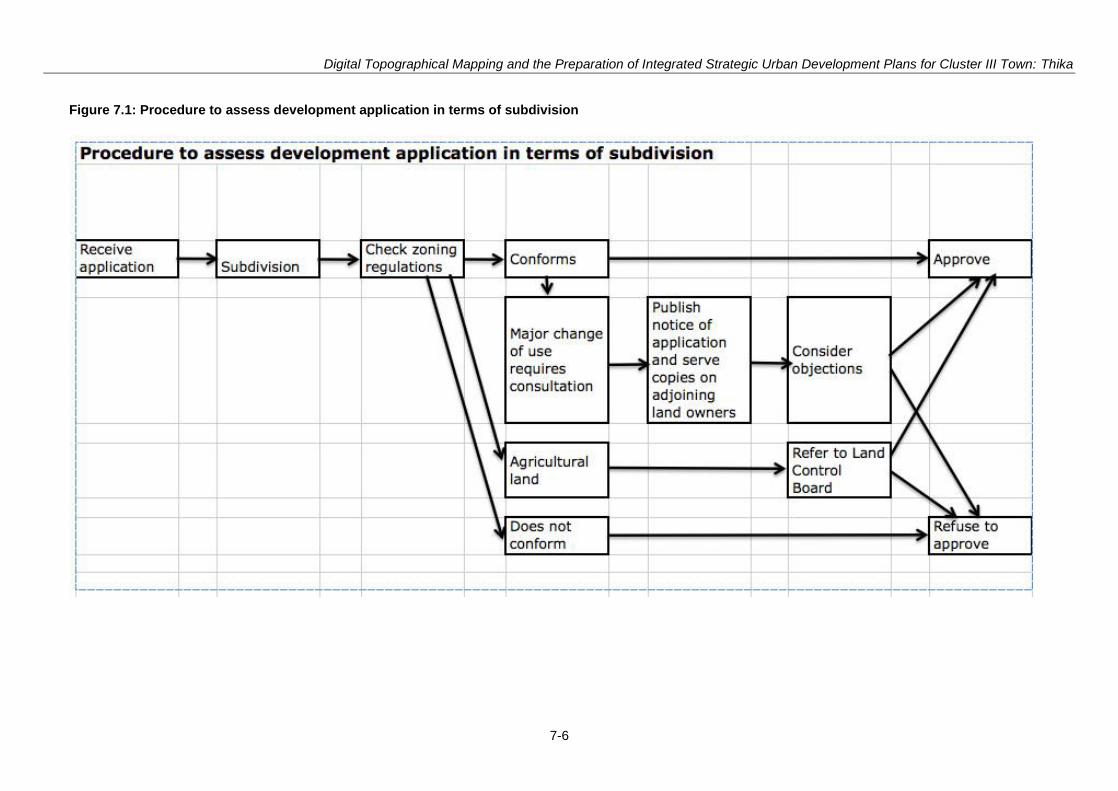
Digital Topographical Mapping and the Preparation of Integrated Strategic Urban Development Plans for Cluster III Town: Thika
7-6
Figure 7.1: Procedure to assess development application in terms of subdivision
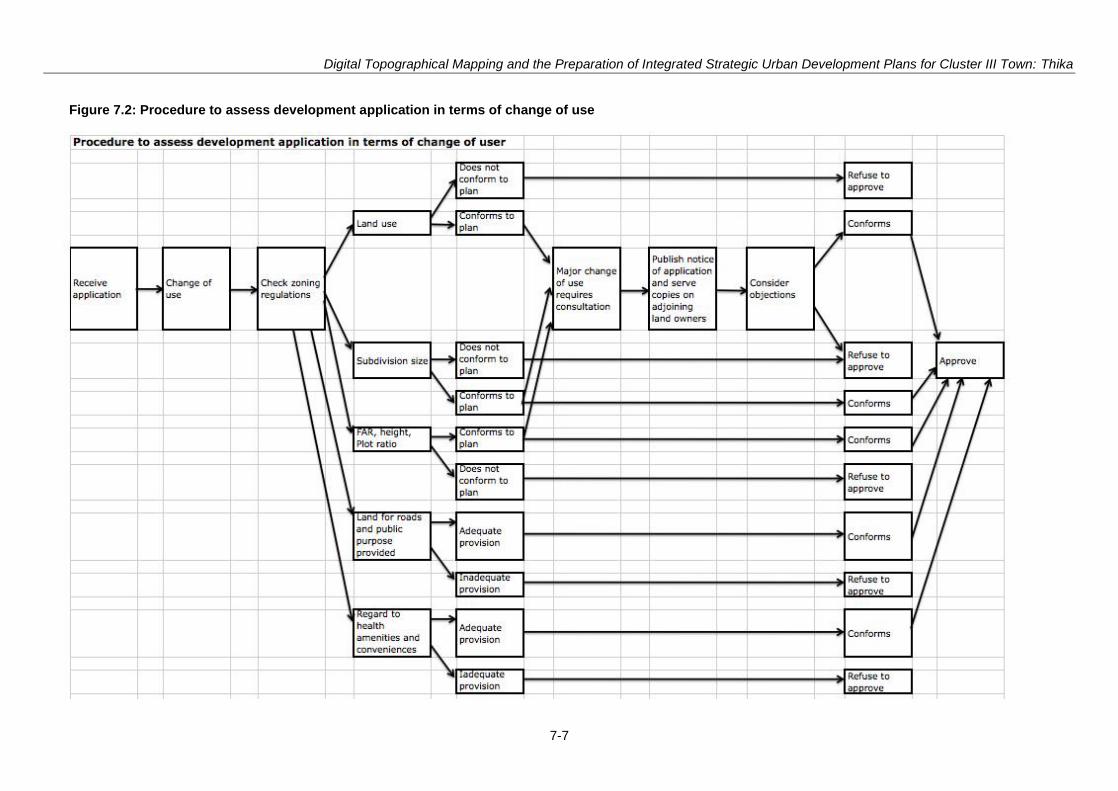
Digital Topographical Mapping and the Preparation of Integrated Strategic Urban Development Plans for Cluster III Town: Thika
7-7
Figure 7.2: Procedure to assess development application in terms of change of use
Digital Topographical Mapping and the Preparation of Integrated Strategic Urban Development Plans for Cluster III Town: Thika
7-8
7.4 Zoning
7.4.1 Why zone? The demand for modern planning arose in the 19
th century from the outcry caused by noxious
factories locating themselves next to residential neighbourhoods, and the need to suitable access roads, water and sewerage.
A long time has passed since then, and the tools for planning have become increasingly powerful. However, the model of the “Development Plan” which was formulated in the 1940s in Britain, in part to guide the redevelopment of post-war Britain, has been found inappropriate in developing countries
3.
There are two reasons for this:
The development plan was designed for a society that was changing relatively slowly
It was designed for a period in which the major urban growth had already taken place – in the 19th
Century, as a result of the industrial revolution, the construction of the railway network, and improved public health in urban areas.
Conditions in the developing world have been very different. On the one hand, urbanisation, especially in Africa, has been rapid to an unprecedented degree. On the other, systems for control, funding for infrastructure, and the poverty of many inhabitants have undermined the good intentions of planners because urbanisation has taken place too fast.
However, there is evidence that the very rapid urbanisation of the past twenty or thirty years is slowing down. Moreover increasing attention is being given to matters of good governance and community participation. These two factors might be conducive to a more orderly urbanisation. Coupled with this is an important realisation of the importance of pro-active planning: being one step ahead, so to speak, instead of one step behind.
For example much urban growth in Kenya has been highly scattered and uncoordinated, resulting in development that is impossible to service efficiently. Moreover, due to the lack of effective planning controls bad neighbour uses such a noxious or noisy industry, solid waste dumps or sewage treatment works are developed side by side with residential, educational or health facilities, for example.
In this matter zoning is therefore of crucial importance. By designating the type of development that should take place in spatial terms planners can ensure that infrastructure is provided economically and efficiently.
7.4.2 The problem of rapid change The history of statutory development plans in Kenya, and most of Africa, is that they are overtaken by rapid urban growth. Planners watch helplessly as they find demand for development in areas outside the official planning area, or multiple demands for change of user from the public. In a word, the plan becomes outdated very quickly. Typically the plans have been prepared by consultants, and the preparation period was often two or more years. Even after preparation there was a cumbersome official approval process. The process was therefore slow and expensive, and beyond the control of the working planner.
As a result of becoming outdated, the plans became redundant, so planners were effectively forced to prepare ad hoc “Part Development Plans” which, in fact, often legitimised scattered and uncoordinated land uses. They were placed under considerable pressure from members of the public and elected representatives to approve such development in the broadly held view that land owners had a basic right to develop their land as they wished.
3 “Local Physical Development Plan” and “Development Plan” are similarly used in Kenya’s Physical
Planning Act
Digital Topographical Mapping and the Preparation of Integrated Strategic Urban Development Plans for Cluster III Town: Thika
7-9
The problem was compounded by the rapid growth of informal settlements by people who could not afford conventional housing and who chose to take the law into their own hands. In Kenya this is aided by landlords who build the maximum lettable space for the minimum cost, without meeting building or planning regulations. The problem has escalated due to the lack of affordable land or housing, so in the majority of cases the poor have had no alternatives.
7.4.3 The concept of strategic planning Strategic planning differs from the traditional statutory development plan in one very important way: it recognises that circumstances change and that plans must also be open to change. However, this does not mean that they should not be followed, but rather that the facility to change should allow them to respond to rapidly evolving social and economic factors.
A strategic plan therefore provides guidance not for the unrealistic timeframe of 20 or 30 years, which was what the traditional development plans aimed to do, but rather the next five or so years. By being flexible in the long term it offers certainty in the short term. This is crucial in the matter of zoning.
To explain in more detail. A well-designed strategic plan provides a framework for urban development over a thirty year period. This framework will designate the location and expected degree of urban growth and will identify the routes of all major arterial roads within that area, thereby protecting their routes for development when necessary. The strategic plan will also designate the areas that are expected to be developed over the next five years. Detailed zoning will be undertaken within this short-term development area, together with infrastructure development for the land being urbanised.
At least every five years a major review of the plan should be held, but in practice the plan should be reviewed and updated annually. This will allow the plan to respond to changing circumstances in terms of the rate of growth or the demand for different uses. In this way, planning will always be ahead of the process, rather than struggling to keep up with it.
7.4.4 Zoning in the context of strategic planning Stakeholders in workshops held with stakeholders in Thika towns complained about zoning matters. The two most common problems were residential areas being too close to industry and people building high-rise housing in single or two storey estates. The explanation offered by offending users is typically “there was no alternative”.
Thus the aim of a strategic plan should always be to be one step ahead in terms of zoning more land for each user-type than is required for immediate future. This is crucial in terms of housing as it has the effect of reducing land prices.
7.4.5 The need for zoning also to be strategic Mixed uses The traditional application of zoning was for each zone to be designated for a single use, and mixed use zones were typically not provided for. However, as discussed above, urban experience throughout the world has demonstrated the value of mixed-use development.
Mixed uses have a number of valuable advantages in inner city areas. The concept allows shop-owners to live near their enterprise. It allows small business to acquire premises at relatively low cost. It reduces travelling time for users. It prevents the phenomenon of dead space at night, thereby enhancing security. Moreover it is cost and space effective.
In residential areas there are also advantages. By allowing small shops and market stalls, the operation of child care and early learning facilities, and small industrial enterprises such as tailoring which have no polluting impacts, the residents have access to increased convenience. Those who operate such facilities have the advantage of being able to work from home. Small offices, provided they do not generate any significant traffic, can also be operated from a private dwelling without any harm to neighbouring residences.
Thus zoning must be able to respond to the needs of present day society always looking to the need to protect against development which will harm the interests of the majority of residents.
Digital Topographical Mapping and the Preparation of Integrated Strategic Urban Development Plans for Cluster III Town: Thika
7-10
Evolving zoning A strategic plan which, as stated above, should be reviewed annually, and be part of a major five-year development cycle, must be able to respond to changes in the demand for different uses and land values.
For example, a residential area which used to be on the periphery of a city and developed as single storey houses on plots of, say, 2000 m
2 will, within twenty years be completely within the urban area.
Land prices will escalate and demand for housing in that area will be massive. This will create a market for high-density town houses, or flats in multi-storey buildings. The zoning for that area should respond, at that time, to that demand by allowing such developments. Thus zoning will be able to respond to a rolling programme of action as the town expands and the nature of demand for land changes.
Zoning regulations for various uses are presented below:
7.4.6 Residential Areas The land use regulations in terms of plot size, plot coverage, density, plot ratio and set-backs are presented in tables below:
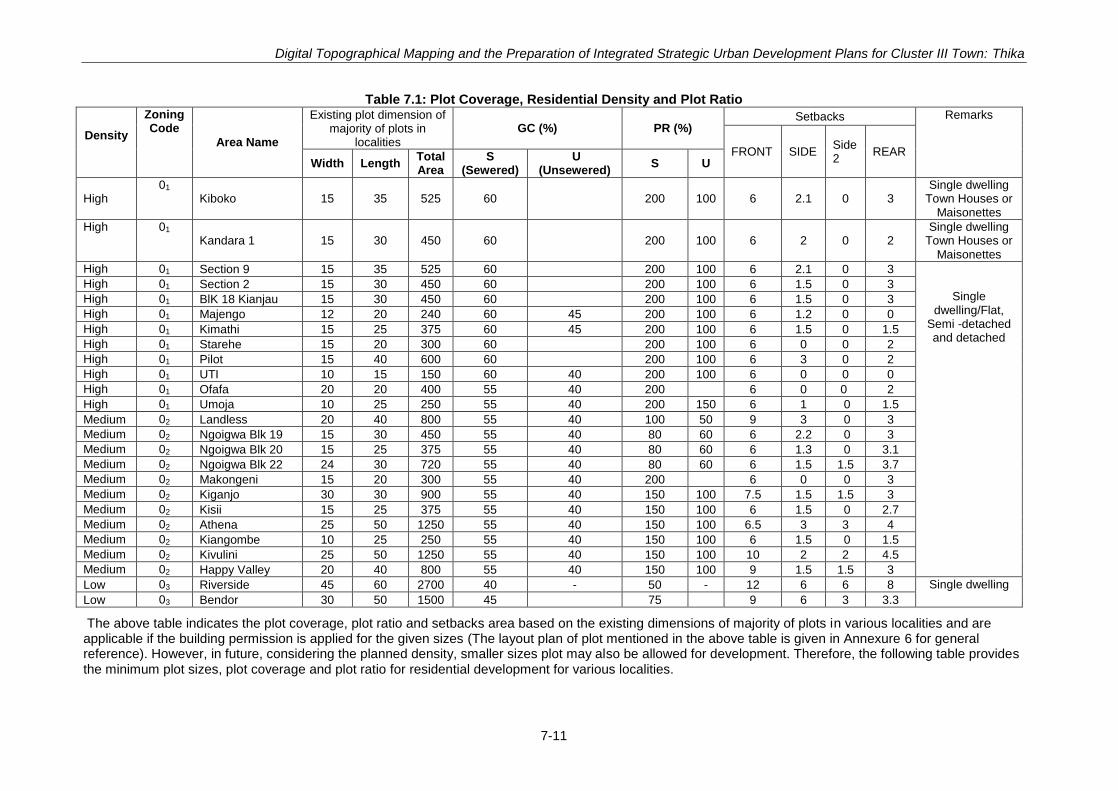
Digital Topographical Mapping and the Preparation of Integrated Strategic Urban Development Plans for Cluster III Town: Thika
7-11
Table 7.1: Plot Coverage, Residential Density and Plot Ratio
Density
Zoning Code
Area Name
Existing plot dimension of majority of plots in
localities
GC (%) PR (%) Setbacks Remarks
FRONT SIDE Side 2
REAR Width Length
Total Area
S (Sewered)
U (Unsewered)
S U
High 01
Kiboko 15 35 525 60 200 100 6 2.1 0 3 Single dwelling
Town Houses or Maisonettes
High 01 Kandara 1 15 30 450 60 200 100 6 2 0 2
Single dwelling Town Houses or
Maisonettes
High 01 Section 9 15 35 525 60 200 100 6 2.1 0 3
Single dwelling/Flat,
Semi -detached and detached
High 01 Section 2 15 30 450 60 200 100 6 1.5 0 3
High 01 BlK 18 Kianjau 15 30 450 60 200 100 6 1.5 0 3
High 01 Majengo 12 20 240 60 45 200 100 6 1.2 0 0
High 01 Kimathi 15 25 375 60 45 200 100 6 1.5 0 1.5
High 01 Starehe 15 20 300 60 200 100 6 0 0 2
High 01 Pilot 15 40 600 60 200 100 6 3 0 2
High 01 UTI 10 15 150 60 40 200 100 6 0 0 0
High 01 Ofafa 20 20 400 55 40 200 6 0 0 2
High 01 Umoja 10 25 250 55 40 200 150 6 1 0 1.5
Medium 02 Landless 20 40 800 55 40 100 50 9 3 0 3
Medium 02 Ngoigwa Blk 19 15 30 450 55 40 80 60 6 2.2 0 3
Medium 02 Ngoigwa Blk 20 15 25 375 55 40 80 60 6 1.3 0 3.1
Medium 02 Ngoigwa Blk 22 24 30 720 55 40 80 60 6 1.5 1.5 3.7
Medium 02 Makongeni 15 20 300 55 40 200 6 0 0 3
Medium 02 Kiganjo 30 30 900 55 40 150 100 7.5 1.5 1.5 3
Medium 02 Kisii 15 25 375 55 40 150 100 6 1.5 0 2.7
Medium 02 Athena 25 50 1250 55 40 150 100 6.5 3 3 4
Medium 02 Kiangombe 10 25 250 55 40 150 100 6 1.5 0 1.5
Medium 02 Kivulini 25 50 1250 55 40 150 100 10 2 2 4.5
Medium 02 Happy Valley 20 40 800 55 40 150 100 9 1.5 1.5 3
Low 03 Riverside 45 60 2700 40 - 50 - 12 6 6 8 Single dwelling
Low 03 Bendor 30 50 1500 45 75 9 6 3 3.3
The above table indicates the plot coverage, plot ratio and setbacks area based on the existing dimensions of majority of plots in various localities and are applicable if the building permission is applied for the given sizes (The layout plan of plot mentioned in the above table is given in Annexure 6 for general reference). However, in future, considering the planned density, smaller sizes plot may also be allowed for development. Therefore, the following table provides the minimum plot sizes, plot coverage and plot ratio for residential development for various localities.
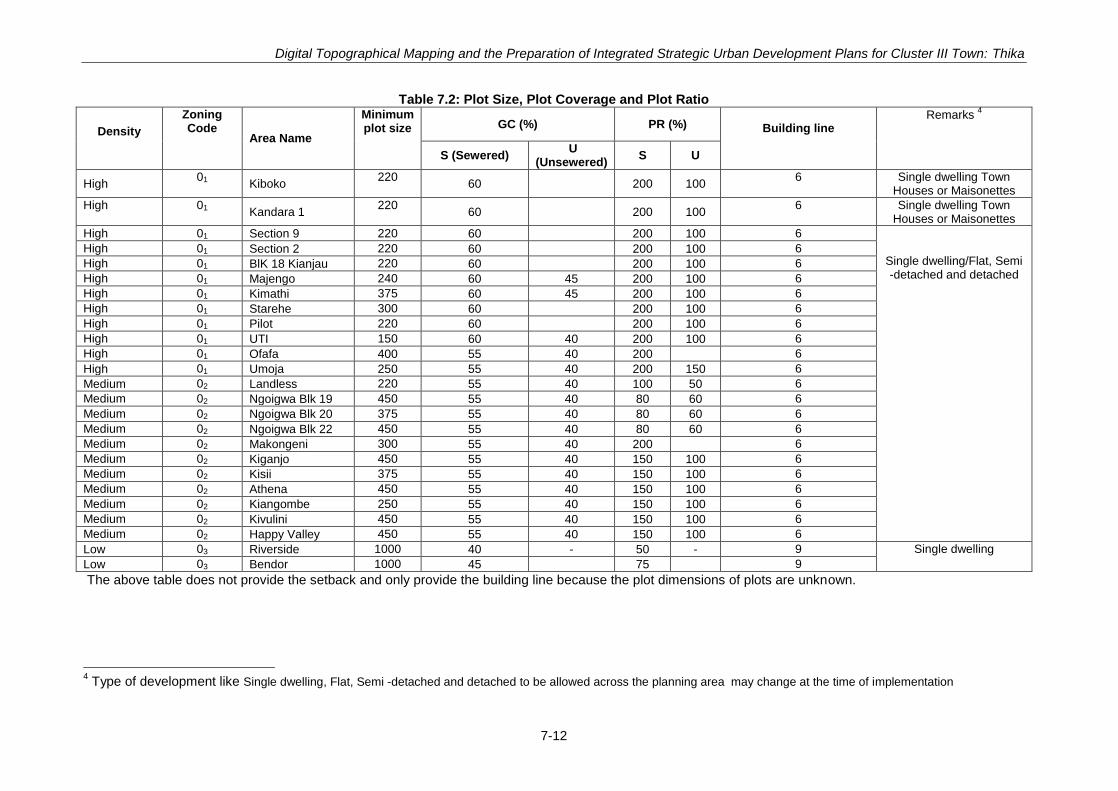
Digital Topographical Mapping and the Preparation of Integrated Strategic Urban Development Plans for Cluster III Town: Thika
7-12
Table 7.2: Plot Size, Plot Coverage and Plot Ratio
Density
Zoning Code
Area Name
Minimum plot size GC (%) PR (%)
Building line
Remarks 4
S (Sewered) U
(Unsewered) S U
High 01 Kiboko
220 60 200 100
6 Single dwelling Town Houses or Maisonettes
High 01 Kandara 1 220
60 200 100 6 Single dwelling Town
Houses or Maisonettes
High 01 Section 9 220 60 200 100 6
Single dwelling/Flat, Semi -detached and detached
High 01 Section 2 220 60 200 100 6
High 01 BlK 18 Kianjau 220 60 200 100 6
High 01 Majengo 240 60 45 200 100 6
High 01 Kimathi 375 60 45 200 100 6
High 01 Starehe 300 60 200 100 6
High 01 Pilot 220 60 200 100 6
High 01 UTI 150 60 40 200 100 6
High 01 Ofafa 400 55 40 200 6
High 01 Umoja 250 55 40 200 150 6
Medium 02 Landless 220 55 40 100 50 6
Medium 02 Ngoigwa Blk 19 450 55 40 80 60 6
Medium 02 Ngoigwa Blk 20 375 55 40 80 60 6
Medium 02 Ngoigwa Blk 22 450 55 40 80 60 6
Medium 02 Makongeni 300 55 40 200 6
Medium 02 Kiganjo 450 55 40 150 100 6
Medium 02 Kisii 375 55 40 150 100 6
Medium 02 Athena 450 55 40 150 100 6
Medium 02 Kiangombe 250 55 40 150 100 6
Medium 02 Kivulini 450 55 40 150 100 6
Medium 02 Happy Valley 450 55 40 150 100 6
Low 03 Riverside 1000 40 - 50 - 9 Single dwelling
Low 03 Bendor 1000 45 75 9
The above table does not provide the setback and only provide the building line because the plot dimensions of plots are unknown.
4 Type of development like Single dwelling, Flat, Semi -detached and detached to be allowed across the planning area may change at the time of implementation
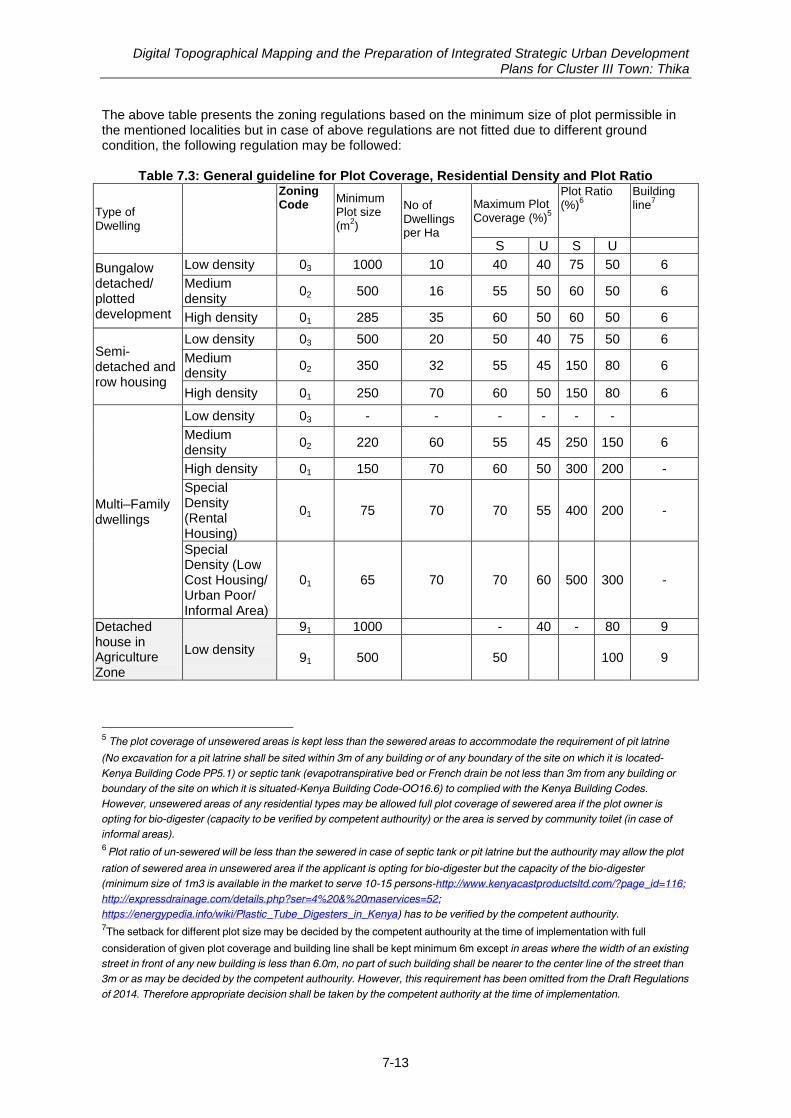
Digital Topographical Mapping and the Preparation of Integrated Strategic Urban Development Plans for Cluster III Town: Thika
7-13
The above table presents the zoning regulations based on the minimum size of plot permissible in the mentioned localities but in case of above regulations are not fitted due to different ground condition, the following regulation may be followed:
Table 7.3: General guideline for Plot Coverage, Residential Density and Plot Ratio
Type of Dwelling
Zoning Code
Minimum Plot size (m
2)
No of Dwellings per Ha
Maximum Plot Coverage (%)
5
Plot Ratio (%)
6
Building line
7
S U S U
Bungalow detached/ plotted development
Low density 03 1000 10 40 40 75 50 6
Medium density
02 500 16 55 50 60 50 6
High density 01 285 35 60 50 60 50 6
Semi-detached and row housing
Low density 03 500 20 50 40 75 50 6
Medium density
02 350 32 55 45 150 80 6
High density 01 250 70 60 50 150 80 6
Multi–Family dwellings
Low density 03 - - - - - -
Medium density
02 220 60 55 45 250 150 6
High density 01 150 70 60 50 300 200 -
Special Density (Rental Housing)
01 75 70 70 55 400 200 -
Special Density (Low Cost Housing/ Urban Poor/ Informal Area)
01 65 70 70 60 500 300 -
Detached house in Agriculture Zone
Low density
91 1000
- 40 - 80 9
91 500
50 100 9
5 The plot coverage of unsewered areas is kept less than the sewered areas to accommodate the requirement of pit latrine
(No excavation for a pit latrine shall be sited within 3m of any building or of any boundary of the site on which it is located-
Kenya Building Code PP5.1) or septic tank (evapotranspirative bed or French drain be not less than 3m from any building or
boundary of the site on which it is situated-Kenya Building Code-OO16.6) to complied with the Kenya Building Codes.
However, unsewered areas of any residential types may be allowed full plot coverage of sewered area if the plot owner is
opting for bio-digester (capacity to be verified by competent authourity) or the area is served by community toilet (in case of
informal areas). 6
Plot ratio of un-sewered will be less than the sewered in case of septic tank or pit latrine but the authourity may allow the plot
ration of sewered area in unsewered area if the applicant is opting for bio-digester but the capacity of the bio-digester
(minimum size of 1m3 is available in the market to serve 10-15 persons-http://www.kenyacastproductsltd.com/?page_id=116;
http://expressdrainage.com/details.php?ser=4%20&%20maservices=52;
https://energypedia.info/wiki/Plastic_Tube_Digesters_in_Kenya) has to be verified by the competent authourity. 7The setback for different plot size may be decided by the competent authourity at the time of implementation with full
consideration of given plot coverage and building line shall be kept minimum 6m except in areas where the width of an existing
street in front of any new building is less than 6.0m, no part of such building shall be nearer to the center line of the street than
3m or as may be decided by the competent authourity. However, this requirement has been omitted from the Draft Regulations
of 2014. Therefore appropriate decision shall be taken by the competent authority at the time of implementation.
Digital Topographical Mapping and the Preparation of Integrated Strategic Urban Development Plans for Cluster III Town: Thika
7-14
Parking norms for residential development: The generally principle to be followed is one car parking space per 100m
2 gross built area (refer
„Table B1: Car Parking in Buildings‟ of Kenya Planning and Building regulations 2009) and considering the different bedroom dwelling units in the town, the following parking norms has to be followed for parking in residential areas:
1 Parking Space per 2 (1-bedroom dwelling Unit)
1 Parking Space per 1 (2-bedroom dwelling Unit)
1.5 parking Space per 1 (3-bedroom dwelling Unit)
Road Network: No new road shall be less that 9m carriage way in the new areas.
Building line: No person shall erect any building other than a boundary wall or other fence nearer to the road than such building line may be so prescribed: Provided that at the discretion of the County Physical Planning Department or competent authority such building line may vary in distance, from the road boundary throughout a road or part thereof: Such building line shall generally be in accordance with specification described below:
a) where roads range between 6m-18m in width the building line shall be 6m; b) for any road above 18m in width the building line shall be 9m. c) for existing road with less than 6m wide d) Where the width of an existing street in front of any new building is less than 6.0m, no part
of such building shall be nearer to the center line of the street than 3m.
Dead-end Streets (Cul-de-sac): A dead-end-street should be aligned in such a way that it shall give access to not more than 8 to 10 residential plots and it should not exceed 60 m in length and shall have a turning radius of at least 15m Hammerhead.
Activities allowed in Residential Zones Permitted Uses
Residence – Bungalow, maisonette, multi-family dwelling (multi-storey flats/apartments), row housing, detached, semi-detached, residential-cum-work,
Hostels, renting houses, old age home, community hall, police post, guest houses (not exceeding 200 m
2 in floor area),
Day care centre, kindergartens, parks and playground
Corner shops, small shopping centres, health facilities (dispensaries, nursing home, etc.),
Educational buildings, religious premises, library, gymnasium, park, technical training centre, exhibition and art gallery, clubs, banks/ ATM, matatus stop/boda boda stand (not
exceeding 100 m2 in floor area), post offices, hostels of non‐commercial nature, etc.
Restricted Uses/Uses Permitted with Special Sanction of the Competent Authority
Night shelters, petrol pumps, motor vehicle repairing workshop/garages, household industry, bakeries and confectionaries, storage of LPG gas cylinders, burial‐grounds, restaurants and hotels (not exceeding 200 m
2 in floor area), small butchery,
Printing press, cinema hall, auditoriums, markets for retail goods, weekly markets (if not obstructing traffic circulation and open during non‐working hours), informal markets, multipurpose or junior technical shops, municipal, county and central government offices, police stations,
Public utility buildings like electrical distribution depot, water/sewerage pumping stations, water works, fire stations, telephone exchanges/ mobile tower, matatus station/ boda boda stand (occupying a floor area not exceeding 200 m
2)
Prohibited Uses All uses not specifically permitted as above are prohibited in residential zones including the following:
Heavy, large and extensive industries : noxious, obnoxious and hazardous industries,
Warehousing, storage go‐downs of perishables, hazardous, inflammable goods,
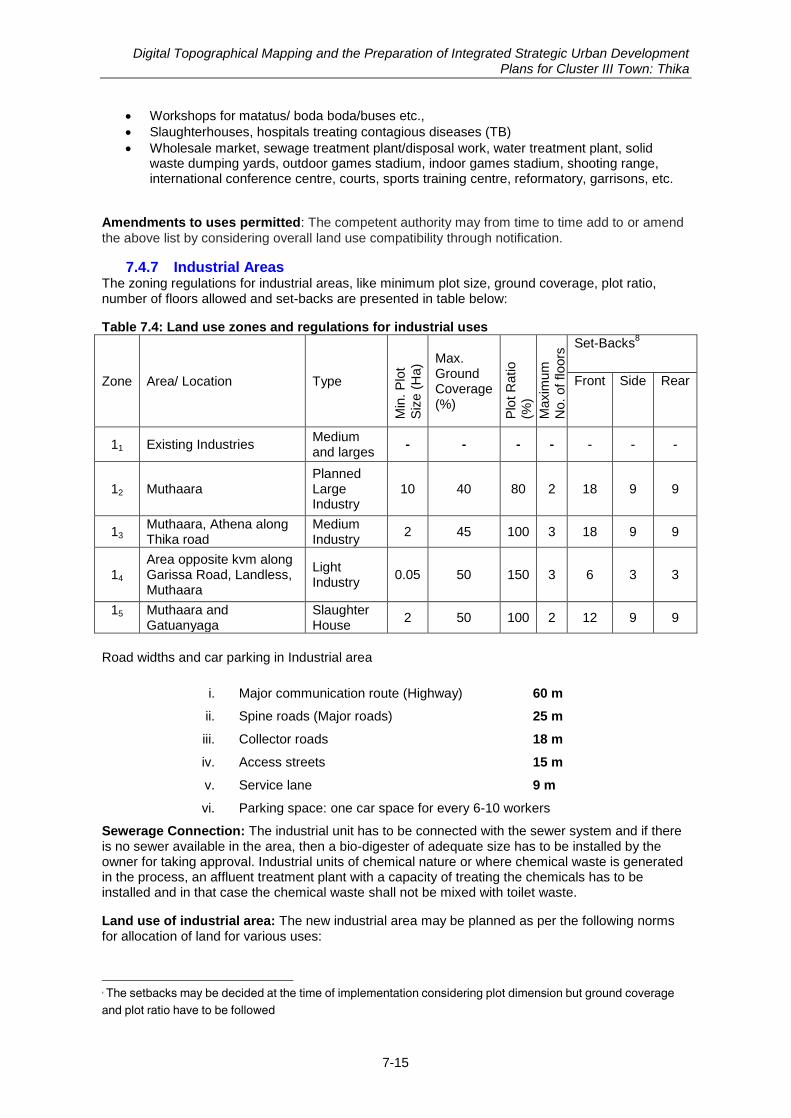
Digital Topographical Mapping and the Preparation of Integrated Strategic Urban Development Plans for Cluster III Town: Thika
7-15
Workshops for matatus/ boda boda/buses etc.,
Slaughterhouses, hospitals treating contagious diseases (TB)
Wholesale market, sewage treatment plant/disposal work, water treatment plant, solid waste dumping yards, outdoor games stadium, indoor games stadium, shooting range, international conference centre, courts, sports training centre, reformatory, garrisons, etc.
Amendments to uses permitted: The competent authority may from time to time add to or amend
the above list by considering overall land use compatibility through notification.
7.4.7 Industrial Areas The zoning regulations for industrial areas, like minimum plot size, ground coverage, plot ratio, number of floors allowed and set-backs are presented in table below:
Table 7.4: Land use zones and regulations for industrial uses
Zone Area/ Location Type
Min
. P
lot
Siz
e (
Ha) Max.
Ground Coverage (%)
Plo
t R
atio
(%)
Maxim
um
No. of
floors
Set-Backs8
Front Side Rear
11 Existing Industries Medium and larges
- - - - - - -
12 Muthaara Planned Large Industry
10 40 80 2 18 9 9
13 Muthaara, Athena along Thika road
Medium Industry
2 45 100 3 18 9 9
14 Area opposite kvm along Garissa Road, Landless, Muthaara
Light Industry
0.05 50 150 3 6 3 3
15 Muthaara and Gatuanyaga
Slaughter House
2 50 100 2 12 9 9
Road widths and car parking in Industrial area
i. Major communication route (Highway) 60 m
ii. Spine roads (Major roads) 25 m
iii. Collector roads 18 m
iv. Access streets 15 m
v. Service lane 9 m
vi. Parking space: one car space for every 6-10 workers
Sewerage Connection: The industrial unit has to be connected with the sewer system and if there is no sewer available in the area, then a bio-digester of adequate size has to be installed by the owner for taking approval. Industrial units of chemical nature or where chemical waste is generated in the process, an affluent treatment plant with a capacity of treating the chemicals has to be installed and in that case the chemical waste shall not be mixed with toilet waste.
Land use of industrial area: The new industrial area may be planned as per the following norms for allocation of land for various uses:
8 The setbacks may be decided at the time of implementation considering plot dimension but ground coverage
and plot ratio have to be followed
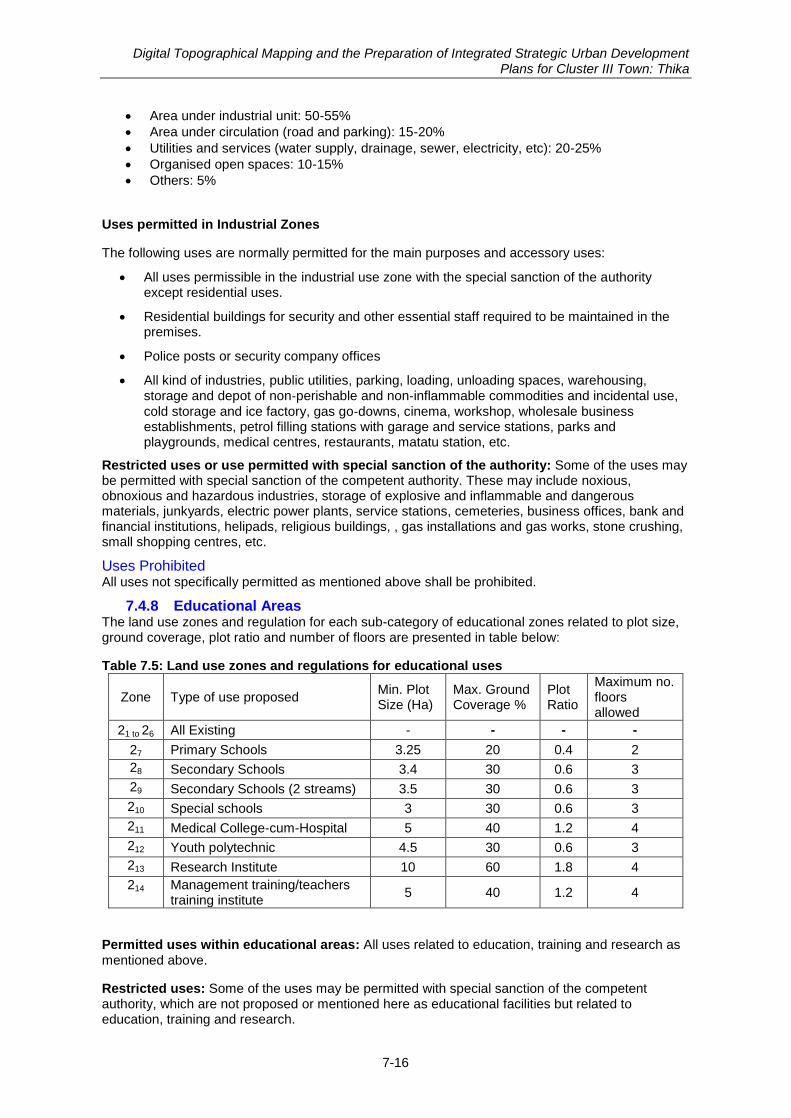
Digital Topographical Mapping and the Preparation of Integrated Strategic Urban Development Plans for Cluster III Town: Thika
7-16
Area under industrial unit: 50-55%
Area under circulation (road and parking): 15-20%
Utilities and services (water supply, drainage, sewer, electricity, etc): 20-25%
Organised open spaces: 10-15%
Others: 5%
Uses permitted in Industrial Zones
The following uses are normally permitted for the main purposes and accessory uses:
All uses permissible in the industrial use zone with the special sanction of the authority except residential uses.
Residential buildings for security and other essential staff required to be maintained in the premises.
Police posts or security company offices
All kind of industries, public utilities, parking, loading, unloading spaces, warehousing, storage and depot of non‐perishable and non‐inflammable commodities and incidental use,
cold storage and ice factory, gas go‐downs, cinema, workshop, wholesale business establishments, petrol filling stations with garage and service stations, parks and playgrounds, medical centres, restaurants, matatu station, etc.
Restricted uses or use permitted with special sanction of the authority: Some of the uses may be permitted with special sanction of the competent authority. These may include noxious, obnoxious and hazardous industries, storage of explosive and inflammable and dangerous materials, junkyards, electric power plants, service stations, cemeteries, business offices, bank and financial institutions, helipads, religious buildings, , gas installations and gas works, stone crushing, small shopping centres, etc.
Uses Prohibited All uses not specifically permitted as mentioned above shall be prohibited.
7.4.8 Educational Areas The land use zones and regulation for each sub-category of educational zones related to plot size, ground coverage, plot ratio and number of floors are presented in table below:
Table 7.5: Land use zones and regulations for educational uses
Zone Type of use proposed Min. Plot Size (Ha)
Max. Ground Coverage %
Plot Ratio
Maximum no. floors allowed
21 to 26 All Existing - - - -
27 Primary Schools 3.25 20 0.4 2
28 Secondary Schools 3.4 30 0.6 3
29 Secondary Schools (2 streams) 3.5 30 0.6 3
210 Special schools 3 30 0.6 3
211 Medical College-cum-Hospital 5 40 1.2 4
212 Youth polytechnic 4.5 30 0.6 3
213 Research Institute 10 60 1.8 4
214 Management training/teachers training institute
5 40 1.2 4
Permitted uses within educational areas: All uses related to education, training and research as
mentioned above.
Restricted uses: Some of the uses may be permitted with special sanction of the competent authority, which are not proposed or mentioned here as educational facilities but related to education, training and research.
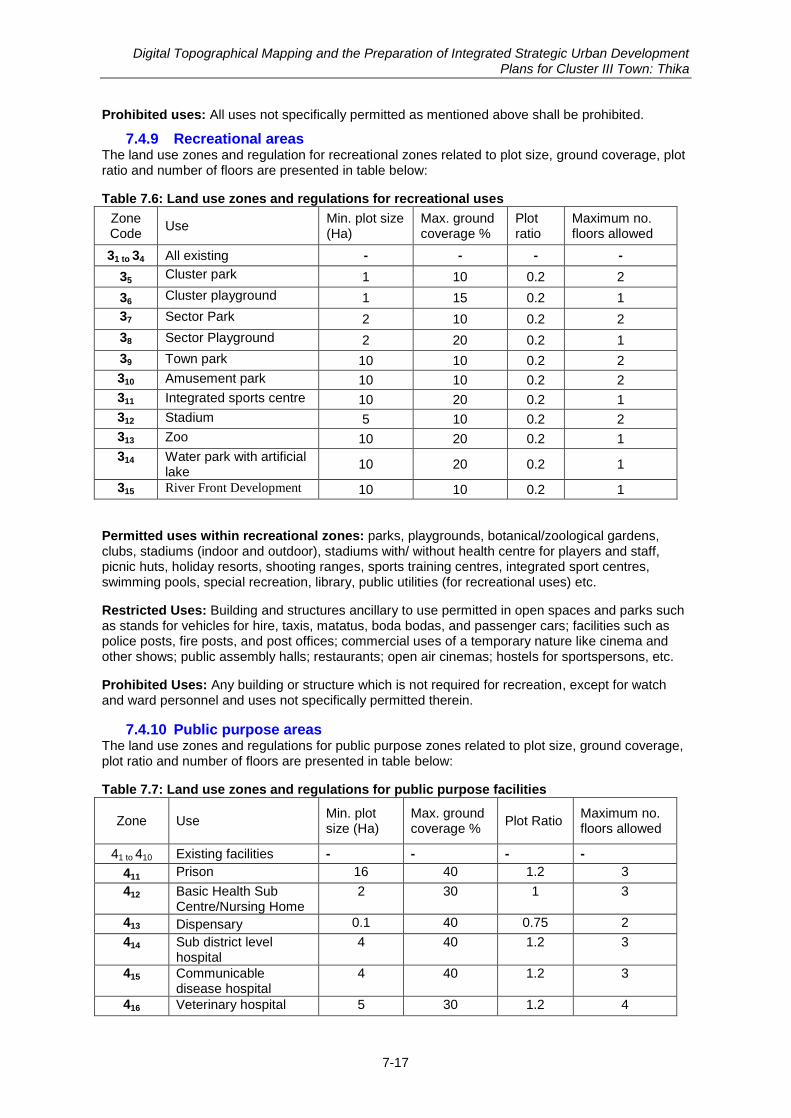
Digital Topographical Mapping and the Preparation of Integrated Strategic Urban Development Plans for Cluster III Town: Thika
7-17
Prohibited uses: All uses not specifically permitted as mentioned above shall be prohibited.
7.4.9 Recreational areas The land use zones and regulation for recreational zones related to plot size, ground coverage, plot ratio and number of floors are presented in table below:
Table 7.6: Land use zones and regulations for recreational uses
Zone Code
Use Min. plot size (Ha)
Max. ground coverage %
Plot ratio
Maximum no. floors allowed
31 to 34 All existing - - - -
35 Cluster park 1 10 0.2 2
36 Cluster playground 1 15 0.2 1
37 Sector Park 2 10 0.2 2
38 Sector Playground 2 20 0.2 1
39 Town park 10 10 0.2 2
310 Amusement park 10 10 0.2 2
311 Integrated sports centre 10 20 0.2 1
312 Stadium 5 10 0.2 2
313 Zoo 10 20 0.2 1
314 Water park with artificial lake
10 20 0.2 1
315 River Front Development 10 10 0.2 1
Permitted uses within recreational zones: parks, playgrounds, botanical/zoological gardens, clubs, stadiums (indoor and outdoor), stadiums with/ without health centre for players and staff, picnic huts, holiday resorts, shooting ranges, sports training centres, integrated sport centres, swimming pools, special recreation, library, public utilities (for recreational uses) etc.
Restricted Uses: Building and structures ancillary to use permitted in open spaces and parks such as stands for vehicles for hire, taxis, matatus, boda bodas, and passenger cars; facilities such as police posts, fire posts, and post offices; commercial uses of a temporary nature like cinema and other shows; public assembly halls; restaurants; open air cinemas; hostels for sportspersons, etc.
Prohibited Uses: Any building or structure which is not required for recreation, except for watch and ward personnel and uses not specifically permitted therein.
7.4.10 Public purpose areas The land use zones and regulations for public purpose zones related to plot size, ground coverage, plot ratio and number of floors are presented in table below:
Table 7.7: Land use zones and regulations for public purpose facilities
Zone Use Min. plot size (Ha)
Max. ground coverage %
Plot Ratio Maximum no. floors allowed
41 to 410 Existing facilities - - - -
411 Prison 16 40 1.2 3
412 Basic Health Sub Centre/Nursing Home
2 30 1 3
413 Dispensary 0.1 40 0.75 2
414 Sub district level hospital
4 40 1.2 3
415 Communicable disease hospital
4 40 1.2 3
416 Veterinary hospital 5 30 1.2 4
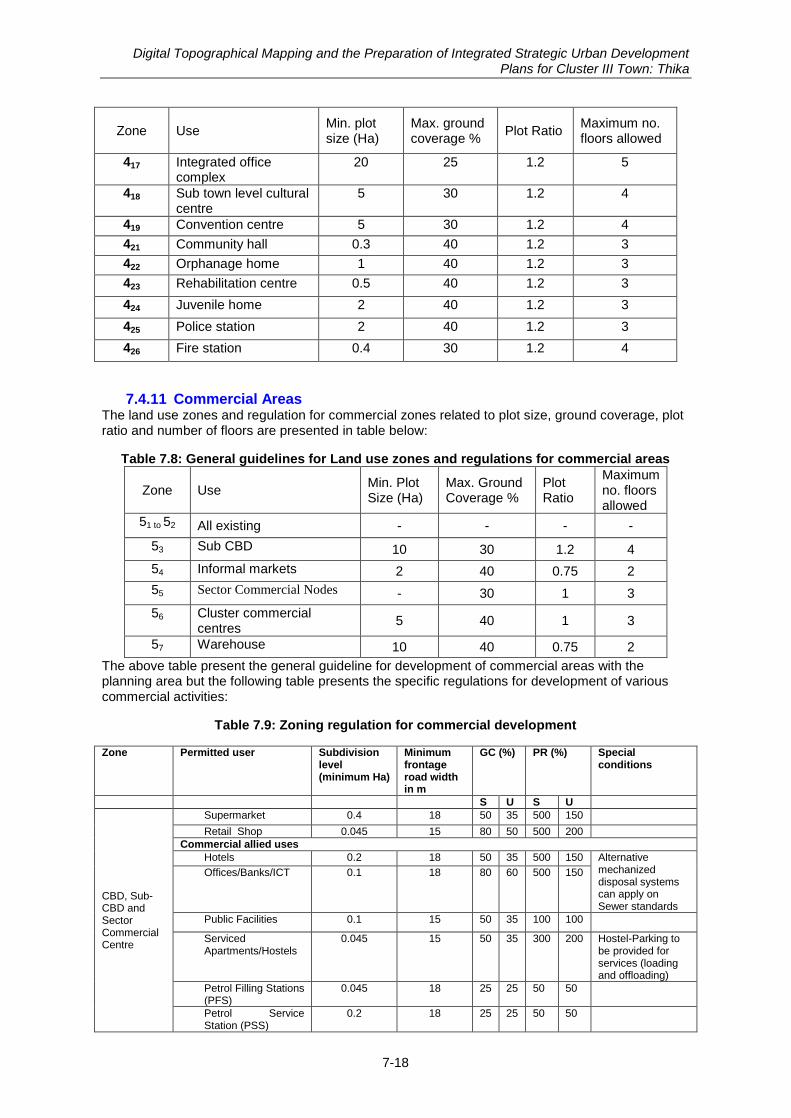
Digital Topographical Mapping and the Preparation of Integrated Strategic Urban Development Plans for Cluster III Town: Thika
7-18
Zone Use Min. plot size (Ha)
Max. ground coverage %
Plot Ratio Maximum no. floors allowed
417 Integrated office complex
20 25 1.2 5
418 Sub town level cultural centre
5 30 1.2 4
419 Convention centre 5 30 1.2 4
421 Community hall 0.3 40 1.2 3
422 Orphanage home 1 40 1.2 3
423 Rehabilitation centre 0.5 40 1.2 3
424 Juvenile home 2 40 1.2 3
425 Police station 2 40 1.2 3
426 Fire station 0.4 30 1.2 4
7.4.11 Commercial Areas The land use zones and regulation for commercial zones related to plot size, ground coverage, plot ratio and number of floors are presented in table below:
Table 7.8: General guidelines for Land use zones and regulations for commercial areas
Zone Use Min. Plot Size (Ha)
Max. Ground Coverage %
Plot Ratio
Maximum no. floors allowed
51 to 52 All existing - - - -
53 Sub CBD 10 30 1.2 4
54 Informal markets 2 40 0.75 2
55 Sector Commercial Nodes - 30 1 3
56 Cluster commercial centres
5 40 1 3
57 Warehouse 10 40 0.75 2
The above table present the general guideline for development of commercial areas with the planning area but the following table presents the specific regulations for development of various commercial activities:
Table 7.9: Zoning regulation for commercial development
Zone Permitted user Subdivision level (minimum Ha)
Minimum frontage road width in m
GC (%) PR (%) Special conditions
S U S U
CBD, Sub-CBD and Sector Commercial Centre
Supermarket 0.4 18 50 35 500 150
Retail Shop 0.045 15 80 50 500 200
Commercial allied uses
Hotels 0.2 18 50 35 500 150 Alternative mechanized disposal systems can apply on Sewer standards
Offices/Banks/ICT 0.1 18 80 60 500 150
Public Facilities 0.1 15 50 35 100 100
Serviced Apartments/Hostels
0.045 15 50 35 300 200 Hostel-Parking to be provided for services (loading and offloading)
Petrol Filling Stations (PFS)
0.045 18 25 25 50 50
Petrol Service Station (PSS)
0.2 18 25 25 50 50

Digital Topographical Mapping and the Preparation of Integrated Strategic Urban Development Plans for Cluster III Town: Thika
7-19
Light industry/Showrooms
0.045 15 80 50 250 150
Transportation Parking yard
0.4 18 Temporary
Parking silo
0.2 18 80 60 500 200
Informal Market
Retail Shop 0.010 6 90 90 90 80 To be served with community toilet. One toilet/ per 50 shops
Vegetable kiosk 0.010 6 90 90 90 90
Eating place/ Restaurant
0.015 6 60 60 90 60 In case of bio-digester is full plot ration may be allowed
Mixed Commercial
All commercial activities (along road more than15m wide)
0.010 6 60 60 150 80 In case of bio-digester is full plot ration may be allowed All commercial
activities (along road less than15m wide)
0.005 - 60 60 150 80
Other regulations for CBD, Sub-CBDs and Sector Commercial Centre are as below:
a. Minimum plot size shall be 0.045 Ha (the plot length vs. width should not be
more than 1:2)
b. Primary distributors shall be ≥ 30 metres wide
c. Local distributors shall be ≥ 15 metres wide,
Provide 6 metres service lane
Provide 6 metres lane (break) after every 60 metres distance
d. Parking requirement - 1 car park per 80 m2 of covered area
e. Road truncation should be half the width of the adjoining road
f. Building line: 3m for plots fronting road reserve ≤ 15m; 0m for ≥ 18m
g. Access: no direct access to/ from National Road networks
Permitted uses in commercial areas: Shops, convenience/neighbourhood shopping centre, local shopping centres, cluster centre, sub-CBDs, professional offices, work places/offices, banks, stock exchange/financial institutions, bakeries and confectionaries, cinema halls/theatres, malls, banqueting halls, guest houses, restaurants, hotels, petrol pumps, warehousing, general business, wholesale, hostel/boarding housing, banks/ ATM, auditoriums, commercial service centres/garages/workshop, wedding halls, weekly/informal markets, libraries, parks/open space, museums, police stations/posts, matatu stands, boda boda stands, parking sites, post offices, government/ institutional offices, etc.
Restricted Uses: Non‐polluting, non‐obnoxious light industries, warehousing/storage go‐downs of perishable, inflammable goods, coal, wood, timber yards, bus and truck depots, gas installation and
gas works, poly‐techniques and higher technical institutes, junk yards, railway stations, sports/stadium and public utility installation, religious buildings, hospitals and nursing homes.
Prohibited Uses: All uses not specifically mentioned above are prohibited in this zone.
7.4.12 Transportation areas zoning regulations The zoning regulations for broad transportation proposals for truck terminals, bus parks and matatu stations are shown in table below:
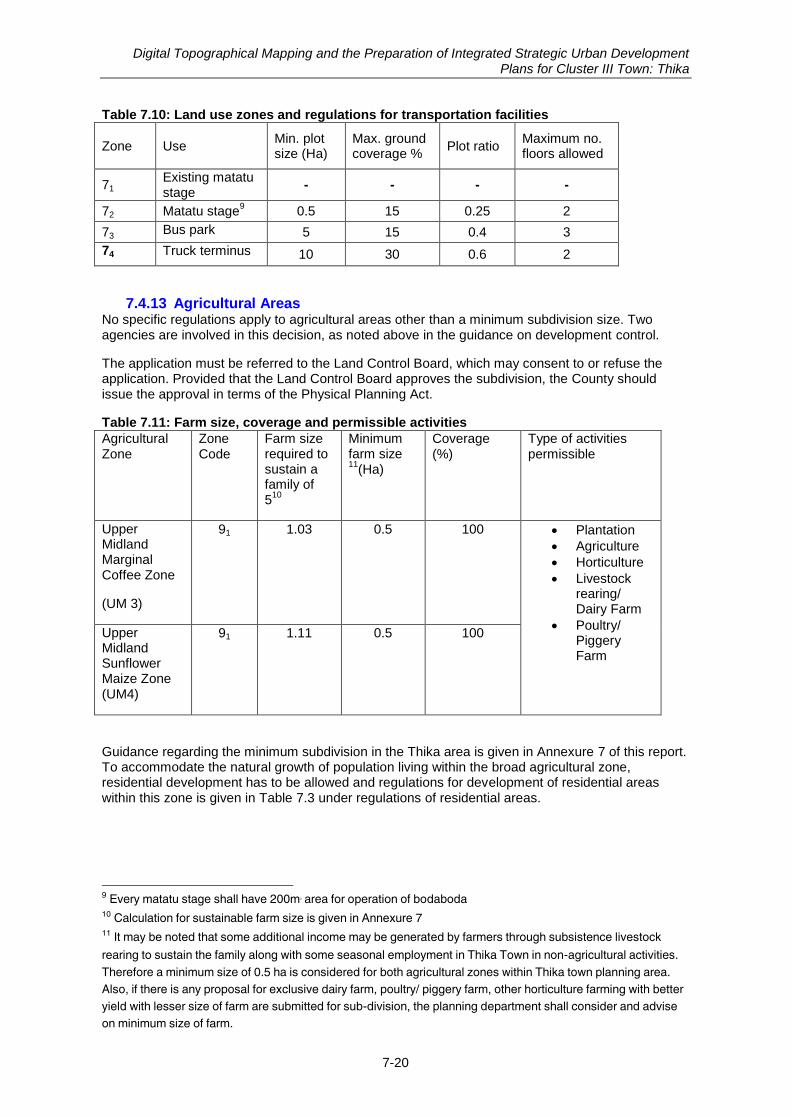
Digital Topographical Mapping and the Preparation of Integrated Strategic Urban Development Plans for Cluster III Town: Thika
7-20
Table 7.10: Land use zones and regulations for transportation facilities
Zone Use Min. plot size (Ha)
Max. ground coverage %
Plot ratio Maximum no. floors allowed
71 Existing matatu stage
- - - -
72 Matatu stage9 0.5 15 0.25 2
73 Bus park 5 15 0.4 3
74 Truck terminus 10 30 0.6 2
7.4.13 Agricultural Areas No specific regulations apply to agricultural areas other than a minimum subdivision size. Two agencies are involved in this decision, as noted above in the guidance on development control.
The application must be referred to the Land Control Board, which may consent to or refuse the application. Provided that the Land Control Board approves the subdivision, the County should issue the approval in terms of the Physical Planning Act.
Table 7.11: Farm size, coverage and permissible activities
Agricultural Zone
Zone Code
Farm size required to sustain a family of 5
10
Minimum farm size 11
(Ha)
Coverage (%)
Type of activities permissible
Upper Midland Marginal Coffee Zone
(UM 3)
91 1.03 0.5 100 Plantation
Agriculture
Horticulture
Livestock rearing/ Dairy Farm
Poultry/ Piggery Farm
Upper Midland Sunflower Maize Zone (UM4)
91 1.11 0.5 100
Guidance regarding the minimum subdivision in the Thika area is given in Annexure 7 of this report. To accommodate the natural growth of population living within the broad agricultural zone, residential development has to be allowed and regulations for development of residential areas within this zone is given in Table 7.3 under regulations of residential areas.
9 Every matatu stage shall have 200m2 area for operation of bodaboda 10 Calculation for sustainable farm size is given in Annexure 7 11 It may be noted that some additional income may be generated by farmers through subsistence livestock
rearing to sustain the family along with some seasonal employment in Thika Town in non-agricultural activities.
Therefore a minimum size of 0.5 ha is considered for both agricultural zones within Thika town planning area.
Also, if there is any proposal for exclusive dairy farm, poultry/ piggery farm, other horticulture farming with better
yield with lesser size of farm are submitted for sub-division, the planning department shall consider and advise
on minimum size of farm.
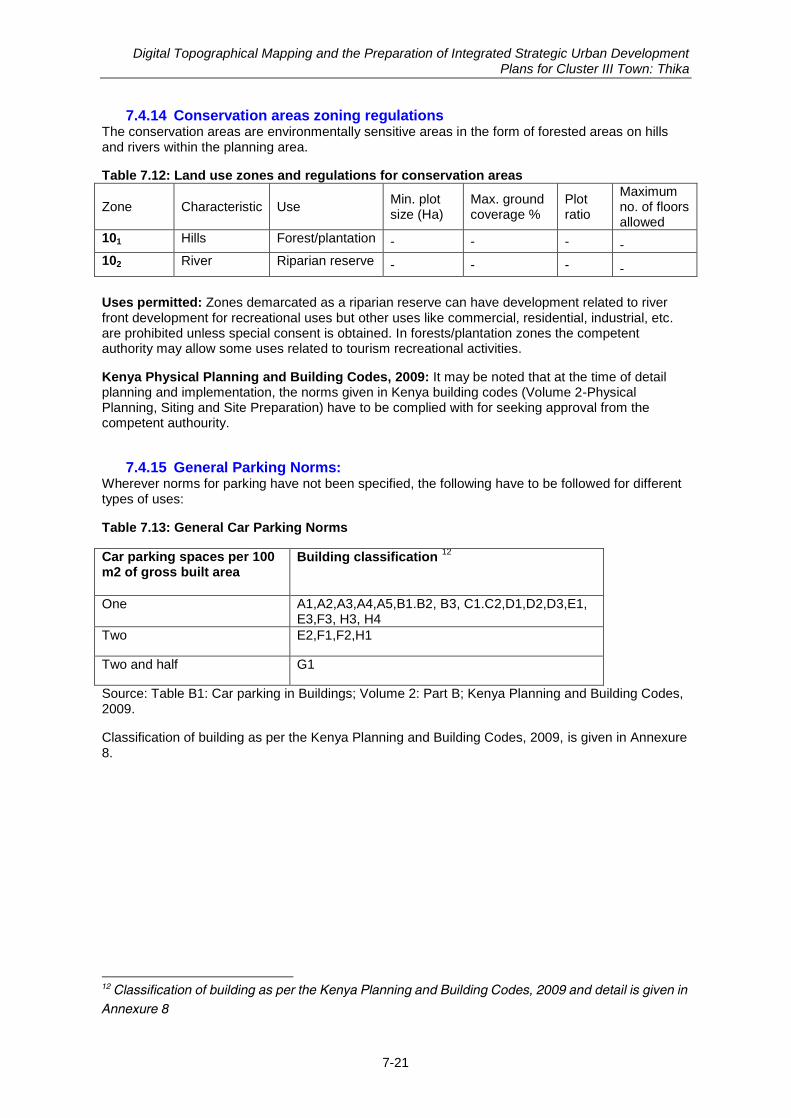
Digital Topographical Mapping and the Preparation of Integrated Strategic Urban Development Plans for Cluster III Town: Thika
7-21
7.4.14 Conservation areas zoning regulations The conservation areas are environmentally sensitive areas in the form of forested areas on hills and rivers within the planning area.
Table 7.12: Land use zones and regulations for conservation areas
Zone Characteristic Use Min. plot size (Ha)
Max. ground coverage %
Plot ratio
Maximum no. of floors allowed
101 Hills Forest/plantation - - - -
102 River Riparian reserve - - - -
Uses permitted: Zones demarcated as a riparian reserve can have development related to river front development for recreational uses but other uses like commercial, residential, industrial, etc. are prohibited unless special consent is obtained. In forests/plantation zones the competent authority may allow some uses related to tourism recreational activities.
Kenya Physical Planning and Building Codes, 2009: It may be noted that at the time of detail planning and implementation, the norms given in Kenya building codes (Volume 2-Physical Planning, Siting and Site Preparation) have to be complied with for seeking approval from the competent authourity.
7.4.15 General Parking Norms: Wherever norms for parking have not been specified, the following have to be followed for different types of uses:
Table 7.13: General Car Parking Norms
Car parking spaces per 100 m2 of gross built area
Building classification 12
One A1,A2,A3,A4,A5,B1.B2, B3, C1.C2,D1,D2,D3,E1, E3,F3, H3, H4
Two E2,F1,F2,H1
Two and half G1
Source: Table B1: Car parking in Buildings; Volume 2: Part B; Kenya Planning and Building Codes, 2009.
Classification of building as per the Kenya Planning and Building Codes, 2009, is given in Annexure 8.
12 Classification of building as per the Kenya Planning and Building Codes, 2009 and detail is given in
Annexure 8
Consultancy Services for Digital Topographical Mapping and the Preparation of Integrated Strategic Urban Development Plans for Cluster III Towns-Thika
8-1
8 Implementation
8.1 Implementation Plan
8.1.1 Introduction The Implementation Plan for ISUDP defines how the plan will be implemented on ground over a period of time. The plan contains the physical manifestation on ground and institutional responsibility to implement various projects. Integrated Strategic Urban Development Plan (ISUDP) comprises proposal for the overall development of Thika town planning area. These proposals include projects related to physical infrastructure (water supply, sewerage, solid waste management, storm water drainage, etc.), transport system improvement, economic development, urban environment and disaster management, tourism and heritage development, institutional development, financial management, etc.
The physical implementation plan contains the time period for various activities of all the identified project for short term, medium term and long terms along with list of government department responsible for implementation.
Here sector-wise physical implementation plan along with listing of institutions responsibility is presented:
8.1.2 Sectoral implementation charts The implementation programme for each sector is contained in the charts below
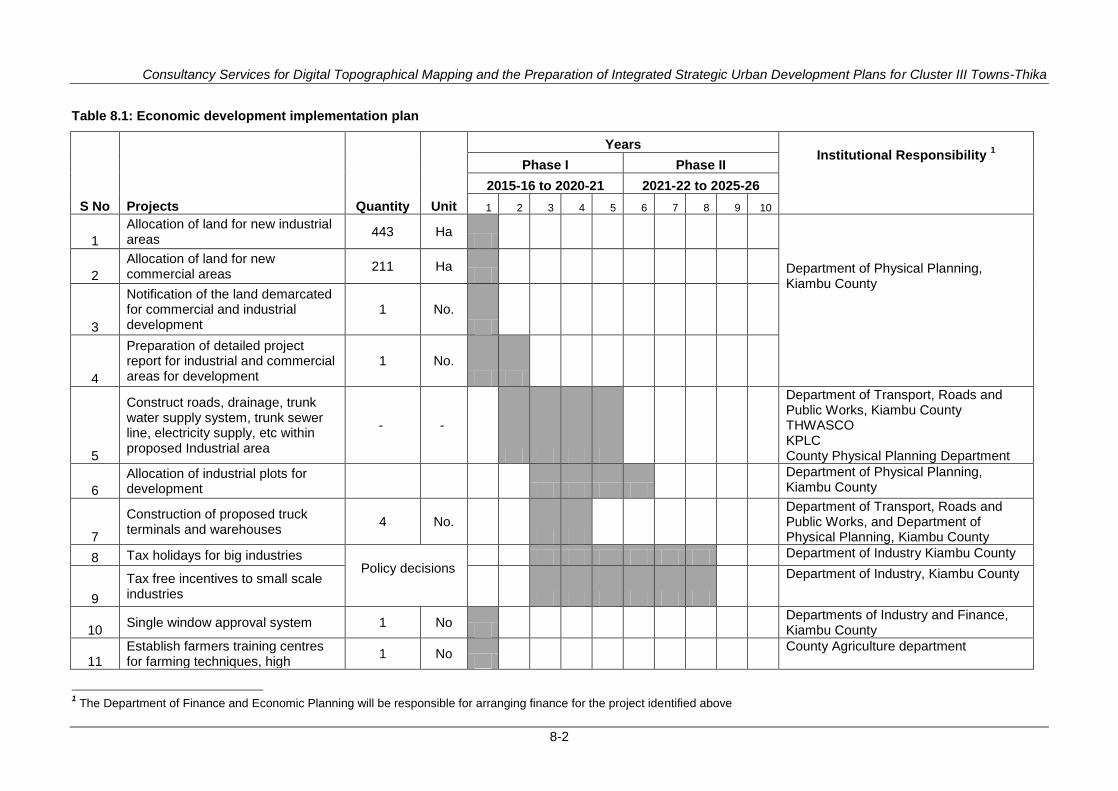
Consultancy Services for Digital Topographical Mapping and the Preparation of Integrated Strategic Urban Development Plans for Cluster III Towns-Thika
8-2
Table 8.1: Economic development implementation plan
S No Projects Quantity Unit
Years Institutional Responsibility
1
Phase I Phase II
2015-16 to 2020-21 2021-22 to 2025-26
1 2 3 4 5 6 7 8 9 10
1
Allocation of land for new industrial areas
443 Ha
Department of Physical Planning, Kiambu County
2
Allocation of land for new commercial areas
211 Ha
3
Notification of the land demarcated for commercial and industrial development
1 No.
4
Preparation of detailed project report for industrial and commercial areas for development
1 No.
5
Construct roads, drainage, trunk water supply system, trunk sewer line, electricity supply, etc within proposed Industrial area
- -
Department of Transport, Roads and Public Works, Kiambu County THWASCO KPLC County Physical Planning Department
6
Allocation of industrial plots for development
Department of Physical Planning, Kiambu County
7
Construction of proposed truck terminals and warehouses
4 No.
Department of Transport, Roads and Public Works, and Department of Physical Planning, Kiambu County
8 Tax holidays for big industries Policy decisions
Department of Industry Kiambu County
9
Tax free incentives to small scale industries
Department of Industry, Kiambu County
10 Single window approval system 1 No
Departments of Industry and Finance, Kiambu County
11 Establish farmers training centres for farming techniques, high
1 No
County Agriculture department
1 The Department of Finance and Economic Planning will be responsible for arranging finance for the project identified above
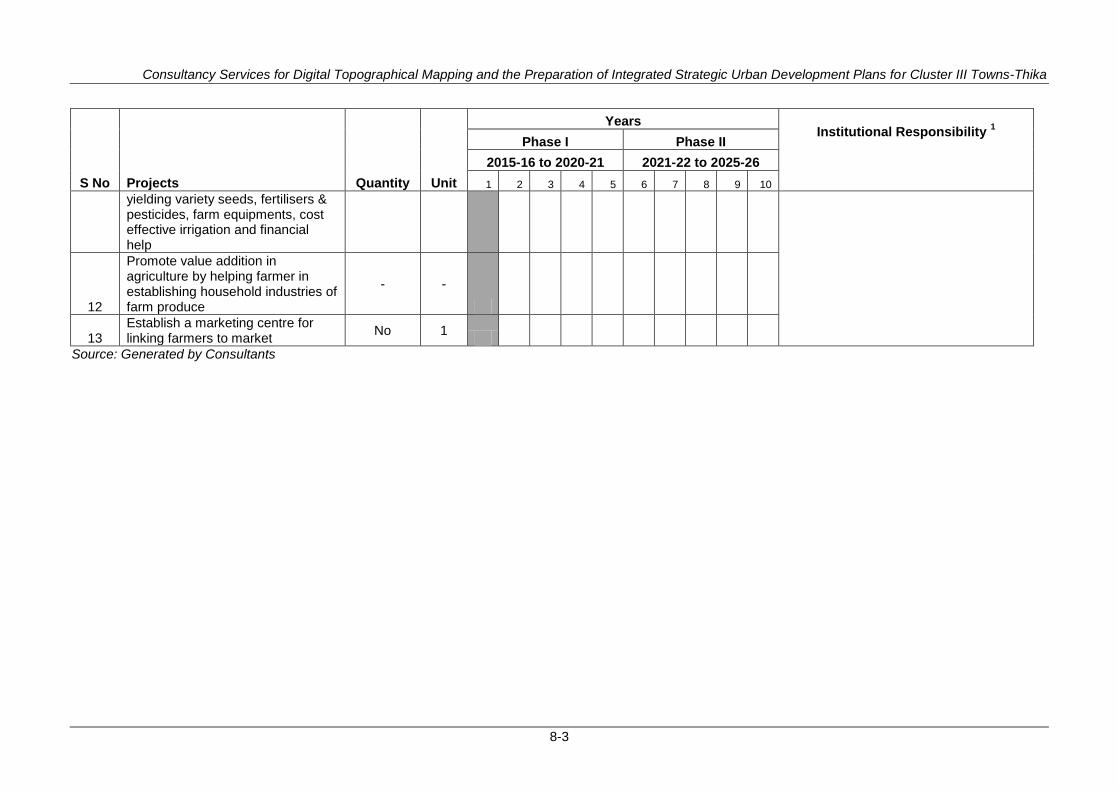
Consultancy Services for Digital Topographical Mapping and the Preparation of Integrated Strategic Urban Development Plans for Cluster III Towns-Thika
8-3
S No Projects Quantity Unit
Years Institutional Responsibility
1
Phase I Phase II
2015-16 to 2020-21 2021-22 to 2025-26
1 2 3 4 5 6 7 8 9 10
yielding variety seeds, fertilisers & pesticides, farm equipments, cost effective irrigation and financial help
12
Promote value addition in agriculture by helping farmer in establishing household industries of farm produce
- -
13 Establish a marketing centre for linking farmers to market
No 1
Source: Generated by Consultants
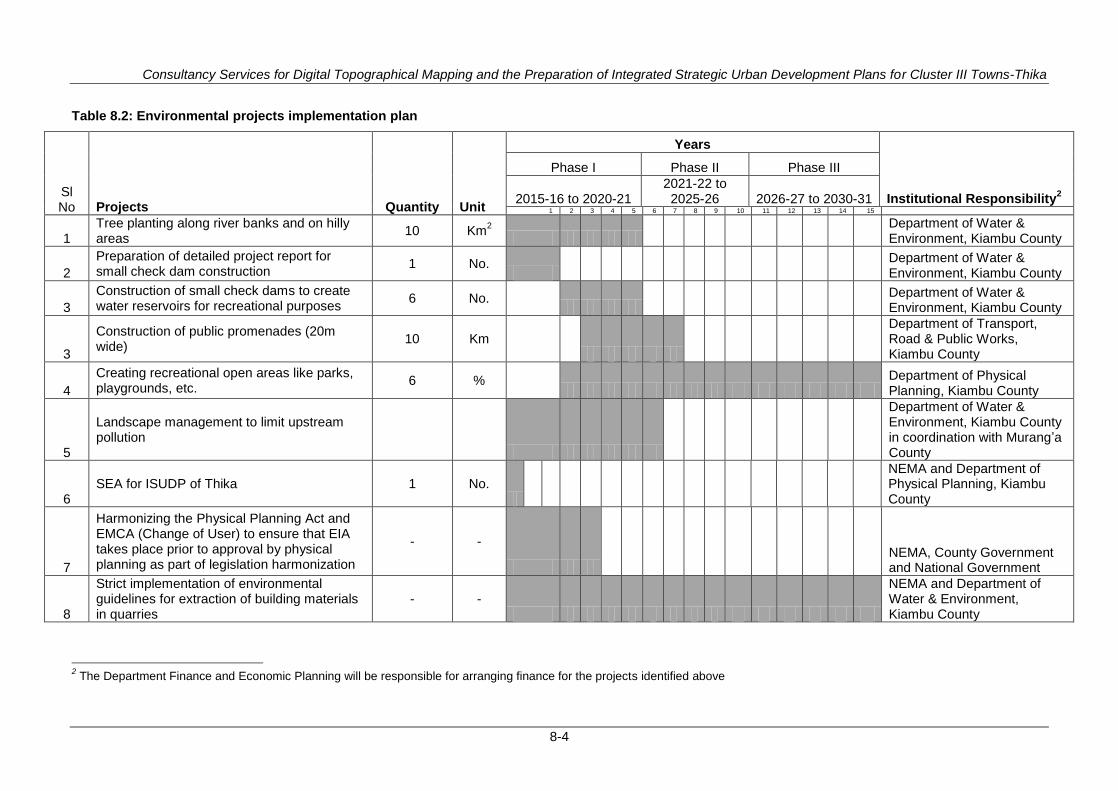
Consultancy Services for Digital Topographical Mapping and the Preparation of Integrated Strategic Urban Development Plans for Cluster III Towns-Thika
8-4
Table 8.2: Environmental projects implementation plan
Sl No
Projects
Quantity
Unit
Years
Institutional Responsibility2
Phase I Phase II Phase III
2015-16 to 2020-21 2021-22 to 2025-26 2026-27 to 2030-31
1 2 3 4 5 6 7 8 9 10 11 12 13 14 15
1 Tree planting along river banks and on hilly areas
10 Km2
Department of Water & Environment, Kiambu County
2
Preparation of detailed project report for small check dam construction
1 No.
Department of Water & Environment, Kiambu County
3
Construction of small check dams to create water reservoirs for recreational purposes
6 No.
Department of Water & Environment, Kiambu County
3
Construction of public promenades (20m wide)
10 Km
Department of Transport, Road & Public Works, Kiambu County
4
Creating recreational open areas like parks, playgrounds, etc.
6 %
Department of Physical Planning, Kiambu County
5
Landscape management to limit upstream pollution
Department of Water & Environment, Kiambu County in coordination with Murang‘a County
6 SEA for ISUDP of Thika 1 No.
NEMA and Department of Physical Planning, Kiambu County
7
Harmonizing the Physical Planning Act and EMCA (Change of User) to ensure that EIA takes place prior to approval by physical planning as part of legislation harmonization
- -
NEMA, County Government and National Government
8
Strict implementation of environmental guidelines for extraction of building materials in quarries
- -
NEMA and Department of Water & Environment, Kiambu County
2 The Department Finance and Economic Planning will be responsible for arranging finance for the projects identified above
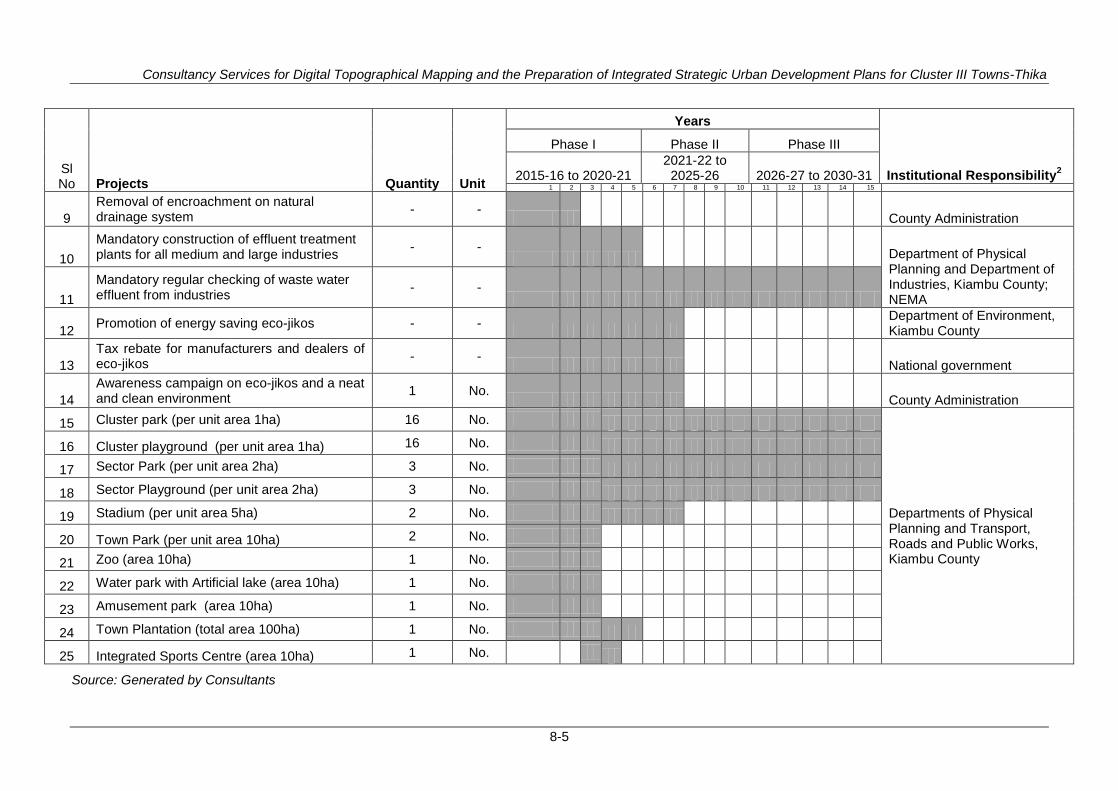
Consultancy Services for Digital Topographical Mapping and the Preparation of Integrated Strategic Urban Development Plans for Cluster III Towns-Thika
8-5
Sl No
Projects
Quantity
Unit
Years
Institutional Responsibility2
Phase I Phase II Phase III
2015-16 to 2020-21 2021-22 to 2025-26 2026-27 to 2030-31
1 2 3 4 5 6 7 8 9 10 11 12 13 14 15
9
Removal of encroachment on natural drainage system
- - County Administration
10
Mandatory construction of effluent treatment plants for all medium and large industries
- - Department of Physical
Planning and Department of Industries, Kiambu County; NEMA 11
Mandatory regular checking of waste water effluent from industries
- -
12 Promotion of energy saving eco-jikos - -
Department of Environment, Kiambu County
13
Tax rebate for manufacturers and dealers of eco-jikos
- - National government
14
Awareness campaign on eco-jikos and a neat and clean environment
1 No. County Administration
15 Cluster park (per unit area 1ha) 16 No.
Departments of Physical Planning and Transport, Roads and Public Works, Kiambu County
16 Cluster playground (per unit area 1ha) 16 No.
17 Sector Park (per unit area 2ha) 3 No.
18 Sector Playground (per unit area 2ha) 3 No.
19 Stadium (per unit area 5ha) 2 No.
20 Town Park (per unit area 10ha) 2 No.
21 Zoo (area 10ha) 1 No.
22 Water park with Artificial lake (area 10ha) 1 No.
23 Amusement park (area 10ha) 1 No.
24 Town Plantation (total area 100ha) 1 No.
25 Integrated Sports Centre (area 10ha) 1 No.
Source: Generated by Consultants
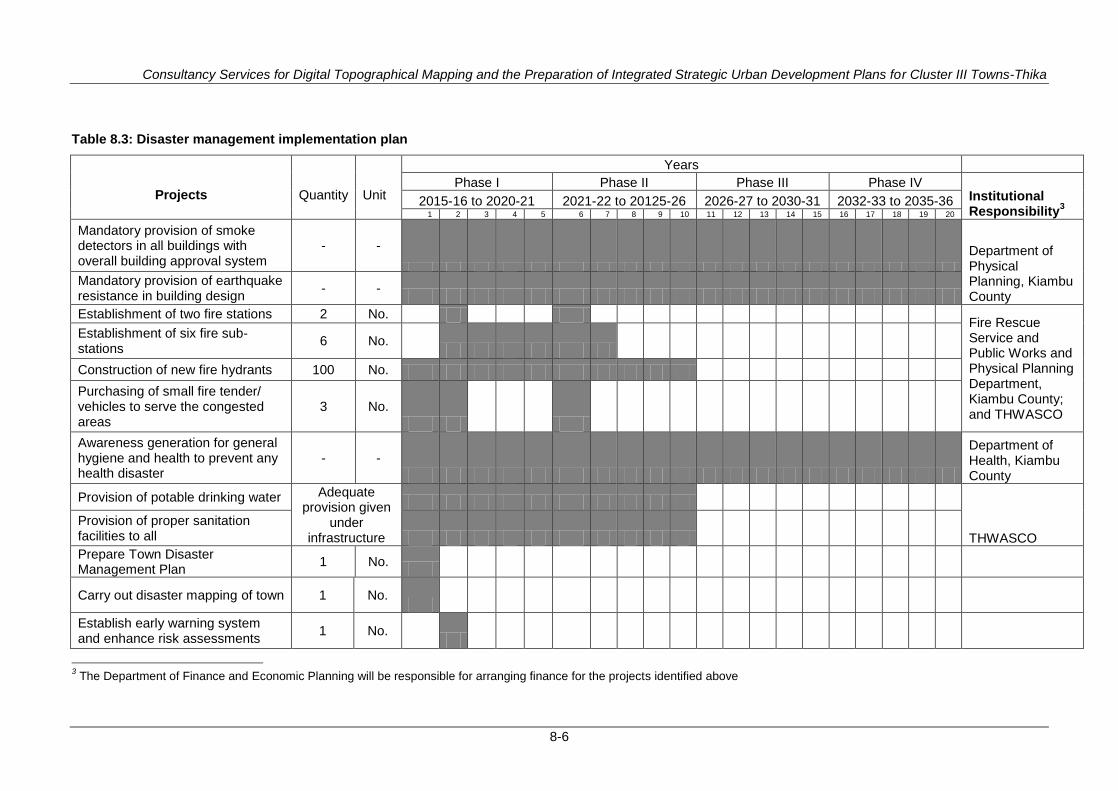
Consultancy Services for Digital Topographical Mapping and the Preparation of Integrated Strategic Urban Development Plans for Cluster III Towns-Thika
8-6
Table 8.3: Disaster management implementation plan
Projects
Quantity
Unit
Years
Phase I Phase II Phase III Phase IV Institutional Responsibility
3
2015-16 to 2020-21 2021-22 to 20125-26 2026-27 to 2030-31 2032-33 to 2035-36 1 2 3 4 5 6 7 8 9 10 11 12 13 14 15 16 17 18 19 20
Mandatory provision of smoke detectors in all buildings with overall building approval system
- -
Department of Physical Planning, Kiambu County
Mandatory provision of earthquake resistance in building design
- -
Establishment of two fire stations 2 No. Fire Rescue Service and Public Works and Physical Planning Department, Kiambu County; and THWASCO
Establishment of six fire sub-stations
6 No.
Construction of new fire hydrants 100 No.
Purchasing of small fire tender/ vehicles to serve the congested areas
3 No.
Awareness generation for general hygiene and health to prevent any health disaster
- -
Department of Health, Kiambu County
Provision of potable drinking water Adequate provision given
under infrastructure
THWASCO
Provision of proper sanitation facilities to all
Prepare Town Disaster Management Plan
1 No.
Carry out disaster mapping of town 1 No.
Establish early warning system and enhance risk assessments
1 No.
3 The Department of Finance and Economic Planning will be responsible for arranging finance for the projects identified above
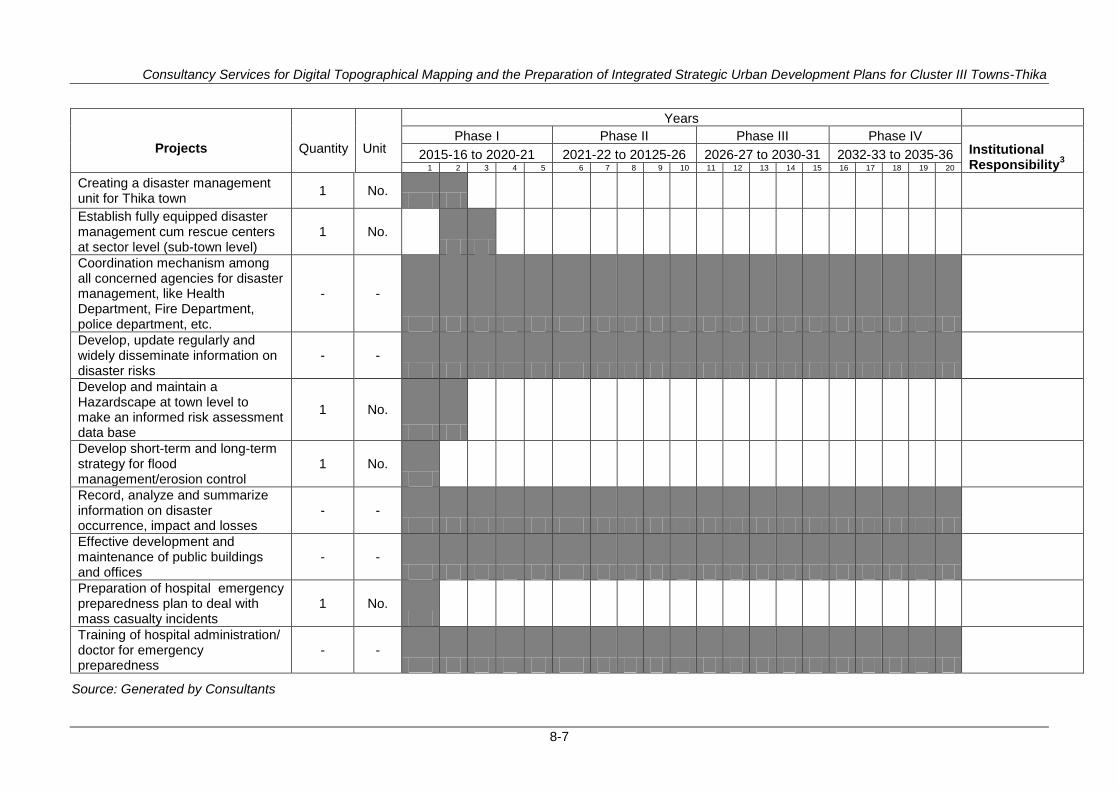
Consultancy Services for Digital Topographical Mapping and the Preparation of Integrated Strategic Urban Development Plans for Cluster III Towns-Thika
8-7
Projects
Quantity
Unit
Years
Phase I Phase II Phase III Phase IV Institutional Responsibility
3
2015-16 to 2020-21 2021-22 to 20125-26 2026-27 to 2030-31 2032-33 to 2035-36 1 2 3 4 5 6 7 8 9 10 11 12 13 14 15 16 17 18 19 20
Creating a disaster management unit for Thika town
1 No.
Establish fully equipped disaster management cum rescue centers at sector level (sub-town level)
1 No.
Coordination mechanism among all concerned agencies for disaster management, like Health Department, Fire Department, police department, etc.
- -
Develop, update regularly and widely disseminate information on disaster risks
- -
Develop and maintain a Hazardscape at town level to make an informed risk assessment data base
1 No.
Develop short-term and long-term strategy for flood management/erosion control
1 No.
Record, analyze and summarize information on disaster occurrence, impact and losses
- -
Effective development and maintenance of public buildings and offices
- -
Preparation of hospital emergency preparedness plan to deal with mass casualty incidents
1 No.
Training of hospital administration/ doctor for emergency preparedness
- -
Source: Generated by Consultants
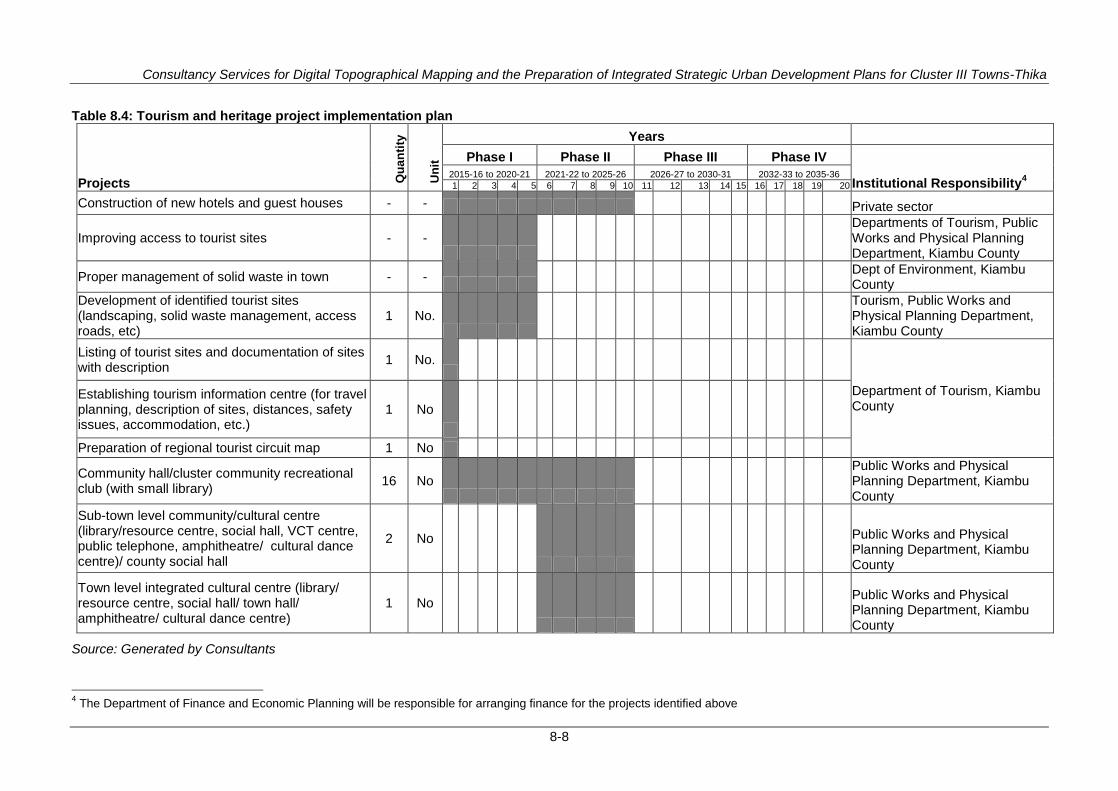
Consultancy Services for Digital Topographical Mapping and the Preparation of Integrated Strategic Urban Development Plans for Cluster III Towns-Thika
8-8
Table 8.4: Tourism and heritage project implementation plan
Projects Qu
an
tity
Un
it
Years
Phase I Phase II Phase III Phase IV Institutional Responsibility
4
2015-16 to 2020-21 2021-22 to 2025-26 2026-27 to 2030-31 2032-33 to 2035-36
1 2 3 4 5 6 7 8 9 10 11 12 13 14 15 16 17 18 19 20
Construction of new hotels and guest houses - - Private sector
Improving access to tourist sites - -
Departments of Tourism, Public Works and Physical Planning Department, Kiambu County
Proper management of solid waste in town - -
Dept of Environment, Kiambu County
Development of identified tourist sites (landscaping, solid waste management, access roads, etc)
1 No.
Tourism, Public Works and Physical Planning Department, Kiambu County
Listing of tourist sites and documentation of sites with description
1 No.
Department of Tourism, Kiambu County
Establishing tourism information centre (for travel planning, description of sites, distances, safety issues, accommodation, etc.)
1 No
Preparation of regional tourist circuit map 1 No
Community hall/cluster community recreational club (with small library)
16 No
Public Works and Physical Planning Department, Kiambu County
Sub-town level community/cultural centre (library/resource centre, social hall, VCT centre, public telephone, amphitheatre/ cultural dance centre)/ county social hall
2 No
Public Works and Physical Planning Department, Kiambu County
Town level integrated cultural centre (library/ resource centre, social hall/ town hall/ amphitheatre/ cultural dance centre)
1 No
Public Works and Physical Planning Department, Kiambu County
Source: Generated by Consultants
4 The Department of Finance and Economic Planning will be responsible for arranging finance for the projects identified above
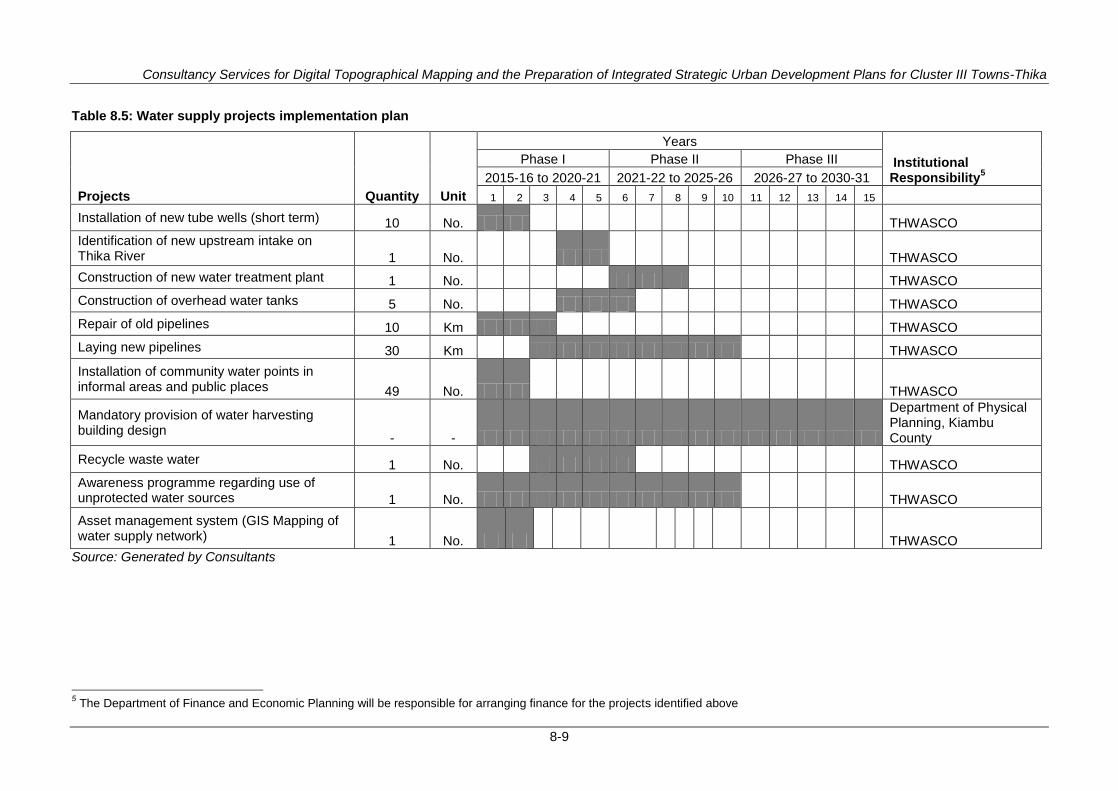
Consultancy Services for Digital Topographical Mapping and the Preparation of Integrated Strategic Urban Development Plans for Cluster III Towns-Thika
8-9
Table 8.5: Water supply projects implementation plan
Projects Quantity Unit
Years
Institutional Responsibility
5
Phase I Phase II Phase III
2015-16 to 2020-21 2021-22 to 2025-26 2026-27 to 2030-31
1 2 3 4 5 6 7 8 9 10 11 12 13 14 15 Installation of new tube wells (short term) 10 No. THWASCO
Identification of new upstream intake on Thika River 1 No. THWASCO
Construction of new water treatment plant 1 No. THWASCO
Construction of overhead water tanks 5 No. THWASCO
Repair of old pipelines 10 Km THWASCO
Laying new pipelines 30 Km THWASCO
Installation of community water points in informal areas and public places 49 No. THWASCO
Mandatory provision of water harvesting building design
- -
Department of Physical Planning, Kiambu County
Recycle waste water 1 No. THWASCO
Awareness programme regarding use of unprotected water sources 1 No. THWASCO
Asset management system (GIS Mapping of water supply network) 1 No. THWASCO
Source: Generated by Consultants
5 The Department of Finance and Economic Planning will be responsible for arranging finance for the projects identified above
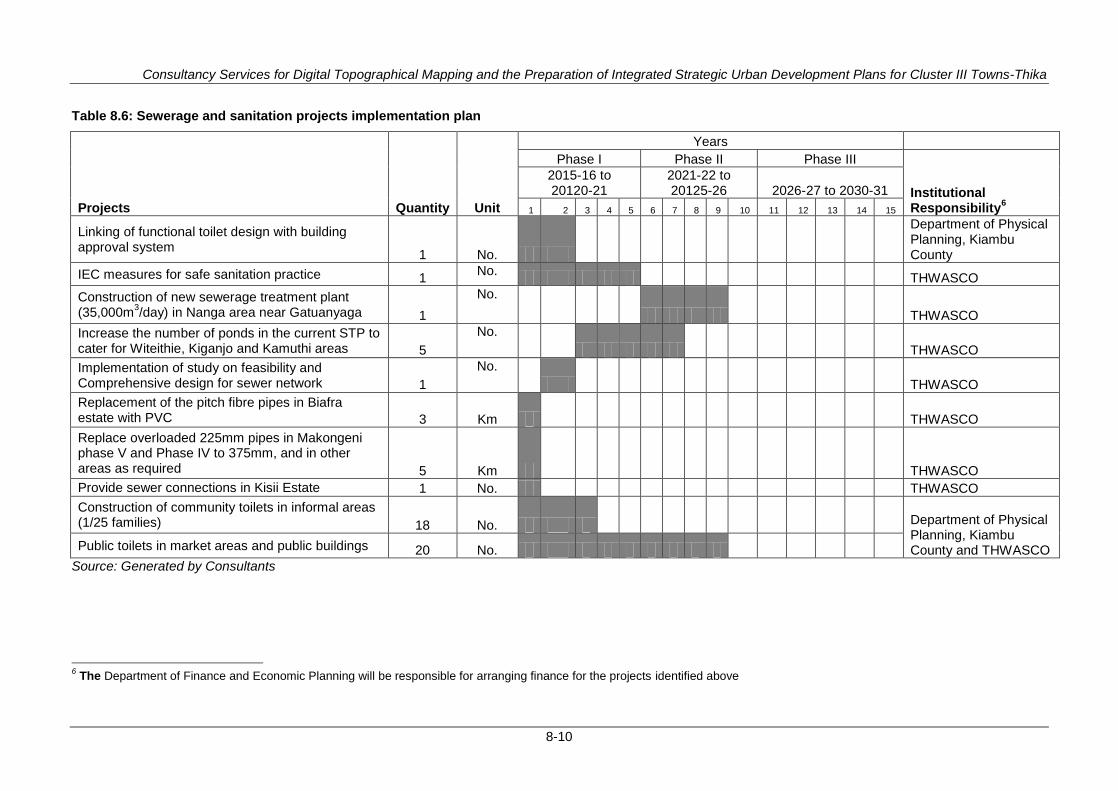
Consultancy Services for Digital Topographical Mapping and the Preparation of Integrated Strategic Urban Development Plans for Cluster III Towns-Thika
8-10
Table 8.6: Sewerage and sanitation projects implementation plan
Projects
Quantity
Unit
Years
Phase I Phase II Phase III
Institutional Responsibility
6
2015-16 to 20120-21
2021-22 to 20125-26 2026-27 to 2030-31
1 2 3 4 5 6 7 8 9 10 11 12 13 14 15
Linking of functional toilet design with building approval system
1 No.
Department of Physical Planning, Kiambu County
IEC measures for safe sanitation practice 1 No.
THWASCO
Construction of new sewerage treatment plant (35,000m
3/day) in Nanga area near Gatuanyaga 1
No.
THWASCO
Increase the number of ponds in the current STP to cater for Witeithie, Kiganjo and Kamuthi areas 5
No.
THWASCO
Implementation of study on feasibility and Comprehensive design for sewer network 1
No.
THWASCO
Replacement of the pitch fibre pipes in Biafra estate with PVC 3 Km THWASCO
Replace overloaded 225mm pipes in Makongeni phase V and Phase IV to 375mm, and in other areas as required 5 Km THWASCO
Provide sewer connections in Kisii Estate 1 No. THWASCO
Construction of community toilets in informal areas (1/25 families) 18 No. Department of Physical
Planning, Kiambu County and THWASCO Public toilets in market areas and public buildings 20 No.
Source: Generated by Consultants
6 The Department of Finance and Economic Planning will be responsible for arranging finance for the projects identified above
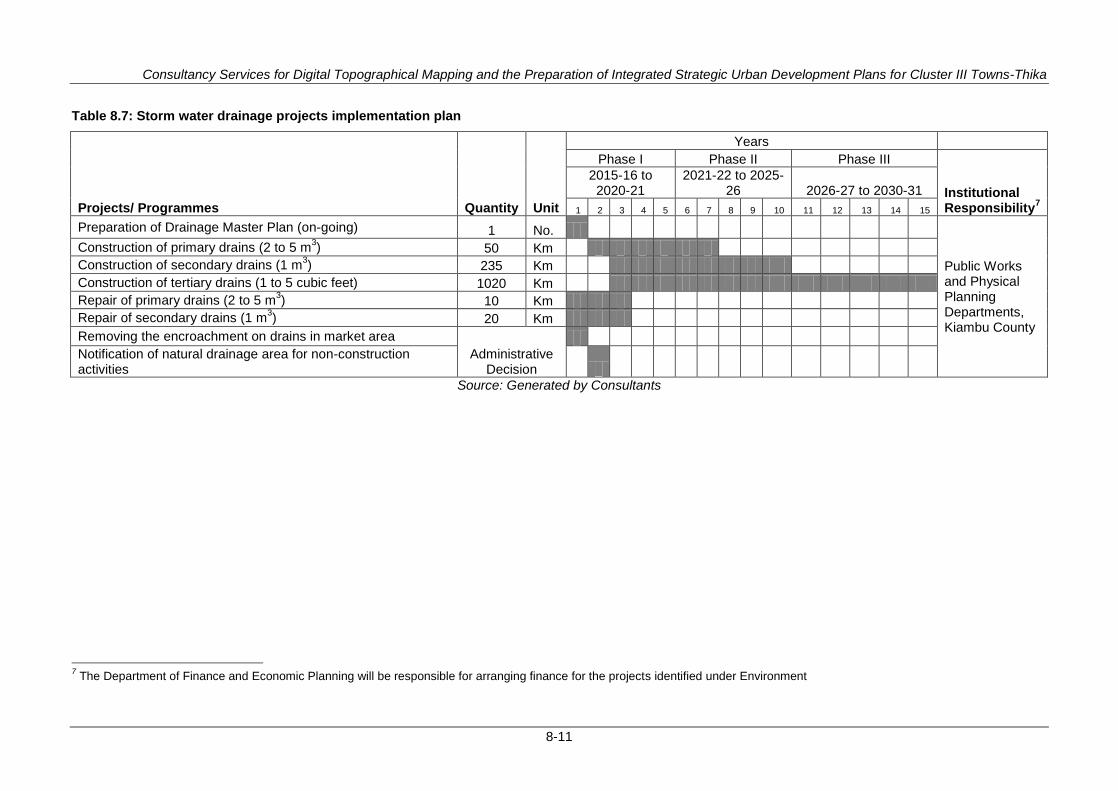
Consultancy Services for Digital Topographical Mapping and the Preparation of Integrated Strategic Urban Development Plans for Cluster III Towns-Thika
8-11
Table 8.7: Storm water drainage projects implementation plan
Projects/ Programmes Quantity Unit
Years
Phase I Phase II Phase III
Institutional Responsibility
7
2015-16 to 2020-21
2021-22 to 2025-26 2026-27 to 2030-31
1 2 3 4 5 6 7 8 9 10 11 12 13 14 15
Preparation of Drainage Master Plan (on-going) 1 No.
Public Works and Physical Planning Departments, Kiambu County
Construction of primary drains (2 to 5 m3) 50 Km
Construction of secondary drains (1 m3) 235 Km
Construction of tertiary drains (1 to 5 cubic feet) 1020 Km
Repair of primary drains (2 to 5 m3) 10 Km
Repair of secondary drains (1 m3) 20 Km
Removing the encroachment on drains in market area
Administrative Decision
Notification of natural drainage area for non-construction activities
Source: Generated by Consultants
7 The Department of Finance and Economic Planning will be responsible for arranging finance for the projects identified under Environment
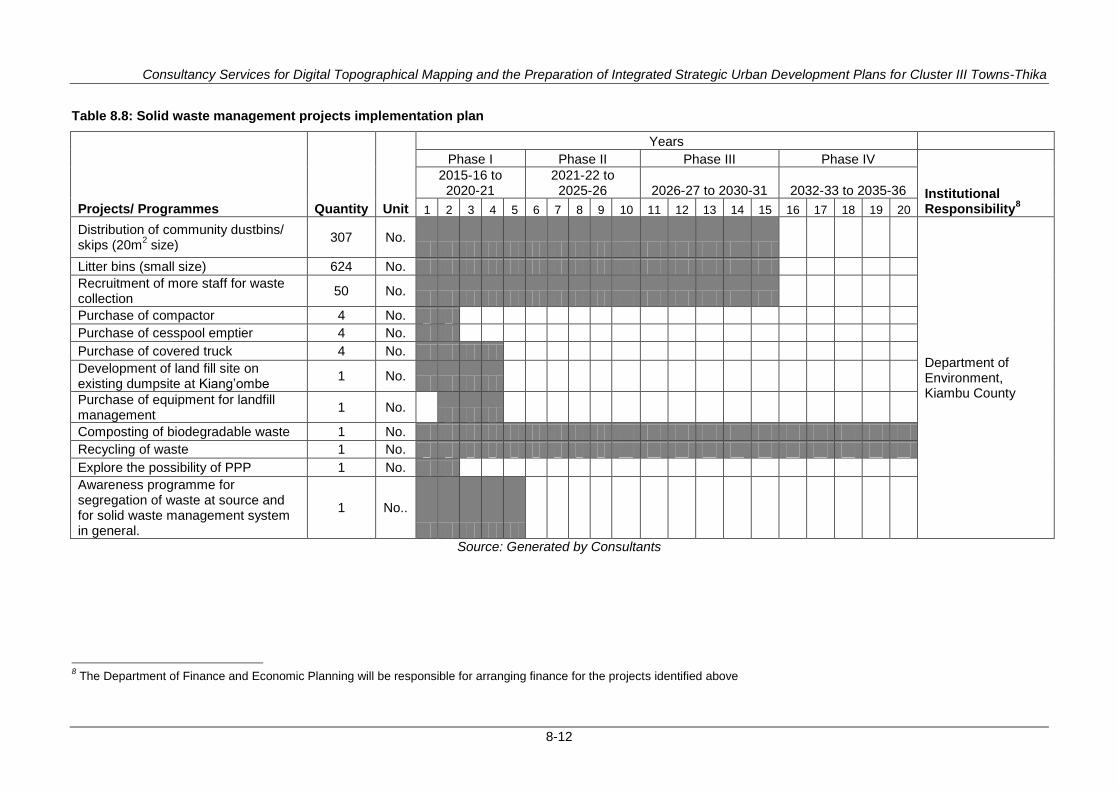
Consultancy Services for Digital Topographical Mapping and the Preparation of Integrated Strategic Urban Development Plans for Cluster III Towns-Thika
8-12
Table 8.8: Solid waste management projects implementation plan
Projects/ Programmes Quantity Unit
Years
Phase I Phase II Phase III Phase IV
Institutional Responsibility
8
2015-16 to 2020-21
2021-22 to 2025-26 2026-27 to 2030-31 2032-33 to 2035-36
1 2 3 4 5 6 7 8 9 10 11 12 13 14 15 16 17 18 19 20
Distribution of community dustbins/ skips (20m
2 size)
307 No.
Department of Environment, Kiambu County
Litter bins (small size) 624 No.
Recruitment of more staff for waste collection
50 No.
Purchase of compactor 4 No.
Purchase of cesspool emptier 4 No.
Purchase of covered truck 4 No.
Development of land fill site on existing dumpsite at Kiang‘ombe
1 No.
Purchase of equipment for landfill management
1 No.
Composting of biodegradable waste 1 No.
Recycling of waste 1 No.
Explore the possibility of PPP 1 No.
Awareness programme for segregation of waste at source and for solid waste management system in general.
1 No..
Source: Generated by Consultants
8 The Department of Finance and Economic Planning will be responsible for arranging finance for the projects identified above
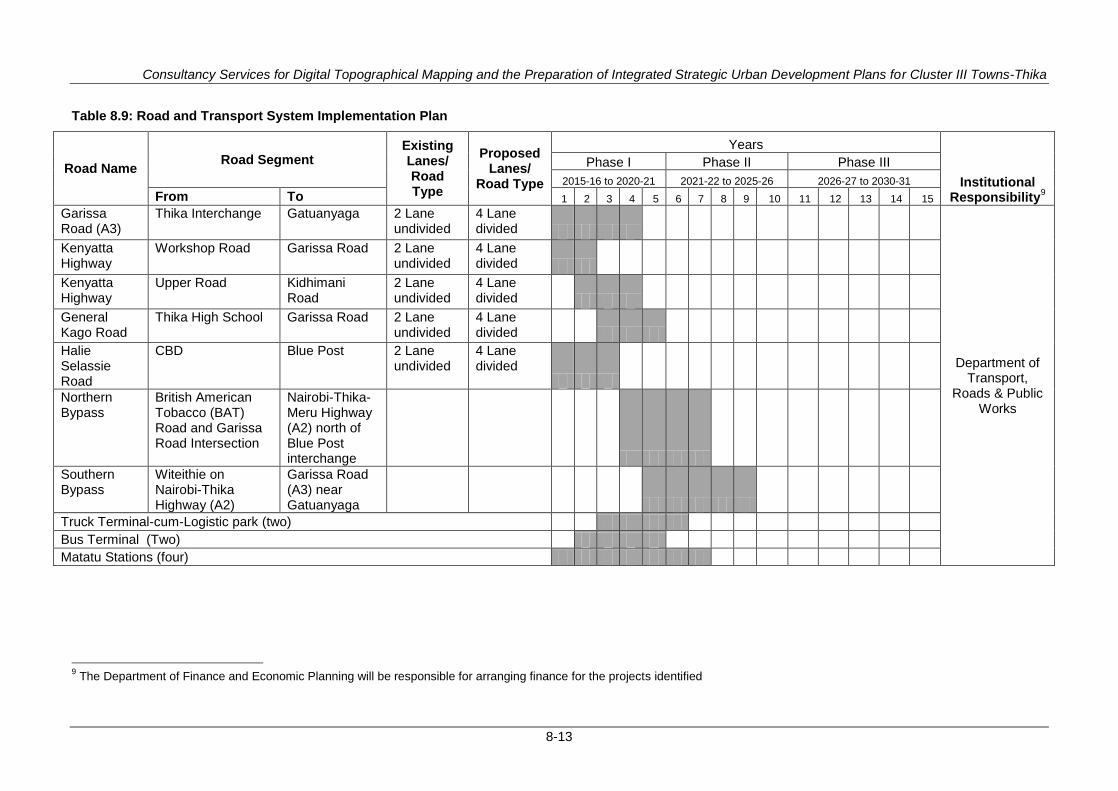
Consultancy Services for Digital Topographical Mapping and the Preparation of Integrated Strategic Urban Development Plans for Cluster III Towns-Thika
8-13
Table 8.9: Road and Transport System Implementation Plan
Road Name Road Segment
Existing Lanes/ Road Type
Proposed Lanes/
Road Type
Years
Institutional Responsibility
9
Phase I Phase II Phase III
2015-16 to 2020-21 2021-22 to 2025-26 2026-27 to 2030-31
From To 1 2 3 4 5 6 7 8 9 10 11 12 13 14 15
Garissa Road (A3)
Thika Interchange Gatuanyaga 2 Lane undivided
4 Lane divided
Department of Transport,
Roads & Public Works
Kenyatta Highway
Workshop Road Garissa Road 2 Lane undivided
4 Lane divided
Kenyatta Highway
Upper Road Kidhimani Road
2 Lane undivided
4 Lane divided
General Kago Road
Thika High School Garissa Road 2 Lane undivided
4 Lane divided
Halie Selassie Road
CBD Blue Post 2 Lane undivided
4 Lane divided
Northern Bypass
British American Tobacco (BAT) Road and Garissa Road Intersection
Nairobi-Thika-Meru Highway (A2) north of Blue Post interchange
Southern Bypass
Witeithie on Nairobi-Thika Highway (A2)
Garissa Road (A3) near Gatuanyaga
Truck Terminal-cum-Logistic park (two)
Bus Terminal (Two)
Matatu Stations (four)
9 The Department of Finance and Economic Planning will be responsible for arranging finance for the projects identified
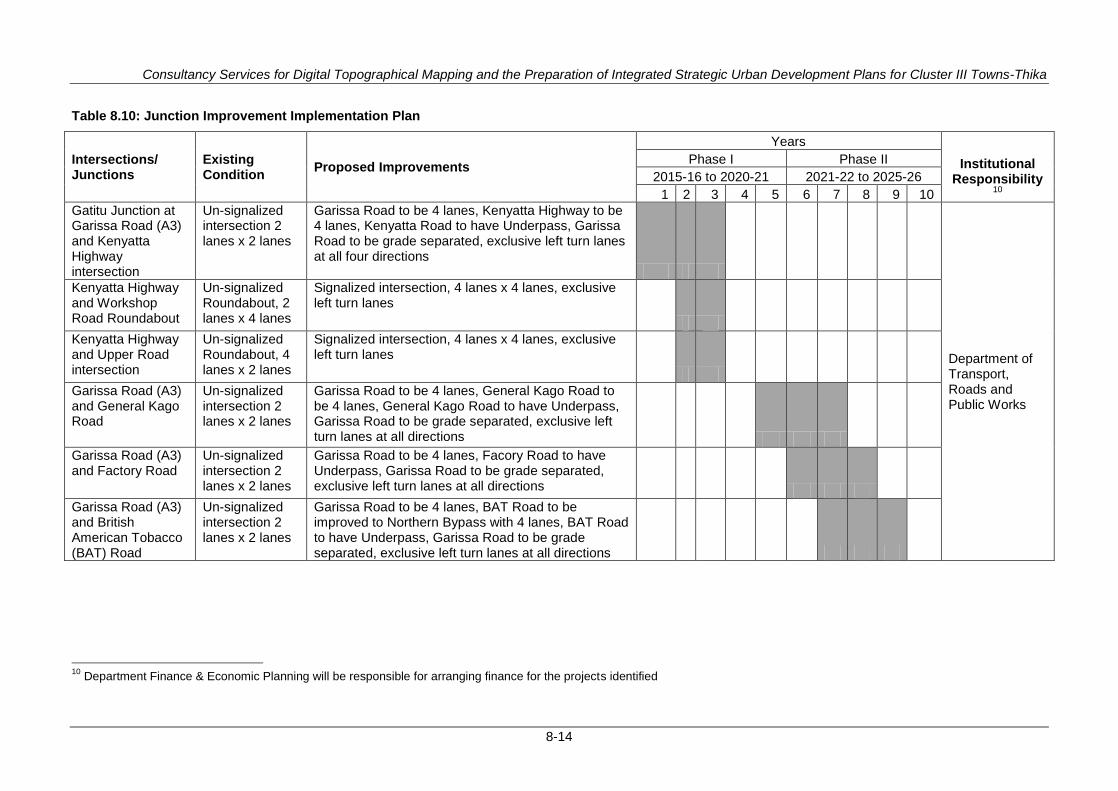
Consultancy Services for Digital Topographical Mapping and the Preparation of Integrated Strategic Urban Development Plans for Cluster III Towns-Thika
8-14
Table 8.10: Junction Improvement Implementation Plan
Intersections/ Junctions
Existing Condition
Proposed Improvements
Years
Institutional Responsibility
10
Phase I Phase II
2015-16 to 2020-21 2021-22 to 2025-26
1 2 3 4 5 6 7 8 9 10
Gatitu Junction at Garissa Road (A3) and Kenyatta Highway intersection
Un-signalized intersection 2 lanes x 2 lanes
Garissa Road to be 4 lanes, Kenyatta Highway to be 4 lanes, Kenyatta Road to have Underpass, Garissa Road to be grade separated, exclusive left turn lanes at all four directions
Department of Transport, Roads and Public Works
Kenyatta Highway and Workshop Road Roundabout
Un-signalized Roundabout, 2 lanes x 4 lanes
Signalized intersection, 4 lanes x 4 lanes, exclusive left turn lanes
Kenyatta Highway and Upper Road intersection
Un-signalized Roundabout, 4 lanes x 2 lanes
Signalized intersection, 4 lanes x 4 lanes, exclusive left turn lanes
Garissa Road (A3) and General Kago Road
Un-signalized intersection 2 lanes x 2 lanes
Garissa Road to be 4 lanes, General Kago Road to be 4 lanes, General Kago Road to have Underpass, Garissa Road to be grade separated, exclusive left turn lanes at all directions
Garissa Road (A3) and Factory Road
Un-signalized intersection 2 lanes x 2 lanes
Garissa Road to be 4 lanes, Facory Road to have Underpass, Garissa Road to be grade separated, exclusive left turn lanes at all directions
Garissa Road (A3) and British American Tobacco (BAT) Road
Un-signalized intersection 2 lanes x 2 lanes
Garissa Road to be 4 lanes, BAT Road to be improved to Northern Bypass with 4 lanes, BAT Road to have Underpass, Garissa Road to be grade separated, exclusive left turn lanes at all directions
10
Department Finance & Economic Planning will be responsible for arranging finance for the projects identified
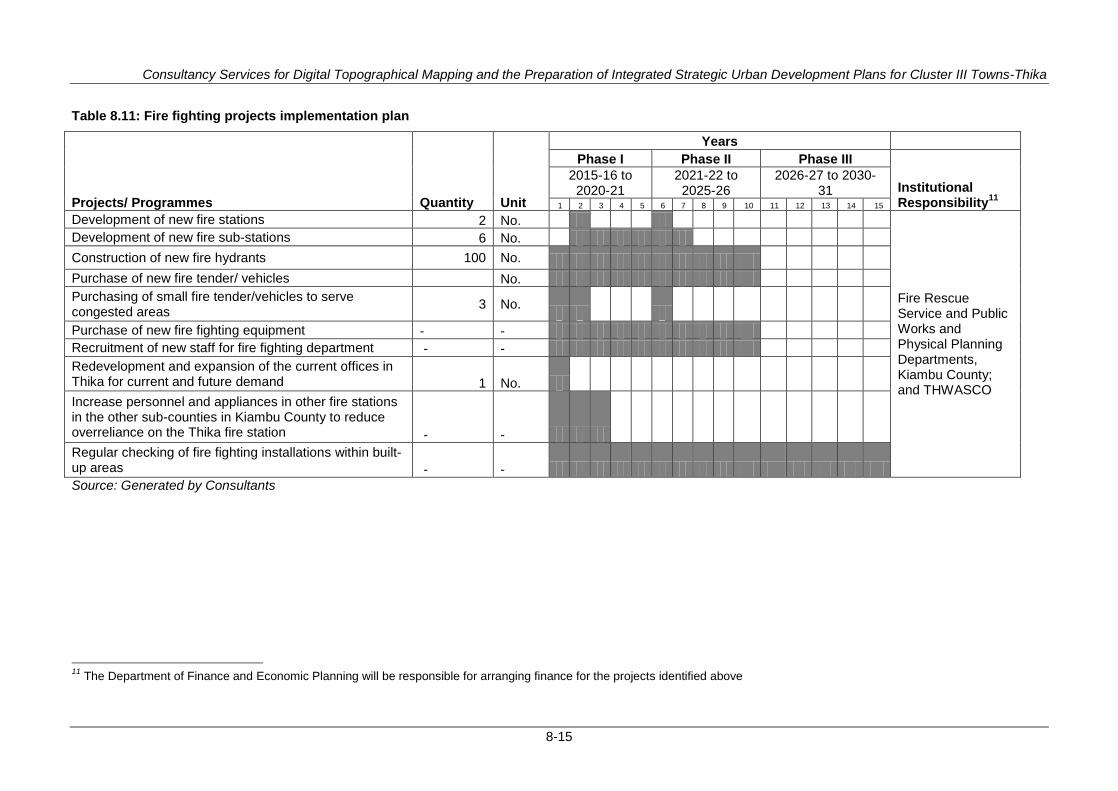
Consultancy Services for Digital Topographical Mapping and the Preparation of Integrated Strategic Urban Development Plans for Cluster III Towns-Thika
8-15
Table 8.11: Fire fighting projects implementation plan
Projects/ Programmes
Quantity
Unit
Years
Phase I Phase II Phase III Institutional Responsibility
11
2015-16 to 2020-21
2021-22 to 2025-26
2026-27 to 2030-31
1 2 3 4 5 6 7 8 9 10 11 12 13 14 15
Development of new fire stations 2 No.
Fire Rescue Service and Public Works and Physical Planning Departments, Kiambu County; and THWASCO
Development of new fire sub-stations 6 No.
Construction of new fire hydrants 100 No.
Purchase of new fire tender/ vehicles No.
Purchasing of small fire tender/vehicles to serve congested areas
3 No.
Purchase of new fire fighting equipment - -
Recruitment of new staff for fire fighting department - -
Redevelopment and expansion of the current offices in Thika for current and future demand 1 No.
Increase personnel and appliances in other fire stations in the other sub-counties in Kiambu County to reduce overreliance on the Thika fire station - -
Regular checking of fire fighting installations within built-up areas - -
Source: Generated by Consultants
11
The Department of Finance and Economic Planning will be responsible for arranging finance for the projects identified above
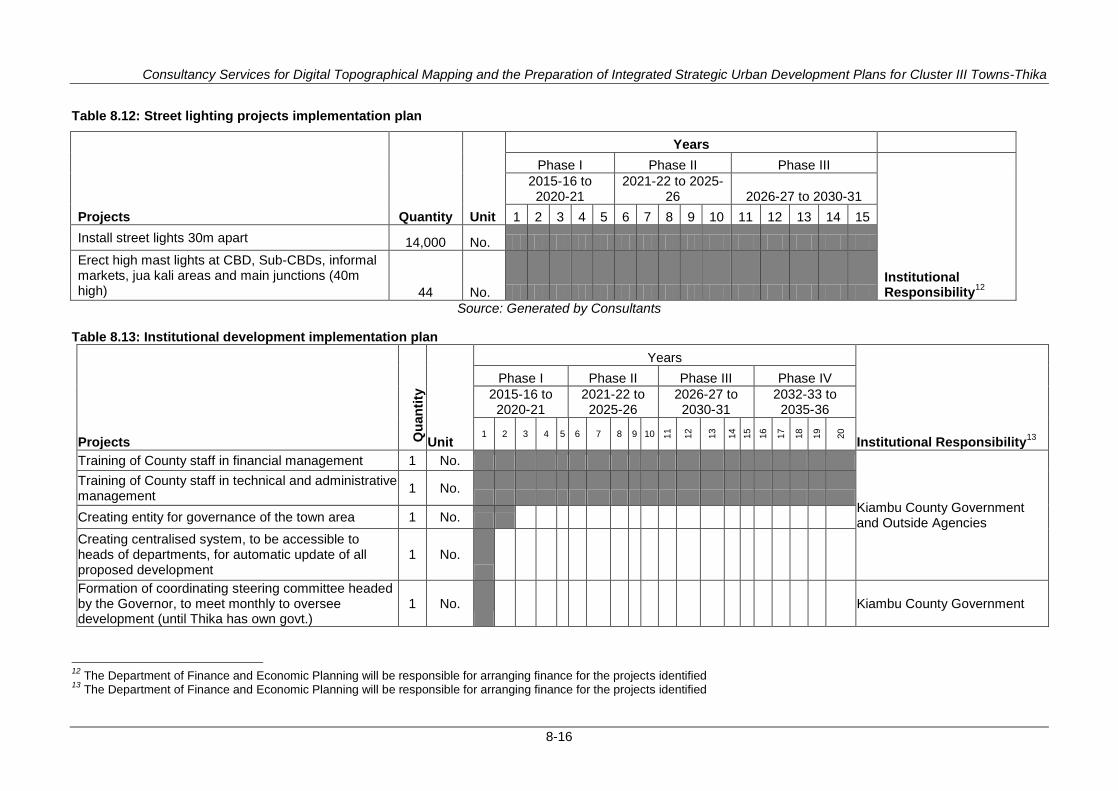
Consultancy Services for Digital Topographical Mapping and the Preparation of Integrated Strategic Urban Development Plans for Cluster III Towns-Thika
8-16
Table 8.12: Street lighting projects implementation plan
Projects
Quantity
Unit
Years
Phase I Phase II Phase III
Institutional Responsibility
12
2015-16 to 2020-21
2021-22 to 2025-26 2026-27 to 2030-31
1 2 3 4 5 6 7 8 9 10 11 12 13 14 15
Install street lights 30m apart 14,000 No.
Erect high mast lights at CBD, Sub-CBDs, informal markets, jua kali areas and main junctions (40m high) 44 No.
Source: Generated by Consultants
Table 8.13: Institutional development implementation plan
Projects Q
uan
tity
Unit
Years
Institutional Responsibility
13
Phase I Phase II Phase III Phase IV
2015-16 to 2020-21
2021-22 to 2025-26
2026-27 to 2030-31
2032-33 to 2035-36
1 2 3 4 5 6 7 8 9 10 11
12
13
14
15
16
17
18
19
20
Training of County staff in financial management 1 No.
Kiambu County Government and Outside Agencies
Training of County staff in technical and administrative management
1 No.
Creating entity for governance of the town area 1 No.
Creating centralised system, to be accessible to heads of departments, for automatic update of all proposed development
1 No.
Formation of coordinating steering committee headed by the Governor, to meet monthly to oversee development (until Thika has own govt.)
1 No.
Kiambu County Government
12
The Department of Finance and Economic Planning will be responsible for arranging finance for the projects identified 13
The Department of Finance and Economic Planning will be responsible for arranging finance for the projects identified
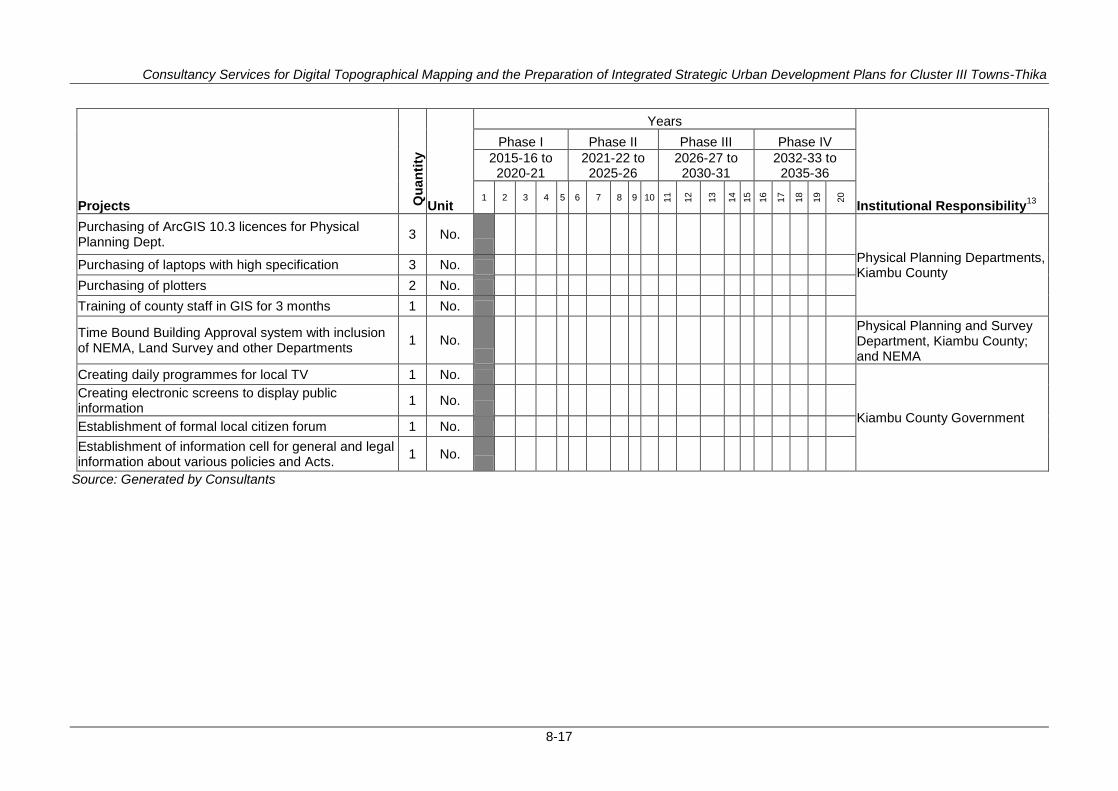
Consultancy Services for Digital Topographical Mapping and the Preparation of Integrated Strategic Urban Development Plans for Cluster III Towns-Thika
8-17
Projects Q
uan
tity
Unit
Years
Institutional Responsibility
13
Phase I Phase II Phase III Phase IV
2015-16 to 2020-21
2021-22 to 2025-26
2026-27 to 2030-31
2032-33 to 2035-36
1 2 3 4 5 6 7 8 9 10 11
12
13
14
15
16
17
18
19
20
Purchasing of ArcGIS 10.3 licences for Physical Planning Dept.
3 No.
Physical Planning Departments, Kiambu County
Purchasing of laptops with high specification 3 No.
Purchasing of plotters 2 No.
Training of county staff in GIS for 3 months 1 No.
Time Bound Building Approval system with inclusion of NEMA, Land Survey and other Departments
1 No.
Physical Planning and Survey Department, Kiambu County; and NEMA
Creating daily programmes for local TV 1 No.
Kiambu County Government
Creating electronic screens to display public information
1 No.
Establishment of formal local citizen forum 1 No.
Establishment of information cell for general and legal information about various policies and Acts.
1 No.
Source: Generated by Consultants
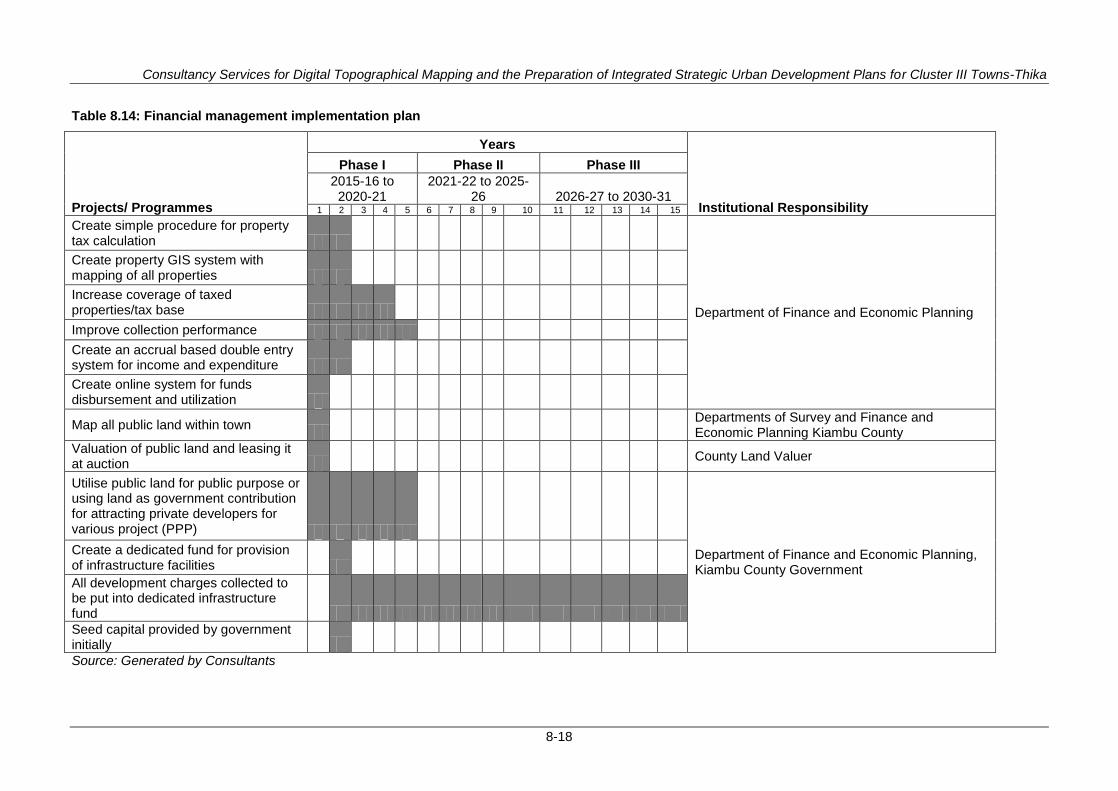
Consultancy Services for Digital Topographical Mapping and the Preparation of Integrated Strategic Urban Development Plans for Cluster III Towns-Thika
8-18
Table 8.14: Financial management implementation plan
Projects/ Programmes
Years
Institutional Responsibility
Phase I Phase II Phase III
2015-16 to 2020-21
2021-22 to 2025-26 2026-27 to 2030-31
1 2 3 4 5 6 7 8 9 10 11 12 13 14 15
Create simple procedure for property tax calculation
Department of Finance and Economic Planning
Create property GIS system with mapping of all properties
Increase coverage of taxed properties/tax base
Improve collection performance
Create an accrual based double entry system for income and expenditure
Create online system for funds disbursement and utilization
Map all public land within town
Departments of Survey and Finance and Economic Planning Kiambu County
Valuation of public land and leasing it at auction
County Land Valuer
Utilise public land for public purpose or using land as government contribution for attracting private developers for various project (PPP)
Department of Finance and Economic Planning, Kiambu County Government
Create a dedicated fund for provision of infrastructure facilities
All development charges collected to be put into dedicated infrastructure fund
Seed capital provided by government initially
Source: Generated by Consultants
Consultancy Services for Digital Topographical Mapping and the Preparation of Integrated Strategic Urban Development Plans for Cluster III Towns-Thika
8-19
8.2 Additional institutional initiatives for plan implementation
Apart from providing the list of departments responsible for implementation of various projects, the county government needs to create additional institutional arrangement for proper implementation of the plan. Time bound and dedicated responsibilities have to be assigned to the staff responsible for implementation.
Town Development Agency (TDA): The Consultant proposes a development agency for plan implementation, which will have full authority to deal with various issues related to implementation. Dedicated staff is proposed to be provided to the TDA. The personnel from respective county departments will be employed in the DA with specific implementation mandate in a time bound manner. The process of nominating or selection of staff for DA can be the standard procedure adopted by the County Government. The DA may comprise the steering committees or special task forces for various sector like land acquisition, building approval, business approval, public works, environment, water and sanitation, electricity and street light, security, PPPs, etc. The steering committees or task forces will prepare their sectoral implementation plan in detail and ensure the implementation. The DA can be established in line of any development agencies like Johannesburg Development Agency, Delhi Development Authority and the like.
There are precedents in Kenya for establishing development authorities. Of these a few are functioning well such as the Kenya Airports Authority and LAPSSET Corridor Development Authority (LCDA). Others such as the Lake Basin Development Authority and the Kerio Valley Development Authority, etc. are not doing so well.
The County Governments Act (No. 17 of 2012, Revised Edition) provides the power to create a development authority.
Section 6. (5) (a): Powers of county governments states:
-To ensure efficiency in the delivery of service or carrying out of a function for which the county government is responsible, the county government may—
(a) establish a company, firm or other body for the delivery of a particular service or carrying on of a particular function-
Therefore, the county government is empowered to create a development authority for Thika town. The proposed ‗Thika Town Development Authority‘ will be empowered and mandated to do all the development work as envisaged in the Thika ISUDP. Since the cost of implementing the projects mentioned in the ISUDP is beyond the financial capacity of the Kiambu County considering the low resource base, low coverage, low rates, etc., a new mechanism is suggested to embark upon the process of development with multiplier effect. The steps for proposed process are as below:
Step I: Gazette notification: A gazette notification for creating the town development authority with its roles and responsibilities.
Step II: Creating initial capital: initial capital needs to be created to start the development process in the town. The development authority needs to be provided with seed capital to start the substantial activities or projects, say Khs 200 million. Considering its mandate over land development, the authority may obtain additional money by taking loans with guarantees from the county or national government, as the case may be.
Step III: Land acquisition: After getting the initial capital, the town development authority will start acquiring the potential land for development as per the ISUDP proposal. The authority can take up high priority projects that have a possibility of high return. The authority may start by developing land for residential development.
Step IV: Developing site or site servicing: the next step would be to develop the acquired land by proving basic infrastructure like roads, storm water drainage, electricity and street light, water supply lines, sewers, etc.
Step V: Auctioning of development land: Simultaneously, during the site development phase or after completion of the site servicing stage, the Town Development Authority should auction the developed land for further development as per the planned use of that particular site. Individuals,
Consultancy Services for Digital Topographical Mapping and the Preparation of Integrated Strategic Urban Development Plans for Cluster III Towns-Thika
8-20
companies, trusts, groups, etc. will be invited to buy the land for further development. The money earned through the auction of this developed land will go into the account of the Town Development Authority and not in the general account of the County.
Fund consolidation: the amount earned through selling of developed land could be around twice of the amount spent on acquisition of the undeveloped land. Around 20-40% of total cost of land acquisition may be spent for site servicing. Therefore, the profit of any project can be around 60-80%. After debt payment of the loan, around 40-60% of net profit can be expected from any project. In this way the Town Development Authority will be in a position to generate funds for its next projects.
The more detailed explanation and process of developing the basic infrastructure of town without any outside help, is explained in the same chapter under ‗Urban Dividend‘.
8.3 Actions needed after completion of the ISUDP The ISUDP is a town level planning document and hence deals with all planning activities at town level. All the planning aspects in the document have been dealt in maximum detail as far as it was possible for a town level exercise and the plan provides guidance for comprehensive and planned development. The next logical planning step is to go into more detail at the sub-town level and other lower levels of planning units. Therefore for actual implementation of the plan, some actions need to be undertaken, as suggested below:
Action Points Description Remarks
Preparation of Strategic Environmental Assessment of the ISUDP
A strategic environment assessment of the ISUDP is the first step to be followed to ensure the environmental sustainability of the plan
NEMA may be engaged for the same or the opportunity awarded to consultants by public tender for preparation of a SEA.
Since SEA not legally mandatory, therefore, some priority project may be started immediately after completion of ISUDP. However, for better weighted, SEA may be done, which can be completed within 3-5 months‘ time.
Detailed plan for residential areas
The ISUDP has zoned land for residential areas of low, medium and high density. Therefore detailed plans indicating the neighbourhood level road network, infrastructure network, recreational areas, public purposes, plot sizes, etc. have to be prepared.
The physical planning department may prepare the detailed plan internally
It can be done -either by acquiring all the land and then developing the land with basic infrastructure and then auctioning in open market -or sub-dividing the land into various plot sizes by allocating land for basic infrastructure and public facilities. Then charging an additional amount for development from the plot owners
Detailed plan for industrial areas
The ISUDP only zones land for industrial areas for light, medium and heavy industries with respective plot sizes and zoning regulation. Therefore, detailed plans for industrial area indicating the various plot dimensions and sizes for light, medium and heavy industries
After acquiring the land, the physical planning department may prepare the detailed plan
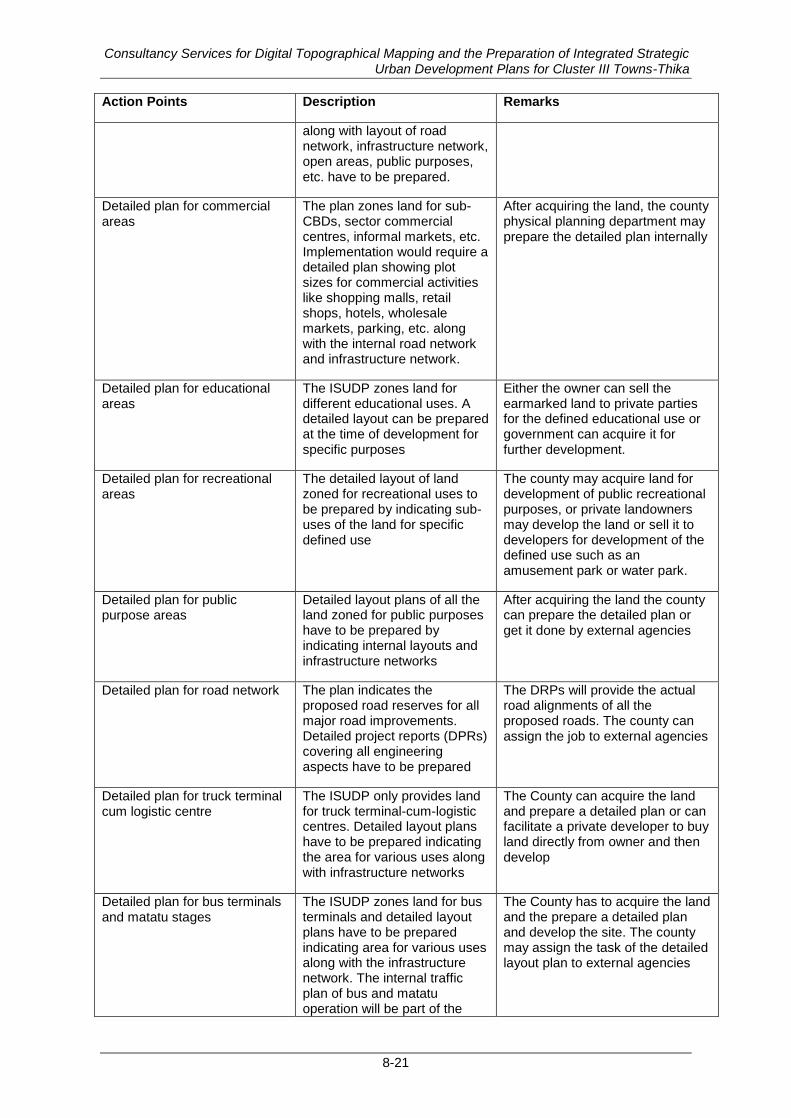
Consultancy Services for Digital Topographical Mapping and the Preparation of Integrated Strategic Urban Development Plans for Cluster III Towns-Thika
8-21
Action Points Description Remarks
along with layout of road network, infrastructure network, open areas, public purposes, etc. have to be prepared.
Detailed plan for commercial areas
The plan zones land for sub-CBDs, sector commercial centres, informal markets, etc. Implementation would require a detailed plan showing plot sizes for commercial activities like shopping malls, retail shops, hotels, wholesale markets, parking, etc. along with the internal road network and infrastructure network.
After acquiring the land, the county physical planning department may prepare the detailed plan internally
Detailed plan for educational areas
The ISUDP zones land for different educational uses. A detailed layout can be prepared at the time of development for specific purposes
Either the owner can sell the earmarked land to private parties for the defined educational use or government can acquire it for further development.
Detailed plan for recreational areas
The detailed layout of land zoned for recreational uses to be prepared by indicating sub-uses of the land for specific defined use
The county may acquire land for development of public recreational purposes, or private landowners may develop the land or sell it to developers for development of the defined use such as an amusement park or water park.
Detailed plan for public purpose areas
Detailed layout plans of all the land zoned for public purposes have to be prepared by indicating internal layouts and infrastructure networks
After acquiring the land the county can prepare the detailed plan or get it done by external agencies
Detailed plan for road network The plan indicates the proposed road reserves for all major road improvements. Detailed project reports (DPRs) covering all engineering aspects have to be prepared
The DRPs will provide the actual road alignments of all the proposed roads. The county can assign the job to external agencies
Detailed plan for truck terminal cum logistic centre
The ISUDP only provides land for truck terminal-cum-logistic centres. Detailed layout plans have to be prepared indicating the area for various uses along with infrastructure networks
The County can acquire the land and prepare a detailed plan or can facilitate a private developer to buy land directly from owner and then develop
Detailed plan for bus terminals and matatu stages
The ISUDP zones land for bus terminals and detailed layout plans have to be prepared indicating area for various uses along with the infrastructure network. The internal traffic plan of bus and matatu operation will be part of the
The County has to acquire the land and the prepare a detailed plan and develop the site. The county may assign the task of the detailed layout plan to external agencies
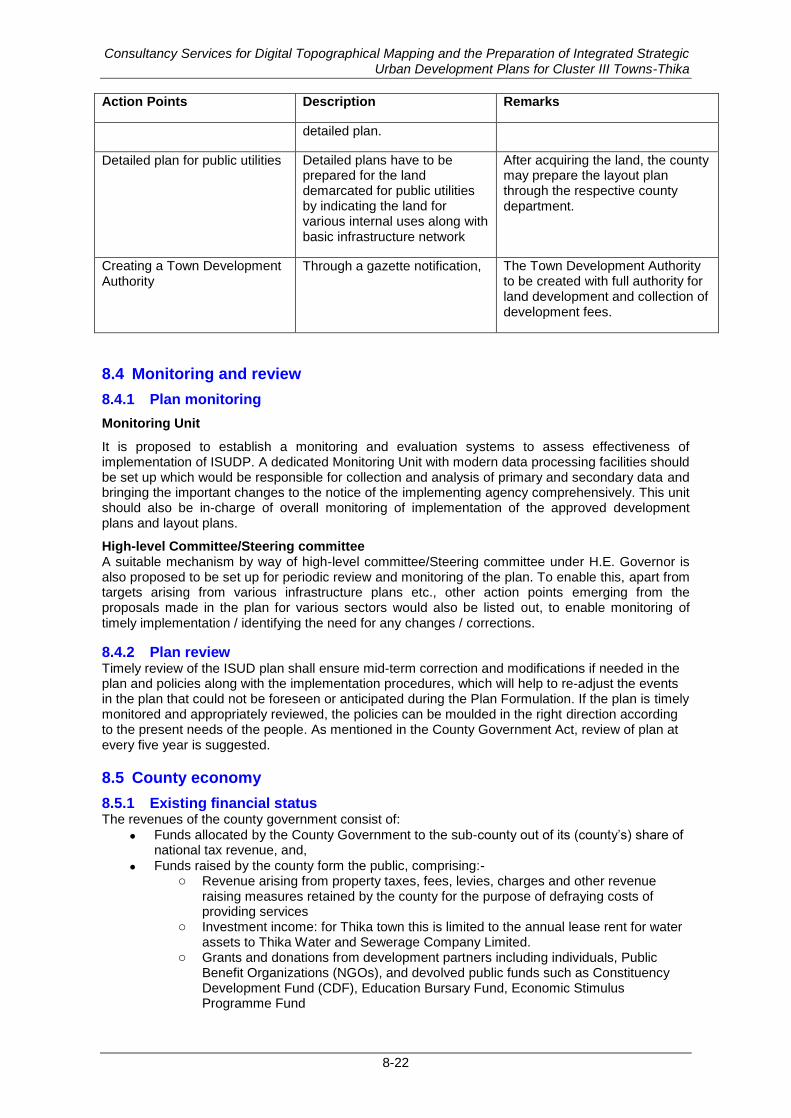
Consultancy Services for Digital Topographical Mapping and the Preparation of Integrated Strategic Urban Development Plans for Cluster III Towns-Thika
8-22
Action Points Description Remarks
detailed plan.
Detailed plan for public utilities Detailed plans have to be prepared for the land demarcated for public utilities by indicating the land for various internal uses along with basic infrastructure network
After acquiring the land, the county may prepare the layout plan through the respective county department.
Creating a Town Development Authority
Through a gazette notification, The Town Development Authority to be created with full authority for land development and collection of development fees.
8.4 Monitoring and review
8.4.1 Plan monitoring
Monitoring Unit
It is proposed to establish a monitoring and evaluation systems to assess effectiveness of implementation of ISUDP. A dedicated Monitoring Unit with modern data processing facilities should be set up which would be responsible for collection and analysis of primary and secondary data and bringing the important changes to the notice of the implementing agency comprehensively. This unit should also be in-charge of overall monitoring of implementation of the approved development plans and layout plans.
High-level Committee/Steering committee A suitable mechanism by way of high-level committee/Steering committee under H.E. Governor is also proposed to be set up for periodic review and monitoring of the plan. To enable this, apart from targets arising from various infrastructure plans etc., other action points emerging from the proposals made in the plan for various sectors would also be listed out, to enable monitoring of timely implementation / identifying the need for any changes / corrections.
8.4.2 Plan review Timely review of the ISUD plan shall ensure mid-term correction and modifications if needed in the plan and policies along with the implementation procedures, which will help to re-adjust the events in the plan that could not be foreseen or anticipated during the Plan Formulation. If the plan is timely monitored and appropriately reviewed, the policies can be moulded in the right direction according to the present needs of the people. As mentioned in the County Government Act, review of plan at every five year is suggested.
8.5 County economy
8.5.1 Existing financial status The revenues of the county government consist of:
Funds allocated by the County Government to the sub-county out of its (county‘s) share of national tax revenue, and,
Funds raised by the county form the public, comprising:- o Revenue arising from property taxes, fees, levies, charges and other revenue
raising measures retained by the county for the purpose of defraying costs of providing services
o Investment income: for Thika town this is limited to the annual lease rent for water assets to Thika Water and Sewerage Company Limited.
o Grants and donations from development partners including individuals, Public Benefit Organizations (NGOs), and devolved public funds such as Constituency Development Fund (CDF), Education Bursary Fund, Economic Stimulus Programme Fund
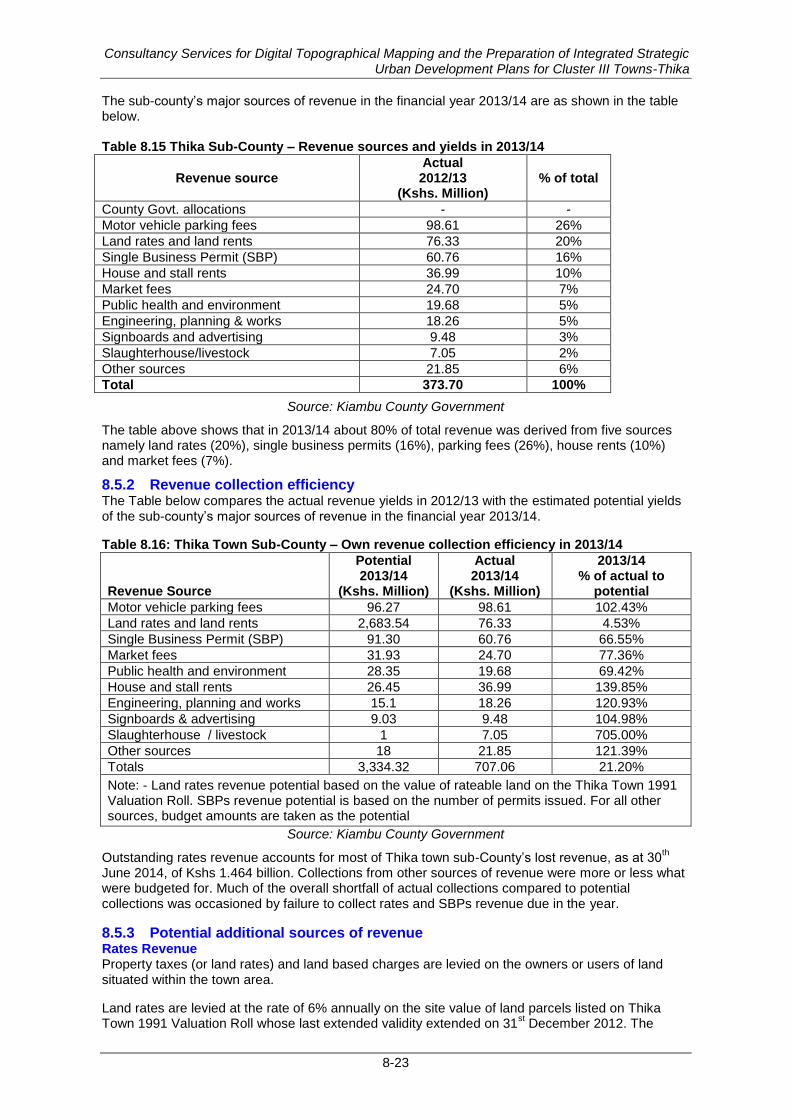
Consultancy Services for Digital Topographical Mapping and the Preparation of Integrated Strategic Urban Development Plans for Cluster III Towns-Thika
8-23
The sub-county‘s major sources of revenue in the financial year 2013/14 are as shown in the table below. Table 8.15 Thika Sub-County – Revenue sources and yields in 2013/14
Source: Kiambu County Government
The table above shows that in 2013/14 about 80% of total revenue was derived from five sources namely land rates (20%), single business permits (16%), parking fees (26%), house rents (10%) and market fees (7%).
8.5.2 Revenue collection efficiency The Table below compares the actual revenue yields in 2012/13 with the estimated potential yields of the sub-county‘s major sources of revenue in the financial year 2013/14.
Table 8.16: Thika Town Sub-County – Own revenue collection efficiency in 2013/14
Revenue Source
Potential 2013/14
(Kshs. Million)
Actual 2013/14
(Kshs. Million)
2013/14 % of actual to
potential
Motor vehicle parking fees 96.27 98.61 102.43%
Land rates and land rents 2,683.54 76.33 4.53%
Single Business Permit (SBP) 91.30 60.76 66.55%
Market fees 31.93 24.70 77.36%
Public health and environment 28.35 19.68 69.42%
House and stall rents 26.45 36.99 139.85%
Engineering, planning and works 15.1 18.26 120.93%
Signboards & advertising 9.03 9.48 104.98%
Slaughterhouse / livestock 1 7.05 705.00%
Other sources 18 21.85 121.39%
Totals 3,334.32 707.06 21.20%
Note: - Land rates revenue potential based on the value of rateable land on the Thika Town 1991 Valuation Roll. SBPs revenue potential is based on the number of permits issued. For all other sources, budget amounts are taken as the potential
Source: Kiambu County Government
Outstanding rates revenue accounts for most of Thika town sub-County‘s lost revenue, as at 30th
June 2014, of Kshs 1.464 billion. Collections from other sources of revenue were more or less what were budgeted for. Much of the overall shortfall of actual collections compared to potential collections was occasioned by failure to collect rates and SBPs revenue due in the year.
8.5.3 Potential additional sources of revenue Rates Revenue Property taxes (or land rates) and land based charges are levied on the owners or users of land situated within the town area.
Land rates are levied at the rate of 6% annually on the site value of land parcels listed on Thika Town 1991 Valuation Roll whose last extended validity extended on 31
st December 2012. The
Revenue source Actual 2012/13
(Kshs. Million) % of total
County Govt. allocations - -
Motor vehicle parking fees 98.61 26%
Land rates and land rents 76.33 20%
Single Business Permit (SBP) 60.76 16%
House and stall rents 36.99 10%
Market fees 24.70 7%
Public health and environment 19.68 5%
Engineering, planning & works 18.26 5%
Signboards and advertising 9.48 3%
Slaughterhouse/livestock 7.05 2%
Other sources 21.85 6%
Total 373.70 100%
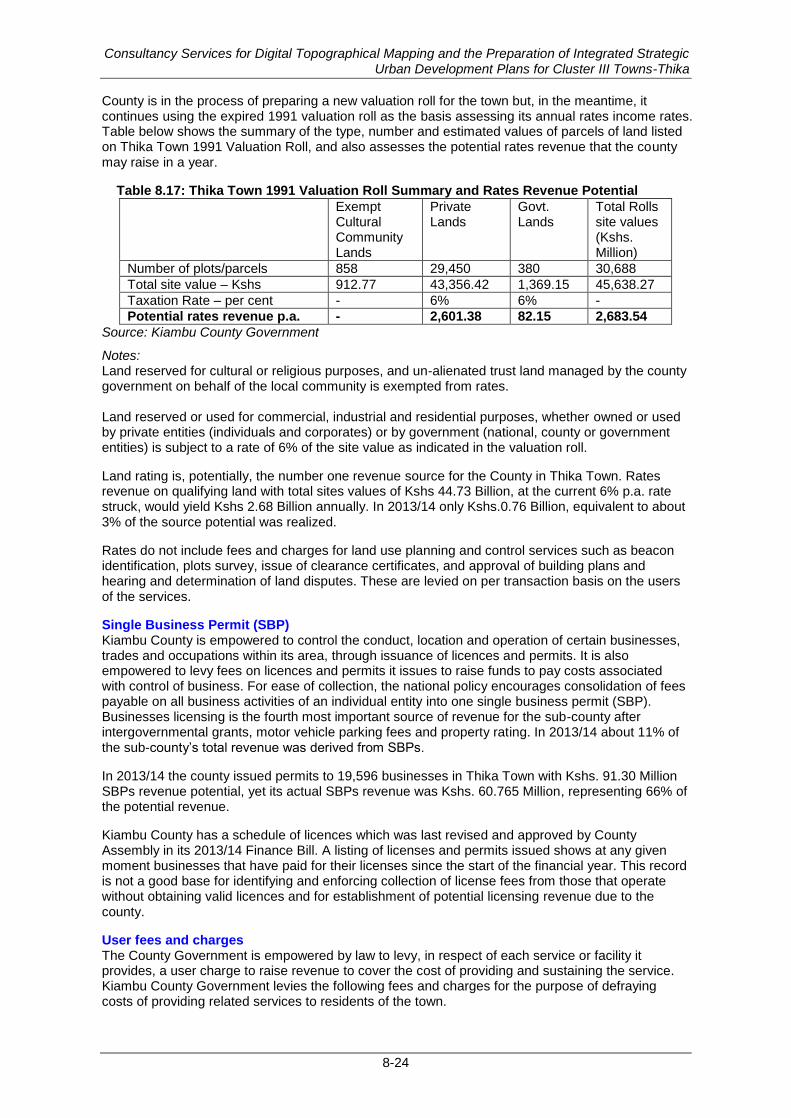
Consultancy Services for Digital Topographical Mapping and the Preparation of Integrated Strategic Urban Development Plans for Cluster III Towns-Thika
8-24
County is in the process of preparing a new valuation roll for the town but, in the meantime, it continues using the expired 1991 valuation roll as the basis assessing its annual rates income rates. Table below shows the summary of the type, number and estimated values of parcels of land listed on Thika Town 1991 Valuation Roll, and also assesses the potential rates revenue that the county may raise in a year.
Table 8.17: Thika Town 1991 Valuation Roll Summary and Rates Revenue Potential
Exempt Cultural Community Lands
Private Lands
Govt. Lands
Total Rolls site values (Kshs. Million)
Number of plots/parcels 858 29,450 380 30,688
Total site value – Kshs 912.77 43,356.42 1,369.15 45,638.27
Taxation Rate – per cent - 6% 6% -
Potential rates revenue p.a. - 2,601.38 82.15 2,683.54
Source: Kiambu County Government
Notes: Land reserved for cultural or religious purposes, and un-alienated trust land managed by the county government on behalf of the local community is exempted from rates. Land reserved or used for commercial, industrial and residential purposes, whether owned or used by private entities (individuals and corporates) or by government (national, county or government entities) is subject to a rate of 6% of the site value as indicated in the valuation roll.
Land rating is, potentially, the number one revenue source for the County in Thika Town. Rates revenue on qualifying land with total sites values of Kshs 44.73 Billion, at the current 6% p.a. rate struck, would yield Kshs 2.68 Billion annually. In 2013/14 only Kshs.0.76 Billion, equivalent to about 3% of the source potential was realized.
Rates do not include fees and charges for land use planning and control services such as beacon identification, plots survey, issue of clearance certificates, and approval of building plans and hearing and determination of land disputes. These are levied on per transaction basis on the users of the services.
Single Business Permit (SBP) Kiambu County is empowered to control the conduct, location and operation of certain businesses, trades and occupations within its area, through issuance of licences and permits. It is also empowered to levy fees on licences and permits it issues to raise funds to pay costs associated with control of business. For ease of collection, the national policy encourages consolidation of fees payable on all business activities of an individual entity into one single business permit (SBP). Businesses licensing is the fourth most important source of revenue for the sub-county after intergovernmental grants, motor vehicle parking fees and property rating. In 2013/14 about 11% of the sub-county‘s total revenue was derived from SBPs.
In 2013/14 the county issued permits to 19,596 businesses in Thika Town with Kshs. 91.30 Million SBPs revenue potential, yet its actual SBPs revenue was Kshs. 60.765 Million, representing 66% of the potential revenue.
Kiambu County has a schedule of licences which was last revised and approved by County Assembly in its 2013/14 Finance Bill. A listing of licenses and permits issued shows at any given moment businesses that have paid for their licenses since the start of the financial year. This record is not a good base for identifying and enforcing collection of license fees from those that operate without obtaining valid licences and for establishment of potential licensing revenue due to the county.
User fees and charges The County Government is empowered by law to levy, in respect of each service or facility it provides, a user charge to raise revenue to cover the cost of providing and sustaining the service. Kiambu County Government levies the following fees and charges for the purpose of defraying costs of providing related services to residents of the town.
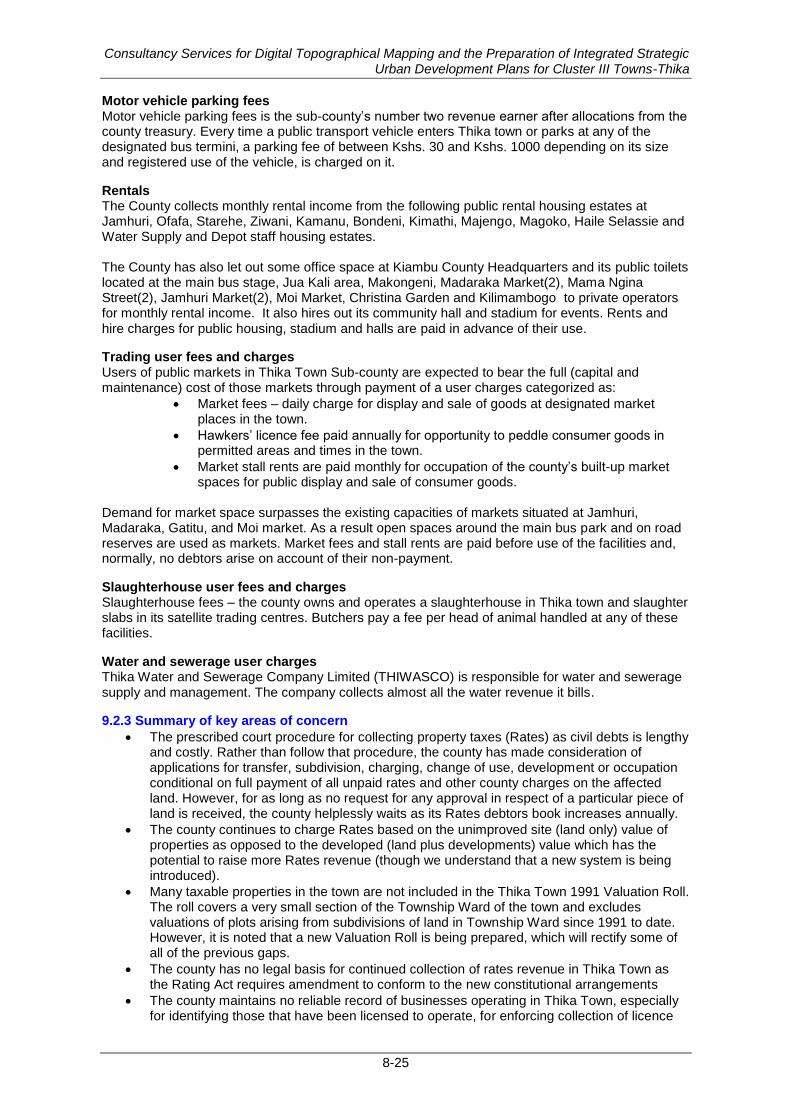
Consultancy Services for Digital Topographical Mapping and the Preparation of Integrated Strategic Urban Development Plans for Cluster III Towns-Thika
8-25
Motor vehicle parking fees Motor vehicle parking fees is the sub-county‘s number two revenue earner after allocations from the county treasury. Every time a public transport vehicle enters Thika town or parks at any of the designated bus termini, a parking fee of between Kshs. 30 and Kshs. 1000 depending on its size and registered use of the vehicle, is charged on it.
Rentals The County collects monthly rental income from the following public rental housing estates at Jamhuri, Ofafa, Starehe, Ziwani, Kamanu, Bondeni, Kimathi, Majengo, Magoko, Haile Selassie and Water Supply and Depot staff housing estates.
The County has also let out some office space at Kiambu County Headquarters and its public toilets located at the main bus stage, Jua Kali area, Makongeni, Madaraka Market(2), Mama Ngina Street(2), Jamhuri Market(2), Moi Market, Christina Garden and Kilimambogo to private operators for monthly rental income. It also hires out its community hall and stadium for events. Rents and hire charges for public housing, stadium and halls are paid in advance of their use.
Trading user fees and charges Users of public markets in Thika Town Sub-county are expected to bear the full (capital and maintenance) cost of those markets through payment of a user charges categorized as:
Market fees – daily charge for display and sale of goods at designated market places in the town.
Hawkers‘ licence fee paid annually for opportunity to peddle consumer goods in permitted areas and times in the town.
Market stall rents are paid monthly for occupation of the county‘s built-up market spaces for public display and sale of consumer goods.
Demand for market space surpasses the existing capacities of markets situated at Jamhuri, Madaraka, Gatitu, and Moi market. As a result open spaces around the main bus park and on road reserves are used as markets. Market fees and stall rents are paid before use of the facilities and, normally, no debtors arise on account of their non-payment.
Slaughterhouse user fees and charges Slaughterhouse fees – the county owns and operates a slaughterhouse in Thika town and slaughter slabs in its satellite trading centres. Butchers pay a fee per head of animal handled at any of these facilities.
Water and sewerage user charges Thika Water and Sewerage Company Limited (THIWASCO) is responsible for water and sewerage supply and management. The company collects almost all the water revenue it bills.
9.2.3 Summary of key areas of concern
The prescribed court procedure for collecting property taxes (Rates) as civil debts is lengthy and costly. Rather than follow that procedure, the county has made consideration of applications for transfer, subdivision, charging, change of use, development or occupation conditional on full payment of all unpaid rates and other county charges on the affected land. However, for as long as no request for any approval in respect of a particular piece of land is received, the county helplessly waits as its Rates debtors book increases annually.
The county continues to charge Rates based on the unimproved site (land only) value of properties as opposed to the developed (land plus developments) value which has the potential to raise more Rates revenue (though we understand that a new system is being introduced).
Many taxable properties in the town are not included in the Thika Town 1991 Valuation Roll. The roll covers a very small section of the Township Ward of the town and excludes valuations of plots arising from subdivisions of land in Township Ward since 1991 to date. However, it is noted that a new Valuation Roll is being prepared, which will rectify some of all of the previous gaps.
The county has no legal basis for continued collection of rates revenue in Thika Town as the Rating Act requires amendment to conform to the new constitutional arrangements
The county maintains no reliable record of businesses operating in Thika Town, especially for identifying those that have been licensed to operate, for enforcing collection of licence
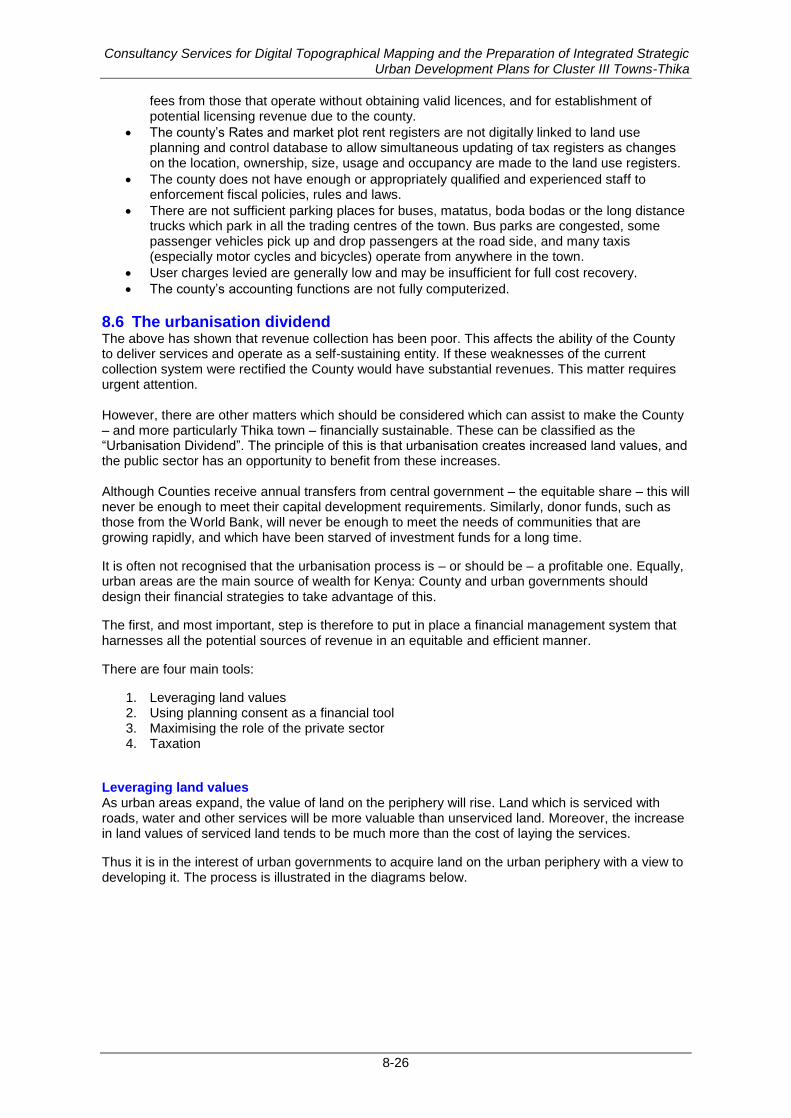
Consultancy Services for Digital Topographical Mapping and the Preparation of Integrated Strategic Urban Development Plans for Cluster III Towns-Thika
8-26
fees from those that operate without obtaining valid licences, and for establishment of potential licensing revenue due to the county.
The county‘s Rates and market plot rent registers are not digitally linked to land use planning and control database to allow simultaneous updating of tax registers as changes on the location, ownership, size, usage and occupancy are made to the land use registers.
The county does not have enough or appropriately qualified and experienced staff to enforcement fiscal policies, rules and laws.
There are not sufficient parking places for buses, matatus, boda bodas or the long distance trucks which park in all the trading centres of the town. Bus parks are congested, some passenger vehicles pick up and drop passengers at the road side, and many taxis (especially motor cycles and bicycles) operate from anywhere in the town.
User charges levied are generally low and may be insufficient for full cost recovery.
The county‘s accounting functions are not fully computerized.
8.6 The urbanisation dividend The above has shown that revenue collection has been poor. This affects the ability of the County to deliver services and operate as a self-sustaining entity. If these weaknesses of the current collection system were rectified the County would have substantial revenues. This matter requires urgent attention. However, there are other matters which should be considered which can assist to make the County – and more particularly Thika town – financially sustainable. These can be classified as the ―Urbanisation Dividend‖. The principle of this is that urbanisation creates increased land values, and the public sector has an opportunity to benefit from these increases. Although Counties receive annual transfers from central government – the equitable share – this will never be enough to meet their capital development requirements. Similarly, donor funds, such as those from the World Bank, will never be enough to meet the needs of communities that are growing rapidly, and which have been starved of investment funds for a long time.
It is often not recognised that the urbanisation process is – or should be – a profitable one. Equally, urban areas are the main source of wealth for Kenya: County and urban governments should design their financial strategies to take advantage of this.
The first, and most important, step is therefore to put in place a financial management system that harnesses all the potential sources of revenue in an equitable and efficient manner.
There are four main tools:
1. Leveraging land values 2. Using planning consent as a financial tool 3. Maximising the role of the private sector 4. Taxation
Leveraging land values As urban areas expand, the value of land on the periphery will rise. Land which is serviced with roads, water and other services will be more valuable than unserviced land. Moreover, the increase in land values of serviced land tends to be much more than the cost of laying the services.
Thus it is in the interest of urban governments to acquire land on the urban periphery with a view to developing it. The process is illustrated in the diagrams below.
Consultancy Services for Digital Topographical Mapping and the Preparation of Integrated Strategic Urban Development Plans for Cluster III Towns-Thika
8-27
An example: the town is shown by the boundary in black. It is served by on major through road, and another road heading to the North East. Population projections show that it will double in size in 30 years.
Consultancy Services for Digital Topographical Mapping and the Preparation of Integrated Strategic Urban Development Plans for Cluster III Towns-Thika
8-28
To the North of the town is a relatively flat area of agricultural land. The town acquires the land required for its future expansion at agricultural values.
The town services the land with a new road and thereby opens it up for development
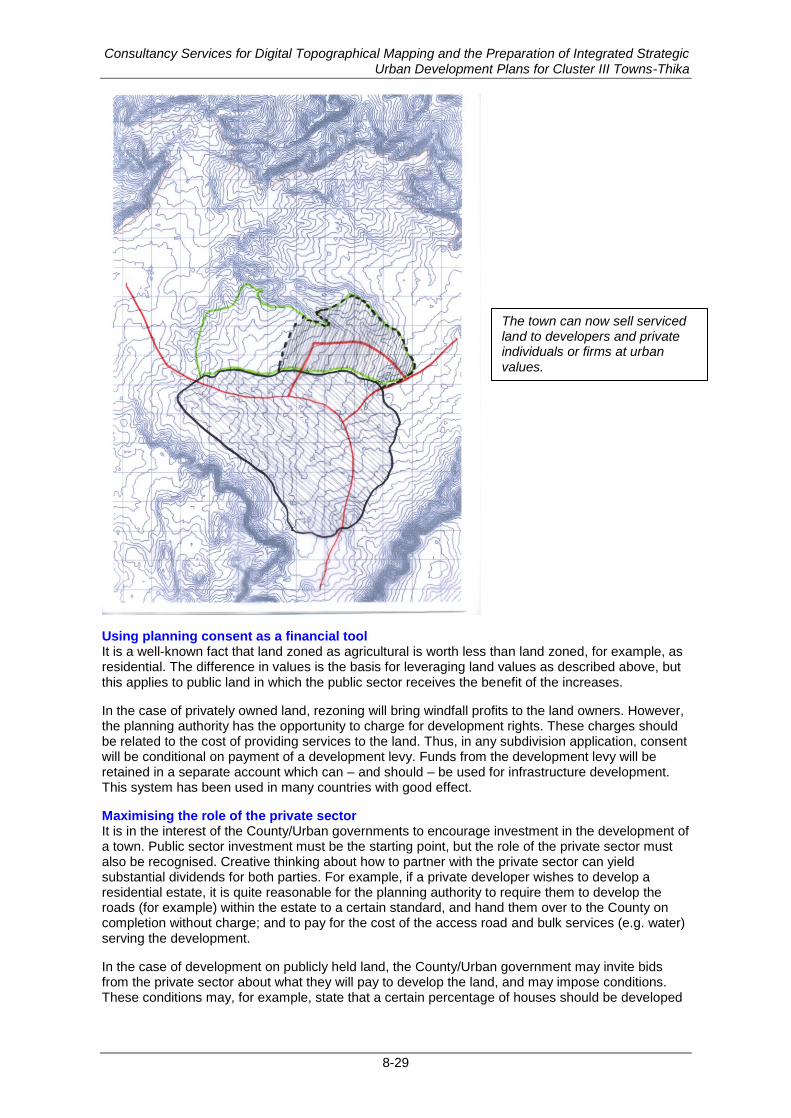
Consultancy Services for Digital Topographical Mapping and the Preparation of Integrated Strategic Urban Development Plans for Cluster III Towns-Thika
8-29
Using planning consent as a financial tool It is a well-known fact that land zoned as agricultural is worth less than land zoned, for example, as residential. The difference in values is the basis for leveraging land values as described above, but this applies to public land in which the public sector receives the benefit of the increases.
In the case of privately owned land, rezoning will bring windfall profits to the land owners. However, the planning authority has the opportunity to charge for development rights. These charges should be related to the cost of providing services to the land. Thus, in any subdivision application, consent will be conditional on payment of a development levy. Funds from the development levy will be retained in a separate account which can – and should – be used for infrastructure development. This system has been used in many countries with good effect.
Maximising the role of the private sector It is in the interest of the County/Urban governments to encourage investment in the development of a town. Public sector investment must be the starting point, but the role of the private sector must also be recognised. Creative thinking about how to partner with the private sector can yield substantial dividends for both parties. For example, if a private developer wishes to develop a residential estate, it is quite reasonable for the planning authority to require them to develop the roads (for example) within the estate to a certain standard, and hand them over to the County on completion without charge; and to pay for the cost of the access road and bulk services (e.g. water) serving the development.
In the case of development on publicly held land, the County/Urban government may invite bids from the private sector about what they will pay to develop the land, and may impose conditions. These conditions may, for example, state that a certain percentage of houses should be developed
The town can now sell serviced land to developers and private individuals or firms at urban values.
Consultancy Services for Digital Topographical Mapping and the Preparation of Integrated Strategic Urban Development Plans for Cluster III Towns-Thika
8-30
for the low income groups. Such public private partnerships can yield cost effective and socially appropriate developments.
Taxation Kenyan towns (with the possible exception of Mombasa) have neglected the potential of Rates income. There are many reasons for this, including:
The cost of revaluation has meant that most valuation rolls are decades old
The cost and time of dealing with appeals against valuations deters authorities from revaluation
Typically, Rates accounts are annual and efforts to recover debts are expensive
Many of the biggest culprits in terms of arrears are politically influential figures
Recovery of debts through the courts is slow and expensive
There is no system to bring new properties onto the Valuation Roll
Most Rates are based on land only, thus not fully recognising the value of the improvements (=buildings) on the land
Worldwide it is not unusual for Rates income (in many countries, described as Property Tax) to be more than half of the total income of an urban government. Property taxes have the advantage of being progressive (i.e. people with more expensive properties pay more than those with less valuable ones) and relatively simple. The problems regarding appeals against valuations and debt recovery however affect many jurisdictions, but there are solutions in sight which should be given consideration.
Regarding valuations, it is possible to have values for each block, or neighbourhood; in which case every property within that block will pay the same, and the finer distinctions between one building and another are ignored.
Regarding debt, in South Africa municipalities buy their electricity from the national service provider, and sell it on to the individual household or business. This means that they have the right to disconnect a customer who is in arrears. They have the legal power to charge Rates on a monthly basis, so rates, electricity and water are on the same account. This ensures that all three are paid regularly, and if they are not paid, the electricity is turned off. This is a powerful weapon which ensures a steady stream of revenue for the municipality. (It is worth noting that the City of Johannesburg‘s estimates of Rates revenue for the financial year 2014/2015 is about $684 million
14.
A substantial sum.
The value of the Rates income cannot be underestimated. Every development within the urban boundary is a long term and ever increasing income stream. If, as is the case in Johannesburg, the rates are increased on an annual basis, then they become a highly valuable source of income which should far outstrip the current sources such as market fees, parking and the Single Business Permit.
8.7 Public Private Partnerships
8.7.1 What are PPPs and why do we need them? The public sector is always dependent on the private sector for the delivery of services, whether it is construction of roads and offices or the supply of stationery. Are these PPPs? For example, if a contractor builds a road for the government, he will have to quote a price for the construction. He is taking the risk that, for example, his workers could go on strike and demand double wages; or that the soils on which the road is being built are very poor. In such a case the government takes none of the risk: it is the private contractor who runs the risk of making a loss on the project. Equally he might make a huge profit because, for example, the soils are much better than he thought. Is this a PPP? There are two typical characteristics for PPPs which make them different from ordinary service contracts.
There is a sharing of the responsibility and the risks of the project.
14
City of Johannesburg: 2013/14 – 2014/2015 Draft Medium Term Budget
Consultancy Services for Digital Topographical Mapping and the Preparation of Integrated Strategic Urban Development Plans for Cluster III Towns-Thika
8-31
The relationship between the parties is a long term one, typically a minimum of five years, with a maximum of 30 years.
8.7.2 What are the advantages of PPPs? The most common motivation for PPPs is that the public sector lacks the funds required. For example, construction of major highways requires massive capital. If a PPP is used, which allows the private company to recover its costs over a long-term period through tolls, the road can be built and operated without requiring expenditure from the National treasury. A second reason is that the private sector can bring skills to the public sector which it may lack, For example, the public sector may not have enough people to operate a water system including the purification plant, billing and other management issues: it can enter into a PPP and thereby ensure that the skills to operate the system are obtained.
8.7.3 What are the risks of PPPs? Anyone who has been married a long time will know that long-term relationships are not straightforward. Someone who seemed to be very reliable might turn out to be the opposite; someone who seemed to be financially secure might loose everything. Similarly in a PPP, an arrangement that seemed perfect at the time may collapse later. For example, a County enters into a PPP with a company to remove the rubbish in the centre of town. The contract includes the payment of a sum by the County upfront to allow the contractor to buy trucks to collect the garbage. The money is paid, but only about half of the rubbish is collected. The contractor says that the amount of rubbish he had estimated when he signed the agreement had increased, so it was not his fault. The County says that the agreement stipulates that all garbage has to be removed. So the agreement collapses. A major risk is that conditions will change so much that the project becomes unviable, or that the private sector partner lacks the funds necessary to continue. At the root of many disputes are badly defined criteria by which performance can be measured, and whether the public client is able to manage the performance of the partner. These guidelines have been prepared to assist the public party – in this case the County – to enter into a PPP which yields the best performance at the best possible price. At the heart of such a partnership is a contract which is sufficiently well prepared to allow the parties to adapt the terms in light of changing circumstances, because in the long run if either party does not receive a fair deal the PPP will fail. Moreover the contract must protect both parties against exploitation by the other. What follows is a summary of a highly technical process, and in all large PPPs the public party is advised to engage an experienced transaction adviser who can advise on the most cost effective arrangement, and protect it against the risks inherent in poorly drafted contracts.
8.7.4 Project Preparation: the sequence The sequence for the preparation of a project is as follows:
1. Conceptualization i. Identify nature of project ii. Test whether it is suitable for using a PPP approach iii. Test against County‘s and government priorities iv. Include in the County‘s multi-year budget and/or multi-year plan v. Set up project team vi. Appoint technical consultants if required
2. Feasibility Study i. Needs analysis ii. Options analysis iii. Value assessment iv. Procurement plan
3. Preparing for bidding i. Set up procurement process ii. Invite expressions of interest
Consultancy Services for Digital Topographical Mapping and the Preparation of Integrated Strategic Urban Development Plans for Cluster III Towns-Thika
8-32
iii. Prepare draft PPP agreement iv. Prepare Request for Proposal documents
4. Tendering and bid evaluation i. Issue requests for proposals (tenders) ii. Conduct due diligence on interested parties (financial ability, reputation,
experience) iii. Compliance with bid conditions
5. Negotiations and financial close i. Reach agreement on all outstanding issues ii. Finalize project documentation
6. Project monitoring i. Provision for Reporting ii. Provision for inspections iii. Mechanisms for handling complaints
8.7.5 Project conceptualization Even though the project development process must allow for changes in the project design as it evolves, perhaps the most important stage of any project is the first one which defines what is needed, how it will be addressed and, in general terms, assesses the project feasibility. This is sometimes described as a pre-feasibility study. It should be conducted carefully so as to ensure that all relevant factors are considered, and that an objective appraisal of the potential for a PPP is made. It is useful to examine these points in more detail. What is supposed to be done, and how can the present system be improved? The fundamental principle is that PPPs must operate within a mandate provided by government policy and be provided for in the Government‘s or County‘s long term planning and budgeting. As a first step it is useful to consider the vision and mission of the County, and the government policy which identifies its deliverables. What functions is the County supposed to provide? This establishes the need. The second stage is to evaluate, in general terms, how well the County is meeting the need. If there are shortcomings, are these due to:
Lack of capital?
Lack of management skills?
Lack of technical skills? What is the budget for the provision of these services? Can it be increased? What constraints is the County facing in terms of budget? From this analysis, the project sponsor (by which we mean the County) should, as objectively as possible, analyse what the cause of these problems is. Is this a short-term problem or a long-term one? What will the private sector bring to the project which the public sector cannot? It is easy to make assumptions regarding what the private sector will bring, but it is also important to know that its input will come at a cost. The sponsor should look very carefully at the status quo to determine what can be improved within the existing management and budgetary framework, remembering that PPPs – while seeming to offer solutions – can also cost substantial sums of money to establish and operate, and can have negative consequences such as resistance by labour, or public objections to private sector participation which can cause political conflict. There is also the fundamental requirement of public policy that PPPs should represent good value for money. This does not always mean that they will be cheaper from the first day of operation, but that they are, in the long run, offering services at a lower cost than the public sector can. In this connection it is important to assess whether, if the problem seems to be a shortage of capital, whether there might be other sources of capital which might be used. For example, government and
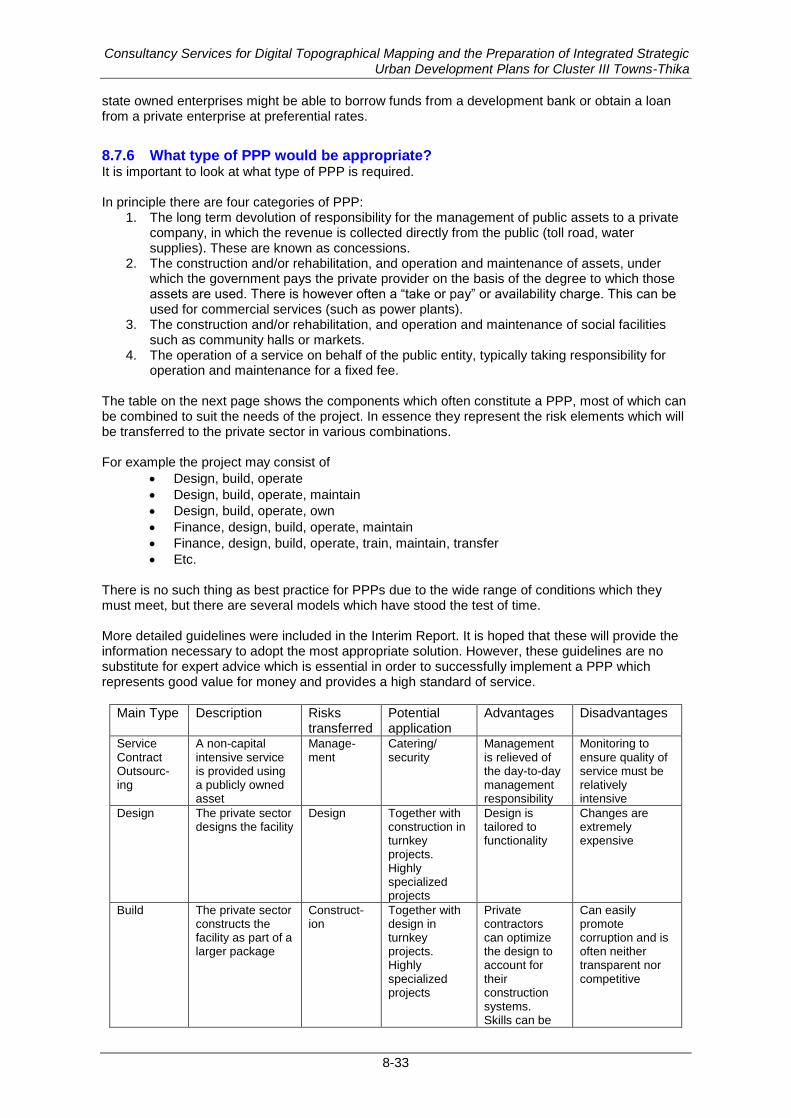
Consultancy Services for Digital Topographical Mapping and the Preparation of Integrated Strategic Urban Development Plans for Cluster III Towns-Thika
8-33
state owned enterprises might be able to borrow funds from a development bank or obtain a loan from a private enterprise at preferential rates.
8.7.6 What type of PPP would be appropriate? It is important to look at what type of PPP is required. In principle there are four categories of PPP:
1. The long term devolution of responsibility for the management of public assets to a private company, in which the revenue is collected directly from the public (toll road, water supplies). These are known as concessions.
2. The construction and/or rehabilitation, and operation and maintenance of assets, under which the government pays the private provider on the basis of the degree to which those assets are used. There is however often a ―take or pay‖ or availability charge. This can be used for commercial services (such as power plants).
3. The construction and/or rehabilitation, and operation and maintenance of social facilities such as community halls or markets.
4. The operation of a service on behalf of the public entity, typically taking responsibility for operation and maintenance for a fixed fee.
The table on the next page shows the components which often constitute a PPP, most of which can be combined to suit the needs of the project. In essence they represent the risk elements which will be transferred to the private sector in various combinations.
For example the project may consist of
Design, build, operate
Design, build, operate, maintain
Design, build, operate, own
Finance, design, build, operate, maintain
Finance, design, build, operate, train, maintain, transfer
Etc. There is no such thing as best practice for PPPs due to the wide range of conditions which they must meet, but there are several models which have stood the test of time. More detailed guidelines were included in the Interim Report. It is hoped that these will provide the information necessary to adopt the most appropriate solution. However, these guidelines are no substitute for expert advice which is essential in order to successfully implement a PPP which represents good value for money and provides a high standard of service.
Main Type Description Risks transferred
Potential application
Advantages Disadvantages
Service Contract Outsourc-ing
A non-capital intensive service is provided using a publicly owned asset
Manage-ment
Catering/ security
Management is relieved of the day-to-day management responsibility
Monitoring to ensure quality of service must be relatively intensive
Design The private sector designs the facility
Design Together with construction in turnkey projects. Highly specialized projects
Design is tailored to functionality
Changes are extremely expensive
Build The private sector constructs the facility as part of a larger package
Construct-ion
Together with design in turnkey projects. Highly specialized projects
Private contractors can optimize the design to account for their construction systems. Skills can be
Can easily promote corruption and is often neither transparent nor competitive
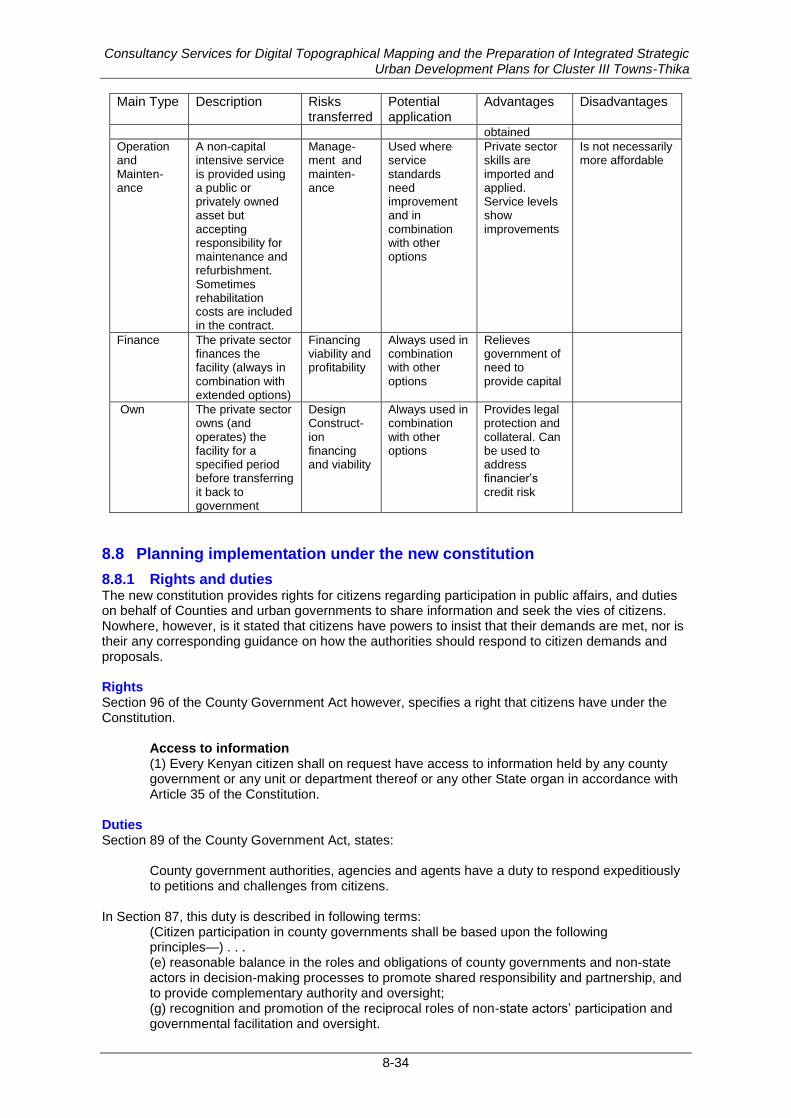
Consultancy Services for Digital Topographical Mapping and the Preparation of Integrated Strategic Urban Development Plans for Cluster III Towns-Thika
8-34
Main Type Description Risks transferred
Potential application
Advantages Disadvantages
obtained
Operation and Mainten-ance
A non-capital intensive service is provided using a public or privately owned asset but accepting responsibility for maintenance and refurbishment. Sometimes rehabilitation costs are included in the contract.
Manage-ment and mainten-ance
Used where service standards need improvement and in combination with other options
Private sector skills are imported and applied. Service levels show improvements
Is not necessarily more affordable
Finance The private sector finances the facility (always in combination with extended options)
Financing viability and profitability
Always used in combination with other options
Relieves government of need to provide capital
Own The private sector owns (and operates) the facility for a specified period before transferring it back to government
Design Construct-ion financing and viability
Always used in combination with other options
Provides legal protection and collateral. Can be used to address financier‘s credit risk
8.8 Planning implementation under the new constitution
8.8.1 Rights and duties The new constitution provides rights for citizens regarding participation in public affairs, and duties on behalf of Counties and urban governments to share information and seek the vies of citizens. Nowhere, however, is it stated that citizens have powers to insist that their demands are met, nor is their any corresponding guidance on how the authorities should respond to citizen demands and proposals. Rights Section 96 of the County Government Act however, specifies a right that citizens have under the Constitution.
Access to information (1) Every Kenyan citizen shall on request have access to information held by any county government or any unit or department thereof or any other State organ in accordance with Article 35 of the Constitution.
Duties Section 89 of the County Government Act, states:
County government authorities, agencies and agents have a duty to respond expeditiously to petitions and challenges from citizens.
In Section 87, this duty is described in following terms:
(Citizen participation in county governments shall be based upon the following principles—) . . . (e) reasonable balance in the roles and obligations of county governments and non-state actors in decision-making processes to promote shared responsibility and partnership, and to provide complementary authority and oversight; (g) recognition and promotion of the reciprocal roles of non-state actors‘ participation and governmental facilitation and oversight.
Consultancy Services for Digital Topographical Mapping and the Preparation of Integrated Strategic Urban Development Plans for Cluster III Towns-Thika
8-35
Section 90 of the County Government Act gives Counties the power to conduct a referendum, provided a sufficient percentage (25%) of the voters within the area concerned have demanded it, However, it is important to note that this is not a duty: the operative word is ―may‖, not ―must‖.
Matters subject to local referenda (1) A county government may conduct a local referendum on among other local issues— (a) county laws and petitions; or (b) planning and investment decisions affecting the county for which a petition has been raised and duly signed by at least twenty five percent of the registered voters where the referendum is to take place. (2) The Elections Act (No. 24 of 2011) shall apply, with necessary modifications, with regard to a referendum referred to under subsection (1).
It is worth noting that one of the grounds for conducting a referendum is ―planning and investment decisions‖.
8.8.2 Areas in which citizen participation should be solicited Section 87 of the County Government Act states:
Principles of citizen participation in counties Citizen participation in county governments shall be based upon the following principles— (b) reasonable access to the process of formulating and implementing policies, laws, and regulations, including the approval of development proposals, projects and budgets, the granting of permits and the establishment of specific performance standards; (f) promotion of public-private partnerships, such as joint committees, technical teams, and citizen commissions, to encourage direct dialogue and concerted action on sustainable development.
The Urban Areas and Cities Act has more detailed descriptions of what is required, but this does not apply to any of the towns in Cluster III. It will therefore not be referred to further.
8.8.3 Relevant areas for citizen participation in relation to the Kenya Municipal Programme
In the context of the present project, the relevant provision from the County Government Act is stated as:
Reasonable access to the process of formulating and implementing policies, laws, and regulations, including the approval of development proposals, projects and budgets. (Section 87 (b))
This may be interpreted as:
Policies and regulations The Terms of Reference include the need to draft proposals regarding development control, which falls under the rubric of policies and regulations.
The plan should be prepared along with the land use zoning regulations (code) which will facilitate easy implementation of the plan proposals. The land use zoning regulations (code) will be prescribed to facilitate easy interpretation and disposal of day to day references received on land matters.
Development Proposals The main output of the project is to prepare development proposals. The Terms of Reference state that
The strategic structure plan will at a minimum:
Identify the location of future residential areas
Identify the location of future commercial and industrial areas
Identify the location of extend (sic) of environmental and historical conservation areas
Articulate a road hierarchy and identify movement corridors
Consultancy Services for Digital Topographical Mapping and the Preparation of Integrated Strategic Urban Development Plans for Cluster III Towns-Thika
8-36
Incorporate good urban design principles that are characteristic of the area as perceived by the residents
Consider and incorporate community vision principles derived from participatory community reference groups/meetings
8.8.4 Projects and budgets The objective of the Capital Investment Plans is to identify projects and their budgetary implications. The Terms of Reference state:
The participatory process will result in a three year rolling capital investment plan (CIP) that reflects publicly agreed local priorities for investment in municipal services and is both financially realistic and feasible. The CIP will include estimated costs and responsibilities for implementation of agreed investments, as well as a financing plan.
This is the only section which refers directly to plans being the generated by public participation through the use of the terms ―publicly agreed‖ and ―agreed investments‖. There is also a somewhat different obligation on Counties, in section 87 of the County Government Act, regarding Public Private Partnerships (PPPs).
(f) promotion of public-private partnerships, such as joint committees, technical teams, and citizen commissions, to encourage direct dialogue and concerted action on sustainable development; and (g) recognition and promotion of the reciprocal roles of non-state actors‘ participation and governmental facilitation and oversight.
Thus if PPPs are envisaged – a real possibility for some services – this sub-section should be applied.
8.8.5 The nature of participation The project has used three methods to obtain the views of a wide range of stakeholders and ensure that their representatives are invited to the workshops. The methods are:
Discussions with all interest groups in the town. These include residents‘ associations, market operators, jua kali entrepreneurs, chamber of commerce and industry, individual enterprises, utility providers, police, workers and management in health and education institutions, transport operators, religious and educational leaders, people with special needs, public officers and political leaders,
Focus groups for specific groups, such as women‘s groups, youth, market women, etc.
Workshops, namely:
Launch workshop
Mapping, situational analysis, and visioning workshop
Preliminary Plans workshop
Capital Investment Plan workshop
Final workshop. These methods have done and will do provide very important and useful input into the planning process. However, the project will end shortly which will mark the beginning of the implementation phase.
8.8.6 Implementation of participation Relationship between the actors Though the above methods are in keeping with the act and serve a very important purpose, they are essentially consultative, in that they are devices to seek the advice and opinion of stakeholders.
True participation is however different, because it involves the sharing of power. It is a prerequisite for site specific interventions, most notably in informal settlement upgrading. However, when it comes to actually starting a process, most professionals are uncertain where to begin.
Consultancy Services for Digital Topographical Mapping and the Preparation of Integrated Strategic Urban Development Plans for Cluster III Towns-Thika
8-37
The starting point for participation is that If development doesn‘t work with people it cannot succeed. It is taken for granted that people will always welcome development, as it is good for them, but all too often things turn out differently. This can be ascribed to imposed systems which are constrained by institutional limitations and inappropriate rules. This report is therefore an outline of methodologies which reflect the values of the people who will the participants in and beneficiaries of the development.
For such a process to succeed there must be structures within which it must take place. Bottom-up development is not the same as laissez faire, and requires management in just the same way as all other development does. Thus, while the perceptions of the poor regarding their environment and their future are important, even as their aspirations are, it is neither desirable nor practical to absolve the formal structures of government and civil society of any duty of care and/or necessity to play a role.
The focus should therefore be on the interface between the poor and the structures of government and society in all their forms, because it is in this relationship that so much of conventional development has been weak. Typically the formal structures of the state, whether national regional or local government, are typically very uneasy about this interface (with a few notable exceptions).
We believe that it is, in many cases, a mixture of ignorance and fear that prevents agencies from adopting a more people-centred approach. In this they are undoubtedly assisted by accountants who will warn of the perils and cost of public participation, and the traditional design professionals whose motivations are the maintenance of high standards (or, a more cynical point of view, might be to protect their interests by creating exclusivity).
The hows are more important than the whats. By this we mean that there seem to be certain threads which run through successful projects which are derived more from how the project was designed than the solution finally adopted. The solutions are less important than the design process – and by design we are not talking about the form of physical solutions, but the relationships between, and duties of, all the parties involved in any development activity.
The hows, therefore concern the manner in which a programme is designed, an essential part of which is a knowledge of the essential ingredients. This report tries to unpack those essential ingredients and to show how they relate to each other. But the what – how those ingredients will be mixed in the final solution – is something which can never be standardised. It must respond to local conditions, whether economic, legal, human or environmental. Taking all factors into account every intervention is bound to be, and probably should be, different.
8.8.7 Participation process The first task is to ask. A random survey around the community will give a quick idea of whether there are organisations which can be taken to represent the community. During the same informal survey, the question must be asked regarding the organisations to which the person is affiliated. These are typically religious, women‘s/youth groups, work-based groups (e.g. informal traders), and savings groups. There may be political ones as well. This will then provide a universe from which to invite representatives to attend a workshop in which a representative committee will be established. But before any meeting is called, the next stage is to meet the heads of each of these organisations and canvass their ideas about how to proceed. In brief, the process is participatory from the start, but using the gradualist approach to ensure that the right people participate.
How the next stage proceeds will vary. Typically all interested parties will get together and will form a committee. The degree of formality of this committee may vary: for some it is enough to keep the whole process almost casual; for others there should be a constitution which will specify the procedures for elections, management of funds, and other matters. In some cases, the committee will establish a financing arm which can then be used as a recognised body to which public and private funds can be donated or leant. This is where the concept of ―good government‖ comes in. It is very helpful if the community can be given support in these matters, and thereby save everyone much time. For example, in a project in South Africa, community groups were assisted to form Trusts into which USAID funds could be deposited. A firm of lawyers was contracted to do all the paperwork involved for all 28 communities involved, and the process was quick (about two weeks) and easy. Similarly, a draft constitution was available which could be used as a basis for each group to develop their own.
Consultancy Services for Digital Topographical Mapping and the Preparation of Integrated Strategic Urban Development Plans for Cluster III Towns-Thika
8-38
As soon as a representative group has been formed they need to meet and develop a working methodology. This should encompass two critical components: how to consult the community as a whole before making major decisions, and how to give feedback to the community in terms of progress. These issues are easily agreed at the beginning of a process, but need constant attention if they are to be implemented in practice. We look at this in more detail below.
At this stage, an important technical point must be addressed: what is the role of the political representative, the Member of the County Assembly. He or she will typically be nervous about the role of the committee, as it will seem to undermine his/her duty to represent the community.
This is an issue which must be addressed with care, in two ways. The first task will be to include the MCA in the early discussions regarding the formation of a committee. There may already have be Ward Committee with similar functions. Ward Committees exist, under one name or another, in many jurisdictions, and while they look good on paper they are typically marred by the lack of a specific role, and the fact that the MCA either chooses the representatives or plays a big role in selecting them. Ward Committees therefore can pose a threat to effective community involvement.
For this reason the MCA can be convinced that the new committee is a development tool, which will help the development of the area. It will collaborate closely with the ward committee and the MCA will be represented on it, and is a tool to accelerate development which will be to the MCA‘s benefit.
To make sure that the MCA is supportive of the initiative he or she must be fully involved in the process, and must see it as a means of advancing his or her interests.
In turn the County/municipality must establish its own presence in the area. Sending in a community liaison person who chooses when to be there, and whose role is to tell the community what is going to happen, is not the idea.
Before we try and define the role of the public sector team in a community we should ask what the public will expect of them.
They will require good communication. This is not just a question of putting up a few posters, or addressing public meetings, but communicating information in a language and style that the residents can understand.
Communication can take many forms: for example in Zambia the project commissioned a top pop group to praise the virtues of alternative technology (compressed soil blocks) in one of their songs, which, incidentally, was at the top of the pops for six months. Street theatre and radio shows can also be effective. The written word can be important, but the spoken word usually has more impact.
A very important part of this is that all local government staff who come to the site in any capacity must speak with the same voice and either be able to answer questions, or to be able to say that they don‘t know and refer the questioner to the right person.
They will need to take informed decisions. In order to do this they will need to have not only the correct information, but the opportunity to interrogate it. They will not, and should not have to, be given information on a take-it-or-leave it basis. Experts must therefore be available to respond to queries, whether they are about land tenure, property taxes, road construction or by-laws. If they do not understand the need for something they cannot be expected to support it. Cognitive dissonance will set in, and the engagement of the community can be lost.
Services should be provided in a way that meets the needs of the residents in terms of hours of operation, location, and the attitude of the staff.
We cannot be prescriptive about how to meet these needs, but examples which have been seen to work have the following characteristics.
The local government has an office – no matter how small – within the community. It can be in an existing house if need be. At the very least it offers a location to which people can go to make contact.
The office is staffed by someone from the community, and paid by the local government. This person is basically a liaison person who understands the needs of the community and the way that the local government operates.
Consultancy Services for Digital Topographical Mapping and the Preparation of Integrated Strategic Urban Development Plans for Cluster III Towns-Thika
8-39
The local government team in the settlement can be very small or quite big, but whatever the size its main function is to act as a facilitator. What it must not be is a means by which decisions made ―in the office‖ are communicated to the people; or, even worse, an enforcement agency designed, for example, to get the people to comply with the by-laws.
The local government team must have the support of the head office to get answers to questions raised by the community, and to mobilise resources.
In other words, the local government is placing its resources at the disposal of the community to help them develop solutions that it (the community) wants and which work. Equally important is for the team and the community to be given time to take decisions. It is terribly easy, and very tempting, to get an instant decision. Thus, an MCA, for example, may get support by acclamation for a project to bring a new road into the settlement, but this is not a decision that will get the support of the community if they find that a huge number of houses will be demolished to make it possible. A sustainable decision, to which people feel committed, takes time, during which dissonances have time to be resolved.
Community decision-making follows a pattern, and in the world of real development we must understand that it is essential to allow the time for decisions to be made, and that time spent at this stage can save far more time which might be required to resolve conflicts at a later stage.
Systematic decision-making
There are three stages in decision-making.
The first stage is to have the information. This is, in a sense the foundation for a process, which is cannot proceed effectively until those involved – which should be every resident – internalise and assimilate the information. However effective mass communications are, people will usually want to ask questions to clarify matters in their mind. They must therefore have an opportunity to question someone about matters which they are not clear about. In the process trust will develop between the community and the local authority. The best environment for the transfer of information is the small group of between 15 and 25 persons in which people are less shy than in a large public meeting, and quieter people will feel free to ask questions.
The second stage is for people to look at the possibilities and consider their options. Among the types of issues will be the trade-off between standards and costs; the trade off between the provision of additional facilities and the loss of dwelling units; and the question of the routing of improved roads and the like. This stage should continue at the small group level, as many questions will arise and debates may occur. The technical nature of some questions will mean that field staff will not be equipped to deal with them; and even if they know the answers they should consciously decide not to answer them because they lack the authority to do so. Thus the second stage may include some strong questioning and debate around technical issues.
The third stage is the development of consensus. This requires good management so that people whose views are being considered do not feel excluded and resentful.
It might need some out-of-the-box thinking. For example a substantial number of people might prefer to live with only minor improvements to their infrastructure, because they cannot afford anything better. Because the saving in engineering terms is only effective if a geographical area is serviced to a specific standard those who opt for such reduced standards can swap houses
15 with
those who want to benefit from substantially increased standards. Therefore some areas will be serviced to a high standard, and others to a lower one, and charges that each household pays will reflect that.
Consensus building has to be achieved steadily, and cannot be rushed. But we must recognise that there will be some people who will refuse to collaborate, either for economic, social or political
15
Swapping houses may sound rather an odd concept, but it worked very well in Zambia where people who were living in a congested area and who wanted larger plots, and were willing to build a new house, swapped with someone whose house was due to be demolished to make way for a new road. In that way, one family surrendered their unit which was to be demolished to move into an existing house, the owners of which had been given a new plot. Similar concepts were well received in Swaziland. (Martin, Mathema et al: Mbabane Upgrading and Finance Project; Cities Alliance, Washington DC, January 2007, p130.)
Consultancy Services for Digital Topographical Mapping and the Preparation of Integrated Strategic Urban Development Plans for Cluster III Towns-Thika
8-40
reasons. How such people are brought into the consensus model requires tact and persuasion. The objective should be to give the person a voice and then bring social pressure to bear. Often people who are individualistic and stubborn will be willing to sacrifice their personal welfare for the common good if they are given the opportunity to do so voluntarily. But when they are put into a corner, and forced to collaborate, they may make life very difficult. Obviously there is no standard method for forcing compliance, but if we refer back to the role of cognitive dissonance, we recall that there must be either a penalty or reward. In this case the preferable route is to reward the person, for example by huge public acclaim, offers of additional land (or whatever) in compensation, or assistance in kind
16.
The second point about negotiation and conflict resolution is to remove the words right and wrong, and look at the situation from the point of view of what gains can be made from a settlement.
The situation is always made more intractable where people have adopted a public position. If so, they will lose face if they ―give in‖ and can be seen to be weak. They ask themselves:
- If I ―give in‖ will I be criticised for it? - Will I lose power and authority? - How will my committee see me, if I am seen to be sympathising with the other side?
It is these sorts of issue which can be the biggest stumbling block to movement in any conflict resolution process.
At the same time, leaders may ask themselves whether their long-term reputation will be enhanced more if they have a record of resolving disputes or creating them, and whether by alienating parts of the community they are sending the right message.
There is no doubt that resolving conflict is harder work in the short term than the ―non-negotiable‖ position; but conflicts have a way of re-surfacing and, like a dormant disease, erupting into nasty sores at a later stage.
The following quotation from the famous Dale Carnegie sums up this point:
You want the approval of those with whom you come into contact. You want recognition of your true worth. You want a feeling that you are important in your little world. You don‘t want to listen to cheap, insincere flattery, but you do crave sincere appreciation. You want your friends to be, as Charles Schwab put it, ―hearty in their approbation and lavish in their praise.‖ All of us want that.
So, let‘s obey the Golden Rule, and give unto others what we would have others give unto us
17.
The style with which conflict is approached is as important as the content. The same book gives
guidance on how to stop disagreement becoming an argument. This includes:
- Welcome the disagreement - Distrust your first instinctive impression - Control your temper - Listen first - Look for areas of agreement
16
In community-driven projects the use of financial compensation creates the potential for substantial conflict between the residents and the compensating authority. On the one hand, if payments are too low they will achieve nothing but disgruntlement; if they are too high they will create perverse incentives to attract compensation. In Swaziland, for example, the cost of compensation paid, largely for destruction of trees and hedges, but also of a few houses, was greater than the cost of the improvements to the roads and water systems. The fact that the valuers were paid a percentage of the sums paid out might have been a factor in inflating the sums paid. Be that as it may, there is nevertheless a likelihood that if the community had been given the responsibility for handling these funds the distribution might have been very different. By contrast, in Zambia, no one received compensation, and there was only one serious complaint: a bar owner was in the way of the road. Knowing that there was no compensation if his property was demolished, he refused to move. The community agreed with him – it would have been unfair for him to have lost such a valuable asset – so the route of the road was changed to allow him to stay.
17 Carnegie, Dale (1982) How to win friends and influence people: Pocket Books, New York, p101.
Consultancy Services for Digital Topographical Mapping and the Preparation of Integrated Strategic Urban Development Plans for Cluster III Towns-Thika
8-41
- Be honest - Promise to think over your opponents‘ ideas and study them carefully - Thanks your opponents sincerely for their interest - Postpone action to given both sides time to think through the problem.
Could my opponents be right? Partly right? Is there truth or merit in their position or argument? Is my reaction one which will relieve the problem, or will it just relieve any frustration? Will my reaction drive my opponents further away or draw them closer to me? Will my reaction elevate the estimation good people have of me? Will I win or lose? What price will I have to pay if I win? If I am quiet about it, will the disagreement blow over? Is this difficult situation an opportunity for me?
18
These attitudinal attributes can make or break any attempt to build consensus, and it is in the last paragraph of this quotation that the essence of the whole concept of successful negotiation lies. What will work for both sides? That is the much-clichéd win-win situation.
There is one more very important quality: patience. Decisions which are rushed through for the sake of appearance of consensus can unravel with disarming speed. So, however, tempting it may be, we do not grab at the first straw of agreement, but make sure that agreement is reached with a complete understanding by both sides of precisely what has been agreed and how it will be implemented.
There is also a need for specific skills.
The community facilitator has a job which requires experience to deal with conflict in a non-directive way: this is much harder than it sounds. He or she also has to understand the technical issues involved, without purporting to become an expert. He or she must be a friend and servant of the community while honestly and conscientiously serving the local government.
Secondly there is a need for the leadership, and the community at large, to understand and be able to manage effective conflict resolution and consensus building.
8.8.8 Putting participation theory into practice What follows is therefore a proposal for new ways of working which are not money-led, nor project-led, but are sustainable in the very best term of the word. This way of working gives the residents of informal settlements, which is used here as an example, a meaningful role in devising their own answers to their problems, and gives them a political and economic stake within the system of governance. In order to do so, it requires local government to treat them as partners, an act of trust that is not always easy. But unless and until it does do, it will not succeed to make a genuine difference. Moreover, trust in this case does not just mean trust in the social sense, but the financial sense as well: the community must be given control over resources.
No public agency ever has enough money to serve everyone‘s needs. Capital for development must therefore be rationed, and costs are recovered either through user charges or formal loan mechanisms. The needy and disadvantaged must compete for resources against other claims: the major highway, the new market, the sewage works; street lighting in upper-income areas. But we have to assume that they will be given a fair slice of the cake. The traditional budget system is based on projects: so much for the new highway, to be spread over three years; so much for the market etc etc.
This budgeting system is subject to fickle and volatile political pressures. The correct route for good government is to ensure that a fixed percentage of the annual budget is allocated to specific purposes, e.g. urban upgrading in specified areas. This system is no different in principle from Kenya‘s constitutional guarantee, under section 202, whereby Counties are allocated ―an equitable share‖ of the national revenue, as of right. The same principle can be applied to other state budgetary systems, including local government.
Allocating the money is one thing, but how is responsibility for its expenditure to be managed?
Before attempting to answer this question we must suggest certain principles by which it would be distributed. For example:
18
Op cit, p122; quoting from Bits and Pieces, published by the Economic Press, Fairfield, N.J.
Consultancy Services for Digital Topographical Mapping and the Preparation of Integrated Strategic Urban Development Plans for Cluster III Towns-Thika
8-42
Predictability: although it is not necessary for allocations to be made annually (indeed, this might not be helpful, as the sums could be too small to spend effectively) it should accrue on a regular basis, so that, for example, there are payments on a rotating three yearly basis.
Amounts would be determined on the basis of the population and the need, using an objectively verifiable formula.
The money would be granted to a community trust from which is would be disbursed direct to suppliers and contractors. In this way no funds would be handled physically by the community members.
Payments would be released in stages by local government on presentation of satisfactory documentation.
Clearly there are many difficulties in such an arrangement, and there will be temptations to corrupt practices. Typical ones are to inflate contract prices and receive kickbacks, or accept bribes for the award of tenders. Unfortunately, these practices are found at all levels of government, and even in the private sector, so we cannot expect community-based money management to be particularly different
However, experience has shown is that the following principles are very important:
Wherever possible the community must have a financial and/or physical stake in the work. Thus, a condition for accessing the funding could be that the community must either provide, say, 10% of the grant sum up front, or must provide labour in lieu of it.
Wherever possible money matters should be managed by women. They show themselves to be better custodians of resources and generally more trustworthy. The experience of micro-lenders with a huge variety of people of different cultures and at different economic levels has demonstrated this in many ways. It will usually be necessary to have a sexually mixed group, but women‘s active participation should be actively supported. One way of doing this might be to place responsibility for the account in the hands of those who have already proved their competence in money matters, for example in a group lending scheme.
Temptations should be removed, for example, as we have already mentioned, there should be no cash.
Deterrents should be in place: for example all the committee members should have a very clear idea of how auditing works and the chances of them getting caught out if they embezzle or enter corrupt relationships.
Transparency is essential, so as to limit the potential for backroom deals.
If such safeguards can be established, how would the system work? Let us assume that a road is being upgraded. The location and design of the road has been agreed, and it is known to be within the allocation which is due to be released within a few months. Engineers appointed by the County, with support and consent from the community, have completed the working drawings and tenders have been received. The community follows public sector bidding guidelines in how tenders are awarded, and advised by the consulting engineers recommend a contractor for appointment.
At this stage the involvement of the community has been to decide, with technical advice, the route of the road and the standard of construction. Now, tenders are received and it is found that prices are above the budget. There are now three choices, and they have to be made within (say) 90 days if the tender price is not to increase.
1. Reduce the length of road to be built, and include the remainder in the allocation to be received within three years.
2. Reduce the standard of the road, for example, by making it slightly narrower, or with a lower standard of surfacing.
3. The community makes up the shortfall.
From this short scenario, the enormous value of placing the community in charge, in terms of empowerment and the taking of responsible decisions within the framework of real financial constraints becomes clear. Engineers may find the risks of such a delegation of power quite frightening. In prospect could be delays in decision-making which jeopardise the contract award, scaring off contractors due to the unfamiliar nature of the arrangement, etc.
Consultancy Services for Digital Topographical Mapping and the Preparation of Integrated Strategic Urban Development Plans for Cluster III Towns-Thika
8-43
In fact the opposite is likely to be true. People will not delay a decision when it affects their immediate interests – this sort of behaviour is much more likely when a body like the County has to take a decision for a community of which no MCA is a resident. And as for contractors‘ fear that community involvement in the contract will lead to disruption and irresponsible interference, experience shows that such contracts are far more likely to run into problems where the people are not involved. For example, in Lusaka, the contractors welcomed the communities‘ participation in the process, and there were no conflicts.
To continue the scenario: the contractor is appointed on the basis that the standards will remain the same and a shorter length of road will be built. Thereafter the contract is supervised by the resident Engineer. A community member volunteers to work with the resident engineer to see how quality checks are undertaken, and how work is measured for payment. An officially designated community person sits as an observer in the official contract site meetings, and the engineer reports on a regular basis to the project monitoring committee.
The contractor submits a payment certificate to the project monitoring committee which then approves it and passes it to the community trust fund for payment. The Trust would follow similar financial management guidelines to those applicable to any fiscally prudent organisation, whether public or private. For example the cheque would be made out by a private sector book-keeper appointed for the purpose, and would be signed by the Treasurer and Chairman of the Trust. A complete paper trail would be available for audit and public scrutiny.
If local government is to be a supporter, and not controller of local affairs, what would the role of other potential actors be?
What is the role of NGOs? Surely they should play an important role in such arrangements? Many have the skills to facilitate community involvement, to help people manage money, to mobilise community self help, to train the leadership and the like.
Although there are many very experienced and talented people work for NGOs, they are sometimes treated with scepticism by many communities. However, NGOs can be used as an initial reservoir for skills regarding participation which can be used until properly trained local government manpower is available. If they are to be used as that, the staff would be seconded to local government, and would not be seen to be working for the NGO itself. This would be the starting point for good government within the communities.
However, there are other, important, roles which NGOs can play. One of them is to support the needs of the disadvantaged; for example the orphans, exploited tenants or small scale traders whose livelihood is threatened by zealous law enforcement, etc.
Another very important role is to train and support training activities. They – especially some of the larger ones – will be able to access the very special skills required for the effective training of community participation activators, and similar work, for example the community builders.
i
Annexure 1
Notice of Intension to Plan: Thika
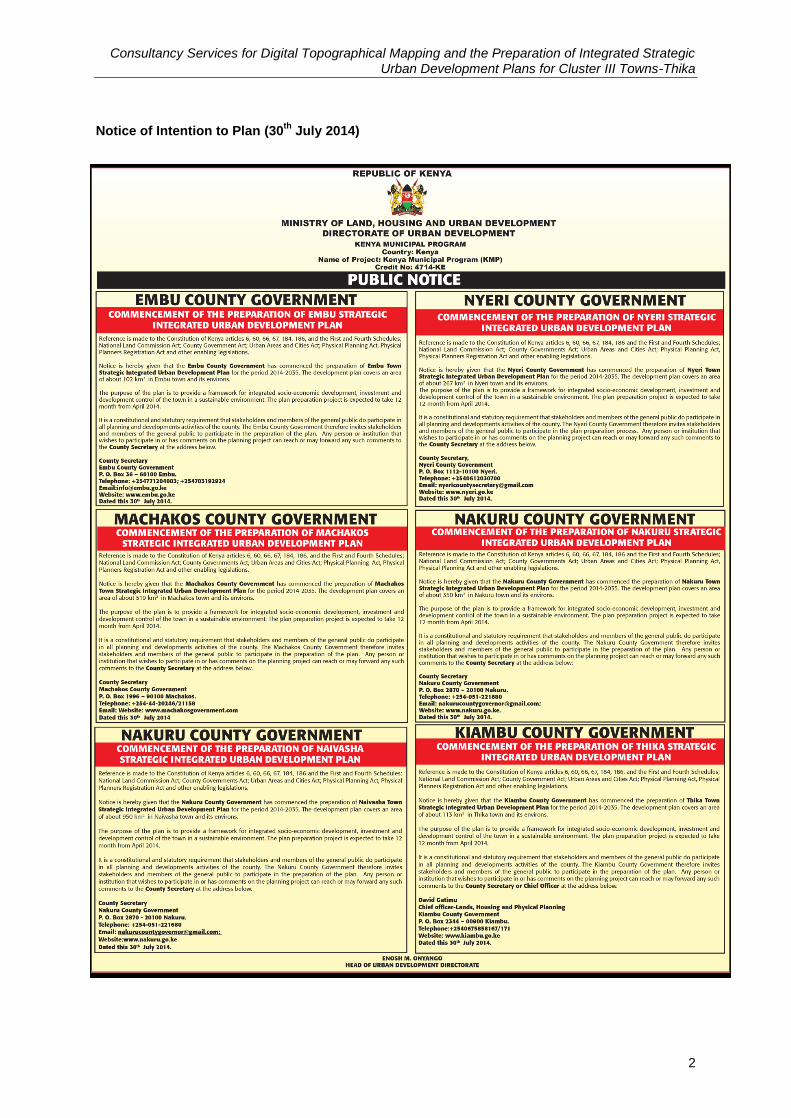
Consultancy Services for Digital Topographical Mapping and the Preparation of Integrated Strategic Urban Development Plans for Cluster III Towns-Thika
2
Notice of Intention to Plan (30th
July 2014)
Consultancy Services for Digital Topographical Mapping and the Preparation of Integrated Strategic Urban Development Plans for Cluster III Towns-Thika
3
Annexure 2
List of Stakeholders for Workshops
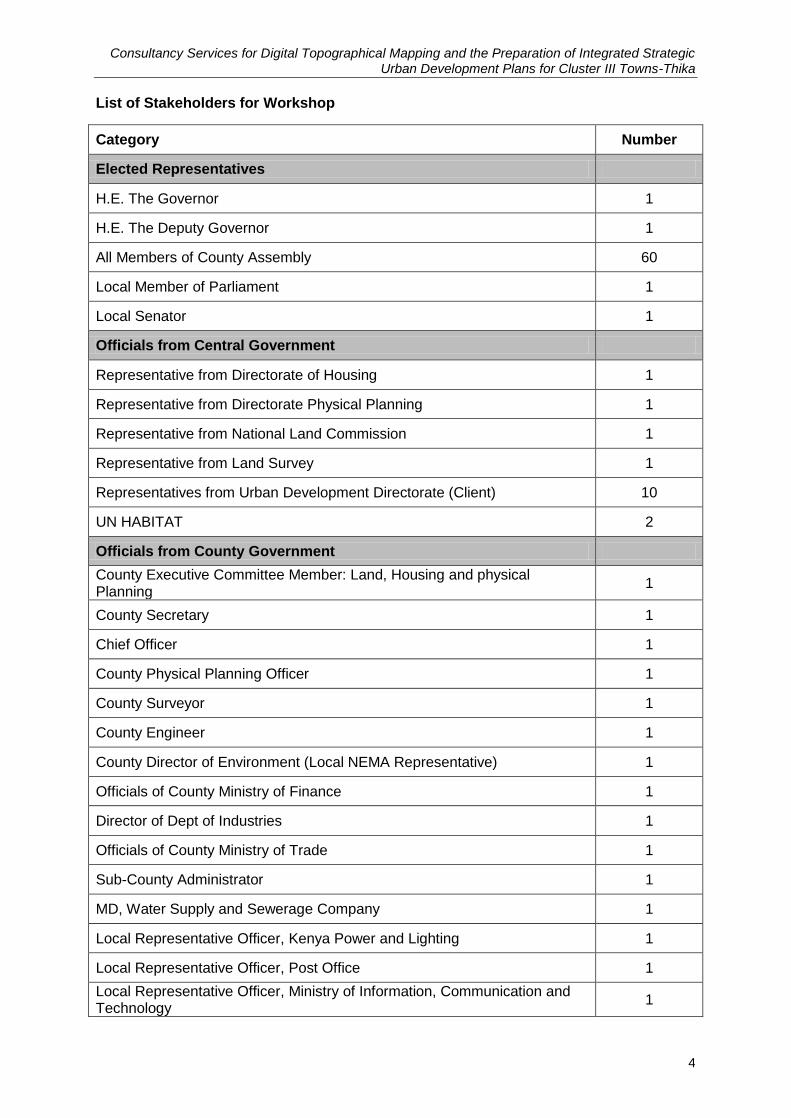
Consultancy Services for Digital Topographical Mapping and the Preparation of Integrated Strategic Urban Development Plans for Cluster III Towns-Thika
4
List of Stakeholders for Workshop
Category Number
Elected Representatives
H.E. The Governor 1
H.E. The Deputy Governor 1
All Members of County Assembly 60
Local Member of Parliament 1
Local Senator 1
Officials from Central Government
Representative from Directorate of Housing 1
Representative from Directorate Physical Planning 1
Representative from National Land Commission 1
Representative from Land Survey 1
Representatives from Urban Development Directorate (Client) 10
UN HABITAT 2
Officials from County Government
County Executive Committee Member: Land, Housing and physical Planning
1
County Secretary 1
Chief Officer 1
County Physical Planning Officer 1
County Surveyor 1
County Engineer 1
County Director of Environment (Local NEMA Representative) 1
Officials of County Ministry of Finance 1
Director of Dept of Industries 1
Officials of County Ministry of Trade 1
Sub-County Administrator 1
MD, Water Supply and Sewerage Company 1
Local Representative Officer, Kenya Power and Lighting 1
Local Representative Officer, Post Office 1
Local Representative Officer, Ministry of Information, Communication and Technology
1
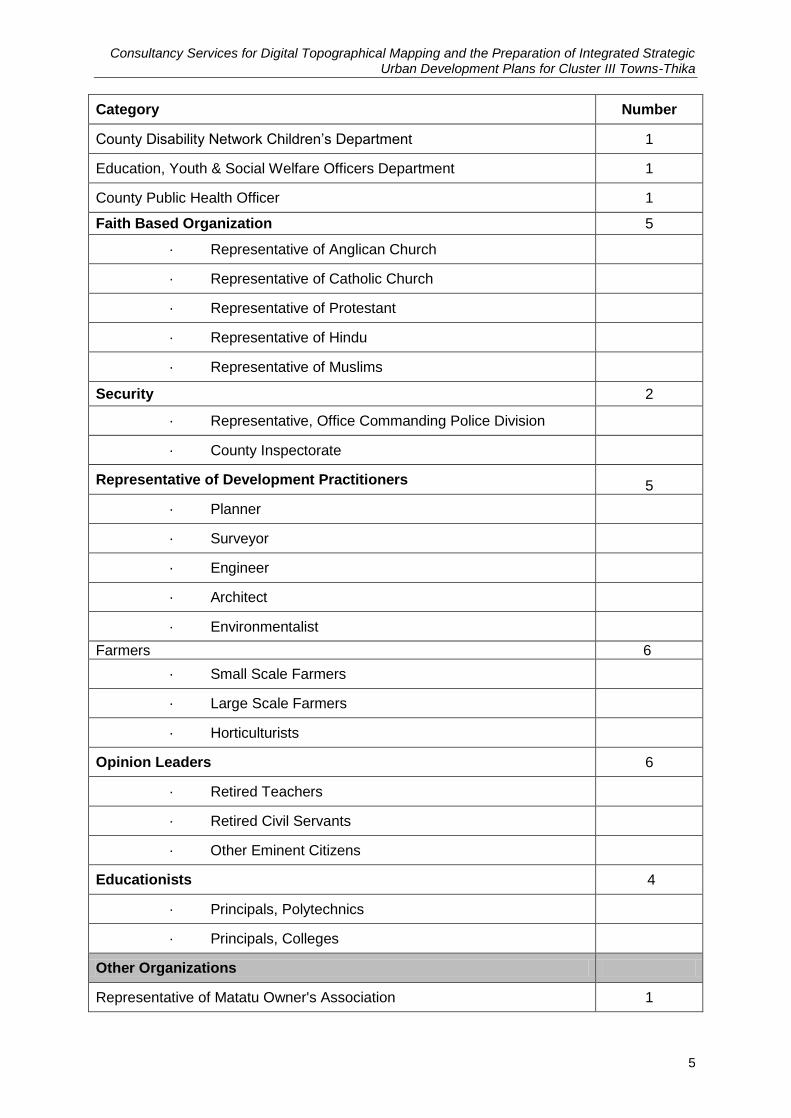
Consultancy Services for Digital Topographical Mapping and the Preparation of Integrated Strategic Urban Development Plans for Cluster III Towns-Thika
5
Category Number
County Disability Network Children‟s Department 1
Education, Youth & Social Welfare Officers Department 1
County Public Health Officer 1
Faith Based Organization 5
· Representative of Anglican Church
· Representative of Catholic Church
· Representative of Protestant
· Representative of Hindu
· Representative of Muslims
Security 2
· Representative, Office Commanding Police Division
· County Inspectorate
Representative of Development Practitioners 5
· Planner
· Surveyor
· Engineer
· Architect
· Environmentalist
Farmers 6
· Small Scale Farmers
· Large Scale Farmers
· Horticulturists
Opinion Leaders 6
· Retired Teachers
· Retired Civil Servants
· Other Eminent Citizens
Educationists 4
· Principals, Polytechnics
· Principals, Colleges
Other Organizations
Representative of Matatu Owner's Association 1
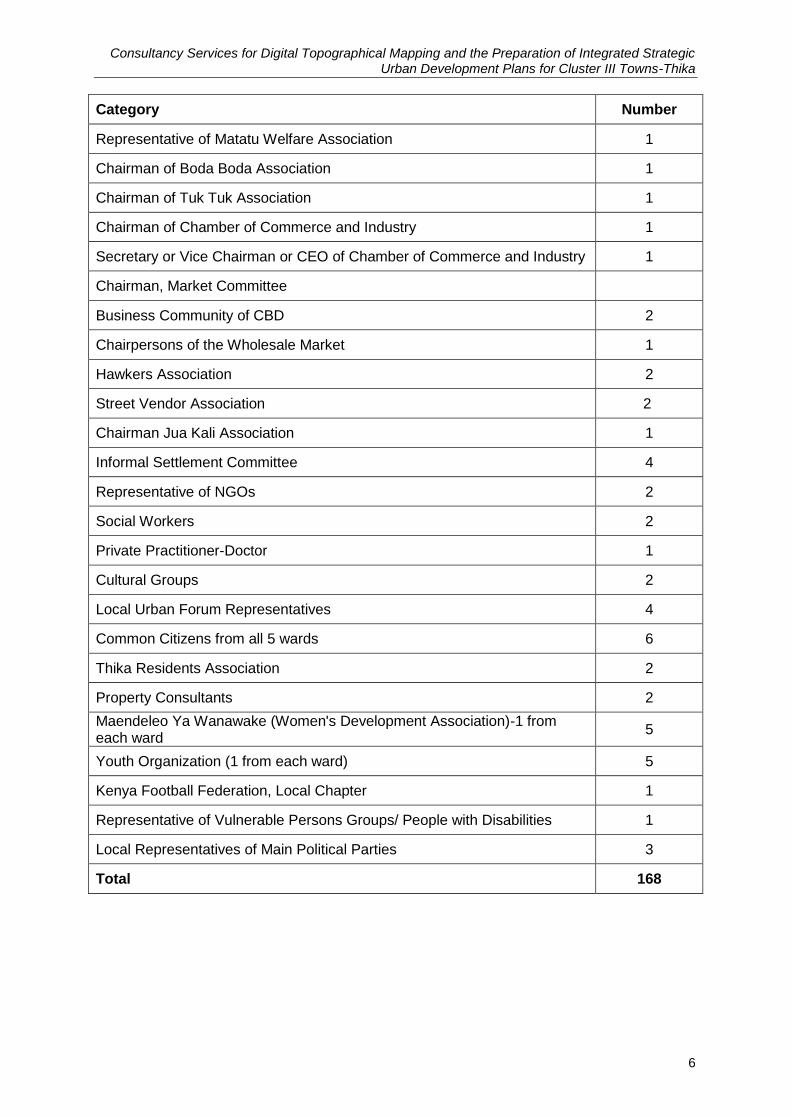
Consultancy Services for Digital Topographical Mapping and the Preparation of Integrated Strategic Urban Development Plans for Cluster III Towns-Thika
6
Category Number
Representative of Matatu Welfare Association 1
Chairman of Boda Boda Association 1
Chairman of Tuk Tuk Association 1
Chairman of Chamber of Commerce and Industry 1
Secretary or Vice Chairman or CEO of Chamber of Commerce and Industry 1
Chairman, Market Committee
Business Community of CBD 2
Chairpersons of the Wholesale Market 1
Hawkers Association 2
Street Vendor Association 2
Chairman Jua Kali Association 1
Informal Settlement Committee 4
Representative of NGOs 2
Social Workers 2
Private Practitioner-Doctor 1
Cultural Groups 2
Local Urban Forum Representatives 4
Common Citizens from all 5 wards 6
Thika Residents Association 2
Property Consultants 2
Maendeleo Ya Wanawake (Women's Development Association)-1 from each ward
5
Youth Organization (1 from each ward) 5
Kenya Football Federation, Local Chapter 1
Representative of Vulnerable Persons Groups/ People with Disabilities 1
Local Representatives of Main Political Parties 3
Total 168
Consultancy Services for Digital Topographical Mapping and the Preparation of Integrated Strategic Urban Development Plans for Cluster III Towns-Thika
7
Annexure 3
Stakeholder Consultations
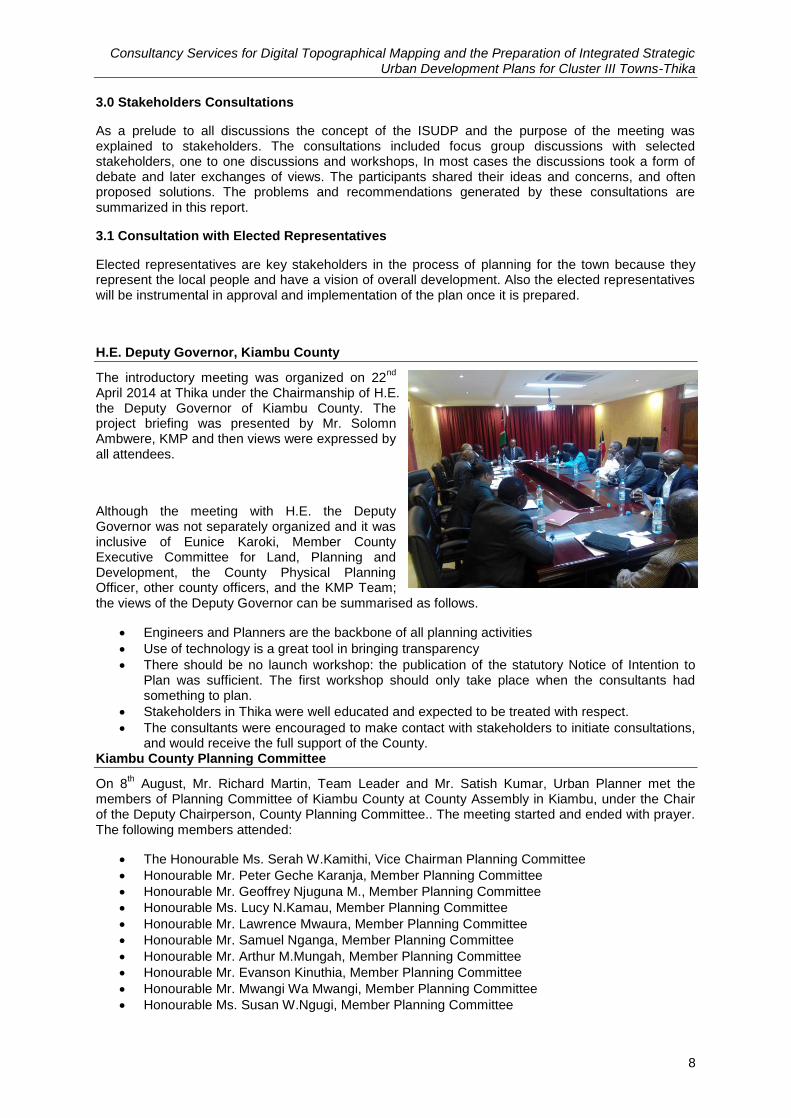
Consultancy Services for Digital Topographical Mapping and the Preparation of Integrated Strategic Urban Development Plans for Cluster III Towns-Thika
8
3.0 Stakeholders Consultations
As a prelude to all discussions the concept of the ISUDP and the purpose of the meeting was explained to stakeholders. The consultations included focus group discussions with selected stakeholders, one to one discussions and workshops, In most cases the discussions took a form of debate and later exchanges of views. The participants shared their ideas and concerns, and often proposed solutions. The problems and recommendations generated by these consultations are summarized in this report.
3.1 Consultation with Elected Representatives
Elected representatives are key stakeholders in the process of planning for the town because they represent the local people and have a vision of overall development. Also the elected representatives will be instrumental in approval and implementation of the plan once it is prepared.
H.E. Deputy Governor, Kiambu County
The introductory meeting was organized on 22nd
April 2014 at Thika under the Chairmanship of H.E. the Deputy Governor of Kiambu County. The project briefing was presented by Mr. Solomn Ambwere, KMP and then views were expressed by all attendees.
Although the meeting with H.E. the Deputy Governor was not separately organized and it was inclusive of Eunice Karoki, Member County Executive Committee for Land, Planning and Development, the County Physical Planning Officer, other county officers, and the KMP Team; the views of the Deputy Governor can be summarised as follows.
Engineers and Planners are the backbone of all planning activities
Use of technology is a great tool in bringing transparency
There should be no launch workshop: the publication of the statutory Notice of Intention to Plan was sufficient. The first workshop should only take place when the consultants had something to plan.
Stakeholders in Thika were well educated and expected to be treated with respect.
The consultants were encouraged to make contact with stakeholders to initiate consultations, and would receive the full support of the County.
Kiambu County Planning Committee
On 8th August, Mr. Richard Martin, Team Leader and Mr. Satish Kumar, Urban Planner met the
members of Planning Committee of Kiambu County at County Assembly in Kiambu, under the Chair of the Deputy Chairperson, County Planning Committee.. The meeting started and ended with prayer. The following members attended:
The Honourable Ms. Serah W.Kamithi, Vice Chairman Planning Committee
Honourable Mr. Peter Geche Karanja, Member Planning Committee
Honourable Mr. Geoffrey Njuguna M., Member Planning Committee
Honourable Ms. Lucy N.Kamau, Member Planning Committee
Honourable Mr. Lawrence Mwaura, Member Planning Committee
Honourable Mr. Samuel Nganga, Member Planning Committee
Honourable Mr. Arthur M.Mungah, Member Planning Committee
Honourable Mr. Evanson Kinuthia, Member Planning Committee
Honourable Mr. Mwangi Wa Mwangi, Member Planning Committee
Honourable Ms. Susan W.Ngugi, Member Planning Committee
Consultancy Services for Digital Topographical Mapping and the Preparation of Integrated Strategic Urban Development Plans for Cluster III Towns-Thika
9
Honourable Ms. Susan Muriithi, Member Planning Committee
Mr. Martin explained the project to the honourable members of planning committee. The following issues/observations emerged out of the meetings:
Nearness to Nairobi is a big factor in the future development of Thika town
Thika is strategically located on a National Highway, which is boosting the development in the town
The future plan should include all infrastructure components
The planning should be done in an integrated manner and not in an isolated manner
Environmental concerns must be taken into consideration for the sustainable development of the town. There is lot of industrial waste in Thika which is damaging the environment.
Slums or informal settlement up-grading is being done under another World Bank funded project by the Kenya Informal Settlement Improvement Programme (KISIP)
Other towns in Kiambu County such as Kiambu, Ruiru, Limuru, Gatundu, Kikuyu, Lari, etc. should also have been considered for planning. Indeed Kiambu town should have been selected first for any plan because it is the headquarters of county
There is another project under the Nairobi Metropolitan Services Improvement Project under World Bank funded programme for the Kiambu County Area which will include all the urban centres of the county. The title of project is „Preparation of Integrated Strategic Development Plan for Murang‟a and Kiambu Counties within the Nairobi Metropolitan Region‟
There are traffic jams in the town due to the fast growth of town and junctions at the entry and exit of the town should have adequate capacity
The stadium which is within the heart of the town should be relocated outside and the its area can be utilized for commercial use
The building heights in the town should be uniform to maintain the uniform skyline and this regulation must be enforced properly
The government should construct houses for the working population of the town
All the government offices must be relocated from the core town area to the periphery of the town. The space can be better utilized for commercial or community facilities
All the roundabouts should be landscaped properly to showcase the good image of the town
Undeveloped land is included within the planning boundary but it can be used to accommodate the future population of the town
Land grabbing must be stopped
It will be advisable to include some representation from all sub-counties for any town level workshop and because the expanses of development of Thika town shall be borne by whole county and not only by the people of Thika town.
Since the whole County is represented through the MCAs there is no need to involve other representatives of sub-counties in the stakeholder workshop. It will create more confusion
Thika town is full of educational institutes
Sewerage and water supply are the major infrastructure requirements for any kind of development
The final planning document will be submitted to the county assembly for approval and all members of the county assembly will play a constructive role in the process
3.2 Consultation with Government Officials
The government officials are key stakeholders in the process of preparing plans for the town because they have experience in executing a wide variety of government projects. Therefore, these consultations are helpful in understanding the existing status of projects and problems faced in implementation. Some of the government officials like the Chief Officer, the County Physical Planner, the County Public Health Officer, etc. were consulted on a one-to-one basis. The outcome of these consultations is presented below:
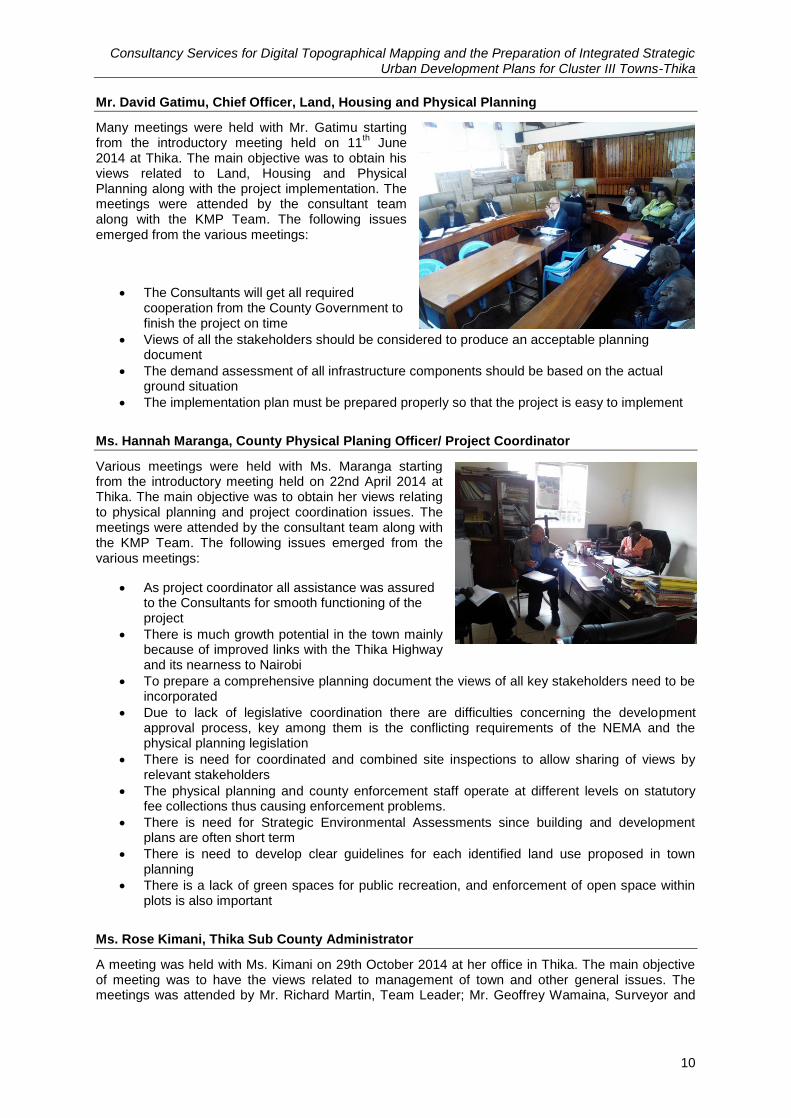
Consultancy Services for Digital Topographical Mapping and the Preparation of Integrated Strategic Urban Development Plans for Cluster III Towns-Thika
10
Mr. David Gatimu, Chief Officer, Land, Housing and Physical Planning
Many meetings were held with Mr. Gatimu starting from the introductory meeting held on 11
th June
2014 at Thika. The main objective was to obtain his views related to Land, Housing and Physical Planning along with the project implementation. The meetings were attended by the consultant team along with the KMP Team. The following issues emerged from the various meetings:
The Consultants will get all required cooperation from the County Government to finish the project on time
Views of all the stakeholders should be considered to produce an acceptable planning document
The demand assessment of all infrastructure components should be based on the actual ground situation
The implementation plan must be prepared properly so that the project is easy to implement
Ms. Hannah Maranga, County Physical Planing Officer/ Project Coordinator
Various meetings were held with Ms. Maranga starting from the introductory meeting held on 22nd April 2014 at Thika. The main objective was to obtain her views relating to physical planning and project coordination issues. The meetings were attended by the consultant team along with the KMP Team. The following issues emerged from the various meetings:
As project coordinator all assistance was assured to the Consultants for smooth functioning of the project
There is much growth potential in the town mainly because of improved links with the Thika Highway and its nearness to Nairobi
To prepare a comprehensive planning document the views of all key stakeholders need to be incorporated
Due to lack of legislative coordination there are difficulties concerning the development approval process, key among them is the conflicting requirements of the NEMA and the physical planning legislation
There is need for coordinated and combined site inspections to allow sharing of views by relevant stakeholders
The physical planning and county enforcement staff operate at different levels on statutory fee collections thus causing enforcement problems.
There is need for Strategic Environmental Assessments since building and development plans are often short term
There is need to develop clear guidelines for each identified land use proposed in town planning
There is a lack of green spaces for public recreation, and enforcement of open space within plots is also important
Ms. Rose Kimani, Thika Sub County Administrator
A meeting was held with Ms. Kimani on 29th October 2014 at her office in Thika. The main objective of meeting was to have the views related to management of town and other general issues. The meetings was attended by Mr. Richard Martin, Team Leader; Mr. Geoffrey Wamaina, Surveyor and
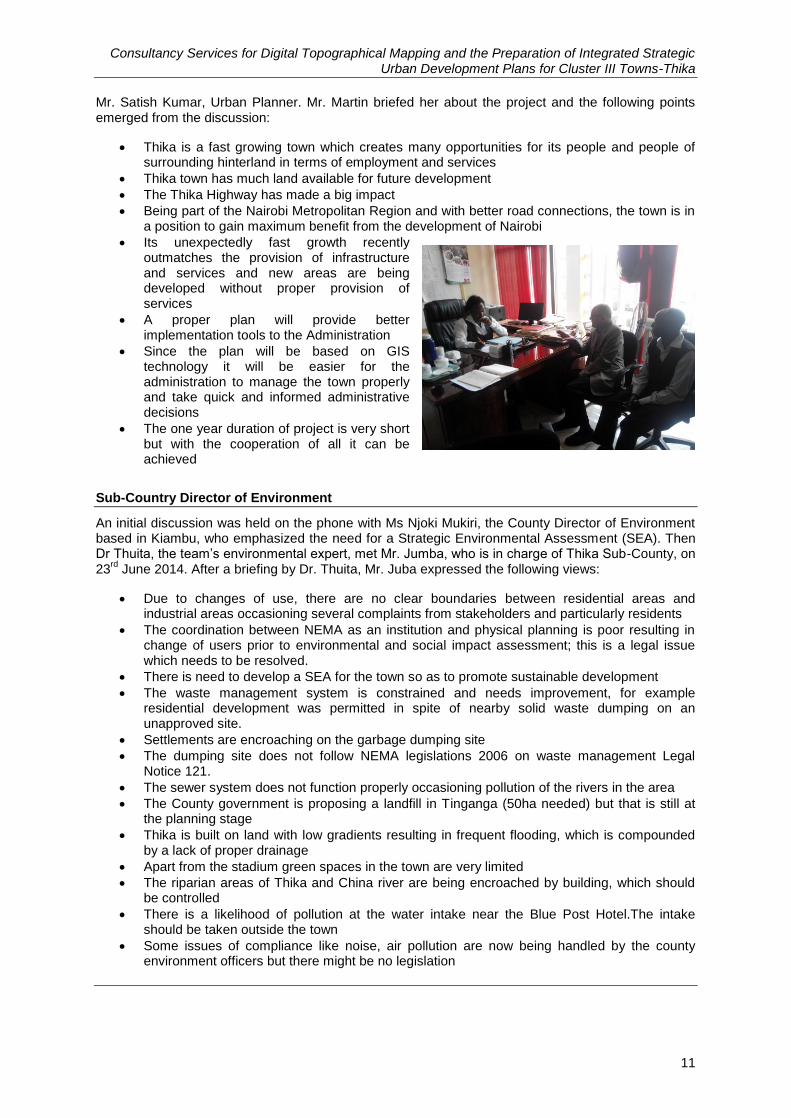
Consultancy Services for Digital Topographical Mapping and the Preparation of Integrated Strategic Urban Development Plans for Cluster III Towns-Thika
11
Mr. Satish Kumar, Urban Planner. Mr. Martin briefed her about the project and the following points emerged from the discussion:
Thika is a fast growing town which creates many opportunities for its people and people of surrounding hinterland in terms of employment and services
Thika town has much land available for future development
The Thika Highway has made a big impact
Being part of the Nairobi Metropolitan Region and with better road connections, the town is in a position to gain maximum benefit from the development of Nairobi
Its unexpectedly fast growth recently outmatches the provision of infrastructure and services and new areas are being developed without proper provision of services
A proper plan will provide better implementation tools to the Administration
Since the plan will be based on GIS technology it will be easier for the administration to manage the town properly and take quick and informed administrative decisions
The one year duration of project is very short but with the cooperation of all it can be achieved
Sub-Country Director of Environment
An initial discussion was held on the phone with Ms Njoki Mukiri, the County Director of Environment based in Kiambu, who emphasized the need for a Strategic Environmental Assessment (SEA). Then Dr Thuita, the team‟s environmental expert, met Mr. Jumba, who is in charge of Thika Sub-County, on 23
rd June 2014. After a briefing by Dr. Thuita, Mr. Juba expressed the following views:
Due to changes of use, there are no clear boundaries between residential areas and industrial areas occasioning several complaints from stakeholders and particularly residents
The coordination between NEMA as an institution and physical planning is poor resulting in change of users prior to environmental and social impact assessment; this is a legal issue which needs to be resolved.
There is need to develop a SEA for the town so as to promote sustainable development
The waste management system is constrained and needs improvement, for example residential development was permitted in spite of nearby solid waste dumping on an unapproved site.
Settlements are encroaching on the garbage dumping site
The dumping site does not follow NEMA legislations 2006 on waste management Legal Notice 121.
The sewer system does not function properly occasioning pollution of the rivers in the area
The County government is proposing a landfill in Tinganga (50ha needed) but that is still at the planning stage
Thika is built on land with low gradients resulting in frequent flooding, which is compounded by a lack of proper drainage
Apart from the stadium green spaces in the town are very limited
The riparian areas of Thika and China river are being encroached by building, which should be controlled
There is a likelihood of pollution at the water intake near the Blue Post Hotel.The intake should be taken outside the town
Some issues of compliance like noise, air pollution are now being handled by the county environment officers but there might be no legislation
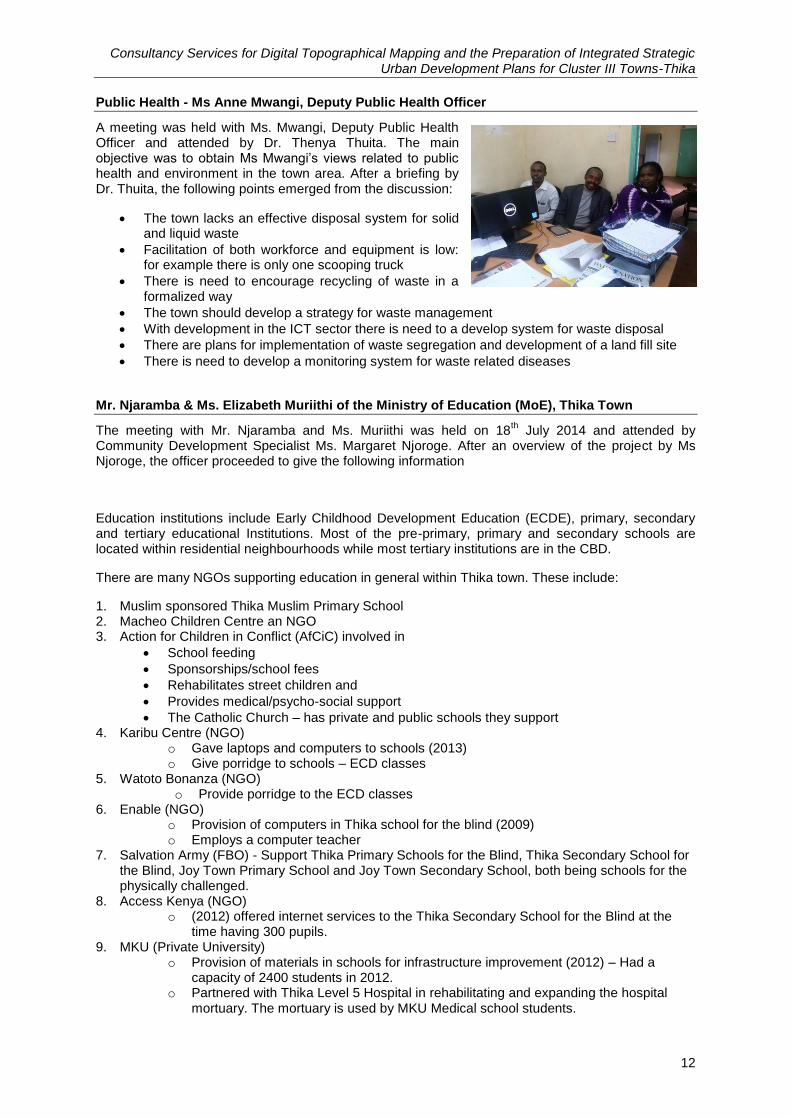
Consultancy Services for Digital Topographical Mapping and the Preparation of Integrated Strategic Urban Development Plans for Cluster III Towns-Thika
12
Public Health - Ms Anne Mwangi, Deputy Public Health Officer
A meeting was held with Ms. Mwangi, Deputy Public Health Officer and attended by Dr. Thenya Thuita. The main objective was to obtain Ms Mwangi‟s views related to public health and environment in the town area. After a briefing by Dr. Thuita, the following points emerged from the discussion:
The town lacks an effective disposal system for solid and liquid waste
Facilitation of both workforce and equipment is low: for example there is only one scooping truck
There is need to encourage recycling of waste in a formalized way
The town should develop a strategy for waste management
With development in the ICT sector there is need to a develop system for waste disposal
There are plans for implementation of waste segregation and development of a land fill site
There is need to develop a monitoring system for waste related diseases
Mr. Njaramba & Ms. Elizabeth Muriithi of the Ministry of Education (MoE), Thika Town
The meeting with Mr. Njaramba and Ms. Muriithi was held on 18th July 2014 and attended by
Community Development Specialist Ms. Margaret Njoroge. After an overview of the project by Ms Njoroge, the officer proceeded to give the following information
Education institutions include Early Childhood Development Education (ECDE), primary, secondary and tertiary educational Institutions. Most of the pre-primary, primary and secondary schools are located within residential neighbourhoods while most tertiary institutions are in the CBD.
There are many NGOs supporting education in general within Thika town. These include:
1. Muslim sponsored Thika Muslim Primary School 2. Macheo Children Centre an NGO 3. Action for Children in Conflict (AfCiC) involved in
School feeding
Sponsorships/school fees
Rehabilitates street children and
Provides medical/psycho-social support
The Catholic Church – has private and public schools they support 4. Karibu Centre (NGO)
o Gave laptops and computers to schools (2013) o Give porridge to schools – ECD classes
5. Watoto Bonanza (NGO) o Provide porridge to the ECD classes
6. Enable (NGO) o Provision of computers in Thika school for the blind (2009) o Employs a computer teacher
7. Salvation Army (FBO) - Support Thika Primary Schools for the Blind, Thika Secondary School for the Blind, Joy Town Primary School and Joy Town Secondary School, both being schools for the physically challenged.
8. Access Kenya (NGO) o (2012) offered internet services to the Thika Secondary School for the Blind at the
time having 300 pupils. 9. MKU (Private University)
o Provision of materials in schools for infrastructure improvement (2012) – Had a capacity of 2400 students in 2012.
o Partnered with Thika Level 5 Hospital in rehabilitating and expanding the hospital mortuary. The mortuary is used by MKU Medical school students.
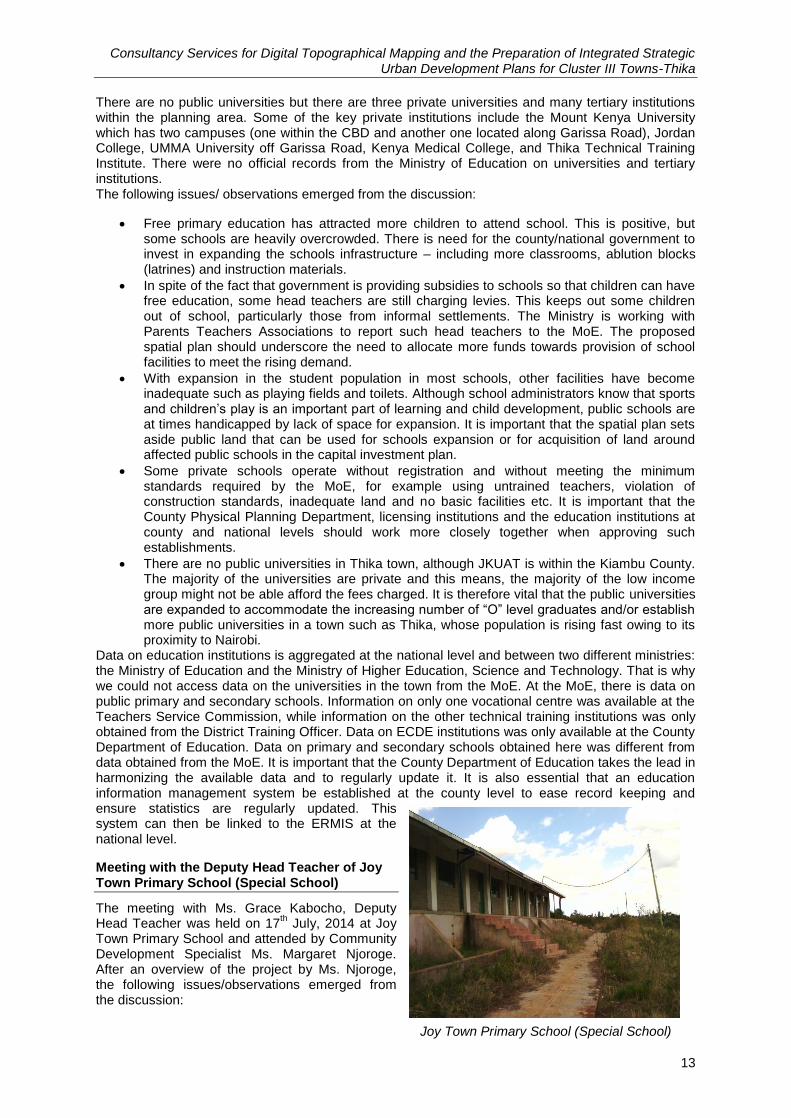
Consultancy Services for Digital Topographical Mapping and the Preparation of Integrated Strategic Urban Development Plans for Cluster III Towns-Thika
13
There are no public universities but there are three private universities and many tertiary institutions within the planning area. Some of the key private institutions include the Mount Kenya University which has two campuses (one within the CBD and another one located along Garissa Road), Jordan College, UMMA University off Garissa Road, Kenya Medical College, and Thika Technical Training Institute. There were no official records from the Ministry of Education on universities and tertiary institutions. The following issues/ observations emerged from the discussion:
Free primary education has attracted more children to attend school. This is positive, but some schools are heavily overcrowded. There is need for the county/national government to invest in expanding the schools infrastructure – including more classrooms, ablution blocks (latrines) and instruction materials.
In spite of the fact that government is providing subsidies to schools so that children can have free education, some head teachers are still charging levies. This keeps out some children out of school, particularly those from informal settlements. The Ministry is working with Parents Teachers Associations to report such head teachers to the MoE. The proposed spatial plan should underscore the need to allocate more funds towards provision of school facilities to meet the rising demand.
With expansion in the student population in most schools, other facilities have become inadequate such as playing fields and toilets. Although school administrators know that sports and children‟s play is an important part of learning and child development, public schools are at times handicapped by lack of space for expansion. It is important that the spatial plan sets aside public land that can be used for schools expansion or for acquisition of land around affected public schools in the capital investment plan.
Some private schools operate without registration and without meeting the minimum standards required by the MoE, for example using untrained teachers, violation of construction standards, inadequate land and no basic facilities etc. It is important that the County Physical Planning Department, licensing institutions and the education institutions at county and national levels should work more closely together when approving such establishments.
There are no public universities in Thika town, although JKUAT is within the Kiambu County. The majority of the universities are private and this means, the majority of the low income group might not be able afford the fees charged. It is therefore vital that the public universities are expanded to accommodate the increasing number of “O” level graduates and/or establish more public universities in a town such as Thika, whose population is rising fast owing to its proximity to Nairobi.
Data on education institutions is aggregated at the national level and between two different ministries: the Ministry of Education and the Ministry of Higher Education, Science and Technology. That is why we could not access data on the universities in the town from the MoE. At the MoE, there is data on public primary and secondary schools. Information on only one vocational centre was available at the Teachers Service Commission, while information on the other technical training institutions was only obtained from the District Training Officer. Data on ECDE institutions was only available at the County Department of Education. Data on primary and secondary schools obtained here was different from data obtained from the MoE. It is important that the County Department of Education takes the lead in harmonizing the available data and to regularly update it. It is also essential that an education information management system be established at the county level to ease record keeping and ensure statistics are regularly updated. This system can then be linked to the ERMIS at the national level.
Meeting with the Deputy Head Teacher of Joy Town Primary School (Special School)
The meeting with Ms. Grace Kabocho, Deputy Head Teacher was held on 17
th July, 2014 at Joy
Town Primary School and attended by Community Development Specialist Ms. Margaret Njoroge. After an overview of the project by Ms. Njoroge, the following issues/observations emerged from the discussion:
Joy Town Primary School (Special School)
Consultancy Services for Digital Topographical Mapping and the Preparation of Integrated Strategic Urban Development Plans for Cluster III Towns-Thika
14
As far as funding sources for the special schools are concerned, Bethany Kids International is the second largest supporter of special schools after the Salvation Army. Recently they constructed modified bathrooms for children with special needs particularly those suffering from paralysis of lower limbs; laundry machines; a computer laboratory that enables children who cannot write to use computers with improvised tools; physiotherapy and occupational therapy facilities among others. The national government provides teachers, while the CDF has supported construction of a borehole, solar panels for pumping water from the borehole, put up a greenhouse and sunk a fish pond at the Joy Town Special School; Action Aid has provided water tanks along the paths, and the Hindu Community and the Lilian Foundation offer sponsorships and psycho-social support.
Special schools have children with special needs. They therefore require facilities that are different and often more advanced and expensive from normal schools. Most paths lack lighting because the cost of electricity is quite high. It would be more efficient to use solar power and only use electricity and a generator to provide alternative lighting when need be.
Currently, pupils use lanterns and torches. However, carrying these items while moving on a wheel chair is often a major problem for the physically challenged. Some cannot even manage to carry lanterns and have to be escorted by other students or hired hands. Some pupils suffer from conditions that require use of hot water for bathing but the school administration cannot afford the cost of heating water with electricity. A request has been put forward to the County Government to provide a generator and solar power that can meet the power requirements of this institution. The only solar power available is only enough to pump water from the borehole.
The playing field is small and inadequate; additional space would enable the children have enough area to play which is particularly necessary because wheel chairs occupy more space. The institution currently uses the Joy Town Secondary School field for its sports and at times there is conflict of use.
Being a national school, it admits pupils from the whole country but space and facilities are limited so the school can often only take 25% of the total applicants. If more facilities could be provided, the school would offer more support to these needy children.
Around 90% of pupils use wheel chairs yet there are staircases, narrow, steep and bumpy paths that make it difficult for them to move around unattended particularly because there are young ones starting from ECD and lower primary; and some with multiple challenges (i.e. mental and physical). Aiding them means more manpower and hence cost. Investment in widening and regularly maintaining the paths/roads, levelling the grounds and constructing balconies in the remaining buildings to shield pupils from rain and hot sun are basic necessities for this children.
More ICT facilities (computers with improvised parts) and internet would enhance learning and training by the teachers and would greatly enhance the children‟s to learn. Some children cannot use their limbs and fingers (or have none) to type on a computer keyboard. Improvised keyboards make it possible for those without fingers or who cannot hold a pen to type notes using their toes or their mouths during classes.
Facilities such as toilets, bathrooms and sinks are designed for children who have no disability. Toilets with bars to hold onto, wide doors to allow wheel chair movement, low water tanks and low dustbins along the paths would all ease access and movement, and minimize the need for assistance and related costs.
The road to the two Joy Town schools needs rehabilitation to enable students to move with their wheel chairs easily and more comfortably. Currently movement by pupils is an uphill task.
Neither the Ministry of Education nor the County Department of Education had data on private institutions (primary and secondary schools, tertiary and universities:
The Education management institutions are greatly fragmented and so is the data. Education statistics was found in three offices – TSC (TTI), MoE-Primary and Secondary public, County Education Department – Early Childhood Development.
Overall, these challenges seemed to affect the secondary school as well and can therefore be taken to represent the other 3 special schools in Thika town. The county government needs to invest more resources to enhance learning facilities and the environment for children with special
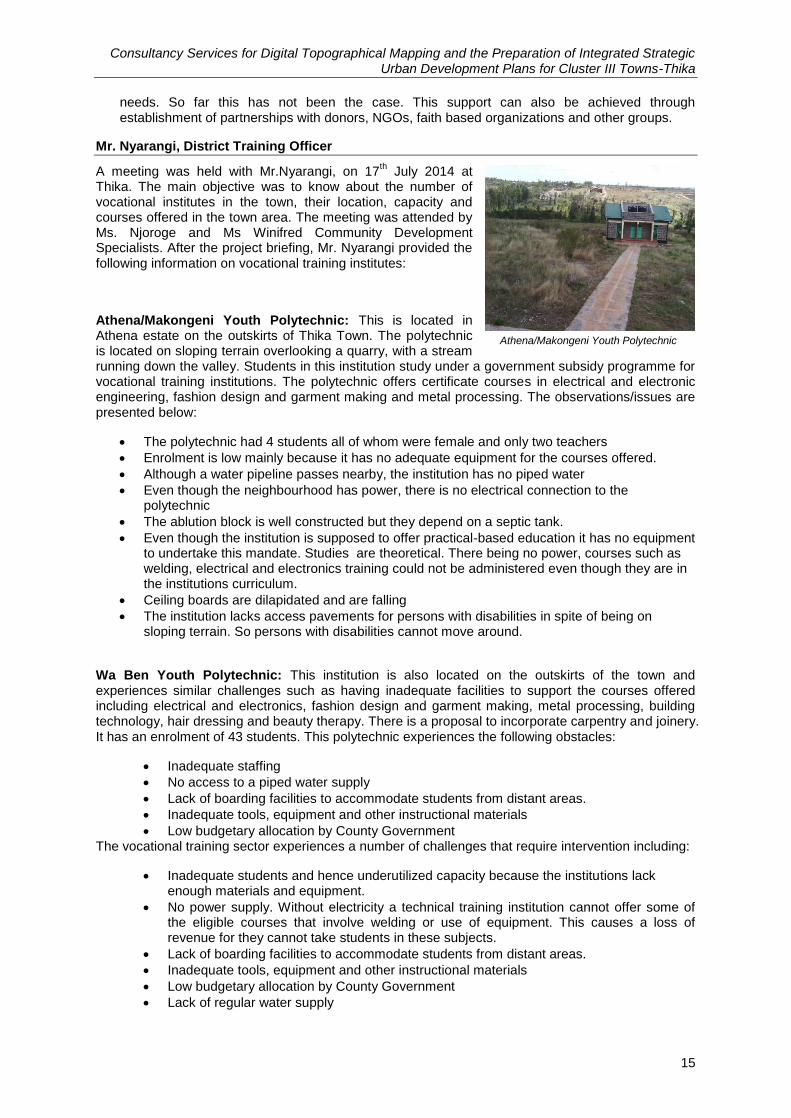
Consultancy Services for Digital Topographical Mapping and the Preparation of Integrated Strategic Urban Development Plans for Cluster III Towns-Thika
15
needs. So far this has not been the case. This support can also be achieved through establishment of partnerships with donors, NGOs, faith based organizations and other groups.
Mr. Nyarangi, District Training Officer
A meeting was held with Mr.Nyarangi, on 17th July 2014 at
Thika. The main objective was to know about the number of vocational institutes in the town, their location, capacity and courses offered in the town area. The meeting was attended by Ms. Njoroge and Ms Winifred Community Development Specialists. After the project briefing, Mr. Nyarangi provided the following information on vocational training institutes:
Athena/Makongeni Youth Polytechnic: This is located in Athena estate on the outskirts of Thika Town. The polytechnic is located on sloping terrain overlooking a quarry, with a stream running down the valley. Students in this institution study under a government subsidy programme for vocational training institutions. The polytechnic offers certificate courses in electrical and electronic engineering, fashion design and garment making and metal processing. The observations/issues are presented below:
The polytechnic had 4 students all of whom were female and only two teachers
Enrolment is low mainly because it has no adequate equipment for the courses offered.
Although a water pipeline passes nearby, the institution has no piped water
Even though the neighbourhood has power, there is no electrical connection to the polytechnic
The ablution block is well constructed but they depend on a septic tank.
Even though the institution is supposed to offer practical-based education it has no equipment to undertake this mandate. Studies are theoretical. There being no power, courses such as welding, electrical and electronics training could not be administered even though they are in the institutions curriculum.
Ceiling boards are dilapidated and are falling
The institution lacks access pavements for persons with disabilities in spite of being on sloping terrain. So persons with disabilities cannot move around.
Wa Ben Youth Polytechnic: This institution is also located on the outskirts of the town and experiences similar challenges such as having inadequate facilities to support the courses offered including electrical and electronics, fashion design and garment making, metal processing, building technology, hair dressing and beauty therapy. There is a proposal to incorporate carpentry and joinery. It has an enrolment of 43 students. This polytechnic experiences the following obstacles:
Inadequate staffing
No access to a piped water supply
Lack of boarding facilities to accommodate students from distant areas.
Inadequate tools, equipment and other instructional materials
Low budgetary allocation by County Government The vocational training sector experiences a number of challenges that require intervention including:
Inadequate students and hence underutilized capacity because the institutions lack enough materials and equipment.
No power supply. Without electricity a technical training institution cannot offer some of the eligible courses that involve welding or use of equipment. This causes a loss of revenue for they cannot take students in these subjects.
Lack of boarding facilities to accommodate students from distant areas.
Inadequate tools, equipment and other instructional materials
Low budgetary allocation by County Government
Lack of regular water supply
Athena/Makongeni Youth Polytechnic
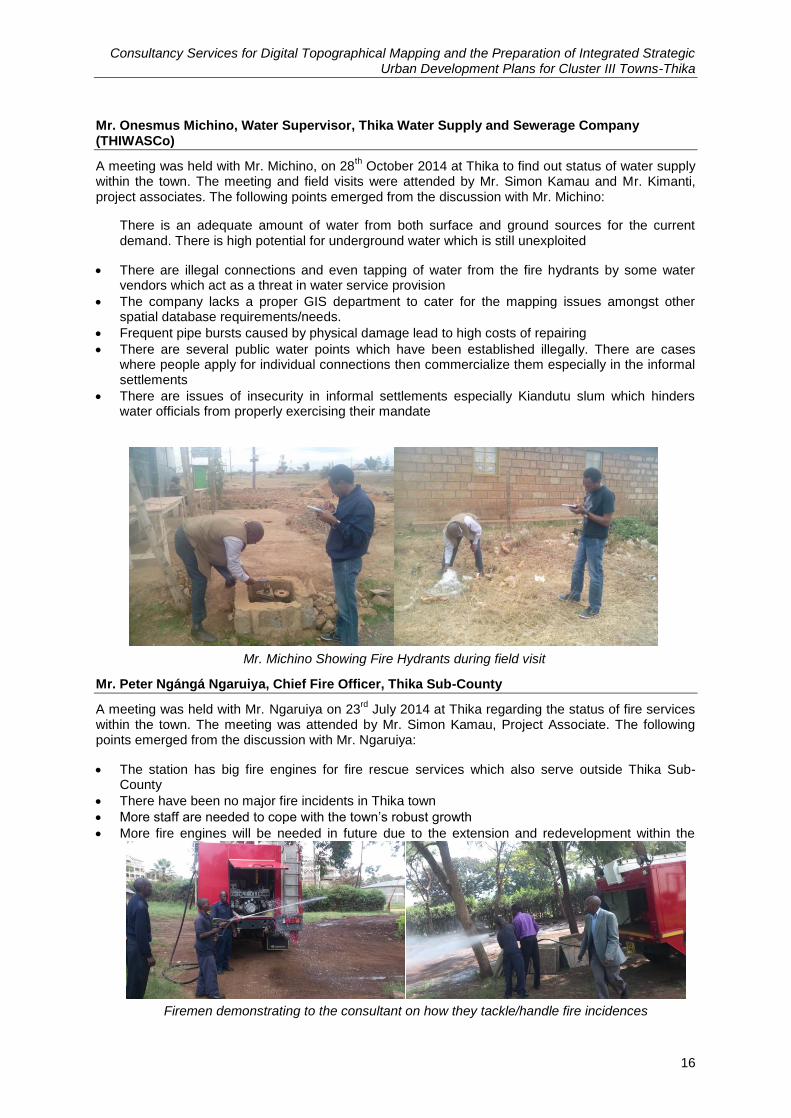
Consultancy Services for Digital Topographical Mapping and the Preparation of Integrated Strategic Urban Development Plans for Cluster III Towns-Thika
16
Mr. Onesmus Michino, Water Supervisor, Thika Water Supply and Sewerage Company (THIWASCo)
A meeting was held with Mr. Michino, on 28th October 2014 at Thika to find out status of water supply
within the town. The meeting and field visits were attended by Mr. Simon Kamau and Mr. Kimanti, project associates. The following points emerged from the discussion with Mr. Michino:
There is an adequate amount of water from both surface and ground sources for the current demand. There is high potential for underground water which is still unexploited
There are illegal connections and even tapping of water from the fire hydrants by some water vendors which act as a threat in water service provision
The company lacks a proper GIS department to cater for the mapping issues amongst other spatial database requirements/needs.
Frequent pipe bursts caused by physical damage lead to high costs of repairing
There are several public water points which have been established illegally. There are cases where people apply for individual connections then commercialize them especially in the informal settlements
There are issues of insecurity in informal settlements especially Kiandutu slum which hinders water officials from properly exercising their mandate
Mr. Peter Ngángá Ngaruiya, Chief Fire Officer, Thika Sub-County
A meeting was held with Mr. Ngaruiya on 23rd
July 2014 at Thika regarding the status of fire services within the town. The meeting was attended by Mr. Simon Kamau, Project Associate. The following points emerged from the discussion with Mr. Ngaruiya:
The station has big fire engines for fire rescue services which also serve outside Thika Sub-County
There have been no major fire incidents in Thika town
More staff are needed to cope with the town‟s robust growth
More fire engines will be needed in future due to the extension and redevelopment within the
Firemen demonstrating to the consultant on how they tackle/handle fire incidences
Mr. Michino Showing Fire Hydrants during field visit
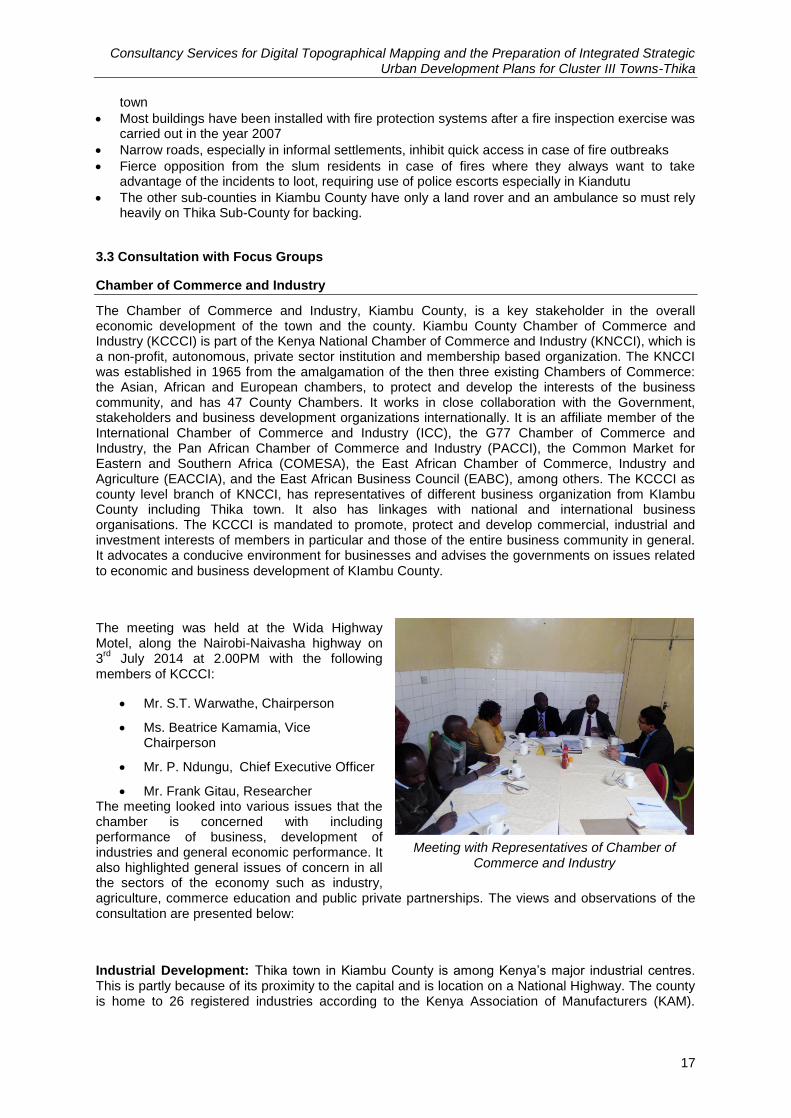
Consultancy Services for Digital Topographical Mapping and the Preparation of Integrated Strategic Urban Development Plans for Cluster III Towns-Thika
17
town
Most buildings have been installed with fire protection systems after a fire inspection exercise was carried out in the year 2007
Narrow roads, especially in informal settlements, inhibit quick access in case of fire outbreaks
Fierce opposition from the slum residents in case of fires where they always want to take advantage of the incidents to loot, requiring use of police escorts especially in Kiandutu
The other sub-counties in Kiambu County have only a land rover and an ambulance so must rely heavily on Thika Sub-County for backing.
3.3 Consultation with Focus Groups
Chamber of Commerce and Industry
The Chamber of Commerce and Industry, Kiambu County, is a key stakeholder in the overall economic development of the town and the county. Kiambu County Chamber of Commerce and Industry (KCCCI) is part of the Kenya National Chamber of Commerce and Industry (KNCCI), which is a non-profit, autonomous, private sector institution and membership based organization. The KNCCI was established in 1965 from the amalgamation of the then three existing Chambers of Commerce: the Asian, African and European chambers, to protect and develop the interests of the business community, and has 47 County Chambers. It works in close collaboration with the Government, stakeholders and business development organizations internationally. It is an affiliate member of the International Chamber of Commerce and Industry (ICC), the G77 Chamber of Commerce and Industry, the Pan African Chamber of Commerce and Industry (PACCI), the Common Market for Eastern and Southern Africa (COMESA), the East African Chamber of Commerce, Industry and Agriculture (EACCIA), and the East African Business Council (EABC), among others. The KCCCI as county level branch of KNCCI, has representatives of different business organization from KIambu County including Thika town. It also has linkages with national and international business organisations. The KCCCI is mandated to promote, protect and develop commercial, industrial and investment interests of members in particular and those of the entire business community in general. It advocates a conducive environment for businesses and advises the governments on issues related to economic and business development of KIambu County.
The meeting was held at the Wida Highway Motel, along the Nairobi-Naivasha highway on 3
rd July 2014 at 2.00PM with the following
members of KCCCI:
Mr. S.T. Warwathe, Chairperson
Ms. Beatrice Kamamia, Vice Chairperson
Mr. P. Ndungu, Chief Executive Officer
Mr. Frank Gitau, Researcher The meeting looked into various issues that the chamber is concerned with including performance of business, development of industries and general economic performance. It also highlighted general issues of concern in all the sectors of the economy such as industry, agriculture, commerce education and public private partnerships. The views and observations of the consultation are presented below:
Industrial Development: Thika town in Kiambu County is among Kenya‟s major industrial centres. This is partly because of its proximity to the capital and is location on a National Highway. The county is home to 26 registered industries according to the Kenya Association of Manufacturers (KAM).
Meeting with Representatives of Chamber of Commerce and Industry
Consultancy Services for Digital Topographical Mapping and the Preparation of Integrated Strategic Urban Development Plans for Cluster III Towns-Thika
18
There are also many commercial establishments in the 147 trading centres in the wider county. However industries in the area have come with their own fair share of challenges. Some industries have not been observing environmental guidelines in their operations and gas pollution is a leading concern. Other industries have been releasing their effluent into the Thika and Chania rivers which is hazardous.
The location of some of these industries has also come under sharp scrutiny. For example Makongeni is next to a residential area and therefore leading to land use conflict. Young children from the nearby informal settlement are exposed to the dangers of industrial production which leads to complications.
There are also claims that one of the biggest companies in the area, Delmonte releases its waste through swamps and finally into the Chania river. The British American Tobacco factory is near the Madharau informal settlement, and is alleged to release untreated waste into the open environment. These are just a few examples of alleged industrial pollution in the town. Kiambu County was once the country‟s premier coffee producing region, but some coffee farms have been converted to industrial use.
The jua kali industry has grown in leaps and bounds in the town and needs special planning since it‟s one of the major contributors to the economy. In fact,Jua Kali products are among Thika‟s exports outside the country.
Currently, the county government of Kiambu has imposed a freeze on industrial development due to concerns on land issues.
Water, Sewerage and Waste Disposal: In some areas such as informal settlements the water is accessed through water vendors who sell to the residents. Sanitation is inadequate as evidenced in sections of the town. The installation of sanitation facilities has not been expanded over time to cater for the growing population. Sewerage is also a concern among the residents of the town with stretched facilities being in use to date. The old Thika sewer was recently closed as it was old and could not service the town. Thika‟s proximity to Nairobi means it‟s a dormitory for Nairobi. Waste disposal is not carried out under effective management leading to uncollected garbage in parts of the town. Thickets have also established themselves in sections of the CBD, and the lack of storm water drainage is a major hazard in some parts of the town.
Commerce: Thika‟s population has grown rapidly in recent past as a result of the town‟s distinction as a major industrial centre. As a result, a lot of in-migration has occurred. The town‟s major economic nodes revolve around industry, commerce and agriculture. The hinterland of the town forms a major source of raw materials for industrial processing.
Business is booming in the town due to the increased purchasing power of residents. Thika town has five functional markets. However, the earlier planners did not make adequate provision for the markets in relation to infrastructure and transport.
However, the long approvals procedure for new businesses is a major disincentive to investment. They advocate a single window processing system to ease the time and resources consumed.
However, they project economic growth for the town to improve steadily in future due to devolution and the establishment of the county government. However there is concern about the availability of counterfeit and the chamber reckons that at the current rate, the fake goods dealers in the black market can bring down the economy of the town. The counterfeit goods range from household usables such as cooking oil, alcohol and electronics.
Infrastructure (Roads and Electricity): The town is well connected with its hinterland and national urban centres. Notably the Thika Super Highway which connects to the capital city and other urban centres. However, there is chaos and congestion in the town due to the inadequate and poorly managed transport system. The main stage of the town is located in the central business district of the town, which is not satisfactory. (Originally the site for the location of the facility was in Makongeni, some distance out of the CBD). The lack of street lighting is also a major concern in the town as it contributes to crimes such as mugging. Electricity supply is however adequate for most uses.
Construction Industry: The construction industry has experienced a boom in Thika due to the demand for housing and industrial units. However, the construction industry has developed at the
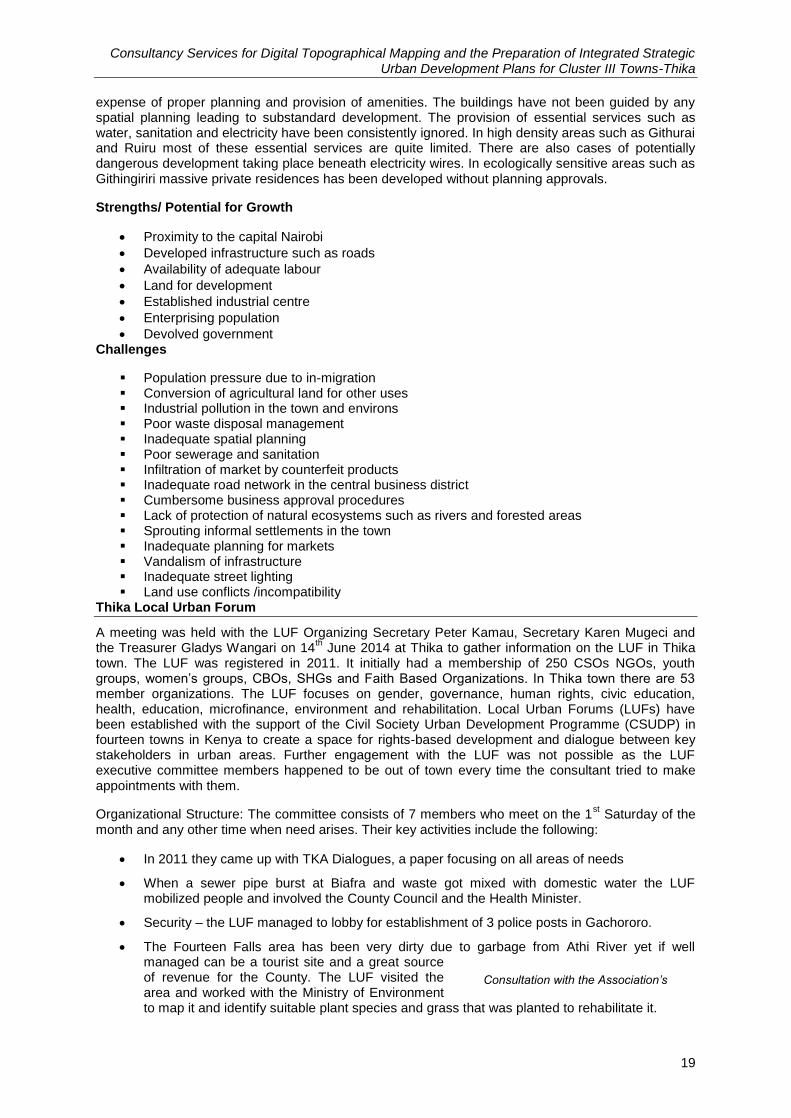
Consultancy Services for Digital Topographical Mapping and the Preparation of Integrated Strategic Urban Development Plans for Cluster III Towns-Thika
19
expense of proper planning and provision of amenities. The buildings have not been guided by any spatial planning leading to substandard development. The provision of essential services such as water, sanitation and electricity have been consistently ignored. In high density areas such as Githurai and Ruiru most of these essential services are quite limited. There are also cases of potentially dangerous development taking place beneath electricity wires. In ecologically sensitive areas such as Githingiriri massive private residences has been developed without planning approvals.
Strengths/ Potential for Growth
Proximity to the capital Nairobi
Developed infrastructure such as roads
Availability of adequate labour
Land for development
Established industrial centre
Enterprising population
Devolved government Challenges
Population pressure due to in-migration Conversion of agricultural land for other uses Industrial pollution in the town and environs Poor waste disposal management Inadequate spatial planning Poor sewerage and sanitation Infiltration of market by counterfeit products Inadequate road network in the central business district Cumbersome business approval procedures Lack of protection of natural ecosystems such as rivers and forested areas Sprouting informal settlements in the town Inadequate planning for markets Vandalism of infrastructure Inadequate street lighting Land use conflicts /incompatibility
Thika Local Urban Forum
A meeting was held with the LUF Organizing Secretary Peter Kamau, Secretary Karen Mugeci and the Treasurer Gladys Wangari on 14
th June 2014 at Thika to gather information on the LUF in Thika
town. The LUF was registered in 2011. It initially had a membership of 250 CSOs NGOs, youth groups, women‟s groups, CBOs, SHGs and Faith Based Organizations. In Thika town there are 53 member organizations. The LUF focuses on gender, governance, human rights, civic education, health, education, microfinance, environment and rehabilitation. Local Urban Forums (LUFs) have been established with the support of the Civil Society Urban Development Programme (CSUDP) in fourteen towns in Kenya to create a space for rights-based development and dialogue between key stakeholders in urban areas. Further engagement with the LUF was not possible as the LUF executive committee members happened to be out of town every time the consultant tried to make appointments with them.
Organizational Structure: The committee consists of 7 members who meet on the 1st Saturday of the
month and any other time when need arises. Their key activities include the following:
In 2011 they came up with TKA Dialogues, a paper focusing on all areas of needs
When a sewer pipe burst at Biafra and waste got mixed with domestic water the LUF mobilized people and involved the County Council and the Health Minister.
Security – the LUF managed to lobby for establishment of 3 police posts in Gachororo.
The Fourteen Falls area has been very dirty due to garbage from Athi River yet if well managed can be a tourist site and a great source of revenue for the County. The LUF visited the area and worked with the Ministry of Environment to map it and identify suitable plant species and grass that was planted to rehabilitate it.
Consultation with the Association’s Secretary
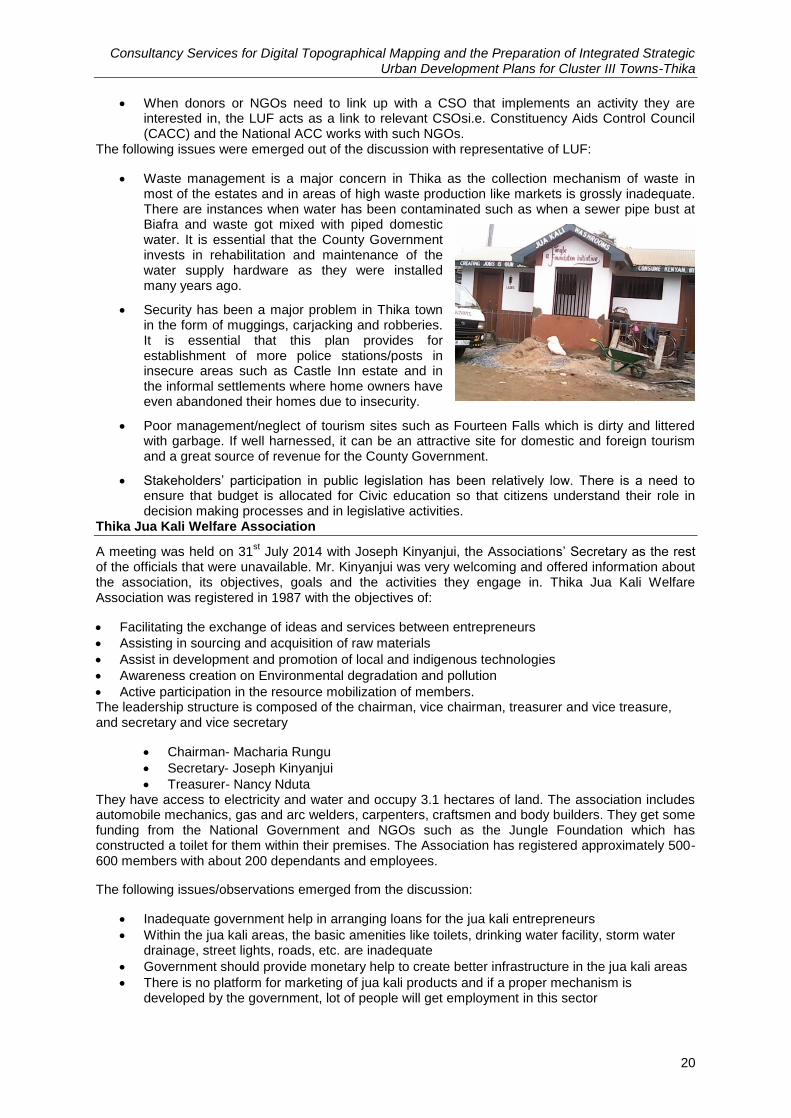
Consultancy Services for Digital Topographical Mapping and the Preparation of Integrated Strategic Urban Development Plans for Cluster III Towns-Thika
20
When donors or NGOs need to link up with a CSO that implements an activity they are interested in, the LUF acts as a link to relevant CSOsi.e. Constituency Aids Control Council (CACC) and the National ACC works with such NGOs.
The following issues were emerged out of the discussion with representative of LUF:
Waste management is a major concern in Thika as the collection mechanism of waste in most of the estates and in areas of high waste production like markets is grossly inadequate. There are instances when water has been contaminated such as when a sewer pipe bust at Biafra and waste got mixed with piped domestic water. It is essential that the County Government invests in rehabilitation and maintenance of the water supply hardware as they were installed many years ago.
Security has been a major problem in Thika town in the form of muggings, carjacking and robberies. It is essential that this plan provides for establishment of more police stations/posts in insecure areas such as Castle Inn estate and in the informal settlements where home owners have even abandoned their homes due to insecurity.
Poor management/neglect of tourism sites such as Fourteen Falls which is dirty and littered with garbage. If well harnessed, it can be an attractive site for domestic and foreign tourism and a great source of revenue for the County Government.
Stakeholders‟ participation in public legislation has been relatively low. There is a need to ensure that budget is allocated for Civic education so that citizens understand their role in decision making processes and in legislative activities.
Thika Jua Kali Welfare Association
A meeting was held on 31st July 2014 with Joseph Kinyanjui, the Associations‟ Secretary as the rest
of the officials that were unavailable. Mr. Kinyanjui was very welcoming and offered information about the association, its objectives, goals and the activities they engage in. Thika Jua Kali Welfare Association was registered in 1987 with the objectives of:
Facilitating the exchange of ideas and services between entrepreneurs
Assisting in sourcing and acquisition of raw materials
Assist in development and promotion of local and indigenous technologies
Awareness creation on Environmental degradation and pollution
Active participation in the resource mobilization of members. The leadership structure is composed of the chairman, vice chairman, treasurer and vice treasure, and secretary and vice secretary
Chairman- Macharia Rungu
Secretary- Joseph Kinyanjui
Treasurer- Nancy Nduta They have access to electricity and water and occupy 3.1 hectares of land. The association includes automobile mechanics, gas and arc welders, carpenters, craftsmen and body builders. They get some funding from the National Government and NGOs such as the Jungle Foundation which has constructed a toilet for them within their premises. The Association has registered approximately 500-600 members with about 200 dependants and employees.
The following issues/observations emerged from the discussion:
Inadequate government help in arranging loans for the jua kali entrepreneurs
Within the jua kali areas, the basic amenities like toilets, drinking water facility, storm water drainage, street lights, roads, etc. are inadequate
Government should provide monetary help to create better infrastructure in the jua kali areas
There is no platform for marketing of jua kali products and if a proper mechanism is developed by the government, lot of people will get employment in this sector
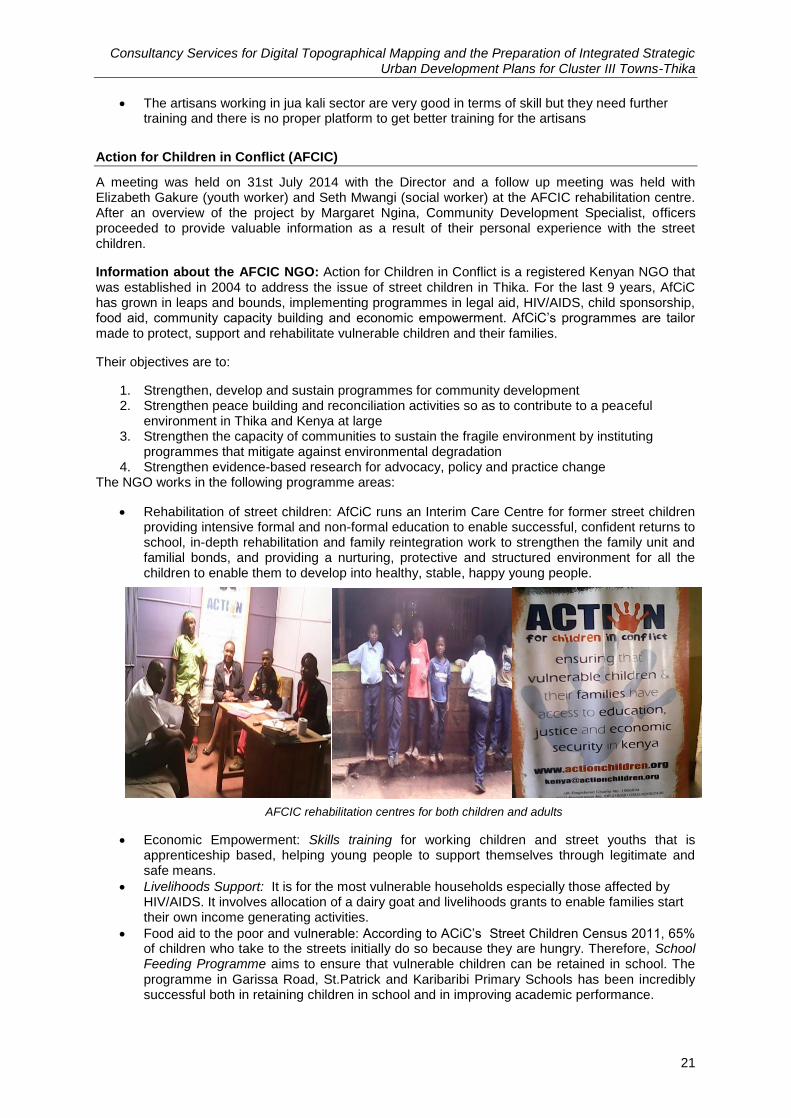
Consultancy Services for Digital Topographical Mapping and the Preparation of Integrated Strategic Urban Development Plans for Cluster III Towns-Thika
21
The artisans working in jua kali sector are very good in terms of skill but they need further training and there is no proper platform to get better training for the artisans
Action for Children in Conflict (AFCIC)
A meeting was held on 31st July 2014 with the Director and a follow up meeting was held with Elizabeth Gakure (youth worker) and Seth Mwangi (social worker) at the AFCIC rehabilitation centre. After an overview of the project by Margaret Ngina, Community Development Specialist, officers proceeded to provide valuable information as a result of their personal experience with the street children.
Information about the AFCIC NGO: Action for Children in Conflict is a registered Kenyan NGO that was established in 2004 to address the issue of street children in Thika. For the last 9 years, AfCiC has grown in leaps and bounds, implementing programmes in legal aid, HIV/AIDS, child sponsorship, food aid, community capacity building and economic empowerment. AfCiC‟s programmes are tailor made to protect, support and rehabilitate vulnerable children and their families.
Their objectives are to:
1. Strengthen, develop and sustain programmes for community development 2. Strengthen peace building and reconciliation activities so as to contribute to a peaceful
environment in Thika and Kenya at large 3. Strengthen the capacity of communities to sustain the fragile environment by instituting
programmes that mitigate against environmental degradation 4. Strengthen evidence-based research for advocacy, policy and practice change
The NGO works in the following programme areas:
Rehabilitation of street children: AfCiC runs an Interim Care Centre for former street children providing intensive formal and non-formal education to enable successful, confident returns to school, in-depth rehabilitation and family reintegration work to strengthen the family unit and familial bonds, and providing a nurturing, protective and structured environment for all the children to enable them to develop into healthy, stable, happy young people.
Economic Empowerment: Skills training for working children and street youths that is apprenticeship based, helping young people to support themselves through legitimate and safe means.
Livelihoods Support: It is for the most vulnerable households especially those affected by HIV/AIDS. It involves allocation of a dairy goat and livelihoods grants to enable families start their own income generating activities.
Food aid to the poor and vulnerable: According to ACiC‟s Street Children Census 2011, 65% of children who take to the streets initially do so because they are hungry. Therefore, School Feeding Programme aims to ensure that vulnerable children can be retained in school. The programme in Garissa Road, St.Patrick and Karibaribi Primary Schools has been incredibly successful both in retaining children in school and in improving academic performance.
AFCIC rehabilitation centres for both children and adults
Consultancy Services for Digital Topographical Mapping and the Preparation of Integrated Strategic Urban Development Plans for Cluster III Towns-Thika
22
Partnership with Schools: AfCiC runs advocacy clubs in primary schools, educating them on their rights and responsibilities and empowering them to be their own advocates. Teachers are also provided with specialised training on children‟s rights, parental rights and responsibilities and other human rights to improve teachers‟ abilities to respond effectively to the negation of basic rights, and to encourage children to speak out and act when their rights are negated.
Holiday Clubs at Heshima and Garissa Road Primary Schools in April, August and December and the clubs provide extra interest lessons, lunch and games/sports for approximately 800 children helping to keep them off the street and away from abuse and exploitation.
AfCiC makes use of Community Own Resource Persons (CORPS) and builds their capacity on child rights and child protection to ensure child protection and participation at the community level. Monthly CORPs meetings are conducted where feedback on the working children and children affected by HIV and AIDS is discussed with AfCiC staff.
AfCiC also partners with different government Ministries and agencies, supplementing and complementing diverse responsibilities carried out by each one of them. They include: District Children‟s Office, District Labour Office, District Education Office, District Commissioner, County Government, Charitable Children‟s Institutions (Legal Aid: Kenyan Children‟s Legal Aid Work (KCLAW), Community Workers, Ministry of Health and the police.
The following issues/observations emerged from the discussion with representatives of AFCIC:
AFCIC provides psycho-social and legal support to vulnerable children (those affected by HIV/Aids, whose parents are in prison and from poor families).
Public centres with proper staffing to provides psycho-social and legal support to vulnerable children (those affected by HIV/AIDS/whose parents are in prison and from poor families/informal settlements) should be established.
Most of the schools in the informal settlements are seriously short of instruction materials, desks, teachers and the classes are congested. The plan should highlight the need for government to allocate additional resources for such schools intervention because the parents are too poor to provide subsidiary support.
Establishment of public rehabilitation centres in Thika town is urgently required in order to rehabilitate the increasing number of youth engaged in substance abuse. The centres would provide counselling, psychiatric treatment services, and skills training to the large number of affected youth. Unfortunately private rehabilitation centres are very expensive and not many residents can afford them.
Consultations with Faith Based Organisations
St. Mulumba Catholic Church: A detailed consultative meeting was held on 3rd
August 2014with the St. Mulumba Catholic Church Priest. After a brief introduction by Ms. Njoroge, he proceeded to highlight the following:
The church has a registered SACCO that is open to any person that belongs to a registered group and provides up to three times of a members‟ savings as a loan at an interest rate of 1% per month. A member must be guaranteed by another member of the SACCO. Some of the groups in the market had benefited from the SACCO loans.
Other projects of FBO are:
St. Mulumba Primary School
St. Mulumba Mission Hospital which serves the citizens of Thika town. St. Patricks ACK Church: A meeting was held with Wilson Huruko, the Education Secretary of the St. Patricks ACK church in Thika on the 3
rd of August 2014 at the Education office. He highlighted the
major development objectives of the church as follows:
The Church ensures the spiritual growth of its members within the County. Its modern Cathedral hosts over 200 persons. They also ensure their church provides quality education, character moulding plus spiritual growth to the children.
Consultancy Services for Digital Topographical Mapping and the Preparation of Integrated Strategic Urban Development Plans for Cluster III Towns-Thika
23
It Supports education in the diocese and municipality. It supports 4 ECD schools. Other schools include Bishop Njuguna academy (600+ pupils) St Luke Makongani primary (300+ pupils) and St Peter‟s Kiganjo Primary (300+ pupils)
Offer administrative advice (instrumental in ensuring competitive leadership, the advice of church principals, counselling for the school fraternity plus parents).
The church is supporting 12 public primary schools and 10 secondary schools, all of which are outside Thika town. Within the town, they have a children‟s home at Kinganjo “NAMURATA SHAH”. They take care of orphans from 2 -20 years old and have a capacity of 30 children. They also provide education support for them all up to university by searching for sponsors for them.
The ACK Church is involved in the housing sector through a development in real estate. They have 3 flats accommodating over 200 people. (1-2 bedroom self-contained units)
The faith-based organizations are primarily involved in education and in community livelihood empowerment programmes. They have increasingly replaced charity work with business-oriented community programs that are supposed to empower communities into self-reliance.
Key issues to be considered in the physical development plan:
Thika is growing very fast (bursting population) compared to 1986 and as a result, changes in physical alignment of structures and road sizes are paramount.
The Super Highway has brought about both positive and negative impacts to the town. It is therefore necessary for the ISUDP to consider the impacts it will have and provide for mitigation measures as well as means of harnessing the positive impacts.
The highway has posed a big challenge to the adjacent areas through constrained access into the highway as there are no definite connecting roads to the estates plus the industry.
The bridge located at Blus Post Hotel is very outdated and small and should be considered for an upgrade.
The Thika - Garissa road entrance and exit from Thika town is constrained hence often resulting in traffic jams. The ISUDP should address the challenge to ensure sustainability.
There is traffic congestion due to the many educational institutes in town especially in the CBD. The MKU graduation literally halted the town‟s activities.
The roads are dilapidated with no recent upgrade. Contractors have even gone to the extent of using soil rather than murram to fill potholes in a tarmac road. Better road maintenance should be provided for.
The unsatisfactory garbage collection/waste management and disposal sites are a challenge to the council. The lorries have broken down which leaves the solid waste uncollected for more than a week making the estates unhygienic and environmentally unfriendly.
Infrastructure such as water and electricity should be expanded to cater for the current population as well as the projected one during the period which the ISUDP shall be operational.
Meeting held with MACHEO staff at their Children Home off Garissa Road
A detailed meeting was held on 18th July 2014 with two members of staff including the Programme
Officer at MACHEO Centre. The interview was conducted by Ms Margaret Njoroge, Community Development Specialist. MACHEO is an NGO supported by volunteers from the Netherlands located a little way after Landless Estate.
The NGO is engaged in the following programmes;
A Home for 56 children (28 boys, 28 girls) drawn mainly from Thika. Some are orphans and others are neglected children and are usually referred to them by the Children‟s Welfare Department or are identified from the informal settlements in Thika town by the NGO‟s social workers. The children are sponsored into private schools within Thika town such as St. Luke‟s ACK Primary in Makongeni, Bell House Prime Junior, Chania Primary, Glorious Fountain and Dr. Ngoima
Support to vulnerable children in 20 public primary schools, the majority being from the informal settlements. Such includes feeding programmes for lunch, porridge, sanitary towels for girls, de-wormers, psycho-social support, employs cooks in these schools drawn from
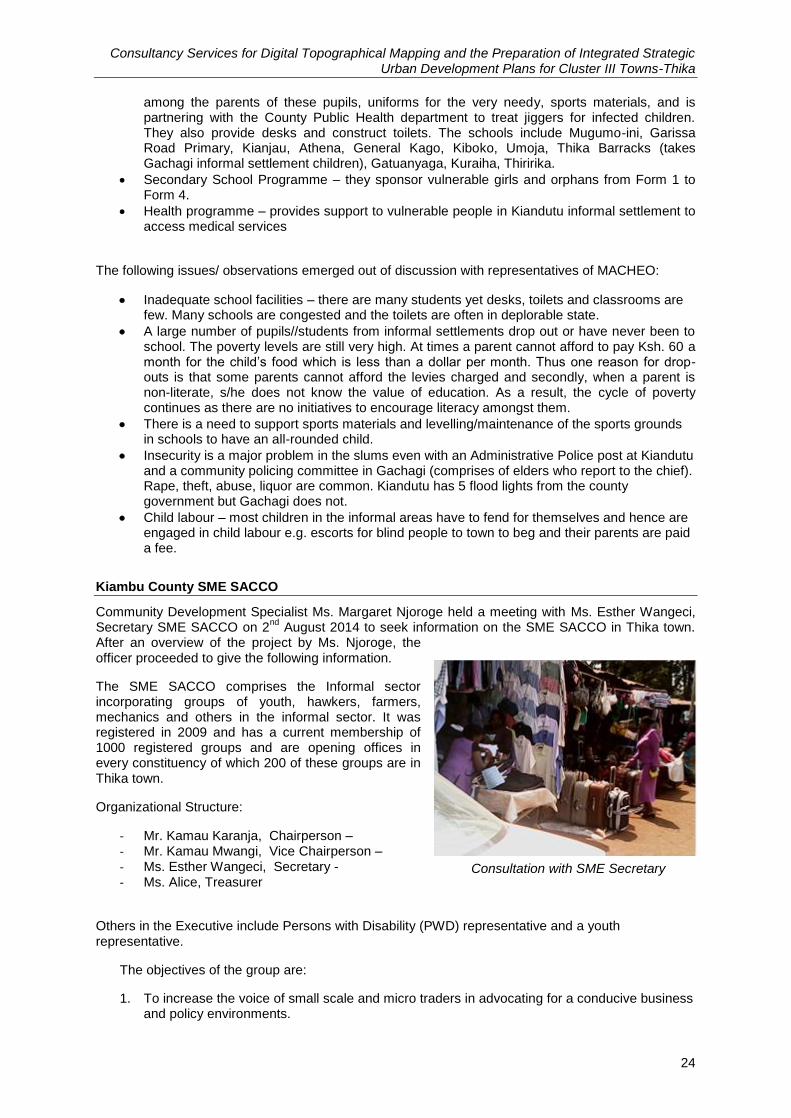
Consultancy Services for Digital Topographical Mapping and the Preparation of Integrated Strategic Urban Development Plans for Cluster III Towns-Thika
24
among the parents of these pupils, uniforms for the very needy, sports materials, and is partnering with the County Public Health department to treat jiggers for infected children. They also provide desks and construct toilets. The schools include Mugumo-ini, Garissa Road Primary, Kianjau, Athena, General Kago, Kiboko, Umoja, Thika Barracks (takes Gachagi informal settlement children), Gatuanyaga, Kuraiha, Thiririka.
Secondary School Programme – they sponsor vulnerable girls and orphans from Form 1 to Form 4.
Health programme – provides support to vulnerable people in Kiandutu informal settlement to access medical services
The following issues/ observations emerged out of discussion with representatives of MACHEO:
Inadequate school facilities – there are many students yet desks, toilets and classrooms are few. Many schools are congested and the toilets are often in deplorable state.
A large number of pupils//students from informal settlements drop out or have never been to school. The poverty levels are still very high. At times a parent cannot afford to pay Ksh. 60 a month for the child‟s food which is less than a dollar per month. Thus one reason for drop-outs is that some parents cannot afford the levies charged and secondly, when a parent is non-literate, s/he does not know the value of education. As a result, the cycle of poverty continues as there are no initiatives to encourage literacy amongst them.
There is a need to support sports materials and levelling/maintenance of the sports grounds in schools to have an all-rounded child.
Insecurity is a major problem in the slums even with an Administrative Police post at Kiandutu and a community policing committee in Gachagi (comprises of elders who report to the chief). Rape, theft, abuse, liquor are common. Kiandutu has 5 flood lights from the county government but Gachagi does not.
Child labour – most children in the informal areas have to fend for themselves and hence are engaged in child labour e.g. escorts for blind people to town to beg and their parents are paid a fee.
Kiambu County SME SACCO
Community Development Specialist Ms. Margaret Njoroge held a meeting with Ms. Esther Wangeci, Secretary SME SACCO on 2
nd August 2014 to seek information on the SME SACCO in Thika town.
After an overview of the project by Ms. Njoroge, the officer proceeded to give the following information.
The SME SACCO comprises the Informal sector incorporating groups of youth, hawkers, farmers, mechanics and others in the informal sector. It was registered in 2009 and has a current membership of 1000 registered groups and are opening offices in every constituency of which 200 of these groups are in Thika town.
Organizational Structure:
- Mr. Kamau Karanja, Chairperson – - Mr. Kamau Mwangi, Vice Chairperson – - Ms. Esther Wangeci, Secretary - - Ms. Alice, Treasurer
Others in the Executive include Persons with Disability (PWD) representative and a youth representative.
The objectives of the group are:
1. To increase the voice of small scale and micro traders in advocating for a conducive business and policy environments.
Consultation with SME Secretary
Consultancy Services for Digital Topographical Mapping and the Preparation of Integrated Strategic Urban Development Plans for Cluster III Towns-Thika
25
2. To increase members‟ ability to access more affordable financial and credit services for business expansion.
Some of the activities they are involved in include:
Organizing training and sensitization fora, to educate their members on the laws that affect them, the need to register as a SACCO or a self-help group for formal recognition.
Increase their voice while advocating for their rights
Ensure Uwezo fund and other loans from the government structures are channeled through the SACCo to ensure equity, increase accountability and transparency in allocation of loans/and in repayment of loans.
The following planning issues were highlighted during the discussion:
Failure by Government to allocate land for use by the informal sector whereas the public land has been allocated to private individuals and need to be recovered.
The Garage at Nanas was on public land but was later allocated to private developers while the mechanics were still there.
Toilets in public places (i.e. markets/garages) are allocated to individuals who charge for their use. The groups proposed that tendering be open to groups using these facilities because, this would benefit many people rather than an individual, they would protect and charge more affordable rates for most people to have access, rather than seek to make profits like the private managers do. This was the case in Machakos and it has been quite successful.
There are no water points in most of the informal market sites and this need to be provided for.
The informal market sheds are in deplorable condition and if formally allocated to individual traders they would take the initiative to improve them for aesthetics, durability, storage and security of goods. It is also important that while planning, provisions be made for wide pavements and ramps for ease of movement on wheel chairs. Staircases and narrow roads force PWDs to use the same roads in use by motor vehicles and this puts them at great risk of accidents.
For Persons with Disabilities to have easier access to public offices and public transport, there is need to construct user friendly transport infrastructure throughout the town like ramps, lifts, wide pedestrian path, etc. .
Enterprise funds such as Uwezo Fund (National Government Fund for Youth) have been reported difficult to access for most members particularly those in the informal sector. Corruption, favouritism, politics and other irregularities were reported to plague the application approval and financing process. The County Development Assistant (CDA) is now trying to educate them on the different funding opportunities and the laid down procedures. The respondents recommended that these funds be placed under a specific ministry or department where applicants can submit formal applications and the selection process be governed by professionals transparently through well established guidelines. With such a structure in place, members of the SME SACCO could channel their applications through the SACCO and the SACCO could be the institution that received and disbursed funds to them.
Infrastructural improvements to accompany economic development programmes as these will enhance business performance. The roads are in a deplorable condition in the CBD and are worse in the estates. The contractors awarded road rehabilitation contracts are doing a substandard job and at times use red soil to cover potholes. County officials should vet such jobs and deny approval where below expected standards. There are serious traffic jams at the entrance into Thika town. There was land meant for construction of an exit/entrance into town but it was allocated to private developers, and as a result need to be recovered.
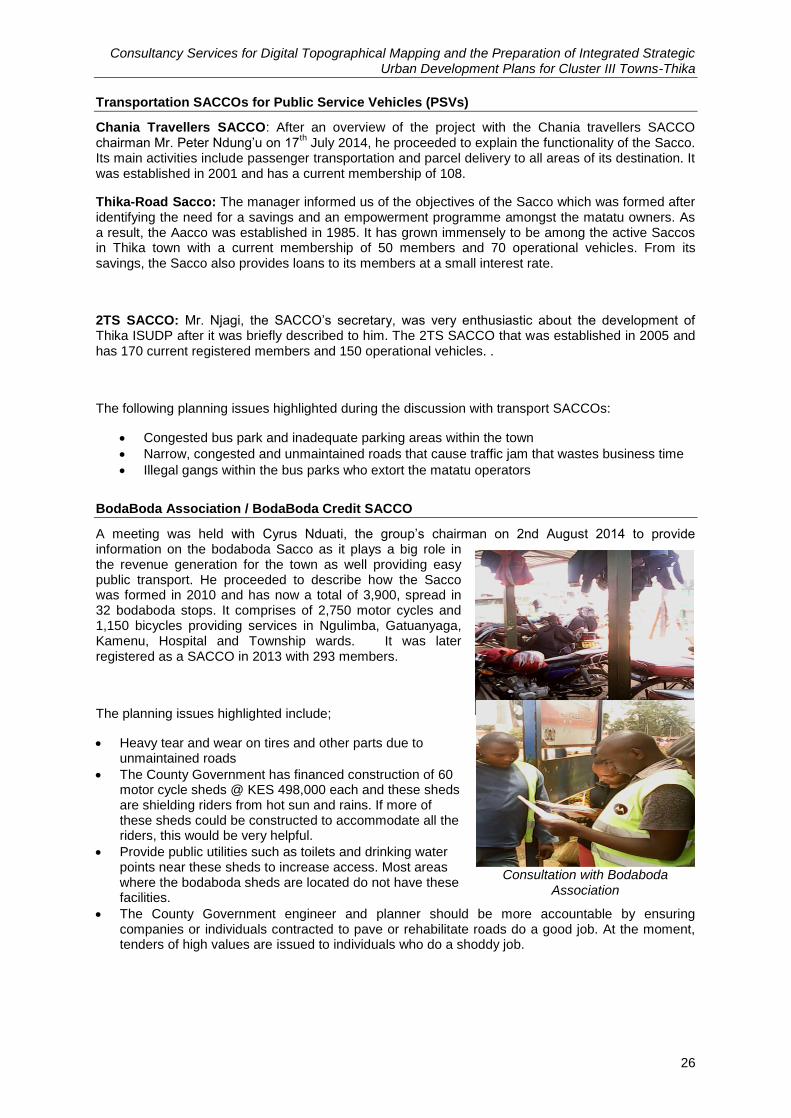
Consultancy Services for Digital Topographical Mapping and the Preparation of Integrated Strategic Urban Development Plans for Cluster III Towns-Thika
26
Transportation SACCOs for Public Service Vehicles (PSVs)
Chania Travellers SACCO: After an overview of the project with the Chania travellers SACCO chairman Mr. Peter Ndung‟u on 17
th July 2014, he proceeded to explain the functionality of the Sacco.
Its main activities include passenger transportation and parcel delivery to all areas of its destination. It was established in 2001 and has a current membership of 108.
Thika-Road Sacco: The manager informed us of the objectives of the Sacco which was formed after identifying the need for a savings and an empowerment programme amongst the matatu owners. As a result, the Aacco was established in 1985. It has grown immensely to be among the active Saccos in Thika town with a current membership of 50 members and 70 operational vehicles. From its savings, the Sacco also provides loans to its members at a small interest rate.
2TS SACCO: Mr. Njagi, the SACCO‟s secretary, was very enthusiastic about the development of Thika ISUDP after it was briefly described to him. The 2TS SACCO that was established in 2005 and has 170 current registered members and 150 operational vehicles. .
The following planning issues highlighted during the discussion with transport SACCOs:
Congested bus park and inadequate parking areas within the town
Narrow, congested and unmaintained roads that cause traffic jam that wastes business time
Illegal gangs within the bus parks who extort the matatu operators
BodaBoda Association / BodaBoda Credit SACCO
A meeting was held with Cyrus Nduati, the group‟s chairman on 2nd August 2014 to provide information on the bodaboda Sacco as it plays a big role in the revenue generation for the town as well providing easy public transport. He proceeded to describe how the Sacco was formed in 2010 and has now a total of 3,900, spread in 32 bodaboda stops. It comprises of 2,750 motor cycles and 1,150 bicycles providing services in Ngulimba, Gatuanyaga, Kamenu, Hospital and Township wards. It was later registered as a SACCO in 2013 with 293 members.
The planning issues highlighted include;
Heavy tear and wear on tires and other parts due to unmaintained roads
The County Government has financed construction of 60 motor cycle sheds @ KES 498,000 each and these sheds are shielding riders from hot sun and rains. If more of these sheds could be constructed to accommodate all the riders, this would be very helpful.
Provide public utilities such as toilets and drinking water points near these sheds to increase access. Most areas where the bodaboda sheds are located do not have these facilities.
The County Government engineer and planner should be more accountable by ensuring companies or individuals contracted to pave or rehabilitate roads do a good job. At the moment, tenders of high values are issued to individuals who do a shoddy job.
Consultation with Bodaboda Association
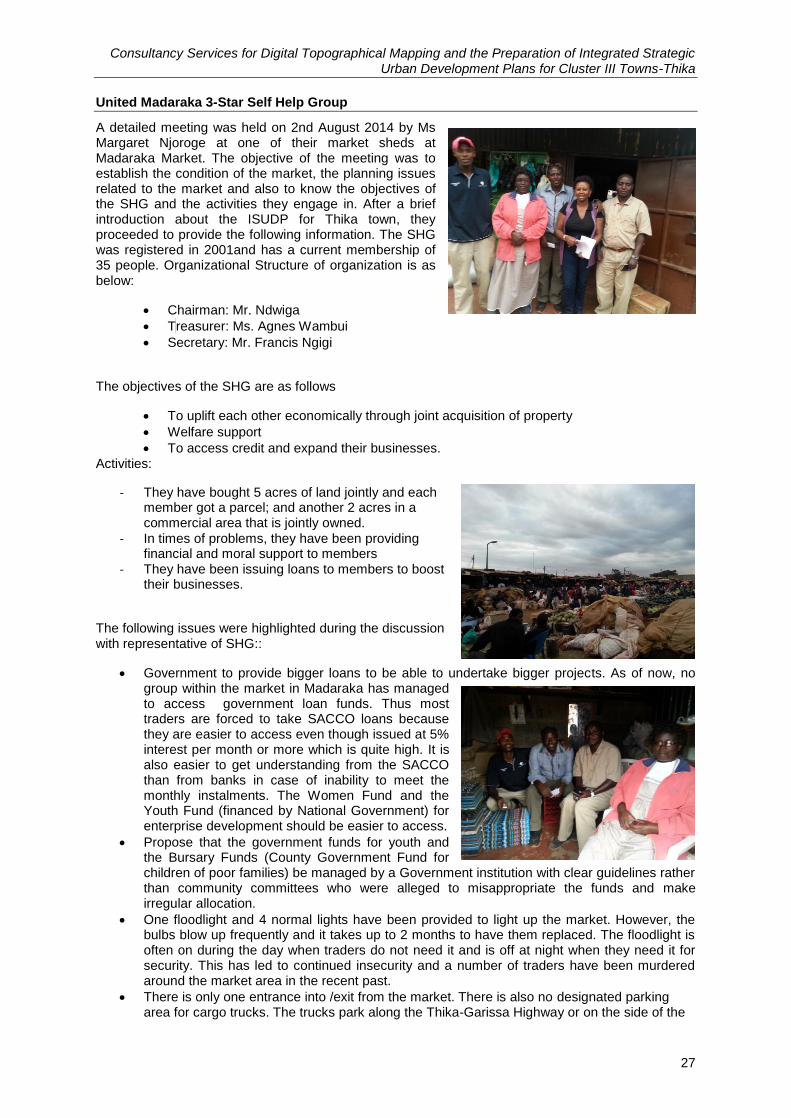
Consultancy Services for Digital Topographical Mapping and the Preparation of Integrated Strategic Urban Development Plans for Cluster III Towns-Thika
27
United Madaraka 3-Star Self Help Group
A detailed meeting was held on 2nd August 2014 by Ms Margaret Njoroge at one of their market sheds at Madaraka Market. The objective of the meeting was to establish the condition of the market, the planning issues related to the market and also to know the objectives of the SHG and the activities they engage in. After a brief introduction about the ISUDP for Thika town, they proceeded to provide the following information. The SHG was registered in 2001and has a current membership of 35 people. Organizational Structure of organization is as below:
Chairman: Mr. Ndwiga
T reasurer: Ms. Agnes Wambui
Secretary: Mr. Francis Ngigi
The objectives of the SHG are as follows
To uplift each other economically through joint acquisition of property
Welfare support
To access credit and expand their businesses. Activities:
- They have bought 5 acres of land jointly and each member got a parcel; and another 2 acres in a commercial area that is jointly owned.
- In times of problems, they have been providing financial and moral support to members
- They have been issuing loans to members to boost their businesses.
The following issues were highlighted during the discussion with representative of SHG::
Government to provide bigger loans to be able to undertake bigger projects. As of now, no group within the market in Madaraka has managed to access government loan funds. Thus most traders are forced to take SACCO loans because they are easier to access even though issued at 5% interest per month or more which is quite high. It is also easier to get understanding from the SACCO than from banks in case of inability to meet the monthly instalments. The Women Fund and the Youth Fund (financed by National Government) for enterprise development should be easier to access.
Propose that the government funds for youth and the Bursary Funds (County Government Fund for children of poor families) be managed by a Government institution with clear guidelines rather than community committees who were alleged to misappropriate the funds and make irregular allocation.
One floodlight and 4 normal lights have been provided to light up the market. However, the bulbs blow up frequently and it takes up to 2 months to have them replaced. The floodlight is often on during the day when traders do not need it and is off at night when they need it for security. This has led to continued insecurity and a number of traders have been murdered around the market area in the recent past.
There is only one entrance into /exit from the market. There is also no designated parking area for cargo trucks. The trucks park along the Thika-Garissa Highway or on the side of the
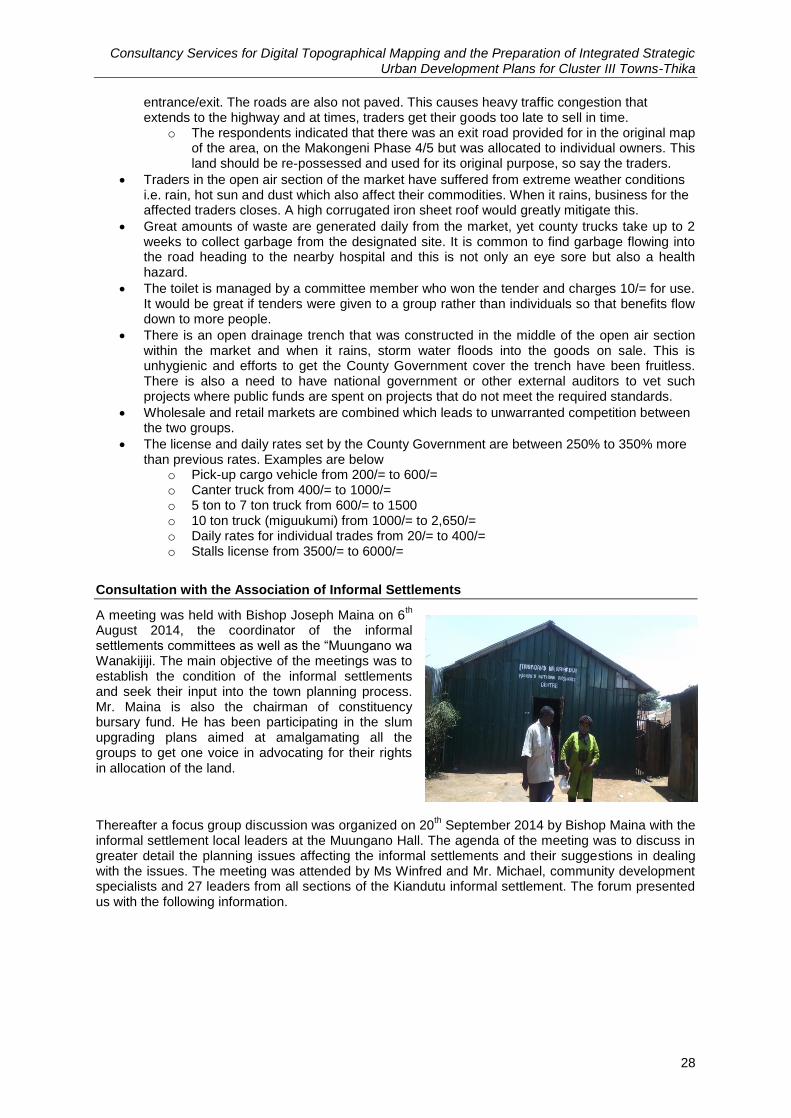
Consultancy Services for Digital Topographical Mapping and the Preparation of Integrated Strategic Urban Development Plans for Cluster III Towns-Thika
28
entrance/exit. The roads are also not paved. This causes heavy traffic congestion that extends to the highway and at times, traders get their goods too late to sell in time.
o The respondents indicated that there was an exit road provided for in the original map of the area, on the Makongeni Phase 4/5 but was allocated to individual owners. This land should be re-possessed and used for its original purpose, so say the traders.
Traders in the open air section of the market have suffered from extreme weather conditions i.e. rain, hot sun and dust which also affect their commodities. When it rains, business for the affected traders closes. A high corrugated iron sheet roof would greatly mitigate this.
Great amounts of waste are generated daily from the market, yet county trucks take up to 2 weeks to collect garbage from the designated site. It is common to find garbage flowing into the road heading to the nearby hospital and this is not only an eye sore but also a health hazard.
The toilet is managed by a committee member who won the tender and charges 10/= for use. It would be great if tenders were given to a group rather than individuals so that benefits flow down to more people.
There is an open drainage trench that was constructed in the middle of the open air section within the market and when it rains, storm water floods into the goods on sale. This is unhygienic and efforts to get the County Government cover the trench have been fruitless. There is also a need to have national government or other external auditors to vet such projects where public funds are spent on projects that do not meet the required standards.
Wholesale and retail markets are combined which leads to unwarranted competition between the two groups.
The license and daily rates set by the County Government are between 250% to 350% more than previous rates. Examples are below
o Pick-up cargo vehicle from 200/= to 600/= o Canter truck from 400/= to 1000/= o 5 ton to 7 ton truck from 600/= to 1500 o 10 ton truck (miguukumi) from 1000/= to 2,650/= o Daily rates for individual trades from 20/= to 400/= o Stalls license from 3500/= to 6000/=
Consultation with the Association of Informal Settlements
A meeting was held with Bishop Joseph Maina on 6th
August 2014, the coordinator of the informal settlements committees as well as the “Muungano wa Wanakijiji. The main objective of the meetings was to establish the condition of the informal settlements and seek their input into the town planning process. Mr. Maina is also the chairman of constituency bursary fund. He has been participating in the slum upgrading plans aimed at amalgamating all the groups to get one voice in advocating for their rights in allocation of the land.
Thereafter a focus group discussion was organized on 20th September 2014 by Bishop Maina with the
informal settlement local leaders at the Muungano Hall. The agenda of the meeting was to discuss in greater detail the planning issues affecting the informal settlements and their suggestions in dealing with the issues. The meeting was attended by Ms Winfred and Mr. Michael, community development specialists and 27 leaders from all sections of the Kiandutu informal settlement. The forum presented us with the following information.
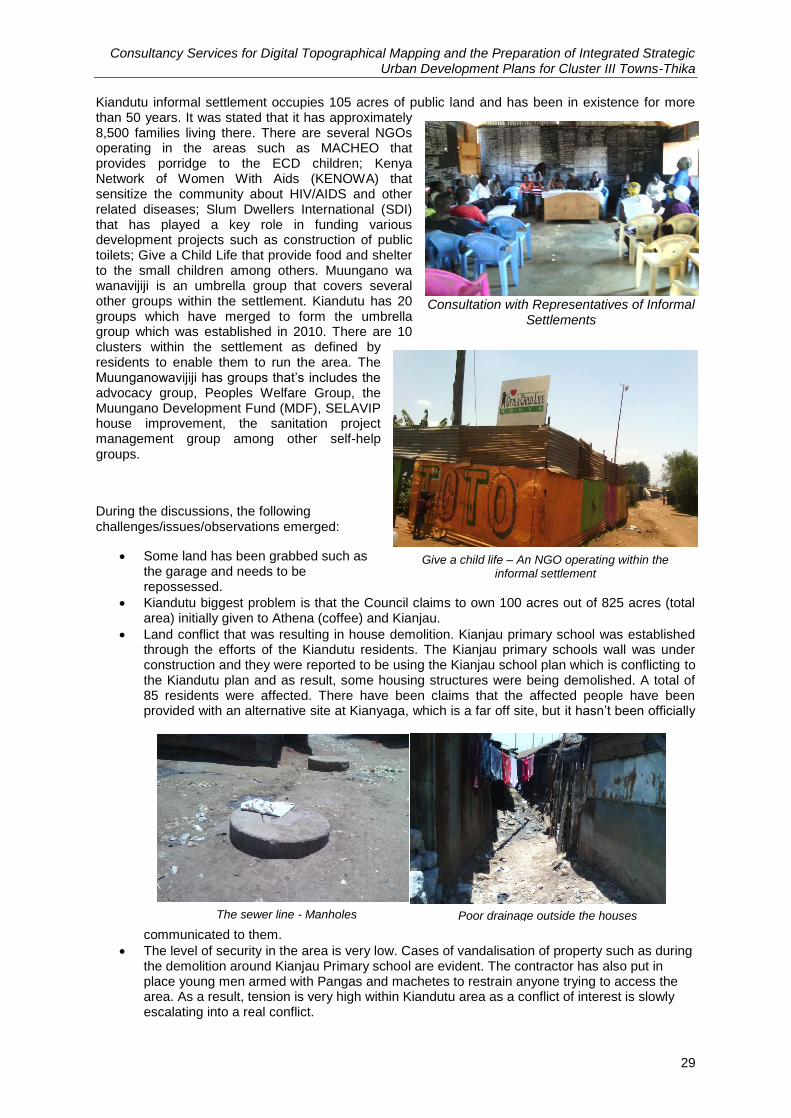
Consultancy Services for Digital Topographical Mapping and the Preparation of Integrated Strategic Urban Development Plans for Cluster III Towns-Thika
29
Kiandutu informal settlement occupies 105 acres of public land and has been in existence for more than 50 years. It was stated that it has approximately 8,500 families living there. There are several NGOs operating in the areas such as MACHEO that provides porridge to the ECD children; Kenya Network of Women With Aids (KENOWA) that sensitize the community about HIV/AIDS and other related diseases; Slum Dwellers International (SDI) that has played a key role in funding various development projects such as construction of public toilets; Give a Child Life that provide food and shelter to the small children among others. Muungano wa wanavijiji is an umbrella group that covers several other groups within the settlement. Kiandutu has 20 groups which have merged to form the umbrella group which was established in 2010. There are 10 clusters within the settlement as defined by residents to enable them to run the area. The Muunganowavijiji has groups that‟s includes the advocacy group, Peoples Welfare Group, the Muungano Development Fund (MDF), SELAVIP house improvement, the sanitation project management group among other self-help groups.
During the discussions, the following challenges/issues/observations emerged:
Some land has been grabbed such as the garage and needs to be repossessed.
Kiandutu biggest problem is that the Council claims to own 100 acres out of 825 acres (total area) initially given to Athena (coffee) and Kianjau.
Land conflict that was resulting in house demolition. Kianjau primary school was established through the efforts of the Kiandutu residents. The Kianjau primary schools wall was under construction and they were reported to be using the Kianjau school plan which is conflicting to the Kiandutu plan and as result, some housing structures were being demolished. A total of 85 residents were affected. There have been claims that the affected people have been provided with an alternative site at Kianyaga, which is a far off site, but it hasn‟t been officially
communicated to them.
The level of security in the area is very low. Cases of vandalisation of property such as during the demolition around Kianjau Primary school are evident. The contractor has also put in place young men armed with Pangas and machetes to restrain anyone trying to access the area. As a result, tension is very high within Kiandutu area as a conflict of interest is slowly escalating into a real conflict.
Give a child life – An NGO operating within the informal settlement
The sewer line - Manholes Poor drainage outside the houses
Consultation with Representatives of Informal Settlements
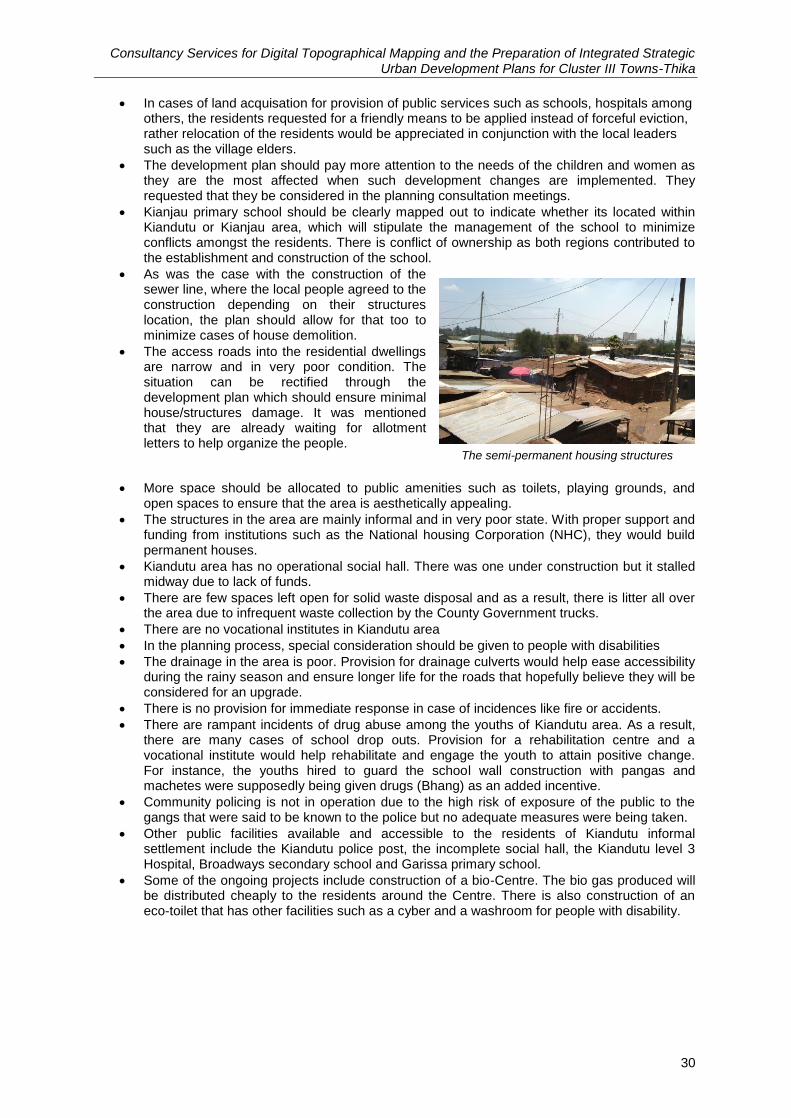
Consultancy Services for Digital Topographical Mapping and the Preparation of Integrated Strategic Urban Development Plans for Cluster III Towns-Thika
30
In cases of land acquisation for provision of public services such as schools, hospitals among others, the residents requested for a friendly means to be applied instead of forceful eviction, rather relocation of the residents would be appreciated in conjunction with the local leaders such as the village elders.
The development plan should pay more attention to the needs of the children and women as they are the most affected when such development changes are implemented. They requested that they be considered in the planning consultation meetings.
Kianjau primary school should be clearly mapped out to indicate whether its located within Kiandutu or Kianjau area, which will stipulate the management of the school to minimize conflicts amongst the residents. There is conflict of ownership as both regions contributed to the establishment and construction of the school.
As was the case with the construction of the sewer line, where the local people agreed to the construction depending on their structures location, the plan should allow for that too to minimize cases of house demolition.
The access roads into the residential dwellings are narrow and in very poor condition. The situation can be rectified through the development plan which should ensure minimal house/structures damage. It was mentioned that they are already waiting for allotment letters to help organize the people.
More space should be allocated to public amenities such as toilets, playing grounds, and open spaces to ensure that the area is aesthetically appealing.
The structures in the area are mainly informal and in very poor state. With proper support and funding from institutions such as the National housing Corporation (NHC), they would build permanent houses.
Kiandutu area has no operational social hall. There was one under construction but it stalled midway due to lack of funds.
There are few spaces left open for solid waste disposal and as a result, there is litter all over the area due to infrequent waste collection by the County Government trucks.
There are no vocational institutes in Kiandutu area
In the planning process, special consideration should be given to people with disabilities
The drainage in the area is poor. Provision for drainage culverts would help ease accessibility during the rainy season and ensure longer life for the roads that hopefully believe they will be considered for an upgrade.
There is no provision for immediate response in case of incidences like fire or accidents.
There are rampant incidents of drug abuse among the youths of Kiandutu area. As a result, there are many cases of school drop outs. Provision for a rehabilitation centre and a vocational institute would help rehabilitate and engage the youth to attain positive change. For instance, the youths hired to guard the school wall construction with pangas and machetes were supposedly being given drugs (Bhang) as an added incentive.
Community policing is not in operation due to the high risk of exposure of the public to the gangs that were said to be known to the police but no adequate measures were being taken.
Other public facilities available and accessible to the residents of Kiandutu informal settlement include the Kiandutu police post, the incomplete social hall, the Kiandutu level 3 Hospital, Broadways secondary school and Garissa primary school.
Some of the ongoing projects include construction of a bio-Centre. The bio gas produced will be distributed cheaply to the residents around the Centre. There is also construction of an eco-toilet that has other facilities such as a cyber and a washroom for people with disability.
The semi-permanent housing structures
Consultancy Services for Digital Topographical Mapping and the Preparation of Integrated Strategic Urban Development Plans for Cluster III Towns-Thika
31
Annexure 4 Situational Analysis and Vision Workshop
Report
Consultancy Services for Digital Topographical Mapping and the Preparation of Integrated Strategic Urban Development Plans for Cluster III Towns-Thika
32
4 Situational Analysis and Vision Workshop Report
The vision of Thika town was formulated in the workshop held on 18th November 2014, at Cravers
Hotel, Thika. The workshop presented status of mapping, situational analysis and vision formulation process. Around 120 participants attended the visioning workshop.
4.1 Introduction The objective of the Stakeholders’ Consultation and Visioning Workshop is to present the preliminary maps, situational analysis and obtain key stakeholders‟ visions for the town. The project Terms of Reference propose three workshops: one each for the launch, the preliminary maps validation and situational analysis; and visioning. However, it was suggested by County Officials and agreed by Kenya Municipal Programme (KMP) team, that the three workshops should be combined. The map validation presentation was separately given to the County earlier and the updated maps were made available at the workshop for reference of key stakeholders.
The key stakeholders include Members of County Assembly (MCAs); County Officials; members of organisations representing Commerce and Industry, Religions, Matatus, Bodabodas, Hawkers, Jua Kali, informal settlements, Police, Development Practitioners, Opinion Leaders, Farmers, Cultural Groups, Education, other community based organisations and civil society organisations, etc. Since a separate report of visioning workshop containing proceeding, invitation letter, attendance sheet and copy of presentation has been submitted earlier, therefore here only proceeding of the workshop has been presented. Around 120 participants attended the workshop.
The workshop programme is given below:
Programme
Time Activity By
08.30 – 09.00 Registration Consultants
09.00 – 09.05 Prayer Kiambu County
Government
(KCG)
09.05 – 09.15 Introductory Remarks – Chief Officer, Lands,
Housing and Physical Planning
KCG
09.15 – 09.30 Introductory Remarks – KMP Urban
Development
Directorate (UDD)
9.30 – 10.30 Thika as it is today – situational analysis Consultants
10.30 – 11.00 Coffee break
11.00 – 11.15 Formation of small groups KCG
11.15 – 1.15 Small Group work
1.15 – 2.15 Lunch
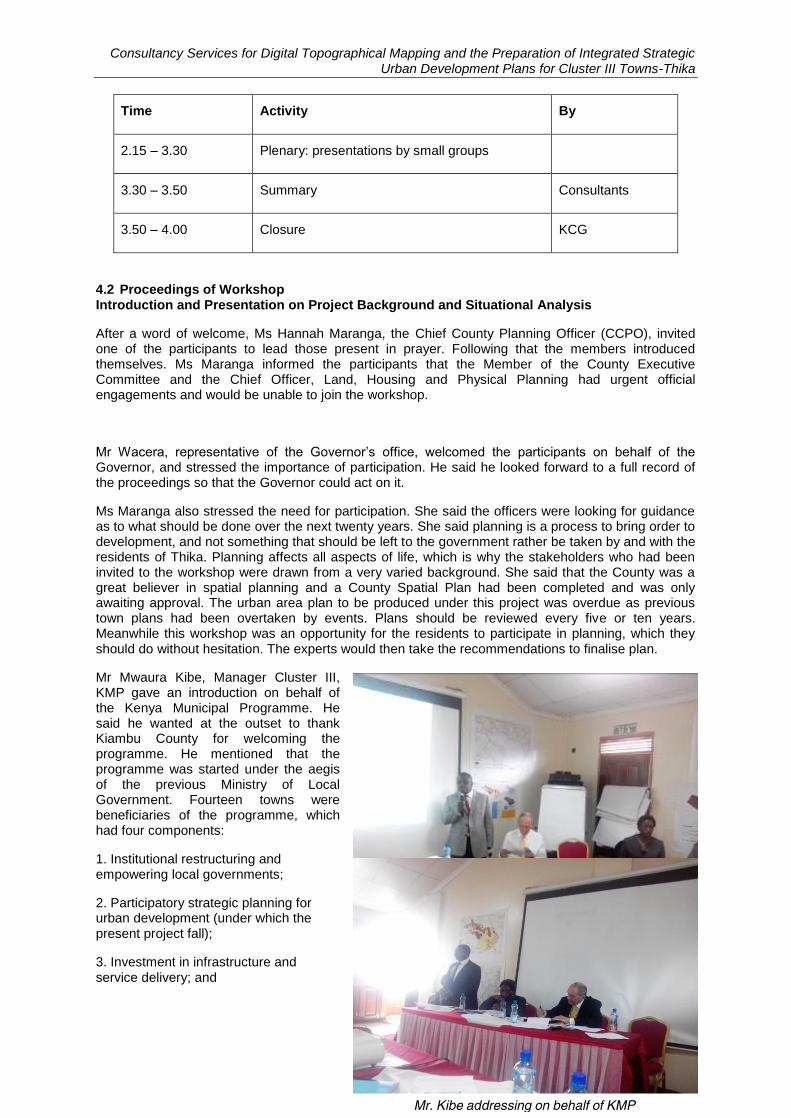
Consultancy Services for Digital Topographical Mapping and the Preparation of Integrated Strategic Urban Development Plans for Cluster III Towns-Thika
33
Time Activity By
2.15 – 3.30 Plenary: presentations by small groups
3.30 – 3.50 Summary Consultants
3.50 – 4.00 Closure KCG
4.2 Proceedings of Workshop Introduction and Presentation on Project Background and Situational Analysis
After a word of welcome, Ms Hannah Maranga, the Chief County Planning Officer (CCPO), invited one of the participants to lead those present in prayer. Following that the members introduced themselves. Ms Maranga informed the participants that the Member of the County Executive Committee and the Chief Officer, Land, Housing and Physical Planning had urgent official engagements and would be unable to join the workshop.
Mr Wacera, representative of the Governor‟s office, welcomed the participants on behalf of the Governor, and stressed the importance of participation. He said he looked forward to a full record of the proceedings so that the Governor could act on it.
Ms Maranga also stressed the need for participation. She said the officers were looking for guidance as to what should be done over the next twenty years. She said planning is a process to bring order to development, and not something that should be left to the government rather be taken by and with the residents of Thika. Planning affects all aspects of life, which is why the stakeholders who had been invited to the workshop were drawn from a very varied background. She said that the County was a great believer in spatial planning and a County Spatial Plan had been completed and was only awaiting approval. The urban area plan to be produced under this project was overdue as previous town plans had been overtaken by events. Plans should be reviewed every five or ten years. Meanwhile this workshop was an opportunity for the residents to participate in planning, which they should do without hesitation. The experts would then take the recommendations to finalise plan.
Mr Mwaura Kibe, Manager Cluster III, KMP gave an introduction on behalf of the Kenya Municipal Programme. He said he wanted at the outset to thank Kiambu County for welcoming the programme. He mentioned that the programme was started under the aegis of the previous Ministry of Local Government. Fourteen towns were beneficiaries of the programme, which had four components:
1. Institutional restructuring and empowering local governments;
2. Participatory strategic planning for urban development (under which the present project fall);
3. Investment in infrastructure and service delivery; and
Welcome remarks by Governor’s representative
Mr. Kibe addressing on behalf of KMP
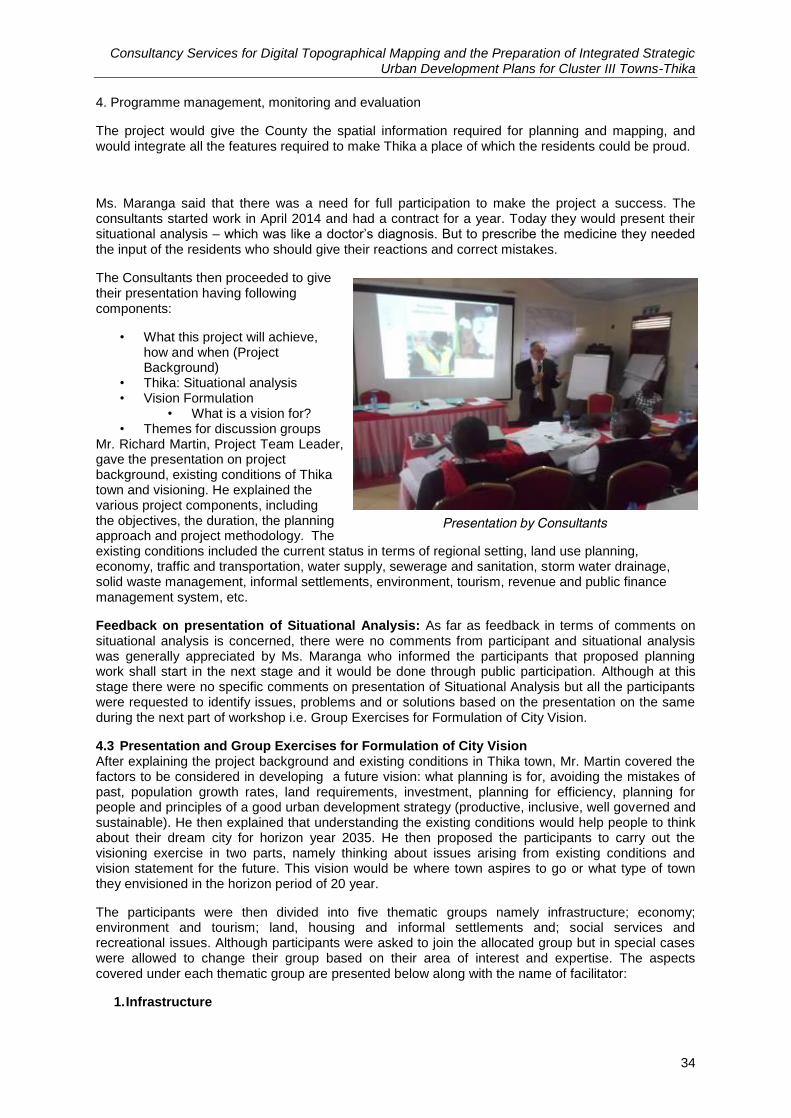
Consultancy Services for Digital Topographical Mapping and the Preparation of Integrated Strategic Urban Development Plans for Cluster III Towns-Thika
34
4. Programme management, monitoring and evaluation
The project would give the County the spatial information required for planning and mapping, and would integrate all the features required to make Thika a place of which the residents could be proud.
Ms. Maranga said that there was a need for full participation to make the project a success. The consultants started work in April 2014 and had a contract for a year. Today they would present their situational analysis – which was like a doctor‟s diagnosis. But to prescribe the medicine they needed the input of the residents who should give their reactions and correct mistakes.
The Consultants then proceeded to give their presentation having following components:
• What this project will achieve, how and when (Project Background)
• Thika: Situational analysis • Vision Formulation
• What is a vision for? • Themes for discussion groups
Mr. Richard Martin, Project Team Leader, gave the presentation on project background, existing conditions of Thika town and visioning. He explained the various project components, including the objectives, the duration, the planning approach and project methodology. The existing conditions included the current status in terms of regional setting, land use planning, economy, traffic and transportation, water supply, sewerage and sanitation, storm water drainage, solid waste management, informal settlements, environment, tourism, revenue and public finance management system, etc.
Feedback on presentation of Situational Analysis: As far as feedback in terms of comments on situational analysis is concerned, there were no comments from participant and situational analysis was generally appreciated by Ms. Maranga who informed the participants that proposed planning work shall start in the next stage and it would be done through public participation. Although at this stage there were no specific comments on presentation of Situational Analysis but all the participants were requested to identify issues, problems and or solutions based on the presentation on the same during the next part of workshop i.e. Group Exercises for Formulation of City Vision.
4.3 Presentation and Group Exercises for Formulation of City Vision After explaining the project background and existing conditions in Thika town, Mr. Martin covered the factors to be considered in developing a future vision: what planning is for, avoiding the mistakes of past, population growth rates, land requirements, investment, planning for efficiency, planning for people and principles of a good urban development strategy (productive, inclusive, well governed and sustainable). He then explained that understanding the existing conditions would help people to think about their dream city for horizon year 2035. He then proposed the participants to carry out the visioning exercise in two parts, namely thinking about issues arising from existing conditions and vision statement for the future. This vision would be where town aspires to go or what type of town they envisioned in the horizon period of 20 year.
The participants were then divided into five thematic groups namely infrastructure; economy; environment and tourism; land, housing and informal settlements and; social services and recreational issues. Although participants were asked to join the allocated group but in special cases were allowed to change their group based on their area of interest and expertise. The aspects covered under each thematic group are presented below along with the name of facilitator:
1. Infrastructure
Presentation by Consultants
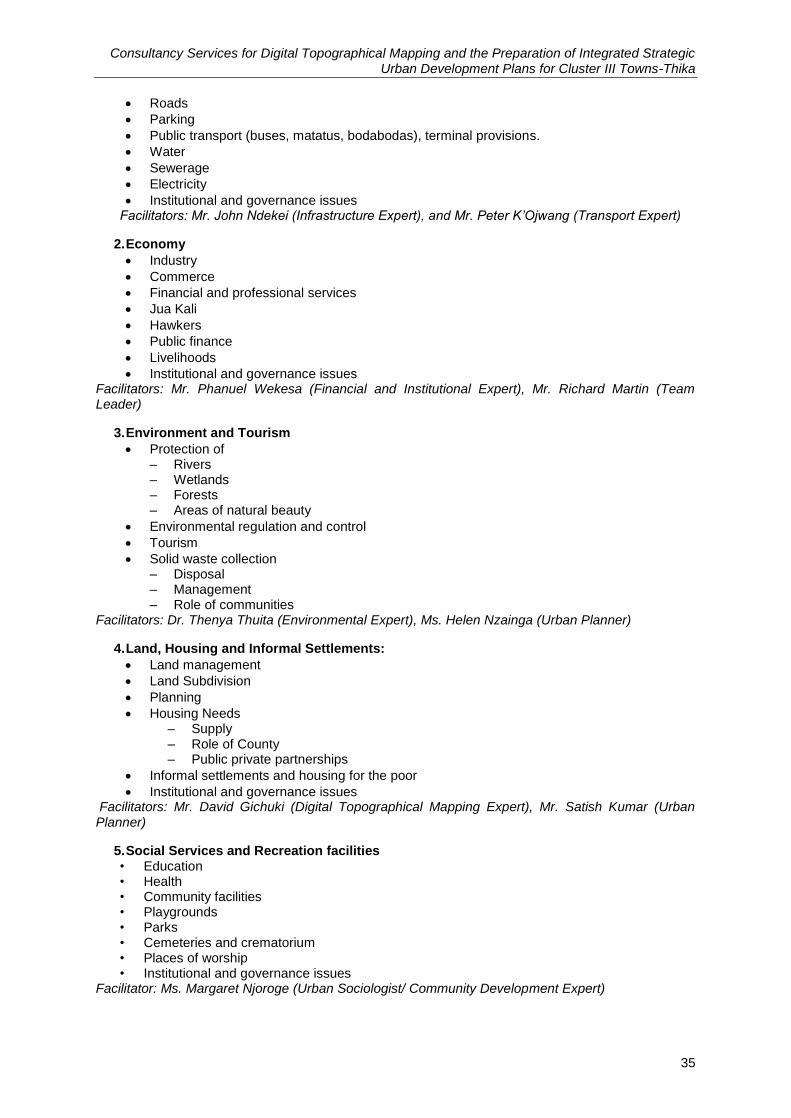
Consultancy Services for Digital Topographical Mapping and the Preparation of Integrated Strategic Urban Development Plans for Cluster III Towns-Thika
35
Roads
Parking
Public transport (buses, matatus, bodabodas), terminal provisions.
Water
Sewerage
Electricity
Institutional and governance issues Facilitators: Mr. John Ndekei (Infrastructure Expert), and Mr. Peter K’Ojwang (Transport Expert)
2. Economy
Industry
Commerce
Financial and professional services
Jua Kali
Hawkers
Public finance
Livelihoods
Institutional and governance issues Facilitators: Mr. Phanuel Wekesa (Financial and Institutional Expert), Mr. Richard Martin (Team Leader)
3. Environment and Tourism
Protection of – Rivers – Wetlands – Forests – Areas of natural beauty
Environmental regulation and control
Tourism
Solid waste collection – Disposal – Management – Role of communities
Facilitators: Dr. Thenya Thuita (Environmental Expert), Ms. Helen Nzainga (Urban Planner)
4. Land, Housing and Informal Settlements:
Land management
Land Subdivision
Planning
Housing Needs – Supply – Role of County – Public private partnerships
Informal settlements and housing for the poor
Institutional and governance issues Facilitators: Mr. David Gichuki (Digital Topographical Mapping Expert), Mr. Satish Kumar (Urban Planner)
5. Social Services and Recreation facilities • Education • Health • Community facilities • Playgrounds • Parks • Cemeteries and crematorium • Places of worship • Institutional and governance issues
Facilitator: Ms. Margaret Njoroge (Urban Sociologist/ Community Development Expert)
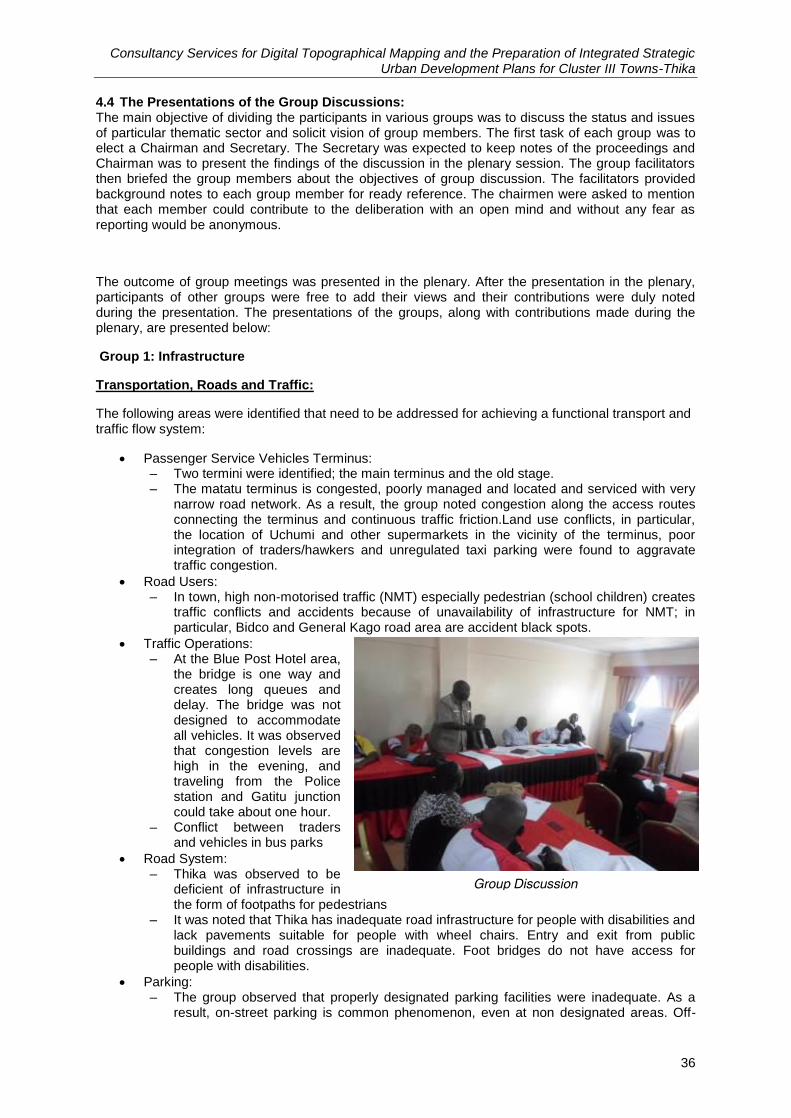
Consultancy Services for Digital Topographical Mapping and the Preparation of Integrated Strategic Urban Development Plans for Cluster III Towns-Thika
36
4.4 The Presentations of the Group Discussions: The main objective of dividing the participants in various groups was to discuss the status and issues of particular thematic sector and solicit vision of group members. The first task of each group was to elect a Chairman and Secretary. The Secretary was expected to keep notes of the proceedings and Chairman was to present the findings of the discussion in the plenary session. The group facilitators then briefed the group members about the objectives of group discussion. The facilitators provided background notes to each group member for ready reference. The chairmen were asked to mention that each member could contribute to the deliberation with an open mind and without any fear as reporting would be anonymous.
The outcome of group meetings was presented in the plenary. After the presentation in the plenary, participants of other groups were free to add their views and their contributions were duly noted during the presentation. The presentations of the groups, along with contributions made during the plenary, are presented below:
Group 1: Infrastructure
Transportation, Roads and Traffic:
The following areas were identified that need to be addressed for achieving a functional transport and traffic flow system:
Passenger Service Vehicles Terminus: – Two termini were identified; the main terminus and the old stage. – The matatu terminus is congested, poorly managed and located and serviced with very
narrow road network. As a result, the group noted congestion along the access routes connecting the terminus and continuous traffic friction.Land use conflicts, in particular, the location of Uchumi and other supermarkets in the vicinity of the terminus, poor integration of traders/hawkers and unregulated taxi parking were found to aggravate traffic congestion.
Road Users: – In town, high non-motorised traffic (NMT) especially pedestrian (school children) creates
traffic conflicts and accidents because of unavailability of infrastructure for NMT; in particular, Bidco and General Kago road area are accident black spots.
Traffic Operations: – At the Blue Post Hotel area,
the bridge is one way and creates long queues and delay. The bridge was not designed to accommodate all vehicles. It was observed that congestion levels are high in the evening, and traveling from the Police station and Gatitu junction could take about one hour.
– Conflict between traders and vehicles in bus parks
Road System: – Thika was observed to be
deficient of infrastructure in the form of footpaths for pedestrians
– It was noted that Thika has inadequate road infrastructure for people with disabilities and lack pavements suitable for people with wheel chairs. Entry and exit from public buildings and road crossings are inadequate. Foot bridges do not have access for people with disabilities.
Parking: – The group observed that properly designated parking facilities were inadequate. As a
result, on-street parking is common phenomenon, even at non designated areas. Off-
Group Discussion
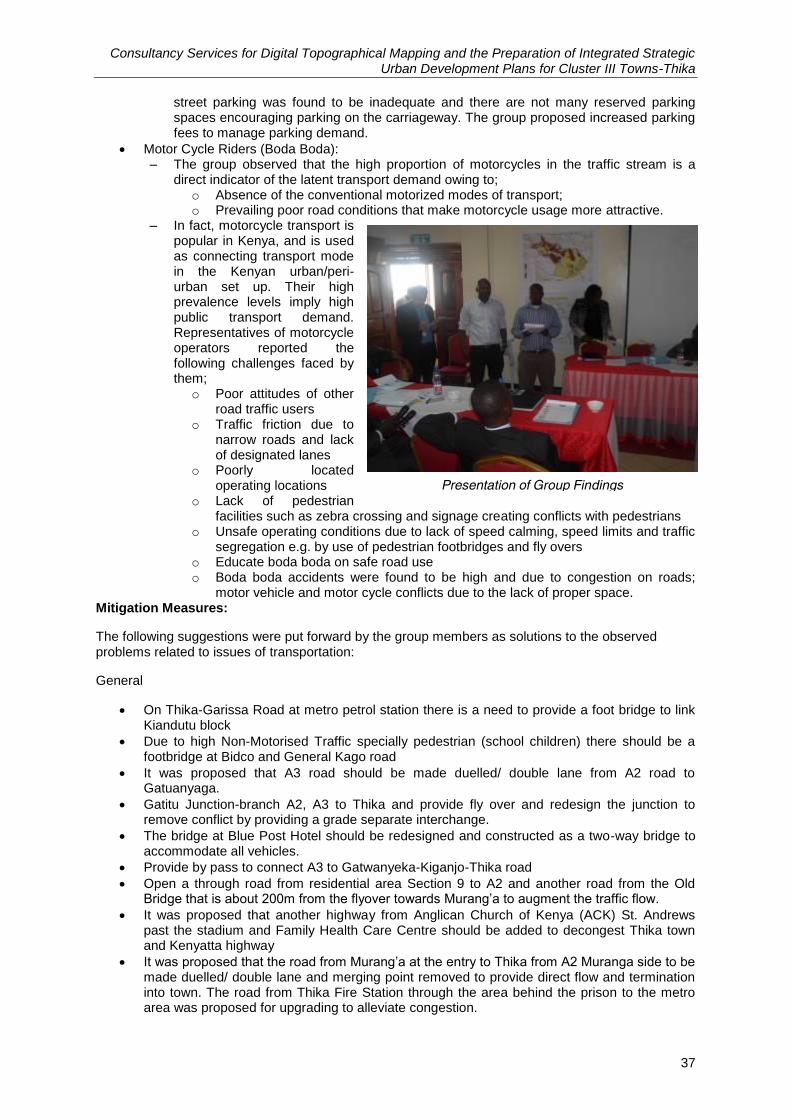
Consultancy Services for Digital Topographical Mapping and the Preparation of Integrated Strategic Urban Development Plans for Cluster III Towns-Thika
37
street parking was found to be inadequate and there are not many reserved parking spaces encouraging parking on the carriageway. The group proposed increased parking fees to manage parking demand.
Motor Cycle Riders (Boda Boda): – The group observed that the high proportion of motorcycles in the traffic stream is a
direct indicator of the latent transport demand owing to; o Absence of the conventional motorized modes of transport; o Prevailing poor road conditions that make motorcycle usage more attractive.
– In fact, motorcycle transport is popular in Kenya, and is used as connecting transport mode in the Kenyan urban/peri-urban set up. Their high prevalence levels imply high public transport demand. Representatives of motorcycle operators reported the following challenges faced by them;
o Poor attitudes of other road traffic users
o Traffic friction due to narrow roads and lack of designated lanes
o Poorly located operating locations
o Lack of pedestrian facilities such as zebra crossing and signage creating conflicts with pedestrians
o Unsafe operating conditions due to lack of speed calming, speed limits and traffic segregation e.g. by use of pedestrian footbridges and fly overs
o Educate boda boda on safe road use o Boda boda accidents were found to be high and due to congestion on roads;
motor vehicle and motor cycle conflicts due to the lack of proper space. Mitigation Measures:
The following suggestions were put forward by the group members as solutions to the observed problems related to issues of transportation:
General
On Thika-Garissa Road at metro petrol station there is a need to provide a foot bridge to link Kiandutu block
Due to high Non-Motorised Traffic specially pedestrian (school children) there should be a footbridge at Bidco and General Kago road
It was proposed that A3 road should be made duelled/ double lane from A2 road to Gatuanyaga.
Gatitu Junction-branch A2, A3 to Thika and provide fly over and redesign the junction to remove conflict by providing a grade separate interchange.
The bridge at Blue Post Hotel should be redesigned and constructed as a two-way bridge to accommodate all vehicles.
Provide by pass to connect A3 to Gatwanyeka-Kiganjo-Thika road
Open a through road from residential area Section 9 to A2 and another road from the Old Bridge that is about 200m from the flyover towards Murang‟a to augment the traffic flow.
It was proposed that another highway from Anglican Church of Kenya (ACK) St. Andrews past the stadium and Family Health Care Centre should be added to decongest Thika town and Kenyatta highway
It was proposed that the road from Murang‟a at the entry to Thika from A2 Muranga side to be made duelled/ double lane and merging point removed to provide direct flow and termination into town. The road from Thika Fire Station through the area behind the prison to the metro area was proposed for upgrading to alleviate congestion.
Presentation of Group Findings
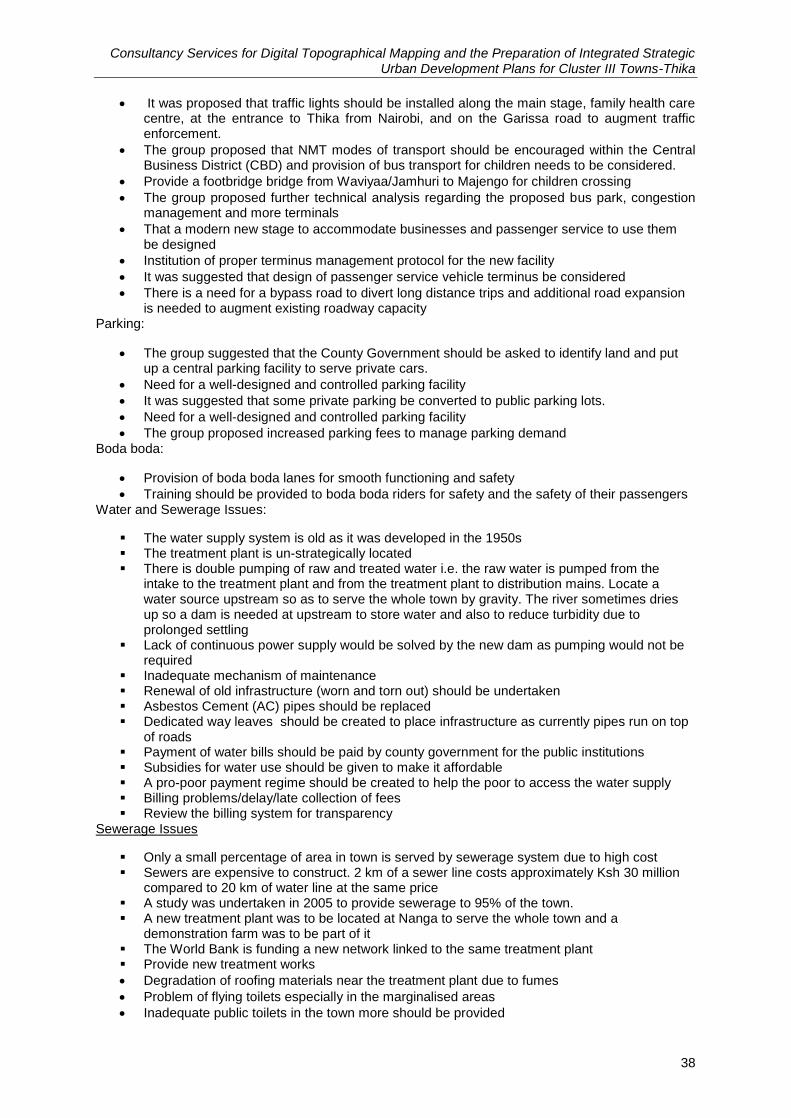
Consultancy Services for Digital Topographical Mapping and the Preparation of Integrated Strategic Urban Development Plans for Cluster III Towns-Thika
38
It was proposed that traffic lights should be installed along the main stage, family health care centre, at the entrance to Thika from Nairobi, and on the Garissa road to augment traffic enforcement.
The group proposed that NMT modes of transport should be encouraged within the Central Business District (CBD) and provision of bus transport for children needs to be considered.
Provide a footbridge bridge from Waviyaa/Jamhuri to Majengo for children crossing
The group proposed further technical analysis regarding the proposed bus park, congestion management and more terminals
That a modern new stage to accommodate businesses and passenger service to use them be designed
Institution of proper terminus management protocol for the new facility
It was suggested that design of passenger service vehicle terminus be considered
There is a need for a bypass road to divert long distance trips and additional road expansion is needed to augment existing roadway capacity
Parking:
The group suggested that the County Government should be asked to identify land and put up a central parking facility to serve private cars.
Need for a well-designed and controlled parking facility
It was suggested that some private parking be converted to public parking lots.
Need for a well-designed and controlled parking facility
The group proposed increased parking fees to manage parking demand Boda boda:
Provision of boda boda lanes for smooth functioning and safety
Training should be provided to boda boda riders for safety and the safety of their passengers Water and Sewerage Issues:
The water supply system is old as it was developed in the 1950s The treatment plant is un-strategically located There is double pumping of raw and treated water i.e. the raw water is pumped from the
intake to the treatment plant and from the treatment plant to distribution mains. Locate a water source upstream so as to serve the whole town by gravity. The river sometimes dries up so a dam is needed at upstream to store water and also to reduce turbidity due to prolonged settling
Lack of continuous power supply would be solved by the new dam as pumping would not be required
Inadequate mechanism of maintenance Renewal of old infrastructure (worn and torn out) should be undertaken Asbestos Cement (AC) pipes should be replaced Dedicated way leaves should be created to place infrastructure as currently pipes run on top
of roads Payment of water bills should be paid by county government for the public institutions Subsidies for water use should be given to make it affordable A pro-poor payment regime should be created to help the poor to access the water supply Billing problems/delay/late collection of fees Review the billing system for transparency
Sewerage Issues
Only a small percentage of area in town is served by sewerage system due to high cost Sewers are expensive to construct. 2 km of a sewer line costs approximately Ksh 30 million
compared to 20 km of water line at the same price A study was undertaken in 2005 to provide sewerage to 95% of the town. A new treatment plant was to be located at Nanga to serve the whole town and a
demonstration farm was to be part of it The World Bank is funding a new network linked to the same treatment plant Provide new treatment works
Degradation of roofing materials near the treatment plant due to fumes
Problem of flying toilets especially in the marginalised areas
Inadequate public toilets in the town more should be provided
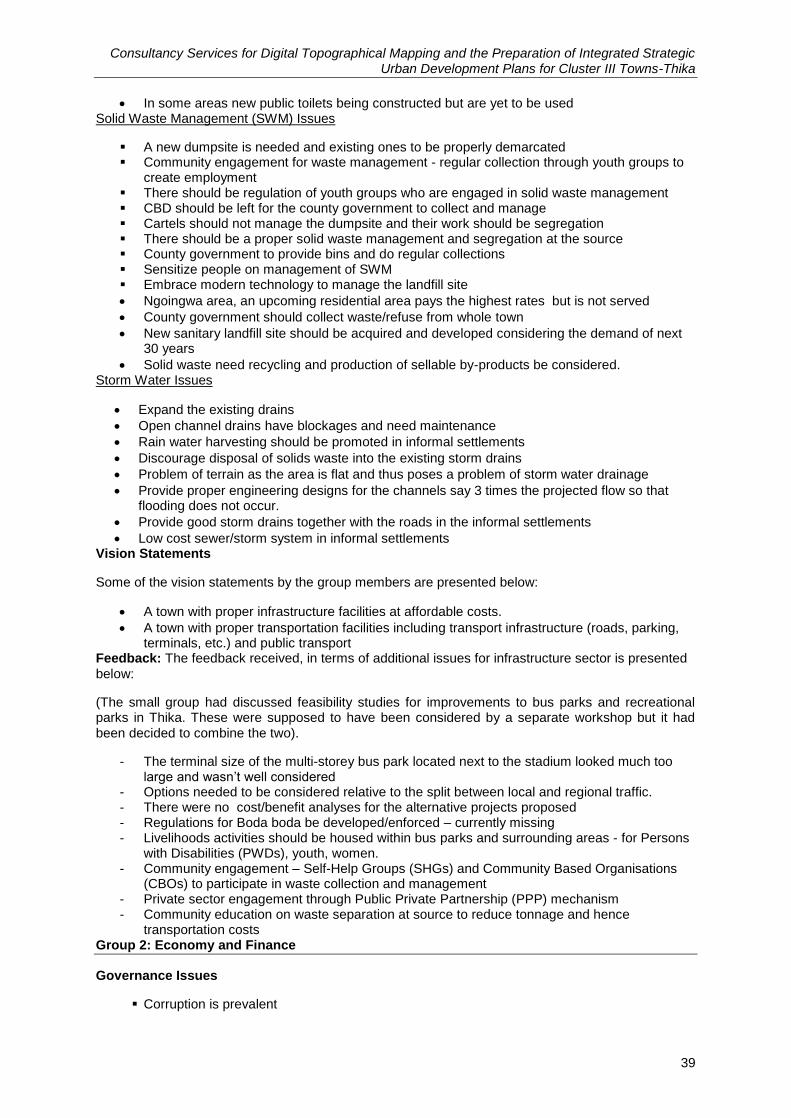
Consultancy Services for Digital Topographical Mapping and the Preparation of Integrated Strategic Urban Development Plans for Cluster III Towns-Thika
39
In some areas new public toilets being constructed but are yet to be used Solid Waste Management (SWM) Issues
A new dumpsite is needed and existing ones to be properly demarcated Community engagement for waste management - regular collection through youth groups to
create employment There should be regulation of youth groups who are engaged in solid waste management CBD should be left for the county government to collect and manage Cartels should not manage the dumpsite and their work should be segregation There should be a proper solid waste management and segregation at the source County government to provide bins and do regular collections Sensitize people on management of SWM Embrace modern technology to manage the landfill site
Ngoingwa area, an upcoming residential area pays the highest rates but is not served
County government should collect waste/refuse from whole town
New sanitary landfill site should be acquired and developed considering the demand of next 30 years
Solid waste need recycling and production of sellable by-products be considered. Storm Water Issues
Expand the existing drains
Open channel drains have blockages and need maintenance
Rain water harvesting should be promoted in informal settlements
Discourage disposal of solids waste into the existing storm drains
Problem of terrain as the area is flat and thus poses a problem of storm water drainage
Provide proper engineering designs for the channels say 3 times the projected flow so that flooding does not occur.
Provide good storm drains together with the roads in the informal settlements
Low cost sewer/storm system in informal settlements Vision Statements
Some of the vision statements by the group members are presented below:
A town with proper infrastructure facilities at affordable costs.
A town with proper transportation facilities including transport infrastructure (roads, parking, terminals, etc.) and public transport
Feedback: The feedback received, in terms of additional issues for infrastructure sector is presented
below:
(The small group had discussed feasibility studies for improvements to bus parks and recreational parks in Thika. These were supposed to have been considered by a separate workshop but it had been decided to combine the two).
- The terminal size of the multi-storey bus park located next to the stadium looked much too large and wasn‟t well considered
- Options needed to be considered relative to the split between local and regional traffic. - There were no cost/benefit analyses for the alternative projects proposed - Regulations for Boda boda be developed/enforced – currently missing - Livelihoods activities should be housed within bus parks and surrounding areas - for Persons
with Disabilities (PWDs), youth, women. - Community engagement – Self-Help Groups (SHGs) and Community Based Organisations
(CBOs) to participate in waste collection and management - Private sector engagement through Public Private Partnership (PPP) mechanism - Community education on waste separation at source to reduce tonnage and hence
transportation costs Group 2: Economy and Finance
Governance Issues
Corruption is prevalent
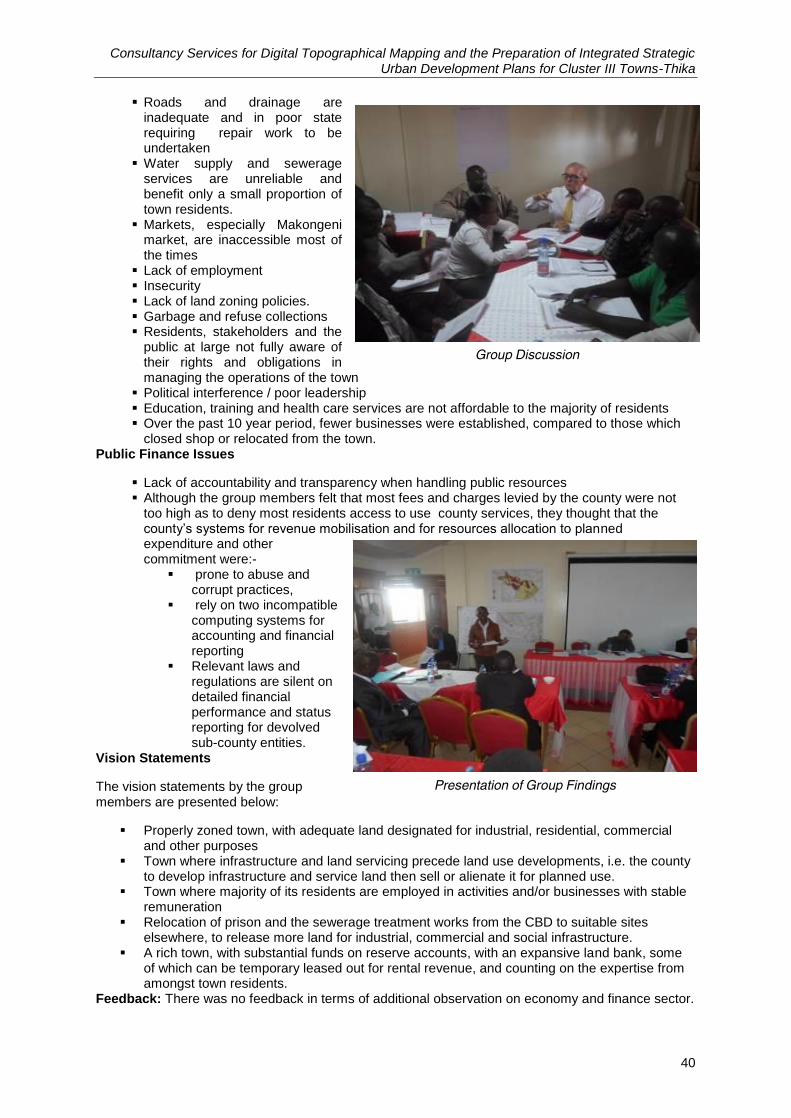
Consultancy Services for Digital Topographical Mapping and the Preparation of Integrated Strategic Urban Development Plans for Cluster III Towns-Thika
40
Roads and drainage are inadequate and in poor state requiring repair work to be undertaken
Water supply and sewerage services are unreliable and benefit only a small proportion of town residents.
Markets, especially Makongeni market, are inaccessible most of the times
Lack of employment Insecurity Lack of land zoning policies. Garbage and refuse collections Residents, stakeholders and the
public at large not fully aware of their rights and obligations in managing the operations of the town
Political interference / poor leadership Education, training and health care services are not affordable to the majority of residents Over the past 10 year period, fewer businesses were established, compared to those which
closed shop or relocated from the town. Public Finance Issues
Lack of accountability and transparency when handling public resources Although the group members felt that most fees and charges levied by the county were not
too high as to deny most residents access to use county services, they thought that the county‟s systems for revenue mobilisation and for resources allocation to planned expenditure and other commitment were:-
prone to abuse and corrupt practices,
rely on two incompatible computing systems for accounting and financial reporting
Relevant laws and regulations are silent on detailed financial performance and status reporting for devolved sub-county entities.
Vision Statements
The vision statements by the group members are presented below:
Properly zoned town, with adequate land designated for industrial, residential, commercial and other purposes
Town where infrastructure and land servicing precede land use developments, i.e. the county to develop infrastructure and service land then sell or alienate it for planned use.
Town where majority of its residents are employed in activities and/or businesses with stable remuneration
Relocation of prison and the sewerage treatment works from the CBD to suitable sites elsewhere, to release more land for industrial, commercial and social infrastructure.
A rich town, with substantial funds on reserve accounts, with an expansive land bank, some of which can be temporary leased out for rental revenue, and counting on the expertise from amongst town residents.
Feedback: There was no feedback in terms of additional observation on economy and finance sector.
Group Discussion
Presentation of Group Findings
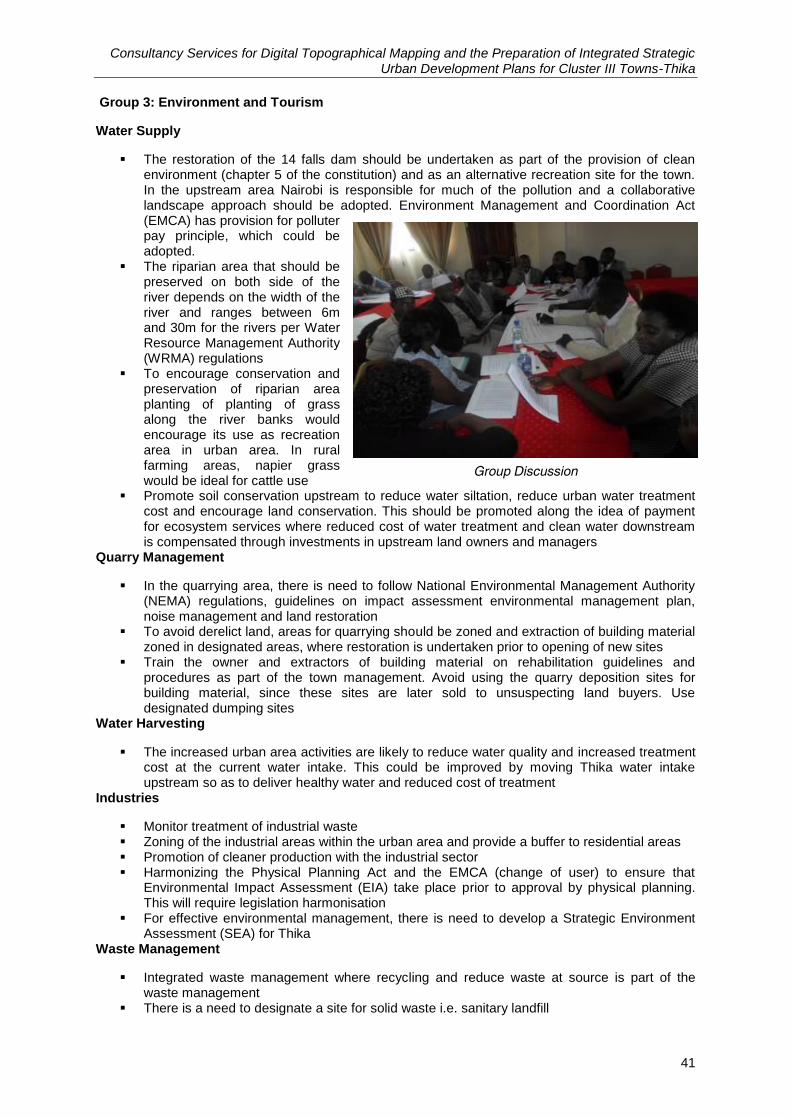
Consultancy Services for Digital Topographical Mapping and the Preparation of Integrated Strategic Urban Development Plans for Cluster III Towns-Thika
41
Group 3: Environment and Tourism
Water Supply
The restoration of the 14 falls dam should be undertaken as part of the provision of clean environment (chapter 5 of the constitution) and as an alternative recreation site for the town. In the upstream area Nairobi is responsible for much of the pollution and a collaborative landscape approach should be adopted. Environment Management and Coordination Act (EMCA) has provision for polluter pay principle, which could be adopted.
The riparian area that should be preserved on both side of the river depends on the width of the river and ranges between 6m and 30m for the rivers per Water Resource Management Authority (WRMA) regulations
To encourage conservation and preservation of riparian area planting of planting of grass along the river banks would encourage its use as recreation area in urban area. In rural farming areas, napier grass would be ideal for cattle use
Promote soil conservation upstream to reduce water siltation, reduce urban water treatment cost and encourage land conservation. This should be promoted along the idea of payment for ecosystem services where reduced cost of water treatment and clean water downstream is compensated through investments in upstream land owners and managers
Quarry Management
In the quarrying area, there is need to follow National Environmental Management Authority (NEMA) regulations, guidelines on impact assessment environmental management plan, noise management and land restoration
To avoid derelict land, areas for quarrying should be zoned and extraction of building material zoned in designated areas, where restoration is undertaken prior to opening of new sites
Train the owner and extractors of building material on rehabilitation guidelines and procedures as part of the town management. Avoid using the quarry deposition sites for building material, since these sites are later sold to unsuspecting land buyers. Use designated dumping sites
Water Harvesting
The increased urban area activities are likely to reduce water quality and increased treatment cost at the current water intake. This could be improved by moving Thika water intake upstream so as to deliver healthy water and reduced cost of treatment
Industries
Monitor treatment of industrial waste Zoning of the industrial areas within the urban area and provide a buffer to residential areas Promotion of cleaner production with the industrial sector Harmonizing the Physical Planning Act and the EMCA (change of user) to ensure that
Environmental Impact Assessment (EIA) take place prior to approval by physical planning. This will require legislation harmonisation
For effective environmental management, there is need to develop a Strategic Environment Assessment (SEA) for Thika
Waste Management
Integrated waste management where recycling and reduce waste at source is part of the waste management
There is a need to designate a site for solid waste i.e. sanitary landfill
Group Discussion
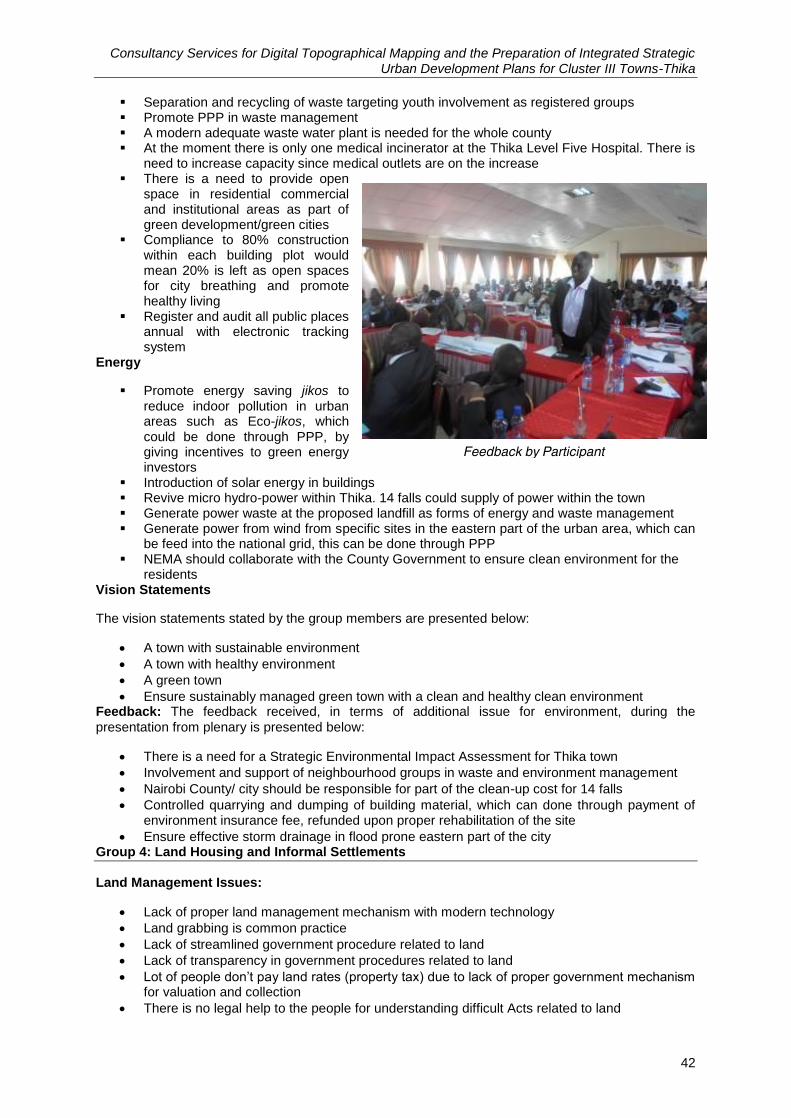
Consultancy Services for Digital Topographical Mapping and the Preparation of Integrated Strategic Urban Development Plans for Cluster III Towns-Thika
42
Separation and recycling of waste targeting youth involvement as registered groups Promote PPP in waste management A modern adequate waste water plant is needed for the whole county At the moment there is only one medical incinerator at the Thika Level Five Hospital. There is
need to increase capacity since medical outlets are on the increase There is a need to provide open
space in residential commercial and institutional areas as part of green development/green cities
Compliance to 80% construction within each building plot would mean 20% is left as open spaces for city breathing and promote healthy living
Register and audit all public places annual with electronic tracking system
Energy
Promote energy saving jikos to reduce indoor pollution in urban areas such as Eco-jikos, which could be done through PPP, by giving incentives to green energy investors
Introduction of solar energy in buildings Revive micro hydro-power within Thika. 14 falls could supply of power within the town Generate power waste at the proposed landfill as forms of energy and waste management Generate power from wind from specific sites in the eastern part of the urban area, which can
be feed into the national grid, this can be done through PPP NEMA should collaborate with the County Government to ensure clean environment for the
residents Vision Statements
The vision statements stated by the group members are presented below:
A town with sustainable environment
A town with healthy environment
A green town
Ensure sustainably managed green town with a clean and healthy clean environment Feedback: The feedback received, in terms of additional issue for environment, during the
presentation from plenary is presented below:
There is a need for a Strategic Environmental Impact Assessment for Thika town
Involvement and support of neighbourhood groups in waste and environment management
Nairobi County/ city should be responsible for part of the clean-up cost for 14 falls
Controlled quarrying and dumping of building material, which can done through payment of environment insurance fee, refunded upon proper rehabilitation of the site
Ensure effective storm drainage in flood prone eastern part of the city Group 4: Land Housing and Informal Settlements
Land Management Issues:
Lack of proper land management mechanism with modern technology
Land grabbing is common practice
Lack of streamlined government procedure related to land
Lack of transparency in government procedures related to land
Lot of people don‟t pay land rates (property tax) due to lack of proper government mechanism for valuation and collection
There is no legal help to the people for understanding difficult Acts related to land
Feedback by Participant
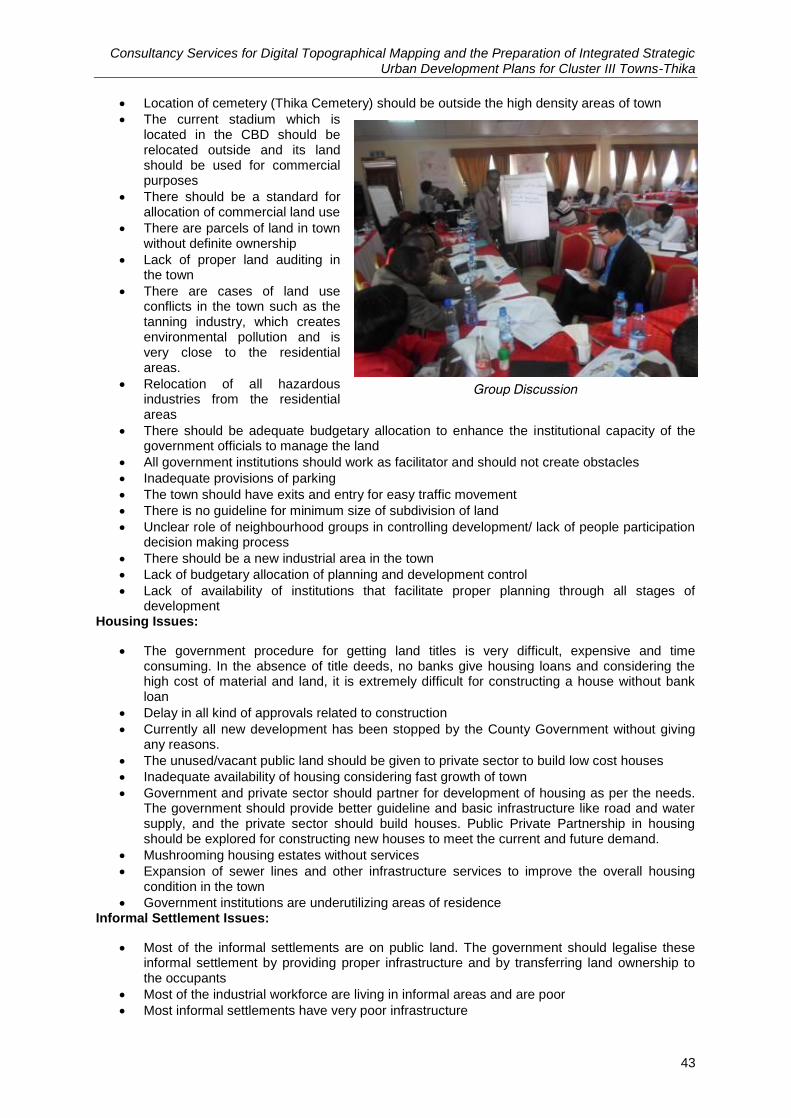
Consultancy Services for Digital Topographical Mapping and the Preparation of Integrated Strategic Urban Development Plans for Cluster III Towns-Thika
43
Location of cemetery (Thika Cemetery) should be outside the high density areas of town
The current stadium which is located in the CBD should be relocated outside and its land should be used for commercial purposes
There should be a standard for allocation of commercial land use
There are parcels of land in town without definite ownership
Lack of proper land auditing in the town
There are cases of land use conflicts in the town such as the tanning industry, which creates environmental pollution and is very close to the residential areas.
Relocation of all hazardous industries from the residential areas
There should be adequate budgetary allocation to enhance the institutional capacity of the government officials to manage the land
All government institutions should work as facilitator and should not create obstacles
Inadequate provisions of parking
The town should have exits and entry for easy traffic movement
There is no guideline for minimum size of subdivision of land
Unclear role of neighbourhood groups in controlling development/ lack of people participation decision making process
There should be a new industrial area in the town
Lack of budgetary allocation of planning and development control
Lack of availability of institutions that facilitate proper planning through all stages of development
Housing Issues:
The government procedure for getting land titles is very difficult, expensive and time consuming. In the absence of title deeds, no banks give housing loans and considering the high cost of material and land, it is extremely difficult for constructing a house without bank loan
Delay in all kind of approvals related to construction
Currently all new development has been stopped by the County Government without giving any reasons.
The unused/vacant public land should be given to private sector to build low cost houses
Inadequate availability of housing considering fast growth of town
Government and private sector should partner for development of housing as per the needs. The government should provide better guideline and basic infrastructure like road and water supply, and the private sector should build houses. Public Private Partnership in housing should be explored for constructing new houses to meet the current and future demand.
Mushrooming housing estates without services
Expansion of sewer lines and other infrastructure services to improve the overall housing condition in the town
Government institutions are underutilizing areas of residence Informal Settlement Issues:
Most of the informal settlements are on public land. The government should legalise these informal settlement by providing proper infrastructure and by transferring land ownership to the occupants
Most of the industrial workforce are living in informal areas and are poor
Most informal settlements have very poor infrastructure
Group Discussion
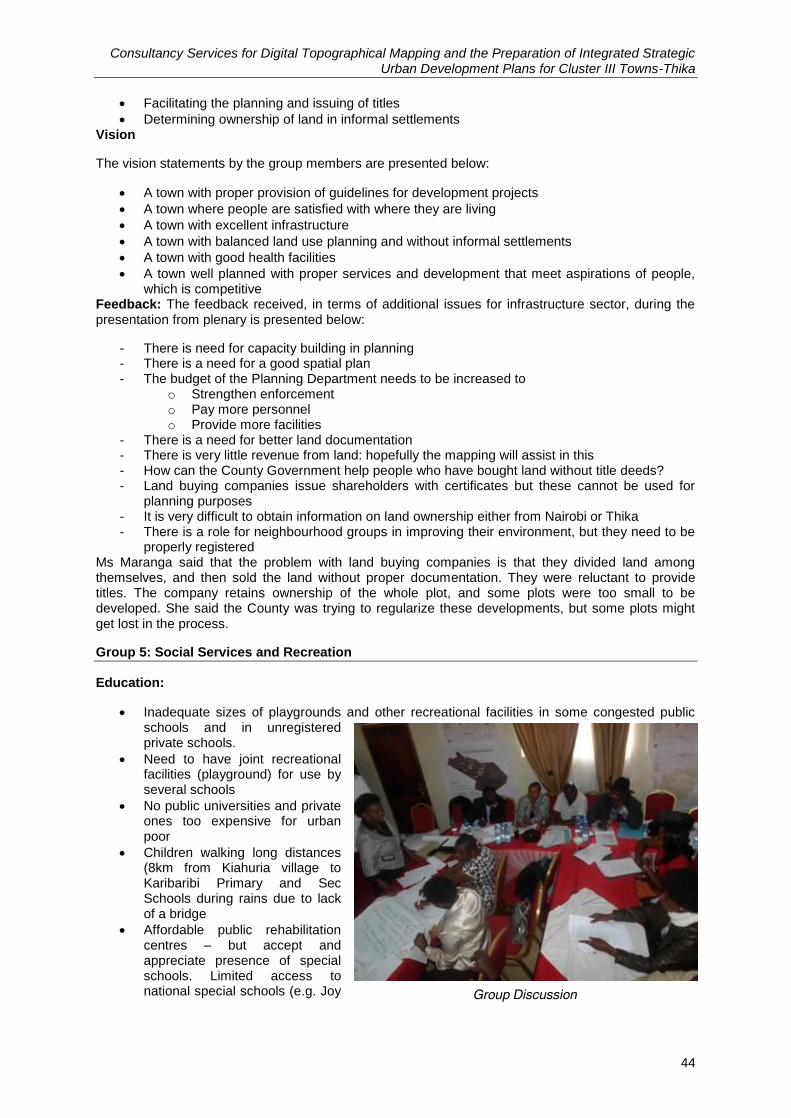
Consultancy Services for Digital Topographical Mapping and the Preparation of Integrated Strategic Urban Development Plans for Cluster III Towns-Thika
44
Facilitating the planning and issuing of titles
Determining ownership of land in informal settlements Vision
The vision statements by the group members are presented below:
A town with proper provision of guidelines for development projects
A town where people are satisfied with where they are living
A town with excellent infrastructure
A town with balanced land use planning and without informal settlements
A town with good health facilities
A town well planned with proper services and development that meet aspirations of people, which is competitive
Feedback: The feedback received, in terms of additional issues for infrastructure sector, during the presentation from plenary is presented below:
- There is need for capacity building in planning - There is a need for a good spatial plan - The budget of the Planning Department needs to be increased to
o Strengthen enforcement o Pay more personnel o Provide more facilities
- There is a need for better land documentation - There is very little revenue from land: hopefully the mapping will assist in this - How can the County Government help people who have bought land without title deeds? - Land buying companies issue shareholders with certificates but these cannot be used for
planning purposes - It is very difficult to obtain information on land ownership either from Nairobi or Thika - There is a role for neighbourhood groups in improving their environment, but they need to be
properly registered Ms Maranga said that the problem with land buying companies is that they divided land among themselves, and then sold the land without proper documentation. They were reluctant to provide titles. The company retains ownership of the whole plot, and some plots were too small to be developed. She said the County was trying to regularize these developments, but some plots might get lost in the process.
Group 5: Social Services and Recreation
Education:
Inadequate sizes of playgrounds and other recreational facilities in some congested public schools and in unregistered private schools.
Need to have joint recreational facilities (playground) for use by several schools
No public universities and private ones too expensive for urban poor
Children walking long distances (8km from Kiahuria village to Karibaribi Primary and Sec Schools during rains due to lack of a bridge
Affordable public rehabilitation centres – but accept and appreciate presence of special schools. Limited access to national special schools (e.g. Joy Group Discussion
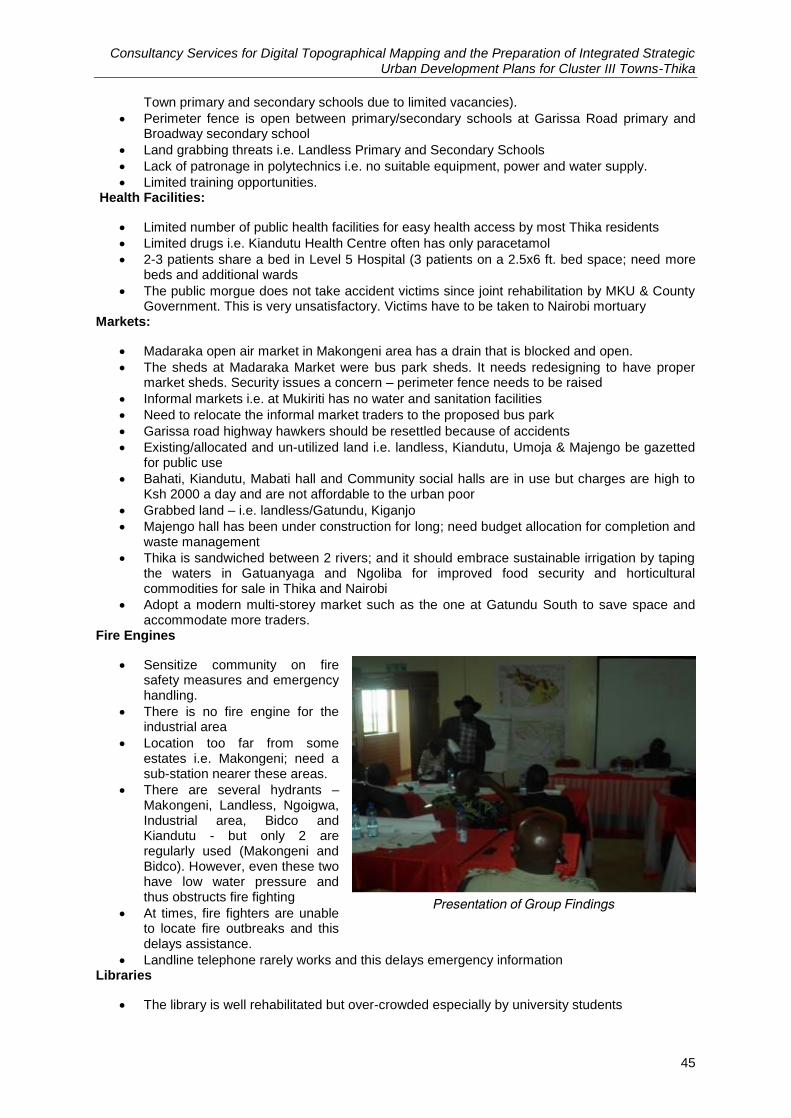
Consultancy Services for Digital Topographical Mapping and the Preparation of Integrated Strategic Urban Development Plans for Cluster III Towns-Thika
45
Town primary and secondary schools due to limited vacancies).
Perimeter fence is open between primary/secondary schools at Garissa Road primary and Broadway secondary school
Land grabbing threats i.e. Landless Primary and Secondary Schools
Lack of patronage in polytechnics i.e. no suitable equipment, power and water supply.
Limited training opportunities. Health Facilities:
Limited number of public health facilities for easy health access by most Thika residents
Limited drugs i.e. Kiandutu Health Centre often has only paracetamol
2-3 patients share a bed in Level 5 Hospital (3 patients on a 2.5x6 ft. bed space; need more beds and additional wards
The public morgue does not take accident victims since joint rehabilitation by MKU & County Government. This is very unsatisfactory. Victims have to be taken to Nairobi mortuary
Markets:
Madaraka open air market in Makongeni area has a drain that is blocked and open.
The sheds at Madaraka Market were bus park sheds. It needs redesigning to have proper market sheds. Security issues a concern – perimeter fence needs to be raised
Informal markets i.e. at Mukiriti has no water and sanitation facilities
Need to relocate the informal market traders to the proposed bus park
Garissa road highway hawkers should be resettled because of accidents
Existing/allocated and un-utilized land i.e. landless, Kiandutu, Umoja & Majengo be gazetted for public use
Bahati, Kiandutu, Mabati hall and Community social halls are in use but charges are high to Ksh 2000 a day and are not affordable to the urban poor
Grabbed land – i.e. landless/Gatundu, Kiganjo
Majengo hall has been under construction for long; need budget allocation for completion and waste management
Thika is sandwiched between 2 rivers; and it should embrace sustainable irrigation by taping the waters in Gatuanyaga and Ngoliba for improved food security and horticultural commodities for sale in Thika and Nairobi
Adopt a modern multi-storey market such as the one at Gatundu South to save space and accommodate more traders.
Fire Engines
Sensitize community on fire safety measures and emergency handling.
There is no fire engine for the industrial area
Location too far from some estates i.e. Makongeni; need a sub-station nearer these areas.
There are several hydrants – Makongeni, Landless, Ngoigwa, Industrial area, Bidco and Kiandutu - but only 2 are regularly used (Makongeni and Bidco). However, even these two have low water pressure and thus obstructs fire fighting
At times, fire fighters are unable to locate fire outbreaks and this delays assistance.
Landline telephone rarely works and this delays emergency information Libraries
The library is well rehabilitated but over-crowded especially by university students
Presentation of Group Findings
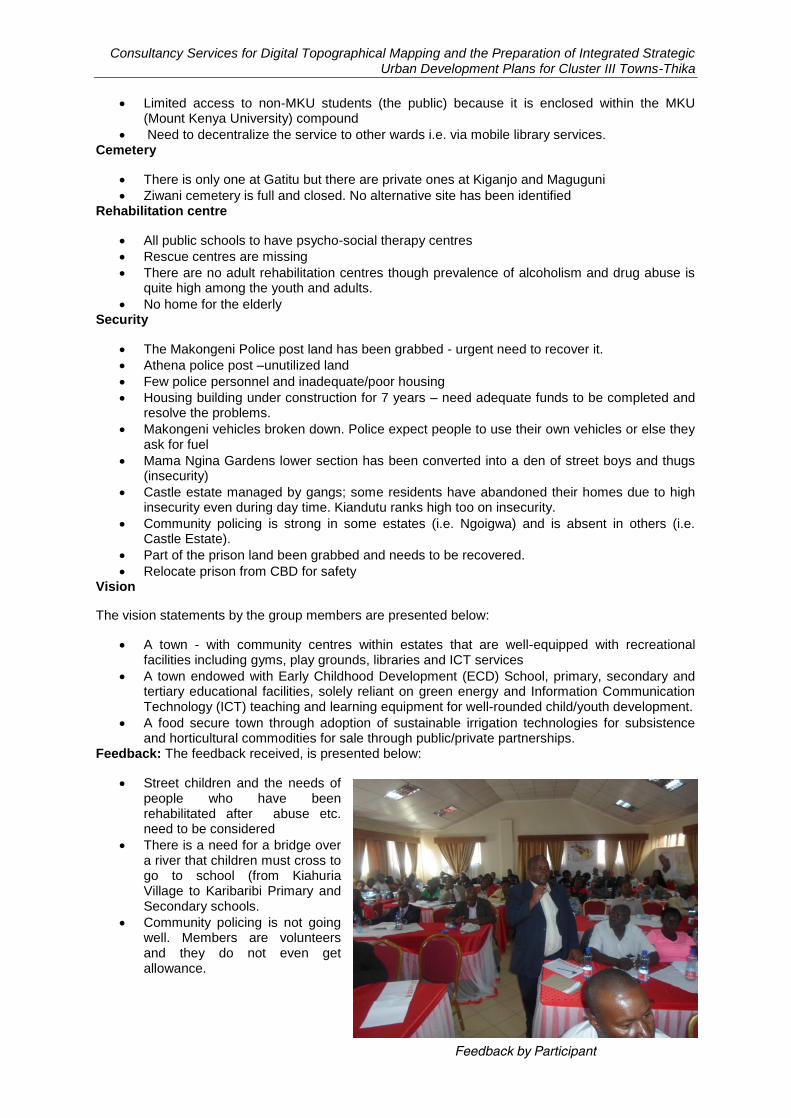
Consultancy Services for Digital Topographical Mapping and the Preparation of Integrated Strategic Urban Development Plans for Cluster III Towns-Thika
46
Limited access to non-MKU students (the public) because it is enclosed within the MKU (Mount Kenya University) compound
Need to decentralize the service to other wards i.e. via mobile library services. Cemetery
There is only one at Gatitu but there are private ones at Kiganjo and Maguguni
Ziwani cemetery is full and closed. No alternative site has been identified Rehabilitation centre
All public schools to have psycho-social therapy centres
Rescue centres are missing
There are no adult rehabilitation centres though prevalence of alcoholism and drug abuse is quite high among the youth and adults.
No home for the elderly Security
The Makongeni Police post land has been grabbed - urgent need to recover it.
Athena police post –unutilized land
Few police personnel and inadequate/poor housing
Housing building under construction for 7 years – need adequate funds to be completed and resolve the problems.
Makongeni vehicles broken down. Police expect people to use their own vehicles or else they ask for fuel
Mama Ngina Gardens lower section has been converted into a den of street boys and thugs (insecurity)
Castle estate managed by gangs; some residents have abandoned their homes due to high insecurity even during day time. Kiandutu ranks high too on insecurity.
Community policing is strong in some estates (i.e. Ngoigwa) and is absent in others (i.e. Castle Estate).
Part of the prison land been grabbed and needs to be recovered.
Relocate prison from CBD for safety Vision
The vision statements by the group members are presented below:
A town - with community centres within estates that are well-equipped with recreational facilities including gyms, play grounds, libraries and ICT services
A town endowed with Early Childhood Development (ECD) School, primary, secondary and tertiary educational facilities, solely reliant on green energy and Information Communication Technology (ICT) teaching and learning equipment for well-rounded child/youth development.
A food secure town through adoption of sustainable irrigation technologies for subsistence and horticultural commodities for sale through public/private partnerships.
Feedback: The feedback received, is presented below:
Street children and the needs of people who have been rehabilitated after abuse etc. need to be considered
There is a need for a bridge over a river that children must cross to go to school (from Kiahuria Village to Karibaribi Primary and Secondary schools.
Community policing is not going well. Members are volunteers and they do not even get allowance.
Feedback by Participant
Consultancy Services for Digital Topographical Mapping and the Preparation of Integrated Strategic Urban Development Plans for Cluster III Towns-Thika
47
There is a need for street names in residential areas (marking of streets and estates)
The Garissa Road flyover is used by pedestrians, as there are no foot paths or foot bridge provided.
The cemetery is in an awkward place at the entrance of Thika town– it should be located outside the town.
Not enough hydrants are provided for the fire service.
Need for a fire station hotline number which should be publicised through social media for easier relaying of fire outbreaks information.
4.5 Closing remarks Mr Martin, speaking on behalf of the consultants, said that the consultants would present their preliminary plans at the next workshop, and give options for the participants to consider. This would be followed by a workshop to discuss the Capital Investment Plans, and at the end of the project they would present the final plans.
- The workshop ended at 4.15 p.m. 4.6 Vision Formulation: The consultants have compiled all the vision statements stated by various participants during the group discussion and also considered the various critical issues and challenges of the town; and formulated the following city vision:
Thika Vision 2035
“Thika to be developed as an industrial hub of Kenya that is environmentally and economically sustainable; a town that provide adequate and affordable modern infrastructure facilities along with security, good health, inclusiveness, transparency and affordable quality education; a town that involves its citizen in decision making process; a town that is globally competitive and provides better
present and bright future to its all citizens.”
4.7 Listing of sectors for development The sectors have been listed based on the stakeholder consultations in the form of one-one interviews, focused group discussion and workshops. After analyzing all the consultation with various stakeholders, the Consultants have listed the following sector for development interventions:
Ease of Governance/ Good Governance
Urban Planning and Growth Management/ Planned Development
Sewerage System
Recreational and Open Spaces
Industrial Development
Sustainable Urban Finance
Transportation system
Storm Water Drainage
Solid Waste Management
Security
Street Light
Environmental Conservation
Water Supply
Housing/Basic Services for Urban Poor
Community Facilities
Tourism and Heritage The priority and ranking of various sectors for development as mentioned above shall be discussed with key stakeholders and finalised.
Consultancy Services for Digital Topographical Mapping and the Preparation of Integrated Strategic Urban Development Plans for Cluster III Towns-Thika
48
Annexure 5
Validation workshop report for the Draft ISUDP
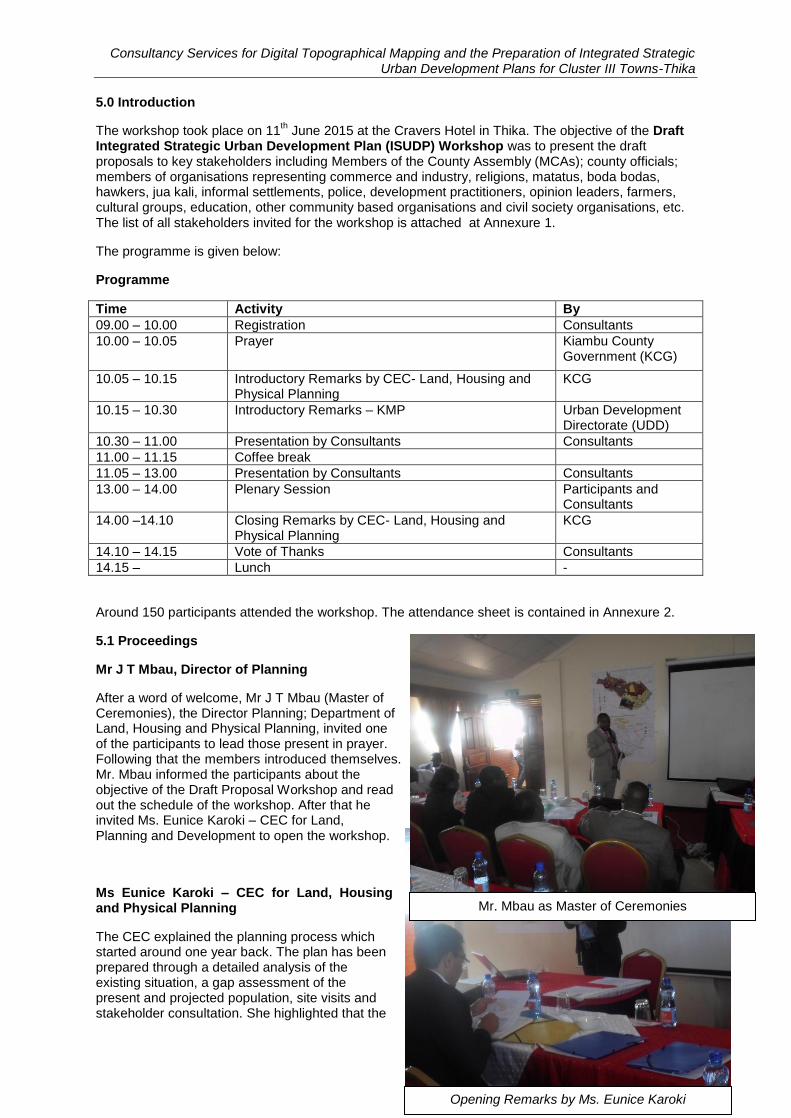
Consultancy Services for Digital Topographical Mapping and the Preparation of Integrated Strategic Urban Development Plans for Cluster III Towns-Thika
49
5.0 Introduction
The workshop took place on 11th June 2015 at the Cravers Hotel in Thika. The objective of the Draft
Integrated Strategic Urban Development Plan (ISUDP) Workshop was to present the draft proposals to key stakeholders including Members of the County Assembly (MCAs); county officials; members of organisations representing commerce and industry, religions, matatus, boda bodas, hawkers, jua kali, informal settlements, police, development practitioners, opinion leaders, farmers, cultural groups, education, other community based organisations and civil society organisations, etc. The list of all stakeholders invited for the workshop is attached at Annexure 1.
The programme is given below:
Programme
Time Activity By
09.00 – 10.00 Registration Consultants
10.00 – 10.05 Prayer Kiambu County Government (KCG)
10.05 – 10.15 Introductory Remarks by CEC- Land, Housing and Physical Planning
KCG
10.15 – 10.30 Introductory Remarks – KMP Urban Development Directorate (UDD)
10.30 – 11.00 Presentation by Consultants Consultants
11.00 – 11.15 Coffee break
11.05 – 13.00 Presentation by Consultants Consultants
13.00 – 14.00 Plenary Session Participants and Consultants
14.00 –14.10 Closing Remarks by CEC- Land, Housing and Physical Planning
KCG
14.10 – 14.15 Vote of Thanks Consultants
14.15 – Lunch -
Around 150 participants attended the workshop. The attendance sheet is contained in Annexure 2.
5.1 Proceedings
Mr J T Mbau, Director of Planning
After a word of welcome, Mr J T Mbau (Master of Ceremonies), the Director Planning; Department of Land, Housing and Physical Planning, invited one of the participants to lead those present in prayer. Following that the members introduced themselves. Mr. Mbau informed the participants about the objective of the Draft Proposal Workshop and read out the schedule of the workshop. After that he invited Ms. Eunice Karoki – CEC for Land, Planning and Development to open the workshop.
Ms Eunice Karoki – CEC for Land, Housing and Physical Planning
The CEC explained the planning process which started around one year back. The plan has been prepared through a detailed analysis of the existing situation, a gap assessment of the present and projected population, site visits and stakeholder consultation. She highlighted that the
Opening Remarks by Ms. Eunice Karoki
Mr. Mbau as Master of Ceremonies
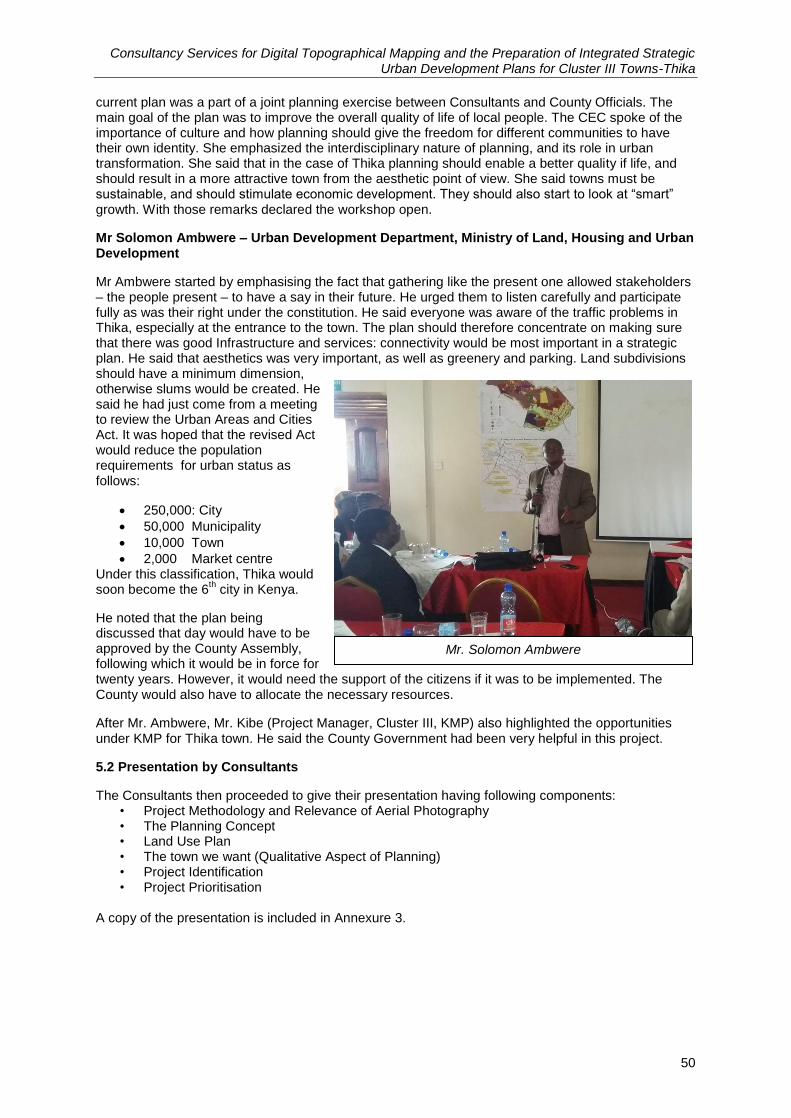
Consultancy Services for Digital Topographical Mapping and the Preparation of Integrated Strategic Urban Development Plans for Cluster III Towns-Thika
50
current plan was a part of a joint planning exercise between Consultants and County Officials. The main goal of the plan was to improve the overall quality of life of local people. The CEC spoke of the importance of culture and how planning should give the freedom for different communities to have their own identity. She emphasized the interdisciplinary nature of planning, and its role in urban transformation. She said that in the case of Thika planning should enable a better quality if life, and should result in a more attractive town from the aesthetic point of view. She said towns must be sustainable, and should stimulate economic development. They should also start to look at “smart” growth. With those remarks declared the workshop open.
Mr Solomon Ambwere – Urban Development Department, Ministry of Land, Housing and Urban Development
Mr Ambwere started by emphasising the fact that gathering like the present one allowed stakeholders – the people present – to have a say in their future. He urged them to listen carefully and participate fully as was their right under the constitution. He said everyone was aware of the traffic problems in Thika, especially at the entrance to the town. The plan should therefore concentrate on making sure that there was good Infrastructure and services: connectivity would be most important in a strategic plan. He said that aesthetics was very important, as well as greenery and parking. Land subdivisions should have a minimum dimension, otherwise slums would be created. He said he had just come from a meeting to review the Urban Areas and Cities Act. It was hoped that the revised Act would reduce the population requirements for urban status as follows:
250,000: City
50,000 Municipality
10,000 Town
2,000 Market centre Under this classification, Thika would soon become the 6
th city in Kenya.
He noted that the plan being discussed that day would have to be approved by the County Assembly, following which it would be in force for twenty years. However, it would need the support of the citizens if it was to be implemented. The County would also have to allocate the necessary resources.
After Mr. Ambwere, Mr. Kibe (Project Manager, Cluster III, KMP) also highlighted the opportunities under KMP for Thika town. He said the County Government had been very helpful in this project.
5.2 Presentation by Consultants
The Consultants then proceeded to give their presentation having following components: • Project Methodology and Relevance of Aerial Photography • The Planning Concept • Land Use Plan • The town we want (Qualitative Aspect of Planning) • Project Identification • Project Prioritisation
A copy of the presentation is included in Annexure 3.
Mr. Solomon Ambwere
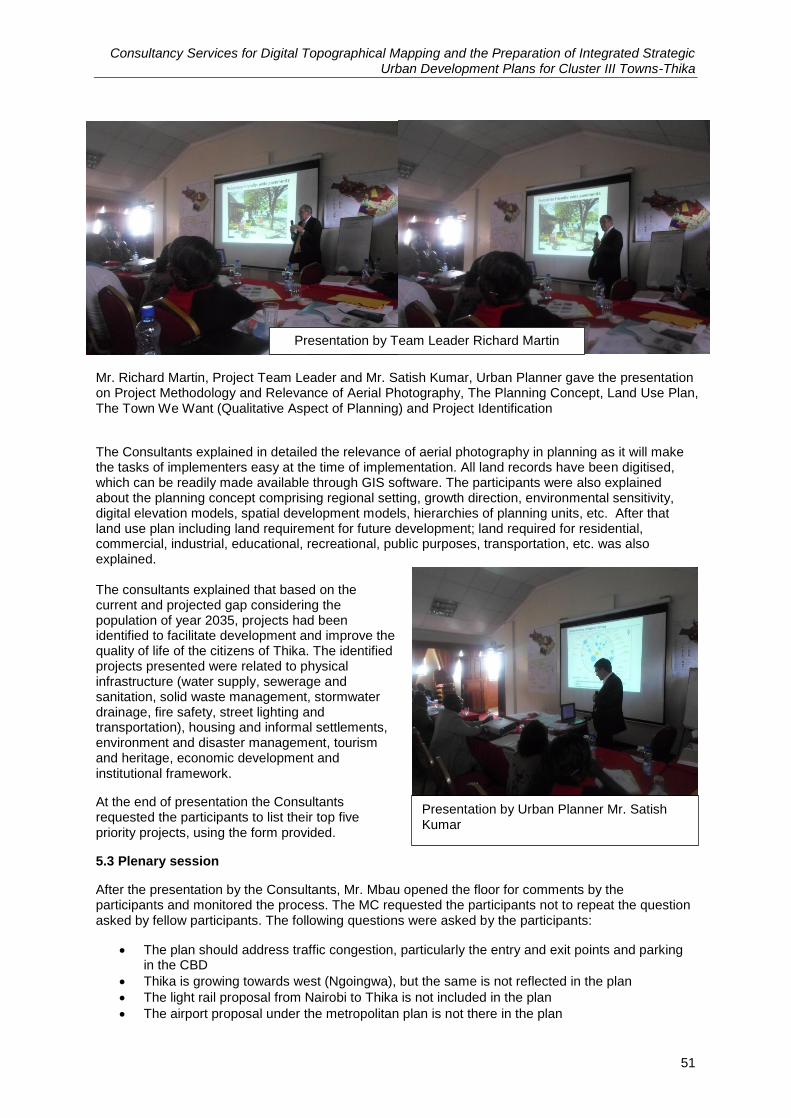
Consultancy Services for Digital Topographical Mapping and the Preparation of Integrated Strategic Urban Development Plans for Cluster III Towns-Thika
51
Presentation by Urban Planner Mr. Satish Kumar
Mr. Richard Martin, Project Team Leader and Mr. Satish Kumar, Urban Planner gave the presentation on Project Methodology and Relevance of Aerial Photography, The Planning Concept, Land Use Plan, The Town We Want (Qualitative Aspect of Planning) and Project Identification
The Consultants explained in detailed the relevance of aerial photography in planning as it will make the tasks of implementers easy at the time of implementation. All land records have been digitised, which can be readily made available through GIS software. The participants were also explained about the planning concept comprising regional setting, growth direction, environmental sensitivity, digital elevation models, spatial development models, hierarchies of planning units, etc. After that land use plan including land requirement for future development; land required for residential, commercial, industrial, educational, recreational, public purposes, transportation, etc. was also explained. The consultants explained that based on the current and projected gap considering the population of year 2035, projects had been identified to facilitate development and improve the quality of life of the citizens of Thika. The identified projects presented were related to physical infrastructure (water supply, sewerage and sanitation, solid waste management, stormwater drainage, fire safety, street lighting and transportation), housing and informal settlements, environment and disaster management, tourism and heritage, economic development and institutional framework.
At the end of presentation the Consultants requested the participants to list their top five priority projects, using the form provided.
5.3 Plenary session
After the presentation by the Consultants, Mr. Mbau opened the floor for comments by the participants and monitored the process. The MC requested the participants not to repeat the question asked by fellow participants. The following questions were asked by the participants:
The plan should address traffic congestion, particularly the entry and exit points and parking in the CBD
Thika is growing towards west (Ngoingwa), but the same is not reflected in the plan
The light rail proposal from Nairobi to Thika is not included in the plan
The airport proposal under the metropolitan plan is not there in the plan
Presentation by Team Leader Richard Martin
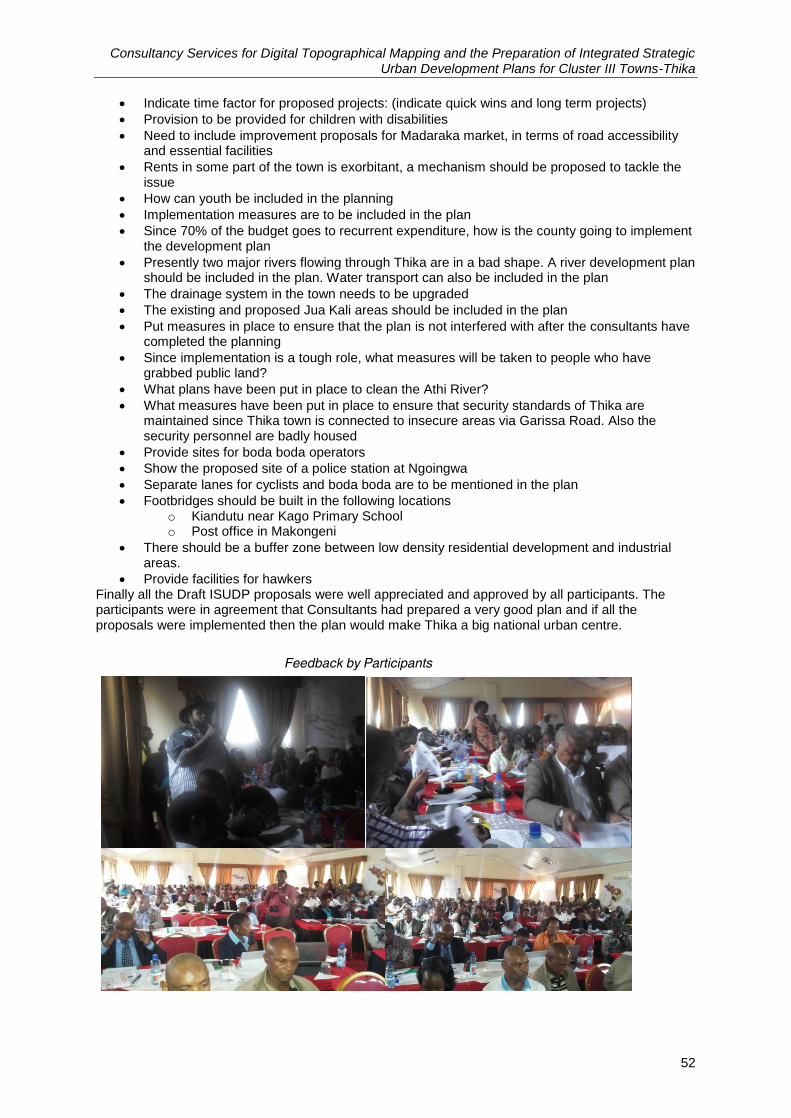
Consultancy Services for Digital Topographical Mapping and the Preparation of Integrated Strategic Urban Development Plans for Cluster III Towns-Thika
52
Indicate time factor for proposed projects: (indicate quick wins and long term projects)
Provision to be provided for children with disabilities
Need to include improvement proposals for Madaraka market, in terms of road accessibility and essential facilities
Rents in some part of the town is exorbitant, a mechanism should be proposed to tackle the issue
How can youth be included in the planning
Implementation measures are to be included in the plan
Since 70% of the budget goes to recurrent expenditure, how is the county going to implement the development plan
Presently two major rivers flowing through Thika are in a bad shape. A river development plan should be included in the plan. Water transport can also be included in the plan
The drainage system in the town needs to be upgraded
The existing and proposed Jua Kali areas should be included in the plan
Put measures in place to ensure that the plan is not interfered with after the consultants have completed the planning
Since implementation is a tough role, what measures will be taken to people who have grabbed public land?
What plans have been put in place to clean the Athi River?
What measures have been put in place to ensure that security standards of Thika are maintained since Thika town is connected to insecure areas via Garissa Road. Also the security personnel are badly housed
Provide sites for boda boda operators
Show the proposed site of a police station at Ngoingwa
Separate lanes for cyclists and boda boda are to be mentioned in the plan
Footbridges should be built in the following locations o Kiandutu near Kago Primary School o Post office in Makongeni
There should be a buffer zone between low density residential development and industrial areas.
Provide facilities for hawkers Finally all the Draft ISUDP proposals were well appreciated and approved by all participants. The participants were in agreement that Consultants had prepared a very good plan and if all the proposals were implemented then the plan would make Thika a big national urban centre.
Feedback by Participants
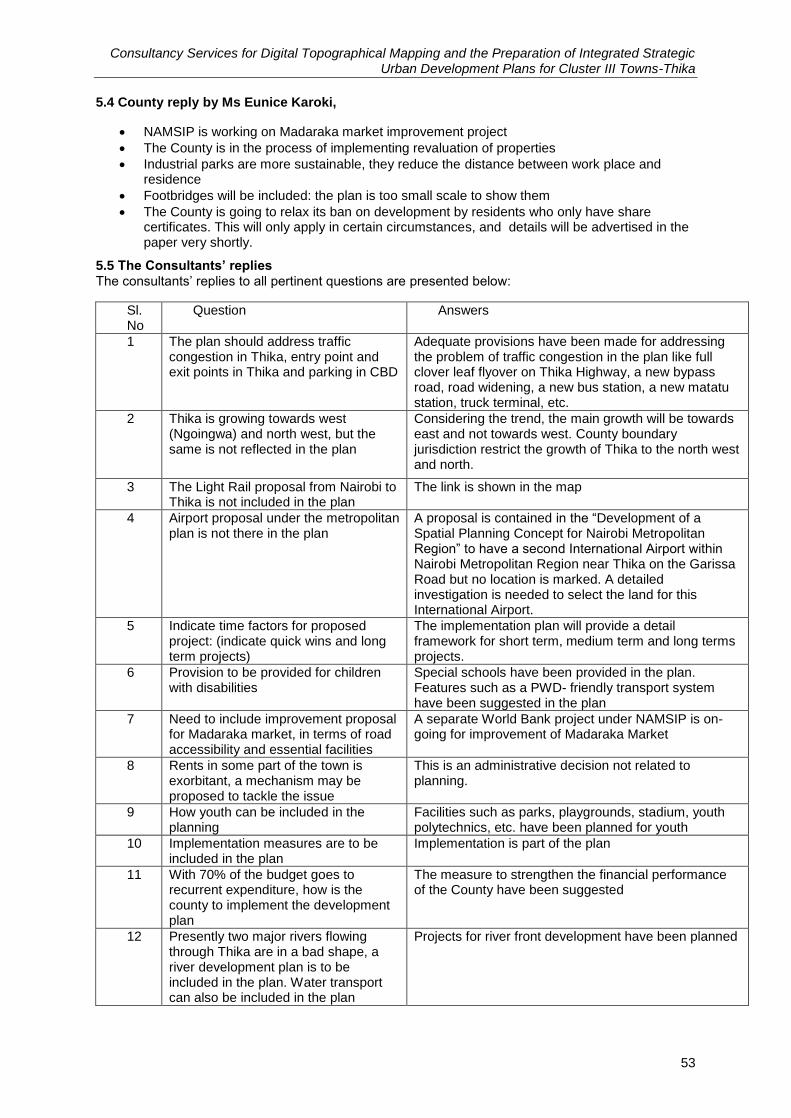
Consultancy Services for Digital Topographical Mapping and the Preparation of Integrated Strategic Urban Development Plans for Cluster III Towns-Thika
53
5.4 County reply by Ms Eunice Karoki,
NAMSIP is working on Madaraka market improvement project
The County is in the process of implementing revaluation of properties
Industrial parks are more sustainable, they reduce the distance between work place and residence
Footbridges will be included: the plan is too small scale to show them
The County is going to relax its ban on development by residents who only have share certificates. This will only apply in certain circumstances, and details will be advertised in the paper very shortly.
5.5 The Consultants’ replies
The consultants‟ replies to all pertinent questions are presented below:
Sl. No
Question Answers
1 The plan should address traffic congestion in Thika, entry point and exit points in Thika and parking in CBD
Adequate provisions have been made for addressing the problem of traffic congestion in the plan like full clover leaf flyover on Thika Highway, a new bypass road, road widening, a new bus station, a new matatu station, truck terminal, etc.
2 Thika is growing towards west (Ngoingwa) and north west, but the same is not reflected in the plan
Considering the trend, the main growth will be towards east and not towards west. County boundary jurisdiction restrict the growth of Thika to the north west and north.
3 The Light Rail proposal from Nairobi to Thika is not included in the plan
The link is shown in the map
4 Airport proposal under the metropolitan plan is not there in the plan
A proposal is contained in the “Development of a Spatial Planning Concept for Nairobi Metropolitan Region” to have a second International Airport within Nairobi Metropolitan Region near Thika on the Garissa Road but no location is marked. A detailed investigation is needed to select the land for this International Airport.
5 Indicate time factors for proposed project: (indicate quick wins and long term projects)
The implementation plan will provide a detail framework for short term, medium term and long terms projects.
6 Provision to be provided for children with disabilities
Special schools have been provided in the plan. Features such as a PWD- friendly transport system have been suggested in the plan
7 Need to include improvement proposal for Madaraka market, in terms of road accessibility and essential facilities
A separate World Bank project under NAMSIP is on-going for improvement of Madaraka Market
8 Rents in some part of the town is exorbitant, a mechanism may be proposed to tackle the issue
This is an administrative decision not related to planning.
9 How youth can be included in the planning
Facilities such as parks, playgrounds, stadium, youth polytechnics, etc. have been planned for youth
10 Implementation measures are to be included in the plan
Implementation is part of the plan
11 With 70% of the budget goes to recurrent expenditure, how is the county to implement the development plan
The measure to strengthen the financial performance of the County have been suggested
12 Presently two major rivers flowing through Thika are in a bad shape, a river development plan is to be included in the plan. Water transport can also be included in the plan
Projects for river front development have been planned
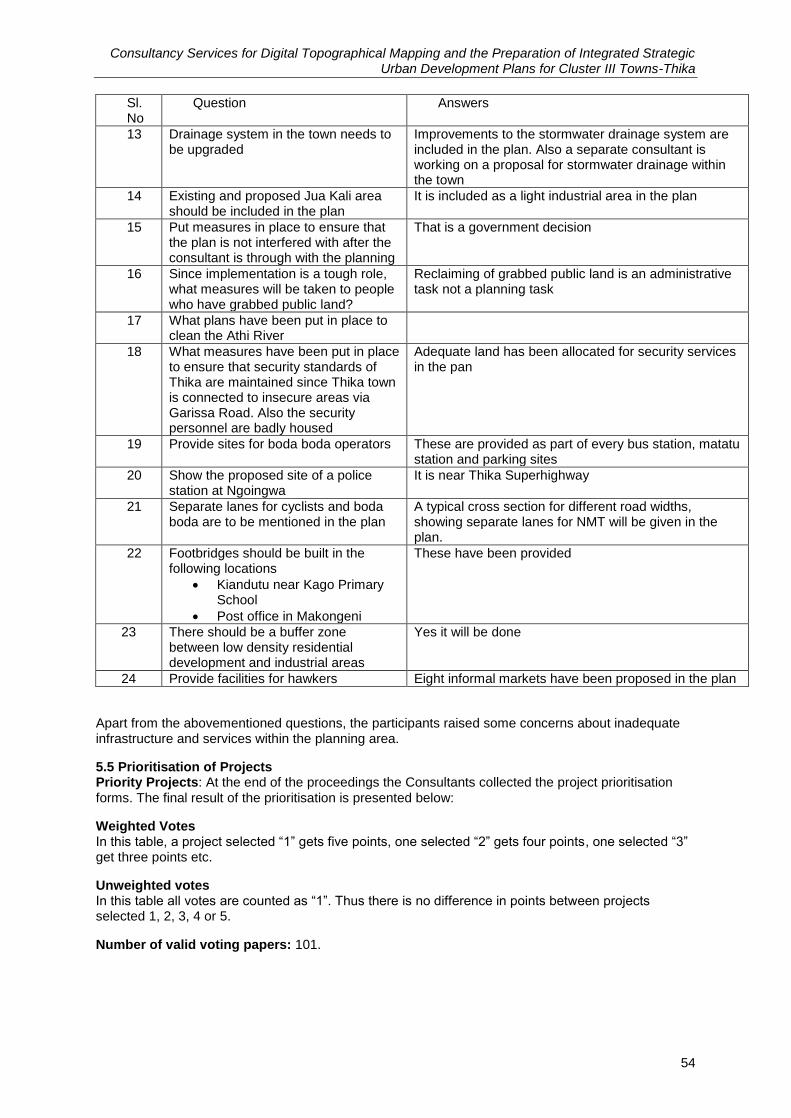
Consultancy Services for Digital Topographical Mapping and the Preparation of Integrated Strategic Urban Development Plans for Cluster III Towns-Thika
54
Sl. No
Question Answers
13 Drainage system in the town needs to be upgraded
Improvements to the stormwater drainage system are included in the plan. Also a separate consultant is working on a proposal for stormwater drainage within the town
14 Existing and proposed Jua Kali area should be included in the plan
It is included as a light industrial area in the plan
15 Put measures in place to ensure that the plan is not interfered with after the consultant is through with the planning
That is a government decision
16 Since implementation is a tough role, what measures will be taken to people who have grabbed public land?
Reclaiming of grabbed public land is an administrative task not a planning task
17 What plans have been put in place to clean the Athi River
18 What measures have been put in place to ensure that security standards of Thika are maintained since Thika town is connected to insecure areas via Garissa Road. Also the security personnel are badly housed
Adequate land has been allocated for security services in the pan
19 Provide sites for boda boda operators These are provided as part of every bus station, matatu station and parking sites
20 Show the proposed site of a police station at Ngoingwa
It is near Thika Superhighway
21 Separate lanes for cyclists and boda boda are to be mentioned in the plan
A typical cross section for different road widths, showing separate lanes for NMT will be given in the plan.
22 Footbridges should be built in the following locations
Kiandutu near Kago Primary School
Post office in Makongeni
These have been provided
23 There should be a buffer zone between low density residential development and industrial areas
Yes it will be done
24 Provide facilities for hawkers Eight informal markets have been proposed in the plan
Apart from the abovementioned questions, the participants raised some concerns about inadequate infrastructure and services within the planning area.
5.5 Prioritisation of Projects Priority Projects: At the end of the proceedings the Consultants collected the project prioritisation
forms. The final result of the prioritisation is presented below:
Weighted Votes In this table, a project selected “1” gets five points, one selected “2” gets four points, one selected “3” get three points etc.
Unweighted votes In this table all votes are counted as “1”. Thus there is no difference in points between projects selected 1, 2, 3, 4 or 5.
Number of valid voting papers: 101.
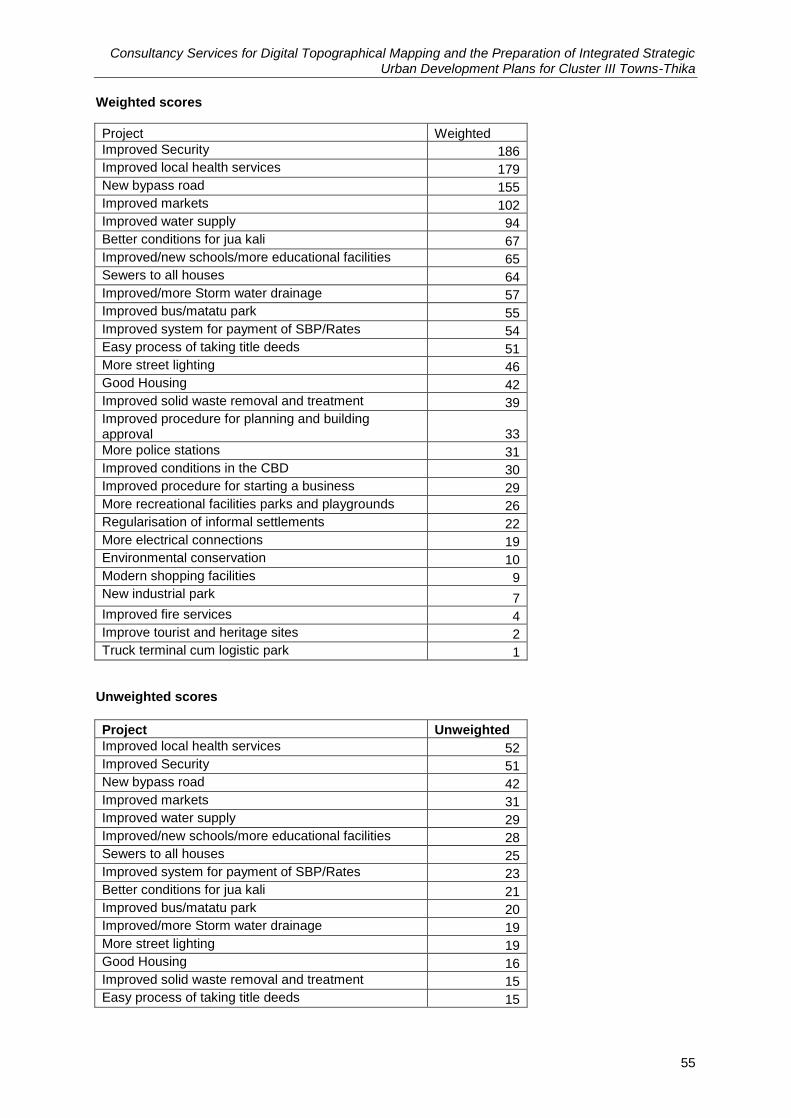
Consultancy Services for Digital Topographical Mapping and the Preparation of Integrated Strategic Urban Development Plans for Cluster III Towns-Thika
55
Weighted scores
Project Weighted
Improved Security 186
Improved local health services 179
New bypass road 155
Improved markets 102
Improved water supply 94
Better conditions for jua kali 67
Improved/new schools/more educational facilities 65
Sewers to all houses 64
Improved/more Storm water drainage 57
Improved bus/matatu park 55
Improved system for payment of SBP/Rates 54
Easy process of taking title deeds 51
More street lighting 46
Good Housing 42
Improved solid waste removal and treatment 39
Improved procedure for planning and building approval 33
More police stations 31
Improved conditions in the CBD 30
Improved procedure for starting a business 29
More recreational facilities parks and playgrounds 26
Regularisation of informal settlements 22
More electrical connections 19
Environmental conservation 10
Modern shopping facilities 9
New industrial park 7
Improved fire services 4
Improve tourist and heritage sites 2
Truck terminal cum logistic park 1
Unweighted scores
Project Unweighted
Improved local health services 52
Improved Security 51
New bypass road 42
Improved markets 31
Improved water supply 29
Improved/new schools/more educational facilities 28
Sewers to all houses 25
Improved system for payment of SBP/Rates 23
Better conditions for jua kali 21
Improved bus/matatu park 20
Improved/more Storm water drainage 19
More street lighting 19
Good Housing 16
Improved solid waste removal and treatment 15
Easy process of taking title deeds 15
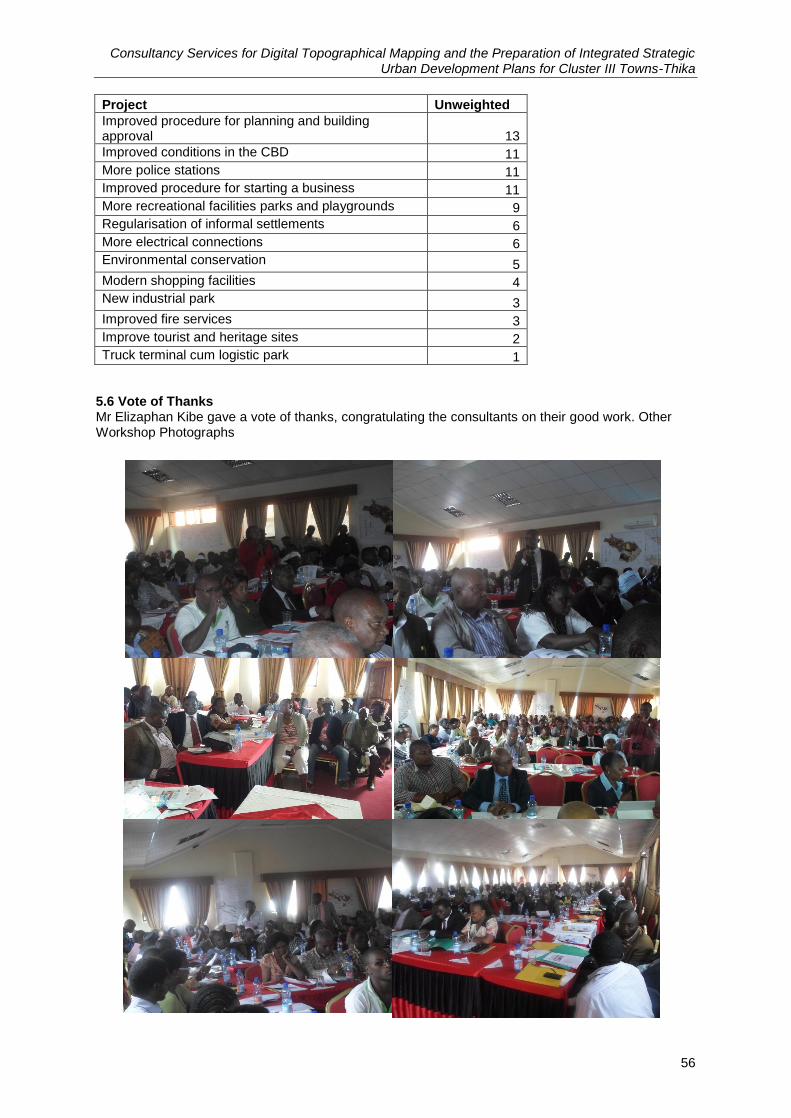
Consultancy Services for Digital Topographical Mapping and the Preparation of Integrated Strategic Urban Development Plans for Cluster III Towns-Thika
56
Project Unweighted
Improved procedure for planning and building approval 13
Improved conditions in the CBD 11
More police stations 11
Improved procedure for starting a business 11
More recreational facilities parks and playgrounds 9
Regularisation of informal settlements 6
More electrical connections 6
Environmental conservation 5
Modern shopping facilities 4
New industrial park 3
Improved fire services 3
Improve tourist and heritage sites 2
Truck terminal cum logistic park 1
5.6 Vote of Thanks Mr Elizaphan Kibe gave a vote of thanks, congratulating the consultants on their good work. Other Workshop Photographs
Consultancy Services for Digital Topographical Mapping and the Preparation of Integrated Strategic Urban Development Plans for Cluster III Towns-Thika
57
Annexure 6
Plot layout as per plot coverage and set backs
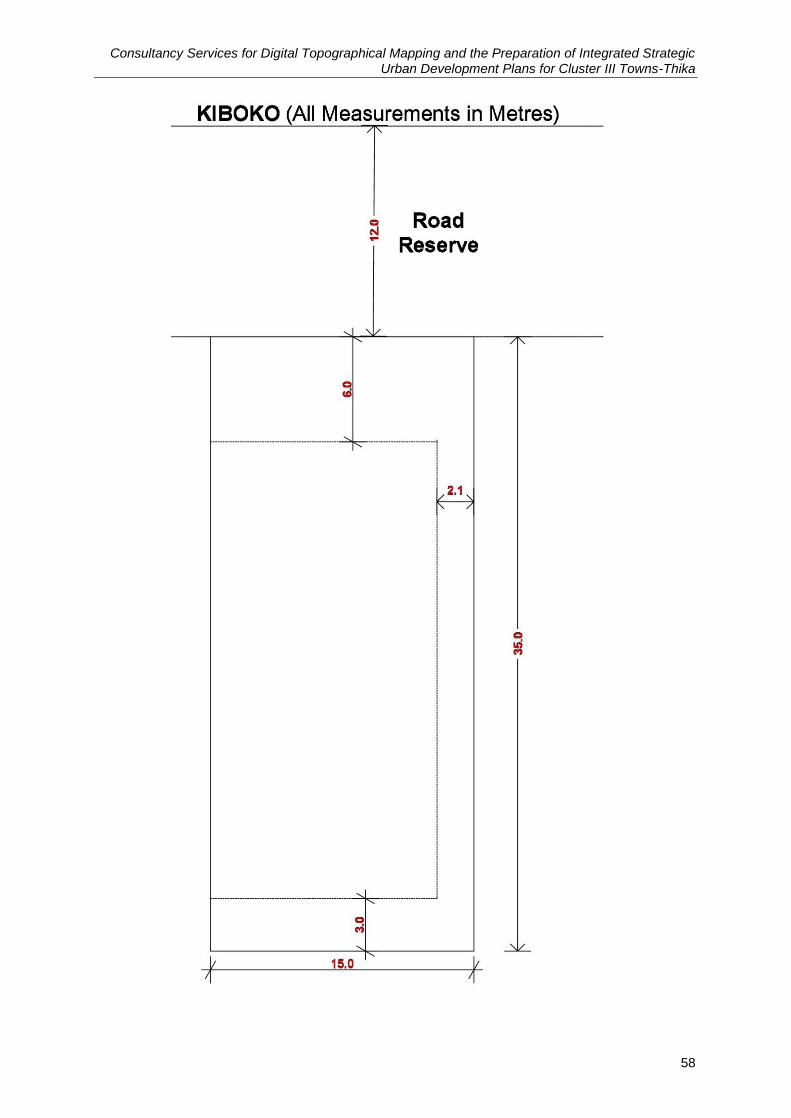
Consultancy Services for Digital Topographical Mapping and the Preparation of Integrated Strategic Urban Development Plans for Cluster III Towns-Thika
58
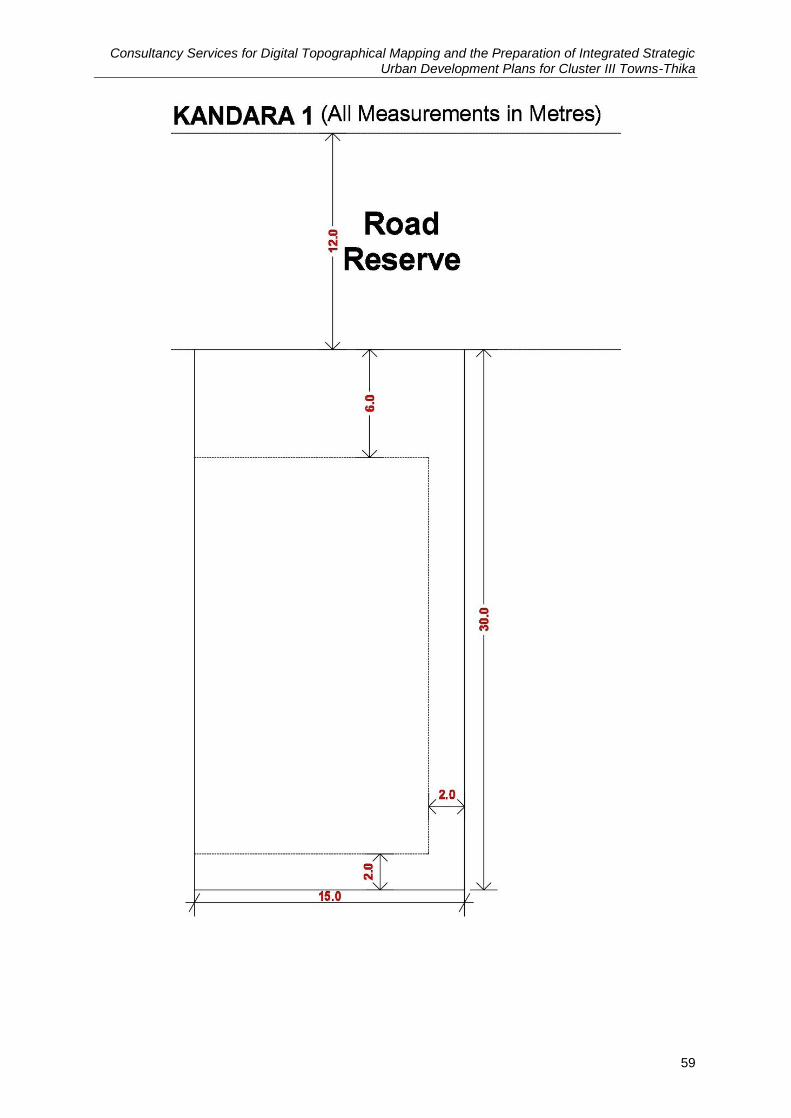
Consultancy Services for Digital Topographical Mapping and the Preparation of Integrated Strategic Urban Development Plans for Cluster III Towns-Thika
59
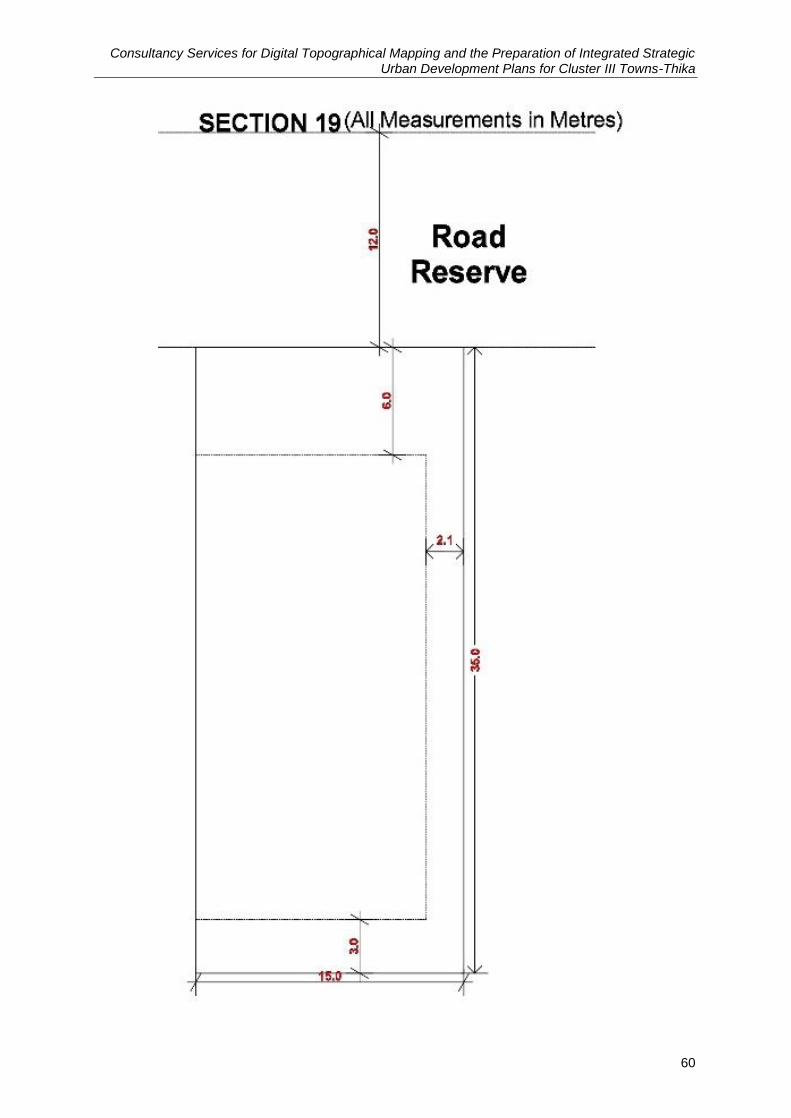
Consultancy Services for Digital Topographical Mapping and the Preparation of Integrated Strategic Urban Development Plans for Cluster III Towns-Thika
60
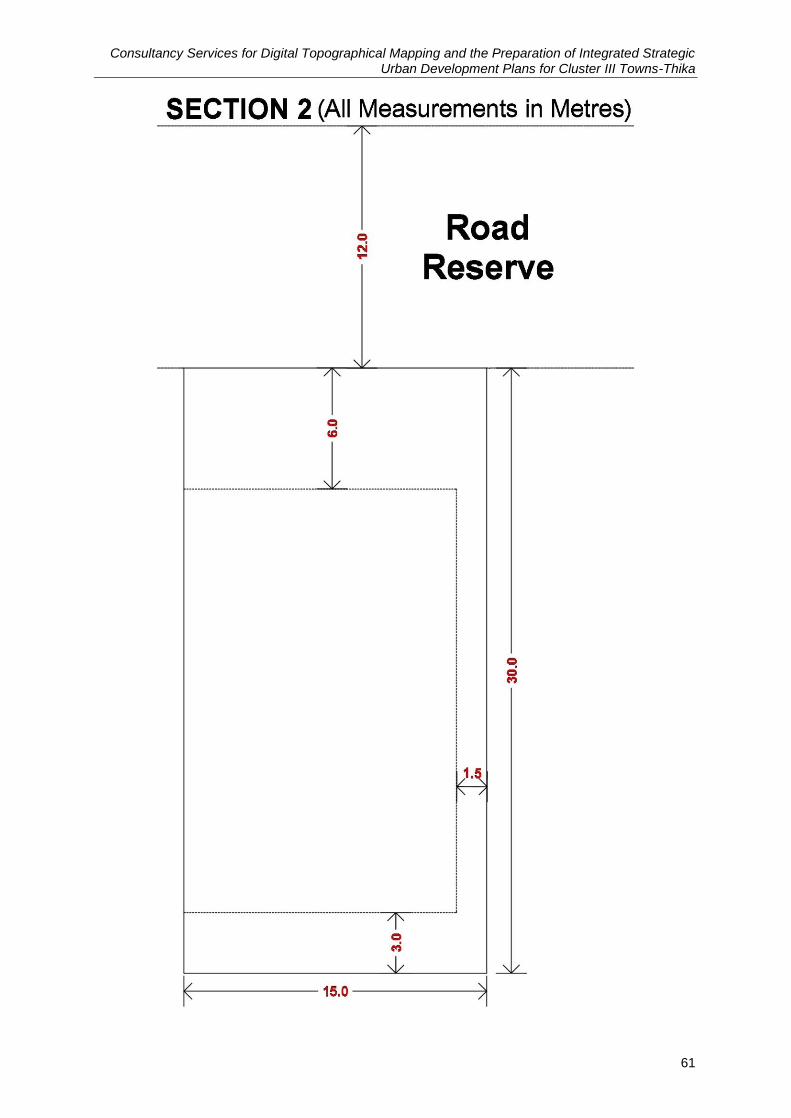
Consultancy Services for Digital Topographical Mapping and the Preparation of Integrated Strategic Urban Development Plans for Cluster III Towns-Thika
61
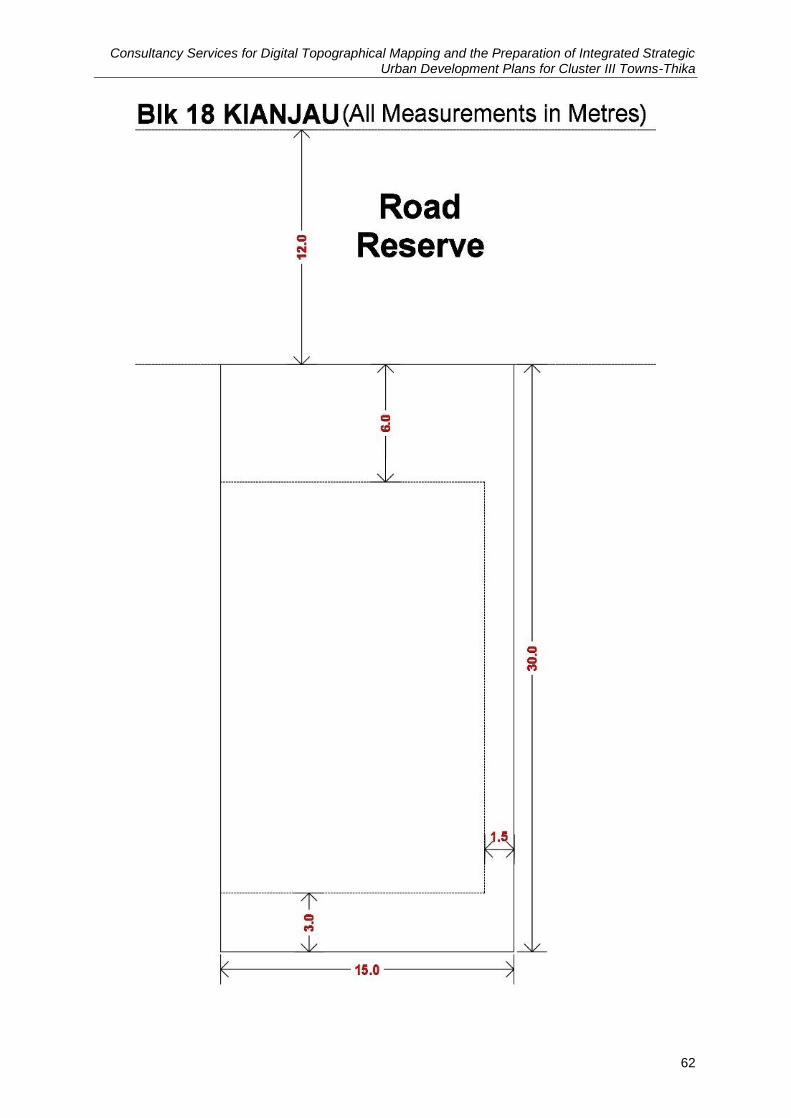
Consultancy Services for Digital Topographical Mapping and the Preparation of Integrated Strategic Urban Development Plans for Cluster III Towns-Thika
62
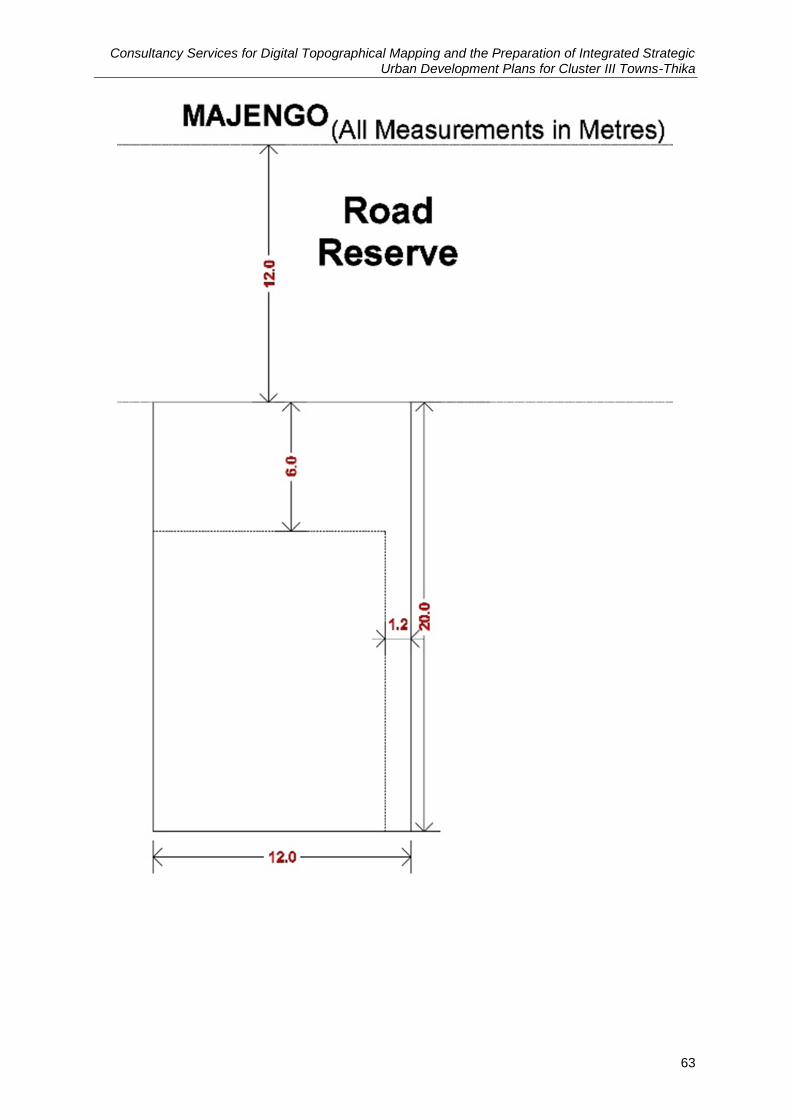
Consultancy Services for Digital Topographical Mapping and the Preparation of Integrated Strategic Urban Development Plans for Cluster III Towns-Thika
63
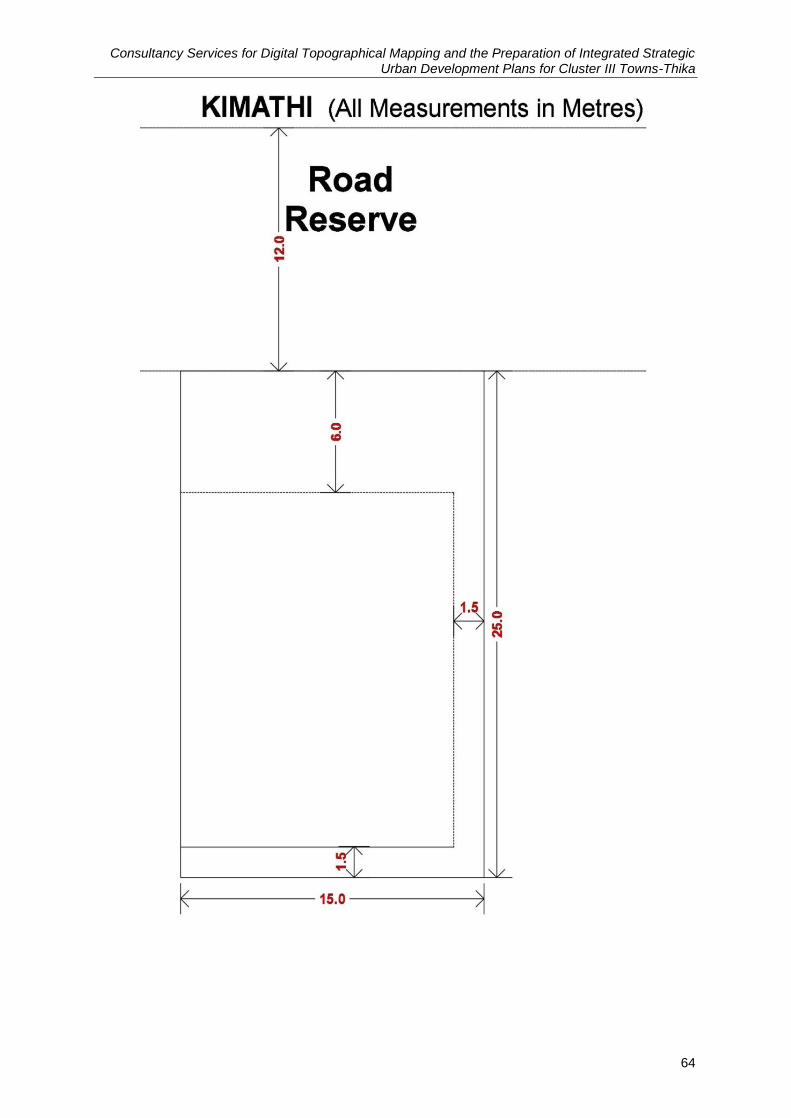
Consultancy Services for Digital Topographical Mapping and the Preparation of Integrated Strategic Urban Development Plans for Cluster III Towns-Thika
64
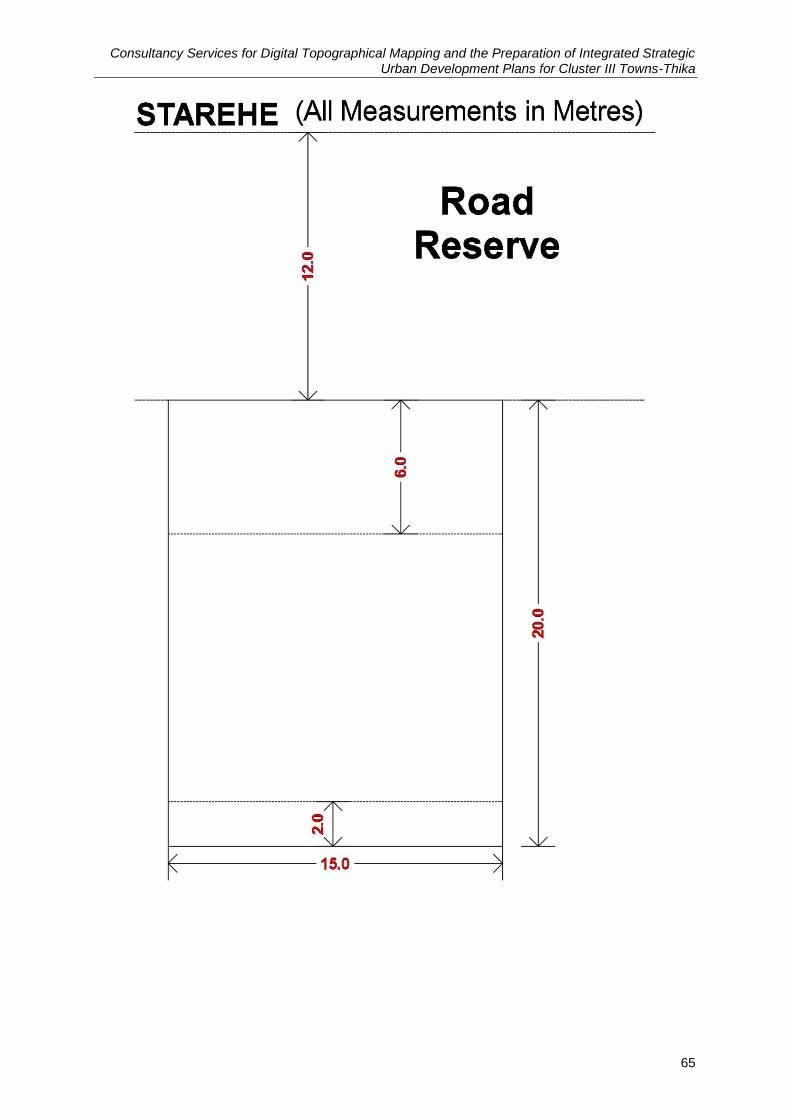
Consultancy Services for Digital Topographical Mapping and the Preparation of Integrated Strategic Urban Development Plans for Cluster III Towns-Thika
65
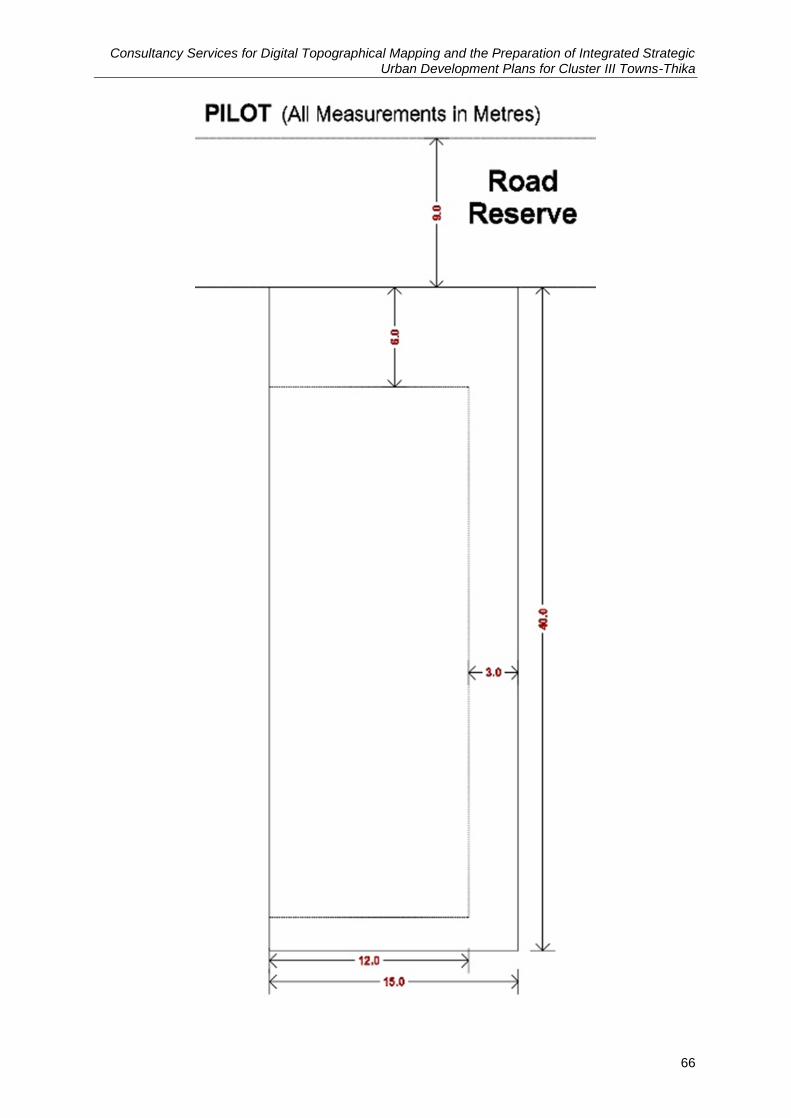
Consultancy Services for Digital Topographical Mapping and the Preparation of Integrated Strategic Urban Development Plans for Cluster III Towns-Thika
66
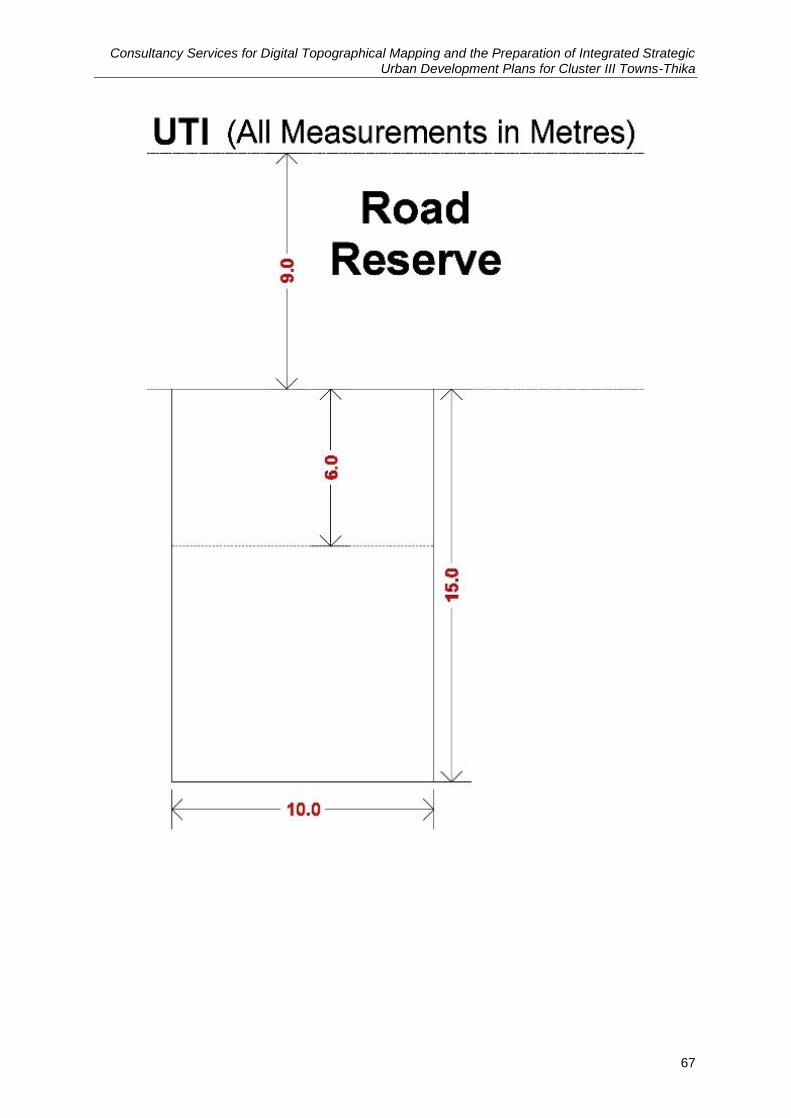
Consultancy Services for Digital Topographical Mapping and the Preparation of Integrated Strategic Urban Development Plans for Cluster III Towns-Thika
67
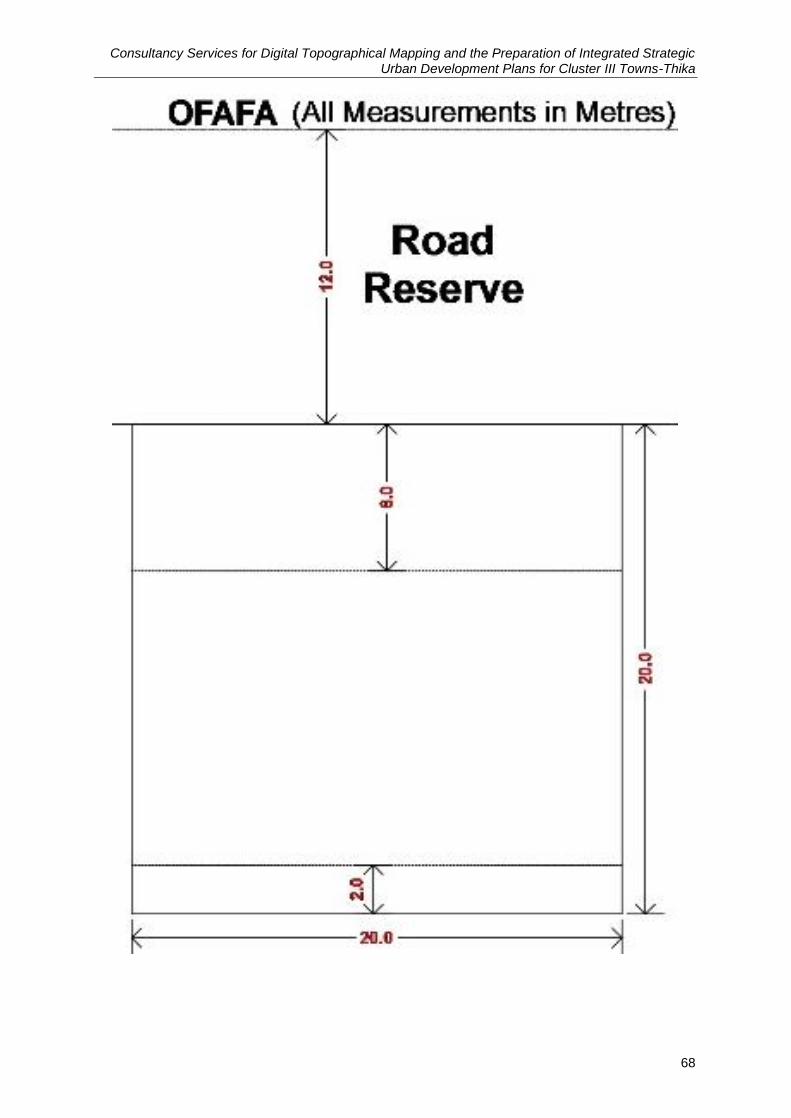
Consultancy Services for Digital Topographical Mapping and the Preparation of Integrated Strategic Urban Development Plans for Cluster III Towns-Thika
68
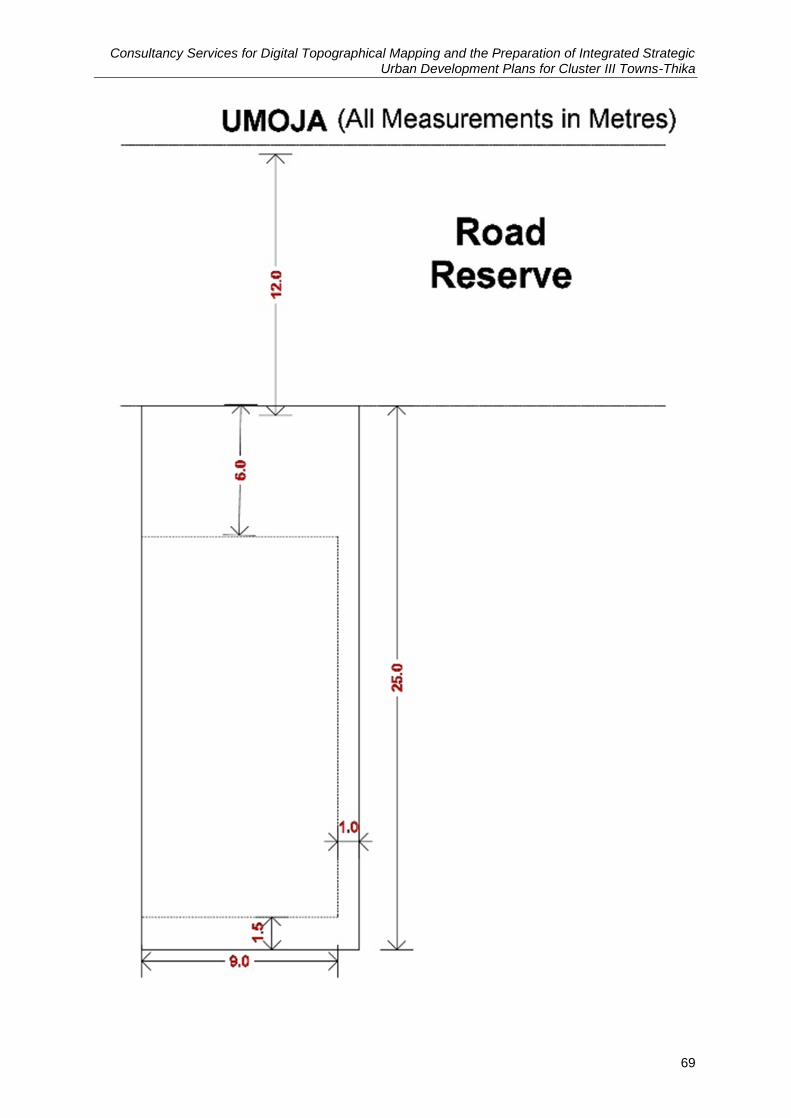
Consultancy Services for Digital Topographical Mapping and the Preparation of Integrated Strategic Urban Development Plans for Cluster III Towns-Thika
69
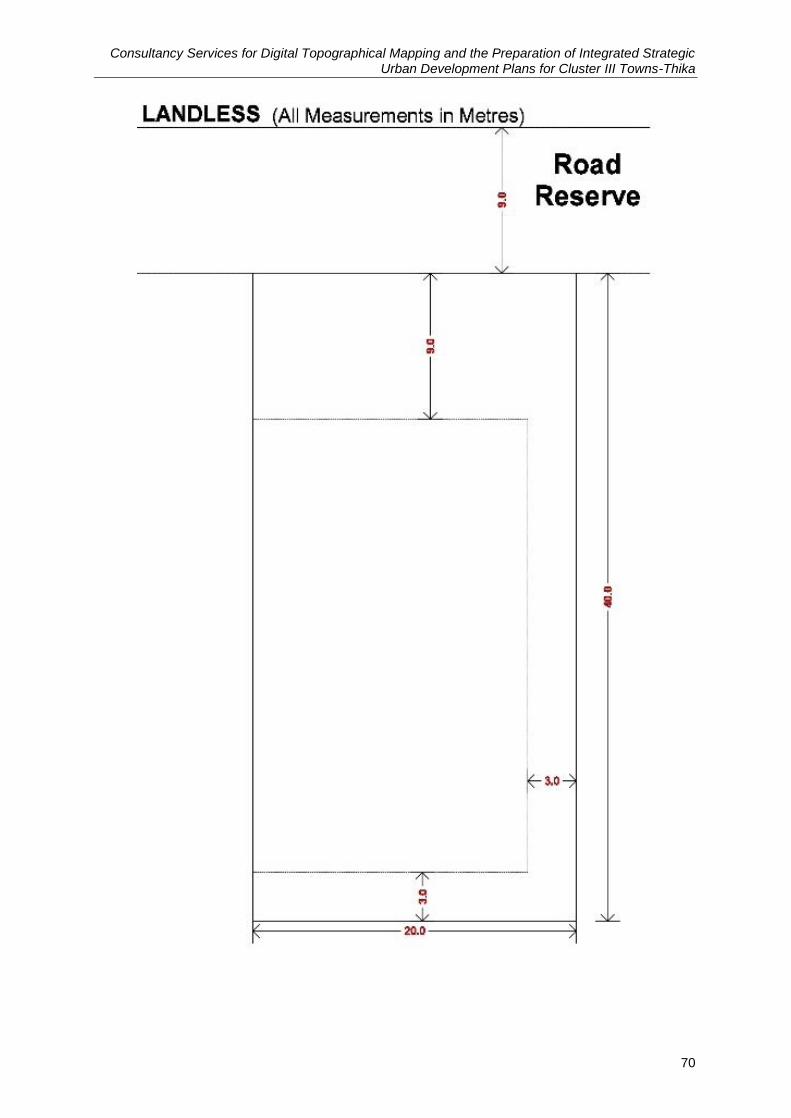
Consultancy Services for Digital Topographical Mapping and the Preparation of Integrated Strategic Urban Development Plans for Cluster III Towns-Thika
70
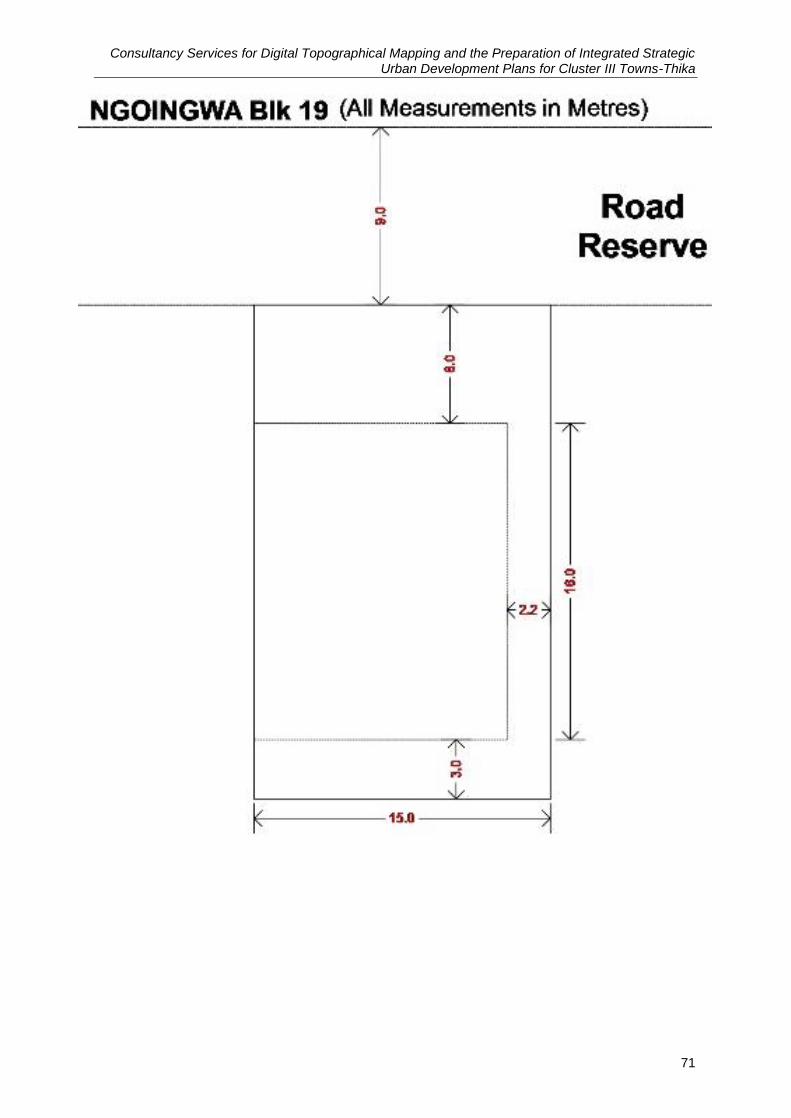
Consultancy Services for Digital Topographical Mapping and the Preparation of Integrated Strategic Urban Development Plans for Cluster III Towns-Thika
71
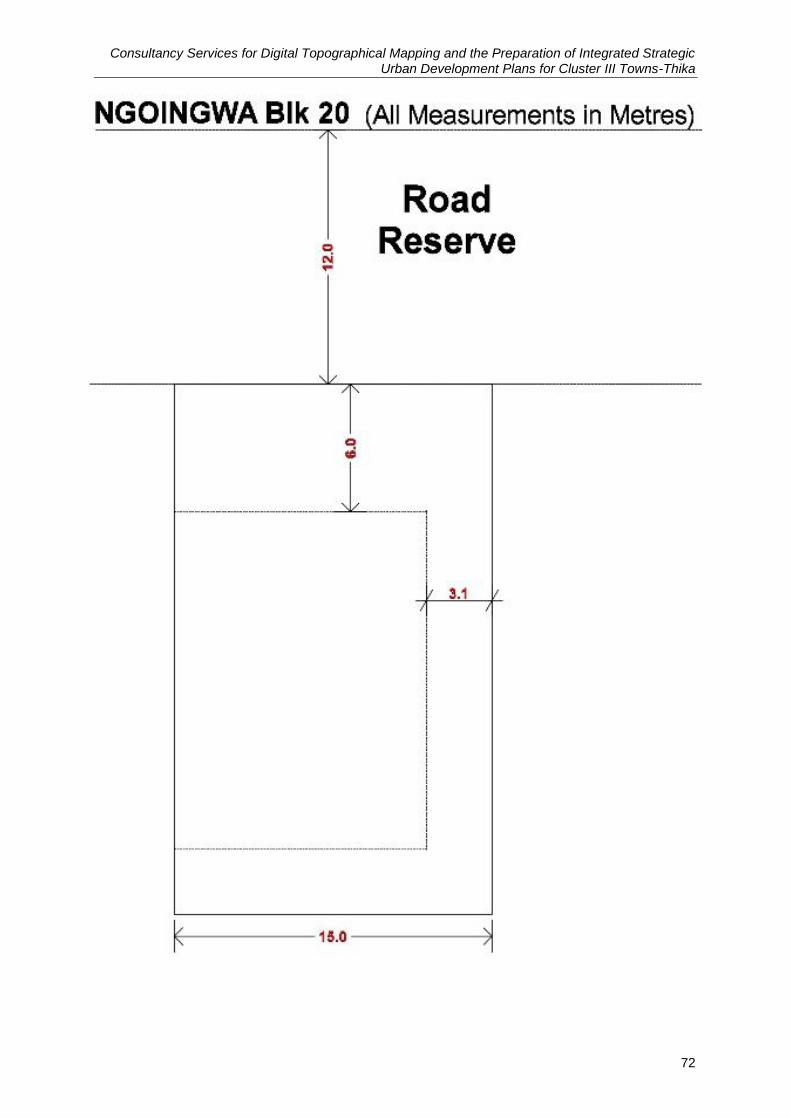
Consultancy Services for Digital Topographical Mapping and the Preparation of Integrated Strategic Urban Development Plans for Cluster III Towns-Thika
72
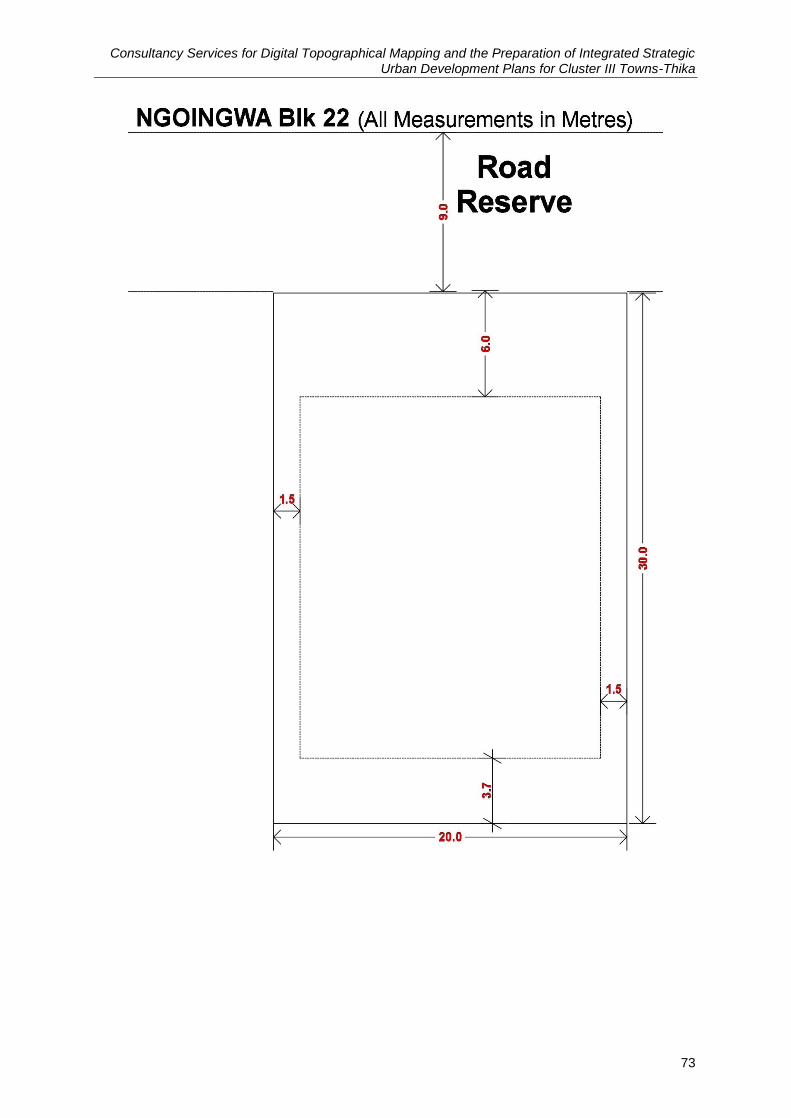
Consultancy Services for Digital Topographical Mapping and the Preparation of Integrated Strategic Urban Development Plans for Cluster III Towns-Thika
73
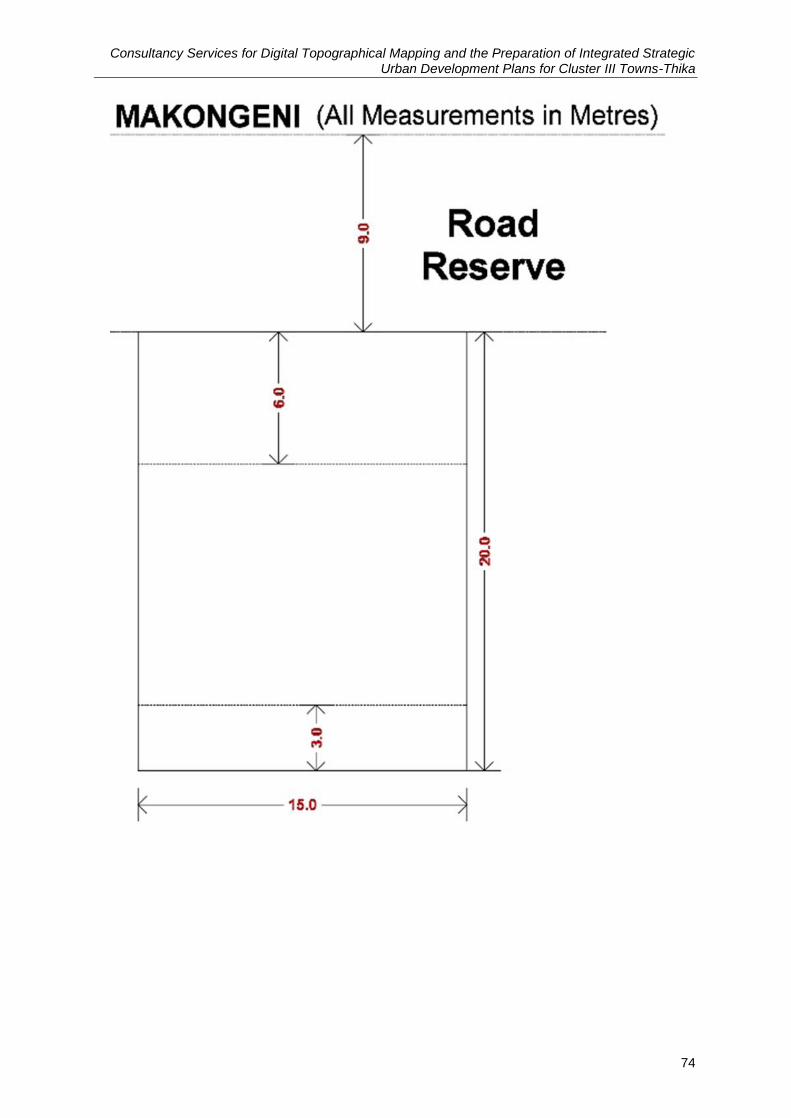
Consultancy Services for Digital Topographical Mapping and the Preparation of Integrated Strategic Urban Development Plans for Cluster III Towns-Thika
74
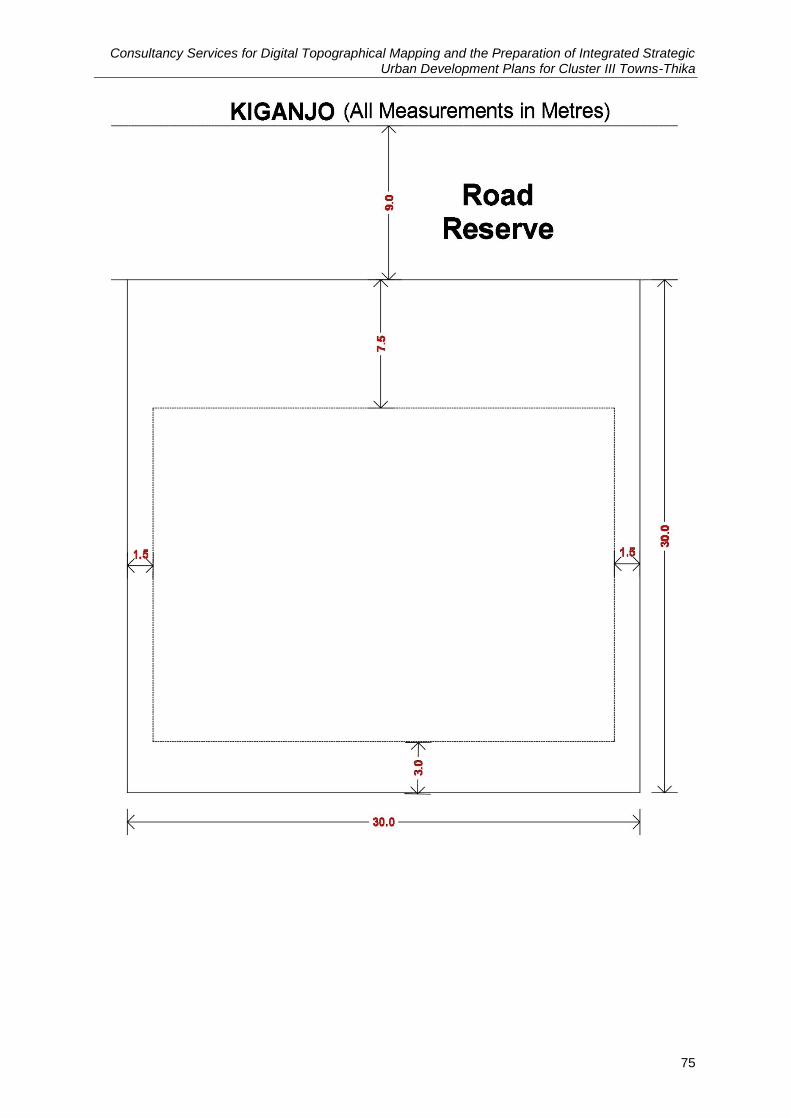
Consultancy Services for Digital Topographical Mapping and the Preparation of Integrated Strategic Urban Development Plans for Cluster III Towns-Thika
75

Consultancy Services for Digital Topographical Mapping and the Preparation of Integrated Strategic Urban Development Plans for Cluster III Towns-Thika
76
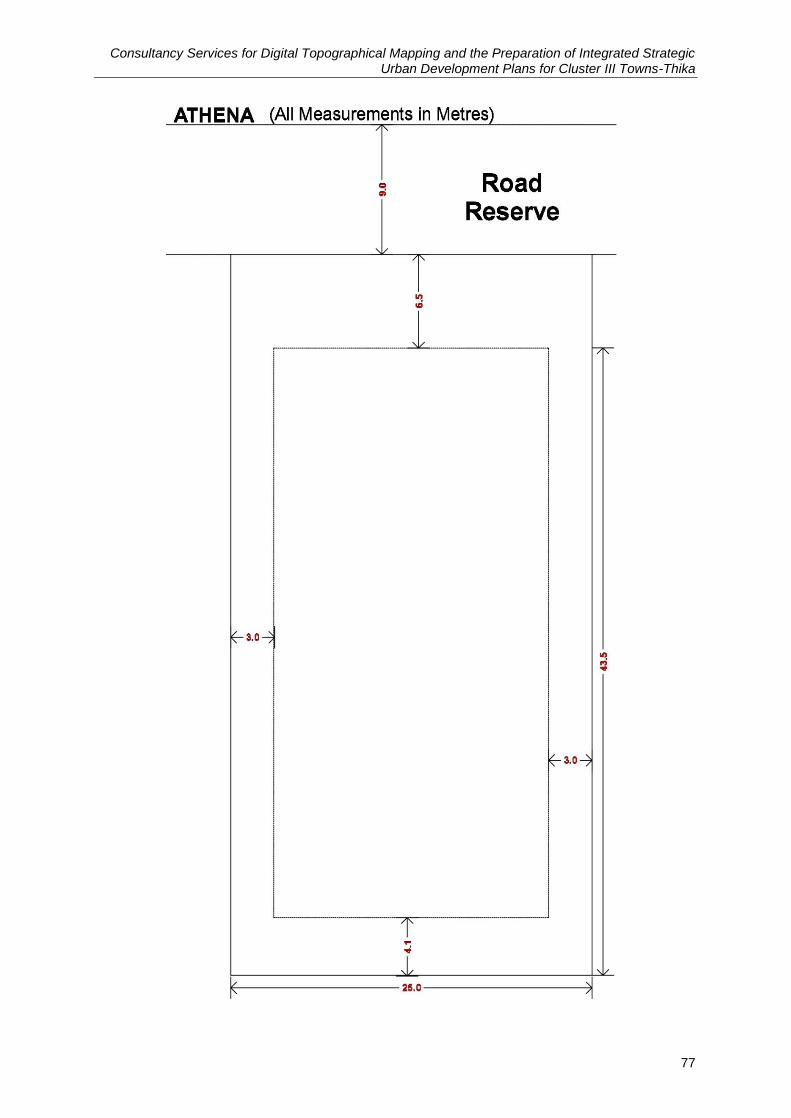
Consultancy Services for Digital Topographical Mapping and the Preparation of Integrated Strategic Urban Development Plans for Cluster III Towns-Thika
77
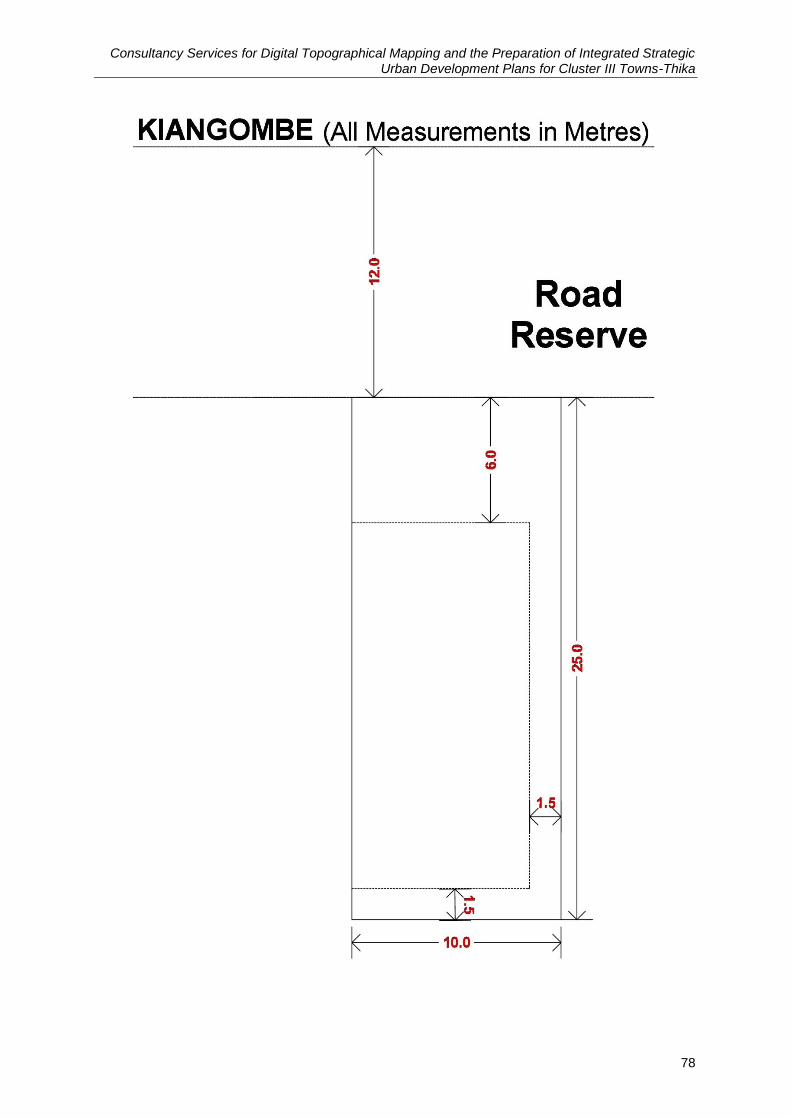
Consultancy Services for Digital Topographical Mapping and the Preparation of Integrated Strategic Urban Development Plans for Cluster III Towns-Thika
78

Consultancy Services for Digital Topographical Mapping and the Preparation of Integrated Strategic Urban Development Plans for Cluster III Towns-Thika
79
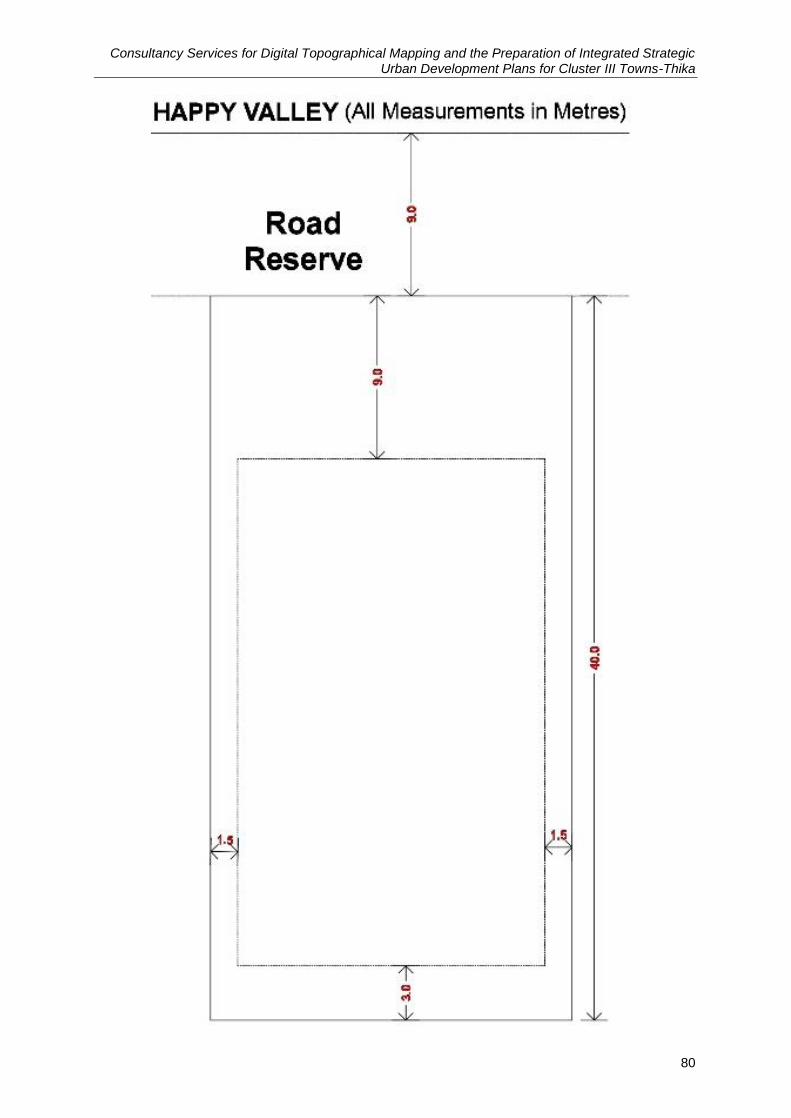
Consultancy Services for Digital Topographical Mapping and the Preparation of Integrated Strategic Urban Development Plans for Cluster III Towns-Thika
80
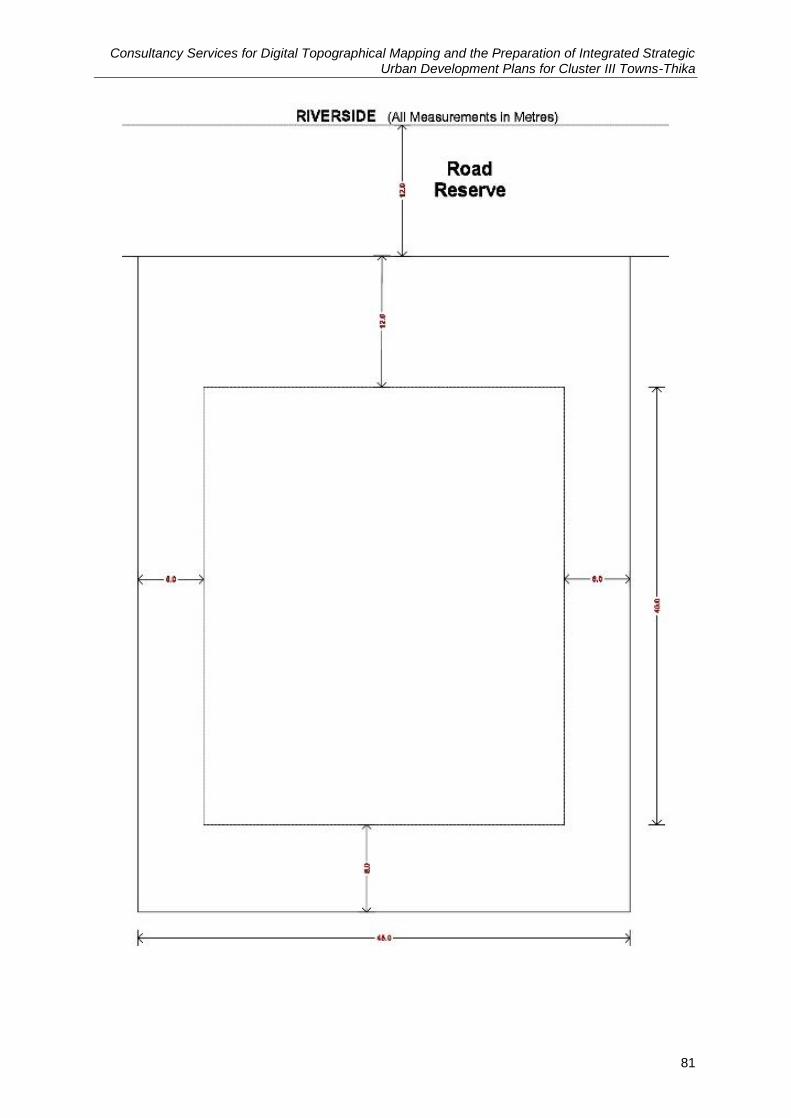
Consultancy Services for Digital Topographical Mapping and the Preparation of Integrated Strategic Urban Development Plans for Cluster III Towns-Thika
81
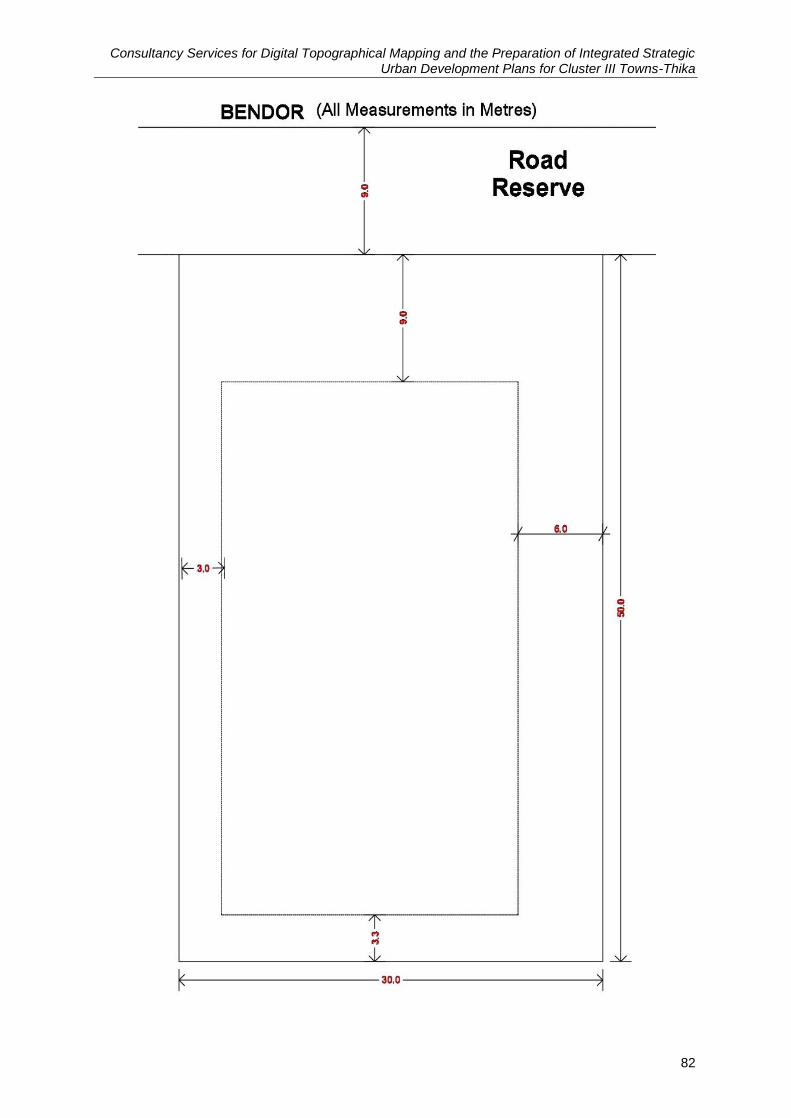
Consultancy Services for Digital Topographical Mapping and the Preparation of Integrated Strategic Urban Development Plans for Cluster III Towns-Thika
82
Consultancy Services for Digital Topographical Mapping and the Preparation of Integrated Strategic Urban Development Plans for Cluster III Towns-Thika
83
Annexure 7
Agriculture and subdivision size
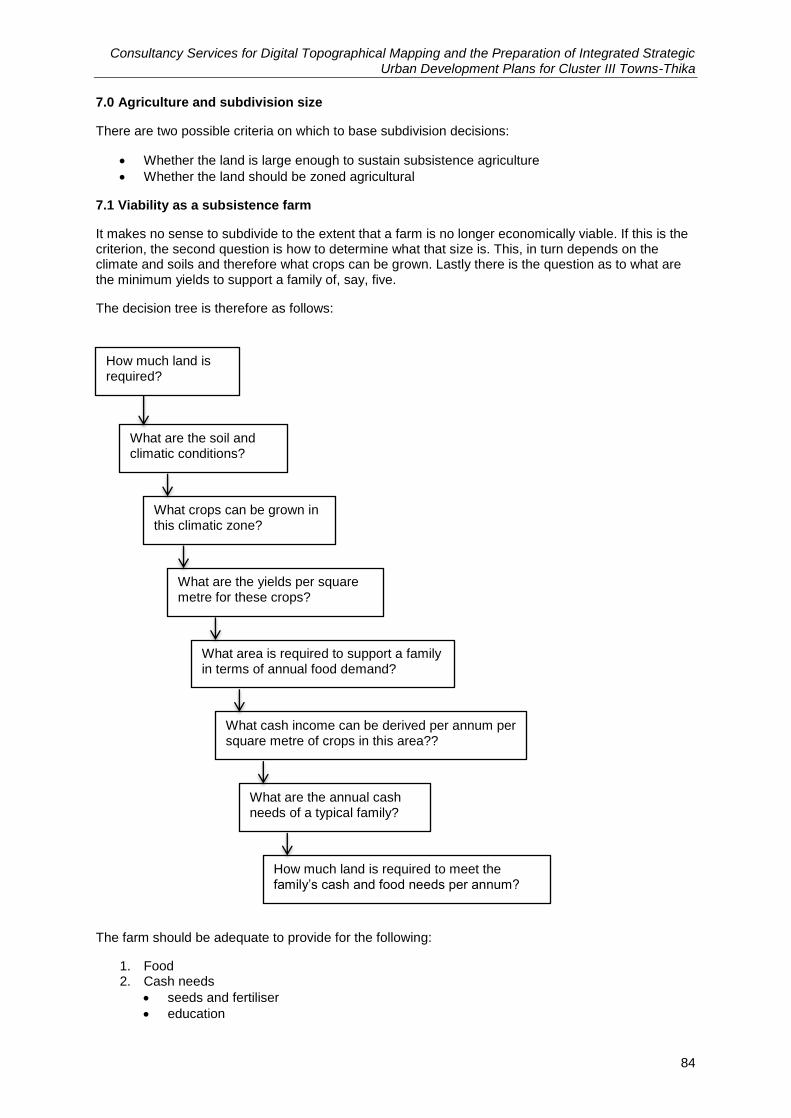
Consultancy Services for Digital Topographical Mapping and the Preparation of Integrated Strategic Urban Development Plans for Cluster III Towns-Thika
84
7.0 Agriculture and subdivision size
There are two possible criteria on which to base subdivision decisions:
Whether the land is large enough to sustain subsistence agriculture
Whether the land should be zoned agricultural
7.1 Viability as a subsistence farm
It makes no sense to subdivide to the extent that a farm is no longer economically viable. If this is the criterion, the second question is how to determine what that size is. This, in turn depends on the climate and soils and therefore what crops can be grown. Lastly there is the question as to what are the minimum yields to support a family of, say, five.
The decision tree is therefore as follows:
The farm should be adequate to provide for the following:
1. Food 2. Cash needs
seeds and fertiliser
education
How much land is required?
What are the soil and climatic conditions?
What crops can be grown in this climatic zone?
What are the yields per square metre for these crops?
What area is required to support a family in terms of annual food demand?
What cash income can be derived per annum per square metre of crops in this area??
What are the annual cash needs of a typical family?
How much land is required to meet the family‟s cash and food needs per annum?
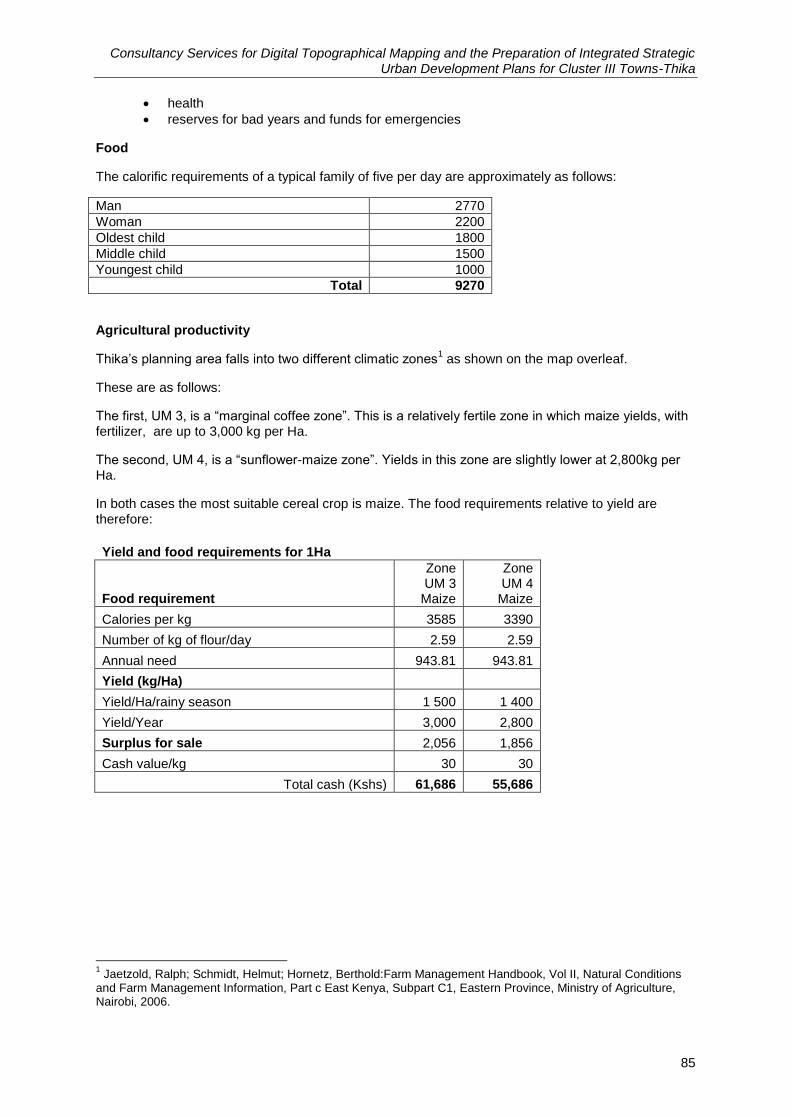
Consultancy Services for Digital Topographical Mapping and the Preparation of Integrated Strategic Urban Development Plans for Cluster III Towns-Thika
85
health
reserves for bad years and funds for emergencies
Food
The calorific requirements of a typical family of five per day are approximately as follows:
Man 2770
Woman 2200
Oldest child 1800
Middle child 1500
Youngest child 1000
Total 9270
Agricultural productivity
Thika‟s planning area falls into two different climatic zones1 as shown on the map overleaf.
These are as follows:
The first, UM 3, is a “marginal coffee zone”. This is a relatively fertile zone in which maize yields, with fertilizer, are up to 3,000 kg per Ha.
The second, UM 4, is a “sunflower-maize zone”. Yields in this zone are slightly lower at 2,800kg per Ha.
In both cases the most suitable cereal crop is maize. The food requirements relative to yield are therefore:
Yield and food requirements for 1Ha
Food requirement
Zone UM 3
Maize
Zone UM 4
Maize
Calories per kg 3585 3390
Number of kg of flour/day 2.59 2.59
Annual need 943.81 943.81
Yield (kg/Ha)
Yield/Ha/rainy season 1 500 1 400
Yield/Year 3,000 2,800
Surplus for sale 2,056 1,856
Cash value/kg 30 30
Total cash (Kshs) 61,686 55,686
1 Jaetzold, Ralph; Schmidt, Helmut; Hornetz, Berthold:Farm Management Handbook, Vol II, Natural Conditions
and Farm Management Information, Part c East Kenya, Subpart C1, Eastern Province, Ministry of Agriculture, Nairobi, 2006.
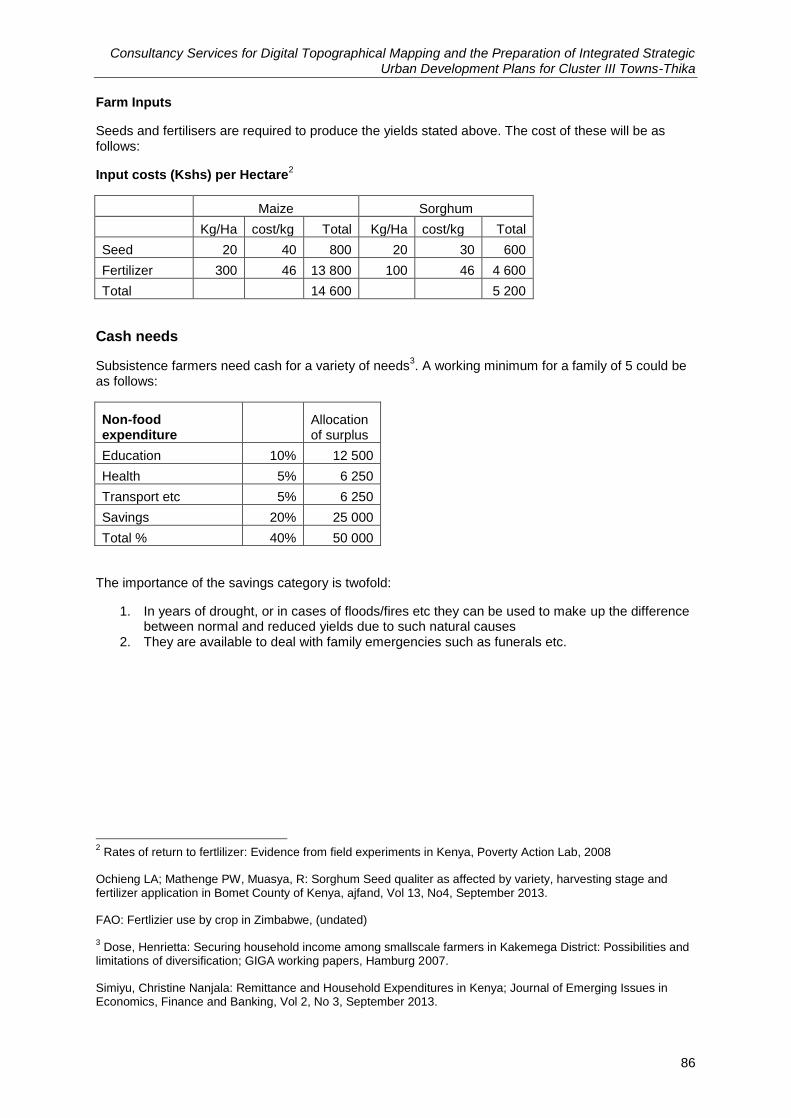
Consultancy Services for Digital Topographical Mapping and the Preparation of Integrated Strategic Urban Development Plans for Cluster III Towns-Thika
86
Farm Inputs
Seeds and fertilisers are required to produce the yields stated above. The cost of these will be as follows:
Input costs (Kshs) per Hectare2
Maize Sorghum
Kg/Ha cost/kg Total Kg/Ha cost/kg Total
Seed 20 40 800 20 30 600
Fertilizer 300 46 13 800 100 46 4 600
Total 14 600 5 200
Cash needs
Subsistence farmers need cash for a variety of needs3. A working minimum for a family of 5 could be
as follows:
Non-food expenditure
Allocation of surplus
Education 10% 12 500
Health 5% 6 250
Transport etc 5% 6 250
Savings 20% 25 000
Total % 40% 50 000
The importance of the savings category is twofold:
1. In years of drought, or in cases of floods/fires etc they can be used to make up the difference between normal and reduced yields due to such natural causes
2. They are available to deal with family emergencies such as funerals etc.
2 Rates of return to fertlilizer: Evidence from field experiments in Kenya, Poverty Action Lab, 2008
Ochieng LA; Mathenge PW, Muasya, R: Sorghum Seed qualiter as affected by variety, harvesting stage and fertilizer application in Bomet County of Kenya, ajfand, Vol 13, No4, September 2013.
FAO: Fertlizier use by crop in Zimbabwe, (undated)
3 Dose, Henrietta: Securing household income among smallscale farmers in Kakemega District: Possibilities and
limitations of diversification; GIGA working papers, Hamburg 2007.
Simiyu, Christine Nanjala: Remittance and Household Expenditures in Kenya; Journal of Emerging Issues in Economics, Finance and Banking, Vol 2, No 3, September 2013.
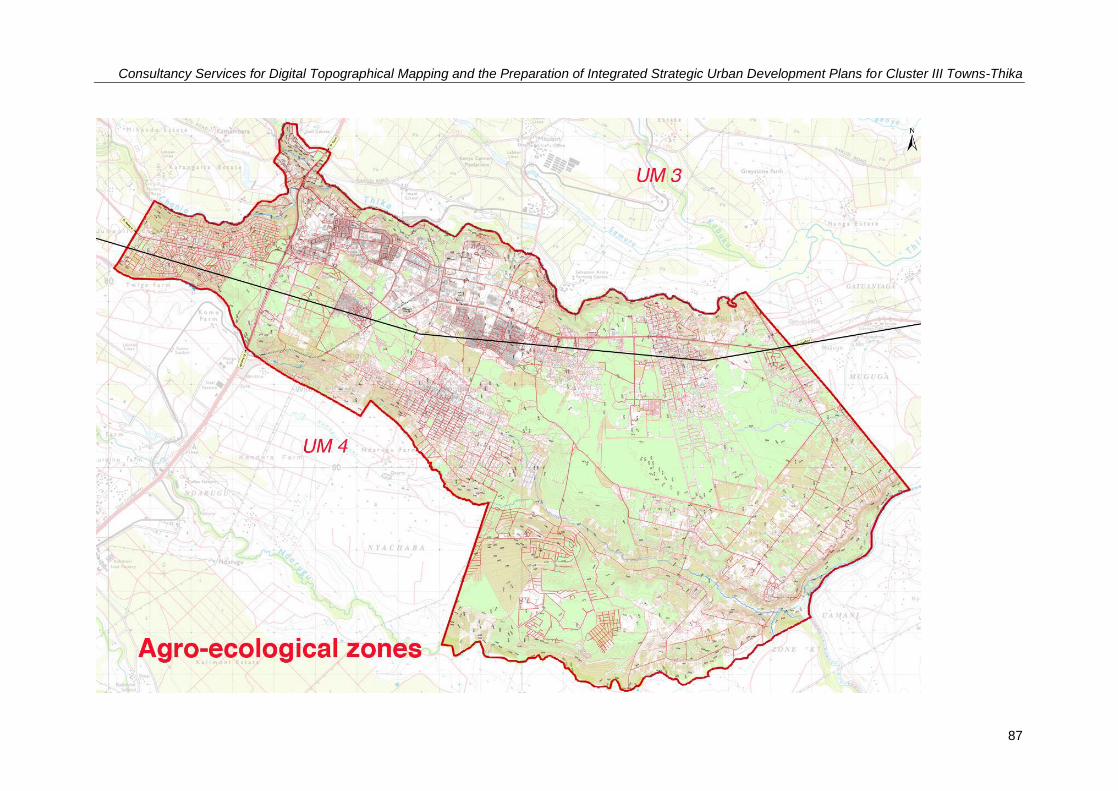
Consultancy Services for Digital Topographical Mapping and the Preparation of Integrated Strategic Urban Development Plans for Cluster III Towns-Thika
87
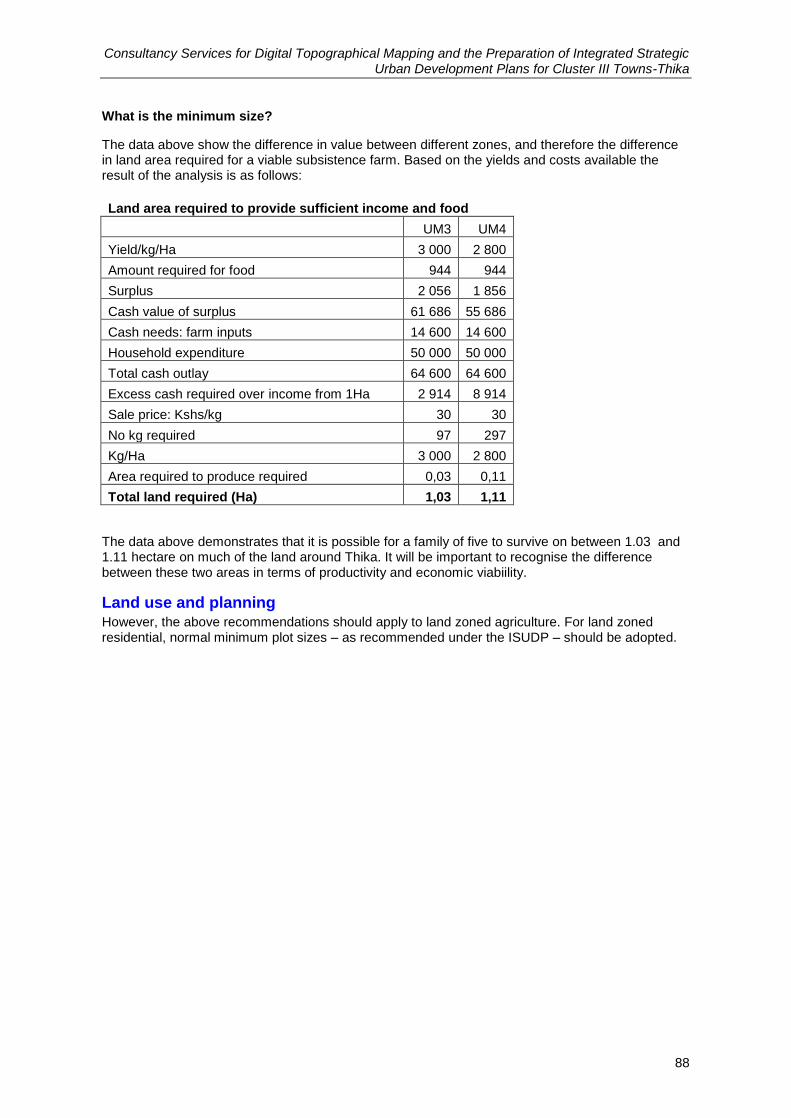
Consultancy Services for Digital Topographical Mapping and the Preparation of Integrated Strategic Urban Development Plans for Cluster III Towns-Thika
88
What is the minimum size?
The data above show the difference in value between different zones, and therefore the difference in land area required for a viable subsistence farm. Based on the yields and costs available the result of the analysis is as follows:
Land area required to provide sufficient income and food
UM3 UM4
Yield/kg/Ha 3 000 2 800
Amount required for food 944 944
Surplus 2 056 1 856
Cash value of surplus 61 686 55 686
Cash needs: farm inputs 14 600 14 600
Household expenditure 50 000 50 000
Total cash outlay 64 600 64 600
Excess cash required over income from 1Ha 2 914 8 914
Sale price: Kshs/kg 30 30
No kg required 97 297
Kg/Ha 3 000 2 800
Area required to produce required 0,03 0,11
Total land required (Ha) 1,03 1,11
The data above demonstrates that it is possible for a family of five to survive on between 1.03 and 1.11 hectare on much of the land around Thika. It will be important to recognise the difference between these two areas in terms of productivity and economic viabiility.
Land use and planning However, the above recommendations should apply to land zoned agriculture. For land zoned residential, normal minimum plot sizes – as recommended under the ISUDP – should be adopted.
Consultancy Services for Digital Topographical Mapping and the Preparation of Integrated Strategic Urban Development Plans for Cluster III Towns-Thika
89
Annexure 7
Class of occupancy of buildings
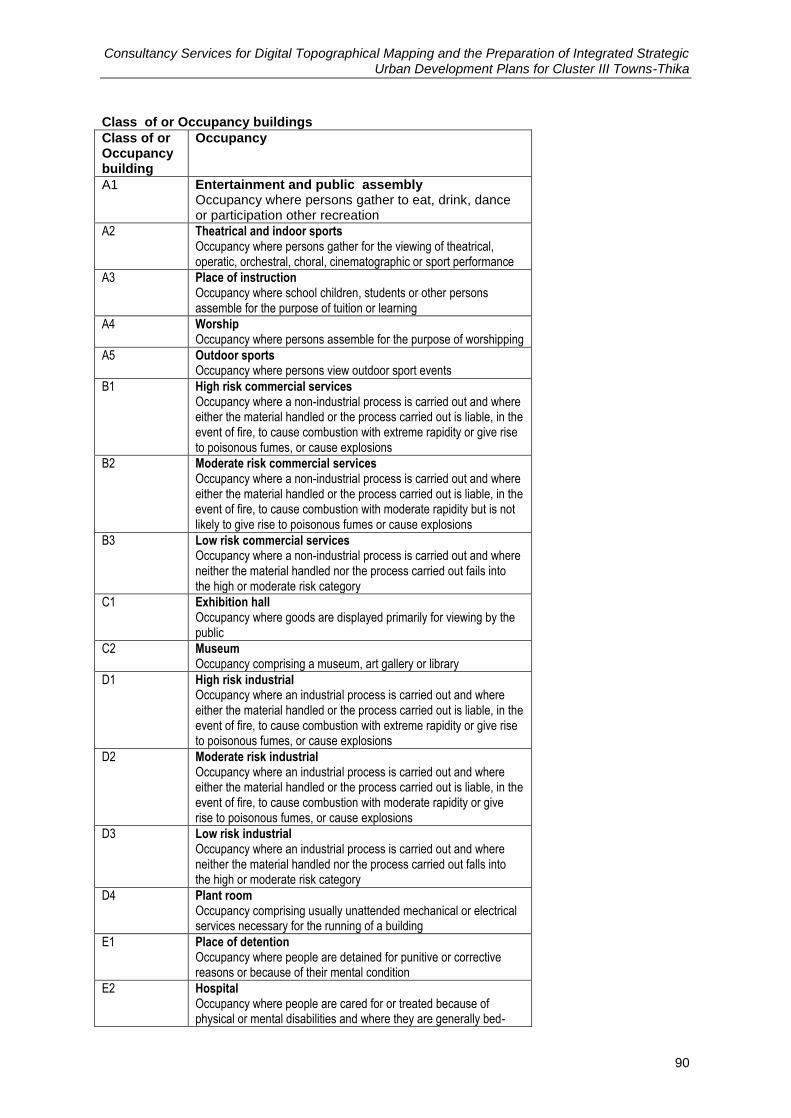
Consultancy Services for Digital Topographical Mapping and the Preparation of Integrated Strategic Urban Development Plans for Cluster III Towns-Thika
90
Class of or Occupancy buildings
Class of or Occupancy building
Occupancy
A1 Entertainment and public assembly Occupancy where persons gather to eat, drink, dance or participation other recreation
A2 Theatrical and indoor sports Occupancy where persons gather for the viewing of theatrical, operatic, orchestral, choral, cinematographic or sport performance
A3 Place of instruction Occupancy where school children, students or other persons assemble for the purpose of tuition or learning
A4 Worship Occupancy where persons assemble for the purpose of worshipping
A5 Outdoor sports Occupancy where persons view outdoor sport events
B1 High risk commercial services Occupancy where a non-industrial process is carried out and where either the material handled or the process carried out is liable, in the event of fire, to cause combustion with extreme rapidity or give rise to poisonous fumes, or cause explosions
B2 Moderate risk commercial services Occupancy where a non-industrial process is carried out and where either the material handled or the process carried out is liable, in the event of fire, to cause combustion with moderate rapidity but is not likely to give rise to poisonous fumes or cause explosions
B3 Low risk commercial services Occupancy where a non-industrial process is carried out and where neither the material handled nor the process carried out fails into the high or moderate risk category
C1 Exhibition hall Occupancy where goods are displayed primarily for viewing by the public
C2 Museum Occupancy comprising a museum, art gallery or library
D1 High risk industrial Occupancy where an industrial process is carried out and where either the material handled or the process carried out is liable, in the event of fire, to cause combustion with extreme rapidity or give rise to poisonous fumes, or cause explosions
D2 Moderate risk industrial Occupancy where an industrial process is carried out and where either the material handled or the process carried out is liable, in the event of fire, to cause combustion with moderate rapidity or give rise to poisonous fumes, or cause explosions
D3 Low risk industrial Occupancy where an industrial process is carried out and where neither the material handled nor the process carried out falls into the high or moderate risk category
D4 Plant room Occupancy comprising usually unattended mechanical or electrical services necessary for the running of a building
E1 Place of detention Occupancy where people are detained for punitive or corrective reasons or because of their mental condition
E2 Hospital Occupancy where people are cared for or treated because of physical or mental disabilities and where they are generally bed-
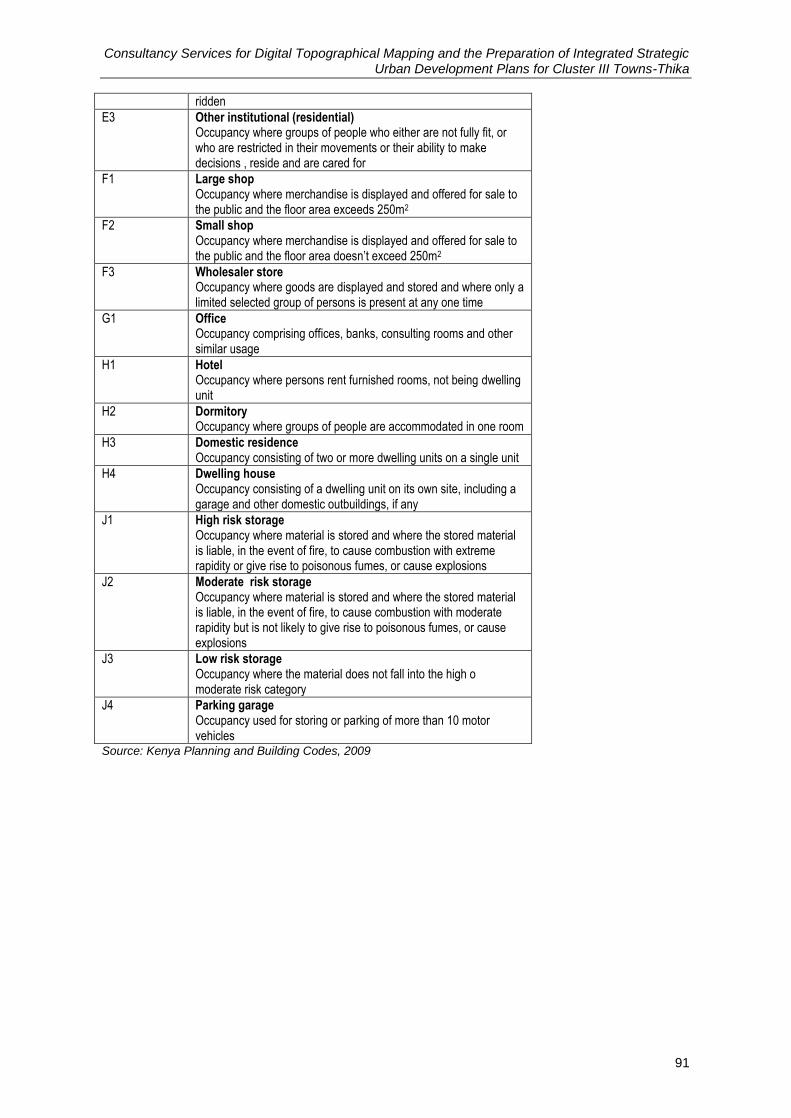
Consultancy Services for Digital Topographical Mapping and the Preparation of Integrated Strategic Urban Development Plans for Cluster III Towns-Thika
91
ridden
E3 Other institutional (residential) Occupancy where groups of people who either are not fully fit, or who are restricted in their movements or their ability to make decisions , reside and are cared for
F1 Large shop Occupancy where merchandise is displayed and offered for sale to the public and the floor area exceeds 250m2
F2 Small shop Occupancy where merchandise is displayed and offered for sale to the public and the floor area doesn’t exceed 250m2
F3 Wholesaler store Occupancy where goods are displayed and stored and where only a limited selected group of persons is present at any one time
G1 Office Occupancy comprising offices, banks, consulting rooms and other similar usage
H1 Hotel Occupancy where persons rent furnished rooms, not being dwelling unit
H2 Dormitory Occupancy where groups of people are accommodated in one room
H3 Domestic residence Occupancy consisting of two or more dwelling units on a single unit
H4 Dwelling house Occupancy consisting of a dwelling unit on its own site, including a garage and other domestic outbuildings, if any
J1 High risk storage Occupancy where material is stored and where the stored material is liable, in the event of fire, to cause combustion with extreme rapidity or give rise to poisonous fumes, or cause explosions
J2 Moderate risk storage Occupancy where material is stored and where the stored material is liable, in the event of fire, to cause combustion with moderate rapidity but is not likely to give rise to poisonous fumes, or cause explosions
J3 Low risk storage Occupancy where the material does not fall into the high o moderate risk category
J4 Parking garage Occupancy used for storing or parking of more than 10 motor vehicles
Source: Kenya Planning and Building Codes, 2009