INTERGRATED YOUTH DEVELOPMENT STRATEGY MAY ...
134
INTERGRATED YOUTH DEVELOPMENT STRATEGY MAY 2021
-
Upload
khangminh22 -
Category
Documents
-
view
2 -
download
0
Transcript of INTERGRATED YOUTH DEVELOPMENT STRATEGY MAY ...

INTERGRATED YOUTH DEVELOPMENT
STRATEGY
MAY 2021

AGENDA
1. South Africa Youth Policy and Strategy
2. Overall Demographic Profile
3. IYDS Methodology
4. Economic transformation
5. Education and skills development
6. Health and wellbeing
7. Social cohesion and nation building
8. Effective youth development machinery
9. Consultation process
10. Monitoring and evaluation

SOUTH AFRICA YOUTH POLICY AND
STRATEGY
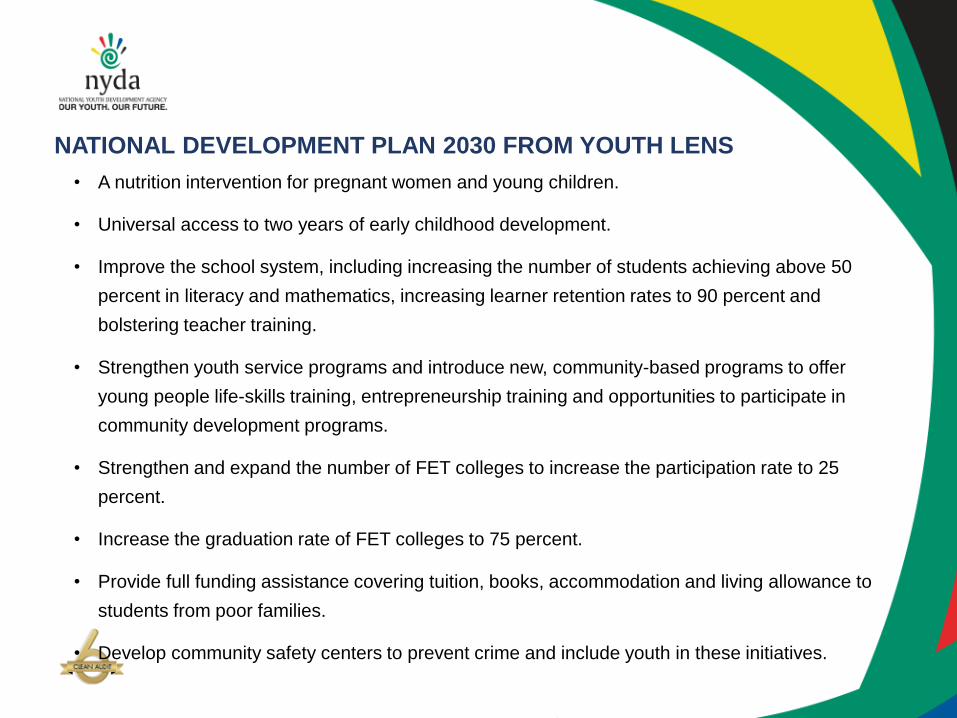
NATIONAL DEVELOPMENT PLAN 2030 FROM YOUTH LENS
• A nutrition intervention for pregnant women and young children.
• Universal access to two years of early childhood development.
• Improve the school system, including increasing the number of students achieving above 50
percent in literacy and mathematics, increasing learner retention rates to 90 percent and
bolstering teacher training.
• Strengthen youth service programs and introduce new, community-based programs to offer
young people life-skills training, entrepreneurship training and opportunities to participate in
community development programs.
• Strengthen and expand the number of FET colleges to increase the participation rate to 25
percent.
• Increase the graduation rate of FET colleges to 75 percent.
• Provide full funding assistance covering tuition, books, accommodation and living allowance to
students from poor families.
• Develop community safety centers to prevent crime and include youth in these initiatives.

NATIONAL DEVELOPMENT PLAN 2030 FROM YOUTH LENS
• A tax incentive to employers to reduce the initial cost of hiring young labor
market entrants.
• A subsidy to the placement sector to identify, prepare and place matric
graduates into work. The subsidy will be paid upon successful placement.
• Expand learnerships and make training vouchers directly available to job
seekers.
• A formalised graduate recruitment scheme for the public service to attract
highly skilled people.
• Expand the role of state-owned enterprises in training artisans and
technical professionals.

EXISTING POLICY MECHANISMS
Youth Employment Tax Incentive (Administered by
SARS)
Skills Development Levy (Administered by the NSF
and SETA’s)
Youth Employment Service (Linked to the BBBEE
scorecard of DTI)
NYDA / JOBS Fund / SEDA / TIA / Provincial
Programs
Youth Service / Public Employment (CWP, EPWP,
NARYSEC)
National Student Financial Aid Scheme

OVERALL DEMOGRAPHIC
PROFILE

57.7 million
TOTAL SA POPULATION 20.5 million
(36%)
YOUTH(15 – 34 years)
10 267 849
10 317 295
49.8% 50.1%
UNEMPLOYMENT
RATE
National
27.6%
15-24 yrs
55.2%
25-34 yrs
34,2%
RURALURBAN FARM
64% 32% 4%
Demographic Profile of South Africa’s Youth
8

Youth Opinion: Overall Direction of the Country
6
%
TOP
REASONS
TOP
REASONS
• There is no work / jobs / unemployment
is high
• The government is corrupt / there is too
much corruption / fraud
• There is too much crime / nothing is being
done about the crime / violence
• No or poor basic service delivery
• The government has failed us / the
government is just making empty
promises
• The Government has improved our
quality of life
• Education standards are better / we
have a school / free education
• We have received a house
• Country is getting better (unspecified
but positive response)
• Government is focusing on issues /
trying to make change

YOUTH VOICES IN COVID-19
• Access to data has emerged one of the most significant barriers to equality before and during the lockdown.
South Africa has some of the highest data costs on the continent. When asked, young people told us because of
limited cash they opt to purchase smaller data bundles more often, even if the price per unit is higher than a bulk
data bundle purchase. On average young people say they are spending R360 per month on data (with some as
much as R1800) for job searching, online applications, social media, research and academic work.
• 63% of young people we surveyed do not have an income—and many youth are using the childcare grant to
support themselves.
• Youth tell us that they are eager to learn, but that data barriers are significant. Young people need to stay busy
and employable, and that they are struggling to make ends meet. By lowering (or even removing) data costs,
young people are more readily able to access information, seek learning and job opportunities and engage with
others.
• We saw that when we changed our mobi-sites to become ‘data free’ young people’s online behavior changed
from logging in after midnight every evening when data was cheapest, to more even traffic during the day.
Affordable data allows young people to be productive during daytime hours, with additive psychosocial benefits
as well as giving them access to online communities amidst physical distancing.
• We have to continue to lift up youth voices to ensure resilience and recovery, and to provide young people with
the opportunities to build their skills and stay positive. If we amplify the voices of young people, they will help lead
us out of this crisis.
IYDS METHODOLOGY

LEGISLATIVE REQUIREMENTS
3. (1) The objects of the Agency are to—
(a) develop an Integrated Youth Development Plan and Strategy for South
Africa;
(b) develop guidelines for the implementation of an integrated national
youth development policy and make recommendations to the President;

METHODOLOGY
• Determine the youth development landscape in South Africa.
• Review key documents including but not limited to, 25 year review, Manifesto, MTSF, MTEF.
• Engage key Departments and Entities directly involved in youth development.
• Engage key Departments and Entities indirectly involved in youth development
• Publish first draft for public comment.
• Consult business, civil society, organized labor, youth formations.
• Consult provincially.
• Consult nationally.
• Consult the legislature
• Include consultation inputs and publish a final draft version.
• Submission to Cabinet for approval.

IYDS NDP & NYP 2030
Economic transformation
Consultation processes
Feedback annually to the youth sector
Education and skills
developmentHealth Social cohesion
Effective youth development machinery
MTSF 2025IYDS 2021 –
2025 & 2025 -2030

METHODOLOGY AND STATUS
Line item Status
Determine the youth development landscape in South Africa. Completed
Review key documents including but not limited to, 25 year review,
Manifesto, MTSF, MTEF
Completed
Engage key Departments and Entities directly involved in youth
development.
Completed
Publish first draft for public comment. Completed
Consult business, civil society, organized labor, youth formations. Completed
Consult provincially. Completed
Consult nationally. Completed
Consult the legislature In progress
Include consultation inputs, consolidate and publish a final draft
version.
In progress
Submit to Executive Authority for review In progress
Submission to Cabinet for approval. Outstanding

IYDS PILLARS

ECONOMIC TRANSFORMATION

YOUTH ENTRPRENEURSHIP: KEY DATA
• Youth participation in entrepreneurship is relatively small. South African total entrepreneurial
activity (TEA) in the 25 to 34 year age cohort was 9.2%, which was less than half the Africa
average as well as considerably lower than the average for efficiency driven economies
(18%). There is a correlation between education level and the level of TEA – with 67,4% TEA
rate for those who have completed secondary education and beyond while the level of TEA
for those without education is at 4,4%. Young men are more likely to be entrepreneurs than
young women and youth in the age group 25-34 years
• South African township youth are not responding to the full potential of business opportunities
in their own communities. Proportionally, immigrants have responded more effectively to
employment and business.
• Most youth will need to find employment in the informal sector. Yet data on labor-force
participation indicates that youth are not widely active in self-employed activities or informally
employed in micro-enterprises.

YOUTH ENTRPRENEURSHIP: KEY DATA
• In two townships the study was conducted in, only 15 percent of micro-enterprises
were run by young people under 30. Of this, one in three of the young entrepreneurs
were non-South Africans. In Delft, Cape Town, four out of 10 hair salons and barbers
were owned by young people, and seven in 10 of these were owned by foreign
entrepreneurs
• The lifestyle and leisure sectors contain some of the most promising youth start-ups,
which found that the young entrepreneurs are those that run internet cafés or
produce music at home and DJ at taverns and shebeens, or design flyers and
posters, or operate gyms, design and make clothes or run takeaways that sell fast
food to late-night revellers. The study found that South Africans are majority owners
of these kinds of businesses.

YOUTH ENTRPRENEURSHIP: KEY DATA
• The formal sector, while a critical engine for productivity and growth, cannot provide
all the answers to the growing numbers of the unemployed. It will be as critical to
keep the formal sector afloat, as it will be to innovate on ideas to support and sustain
the informal sector.
• Research shows that of roughly 1.8 million informal SMEs, slightly less than one-third
are led by youth, and slightly more than a third are headed by women. The most
common informal sector occupations for young men are taxi drivers and motor
vehicle mechanics, and for young women—beauticians and street food vendors.
Supporting these young men and women will help drive a more inclusive recovery—
and without their livelihood strategies, the poverty gap could grow and inequality
increase.

YOUTH ENTRPRENEURSHIP: KEY DATA
In a context in which the wider South African economy is not creating the scale of jobsrequired to absorb unemployed youth, it is important that youth can contribute tocreating the jobs needed for themselves. Yet, there are unique, systemic-level barriers toentry into economic opportunities and existing value chains for young people, especially ineconomically marginalised contexts. Where economic participation is possible, this is often ondeeply disadvantageous terms.
For example, the typical starting point for local economic development is for entry-levelentrepreneurs to produce the basic goods most commonly needed locally, growing in scaleand market outreach from there. In South Africa, however, local markets for basic consumergoods are typically already taken by large incumbents and it is hard for small-scale start-ups tocompete in relation to the established, mass-produced brands. This is at least part of theexplanation for the limited incidence of small-scale manufacturing in townships, with retailactivities that distribute such mass-produced goods a more common entry-point into marketsinstead.
Then there are the implications of spatial inequality, which concentrates poverty within thestructures of our cities, towns and villages, creating economic inefficiencies and illogics thatreproduce existing patterns of economic disadvantage – and of both exclusion or inclusion onadverse terms. The distance of many townships from economic centres can add costs toproduction activities located there, since current market access points are located elsewhere.
The systemic-level constraints in marginal economic contexts are reflected in outcomes. Theinconvenient truth is that despite the policy hopes pinned on small businesses as a solution tounemployment, small enterprises in the formal sector are not currently creating employment atscale, with South Africa an outlier in this regard. Therefore, while formal SMEs contributenearly 98.5% of the number of formal firms in the economy, they only account for 28% of thejobs. Based on international trends, this should be about 60 to 70%.[1]
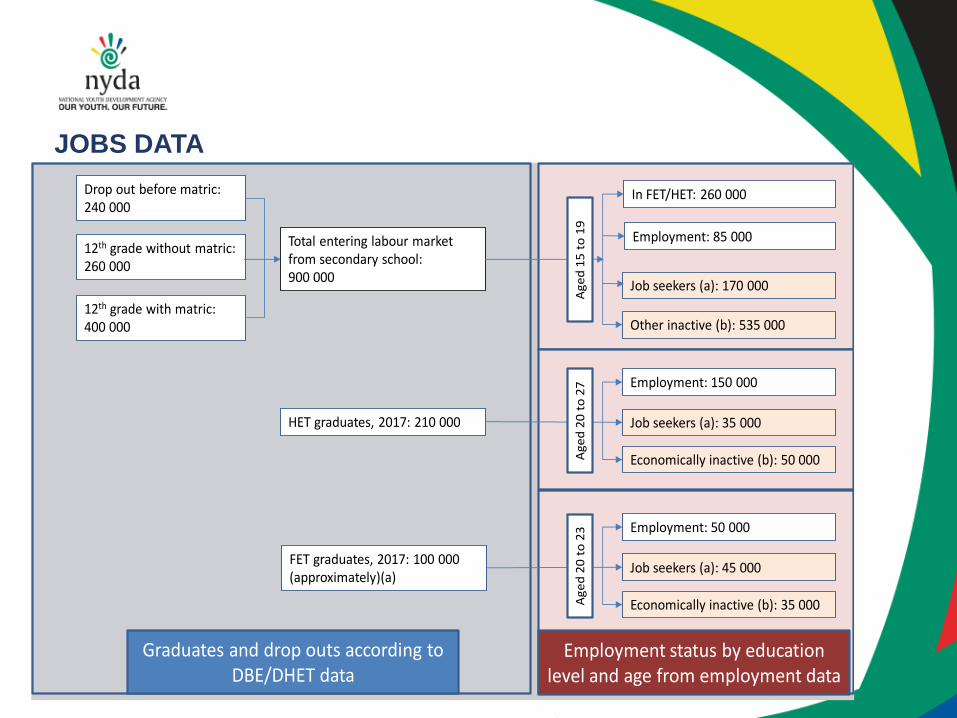
JOBS DATA
Drop out before matric:240 000
12th grade with matric:400 000
12th grade without matric:260 000
In FET/HET: 260 000
Employment: 85 000
Job seekers (a): 170 000
Other inactive (b): 535 000
Total entering labour market from secondary school: 900 000
HET graduates, 2017: 210 000
FET graduates, 2017: 100 000 (approximately)(a)
Employment: 150 000
Job seekers (a): 35 000
Economically inactive (b): 50 000
Ag
ed
15
to
19
Ag
ed
20
to
27
Employment: 50 000
Job seekers (a): 45 000
Economically inactive (b): 35 000 Ag
ed
20
to
23
Graduates and drop outs according to DBE/DHET data
Employment status by education level and age from employment data

JOBS DATA

• The high level of unemployment experienced by
youth is said to be the cause of corruption and
nepotism. It is believed that because of scarcity of
jobs people in positions of authority provide
information on jobs to those close to them such as
their family members and friends.
• Unemployment is also viewed as a potential cause
of corruption as more unemployed youth and their
families resort in paying bribes in the hope of
being employed.
• Required experience for advertised jobs is also
seen as one of the limiting factors to youth
employment. Many mentioned that after qualifying
they either remain unemployed or forever confined
to internship.
How Challenges Affect the Life of the Youth
24
Unemployment
• The view is that internships most often do not consider the area
in which a person is qualified. The youth expressed the view
that interns are not gaining knowledge relevant to their
specialty area which makes it difficult for them to acquire
skills that can make it easier for them to become permanently
employed.
• Poverty is one consequence of unemployment that most
youth find themselves facing and as a result resort to crime.
• The challenge of poverty, especially amongst the Rooted
Realist youth (rural based youth and low income households) is
seen as an exclusion from having facilities, amenities,
resources, transport, Wi-Fi etc. This does not even include lack
of basic services.
• The rural youth mainly feel neglected especially when it comes
to opportunities government put in place to help the youth.

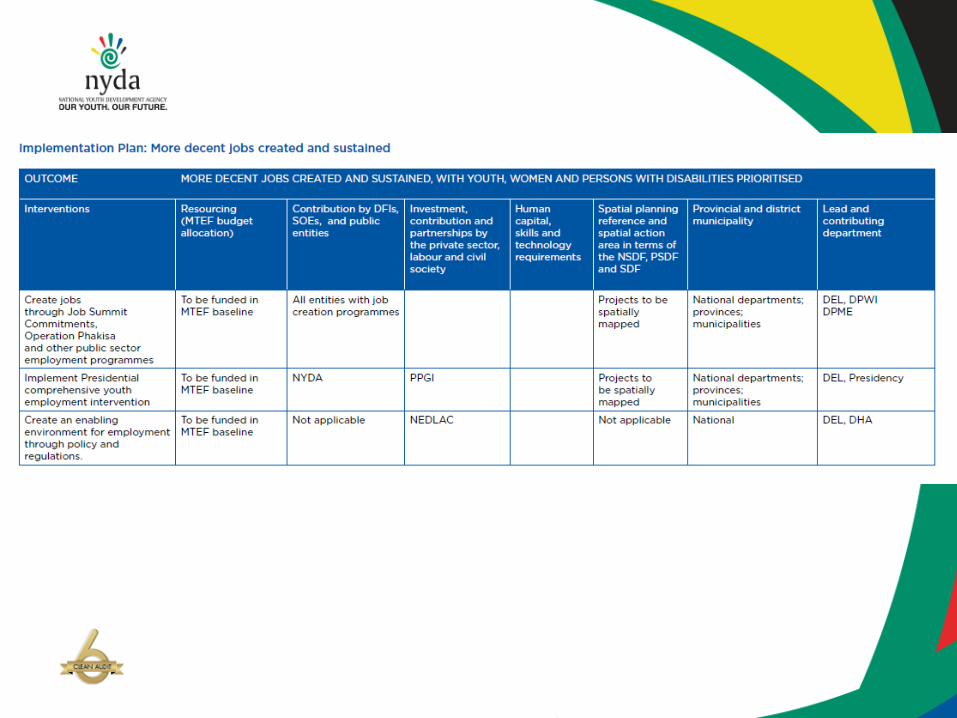
MEDIUM TERM STRATEGIC
FRAMEWORK: PRIORITY TWO:
ECONOMIC TRANSFORMATION
AND JOB CREATION


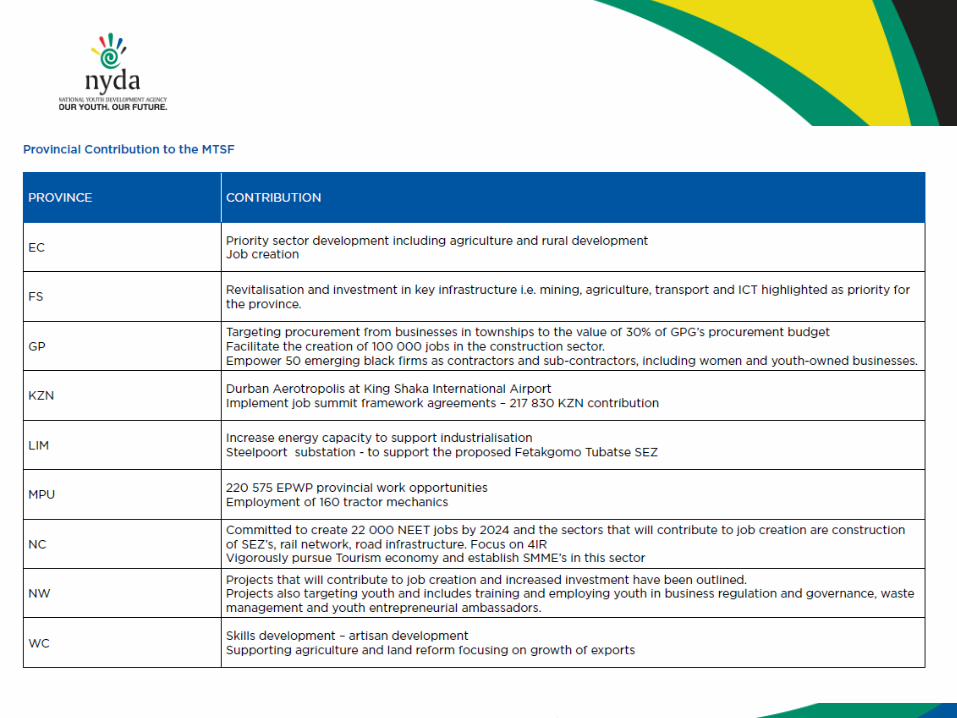

MEDIUM TERM STRATEGIC FRAMEWORK: PRIORITY FIVE:
SPATIAL INTERGRATION, HUMAN SETTLEMENTS AND LOCAL
GOVERNMENT


EDUCATION AND SKILLS
DEVELOPMENT
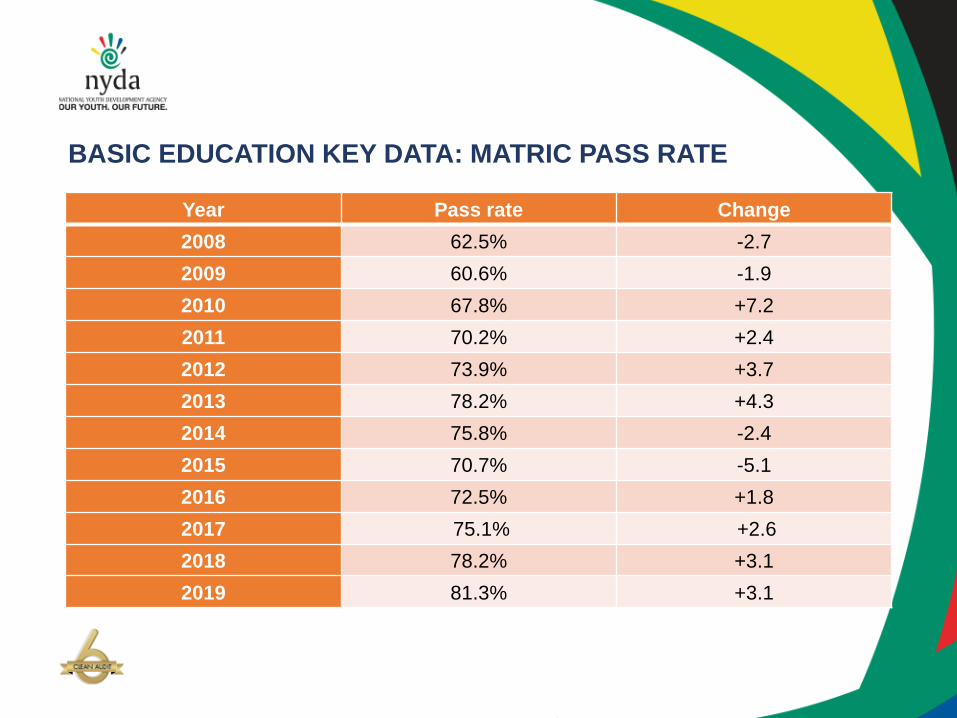
BASIC EDUCATION KEY DATA: MATRIC PASS RATE
Year Pass rate Change
2008 62.5% -2.7
2009 60.6% -1.9
2010 67.8% +7.2
2011 70.2% +2.4
2012 73.9% +3.7
2013 78.2% +4.3
2014 75.8% -2.4
2015 70.7% -5.1
2016 72.5% +1.8
2017 75.1% +2.6
2018 78.2% +3.1
2019 81.3% +3.1

BASIC EDUCATION KEY DATA
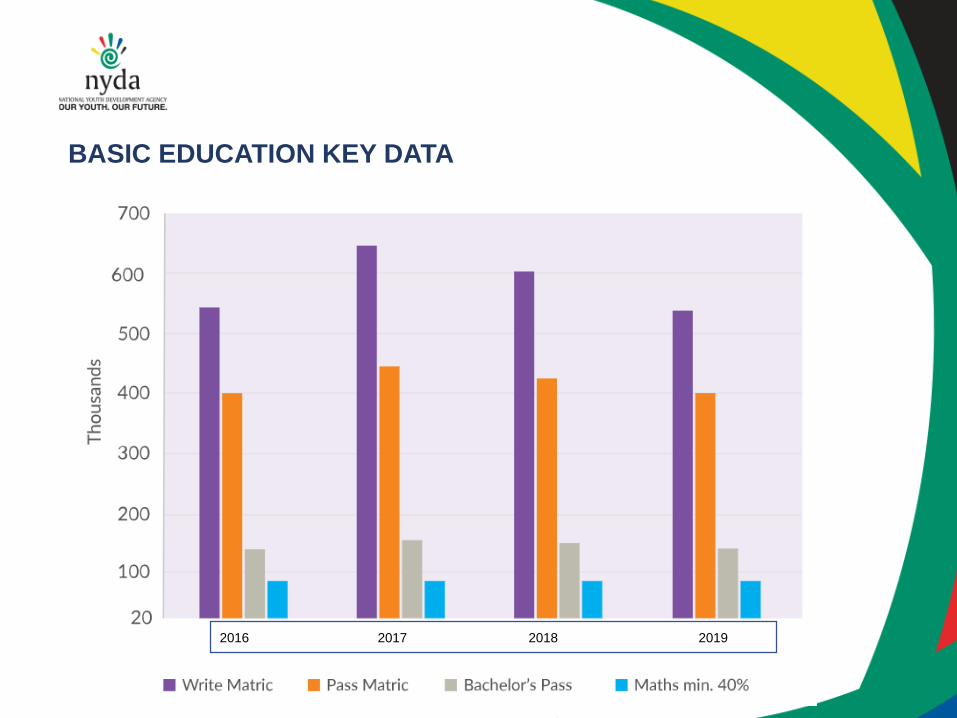
BASIC EDUCATION KEY DATA
2016 2017 2018 2019
BASIC EDUCATION KEY DATA

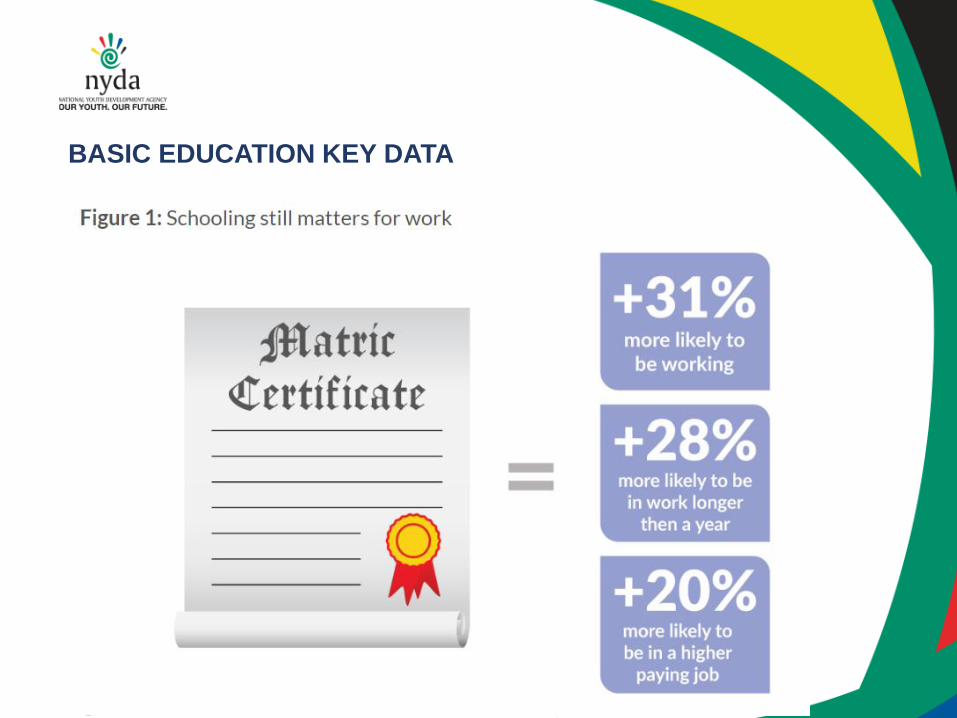
BASIC EDUCATION KEY DATA
Basic education system
South Africa spends approximately 18% of its annual budget on basic education; however, the system remains a poor state of affairs. South Africa has achieved near universal access to education; however, this has not translated into positive educational outcomes.
The following matters are listed as factors that illustrate the challenges in South Africa’s basic education system:
Literacy and numeracy
Literacy and numeracy are critical in being able to secure formal sector employment, however South Africa continues to find lower levels of literacy and numeracy that impact our ability to build a high skills country.

BASIC EDUCATION KEY DATA
Role players in education of young people
Parents
Parental involvement in a young person’s education has been shown to have positive benefits for educational attainment. This is even more important in South Africa’s public schooling system where teacher to student ratios mean that young people are often deprived of sufficient attention which would allow them to succeed. Yet, often because of socio-economic conditions in South Africa where parents are single parents or work long hours to be providers, young people lack parental involvement.
School Governing Bodies (SGB’s)
SGB’s are key to ensuring stakeholder accountability for schools. The appointment of SGB’s was an important step in creating accountability for outcomes – however many SGB’s do not have sufficiently qualified individuals who can manage complex challenges and develop practical solutions to these challenges.

BASIC EDUCATION KEY DATA
Government
Government has doubled its investments in education over the last 20 years. Despite this, challenges remain. There are views that government is not sufficiently regulating the time spent by teachers in the classroom and strike action can consume as much as 10 school days a year. Other challenges that government must consider are the continuous changes to the curriculum, inadequate teacher training and support mechanisms, teaching time in comparison to other activities and the availability of key learning materials and resources. Infrastructure in many schools is still lacking, not creating a conducive environment for learning. Better teachers are also not attracted to poorly resourced schools as it impacts on their individual performance.
Teachers
It is estimated that 18 000 – 22 000 teachers exit the profession each year, while higher education institutions produce 6 000 - 10 000 new teacher graduates each year. Many new graduate teachers are attracted to international teaching opportunities which offer better benefits than local teaching jobs. The shift of the teaching profession from training colleges to universities has lowered the number of teachers being produced. Equally there is insufficient development programmes for existing teachers
Studies have also further indicated that twenty percent of teachers are absent on Mondays and Fridays. An additional issue that has been flagged has been sexual involvement of teachers with students creating an unsafe learning environment. In schools, however, where principals enforce discipline amongst teachers, results and outcomes in terms of student performance are better.

BASIC EDUCATION KEY DATA
Learners
Amongst learners, two major issues were identified that hamper progress. One is drug and substance abuse even at primary education level, where these substances are easily accessible affecting young people’s ability to learn from an early age. The second is teenage pregnancy and while the South African Constitution and Bill of Rights protects the rights of pregnant mothers to return to school, effectively only one third end up returning post pregnancy.
Violence in schools remains an issue. Rape, sometimes by teachers themselves has been an experience of boys but mainly girls attending school. In addition, other forms of sexual abuse, pregnancy and poverty all play a marked role in educational outcomes

HIGHER EDUCATION KEY DATA
• Funding of Higher Education in South Africa is comparatively lower than othercountries which are at a similar level of economic development. There is also skewedparticipation in the higher education sector in terms of race. Of those young peoplewho drop out of the higher education sector, 70% would be of “lower economicstatus”. Race and economic status both play a role in terms of educationaldisadvantage in higher education in South Africa.
• Access to higher education has improved substantially since the advent ofdemocracy. In 1994. In 1994, 55% of students at public universities were black(African, coloured and Indian), 43% were African and 55% were male. By 2010 thesefigures were 80% black, 67% African and 43% male. There has therefore been amajor move in terms of access to higher education but less so in terms of success.
• NSFAS has evolved over the years and now provides a large share of its disbursements toTechnical and Vocational Training Colleges (TVET) and now implements since 2016 astudent-centered model of disbursements to students rather than institutions. NSFASfunding has grown from R441 million in 1999 to R8.5 billion in 2013. In the 2019 / 2020financial year, NSFAS disbursed R15.4 billion of which the main driver was theFeesMustFall campaign of 2015. The scale of NSFAS is also visible in terms of the numberof students funded. In 1991, TESFA funded 7 240 students. In 2019 / 2020 NSFAS funded550 000 students across Universities and TVET Colleges

HIGHER EDUCATION KEY DATA
• The role of NSFAS in increasing access to higher education cannot berefuted. There is also a growing body of evidence that NSFAS has impactednot only on access but also on student progress and mobility. An analysis ofthe period 2005 – 2015 indicates that 91% of NSFAS student graduateshave found employment. University graduates are at 95% which is higherthan TVET graduates. The concerning data is that only 46% of NSFASstudents graduate. Given the substantial financial investment and highemployment absorption of NSFAS graduates this graduation rate isdisappointing. There is also a higher employment absorption for studentswho are from Engineering, Health Professions and Related ClinicalSciences, Education, and Architecture and the Built Environment fieldsrather than for graduates from Public Management and Services, SocialSciences and Languages, Linguistics and Literature fields

SKILLS DEVELOPMENT KEY DATA
• South Africa is characterised by a two-economy challenge – the formal and the informal. The Skills Development Levy does not seem to have any impact on the informal economy which is often characterised by low skilled work and non-registration for taxation and thus meeting the criteria for the SDL is unlikely. There is also a view that the linkages between the formal and informal economy are unclear and hard to define. This makes it challenging for the SDL to bridge the gap.
• The SDL does derive benefit particularly for in service training. Overall, the SDL seems to benefit larger firms more than smaller ones and this finding is similar to international findings on a skills levy/tax. The SDL does not offer sufficient support to South Africa’s informal sector.

• On education, concerns were raised about effectiveness
and accessibility of TVET colleges, particularly in more
rural areas.
• There is a perceived lack of support for learners who
dropped out of school and those who have not passed
matric.
• The youth in Limpopo expressed a concern on lack of
access to TVET colleges which most are not closer to
their area, specifically in Musina municipality.
• Concern about shortage of educators and classrooms
that will accommodate all learners in schools was also
raised. This is believed to negatively affect the
performance of the learners.
• Some of the youth raised other issues related to the fact
that learners do not get career guidance from educators,
which affect them when they have to choose the field of
study at tertiary institutions.
How Challenges Affect the Life of the Youth
58
Education
• The proposal from the youth is that this has to start at
high school level where educators (especially life
orientation educators) assist learners in choosing
subject streams based on aspired professions.
• The youth is also of the view that lowering the
standard of a pass mark in matric affects performance
of learners at tertiary level based on performance
standard required.
• The youth would also like the school leaving age in
matric to be increased from 18 to 20 years, to allow for
those who may have been kept back a grade for
whatever reason.
• The youth feel that there is a need to bring back the
technical schools to accommodate those who excel in
artisan.
• Lack of security within school premises is said to
expose learners to illegal substances and dangerous
weapons.

MEDIUM TERM STRATEGIC FRAMEWORK: PRIORITY TWO:
EDUCATION, SKILLS AND HEALTH


HEALTH

HEALTH KEY DATA
• The South African youth are at risk for unprotected sex, unhealthy eating habits and violence, all of
which start in their youthful years and continues into adulthood. This sexual behavior
simultaneously results in social and educational problems, such as failure to complete high school,
unemployment, crime, morbidity and sometimes mortality.
• Research shows that about a quarter of women in sub-Saharan Africa currently use modern
contraceptive methods, with levels highest in southern Africa (Darroch JE, 2013). In South Africa,
estimates of the proportion of women of reproductive age using modern contraceptive methods
have increased steadily from 26,3% in 2002/2003 to 37,3% in 2013/2014 (Chersich, 2017).
• A South African study done among learners in Grades 8, 9 and 10 in public schools across the
eight districts of the Western Cape shows that the use of tobacco, alcohol and cannabis (dagga)
were the three most frequently reported substances used by Grade 8–10 learners in the Western
Cape. Alcohol was the most regularly reported substance used, with 66% of learners reporting
ever having used alcohol. Among learners who reported lifetime use of alcohol, more than 33,3%
reported current use, almost 25% reported alcohol use in the week before the study, and almost
25% reported indulge-drinking in the two weeks prior to the study. Among those who drank
alcohol, almost 33,3% reported early initiation of alcohol use (before the age of 13 years), with
10% reporting using alcohol on a weekly basis. A small percentage (2%) reported being drunk on
a daily or (10%) on a weekly basis. Males were more likely than females to report indulge-drinking
(25,4% vs 19,8%), weekly alcohol use (12,2% vs 8,3%) and weekly drunkenness (11,6% vs 7,9%).

HEALTH KEY DATA
• Suicide has become a significant public health problem in South Africa. The average rate of
suicide in South Africa in 2019 was 17,2 per 100 000, accounting for 8% of all deaths. Results
from a survey conducted by the South African Medical Research Council in 2018 highlighted that
one in five adolescents considered suicide.
• Research on risk behaviors indicated that many factors influence suicide attempts among young
people, including alcohol abuse, being threatened by someone with a weapon, bullying and
previous suicide attempts, which have all been associated with a high prevalence of suicide and
suicidal ideation among adolescents
• Information on violence in South Africa shows that adolescents who are involved in bullying, either
as victims or as perpetrators, are more likely to be socially isolated than those who are not
involved, since they may lack a sense of belonging. A national survey of violence at school
conducted in 2013 indicated that 24% of learners were bullied on school property
• Sexual and Reproductive Health – HIV Incidence among adolescent girls and young women
declined by 60% between 2004 – 2018.
• Teenage pregnancy is also on the decline.

• Health concerns raised were around issues of resources
such as availability of medicine for HIV/AIDS,
contraceptives for female youth and shortage of
health care personnel.
• In provinces next to ports of entry, the youth expressed a
concern that illegal immigrants take up jobs that they
should be employed in. Access of illegal immigrants to
health care resources and RDP houses is believed to
exert pressure on limited resources for South Africans
and youth in particular.
How Challenges Affect the Life of the Youth
88
Health
Source: Stats SA Mid-year population estimates 2018, Quarterly Labour Force Survey (QLFS) Q1:2019


SOCIAL COHESION

SOCIAL COHESION AND NATION BUILDING KEY DATA
• Majority of SA’s youth are interested in public affairs (55%).
• There were 11.8 million eligible voters between 18-29 in 2019.
• Nine million South Africans eligible to vote have not registered to vote, most
of them young people, 46% of this group are aged 20 to 29, according to the
Independent Electoral Commission. Approximately four million young
people.
• Youth voter turnout decreased about 11% between 2014 and 2019.
• We are still relatively similar to comparative nations for youth voter turnout.
• Youth volunteerism is considered high relative to other countries.
• Participation in civic duties among youth has increased.

MEDIUM TERM STRATEGIC FRAMEWORK: PRIORITY FIVE:
SOCIAL COHESION AND SAFER COMMUNITIES


EFFECTVE YOUTH DEVELOPMENT
MACHINERY

EFFECTIVE YOUTH DEVELOPMENT MACHINERY
• NYDA Amendment Bill process.
• NYP 2030 and IYDS.
• National Youth Development Coordination Forum.
• Presidential Youth Employment Intervention, Presidential Working Group on
Youth.
• Strengthening of youth directorates – very high risk due to austerity
measures.

MEDIUM-TERM STRATEGIC
FRAMEWORK
PRIORITY ONE: CAPABLE, ETHICAL
AND DEVELOPMENTAL
STATE


MEDIUM-TERM STRATEGIC
FRAMEWORK
PRIORITY SEVEN: A BETTER AFRICA AND
A BETTER WORLD


NATIONAL BUDGET

2021 BUDGET

CONSULTATION OUTCOMES

CONSULTED STAKEHOLDERS
Date of Consultation Name of the sector consulted
05 February 2021 Persons with Disabilities
05 February 2021 Young Women in Business
09 February 2021 2nd sphere of government, viz, provinces
15 February 2021 Office of the Premiers (Provincial) and National Government
18 February 2021 Civil Society (SAYC)
19 February 2021 Gauteng Office of the Premier
26 February 2021 Local Government Sphere (SALGA)
11 March 2021 Youth Business Sector
11 March 2021 Free State Office of the Premier/Mpumalanga
17 March 2021 Civil Society (Activate SA)/ SAYC Provincial structures
17 March 2021 Kwa Zulu Natal Office of the Premier
19 March 2021 Eastern Cape Provincial Interdepartmental Youth Forum
30 – 31 March 2021 National Consultation with youth political formations and other
youth stakeholders.
15th April 2021 Limpopo Office of the Premier
05th May 2021 Western Cape Office of the Premier
07 May 2021 North West Office of the Premier

• The private sector should forge a partnership with institutions of higher learning to aid in students’ placements for practical experience prior to completion of their qualifications.
• Unemployed youth, school leavers and graduates of tertiary institutions should be provided vocational skills. This will improve their chances to penetrate the labour market, whether as self-employed or as employees.
• Government and established farmers should provide agricultural support and training to youth on small scale but sustainable farming.
• Technical/artisan schools are required to accommodate youth who do not perform well in academically aligned schools.
Consultation
128
• Government has to be seen rooting out corruption and nepotism.
• Recreational facilities in townships or rural areas such as sports ground, parks, etc. have to be provided in order to prevent youth from engaging in illegal activities.
• Employment opportunity content should be easily accessible to the youth to improve take up of government and private sector opportunities that are available.
• Improve access to structures such as the National Youth Development Agency or youth centres that provide information on youth programmes aimed at improving their lives.
• Encourage youth to be agents of caring for the environment in light of climate change.

Consultation
129
Education, Skills &Second Chances Health and Pandemics
Most young people have intellectual disabilities that
the society does not necessarily comprehend.
Young people who cannot finish school because of
late diagnosis of disabilities.
Challenges faced by youth disabilities.
Many youths with disabilities are not educated.
NYS programs are excluding disable youth as
military training require matric
Youth with intellectual disability are prone to be
suicidal.
Government strategies should regard youth that have
these disabilities – as documents are written.
Regard youth with no access to internet no tools
Teenage pregnancy
issues of mental health
There are 32 different forms of of
disabilities in South Africa and some
of them are ignore because of lack of
awareness
Physical and mental health refers to
SADAG, the strategy on this issue
does not make sense.
There is continued marginalization of
people with disabilities
Issue of obesity on the increase
Health promotion including mitigation
against Covid-19.

Consultation
130
Economic Participation and
Transformation
Targeted programs must be specifically set aside for youth with disabilities to hold implementers
accountable.
While policies guide the percentage of employment expected in the sector for persons with
disabilities, companies are not meeting the targets or being held accountable for that.
There is no form of effort made by government to ensure that the state plays a role in being a
catalyst for persons with disabilities and advocate for their rights.
Most excuses of companies escape employing youth with disabilities because they cannot find
youth with disability which is not true.
Companies are not even meeting the targets.
Employers tend to have less confidence in graduates from historically black universities
Young people are excluded from some of the influential structures of government
National Treasury to liaise with SOEs in ensuring that some procurements are earmarked for
youth businesses
The youth ICT Strategy needs to be development.
The DPSA has signed circular that enforces the HoDs in government to reserves at least 30%
vacant positions for youth.
National Treasury to liaise with SOEs in ensuring that some procurements are earmarked for
youth businesses.

Consultations
131
Social Cohesion Youth Machinery
Participation in sport
Volunteering programs
Racism is fully addressed in the document, but
ableism is not address at all.
In trying to address youth business challenges, the
“social inequality” must also be taken into
consideration.
Focus more on deeper issues, such as tribalism,
and or regionalism than on racism Voter education
and public participation need to be enhanced
among youth.
Interracial dynamics are emphasized more than
tribalism. A provision must be made to balance the
two
Limited private sector involvement in supporting
people with disabilities
Social ill on social media – e.g., bullying,
There is no mainstream and
coordinated approach
There are issues of working in silos
which create duplication of efforts.
The document should strongly
address the questions of proper
coordination, collaboration, and the
mainstreaming of youth
development.
There must be clear guidelines
regarding the IYDS
implementation.
Uniform coordination across the
board for the purpose monitoring
and evaluation.

MONTORING AND
EVALUATION

MONITORING AND EVALUATION
Co
mm
itm
en
t Each year in November progress report on IYDS presented from 2021 -2025
Commitment Each year
forum convened in early December from 2021 -2025