THESIS Giat Gemintang Dzakirat - Repository UIN JAMBI
92
THE EFFECT OF GRAPHIC ORGANIZER METHOD ON STUDENTS' READING COMPREHENSION AT JUNIOR HIGH SCHOOL 26 TANJUNG JABUNG TIMUR THESIS Giat Gemintang Dzakirat (TE.161724) ENGLISH EDUCATION PROGRAM FACULTY OF EDUCATION AND TEACHING TRAINING THE ISLAMIC UNIVERSITY SULTAN THAHA SAIFUDDIN JAMBI 2021
-
Upload
khangminh22 -
Category
Documents
-
view
0 -
download
0
Transcript of THESIS Giat Gemintang Dzakirat - Repository UIN JAMBI
THE EFFECT OF GRAPHIC ORGANIZER METHOD ON STUDENTS'
READING COMPREHENSION AT JUNIOR HIGH SCHOOL 26
TANJUNG JABUNG TIMUR
THESIS
Giat Gemintang Dzakirat
(TE.161724)
ENGLISH EDUCATION PROGRAM
FACULTY OF EDUCATION AND TEACHING TRAINING
THE ISLAMIC UNIVERSITY
SULTAN THAHA SAIFUDDIN JAMBI
2021
THE EFFECT OF GRAPHIC ORGANIZER METHOD ON STUDENTS'
READING COMPREHENSION AT THE EIGHT GRADE OF JUNIOR
HIGH SCHOOL 26 TANJUNG JABUNG TIMUR
THESIS
Submitted to fulfill one the requirement to obtain the Undergraduate
Degree (S1) in English Education Program of Education Faculty of The State
Islamic University of Sultan Thaha Saifuddin Jambi
GIAT GEMINTANG DZAKIRAT
TE. 161724
ENGLISH EDUCATION STUDY PROGRAM
TARBIYAH AND TEACHER TRAINING FACULTY
THE STATE ISLAMIC UNIVERSITY
SULTAN THAHA SAIFUDDIN
JAMBI
2021
i
ii
iv
Advisor I : Shynta Amalia, M.pd
Advisor II : Faiqah Mahmudah,M.pd
Address : Faculty of Tarbiyah and Teacher Training The Islamic State
University of Sulthan Thaha Saifuddin Jambi
The dean of Faculty of Tarbiyah and Teacher Training
The Islamic State University of Sulthan Thaha Saifuddin Jambi
In Jambi
OFFICIAL NOTE
Assalamualaikum warahmatullahi wabarakatuh,
After reading and making some necessary corrections, we agree that thesis
entitled “The effect of Graphic Organizer method on Student's Reading
comprehension at JUNIOR HIGH SCHOOL 26 TANJUNG JABUNG
TIMUR” by Giat Gemintang Dzakirat, TE.161724 , English Education Program
is approved for thesis defense as partial fulfillment of the requirements to obtain
undergraduate degree (S1) at English Education Study Program Faculty of
Tarbiyah and Teacher Training at The Islamic State University of Sultan Thaha
Saifuddin Jambi.
So, we submit it in order to be received well. We appreciate your attention.
May this thesis be a great benefit for the religion and nation.
Wassalamualaikum warahmatullahi wabarakatuh
Advisor I Advisor II
Shynta Amalia, M.Pd Faiqah Mahmudah, M.Pd
NIP.198906232015032006 NIP.198704172015032003
iii
KEMENTERIAN AGAMA REPUBLIKINDONESIA UNIVERSITAS ISLAM NEGERI
SULTHAN THAHA SAIFUDDIN JAMBI FAKULTAS TARBIYAH DAN EGURUAN
Jalan Lintas Jambi-Muaro Bulian KM.16 Simpang Sungai Duren Kab.Muaro Jambi 36363 Telp/Fax : (0741)
583183 – 584118 website:www.iainjambi.ac.id
iv
Dedication
Alhamdulillah bini‟mati tathimushaalihaat
Thanks to Allah subhanahu wata‟ala, The most Gracious, the most Merciful, the
Creator of the Universe for giving me the blessing and leading me, hence, I could finally
finish writing this thesis. Sholawat to the Prophet Muhammad Shallallahu „alaihi wa
sallam. His presence really change the world. Special thanks to :
My beloved parents, Tarmuzi, S.pd.I and Erny yusnita who have giving me
material, endless love and encouraged me and never stop prayed for my success now and
in the future, always being with me and guiding me to pass every challenge that I face,
your prayers are really powerful.
My older sister, Ners Fifi afrilla, S.kep and my brother-in-law Rd Rafsanjani,
A.Md. KG and my younger sister Fatimah Az-Zahra, who are always there, encourage
motivating and I feel endless love, hopefully we will always love now, tomorrow and
forever, and we are equally happy for our parents.
My soulmate THE JOMBS (Cici Rezki Ananda, Nopi Windi Lestari,
Muhammad Ishak, M. Gilang Ramadhan, M. Marwan Nuuri ) when we meet in first
semester until the last semester we are always together. Thanks for your support,
motivation, and quality time to share happiness and sadness with me and understand me,
although we are sometime different think but you make know what the meaning of true
friendship.
My beloved Pratu Sarwono, thank you for your help, support, motivation, thank
you for continuing to love me and accompany me in every process of my life, even at the
most difficult point, you are still with me.
My greatest advisor Shynta Amalia, M.Pd and Faiqah Mahmudah, M.Pd who
have given me all the advise, suggestions and motivation to finish this thesis.
All of my classmates from English Department especially batch 2016 Class A,
thank you for being my friends, thank you for your help, support, suggestions and
motivations for me in arranging this thesis.
My beloved almamater ENGLISH EDUCATION STUDY PROGRAM AND
ISLAMIC UNIVERSITY SULTHAN THAHA SAIFUDDIN JAMBI thanks for your
support and your participants.
v
The last, thanks to all Student's at the eight grade of SMPN 26 Tanjung
Jabung Timur as subject for help me to completed this thesis.
May Allah grant you all goodness. Aamiin Allahumma aamiin
vi
MOTTO
يسراالعسرمعإن
“Sesungguhnya sesudah kesulitan itu ada kemudahan.” (QS.
Al- Insyirah: 6)
vii
ACKNOWLEDGEMENT
Alhamdulillah, Firstly, In the name of Allah, the most gracious and
merciful, the lord of universe. Because of His blessings, the researcher could
finish this thesis as one of the requirement for S1 degree in English Education
Program of Education and Teacher Training Faculty of the State Islamic
University of SulthanThaha Saifuddin Jambi.
Secondly, peace and salutation always be given to our prophet Muhammad
Shallallahu „Alaihi Wasallam who has guided us from the darkness into the
lightness.
The researcher realizes that this thesis would have not been completed
without the help, advice and guidance from many people. Therefore, in this
opportunity the researcher would like to express thanks and gratitude to following
parties for their contribution:
1. Prof. Dr. H. Suaidi Asy‟ari, MA., Ph.D Rector of the State Islamic University
of Sulthan Thaha Saifuddin Jambi.
2. Dr. Hj. Fadlilah, M. Pd. as Dean of Faculty of Education and Teacher Training
of The State Islamic University of Sulthan Thaha Saifuddin Jambi
3. Wahyuni Fitria, M.Pd as the chief of English Education Program.
4. Shynta Amalia, M. Pd as my first advisor and Faiqah Mahmudah, M.Pd as my
second advisor.
5. All lecturers at the Faculty of Education and Teacher Training of The State
Islamic University of Sulthan Thaha Saifuddin Jambi.
6. The students in eight grade of SMPN 26 Tanjung Jabung Timur as my subject
in my research and give me many information about my data source.
7. All my friends in English Education Study Program”2016” who has given their
support and spirit in finishing this thesis.
It is expected that this thesis will give contribution to the Students of
English Education Program that will be English teacher in the future. Then, the
viii
researcher realized that this thesis is still far from being perfect. For that reason,
the researcher hope constructive critics and suggestion from readers for the
perfection of this thesis. May Allah Subhanahu Wata‟ala always gives guidance
and blessing to us. Aamiin Ya Rabbal Alamin.
Jambi, November 2021
Researcher
ix
ABSTRAK
Nama : Giat Gemintang Dzakirat
NIM : TE.161724
Jurusan : Pendidikan Bahasa Inggris
Judul : Pengaruh metode Graphic Organizer terhadap
Pemahaman bacaan siswa kelas delapan SMPN 26
Tanjung Jabung Timur.
Tujuan dari penelitian ini adalah untuk menemukan ada atau tidak peningkatan
yang signifikan kemampuan membaca siswa setelah diberikan perlakuan berupa Graphic
Organizer. strategi graphic organizer ini untuk mengetahui sejauh mana pemahaman
membaca siswa, Metode penelitian ini adalah quantitatif. Desain yang digunakan adalah
pre-eksperimental. Sampel penelitian ini adalah 25 siswa kelas VIII. Data dikumpulkan
menggunakan test reading. Hasil penelitian menunjukkan bahwa nilai rata-rata post-test
(67,8) lebih tinngi dari nilai rata-rata pre-test (50,6). Jadi, Ha diterima. Yang berarti ada
peningkatan hasil reading siswa setelah diberikan perlakuan. Selanjutnya, peneliti telah
mengkalkulasikan nilai thitung > ttabel (8,2256 > 2,093) and significant 2-tailed < 0,05
(0,000 < 0,05). Jadi, Ha diterima. Yang berarti Graphic Organizer memberikan efek
terhadap kemampuan membaca siswa.
Kata Kunci: Graphic Organizer, pemahaman membaca
x

ABSTRACT
Name : Giat Gemintang Dzakirat
NIM : TE.161724
Major : English Education Study Program
Title : The effect of Graphic Organizer method on student's
Reading comprehension at the eight grade of SMPN 26
Tanjung Jabung Timur.
The objectives of this study were to find out wheter or not there is significant
improvement on students’ reading comprehension achievement after being taught by
graphic Organizer. This graphic organizer strategy is to find out the extent of students'
reading comprehension, The method of this reseacrh is quantitative research. The
design of the research is pre-experimental. The sample of this research was 25 students
at eight grade students. The data were collected by using reading test. The result of the
analysis indicated that the mean score of post-test (67,8) is higher than pre-test (50,6).
so that Ha was accepted. It means, that there was an improvement of students’
reading comprehension achievement
aftergivingtreatment.Next,theresearcherhadcomputedthatthescoreoftobtained> ttable
(8,2256 > 2,093) and significant 2-tailed < 0,05 (0,000 < 0,05). So, Ha was accepted. It
means that Graphic Organizer has an effect to the student’s reading comprehension.
Keywords : Graphic Organizer, Reading comprehension
xi

TABLE OF CONTENTS
PAGE OF TITLE .................................................................................. i
TABLE OF CONTENT ........................................................................ ii
CHAPTER I INTRODUCTION
A. Background of the Study...................................................... 1
B. Limitation of the problem ................................................... 5
C. Problem of the research ........................................................ 5
D. The Objectives of the research ............................................. 6
E. The Significances of the Research ....................................... 6
CHAPTER II LITERATURE OF REVIEW
A. Theoretical Review .............................................................. 7
Concept Reading .................................................................. 7
1. Definition of of Reading Comprehension ..................... 8
2. Components of reading comprehension ........................ 8
3. Level of reading comprehension ................................... 10
4. Assessment of reading comprehension ......................... 11
5. Readability Level of English Text ................................ 11
6. Graphic Organizer Method .................................................. 12
B. Previous Studies ................................................................... 16
C. Hypothesis ............................................................................ 17
CHAPTER III RESEARCH METHODOLOGY
A. Setting and Time of the research ..................................................... 19
B. The design of the research ........................................................ 19
C. Population, Sample and Sampling ............................................ 20
D. Research variable ...................................................................... 21
E. The Research Instruments ......................................................... 21
F. Validity and Reability .............................................................. 22
G. Normality test............................................................................ 26
xii
H. Data collection method ............................................................ 26
I. Data analysis ............................................................................. 28
J. Statistical Hypothesis
CHAPTER IV RESEARCH FINDING AND DISCUSSION
A. Finding the Study
1. DescriptiveAnalysis................................................................................... 29
2. PrerequisiteTest........................................................................................ 38
3. StatisticalAnalysis..................................................................................... 39
4. Interpretations........................................................................................... 42
CHAPTER V CONCLUSION AND SUGESSTION
A. Conclusion................................................................................................. 46
B.Suggestion................................................................................................. 46
REFERENCES
APPENDIX
xiii
1
CHAPTER I
INTRODUCTION
A. Background of The Research
Reading is the activity of perceiving, analyzing, and interpreting the reader to
get the message the writer wants to convey in written media, reading is a process
carried out and use by readers to obtain messages, which the writer intends to convey
throught the media of words or written langguage, so in reading there is an attempt to
get the message that is in writing.
Reading has an important role in learning English. Nunan (2003, p. 69) states
that reading is an essential skill for learners of English as a second language. By
strengthening reading skills, learners will make greater progressand development in
all areas of learning. For most learners, it is the most important skill to master in
order to ensure success not only in learning English, but also in learning any content
class where reading in English is required.
Reading is an important activity to get information and to support language
learning activities. Pang et al (2003, p. 6) state that reading is about understanding
text. Understanding text include get meaning from the text. understanding text is help
by reader prior knowledge. Their environment, people they meet, the previous text
they read, and experience they have every day help people to understand the text
better.
In fact, reading is a complex activity that involve both perception and thought.
Reading enables readers to gain new knowledge. It opens up new world and
oportunities. Through reading, people might enjoy literature, knowing something
new, getting job, and expand their thought. The readers‟ prior knowledge, experience,
attitude, and the social environment where the readers lived or grow helps readers in
understand text .
2
In fact, many students have not been able to understand and understand
reading, the researcher obtained the following data: from 25 students, it was found
that 10 students passed the KKM and 12 students still got grades below the KKM
made by the teacher, the passing value (KKM) was 70.
In fact, in Indonesia students‟s reading achievement is still out of
expectation. It can be seen from the data of Programme for International Students
Assessment (PISA) on december 16, 2016 from 69 countries Indonesia rank 62nd
assessment. Referring to the similar discussion, it is reported in Kompas, a daily
newspaper, (2013) that around 37,6 % of 15-yearold students are merely able to read
the texts without understanding the meaning carried by the text. Only 24,8 % out of
them are able to correlate the text with their prior knowledge. It means that many
students still have insufficient ability to comprehend the texts. This research proved
that reading is still need to be improved.
According to UNESCO (2015), based on survey 2011 from 61 countries only
0,001 percent of students who has read in indonesia. Others factor that influence low
reading comprehension is a material that is given by the teacher. The material are
usually given by the teacher, the students say it is difficult to understand, so thats way
it is not enthusiasm in english language learning material. In addition, teacher use the
strategies and procedures that are less appropriate for english learning and the factor
that might cause the students fail in reading is that the students get difficulties in
comprehending the text they are reading and number of students were found to
encounter some difficulties in reading activity.
However, reading is not as easy as what students think. There are some
difficulties which are faced by students such as vocabulary and background
knowledge, problems with grammatical and also poor reading strategies. It makes the
students could not get information through reading. According to Nurkasih (2016)
“the students also find some difficulties students feel that is not easy to have ability to
draw the meaning and interpret the information from the text” (p. 2). Therefore,
3
sometimes the subject makes the students boring and they always get bad score in
reading comprehension. A research on reading skill in Indonesia has revealed that the
students‟ skills particularly in reading comprehension are still far from satisfactory.
Sixty nine percent (69%) of 15-year-old Indonesian students have internationally
worst reading performance (Media Indonesia, 2003).
Moreover, based on the results of research conducted by Hidayati (2018), she
found that mostly, the students failed in the reading comprehension because they are
poor vocabulary, poor mastery of grammar, difficult to understand long sentences and
text, poor of media learning or support from the family, and lack of knowledge about
strategies of reading comprehension. It means that to know the difficulties in reading
comprehension is important to find the solution in learning language.
Based on preliminary data, reading is one of them important skills in language
that school students face at many levels including in junior high school. In teaching
English, this is stated in the English competency standards junior high school which
has one of the competency standards is able to understand and use short texts and
short essays with everyday life context and accessing knowledge. It advises English
teachers to teach students clearly understand some English texts to achieve that
standard competence.
In this study, the researcher has chosen the eighth grade students of SMP 26
Tanjung Jabung Timur in the academic year of 2020/2021. Based on the researcher‟s
observation on 25 April 2020 the students of Junior High School of 26 Tanjung
Jabung Timur students have difficulty in identifying information from the text and
they cannot understand what they have read, when students read the text they find it
difficult to know the main idea of a paragraph, general information and specific
information in a text. Because students don't practice their English outside the
classroom or at home.
4
In addition, many students do not have much time to read because when the
teacher gives them the text and asks the students to answer questions about the text,
they only focus on how to answer the question quickly without applying some
strategy. In fact, reading strategies are very important to help students understand
information in the text. They ignore the importance of understanding the text as a
whole and ultimately fail.
Researchers hope that by using the Graphic organizer, students can answer
questions of understanding more easily or minimize their mistakes. This strategy
helps students to gain a better understanding of the explicit and implicit ideas
contained in the text through different levels of understanding. It also helps them to
understand certain types of questions and find the location of the answers. They may
become more skilled at finding out answers in the text or composing their own
answers. In addition, this strategy can encourage students to monitor their own
understanding of reading, this benefit can lead them to get better reading test results
and of course have better reading comprehension.
In this research, the solution that the researchers offer is to use the Graphic
Organizer Method to teach students to read. By using this method, students can
easily understand the contents of the text and easily memorize vocabulary, A graphic
organizer is simply an image or format used to represent informationand to show the
relationship between ideas. Making it easier for students to bridgegap between
limited background knowledge and vocabulary.
In order to accomplish student‟s need toward reading, K13 provides reading
as one of the skills that must be taught and learned inSMPN 26 TANJUNG JABUNG
TIMUR is one of the schools that also uses K13 as its guidance in teaching and
learning process. English has been taught twice a week with 45 minutes for one hour.
In order, to be successful to teach writing skill, writing should be taught in effective
and efficient way.

5
Based on the explanation and the problem above, the researcher is interested
in conducting a research entitled "The effect of using Graphic Organizer method
on Students' Reading comprehension of the eight grade of Junior high school 26
Tanjung Jabung timur".
B.Limitation of The Problem
In this study, the researcher limits the object of the research on Eighth Grade
Students‟ Reading Comprehension at SMP N 26 Tanjung Jabung timur, in the
academic year of 2020/2021. The researcher also limits according to the school
curriculum, because it will make students easy to understand the text. Graphic
organizer will be aplaied in class VIII to find students‟ reading comprehension of
Eighth Grade Students at SMPN 26 Tanjung Jabung timur.
C. Problem of The Research
Based on the background above, this research aimed to provide the answer to
these following questions :
1. Is There any significant effect after using graphic organizer on students'
reading comprehension?
D. The Objectives of The Research
1. To find out the whether Do the students taught by graphic organizer technique have
better reading comprehension than those taught by non-graphic organizer
techniqueof the eight Grade Students at SMPN26 TANJUNG JABUNG TIMUR?
E. The Significances of The Research
The significant of this reaserch is expected to be useful as follows:
1. For the teachers
The finding of the research method can be used as a consideration in
selecting the appropriate method or ways in teaching learning process for Junior

6
high School especially for students Reading skill. Besides, it can be used to vary
such activities of reading that support and motivate their students.
2. For students
The finding of the research can improve their reading skill and motivate
the students that reading is not difficult.
3. For the reader
The finding of this reaserch can be used as one of the information about
the use of Graphic Organizer Method in teaching and learning English especially
in teaching reading

7
CHAPTER II
LITERATURE OF REVIEW
A. Theoretical Review
1. Concept of Reading
Reading is one of the most important academic skills needed by students as a
source of knowledge and enjoyment. Reading is also quite possibly the most
important skill that students must acquire in order to be succes in the school and life.
Moreover reading has been a highly emphazised skill in the english foreign learner
context. In teaching reading, the teacher has to pay attention to some principles of
teaching reading. According to Antony (2010, p. 42) in the process of teaching
reading, the teacher must know the steps of teaching reading to the students such as.
a. Pre-reading activity
This activity is designed to prepare the students for actual reading of the
selected materials. In other words, the teacher helps the students anticipate the text
they will read. In pre-teaching activity the teachers introduce the topic by
brainstroming through media, and pictures.
b. Whilst-reading activity
This activity is the core activity in teaching learning process. In whilst
reading activity, the teacher distributes the text to the students. Ask the students to
read the text, after that the teacher will give explanations about text, and ask the
students to do assignment based on the text.
c. Post-reading activity
It is an activity in teaching reading to comprehend the text. In post teaching activity,
the teacher asks the students to retell about the text and make summary about the text.
2. Definition of Reading Comprehension
The main goal of reading is comprehension. The ability to read a written
language with good comprehension and reasonable rate has long been organized to be
8
important skill. Comprehension is the process of making sense of words, sentences and
deriving meaning from connected text (Pang et al., 2003, p. 6). Horowitz (2011, p. 2) states
that reading comprehension is a complex cognitive process that depends upon a number of
ingredients all working together in a synchronous, even automatic way.
Indeed, comprehension is a complex process that includes cognitive process,
whichhelps reader to understand the text.The reader is using reading comprehension as
ways to be sure that what is being read matches their expectations and help builds on their
growing knowledge. According to the statement above it can be concluded that reading is
an active process including making use of prior knowledge to construct meaning from the
text. Comprehension in reading becomes important because it makes the readers get
something meaningful in their reading. Comprehension also help people to build on their
knowledge, because without comprehension, reading is meaningless.
3. Components of Reading Comprehension
According to Kim and Pamela (1990) as cited on Ade Novianto (2012; p.282)
said that there are five components that can help the students to read effectively.
a. Main idea.
Reading is concerned with meaning to greater extent that in with form. An
efficient readers understands not only the ideas but also relative significance as
expressed by the authors. In other word, some of ideas are super – ordinate
while others are subordinate.
b. Finding factual information.
Finding factual information requires the readers to scan specific details.Factual
information questions are generally prepared for vocational junior high school
students and those questions being with questions words.
c. Reference.
Recognizing reference words and to identify the words or phrase to which they
refer to will help to the readers understand the reading passage. English
9
students might learn many roles for the use of references words and yet be
confuse about what a particular words refers to in sentences.
d. Understanding inference
Understanding inference is almost important aspect in the reading. Writers how
ever do not write out everything and they expect the readers to understand the
writer point of view.
e. Vocabulary
Vocabulary has an important role in learning English, especially in reading
comprehension. Based on Longman New Edition (2003, p.487) vocabulary is
words known, learned, used, etc; short list of words with their meanings. Based
on statement above, reading comprehension is the reading activity which more
trough to understand the meaning, find the message of the text and reconstruct
the idea of the reader. Therefore, in the reading process the readers or the
students should understand the meaning of language that is used in text in order
to able comprehend, to analyze, and explain the content of the text by using
their own language.
4. Level of Reading Comprehension
Reading comprehension is the process of making from text. It‟s important as
teachers of English second language to teach read well. The teacher should be aware
that the primary objective of reading is comprehension or being able to find meaning
in what is read.
Reading is foreign language may face difficulties, such as: difficult
vocabulary, difficult to get certain information from the passages, difficult to get the
author‟s meaning and difficult to make a conclusion of the passage. Probably the
simple and best away to understand this is to view comprehension as occurring levels.
According to Sadoski (2004:68-72) there are three levels of comprehension are
usually proposed:
10
1) Literal Level
This level involves literal comprehension, interpreting the author‟s words in a
given sentence in a way that has meaning to us, but without considering and
weighing the implications of any interpretation we may have. Literal
comprehension involves word meaning, but it is more than decoding the meanings
of individual words one at a time. Literal comprehension deals only with the
textually explicit, with what is directly stated.
2) Inferential or Interpretive Level
The level of inferential comprehension, also called the interpretive level, is the
level of comprehending what is implied but ot explicitly stated. Build on facts in
the text: Predictions, sequence sand settings. Make a conclusion about the text.
3) Critical Reading
Critical reading involves assessing and judging the value of what is read.
Reading critically can be seen as a conversation with an author, talking back to an
author in our imagination. Based on the levels of comprehension, the researcher
designed the test to measure using literal level because the answer in literal is
usually directly stated in the text. In descriptive text the students are expected to
understand the topic and detail of the text, and answer directly stated in the text.
5. Assesment of Reading Comprehension
Reading assessment has great power to inform researchers,
teachers,administrators, and policy makers. An understanding of the principles and
uses of assessment is essential for all teachers, and in particular for teachers of
reading (Snow, Griffin, & Burns, 2005: 179). According to Bales (2018) about
Methods of Assessing Reading Comprehension. There are several methods
toevaluate a student‟s reading comprehension. Once method that the researcher
used is a formal assessment, about reading passages followed by questions about
the passage. These assessments focus on identifying the main idea of a passage,

11
understanding vocabulary in context, making inferences, and identifying the
author‟s purpose.
6. Readability Level of English Reading Texts
Assessment of text readability is useful to know whether a text is written at level
suitable for the target audience. One of the assessments to assess the text is
readability formula. The readability of a text depends upon how easily it can be
understood by the reader (Fry, 2002). A readability formula can predict the
comprehension, interest aspects. Therefore, there are many readability formula
used nowadays, one of them is the Flesch-Kincaid Readability formula. It is one of
the most famous readability formulas so far in the history of readability studies. It
is calculated by using sentence and word length as variable. In addition, to
measure the readability level, the researcher used a website of Readability Test
Tool. The researcher conclude that there are steps in using Readability Test Tool
as follows:
1. Search the Readability Test Tool on the Internet, the open it
2. After that, click “Test by Direct Input”, then input the text that you want to chek.
3. After input the text, then click the “Calculate Readability”.
4. Wait until you see the Test Results.
In conclusion, The readability should be one of the top concerns when teacher
use reading texts as teaching material. Readability is the ease with which a reader can
understand a written text. It should appropriate to the students level. Teacher should
like a tool to check if a given text would be readable by its intended readers or
students.
7. Graphic Organizer Method
The Definiton of Graphic Organizer Method Ciascai (2009: 17) defines graphic
organizers as representation, pictures, or models used for processing textual
information. Graphic organizers facilitate the students in understanding knowledge
when there is a large amount of work with a given limited time. She adds that there
12
are various functions of graphic organizers. In reading activity, graphic organizers
assist learners to:
1) Clarify and organize information into categories (main idea, supporting details,
topic sentence, facts, opinion, etc),
2) Organize information in a paragraph for better understanding,
3) Construct meaning of difficult words and sentence dividing into lexias,
4) Understand the context by associating with prior knowledge,
5) Identify conceptual and perceptual errors that may occur in the comprehension of
reading a passage.
Graphic organizers, as illustrated by Drapeau (1998: 11), can be used to
enhance students„ thinking skills by encouraging brainstorming, generating new
ideas, connecting parts to the whole, drawing sequence, analyzing causes and effects,
etc. In line with Drapeau, graphic organizers are visual representation of knowledge
that structure information by arranging important aspects of a concept or topic into a
pattern using labels (Bromley, DeVitis & Modlo, 1999: 7) In conclusion, graphic
organizers are tools that facilitate the readers to organize the large information into
structural categories by arranging the important aspect
a. Type Of Graphic Oranizer Method
Graphic organizers come in many different forms, each one best suited to
organizing a particular type of information. Hall & Nicole (2002:1-3) give their
thirteen detail about selection of graphic organizers and their practical use. The first
graphic is a descriptive or thematic map. It works well for mapping generic
information, but particularly well for mapping hierarchical relationships.
The second graphic is a network tree. This type of graphic organizes is
helpful as a hierarchical set of information, reflecting super ordinate or subordinate
elements. When the information relating to the main idea or theme does not fit into a
13
hierarchy, a spider map can help with organization. This is the third type. The fourth
type of graphic organizers is problem and solution map. When information contains
cause and effects problem and solution, a problem and solution map can be useful for
organizing. The fifth graphic organizers is problem-solution online, ithelp students to
compare different solution to a problem. The sixth graphic organizer is a sequential
episode map. It is useful for mapping cause and effect. When cause-effect
relationships are complex and non-redundant a fishbone map may be particular
useful. This type of graphic organizers belongs to the seventh. The eighth and the
ninth graphic organizers are comparative and contrastive map and compare-contrast
matrix. Comparative and contrastive map can help students to compare and contrast
two concepts according to their features. The other graphic is for another way to
compare concept‟ attribute. Continuum scale is effective for organizing information
along a dimension such as less to more, low to high, and few to many.
This is the graphic number ten. A series of events chain, that is graphic
number eleven, can help students organize information according to various steps or
stages. The twelfth graphic organizer is a cycle map. It is useful for organizing
information that is circular or cyclical, with no absolute beginning or ending. The last
graphic organizer is human interaction online. This type of graphic is effective for
organizing events in terms of a chain of action and reaction (especially useful in
social sciences and humanities).
Moreover, Bellanca (2007) supports and add some graphic organizers. In his
book entitled A Guide to Graphic Organizers, he puts graphic organizers in total
twenty four types. They are KWL, Web, Sequence Chart, Starburst, Gathering Grid,
5+1 Newspaper, Jigsaw, Making Ladder, Scale, PMI, Venn Diagram, Spider map,
Classification Grid, Agree-Disagree Chart, Prediction Tree, Decision Maker‟ Flow
Chart, Concept Map, Fishbone analyze,Problem Solving Chart, Two-Way Thinking
Tower, Classification Flow Chart, Right Angle, Inference Funnel, and what is the big
idea.In addition, Mcgill, Murphy, and Freeman (2009).

14
They state that graphic organizers are generally labelled as conceptual,
hierarchical, cyclical, and sequential. The first, conceptual organizers help students
show their learning or knowledge of a central idea. Concept maps, KWL charts, and
Venn diagrams are only a few conceptual graphic organizers. KWL charts will help
the student organize his or her prior knowledge and the information that he or she
wants to learn before new learning begins.
Then, after learning has taken place the student will chart what he or she has
learned. Venn diagrams are used to compare and contrast two objects, topics,
characters, etc. Second, a hierarchical organizer is used when a student needs to break
down broad concept into sub concepts. Some of these organizers include the
branching diagram, classifying chart, and topic/subtopic web. Students could use this
type of graphic organizer to explain the food chain.
Third, the student will use a sequential graphic organizer when he or she
needs to explain the sequence of events. Storyboards, T-charts, andcause and effect
organizers are all sequential. This type of organizer couldbe used when telling the
beginning, middle, and end of a story. The last, there are times when it would be best
to use a cyclical organizer. These organizers may be better known as the circle
organizer or the circle diagram. These could be used to show life cycles or the water
cycle.
b. The Benefits of Graphic Organizer
Graphic organizers enable teachers to show and explain relationships
between content and subcontent and how they in turn relate to other content areas. On
the other hand, through the use of the organizers, students can make more abstract
comparisons, evaluations, and conclusions. In short, graphic organizers allow
students an active role in their learning. There are a benefits of Graphic Organizer for
students and teachers :
15
a. Benefit to student :
Understand the concept of part to whole, Record relationships, Clarify and
organize ideas, Improve memory, Comprehend texts, Recognize and assimilate
different points of view.
b. Benefit to teachers:
Show and explain relationships between and among content, Make your
lessons interactive, Help visual learners to acquire information more easily. Motivate
students, Assist students in prewriting techniques, Assess what students
knowMoreover, Buehl (2001, p.27) states there are 3 advantages of Graphic
Organizer :Students enhance their understanding of new concepts or vocabulary
through the analysis of familiar analogous concepts.Students make connection to new
material by activating related experience and background.Students gain practice in
writing well organized summaries that follow a compare/contrast text frame.
B. The previous studies
In this study, the researcher did the research about the effect of Graphic
organizer on student‟s reading comprehension at eight grade Junior High School 26
Tanjung Jabung timur. There are some previous researchers that have discussed about
teaching reading comprehension, they are;
Firstly, A research from Dewi Marhaeni, The Effect of Graphic organizer
upon Reading Comprehension of the Twelfth Grade students of SMAN 1 Sukawati in
the Academic Year of 2015/2016. The research showed that there was aimed to
investigate whatever there was a significant effect on reading comprehension of the
twelfth grade students who were taught by using Grhapic Organizer and who were
taught by using conventional technique.
Secondly, A research from Mihdar Amar, The Effect of Graphic Organizer
Strategy on Reading Comprhension of Students with Difference Learning Styles of
the second Grade students of SMK 02 Muhammadiyah Malang in Academic Year
16
2018/2019. The research to examine whater there is a significant difference in the
reading comprehension between the student taught by KWL and Mind Mapping.
Whater there is any significant difference in reading comprehension among the visual
and auditory. Whater there is any significant difference in reading comprehension
among the students‟ learning styles use a grSShapic organizer. Whater there is an
interaction between the KWL and Mind Mapping and students‟ learning styles in
reading comprehension.
Thirdly, A research from Dewi Yunianti, improve grade ten students„ reading
comprehension of SMA N 11 Yogyakarta through the use of graphic organizers. The
subjects of the study were 32 students of X H at SMA N 11 Yogyakarta in the
academic year of 2013/2014. The data were collected by observing the teaching and
learning process during the implementation of the action, interviewing the students
and the English teacher, giving pre-test and post-test to the students, and taking
pictures of the teaching and learning process. The instruments used in this research
were interview guidelines, observation checklist, and reading comprehension tests.
From the preview related research above, most of them analyzed about the
reading comprehension and the difference between this research with them in
focusing the research. The researcher focuse in the effect of Graphic organizer and
the level of reading comprehension. This research uses pre experimental design to
know effect of Graphic organizer on Students‟ Reading Comprehension in SMPN 26
Tanjung Jabung timur.
C. Hypothesis
Hypothesis is defined as a prediction about the result of research. It can be the
direction of the expected relationship between two or more variables. There are two
types of hypothesis, namely null hypothesis and alternative hypothesis. The null
hypothesis (Ho) states that there is no difference between the outcome of pre-test and
post-test. The alternative hypothesis (Ha) tries opposite the hypothesis null (Hatch &
Farhady, 1982, pp. 3-4). Therefore, the hypotheses of this search are as follow:
17
Ha : There is significant effect of using Graphic Organizer method on Students‟
Reading Comprehension in SMPN 26 Tanjung Jabung timur.
Ho : There is no effect of using Graphic Organizer effect on Students‟ Reading
Comprehension in SMPN 26 Tanjung Jabung timur.
18
CHAPTER III
RESEARCH METHODOLOGY
A. Setting and Time of the Research
The research was conducted on eight grade students' at Junior High School
26 Tanjung Jabung timur. In this school the teacher only uses one strategy it is story
mapping technique when attempted to explain reading materials namely. the teacher
only presents a subject in the text book and asks students to read silently and make
the map what they have read and then students have to answer the questions.
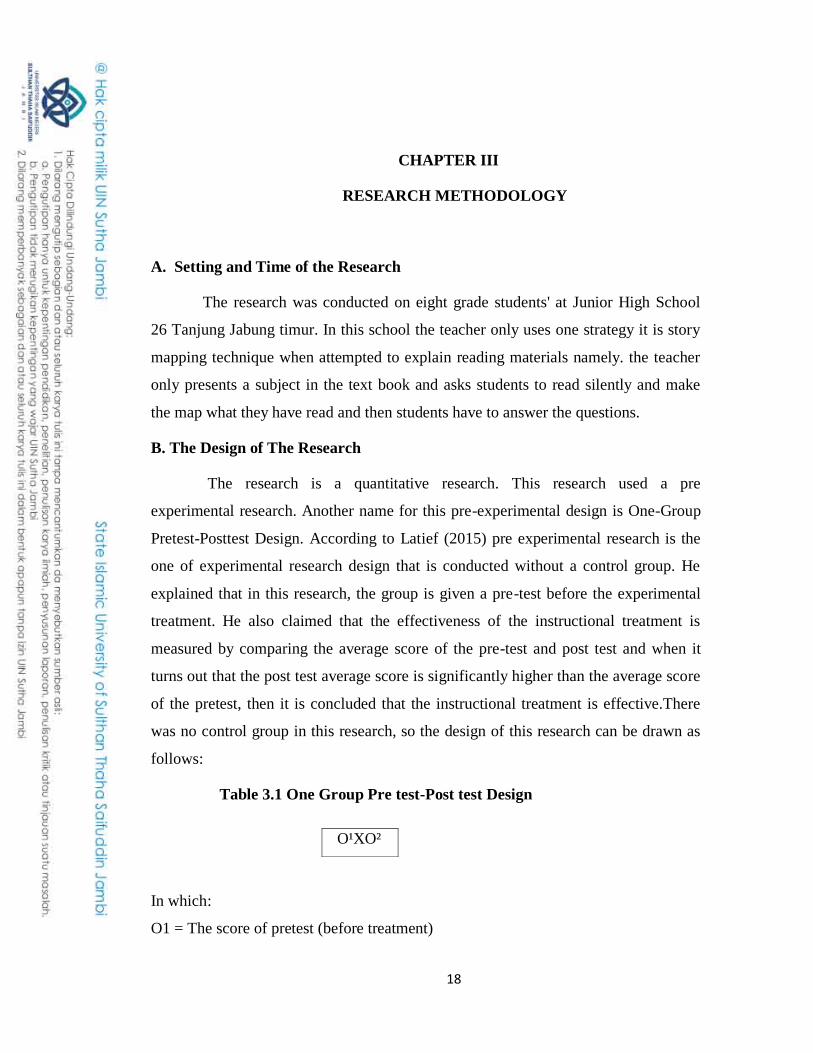
B. The Design of The Research
The research is a quantitative research. This research used a pre
experimental research. Another name for this pre-experimental design is One-Group
Pretest-Posttest Design. According to Latief (2015) pre experimental research is the
one of experimental research design that is conducted without a control group. He
explained that in this research, the group is given a pre-test before the experimental
treatment. He also claimed that the effectiveness of the instructional treatment is
measured by comparing the average score of the pre-test and post test and when it
turns out that the post test average score is significantly higher than the average score
of the pretest, then it is concluded that the instructional treatment is effective.There
was no control group in this research, so the design of this research can be drawn as
follows:
Table 3.1 One Group Pre test-Post test Design
In which:
O1 = The score of pretest (before treatment)
O¹XO²

19
X = Treatment
O2 = The score of posttest (after treatment)
In this design, There were pretest and posttest. Pretest (O1) is a test which is
done before giving an experiment and posttest (O2) is a test which is done after
giving a treatment. The difference between O1 and O2 assumes the effect of the
treatment or experiment. This research used experimental group. The experimental
group was treated by integrating local culture in the form of teaching materials.
According to Arikunto (2013, p.124).
c. Population and sample
1. Population
According to Creswell (2012, p. 142) population is a group of individuals who
have the same characteristics. It means that population are all area which both object
and subject include in it which has quality and certain characteristic make by
researcher to learn it and then the researcher can make conclusion from it. The
population of this research was all the eight grade students of SMPN 26 TANJUNG
JABUNG TIMUR and a total of it is 25 students.
Table 3.2
No Clas Male Female Total
1 VIII 10 15 25
2. Sample
Table 3.3
No Clas Male Female Total
1 VIII 10 15 25

20
Creswell (2012, p. 381) states that sample is the group of participants in a study
selected from the target population from which the researcher generalizes to the target
population. A sample is a group of elements or a single element from which the data
are collected. It is a subset of some of the number and characteristic in the population
in this research, the research took class of eight grade of SMPN26 TANJUNG
JABUNG TIMUR in academic year 2020/2021. That was class eight consist of 25
students. with Convenience sampling, Convenience sampling technique is sampling
based on the availability of elements and the ease of obtaining them.
According to Sugiyono (2015), convenience sampling is a method of determining
the sample by choosing a sample freely at the discretion of the researcher. Some
considerations the researcher chose class VIII as the sample; first, to get accurate
data and also because class VIII is less active in learning. Second, due to the
COVID-19 pandemic, the learning schedule is carried out for one week studying at
school, one week studying at home, this makes it difficult for researchers to adjust the
meeting schedule. Last, the average score for class VIII is less than the KKM (75).
D. Research Variable
Research variable is an attribute or value of a person, an object, or activity that
has a particular variation set out by the researcher to study and is later drawn to the
conclusion. According to Sugiyono (2009, p. 39), Ther are five kinds of research
variable. In this research use two variables as follows:
a. Independent Variable (Variable X), is a variable that affect or that cause
or arise dependent variable.
b. Dependent Variable (Variable Y), is a variable that affected or caused by
independent variable.
In this research, the researcher focused on improving students‟ reading
comprehension achievement by using Graphic Organizer as a strategy to
understanding the text. During five weeks study, the researcher was used guided
question for the students to read. the test was done for getting the objective data of the
students‟ achievement in teaching reading comprehension. Furthermore, the result of
21
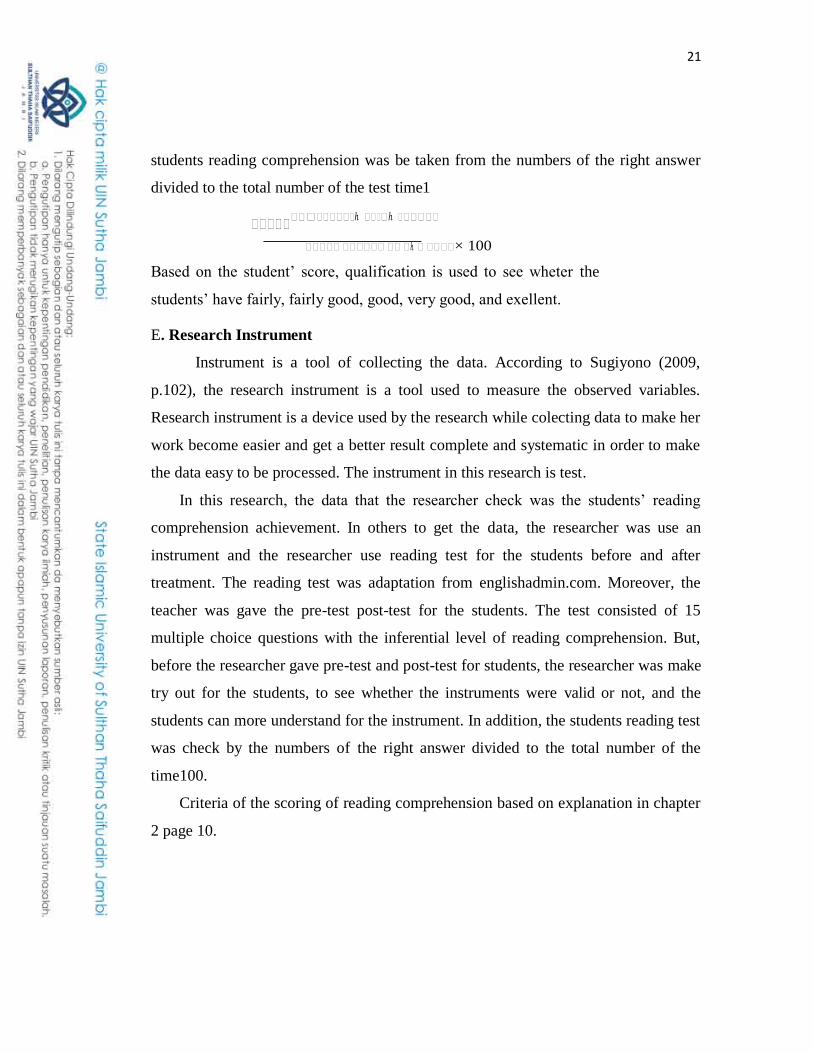
students reading comprehension was be taken from the numbers of the right answer
divided to the total number of the test time1
��������������ℎ ����ℎ ������
����� ������ �� �ℎ � ����× 100
Based on the student‟ score, qualification is used to see wheter the
students‟ have fairly, fairly good, good, very good, and exellent.
E. Research Instrument
Instrument is a tool of collecting the data. According to Sugiyono (2009,
p.102), the research instrument is a tool used to measure the observed variables.
Research instrument is a device used by the research while colecting data to make her
work become easier and get a better result complete and systematic in order to make
the data easy to be processed. The instrument in this research is test.
In this research, the data that the researcher check was the students‟ reading
comprehension achievement. In others to get the data, the researcher was use an
instrument and the researcher use reading test for the students before and after
treatment. The reading test was adaptation from englishadmin.com. Moreover, the
teacher was gave the pre-test post-test for the students. The test consisted of 15
multiple choice questions with the inferential level of reading comprehension. But,
before the researcher gave pre-test and post-test for students, the researcher was make
try out for the students, to see whether the instruments were valid or not, and the
students can more understand for the instrument. In addition, the students reading test
was check by the numbers of the right answer divided to the total number of the
time100.
Criteria of the scoring of reading comprehension based on explanation in chapter
2 page 10.
22
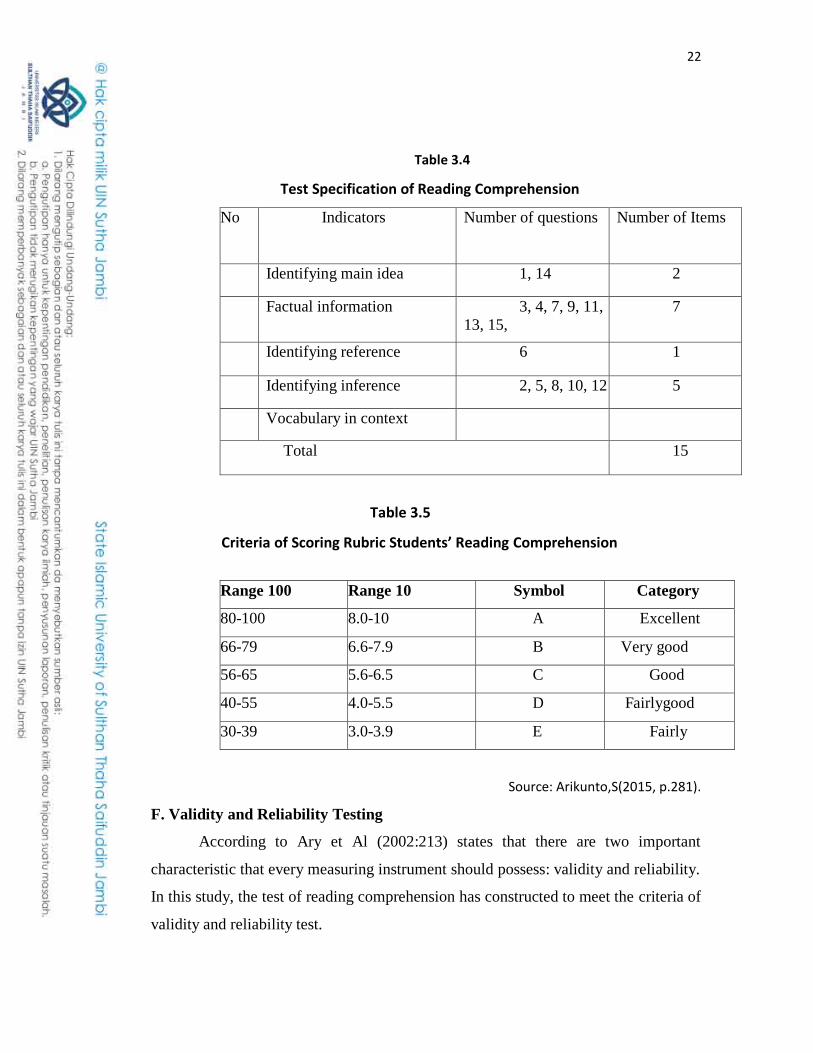
Table 3.4
Test Specification of Reading Comprehension
No Indicators Number of questions Number of Items
1 Identifying main idea 1, 14 2
2 Factual information 3, 4, 7, 9, 11,
13, 15,
7
3 Identifying reference 6 1
4 Identifying inference 2, 5, 8, 10, 12 5
5 Vocabulary in context
Total 15
Table 3.5
Criteria of Scoring Rubric Students’ Reading Comprehension
Range 100 Range 10 Symbol Category
80-100 8.0-10 A Excellent
66-79 6.6-7.9 B Very good
56-65 5.6-6.5 C Good
40-55 4.0-5.5 D Fairlygood
30-39 3.0-3.9 E Fairly
Source: Arikunto,S(2015, p.281).
F. Validity and Reliability Testing
According to Ary et Al (2002:213) states that there are two important
characteristic that every measuring instrument should possess: validity and reliability.
In this study, the test of reading comprehension has constructed to meet the criteria of
validity and reliability test.

23
1. Validity
Validity is a characteristic based on the reasonableness of inferencess drawn
froma set of scores. Evidence is gathered to support an argument that the inferences
are reasonable. Inference are valid or invalid; tests or other instruments are not
(McMillan & Sally, 2010, p. 185). In this research, the resercher analyzed the test
from content validity. Content validity of the test appropriate with curriculum or
material in SMPN 26 TANJUNG JABUNG TIMUR.
The procedure in doing the validation was first, the researcher saw curriculum
or material at Eight grade. Then, researcher shows kind of text with level reading to
english teacher and use readability formula to know the level reading of eleventh
grade students. The readability of a text depends upon how easily it can be
understood by the reader (Fry, 2002). A readability formula can predict the
comprehension, interest aspects. Therefore, there are many readability formula used
nowadays, one of them is the Flesch-Kincaid Readability formula. It is one of the
most famous readability formulas so far in the history of readability studies. It is
calculated by using sentence and word length as variable. In conclusion, Teacher
should like a tool to check if a given text would be readable by its intended readers
orstudents.
Next after found the level reading, the researcher designed 50 item multiple
choices. Based on inferential level beacause the students of eleventh grade in
thatlevel.To judge the validity of each item could be seen from column corrected item
total correlation (rcount) compare with rtable. If rcount > rtable that item was valid or
otherwise using ɑ = 0,05.
Based on trying out instrument of students‟ reading comprehension which was
conducted to 25 students with 50 multiple choice questions, it was obtained that 15
items valid and 30 items invalid. The invalid items were removed and students‟
24
reading comprehension instrument used 20 valid questions. The calculation of
validity can be seen in appendix 1.
2. Reliability
Reliability refers to the consistency of the scores obtained-how consistent they
are for each individual from one administration of an instrument to another and from
one set of items to another (frankle & wallen, 2009, p. 154). In this research, the
researcher gave try out first to non sample student in this school. This test function to
find out wheter the test reliable or not.
Reliabilities with internal consistency, carried out by framing the instrument once,
and then the data obtained is analyzed by a particular technique. Analytical results
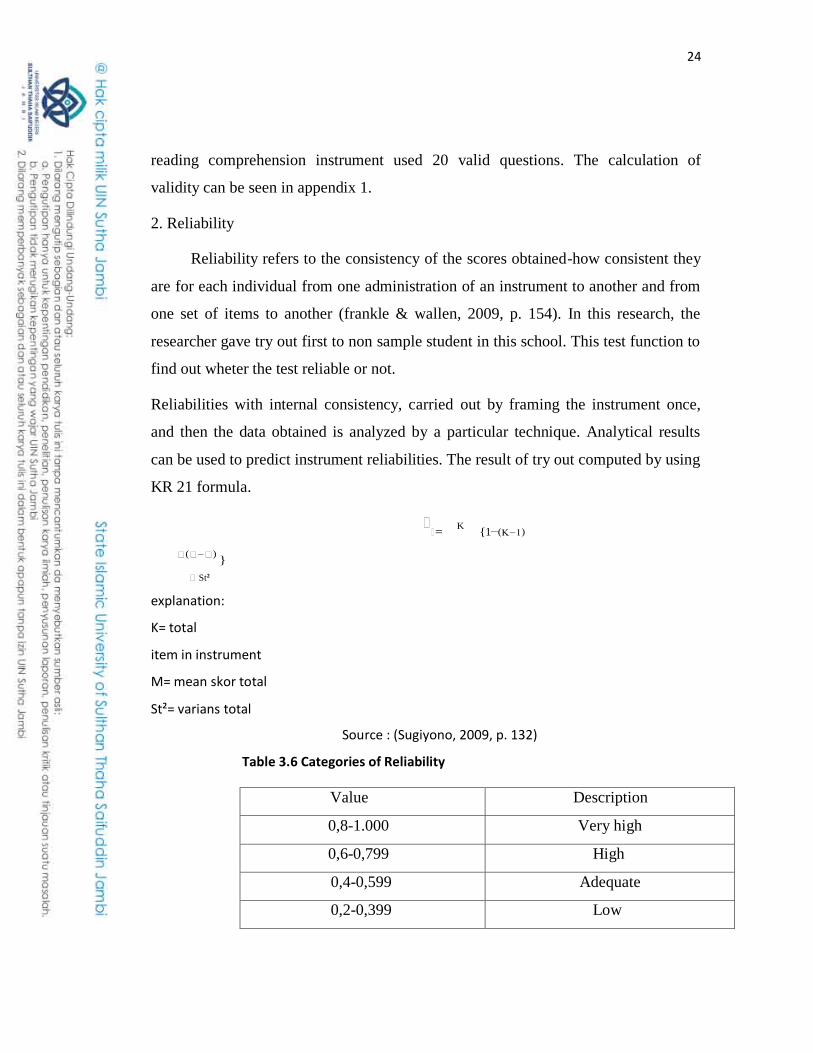
can be used to predict instrument reliabilities. The result of try out computed by using
KR 21 formula.
��= K {1−(K−1)
�(�−�) }
� St²
explanation:
K= total
item in instrument
M= mean skor total
St²= varians total
Source : (Sugiyono, 2009, p. 132)
Table 3.6 Categories of Reliability
Value Description
0,8-1.000 Very high
0,6-0,799 High
0,4-0,599 Adequate
0,2-0,399 Low
25
The researcher has done validity test, then performed reliability testing on those
instruments. Reliability test used to determine the level of consistency in answering
to the instrument. Based on the calculation point about the reliability of tryout
coefficient obtained by 0,552. Based on table 3.4 showed the categories of reliability
in this research is high. From the result above it can be concluded that the instrument
can be used as a data collection tool. The calculation of reliability can be seen in
appendixII.
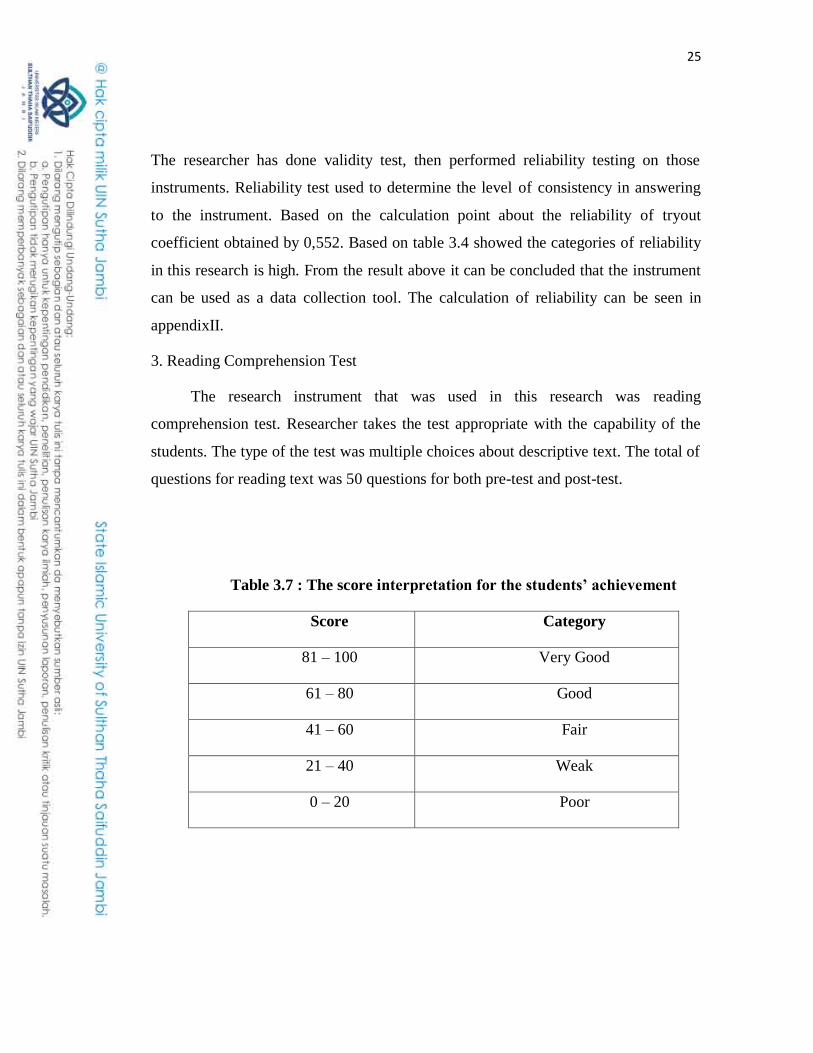
3. Reading Comprehension Test
The research instrument that was used in this research was reading
comprehension test. Researcher takes the test appropriate with the capability of the
students. The type of the test was multiple choices about descriptive text. The total of
questions for reading text was 50 questions for both pre-test and post-test.
Table 3.7 : The score interpretation for the students’ achievement
Score Category
81 – 100 Very Good
61 – 80 Good
41 – 60 Fair
21 – 40 Weak
0 – 20 Poor

26
G. Data Analysis
The result of the data will be compared between the first data(pre-tes) and the
second test (post-test) to know whether there are any significant student‟s scores
before and after being taught by using graphic organizer. The researcher analyzed the
collected data by quantitative data was analyzed by using statiscal method. This
technique was used To find out the wheter Do the students' taught by Graphic
organizer technique have better reading comprehension than those taught by non-
graphic organizer technique,This technique of data analysis belonged to quantitative
data analysis and the data was analyze by using SPSS 25. In analyzing the data
obtained from the text, the researcher used some technique:
1. Descriptive analysis
In descriptive analysis, number of sample, the score of minimal, maximal, mean,
and standard deviation. Descriptive analysis are obtained from students‟ pretest
posttest score. After the pretest and posttest score are obtained from scoring results.
Then was calculated the average increase in student learning outcomes, namely the
calculation of N-gain.
2. Statistical analysis
a. Normality Test
This test was carried out in order to check wheter or not the data was normal.
Data can be classified into normal when the p-output is higher than 0,05. In
measuring normality test, One Sample Kolomogrov Smirnov is used.
If the data was normal, the parametric test was used. On the other hand, if the
data was not normal, the non parametric test was used.
b. T-test
The sample of the T-test in this research is used paired sample t-test. It
used to saw wheter or not significant effect of students‟ reading comprehension
before and after treatment by Graphic Organizer.

27
H. Statistical Hypothesis
a. Alternative Hypothesis (Ha)
There is significant improvement on students‟ reading comprehension
achievement after being taught by using Graphic Organizer.
b. Null Hypothesis (Ho)
There is not significant improvement on students‟ reading comprehension
achievement after being taught by using Graphic Organizer.
28
CHAPTER IV
RESEARCH FINDING AND DISCUSSION
A. Finding the Study
In this study the researchers used a pre experimental design because current
conditions do not allow to use two classes because the covid 19(pandemic), student
attendance is limited to a week of school a week or not and even then alternates with
other classes.
In this section, the researcher was describe the result of the study based on the
score that students got in Pre-test and Post-test. The reseacher did the research for
five meetings. Moreover, before comes to the statistical analysis, the researcher was
shown on descriptively the students score. However, after the researcher got the data,
the researcher analyze the data using pair sample t-test to calculate the data and also
using Statistical Product and Service Solution (SPSS) version 25 program. The
findings include: 1. Descriptive analysis of the students reading test; 2. Prerequisite
test; 3. Statistical analysis of the students reading test.
1. Descriptive Analysis
In this part, the reseacher explained the frequencies, percentages and mean scores
of the tests based on the results of the test before and after giving the treatment.
a. The Result of Pre-test
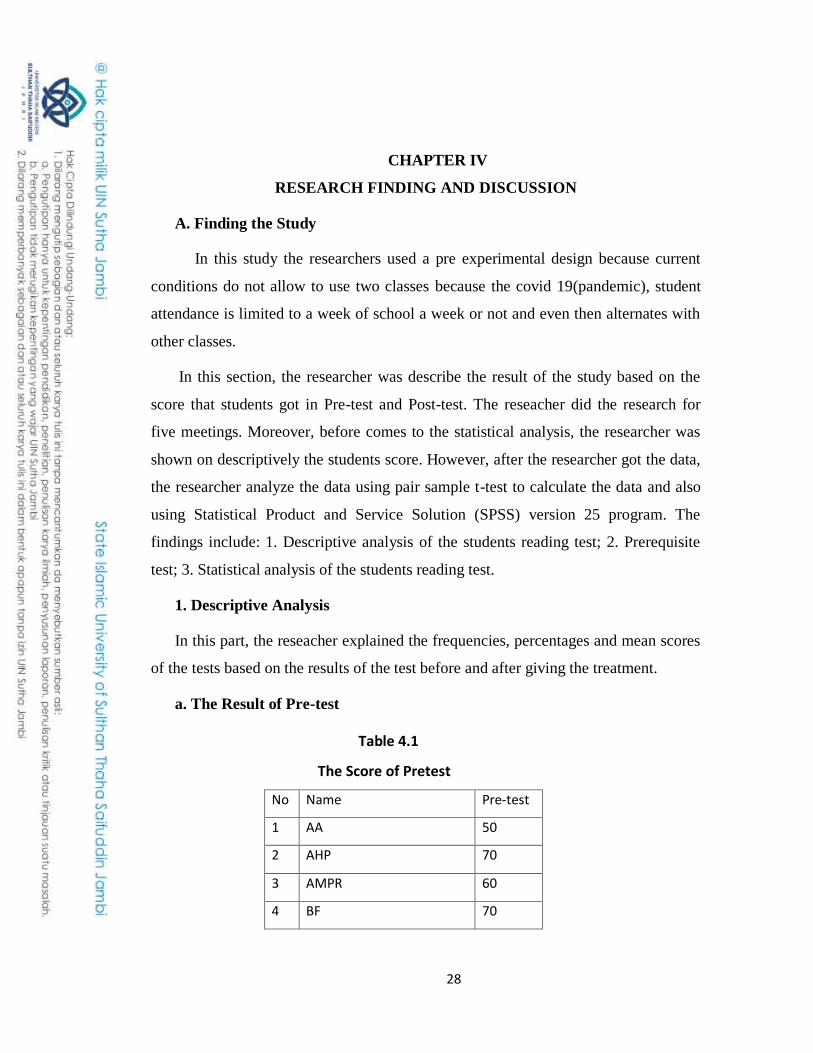
Table 4.1
The Score of Pretest
No Name Pre-test
1 AA 50
2 AHP 70
3 AMPR 60
4 BF 70
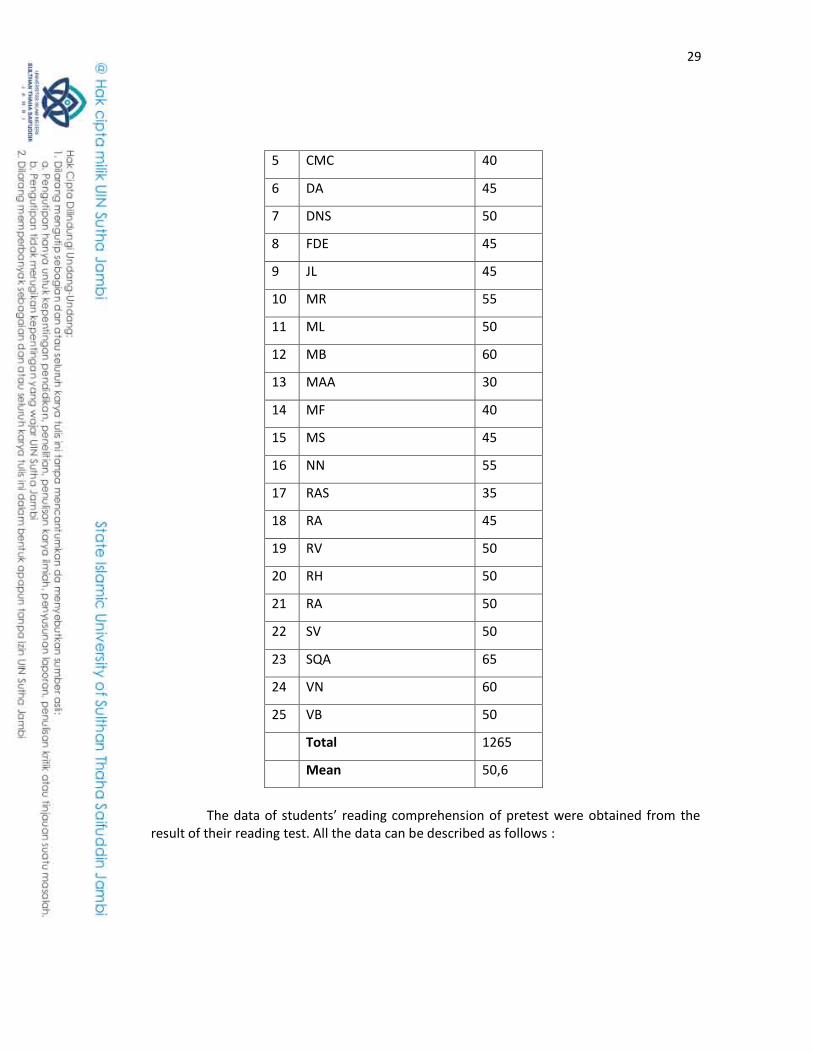
29
5 CMC 40
6 DA 45
7 DNS 50
8 FDE 45
9 JL 45
10 MR 55
11 ML 50
12 MB 60
13 MAA 30
14 MF 40
15 MS 45
16 NN 55
17 RAS 35
18 RA 45
19 RV 50
20 RH 50
21 RA 50
22 SV 50
23 SQA 65
24 VN 60
25 VB 50
Total 1265
Mean 50,6
The data of students’ reading comprehension of pretest were obtained from the
result of their reading test. All the data can be described as follows :
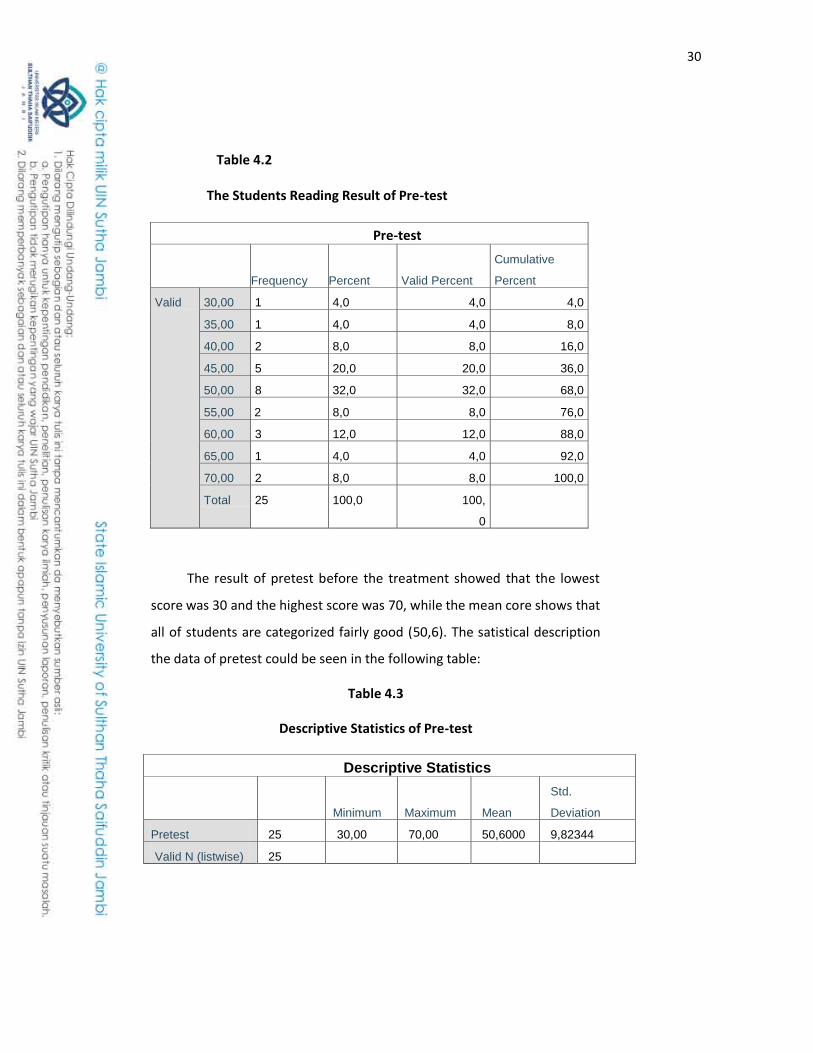
30
Table 4.2 The Students Reading Result of Pre-test
Pre-test
Frequency Percent Valid Percent
Cumulative
Percent
Valid 30,00 1 4,0 4,0 4,0
35,00 1 4,0 4,0 8,0
40,00 2 8,0 8,0 16,0
45,00 5 20,0 20,0 36,0
50,00 8 32,0 32,0 68,0
55,00 2 8,0 8,0 76,0
60,00 3 12,0 12,0 88,0
65,00 1 4,0 4,0 92,0
70,00 2 8,0 8,0 100,0
Total 25 100,0 100,
0
The result of pretest before the treatment showed that the lowest
score was 30 and the highest score was 70, while the mean core shows that
all of students are categorized fairly good (50,6). The satistical description
the data of pretest could be seen in the following table:
Table 4.3
Descriptive Statistics of Pre-test
Descriptive Statistics
N Minimum Maximum Mean
Std.
Deviation
Pretest 25 30,00 70,00 50,6000 9,82344
Valid N (listwise) 25
31
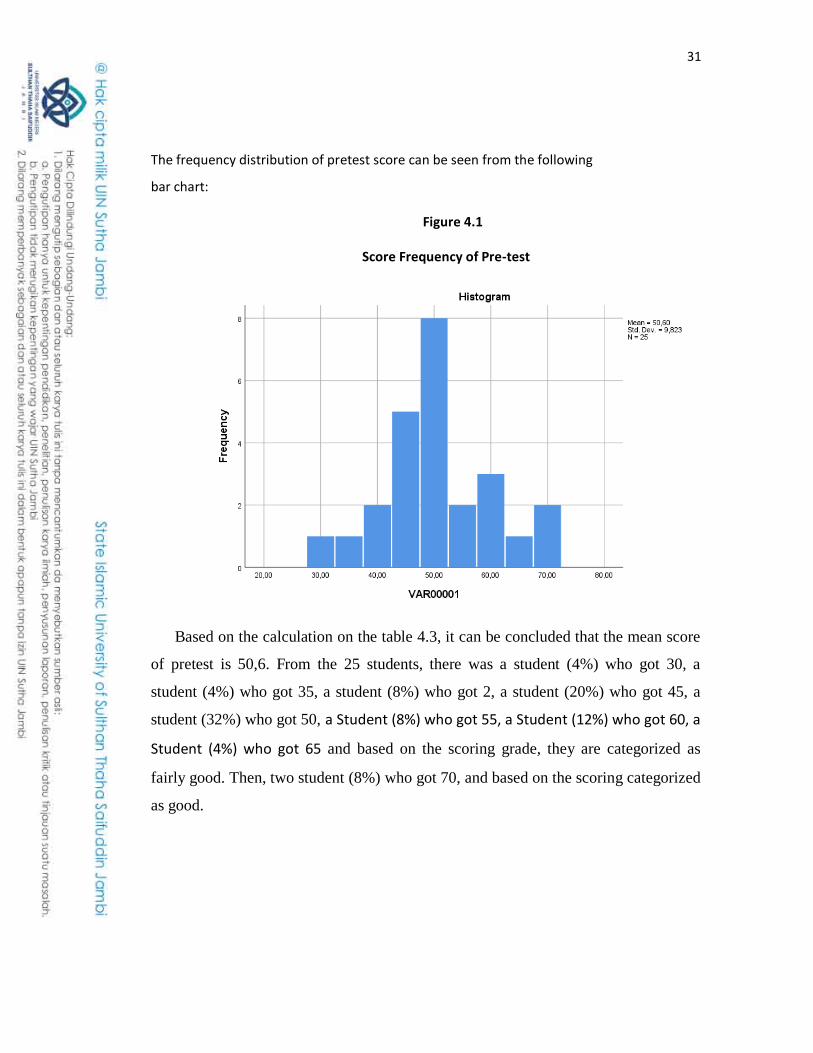
The frequency distribution of pretest score can be seen from the following
bar chart:
Figure 4.1
Score Frequency of Pre-test
Based on the calculation on the table 4.3, it can be concluded that the mean score
of pretest is 50,6. From the 25 students, there was a student (4%) who got 30, a
student (4%) who got 35, a student (8%) who got 2, a student (20%) who got 45, a
student (32%) who got 50, a Student (8%) who got 55, a Student (12%) who got 60, a
Student (4%) who got 65 and based on the scoring grade, they are categorized as
fairly good. Then, two student (8%) who got 70, and based on the scoring categorized
as good.
32
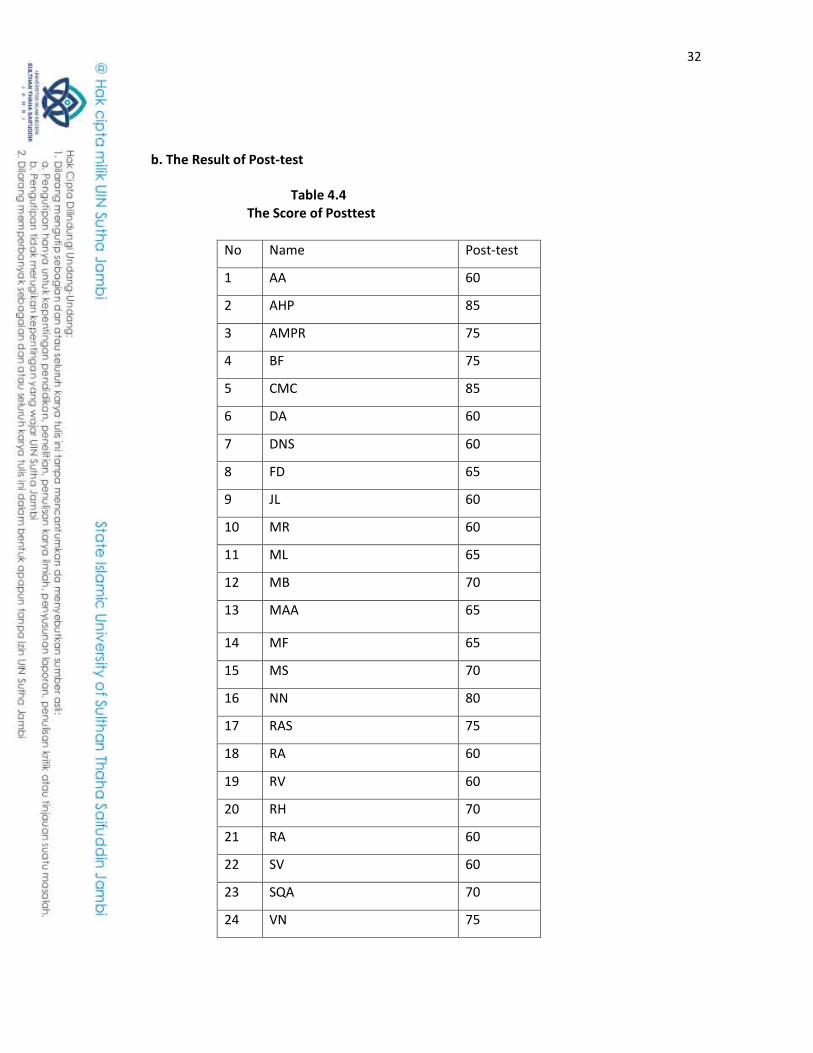
b. The Result of Post-test
Table 4.4 The Score of Posttest
No Name Post-test
1 AA 60
2 AHP 85
3 AMPR 75
4 BF 75
5 CMC 85
6 DA 60
7 DNS 60
8 FD 65
9 JL 60
10 MR 60
11 ML 65
12 MB 70
13 MAA 65
14 MF 65
15 MS 70
16 NN 80
17 RAS 75
18 RA 60
19 RV 60
20 RH 70
21 RA 60
22 SV 60
23 SQA 70
24 VN 75
33
25 VB 65
Total 1695
Mean 67,8
The data of students’ reading comprehension of posttest were
obtained from the result of their reading test. All the data can be described
as follows:
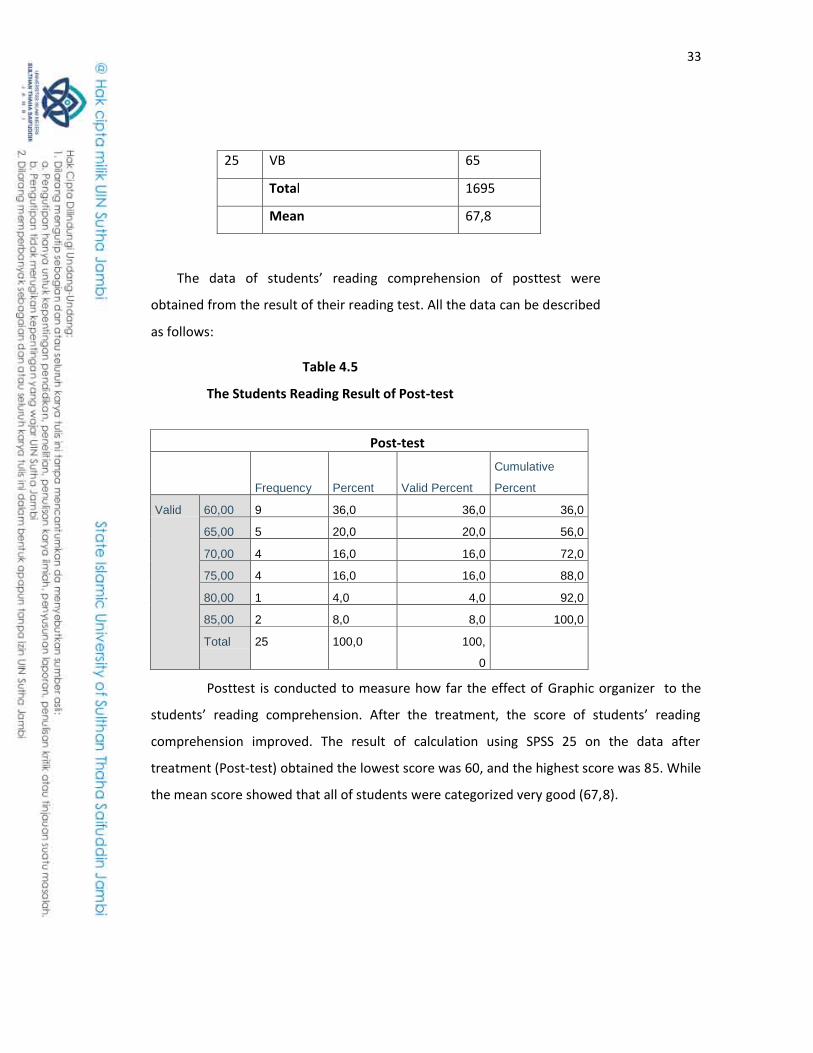
Table 4.5
The Students Reading Result of Post-test
Post-test
Frequency Percent Valid Percent
Cumulative
Percent
Valid 60,00 9 36,0 36,0 36,0
65,00 5 20,0 20,0 56,0
70,00 4 16,0 16,0 72,0
75,00 4 16,0 16,0 88,0
80,00 1 4,0 4,0 92,0
85,00 2 8,0 8,0 100,0
Total 25 100,0 100,
0
Posttest is conducted to measure how far the effect of Graphic organizer to the
students’ reading comprehension. After the treatment, the score of students’ reading
comprehension improved. The result of calculation using SPSS 25 on the data after
treatment (Post-test) obtained the lowest score was 60, and the highest score was 85. While
the mean score showed that all of students were categorized very good (67,8).
34
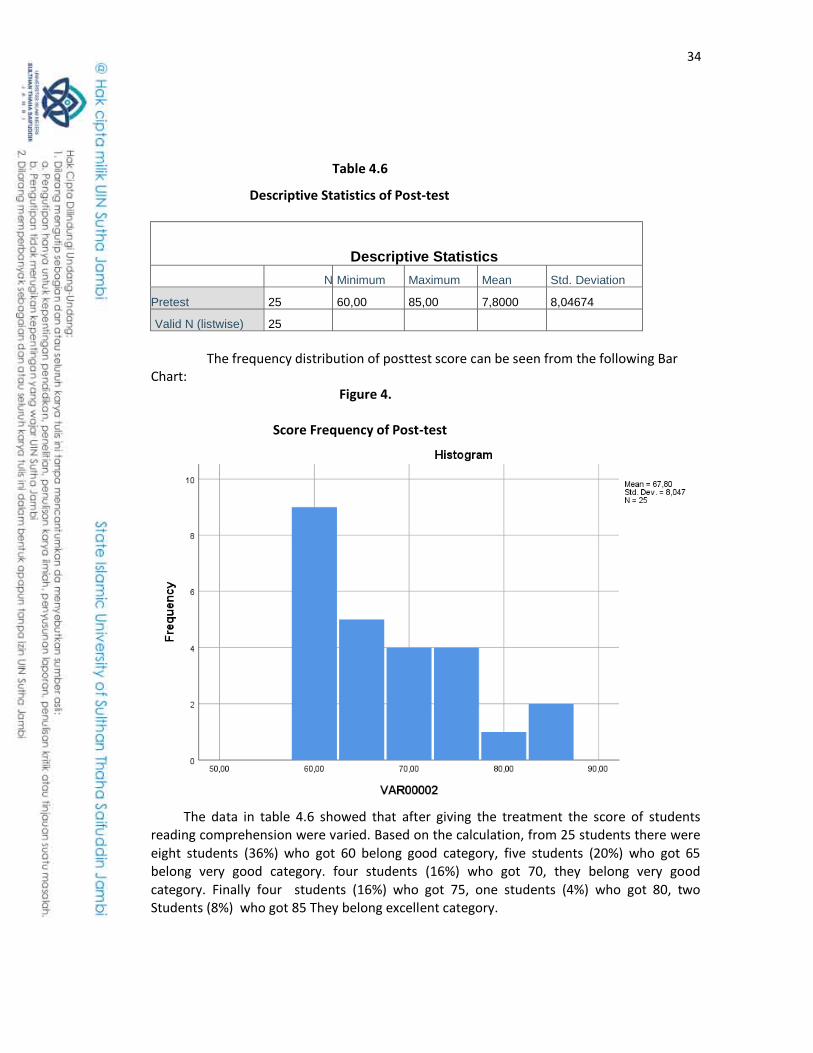
Table 4.6
Descriptive Statistics of Post-test
Descriptive Statistics
N Minimum Maximum Mean Std. Deviation
Pretest 25 60,00 85,00 7,8000 8,04674
Valid N (listwise) 25
The frequency distribution of posttest score can be seen from the following Bar
Chart: Figure 4.
Score Frequency of Post-test
The data in table 4.6 showed that after giving the treatment the score of students reading comprehension were varied. Based on the calculation, from 25 students there were
eight students (36%) who got 60 belong good category, five students (20%) who got 65 belong very good category. four students (16%) who got 70, they belong very good
category. Finally four students (16%) who got 75, one students (4%) who got 80, two Students (8%) who got 85 They belong excellent category.

35
After the researcher analyzes the value of pretest and posttest, the next step is to calculate the gain (improvement) of students’ reading comprehension. Gain is the difference
between the pretest and posttest values. Gain shows an increase in students’ reading comprehension after learning is done. The improvement (gain) from pretest to posttest can
be computed for each participant by subtracting each person’s pretst score from his or her
posttest score by considering the following formula : The improvement (gain) of the test
result can be drawn in the following table:
Table 4.7
Gain Score of Pre-test and Post-test
No Name Pre-test
Score
Post-test
Score
Gain
1 AA 50 60 10
2 AHP 70 85 15
3 AMPR 60 75 15
4 BF 70 75 5
5 CMC 40 85 45
6 DA 45 60 15
7 DNS 50 60 10
8 FDE 45 65 20
9 JL 45 60 15
10 MR 55 60 5
11 ML 50 65 15
12 MB 60 70 10
13 MAA 30 65 35
14 MF 40 65 25
15 MS 45 70 25
16 NN 55 80 25
17 RAS 35 75 40
18 RA 45 60 15
19 RV 50 60 10
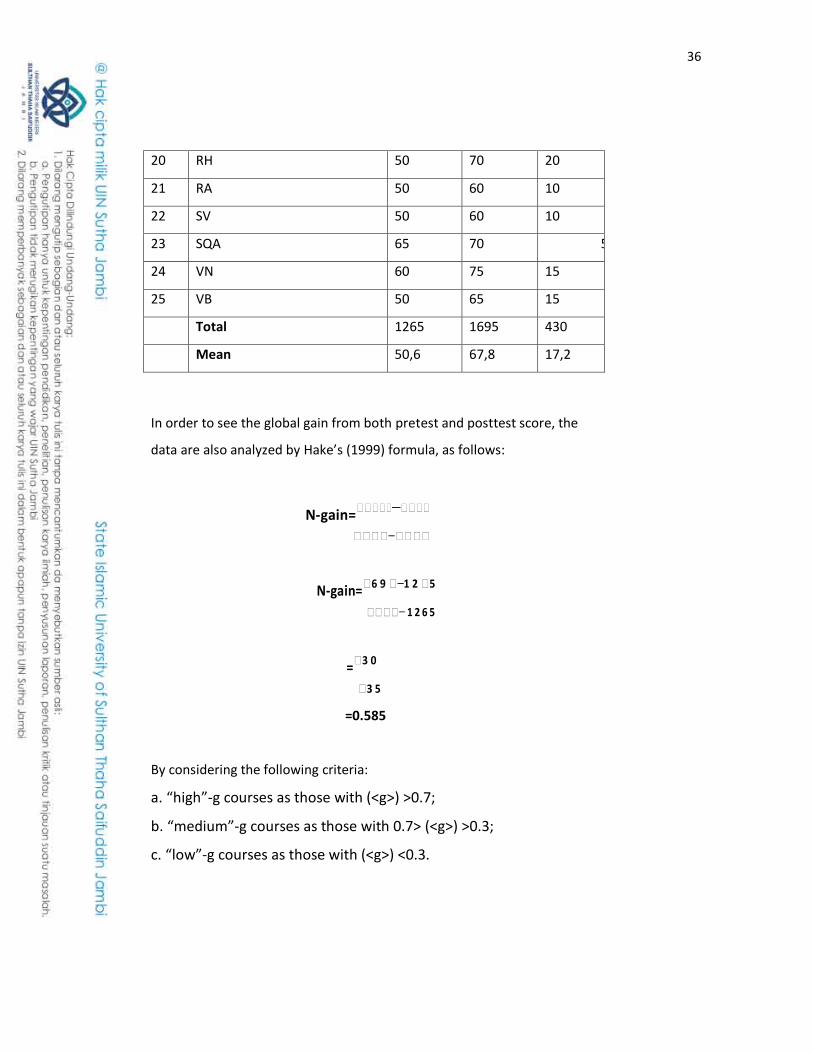
36
20 RH 50 70 20
21 RA 50 60 10
22 SV 50 60 10
23 SQA 65 70 5
24 VN 60 75 15
25 VB 50 65 15
Total 1265 1695 430
Mean 50,6 67,8 17,2
In order to see the global gain from both pretest and posttest score, the
data are also analyzed by Hake’s (1999) formula, as follows:
N-gain=�����−����
����−����
N-gain=�6 9 �−1 2 �5
����− 1 2 6 5
=�3 0
�3 5
=0.585
By considering the following criteria:
a. “high”-g courses as those with (<g>) >0.7;
b. “medium”-g courses as those with 0.7> (<g>) >0.3;
c. “low”-g courses as those with (<g>) <0.3.
37
Based on the calculation above, the writer obtained N-gain was 0.585. so, it
is concluded that the N-gain of reading comprehension test included in
mediumlevel.
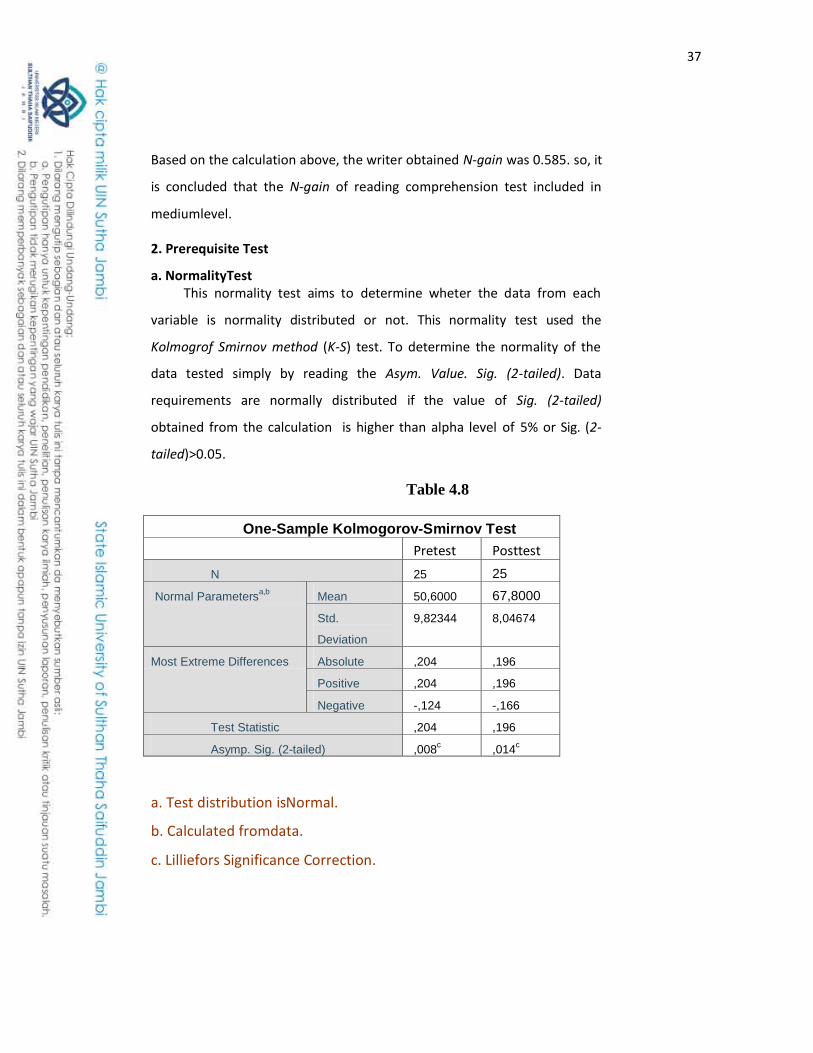
2. Prerequisite Test
a. NormalityTest This normality test aims to determine wheter the data from each
variable is normality distributed or not. This normality test used the
Kolmogrof Smirnov method (K-S) test. To determine the normality of the
data tested simply by reading the Asym. Value. Sig. (2-tailed). Data
requirements are normally distributed if the value of Sig. (2-tailed)
obtained from the calculation is higher than alpha level of 5% or Sig. (2-
tailed)>0.05.
Table 4.8
One-Sample Kolmogorov-Smirnov Test
Pretest Posttest
N 25 25
Normal Parametersa,b Mean 50,6000 67,8000
Std.
Deviation
9,82344 8,04674
Most Extreme Differences Absolute ,204 ,196
Positive ,204 ,196
Negative -,124 -,166
Test Statistic ,204 ,196
Asymp. Sig. (2-tailed) ,008c ,014
c
a. Test distribution isNormal.
b. Calculated fromdata.
c. Lilliefors Significance Correction.

38
Based on the table above was known that the significance value from
each pretest posttest is higher than 0,05. The sig/p-value on pretest is 0,20
and it is higher than 0,05 (0,20>0,05), means that the data is in normal
distribution, the p-value on posttest is 0,07 and it is higher than 0,08
(0,07>0,05), means the data is in normal distribution. Therefore, is also
means that Ho is accepted and Ha is rejected. So it can be interpreted that
each of data is in normal distribution.
3. StatisticalAnalysis
A. Hypothesistesting
Hypothesis testing used paired sample t-test is a test for the some
population group, but has two or more conditions of the sample data as a
result of the treatment given to the sample group. The data needed for
this test equipment is numerical data in the form of ratios and intervals.
Theamount needed in this model is a small sample. Paired Sample t test is
used from a population before and after receiving treatment. The
hypothesis with the following details:
a. Alternative Hypothesis (Ha)
There is significant improvement on students’ reading comprehension
achievement after being taught by Graphic Organizer.
b. Null Hypothesis(Ho)
There is not significant improvement on students’ reading comprehension
achievement after being taught by Graphic Organizer.
The basic of decision making is based on the comparison of t count with t
table:
a. If the value of tobatined > ttable, then Ho is rejcted and Ha
isaccepted

39
b. If the value of tobtained < ttable then Ho is accepted and Ha isrejected
Basic of decision making in Paired Sample t-test based on the comparison
of the significance value (probability) as follow:
a. If the significance value is > 0,05, then Ho is accepted and Ha is
rejected.
b. If the significance value is < 0,05, then Ho is rejected and Ha is
accepted.
The results of statistical dat analysis using SPSS 25, obtained the output shown in the
tablebelow:
Table 4.9
The Result of Paired Samples Statistics
Paired Samples Statistics
Mean N
Std.
Deviation
Std. Error
Mean
Pair 1 Pretest 50,6000 25 9,82344 1,96469
Posttest 67,8000 25 8,04674 1,60935
At the firs output, presents a description of the pair of variables analyzed,
which is includes the average (mean) before being given treatment 50,60
with standard deviation of 9,8234 and after being treatment 67,80 with
standard deviation8,046.
Table 4.10
The Result of Paired Samples Correlations
Paired Samples Correlations
N Correlation Sig.
Pair 1 Pretest & Postest 25 0,334 0,103

40
Furthermore, in the second output, the results of the correlation between the two
variables yielded a figure of 0,334 with a probability value (sig) of 0,103. This states that the
correlation between before and after being given treatment is significantly no related,
beacause the probability value is >0,05
Table 4.11
The Result of Hypothesis Test
Paired Samples Test
Paired Differences
t df
Sig. (2-tailed) Mean
Std. Deviation
Std. Error Mean
95% Confidence Interval
of the Difference
Lower Upper Pair 1
Pretest - Posttest
-17,20000
10,41633 2,08327 -21,49965
-12,90035
-8,256 24 0,000
a. Decision making based o the value of obtained and
t table: Finding ttable in the tablet:
1). Level of significance (ɑ) is 5% (seen from data input on option
which chooses 95% confidencelevel)
2). DF or Degrees of Freedom are N (amount of data) – 1 or 25-1 =24
3). So that the value of 2.093 is obtained from tablet.
From the result of the third output it is known that the value of
tobtained is -8,256. In the t test the plus and minus signs are not considered
so that the value of -8,2526> 2,093 (ttable). So it can be concluded that Ho is
rejected and Ha is accepted. So it can be concluded that using the Graphic
41
organizer on Student's Reading comprehension at the eight grade of SMPN
26 Tanjung Jabung timur.
b. Decision making Paired Sample t-test based on the comparison of
significance value. From the result of SPSS output above, it is known that
the significance value is 0,000. Because the significance value is 0,000 <
0,05 in accordance with paired sample t-test decision making basis, it can
be concluded that using the Graphic organizer on Student's Reading
comprehension at the eight grade of SMPN 26 Tanjung Jabung timur.
4. Interpretations After the analysis conducted, it can be stated that Graphic Organizer is
an effective strategy applied in the teaching reading. It was strenghtened
by the result of descriptive analysis and inferential analysis that there was a
significant difference students reading comprehension achievement. The
mean score of pre-test 50,6 and the mean score of post-test is 67,8. Based
on the results of pretest posttest obtained, looked there is an improvement
in the mean score after being given treatment about 17,2. This means that
the students could answer the reading comprehension test better than
before given thetreatment.
To give accurate data on the students’ score improvement and to
know the effect of Graphic organizer, then the results from pretest and
posttest were calculated with gain score formula. The calculation got scores
0,585 which is categorized as a medium level. It means that teaching
reading with Graphic Organizer strategy was effective.
Then, result of this study also indicated that there was a significant
different before and after taught by using Graphic organizer, This result
showed that the students are more interested to read and comprehend the
text. However, the students were motivated in reading after using Graphic
organizer.

42
In this section, the researcher would interpret the hypothesis testing. As
mentioned above, the hypothesis of this research said “using the Graphic
organizer on Student's Reading comprehension at the eight grade of SMPN
26 Tanjung Jabung timur.
From the previous analysis, it showed that with the number of sample is 25 and the
level of significant is 0.000, the result of the computation of t-value is -8.256. Based on the
value for n=25 and the level of significant is 0.000, the value of t-table is -8,256. The
computation shows that t-value is higher than t-table that is -8,256 > 2,093. So, the
hypothesis is accepted. It means that there is effective of using the Graphic organizer on
Student's Reading comprehension at the eight grade of SMPN 26 Tanjung Jabung timur.
After computing t-test, and after knowing that the hypothesis is accepted, the theory meets
the fact in this case.
The result of the research was stating that applying graphic organizer method
in teaching learning was effective. It was proved by the significant difference score of
students‟ reading comprehension ability between before and after taught by using
graphic organizer method. So, it meant that the result of this research was verified the
theory by to Kintsch and Rawson (2005) stated that comprehension skills aided by
graphic organizers help a reader develop reading abilities.
The result showed that the Graphic Organizer affects the students‟
performance in reading comprehension. Research comes from Ika Nuryana(2016)
with her research entitled "THe EFFECTIVENESS OF USING GRAPHIC
ORGANIZER TOWARD STUDENT'S ACHIEVEMENT IN READING
COMPREHENSION OF ELEVENTH GRADE AT MAN TRENGKALEK". the
research design in this research was experimental research design with quantitative
approach, the population of this research was all students of eleventh grade at MAN
Trenggalek, the sample was IX MIA 1 class consisting of 35 students,the research
instrument was test, the data analyzed was analyze by using SPSS The result showed
that the difference between the averages of student‟s reading comprehension score

43
before they were taught using graphic organizer and after they were taught using
graphic organizer. Thus, it can be concluded that by using Graphic Organizer strategy
in teaching reading comprehension of eleventh grade at MAN Trenggalek was
effective. The equation with my research is The research instrument was a test, the
data were analyzed with SPSS. The result showed that the difference between the
averages of student‟s reading comprehension score before they were taught using
graphic organizer (67.42) and after they were taught using graphic organizer (84.14).
The Tcount was 19.2, whereas Ttable with the significance level of 5% was 2.03. So,
the Tcount was bigger than Ttable. This meant that the alternative hypothesis (Ha) is
accepted and the null hypothesis (Ho) was rejected. Thus, it can be concluded that by
using Graphic Organizer strategy in teaching reading comprehension of eleventh
grade at MAN Trenggalek was effective. The equation with my research is both use
pre experimental design and both use quantitative research and calculate values using
sppss, The difference with my research is she use all students of eleventh grade at
MAN Trenggalek, the sample was IX MIA 1 class consisting of 35 students, while
my research The sample of the research was 25 students at eight grade students of SMPN
26 The data were collected by using reading test. The result of the analysis indicated that
the mean score of post-test (67,8) is higher than pre-test (50,6).
The second research comes from Dwi Putranti (2015) with her research entitled
"IMPROVING THE STUDENTS’ READING COMPREHENSION SKILL BY USING THE GRAPHIC
ORGANIZER FOR GRADE VIIID AT SMP N 1 BERBAH". This research was an action research.
This research consisted of two cycles. The data were obtained from the classroom
observation during the teaching and learning process, the students‟ interview, the
teacher‟s interview, the questionnaire, and supported by the score of the students‟
reading comprehension tests. The data from the classroom observation, interview and
the questionnaire were analyzed qualitatively and the scores were analyzed
quantitatively using descriptive statistics. The results of this research suggested that
the graphic organizer improved the students‟ reading comprehension skill for grade

44
VIIID at SMP N 1 Berbah. The qualitative data analysis showed that the students
were able to comprehend the texts better by using the graphic organizer. There were
also some changes on their behavior. They could focus their attention on the teaching
and learning process by the implementation of the graphic organizer. the total score
and the average score in the posttest I was increased 10% from the total score and the
average score of the pretest. Meanwhile the total score and the average score in the
posttest II was increased 9% from the total score and the average score of the posttest
I. The quantitative data supported the qualitative data, that the graphic organizer
could be used to improve the students‟ reading comprehension skill. The equation
with my research is the same as quantitative research and the same research in junior
high school and the same using the Graphic Organizer method to improve reading
comprehension, The difference with my research is Her research is action research.
Her research consisted of two cycles. Data were obtained from classroom
observations during the teaching and learning process, student interviews, teacher
interviews, questionnaires, and supported by students' reading comprehension test
scores, while my research The sample of the research was 25 students at eight grade
students, The data were collected by using reading test. The result of the analysis indicated
that the mean score of post-test (67,8) is higher than pre-test (50,6).
Third, a research comes from Ana Putri Sari (2014) IMPROVING
READING COMPREHENSION SKILLS BY USING GRAPHIC ORGANIZER OF
EIGHTH GRADE STUDENTS IN SMP 4 KUDUS This research is a classroom
action research. There are four steps in action research, there are: planning (identify a
problem), acting (collect data), observing (analyze and interpret data), reflecting
(develop and action).To know the improvement of reading skill by using graphic
organizer, the writer got the result from students‟ score of the reading test and also
observation sheet.The data analysis shows that graphic organizers can improve the
reading skill of the eighth grade students of SMP 4 Kudus. From the calculation, the
average score from the first cycle is 72.8 with the highest score is 80 and lowest score
45
is 60. In the second cycle there was significant improvement by the score of the
students. The mean score is 82 with the highest score is 85 and the lowest score is 70.
It means that the reading skill of the eighth grade students are improved. The
equation with my research is the same as quantitative research and the same research
in junior high school and the same using the Graphic Organizer method to improve
reading comprehension, the difference with my research is Her research is action
research and she got the result from students‟ score of the reading test and also
observation sheet while my research The sample of the research was 25 students at eight
grade students, The data were collected by using reading test. The result of the analysis
indicated that the mean score of post-test (67,8) is higher than pre-test (50,6).
All those researhers proved that collocation. In this case, Graphic Organizer was
effective to enhance the students‟ reading comprehension. The treatment received by
the students also made them easily in understanding the text and the question,
because they were not translating or finding the meaning of word per word. This
translation method sometimes made students confused, because on some collocation,
such as “hang on”, it was difficult to understanding its meaning when it is translated
word by word. So we could conclude that learning collocation indeed help students in
their reading comprehension achievement.
Then, from the computation in the previous section; the researcher conclude the
effect of Graphic Organizer on students reading comprehension at the eight grade of
SMPN 26 TANJUNG JABUNG TIMUR.
46
CHAPTER V
CONCLUSION AND SUGESSTION
A. Conclusion
Based on the analysis of the data, the hypothesis, and the discussion in the
previous chapter, the conclusion can be drawn that used Graphic Organizer is
effective on students‟ reading comprehension achievement at SMPN 26 Tanjung
Jabung Timur . This statement is proved by t-test. The Sig. (2-tailed)was 0.000 <0.05.
Then, the result of the score of the students is mostly increase from the pretest to the
posttest after given treatment. It can be proved by the increasing of the mean score.
The mean score before give treatment is 50,6 while after give treatment is 67,8. It
can be categorized as good.
B Suggestion
Based on the research finding, the researcher tries to give some suggestions
after finishing this study. They were as follows: For the English teacher should
choose the most appropriate method in teaching learning process especially in
teaching reading. The English teacher can use Graphic Organizer strategy method in
teaching learning process as the alternative method. The English teacher must
prepare the method and the material well before teaching. The English teacher can
apply this method to make the students more interested with the materials in learning
process. The teacher should motivate their students.For the students should pay
attention the teacher‟s explanation. The students should be active in teaching
learning process and are not afraid to English lesson. The students should be more
active in participation in teaching learning process to build their knowledge.
The students must study hard to improve their reading comprehension For other
researcher, Knowing that the use of Graphic Organizer strategy is effective to improve
students’ reading comprehension, the researcher suggests to the other researchers should

47
REFERENCES
Antoni, N. (2010). Exploring EFL Teachers’ Strategies In Teaching Reading
Arikunto (2013, p.124). One Group Pre test-Post test Design.
Arikunto, S (2015,P.281)Criteria of scoring rubric Student's Reading comprehension
.
Brown, H. D. (2003). Language Assessment-Principles and Classroom Practices.
New York: Longman.
Buehl, D. (2002). Classroom Strategies for Interactive Learning. USA: International
Reading Assosiation.
Creswell, J. W. (2014). Research design : Qualitative, Quantitative, and Mixed
Methods Approaches. USA: Sage Publications.
Ciasai(2008). Graphic organizer method.
Cline,etAl(2006). Definition states reading.
Harmer,J.(2007).ThePracticeofEnglishLanguageTeaching-
4th
Ed.Oxford:PerasonLongman.
Harmer,J.(2001)The Practice of English language.
Harmer,J.(2002)The Practice of English language.
HallandNicole(2002). Type Of Graphic organizer.
Harmer, J. (2001). How to Teach English. England: Associated Companies Throught
of World.
Hidayati, D. (2018). Students Difficulties in Reading Comprehension At The First
Grade Of Sman 1 Darussalam Aceh Besar Faculty Of Education And Teacher
Training Ar-Raniry State Islamic University Darussalam- Banda Aceh 2018 M/1439
H.

48
Holderness (2009 P 114) Concept of reading
Latif (2015) Pre experimental design
Lidiya Wati(2009). Kinds of Reading.
Majia Macleod(2018). Reading type.
(McMillan & Sally, 2010, p. 185), Validity.
NewYork(2018).Sunrise publisher anddistributor.
NewYork(2019) Rouledge.
Nunan, D (Ed). (2003). Practical english language learning (3rd ed.).
Sugiyono(2011,p.80), Population.
Sugiyono. (2009). Metode Penelitian Kuantitatif Kualitatif dan R & D. Bandung:
Alfabeta.
Sugiyono, (2009,P 132) Reliablity
Tinker mules and Mmc Coullogh(2008).
Zimmerwan(1999). Reading Comprehension.

49
A
P
P
E
N
D
I
X

50
Appendedix I
The Result Of Validity
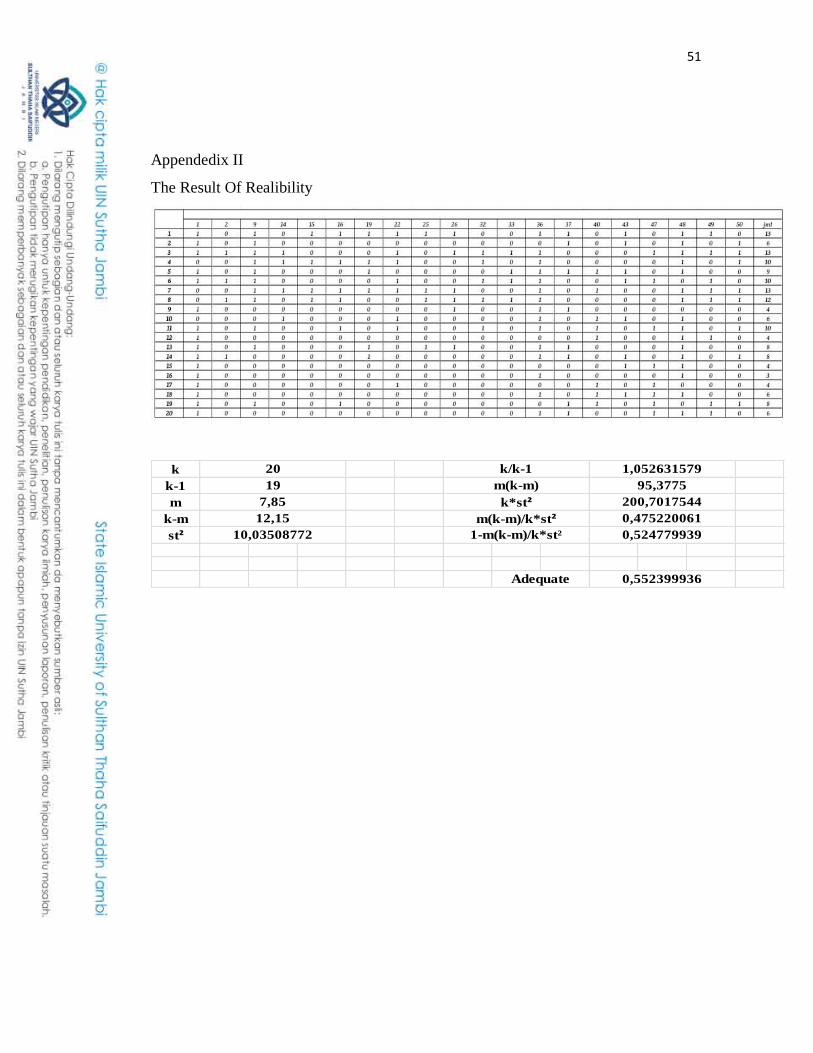
51
Appendedix II
The Result Of Realibility
k
k-1
m
k-m
st²
20
19
7,85
1,052631579
95,3775
200,7017544
0,524779939
Adequate 0,552399936
10,03508772
k/k-1
m(k-m)
k*st²
m(k-m)/k*st²
1-m(k-m)/k*st²
12,15 0,475220061
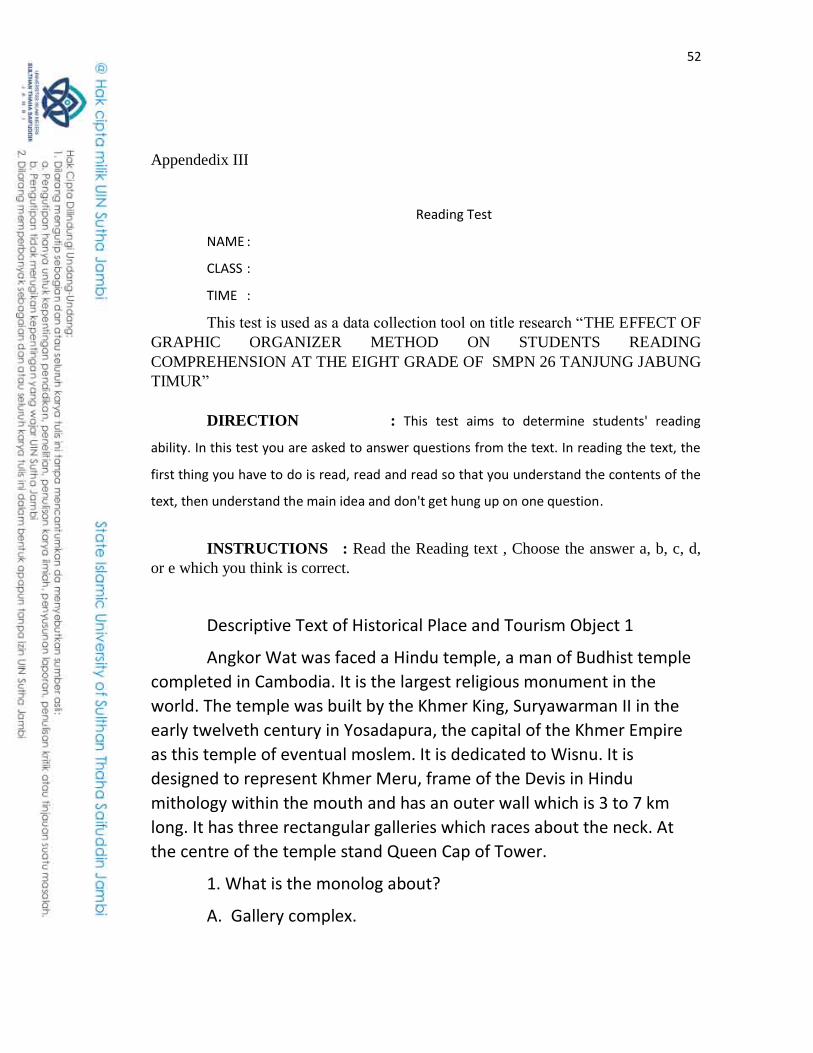
52
Appendedix III
Reading Test
NAME :
CLASS :
TIME :
This test is used as a data collection tool on title research “THE EFFECT OF
GRAPHIC ORGANIZER METHOD ON STUDENTS READING
COMPREHENSION AT THE EIGHT GRADE OF SMPN 26 TANJUNG JABUNG
TIMUR”
DIRECTION : This test aims to determine students' reading
ability. In this test you are asked to answer questions from the text. In reading the text, the
first thing you have to do is read, read and read so that you understand the contents of the
text, then understand the main idea and don't get hung up on one question.
INSTRUCTIONS : Read the Reading text , Choose the answer a, b, c, d,
or e which you think is correct.
Descriptive Text of Historical Place and Tourism Object 1
Angkor Wat was faced a Hindu temple, a man of Budhist temple
completed in Cambodia. It is the largest religious monument in the
world. The temple was built by the Khmer King, Suryawarman II in the
early twelveth century in Yosadapura, the capital of the Khmer Empire
as this temple of eventual moslem. It is dedicated to Wisnu. It is
designed to represent Khmer Meru, frame of the Devis in Hindu
mithology within the mouth and has an outer wall which is 3 to 7 km
long. It has three rectangular galleries which races about the neck. At
the centre of the temple stand Queen Cap of Tower.
1. What is the monolog about?
A. Gallery complex.
53
B. Buddhist mythology.
C. Cambodia.
D. Khmer Empire.
E. Angkor Wat.
2. In the twelveth century which Empire was strong enough to
build the biggest temple of the world?
A. Old Empire.
B. Yosadapura Empire.
C. Meru Empire.
D. The King Empire.
E. Khmer Empire.
Descriptive Text of Historical Place and Tourism Object 2
Paris is the capital city of FrancE. It is one of the most beautiful
cities in the world. It is also one of the world’s most crowded cities.
Lovely gardens and parks are found throughout Paris. At night, many
palaces and statues are lit up. For this reason, Paris is often called the
city of light. Every year, millions of people visit Paris. The most popular
place to visit is the Eiffel Tower. This huge structure has become the
symbol of Paris. D’Louvre, one of the world‘s largest art museums draws
many visitors. The Cathedral Notre Dame, a famous church, is an other
favourite place to visit.
3. What is the monologue about?
A. Paris
B. The Louvre
C. Notre Dame
D. The crowded city
E. The city of light
54
4. What has become the symbol of Paris?
A. The Louvre
B. The Cathedral
C. The Eiffel Tower
D. The lovely garden
E. The light structure
Descriptive Text of Historical Place and Tourism Object 3
This museum is located in Ambarawa in central JavA. The
musseum focuses on the collection of steam locomotivE. Ambarawa was
a military city during the dutch colonial government. King Willem I
ordered the construction of the new railway station to enable the
government to transport it’s troops to Semarang. On may the 21st 1873,
the Ambarawa railway station was built on 100,027,500 squares meter
lanD. Back then it was known as the Willem I station. The Ambarawa
railway museum was established much later on October 16, 1976 in the
Ambarawa station to preserve the steam locomotivE. They were coming
to the end of their useful life when the 3 feet 6 inches guard railway or
the Indonesian state railway or Perusahaan Negara Kereta Api was
closed. The steam locomotives are parked in the open air next to the
original station.
5.What was the Ambarawa called during the dutch colonial
government?
A. A military city
B. A railway museum,
C. A new railway town,
D. King Willem I station.
E. Steam locomotives station,
6. Why was the Ambarawa railway museum established?
55
A. To build new railway museums.
B. To transport government troops.
C. To preserve the steam locomotives
D. To build a new government station.
E. To park the locomotives at the original station.
Text of Historical Place and Tourism Object 3
On the banks of the Chao Phraya, Bangkok’s “River of Kings”, lies
a hotel that has already set new standards of hospitality for this
celebrated city.
Set in magnificently lanscaped tropical gardens, the Shangri-La
Bangkok provides guests with all the charm and warmth of the orient
and, at the same time, unsurpassed range of facilities and leisure
activities. There is a choice of 12 superb settings in which to wine and
dine, a large free-form swimming pool that overlooks the river,
conventoin and meeting facilities for up to 2000 people, and a 24-hour
business centre. And, from every single guest room and suite, there is a
breathtaking view of all the exotic hustle and bustle of the fabled “River
of Kings”. One might expect such a well-equipped and positioned hotel
to be miles away from the city center but, at Shangri-La Bangkok the
busness district and main shopping areas are mere minutes away. From
more than 200 years, Bangkok’s granduer has been reflected in the
waters of the Chao PhrayA. Today, the Shangri-La Bangkok towers
beside this majestic river, offers its guests the golden promise of the
East.
7. For how many people the meeting facilities are up to?
A. 5000 people.
B. 4000 people.
C. 2000 people.

56
D. 1000 people.
E. 500 people.
8. The text mainly focuses on…
A. Bangkok’s granduer.
B. Bangkok’s ”River Kings.”
C. The water of the Chao Praya.
D. The majestic river in Bangkok.
E. Shangri-La Bangkok.
Descriptive Text of Historical Place and Tourism Object 4
Losari beach is a beautiful beach and located on the edge city of
Makassar. It is located only about 3 km from the center of Makassar
(Karebosi Park). The beach used to be the longest café in Asia, because
many cafes stand in along the beach, but now the cafes are collected in
a special place so it does not spread along the coast. Charm of the beach
is mainly seen in the evening when the sunset stands out. This is a major
attraction of people’s coming to the Losari beach. Every evening
hundreds of people come to witness the panorama of red as the sun will
disappear into the ocean, so do not miss the sunset at the Losari beach.
If the sky is sunny, the scenery is absolutely perfect. Because of its
location in a bay, the water of Losari is even often quiet as usual pool
water. Losari is its waterfront of Makassar. The lengthy of the beach is
approximately one kilometer and it is a public space that can be
accessed by anyonE. On this beach there is a park called the Pelataran
Bahari (Marine Park), with semicircular area of nearly one hectarE. This
place is a plaza with a clean floor for children to play and running
around, while parents and teens sit on concrete benches to enjoy the
sea breezE. From this place, you are also free to view out to the sea and
watch the sunset slowly turns reddish in the line of the horizon. The
reflected light also creates sheen on the surface of sea water.
57
The Pelataran Bahari also serves as the stadium of open water to
watch the coastal waters in front of Losari beach. This coastal water is
often used as a racecourse jet ski, boat races and traditional boat jolloro
katinting, or become a transit point of rely of Sandeq traditional
sailboats and yachts. In Losari there are also a few hotels. Some of them
qualified as a tree stars hotel. The hotel is offering panoramic beauty of
the sea with luxury service treats. There are Losari Beach Hotel, Losari
Beach Inn, Makassar Golden Hotel, and Pantai Gapura Hotel. All of the
hotels located in Jalan Penghibur.
9.What is the main idea of the text?
A. Losari beach is a awful place.
B. Losari beach is a good place to visit.
C. No body visit Losari beach.
D. Many visitor on Pantai Gapura Hotel.
E. No one stay at Losari Beach Inn.
10. How many hotels does the writer mention?
A. Six hotels.
B. Five hotels.
C. Four hotels.
D. Three hotels.
E. Two hotels.
11. Where is Losari beach located?
A. Somewhere at Makassar City.
B. Locate at Jalan Penghibur.
C. Near Makassar City.
D. Far away from Losari Beach Inn.
58
E. Located only about 3 km from the center of Makassar
(Karebosi Park).
Descriptive Text of Historical Place and Tourism Object 5
The Shard is an 87-storey skyscraper, which sits in the heart of
London. It is known as the shard of glass. Construction began in 2009
and was completed three years later in 2012, making it Western
European’s tallest building. Designed by architect Renzo Piano, The
Shart is the second tallest free standing structure in the UK. Its exterior
boasts 11,000 glass panels — that’s equivalent in area to eight football
pitches or two-and-a-half Trafalgar Squares. The building was developed
to have multiple uses, describes on the website as a ‘vertical city where
people can live, work and relax’. This motto was clearly taken on board
that was found on the 72nd floor towards the end of construction.
12. What is the text about?
A. The architect Renzo Piano
B. The Shard glass panels
C. The Shard, building in London
D. The tallest building in London
E. The heart of London
13. In Europe, the Shard gains popularity on its …
A. Location
B. Function
C. Height
D. Age
E. Usage
14. What probably makes people interested to stay in the Shard?

59
A. It has multiple uses
B. It is the tallest building in UK
C. It was built by famous architect
D. It is located in the heart of London
E. It is very cheap
15. “…, making it Western European’s tallest building.” What
does the underlined word “it” refer to?
A. The Shard
B. The glass
C. London
D. Skyscraper
E. Renzo Piano
Descriptive Text of Historical Place and Tourism Object 6
Kediri is a name of a town. It is situated in a valley between the
Kelud and Willis mountains and inhabited by about 1.3 million peoplE. In
the centre of the town there is a large hill which is called the Dathok
Mountain. Because of the topography of the region, Kediri is called a
chilly town by the locals. There is a big river called Brantas cutting off
the centre of the town. Beside the temples, Kediri is also famous for its
products like cigarettes and a special kind of tofu or bean curD. This
highly nutritious food is delicacy of Kediri and has a distinctive tastE. The
cigarettes factory dominates the town economy and employs the
majority of the women labor forcE. Kediri and the cigarettes factory are
inseparable and it is considered the biggest cigarette factory in
IndonesiA. Most of the local people work in this factory. Those who do
not work here are farmers or traders.
16. What does the above text tell about?
A. The history of Kediri
60
B. The famous products of Kediri
C. The description of Kediri
D. The people
E. 1.3 million people
17. Which one has a distinctive taste?
A. The cigarette
B. The special food
C. The bean curd
D. The highly nutritious food
E. Tofu
18. “Those who do not work here …” (last sentence). The “those”
word refers to ….
A. The local people
B. The factory workers
C. The farmers
D. The traders
E. Woman labour force
Descriptive Text of Historical Place and Tourism Object 7
Masjid Sultan Suriansyah is a historical mosquE. Built 300 years
ago, this building is the oldest mosque in South Kalimantan. The mosque
is located in the North Kuin Village of Banjarmasin. It was built in the
reign of Sultan Suriansyah known as Pangeran SamuderA. He was the
first Banjarnese King who converted into Islam. This mosque was found
on the bank of the Kuin River, near KampungKraton, which was
destroyed by the Dutch colonial. The construction of Masjid Sultan
Suriansyah was uniquE. The roof is layereD. It took the Banjar’s past
architecture before Islam camE. Different from any other old mosques

61
in Banjar, the mihrab has its own roof, separated from the main
building.
19. Masjid Sultan Suriansyah was constructed in the era of ….
A. Banjar people
B. Dutch colonial
C. Kalimantan King
D. Sultan Suriansyah
20. What is mainly discussed in the text?
A. A king reign
B. A palace complex
C. An Islamic location
D. A historical mosque
21. From the text we know that ….
A. Some construction of the mosque takes the local style
B. Banjar people burned down the mosque
C. There is nothing special from this mosque
D. The Dutch colonial built the mosque
Descriptive Text of Historical Place and Tourism Object 8
Bale Kambang is a small village in the Southern coast of East
Java, seventy kilometers from Malang town and two hours’ drive from
South. It is well known for its long beautiful white sandy beach as well as
the similarity of its temple to the one of Tanah Lot in Bali. In Bale
Kambang, there are three small rocky islands namely Ismaya Island,
Wisanggeni Island, and Anoman Island, those names are taken from
“wayang” figures (Java traditional puppets). These islands are
surrounded by Indonesian Ocean which huge waves frighten most
overseas cruisers.

62
22. What makes Bale Kambang famous?
A. Small rocky islands
B. Long beautiful beach
C. Huge waves of ocean
D. Overseas cruisers
E. three small rocky islands
23. What is the main idea of the second paragraph?
A. There are three rocky islands in Bale Kambang
B. Huge waves frighten many overseas cruisers
C. Names of rocky islands are taken from “wayang”figures
D. The rocky islands are in the middle of the sea
E. Small village of Bale Kambang
Descriptive Text of Historical Place and Tourism Object 9
Orchard Road is a Boulevard which becomes business and
entertainment center in SingaporE. Orchard Road is surrounded by a
lush tropical and flower gardens which are beautiful. At first, Orchard
Road is just a suburban street lined with orchards, plantations nutmeg,
and pepper farming. However, in the 1970s, it turned into a shopping
center in SingaporE. In 1960 and 1970 entertainment industries began
to enter this roaD. Shopping centers such as mall and Plaza was built in
1974. Orchard Road runs along about 2.2 km. This road is one-way
street flanked by a variety of shopping malls, hotels and restaurants.
The shopping area which is nearly 800,000 square meters provides a
wide range of Things, food, and entertainment. In this area there are
many options that can satisfy visitors from all walks of life starting from
the luxury branded things to the Popular branded, from exclusive
restaurants to fast food. There are so many ways that can be accessed
to get to Orchard road such as: by taxi, bus or drive your own car. For
63
those who are driving to Orchard Road can be entered from the west
through the Napier RoaD. Vehicles from Dunearn Road can turn to left
at the intersection of the Marriott Hotel junction. Vehicles that come
from Paterson can turn right onto Orchard RoaD. Orchard is always
crowded so you have to be careful in order not to get lost.
24. The text mainly focuses on
A. Singapore
B. Orchard Plantation
C. Plaza and Mall
D. Orchard road as business and entertainment center
E. Shopping Center
25. Which statement is TRUE?
A. At first Orchard Road is a crowded settlement
B. Orchard road became business and entertainment center
since 1974
C. Vehicles from Dunrean road turn to the left at intersection of
the Marriott Hotel junction
D. Orchard road is infamous place at Singapore
E. Orchard road is not surrounded by flower garden
26. In the third paragraph the writer describes about?
A. The location of Orchard Road
B. The things that we can see at orchard road
C. The direction to get to Orchard Road
D. The history of Orchard Road
E. The distance of Orchard Road
27. Words “it” in line 4 refers to?

64
A. The plantation
B. Luxury branded things
C. The plaza
D. Singapore
E. Suburban street
28. The word “satisfy” in line eighth has the closet meaning
with?
A. Pleased
B. Free
C. Frighten
D. Threat
E. Loved
Descriptive Text of Historical Place and Tourism Object 10
Petruk cave is one of the leading tourist attractions in Kebumen,
Central JavA. The cave is located in the dukuh Mandayana Candirenggo
Village, Ayah District, Kebumen regency. In the petruk cave there is no
lighting that illuminates the cavE. It is still very natural cave so that
petruk cave is very dark to be entereD. Petruk cave’s name is taken from
the punokawan of puppet characters that is Petruk. The cave Named
Petruk cave because the length of cave is as long as petruk’s nose. In the
cave there are 3 floors that are the first is a basic cave, Hindu caves and
Petruk cavE. The base cave is a short cave which is just 100 meters
away. The cave is used for tourist attractions. Hindu cave is part of the
cave that is usually used to put offerings to the ancestor. Inside Petruk
cave there are so many stalactites and stalagmites which are really
awesomE. If you want to explore this cave, you must be led by guides
who are ready to take you through the cavE. After arriving at the end of
65
the cave, you can see the beach or waterfall located near at the end of
the cave
29. What is the text purpose?
A. To inform readers about tourism in Kebumen
B. To entertain reader about Petruk Cave
C. To explain the reader about floors in Petruk Cave
D. To Introduce The Local tourism in Kebumen
E. To describe Petruk Cave
30. Why did Petruk cave named as one of character in
Punokawan puppet?
A. Because the cave is belong to Petruk
B. Because Petruk is the first explorer of the cave
C. Because Petruk is buried at the cave
D. Because the cave’s length is as long as Petruk’s nose
E. Because the cave’s depth is as deep as Petruk’s hair
31. Which part of Petruk Cave which used for place to put foods
for ancestor?
A. In the basic cave
B. In petruk cave
C. In Hindu cave
D. In front of the cave
E. Inside the cave
32. What is stalactites means?
A. A type of formation that hangs from the ceiling of caves

66
B. Types of formation that lay on the floor of caves
C. Types of food given to ancestor
D. Someone who guide the visitor in the cave
E. Kind of animals in the cave
33. What is “lead” means in paragraph 2?
A. Guide
B. Take
C. Bring
D. Put
E. Place
Descriptive Text of Historical Place and Tourism Object 11
Venice is a city in northern Italy. It has been known as the
“Queen of the Adriatic”, “City of Bridges”, and “The City of Light”. The
city stretches across 117 small islands in the marshy Venetian Lagoon
along the Adriatic Sea in northeast Italy. Venice is world famous for its
canals. It is built on an archipelago of 117 islands formed by about 150
canals in a shallow lagoon. The islands on which the city is built are
connected by about 400 bridges. In the old centre, the canals serve the
function of roads, and every form of transport is on water or on foot.
You can ride gondola therE. It is the classical Venetian boat which
nowadays is mostly used for tourists, or weddings, funerals, or other
ceremonies. Now, most Venetians travel by motorised waterbuses
which ply regular routes along the major canals and between the city’s
islands. The city has many private boats. The only gondolas still in
common use by Venetians are the Traghetti, foot passenger ferries
crossing the Grand Canal at certain points without bridges.
67
34. What does the text tell you about?
A. Gondola.
B. Traghetti.
C. Venice
D. Italy.
E. Venetian boat
35. What transport crosses the Grand Canal for foot passengers
at certain points without bridges?
A. Gondolas.
B. Traghetti.
C. Waterbuses.
D. Lagoon.
E. Ship
36. From the text we can say that Venice belongs to a city of ….
A. water
B. ceremonies
C. buses
D. funerals
E. Gondola
37. What does the second paragraph of the text tell us about?
A. The forms of transport in the worlD.
B. The canals and roads that people like to usE.
C. The archipelago that has a lot of islands.
D. Venice as the world famous for its canals.
E. Venice is the city of light

68
Descriptive Text of Historical Place and Tourism Object 12
Natural Bridge National Park is luscious tropical rainforest. It is
located 110 kilometers from south of Brisbane and is reached by
following the Pacific Highway to Nerang and then by travelling through
the Numinbah Valley. This scenic roadway lies in the shadow of
Lamington National Park. The phenomenon of the rock formed into a
natural ‘arch’ and the cave through which a waterfall cascades is a short
one-kilometer walk below a dense rainforest canopy from the main
picnic areA. Swimming is permitted in the rock pools. Night-time visitors
to the cave will discover the unique feature of the glow worms. Picnic
areas offers toilets, barbeque, shelter sheds, water and fireplaces;
however, overnight camping is not permitted.
38. What is the function of paragraph 1?
A. as an identification
B. as an orientation
C. as a thesis
D. as a classification
E. as an abstract
39. The text above is in form of………….
A. hortatory exposition
B. narrative
C. description
D. report
E. explanation
40.What is the communicative purpose of the text?
A. to present two points of views about natural bridge national
park

69
B. to explain the bridge national park
C. to describe the bridge national park
D. to retell the bridge national park
E. to persuade readers to treat preserve the bridge nationl park
41. Where is the natural bridge national park located?
A. 110 kilometers from South of Brisbane
B. 110 kilometers from Pacific Highway
C. 110 kilometers from Numinbah Valley
D. 110 kilometers from Lamington National Park
E. 110 kilometers from Nerang
42. What the visitors will see in the night?
A. a common glow worm
B. the unique feature of the glow worms
C. a great dark cave
D. the unique rocks
E. the fantastic bridge
43. The word ‘luscious’ in the text means………..
A. succulent
B. dense
C. dull
D. dry
E. arid
Descriptive Text of Historical Place and Tourism Object 13
The Suramadu Bridge (Indonesian: JembatanSuramadu), also
known as the Surabaya–Madura Bridge, is a bridge with three cable-
70
stayed sections constructed between Surabaya on the island of Java and
the town of Bangkalan on the island of Madura in IndonesiA. Opened on
June 10, 2009, the 5.4-km bridge is the longest in Indonesia and the first
bridge to cross the Madura Strait. The cable-stayed portion has three
spans with lengths 192 m, 434 m and 192 m. The bridge has two lanes in
each direction plus an emergency lane and a dedicated lane for
motorcycles. The first toll bridge in Indonesia, fares have been initially
set at Rp. 30,000 (US$3 in 2009) for four-wheeled vehicles and Rp. 3,000
(US$0.30) for two-wheelers. The bridge was built by a consortium of
Indonesian companies PT AdhiKarya and PT WaskitaKarya working with
China Road and Bridge Corp. and China Harbor Engineering Co. LtD. The
total cost of the project, including connecting roads, has been estimated
at 4.5 trillion rupiah (US$445 million). Construction was started on
August 20, 2003. In July 2004, a girder collapsed, killing one worker and
injuring nine others. Work on the bridge halted at the end of 2004 due
to lack of funds, but was restarted in November 2005. The main span of
the bridge was connected on March 31, 2009, and the bridge was
opened to the public in June 10, 2009.Within a week of the opening, it
was discovered that nuts and bolts as well as maintenance lamps had
been stolen and that there was evidence of vandalism of cables
supporting the main span.
44. Suramadu’s bridge also known as….
A. Longest bridge
B. sura and madu
C. Surabaya-Madura bridge
D. toll bridge
E. cable bridge
45. Suramadu’s bridge connects the island….
A. Java and Sumatra

71
B. Java and Bali
C. Sumatra and Kalimantan
D. Java and Madura
E. Java and Surabaya
46. Length of the Suramadu’s bridge is….
A. 5.400 meters
B. 192 meters
C. 494 meters
D. 526 meters
E. 2004 meters
47. The following statement is true, except ….
A. Suramadu’s bridge is also known Surabaya-Madura bridge
B. the long of Suramadu’s bridge is 5400 meters
C. suramadu’s bridge connects the islands of Java and Madura
D. bridge was opened on March 31, 2009
E The bridge was built by Surabaya government
Descriptive Text of Historical Place and Tourism Object 14
Natural Bridge National Park is luscious tropical rainforest. It is
located 110 kilometers from south of Brisbane and is reached by
following the Pacific Highway to Nerang and then by travelling through
the Numinbah Valley. This scenic roadway lies in the shadow of
Lamington National Park. The phenomenon of the rock formed into a
natural ‘arch’ and the cave through which a waterfall cascades is a short
one-kilometer walk below a dense rainforest canopy from the main
picnic areA. Swimming is permitted in the rock pools. Night-time visitors
to the cave will discover the unique feature of the glow worms. Picnic
72
areas offers toilets, barbeque, shelter sheds, water and fireplaces;
however, overnight camping is not permitted.
48. What is the function of paragraph 1?
A. as an identification
B. as an orientation
C. as a thesis
D. as a classification
E. as an abstract
49. The text above is in form of ………….
A. hortatory exposition
B. narrative
C. description
D. report
E. explanation
50. What is the communicative purpose of the text?
A. to present two points of views about natural bridge national
park
B. to explain the bridge national park
C. to describe the bridge national park
D. to retell the bridge national park
E. to persuade readers to treat preserve the
bridge nationl park

73
Appendedix III
APPENDIX
RENCANAPELAKSANAANPEMBELAJARAN(RPP)
SEKOLAH : SMPN 26 Tanjung Jabung Timur
MATA PELAJARAN : Bahasa Inggris
KELAS/ SEMESTER : VIII
TEMA/SUB TEMA : Descrtive text
ALOKASI WAKTU : 6 X 45 Menit
KOMPETENSI INTI
KI 1: Menghayati dan mengamalkan ajaran agama yang dianutnya
KI 2:Menghayati dan mengamalkan perilaku jujur, disiplin,
tanggungjawab, peduli (gotong royong, kerjasama, toleran, damai), santun,
responsif dan pro-aktif dan menunjukkan sikap sebagai bagian dari solusi atas
berbagai permasalahan dalam berinteraksi secara efektif dengan lingkungan
sosial dan alam serta dalam menempatkan diri sebagai cerminan bangsa dalam
pergaulandunia
KI 3: Memahami, menerapkan, menganalisis, dan
mengevaluasitentang pengetahuan faktual, konseptual, operasional dasar, dan
metakognitif sesuai dengan bidang dan lingkup kajian/kerja bidang Bahasa
Inggris pada tingkat teknis, spesifik, detil, dan kompleks, berkenaan dengan
ilmu pengetahuan, teknologi, seni, budaya, dan humaniora dalam konteks
pengembangan potensi diri sebagai bagian dari keluarga, sekolah, dunia kerja,
warga masyarakat nasional, regional, daninternasional.
KI 4: Melaksanakan tugas spesifik dengan menggunakan alat,
informasi, dan prosedur kerja yang lazim dilakukan serta memecahkan
masalah sesuai dengan bidang kajian/kerja bidang Bahasa Inggris,
menampilkan kinerja di bawah bimbingan dengan mutu dan kuantitas yang
terukur sesuai dengan standar kompetensi kerja.Menunjukkan keterampilan
74
menalar, mengolah, dan menyaji secara efektif, kreatif, produktif, kritis,
mandiri, kolaboratif, komunikatif, dan solutif dalam ranah abstrak terkait
dengan pengembangan dari yang dipelajarinya di sekolah, serta mampu
melaksanakan tugas spesifik di bawah pengawasan langsung.
KOMPETENSI DASAR
KD3.7
Menganalisis fungsi sosial, struktur teks, dan unsur kebahasaan
beberapa teks recount dengan memberi dan meminta informasi terkait
peristiwa/pengalaman sesuai dengan konteks penggunaannya.
KD 5.2 Merespon makna dan langkah retorika teks tulis secara
akurat, lancar dan berterima dalam konteks kehidupan sehari-hari dan untuk
mengakses ilmu pengetahuan dalam teks berbentuk: recount.
INDIKATOR PENCAPAIAN KOMPETENSI
Indikator KD3.7
Mengidentifikasi text structure pada recount text
Mengidentifikasi language feature (past event) pada recounttext
Menentukan gambaran umum recounttext
Menentukan informasi rinci tersurat dantersirat
Menentukan fungsi/ tujuan recounttext
Menentukan makna kata atau kalimat dalam recounttext
Indikator KD 5.2
Menemukan main idea dalam paragraph dari teks yang berbentuk
recount, agarberlatihkerjakeras.
Menentukan tujuan teks recount agar gemar membaca.
Menyebutkan informasi rinci dalam teks berbentuk recount agar gemar
membaca.
Menjelaskan rujukan (reference) yang ada dalam teks berbentuk
recount agar gemarmembaca.
Menjelaskan makna kata atau ungkapan tertentu dalam teks berbentuk
recount agar gemarmembaca.
75
TUJUAN PEMBELAJARAN
KD3.7
Disediakan contoh recount text, peserta didik dapat menentukan
gambaran umum tentang recount text dengan baik danbenar.
Disediakan contoh recount text, peserta didik dapat menetukan
informasi rinci tersurat dan tersirat dengan penuh percayadiri.
Setelah membaca recount text tentang pengalaman seseorang/ short
biography, peserta didik dapat menentukan fungsi/ tujuan teks recount
dengan baik danbenar.
Setelah membaca recount text tentang pengalaman seseorang atau/
short biography, peserta didik dapat menentukan makna kata atau
kalimat dengan baik danbenar.
KD 5.2
5.2.1. Menemukan main idea tiap paragraph dari teks yang
berbentuk recount agar berlatih kerjakeras.
Menentukan tujuan teks recount agar gemarmembaca.
Menyebutkan informasi rinci dalam teks berbentuk recount agar gemar
membaca.
Menjelaskan rujukan (reference) yang ada dalam teks berbentuk
recount agar gemarmembaca.
Menjelaskan makna kata atau ungkapan tertentu dalam teks berbentuk
recount, agar gemarmembaca.
MATERI PEMBELAJARAN
Fakta
Teks recount tulis, sederhana, tentang pengalaman seseorang/ short biography.
Fungsi sosial
Melaporkan, meneladani, membanggakan, mengagumi, berbagi
pengalaman, dsb.
Struktur text

76
(gagasan utama dan informasi rinci)
Memberikan pendahuluan (orientasi) dengan menyebutkan orang(-
orang) yang terlibat, tempat, waktu, dsb dari
peristiwa/kejadian/pengalaman yang akan disampaikan
Menguraikan urutan kejadian secara kronologis, urut danruntut
Menutup dengan memberikan komentar atau penilaian umum tentang
peristiwa/kejadian/ pengalaman yang telah disampaikan(opsional)
Unsur kebahasaan
Kata kerja dalam Simple Past tense, Past ContinuousTense
Kosa kata: kata kerja yang menunjuk tindakan ataukegiatan
Adverbia penghubung waktu: first, then, after that, before, when, at
last, finally,dsb.
Adverbia dan frasa preposisional penujuk waktu: yesterday, last month,
on Monday, an hour ago, immediately,dsb.
Penggunaan nominal singular dan plural secara tepat, dengan atau
tanpa a, the, this, those, my, their, dsb secara tepat dalam frasanominal
Ucapan, tekanan kata,intonasi
Ejaan dan tanda baca Topik
Peristiwa, kejadian, pengalaman yang relevan dengan kehidupan
siswa sebagai pelajar dan remaja, dengan memberikan keteladanan tentang
perilaku santun, peduli, jujur, disiplin, percaya diri, kerjasama, cinta damai, dan
bertanggung jawab.

77
Appendedix IV
78
Curriculum vitae
Name : Giat Gemintang Dzakirat
Birthday : 30-09-1998
Gender : Female
Address : Desa Lagan Tengah
Email : [email protected]
NoHp :081373477994
Education Background
No Graduated Education Place
1
2010 SDN 26/X Lagan Tengah
2
2013 SMPN 26 Tanjung Jabung Timur
3
2016 MA Nahdatut Thulab Tanjung jabung timur
4
2021 The State Islamic University of Sulthan
Thaha Saifuddin
Jambi
Jambi, November 2021
The Researcher
Giat Gemintang Dzakirat