Thermostability of firefly luciferases affects efficiency of detection by in vivo bioluminescence
9
Thermostability of Firef ly Luciferases Affects Efficiency of Detection by In Vivo Bioluminescence Brenda Baggett 1 * , Rupali Roy 1 * , Shafinaz Momen 1 , Sherif Morgan 1 , Laurence Tisi 2 , David Morse 1 , and Robert J. Gillies 1 1 University of Arizona and 2 Cambridge University Abstract Luciferase from the North American firefly (Photinis pyralis) is a useful reporter gene in vivo, allowing noninvasive imaging of tumor growth, metastasis, gene transfer, drug treatment, and gene expression. Luciferase is heat labile with an in vitro half- life of approximately 3 min at 37°C. We have characterized wild type and six thermostabilized mutant luciferases. In vitro, mutants showed half-lives between 2- and 25-fold higher than wild type. Luciferase transfected mammalian cells were used to determine in vivo half-lives following cycloheximide inhibition of de novo protein synthesis. This showed increased in vivo thermostability in both wild-type and mutant luciferases. This may be due to a variety of factors, including chaperone activity, as steady-state luciferase levels were reduced by geldanamycin, an Hsp90 inhibitor. Mice inoculated with tumor cells stably transfected with mutant or wild-type luciferases were imaged. Increased light production and sensitivity were observed in the tumors bearing thermostable luciferase. Thermostable pro- teins increase imaging sensitivity. Presumably, as more active protein accumulates, detection is possible from a smaller number of mutant transfected cells compared to wild-type transfected cells. Mol Imaging (2004) 3, 324 – 332. Keywords: Luciferase, in vivo bioluminescence, thermostability, breast cancer tumors, metastasis. Introduction In the current study, we test the hypothesis that ther- mostabilization will lead to a higher accumulation of firefly luciferase in human tumor cells and that this will improve the lower detection limit of luciferase express- ing cells in whole animals. Luciferase is a powerful in vivo reporter system whose main strength is the rela- tive absence of endogenous light-emitting signals from higher organisms. Hence, it can provide extremely high signal to noise. Over the past few years, methods have been developed to detect expression of luciferase pro- teins in living mice [1–3]. Applications of this technol- ogy have grown, and now include the detection of tumor growth [4], the detection of tumor metastases [5], as a reporter for gene expression under control of regulable promoters [6–9], as a reporter for efficacy of gene therapy [8,10–13], measurement of in vivo phar- macodynamics [14,15] and as a reporter for toxicology studies [16–18]. Luciferases are made by a wide variety of phyla, in- cluding bioluminescent species such as beetles, fireflies, bacteria, and marine coelenterates and dinoflagellates [19–24]. The most widely used luciferase reporter gene is that of the North American firefly, Photinis pyralis. Wild-type, P. pyralis luciferase is thermolabile, with an in vitro half-life for activity on the order of 2–3 min at 37°C (see Results). However, luciferase is stabilized in vivo, with half-lives from 1 to 4 hr [25,26]. This has certain obvious advantages, as well as disadvantages. On the one hand, a high turnover rate of the reporter would be advantageous in time-sensitive studies, such as those to determine the response to an environmental toxin, infection, or induction or repression of gene expression. However, a high turnover rate could limit the accumula- tion of functional luciferase molecules and would un- doubtedly have a higher explicit energy cost associated with continuous de novo protein synthesis. On the other hand, it is proposed that a lower turnover rate provided by thermostabilization will lead to higher accumulation of active luciferase molecules, and that this will lead to higher light output on a per-cell basis and thus improve detection. This would be advantageous for studies that are not time-sensitive, such as monitoring tumor growth or colonization of metastases. This is especially important in investigating metastases, as there would be significant interest in the fate of micro-metastases, which might otherwise escape detection due to their small size. Materials and Methods Chemicals and Buffers Unless otherwise noted, all chemicals were obtained from Sigma (St. Louis, MO). Hanks Balanced Salt Solution D 2005 Massachusetts Institute of Technology. Corresponding author: Robert J. Gillies, University of Arizona Cancer Center, Tucson, AZ 85724-5024; e-mail: [email protected]. *These authors contributed equally to this work. Received 10 November 2003; Accepted 17 August 2004. RESEARCH ARTICLE Molecular Imaging . Vol. 3, No. 4, October 2004, pp. 324 – 332 324
-
Upload
independent -
Category
Documents
-
view
1 -
download
0
Transcript of Thermostability of firefly luciferases affects efficiency of detection by in vivo bioluminescence

Thermostability of Firef ly Luciferases Affects Efficiency ofDetection by In Vivo Bioluminescence
Brenda Baggett1 Rupali Roy1 Shafinaz Momen1 Sherif Morgan1 Laurence Tisi2
David Morse1 and Robert J Gillies1
1University of Arizona and 2Cambridge University
AbstractLuciferase from the North American firefly (Photinis pyralis) is
a useful reporter gene in vivo allowing noninvasive imaging of
tumor growth metastasis gene transfer drug treatment and
gene expression Luciferase is heat labile with an in vitro half-
life of approximately 3 min at 37C We have characterized wild
type and six thermostabilized mutant luciferases In vitro
mutants showed half-lives between 2- and 25-fold higher than
wild type Luciferase transfected mammalian cells were used to
determine in vivo half-lives following cycloheximide inhibition
of de novo protein synthesis This showed increased in vivo
thermostability in both wild-type and mutant luciferases This
may be due to a variety of factors including chaperone activity
as steady-state luciferase levels were reduced by geldanamycin
an Hsp90 inhibitor Mice inoculated with tumor cells stably
transfected with mutant or wild-type luciferases were imaged
Increased light production and sensitivity were observed in the
tumors bearing thermostable luciferase Thermostable pro-
teins increase imaging sensitivity Presumably as more active
protein accumulates detection is possible from a smaller
number of mutant transfected cells compared to wild-type
transfected cells Mol Imaging (2004) 3 324ndash 332
Keywords Luciferase in vivo bioluminescence thermostability breast cancer tumors
metastasis
Introduction
In the current study we test the hypothesis that ther-
mostabilization will lead to a higher accumulation of
firefly luciferase in human tumor cells and that this will
improve the lower detection limit of luciferase express-
ing cells in whole animals Luciferase is a powerful
in vivo reporter system whose main strength is the rela-
tive absence of endogenous light-emitting signals from
higher organisms Hence it can provide extremely high
signal to noise Over the past few years methods have
been developed to detect expression of luciferase pro-
teins in living mice [1ndash3] Applications of this technol-
ogy have grown and now include the detection of
tumor growth [4] the detection of tumor metastases
[5] as a reporter for gene expression under control of
regulable promoters [6ndash9] as a reporter for efficacy of
gene therapy [810ndash13] measurement of in vivo phar-
macodynamics [1415] and as a reporter for toxicology
studies [16ndash18]
Luciferases are made by a wide variety of phyla in-
cluding bioluminescent species such as beetles fireflies
bacteria and marine coelenterates and dinoflagellates
[19ndash24] The most widely used luciferase reporter gene
is that of the North American firefly Photinis pyralis
Wild-type P pyralis luciferase is thermolabile with an
in vitro half-life for activity on the order of 2ndash3 min at
37C (see Results) However luciferase is stabilized
in vivo with half-lives from 1 to 4 hr [2526] This has
certain obvious advantages as well as disadvantages On
the one hand a high turnover rate of the reporter would
be advantageous in time-sensitive studies such as those
to determine the response to an environmental toxin
infection or induction or repression of gene expression
However a high turnover rate could limit the accumula-
tion of functional luciferase molecules and would un-
doubtedly have a higher explicit energy cost associated
with continuous de novo protein synthesis On the other
hand it is proposed that a lower turnover rate provided
by thermostabilization will lead to higher accumulation of
active luciferase molecules and that this will lead to
higher light output on a per-cell basis and thus improve
detection This would be advantageous for studies that
are not time-sensitive such as monitoring tumor growth
or colonization of metastases This is especially important
in investigating metastases as there would be significant
interest in the fate of micro-metastases which might
otherwise escape detection due to their small size
Materials and Methods
Chemicals and Buffers
Unless otherwise noted all chemicals were obtained
from Sigma (St Louis MO) Hanks Balanced Salt Solution
D 2005 Massachusetts Institute of Technology
Corresponding author Robert J Gillies University of Arizona Cancer Center Tucson AZ
85724-5024 e-mail gilliesemailarizonaedu
These authors contributed equally to this work
Received 10 November 2003 Accepted 17 August 2004
RESEARCH ARTICLE Molecular Imaging Vol 3 No 4 October 2004 pp 324 ndash 332 324
(HBSS) 54 mM KCl 04 mM KH2PO4 42 mM NaHCO3
137 mM NaCl 03 mM Na2HPO4 In order to gener-
ate HBSS at different pH values pH was adjusted by
adding either HCl or NaOH to the desired pH Native
firefly luciferase-recombinant protein was purchased
from RampD Systems (Minneapolis MN) (700-LF-01M)
LuciferinmdashD-luciferin potassium salt was a generous gift
from Brian Ross (University of Ann Arbor Michigan)
Luciferase Assay reagent (LAR) and Cell Culture Lysis Re-
agent (CCLR) were purchased from Promega (Madison
WI) Luciferase mutants were cloned into a pET23a(+)
bacterial expression vector at the NdeI and SalI sites of
the MCS and maintained in Escherichia coli B121 DE3
Wild-type luciferase was isolated from pGEM-luc from
Promega The mammalian expression vector used was
pcDNA31() from Invitrogen (Carlsbad CA) with a se-
lectable neomycin resistance gene
Production of Mutant Luciferases from Bacteria
Preliminary experiments were done to optimize for
induction time DH5a bacteria were transformed with a
pET23a(+)mutant luciferase construct Colonies of
bacteria were isolated then grown in liquid cultures of
LB broth (Sigma L 3152) in an orbital shaking incubator
One milliliter of cell suspension was removed the bacte-
rial cells pelleted then resuspended in 1 mL HBSS
pH 78 This sample was placed in the luminometer a
background reading was taken D-luciferin was added
and the light intensity was recorded IPTG was then
added to the remainder of the culture to a final concen-
tration of 01 mM and cultures were left in an orbital
shaking incubator Samples were then removed at multi-
ple time points post-IPTG induction and the assay pro-
cess was repeated Peak induction was seen between
1 and 2 hr In vitro experiments were performed by
isolating the mutant luciferase protein from bacterial
cultures In an orbital shaking incubator 2-mL starter
cultures were grown from isolated colonies incubated
overnight and then transferred to 100 mL LB broth After
incubating for 2 hr cells were induced with IPTG Two
hours post-induction cells were harvested and washed a
lysozyme buffer (9 mgmL lysozyme in PBS) was added
and the cells were subjected to a freezendashthaw cycle after
addition of Triton X-100 Samples were spun and super-
natant aliquoted then frozen for use with in vitro tem-
perature half-life assays
Mammalian Cell Culture
All mammalian cell lines were grown in DMEF-12
media (Sigma D0547) with 10 FBS Cells were pas-
saged weekly The parental cell lines MDA-mb-231
(metastatic breast) and SW-480 (colon) were plated into
six-well plates or 10-cm dishes for transfections Stable
cell lines were created by adding selection media (G418
sulfate Geneticin 400 mgmL Invitrogen) and cells
maintained were under selection Cells for mouse inoc-
ulations were expanded equally into several T-75 flasks
one flask was trypsinized and counted in an appropriate
number of flasks cells were scraped centrifuged and
resuspended in a volume of 11 salinecell suspension to
Matrigel (BD Biosciences Franklin Lakes NJ) so that a
100-mL inoculum contains 3 106 cells
Preparation of Mammalian Expression Vectors
DNA was isolated from colonies of B121 DE3 E coli
transformed with a bacterial expression vector carrying
one of six different mutant forms of luciferase that were
previously generated by a random mutagenesis screen in
yeast These mutant sequences were cloned into the
NdeI and SalI sites of the MCS of pET23a(+) (Tisi
unpublished) Competent DH5a cells were then trans-
formed with the various mutants designated A-F (see
Table 1) Each mutant DNA was isolated digested and
ligated into a mammalian expression vector All mutants
were transferred into the pcDNA31() mammalian
expression vector at ApaI and XhoI The wild-type
luciferase was transferred from pGEM-luc (Promega) to
pcDNA31() also at ApaI and XhoI SW-480 colon can-
cer cells were transiently transfected using FuGene-6
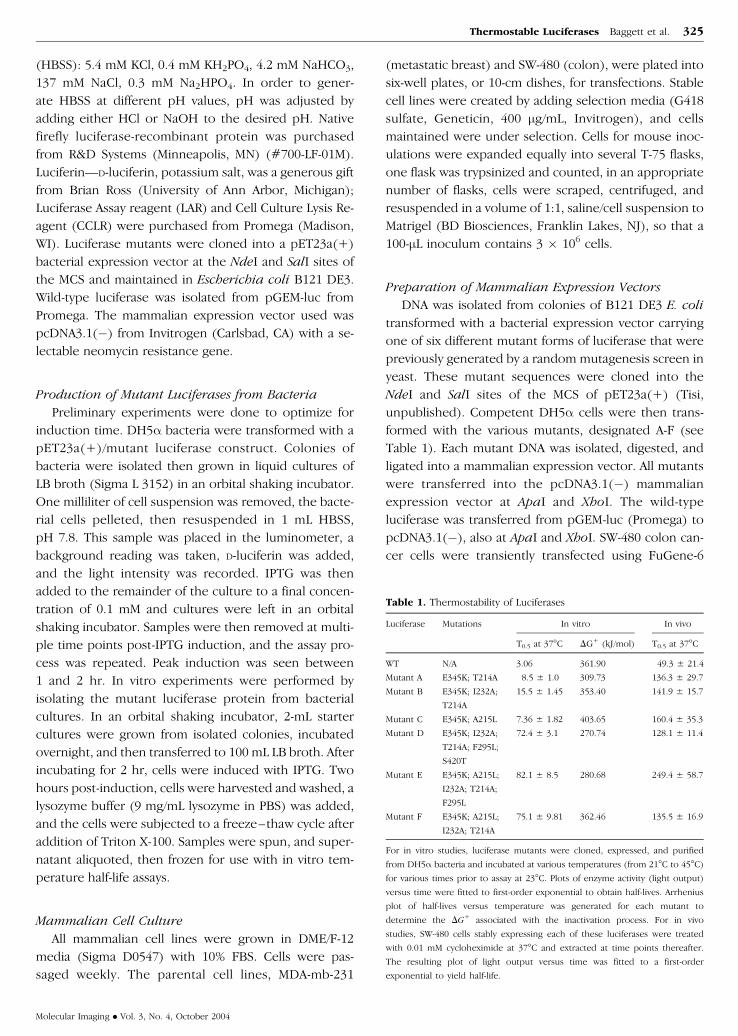
Table 1 Thermostability of Luciferases
Luciferase Mutations In vitro In vivo
T05 at 37C DG+ (kJmol) T05 at 37C
WT NA 306 36190 493 plusmn 214
Mutant A E345K T214A 85 plusmn 10 30973 1363 plusmn 297
Mutant B E345K I232A
T214A
155 plusmn 145 35340 1419 plusmn 157
Mutant C E345K A215L 736 plusmn 182 40365 1604 plusmn 353
Mutant D E345K I232A
T214A F295L
S420T
724 plusmn 31 27074 1281 plusmn 114
Mutant E E345K A215L
I232A T214A
F295L
821 plusmn 85 28068 2494 plusmn 587
Mutant F E345K A215L
I232A T214A
751 plusmn 981 36246 1355 plusmn 169
For in vitro studies luciferase mutants were cloned expressed and purified
from DH5a bacteria and incubated at various temperatures (from 21C to 45C)
for various times prior to assay at 23C Plots of enzyme activity (light output)
versus time were fitted to first-order exponential to obtain half-lives Arrhenius
plot of half-lives versus temperature was generated for each mutant to
determine the DG+ associated with the inactivation process For in vivo
studies SW-480 cells stably expressing each of these luciferases were treated
with 001 mM cycloheximide at 37C and extracted at time points thereafter
The resulting plot of light output versus time was fitted to a first-order
exponential to yield half-life
Thermostable Luciferases Baggett et al 325
Molecular Imaging Vol 3 No 4 October 2004
(Roche Indianapolis IN) with each of the mammalian
expression constructs Transfected cells were incubated
for 48 hr lyzed with CCLR (Promega) and assayed for
light Polyclonal stable transfectants were also created
by transfection of SW-480 cells or MDA-mb-231 cells
using FuGene-6 48-hr incubation followed by selec-
tion using media containing 04 mgmL G418 Cells con-
tinued to be passaged and grown in selection media
All stable lines were tested to confirm light production
Quantitative RT-PCR was conducted on RNA extracts of
the various transfected cell lines to determine levels of
message being produced by each cell line
Detection of Light Output in Cells and Extracts
For most studies light output was detected in vitro
using an SLM 8100C spectrofluorometer operating with-
out excitation Photons were collected by Hamamatsu
photomultipliers operating at room temperature with
attendant dark current For all studies the PMT voltage
and gains were kept constant at 1250 V and 10
respectively allowing comparison between assays run
at different times The reproducibility was verified in
parallel experiments (data not shown)
Detection of Light Output In Vivo
Wild-type luciferase and thermostable mutants are to
be compared to each other by imaging the cells in mice
Mutant luciferase cells were chosen for imaging studies
based on mRNA expression levels being comparable to
wild-type mRNA expression as well as having a long
half-life at 37C Mutant F was chosen as the mutant
luciferase for these studies SCID mice were inoculated
subcutaneously with MDA-mb-231WT on the left flank
and MDA-mb-231mut F on the right flank using 3 106 cells in 100 mL Matrigel On Day 8 tumors were
barely palpable The mice were anesthetized using a Ke-
tamine Acepromazine and Xylazine cocktail (72 mgkg
Ketamine 6 mgkg each Acepromazine and Xylazine)
then imaged using a VersArray 1300B cooled CCD cam-
era (Roper Scientific Tucson AZ) A top-illuminated im-
age was taken using a 100-msec exposure at f 16 The
luminescent image was then taken using a 10-min expo-
sure at f 28 5 min after an intraperitoneal injection of
175 mgkg luciferin An intensity map was created using
WinView32 software (Princeton Instruments Trenton
NJ) The final image was created by superimposing the
color intensity map onto the light image using Adobe
Photoshop 60 The imaging process was repeated on
Days 15 22 and 29 and caliper measurements taken of
all tumors each time (tumors were only palpable not
measurable until Day 22)
qRT-PCR
Quantitative RT-PCR was done by isolating RNA from
cell lines using a tRNA isolation mini-prep kit (Sigma
RTN-70) DNase treatment (Ambion Austin TX Cat
1906) of the samples and followed by a SuperScript one-
step RT-PCR reaction (Invitrogen) The RT-PCR reaction
was run using a Smart Cycler (Cepheid Sunnyvale CA)
Reactions were set up using previously designed PCR
primers for luciferase (forward-GGGATACGACAAGGA-
TATGGGC reverse-TGGAACAACTTTACCGACCGC) and
a GAPDH control and detected by SYBR Green dye
(Molecular Probes Eugene OR) Further experiments
were carried out using a primerprobe design Primers
and a TET-labeled probe for luciferase (forward-GGC-
GCGTTATTTATCGGAGTT reverse-TGGCGAGGGTGCT-
TACGT probe-TET-TTGCGCCCGCGAACGACATT) were
designed by using Primer Express software (Applied
Biosystems Foster City CA) A commercially available
FAM-labeled b-actin primer and probe set (Applied Bio-
systems) were used as an internal control Data were
expressed relative to glyceraldehydes phosphate dehy-
drogenase (GAPDH) or b-actin mRNA Both of these have
been shown to be robust control mRNA for these cell
lines (Morse et al submitted)
Results
Determination of Optimal pH and Temperature of
Wild-Type Luciferase
The activity of native (wild-type) firefly luciferase is
sensitive to both pH and temperature Optimum pH was
determined by incubating 20 mL of recombinant lucifer-
ase in 880 mL of HBSS adjusted to various pH levels
Baseline PMT current was monitored until stable at
which time 100 mL of LAR was added and the change in
light output was recorded in arbitrary units Light output
was highest with the HBSS between pH 7 and 9 When
these data were corrected for final pH the peak range
decreased significantly as shown in Figure 1A Conse-
quently HBSS at a pH of 78 prior to addition of LAR was
used for all subsequent studies as the pH of the solution
did not change upon addition of LAR
The effect of temperature on luciferase activity is il-
lustrated in Figure 1B which shows the time-dependent
light output following addition of luciferase and LAR to
HBSS and assayed at 23C and 40C As shown in this
figure light output remains constant at 23C whereas
less light is transiently emitted from the incubation at
40C The thermosensitive component was determined
by independently incubating LAR HBSS and luciferase
at various temperatures prior to analysis Neither LAR
nor HBSS showed any thermolability (data not shown)
326 Thermostable Luciferases Baggett et al
Molecular Imaging Vol 3 No 4 October 2004
Figure 1 Characterization of wild-type firefly luciferase in vitro and in vivo (A) pH sensitivity Commercial firefly luciferase was incubated at 23C in HBSS at
various pH values and LAR induced light output was measured Data are expressed as arbitrary units of bioluminescence plusmn SD (n 3 per datum) (B) Time course of
light output at 23C and 40C Luciferase and LAR were added to HBSS (pH 78) prewarmed to the indicated temperature and light captured by PMTs Data are
expressed as arbitrary units of bioluminescence Gains PMT voltages and volumes were identical between samples At 23C light was at a high intensity and remained
stable At 40C intensity was not as high initially and degraded over time (C) Decrease in light output from as a function of time at different temperatures Luciferase
was incubated at the indicated temperatures for the indicated amount of time after which it was cooled to 23C and assayed for light output by the addition of LAR
Data are expressed as arbitrary units of bioluminescence plusmn SD (n 3 per datum) (D) Half-lives at different temperatures with Arrhenius plot The half-lives of
luciferase were determined at different temperatures by exponential fit to data shown in C An inverse plot (inset) indicates an energy of activation of approximately
340 kJmol (E) Light output from cells following incubation at 27C and 37C Equivalent cultures of 9L glioma cells were incubated for 18 hr at either 23C or 37C
Cells were trypsinized and suspended in a cuvette containing HBSS at 23C For detection of in vivo luminescence luciferin was added to the cell suspension and the
luciferin induced light emission determined by PMTs Alternatively the in vitro luciferase activity was determined following lysis of the cells and addition of LAR Data
are expressed as arbitrary units of bioluminescence plusmn SD (n = 4 per datum)
Thermostable Luciferases Baggett et al 327
Molecular Imaging Vol 3 No 4 October 2004
However as shown in Figure 1C luciferase itself was
significantly thermolabile Luciferase was incubated at
different temperatures for various amounts of time in
HBSS (pH 78) after which the temperature was re-
duced to 23C and the increase in light output was mea-
sured in response to addition of LAR As shown in this
figure light output decreased with incubation time at
all temperatures The rates of decrease were multi-
phasic suggesting complex mechanisms yet were uni-
formly faster at higher temperatures Luciferase activity
was still present at up to 6 hr at 28C and 3 hr at 30C At
34C and 37C however luciferase activity was com-
pletely abolished by 50 and 20 min respectively From
these data half-lives were calculated by fitting the data to
simple first-order exponentials The half-lives at different
temperatures are shown in Figure 1D An inverse plot of
these data is shown in the inset These data were fit to
the Arrhenius equation k = A exp(EART) where k is the
rate of enzyme inactivation E is the activation energy
associated with the inactivation process in kJ per mole
and T is the absolute temperature in Kelvin This yields a
DGDagger activation energy of 3619 kJmol
An initial test was then conducted to assess whether
the thermolability of luciferase significantly affected
steady-state enzyme activity in vivo Cultures of 9L glioma
cells stably expressing WT luciferase were split and incu-
bated in parallel for 18 hr at 23C or 37C with the
expectation that lower temperatures would result in an
accumulation of enzyme At the end of the incubation
luciferase activity was assessed both in vivo with the
addition of luciferin to whole cells and following cell lysis
with the addition of LAR As shown in Figure 1E luciferase
levels increased significantly upon incubation at 23Ccompared to 37C supporting the hypothesis that lucif-
erase thermolability significantly affects steady-state en-
zyme accumulation in vivo
Thermostable Mutants
The previous data suggest that the thermolability of
luciferase could have a significant effect on steady-state
protein levels in vivo To further investigate this phe-
nomenon a series of thermostable mutants were ana-
lyzed (listed in Table 1) These were expressed and
isolated from DH5a bacteria and the in vitro half-lives
were determined as described in Materials and Methods
As shown in Table 1 and Figure 2B the in vitro half-lives
of these mutants were significantly longer as compared
to wild-type luciferase Note that the activation energy
DGDagger of enzyme inactivation remained between 280 and
404 kJmol for all mutants comparable to the 362 kJmol
for wild type
In Vivo Turnover Rates
A more detailed analysis of the in vivo significance
of thermolability was performed by determination of
in vivo protein turnover rates In these experiments
mutant luciferases were subcloned into mammalian
expression vectors (pcDNA31()) and stably expressed
in SW-480 colon carcinoma cells under selection with
G418 These cells were treated at 37C with 10 mM cy-
cloheximide which is sufficient to inhibit de novo pro-
tein synthesis The amount of active luciferase was
determined in vitro at different time points and the
subsequent rate of light reduction was used to estimate
the in vivo turnover rate A typical response is shown in
Figure 2C which shows the loss of light following
cycloheximide treatment of SW-480 cells expressing
luciferase mutant F As shown in this figure the light
decreased with first-order exponential kinetics with a
calculated half-life of 135 min Independent half-life
determinations (with n = 1 sample per time point)
were repeated at least four times per mutant and these
data were averaged A summary of results from all
mutants is presented in Table 1 Note that the in vivo
half-lives are significantly longer than those observed
in vitro and that in general the relative in vivo half-lives
compare favorably to the relative in vitro half-life values
(Figure 2B) In other words wild-type luciferase has the
shortest half-life and mutant E has the longest half-life
both in vitro and in vivo Western blot analyses show
higher luciferase protein levels therefore lower detec-
tion limits in mutant luciferase compared to wild-type
cell extracts (data not shown) Although the mech-
anisms behind the differences between in vivo and
in vitro half-lives are not known a reasonable hypothesis
is that this is due to the presence of chaperone proteins
in vivo [2728] This is supported by the observation that
geldanamycin an inhibitor of the chaperone Hsp90
leads to a reduction in steady-state wild-type luciferase
levels (Figure 2D) It should be noted that at this dose
(200 nM) geldanamycin is not toxic to MDA-mb-231
cells (data not shown) Therefore the decreased lucif-
erase activity was not due simply to cell death
In Vivo Imaging
To test the hypothesis that thermostabilization of
luciferases will lead to higher steady-state light output
mice were inoculated with tumor cells expressing either
wild-type or mutant luciferases In order for this com-
parison to be valid the steady-state luciferase mRNA
levels must be similar between two cell lines that are to
be compared SW-480 and MDA-mb-231 cells were trans-
fected with mutant and wild-type luciferases and mRNA
328 Thermostable Luciferases Baggett et al
Molecular Imaging Vol 3 No 4 October 2004
levels were compared by quantitative RT-PCR In initial
experiments primers for GAPDH were used to compare
luciferase levels by taking the log2 amount of luciferase
mRNA expressed relative to the log2 GAPDH product
from the same preparation Subsequent experiments
used a primerprobe design to assess by multiplex
analysis b-actin and luciferase levels within a single
reaction Steady-state luciferase mRNA levels were com-
pared across all cell lines and there was a general
agreement between mRNA and light output (data not
shown) Of all cell lines SW-480 cells expressing mutant
E and MDA-mb-231 cells expressing mutant F had mRNA
levels that were closest to their respective control cell
lines expressing wild-type luciferases (data not shown)
Although both of these were tested in vivo subsequent
RT-PCR from tumor extracts showed that SW-480 cells
expressing wild-type luciferase consistently lost mRNA
expression when grown in the absence of selection (data
not shown)
Consequently in vivo studies were carried out using
MDA-mb-231 transfected with WT and mutant F lucif-
erases which were shown to have comparable mRNA
levels and representative differences in their steady-state
light output as seen in Figure 3A Transfected WT or
mutant F MDA-mb-231 cells were grown as subcutaneous
xenografts in flanks of SCID mice imaged during tumor
growth All mutant tumors showed greater light intensity
than wild-type tumors SimplePCI software was used
to analyze the light intensity from bioluminescent im-
ages Images were converted to 16-bit TIF images and
were analyzed by implementing a threshold of twice
background to automatically select regions of light out-
put The selected regions were measured for number
of pixels in a region total light intensity over the region
Figure 2 Characterization of mutant luciferases in vitro and in vivo (A) Renaturation of mutant luciferase protein Thermostable mutant luciferase protein was
incubated at 37C for various amounts of time Light was either assayed immediately in the denatured state or allowed to renature at room temperature prior to
being assayed (B) In vitro and in vivo half-lives of wild-type and mutant luciferases In vitro half-lives were determined by IPTG induced bacteria and subsequent
luciferase protein isolation In vivo half-lives were determined from luciferase transfected mammalian tumor cell lines (C) In vivo light output at times following
cycloheximide Typical result showing effects of cyclohexamide inhibiting protein synthesis in cells transfected with thermostable mutant luciferase (D) Effects of
geldanamycin This suggests the role of chaperone activity in the stabilization of luciferase protein Geldanamycin inhibits chaperone activity thereby decreasing light
output without being toxic to the cell
Thermostable Luciferases Baggett et al 329
Molecular Imaging Vol 3 No 4 October 2004
and an average of intensity per pixel was calculated
(Figure 3B) As shown in Figure 3D the light output
from the tumor-expressing mutant F is significantly
higher than that of the tumor-expressing wild-type
luciferase In all mice imaged the mutant tumor pro-
duced greater light intensity than that of the wild-type
tumor on all days imaged Due to slightly varying tumor
growth rates most animals had larger WT tumors than
mutant tumors over the imaging time course whereas
a few had larger mutant F tumors than WT tumors To
verify that tumor size was not the influencing factor MR
images were taken to calculate the tumor volume be-
fore the tumors were palpable This showed that tumor
volume was not the reason for increased light intensity
Figure 3 (A) qRT-PCR Using a primerprobe design luciferase levels were compared to b -actin levels Results of MDA-mb-231 cells transfected with either wild-type or
mutant F luciferase that were used to inoculate mice are shown here Samples are compared at a cycle threshold (30 units) the point at which the slope of the curve
changes At this point the ratio of luciferase to b -actin shows that the expression of luciferase in WT is slightly higher than that of the mutant yet not significantly
different (B) Light output of WT and mutant F from tumors in vivo SimplePCI software was used to analyze images A threshold was set to automatically select regions
of increased intensity The areas selected were calculated for number of pixels in the region and total intensity within the region Area in pixels is an approximation of
tumor volume since tumors were not large enough for caliper measurements until Week 3 (C) In vivo imaging sensitivity Tumor volumes were initially measured by
MR imaging before they were large enough for caliper measurements Tumor volumes here were estimated based on MRI tumor volumes versus number of detectable
pixels for the remainder of the experiment only a percentage of the wild-type tumor is detectable compared to the detectable area of the mutant tumor Due to
increased sensitivity mutant luciferase can be imaged at a much smaller size with much greater intensity Tumor volumes through 4 weeks postinoculation showed
that wild-type tumors were larger than mutant F tumors (D) Bioluminescence of mouse bearing tumors expressing WT and mutant luciferases In all cases the
mutant luciferase showed greater light output than WT In this image MR images were taken to determine tumor volumes showing that although the WT tumor is four
times larger than the mutant tumor the mutant tumor has a higher light intensity greater light per pixel and greater detectable area
330 Thermostable Luciferases Baggett et al
Molecular Imaging Vol 3 No 4 October 2004
The MR tumor volume measurements were also useful
since imaging of tumors was possible more than 2 weeks
before caliper measurements could be made
Discussion
Luciferase is a powerful reporter gene for in vitro
detection of gene expression and has more recently
been used in in vivo bioluminescence imaging Because
the wild-type protein is relatively thermolabile at in vivo
temperatures it was hypothesized that this would limit
the in vivo accumulation of light emitting activity on a
per-cell basis This work has shown that thermostabili-
zation achieved through specific mutations and can lead
to higher steady-state levels of enzyme accumulation
in vivo In all cases heat-induced loss of enzyme activity
was associated with an energy of activation near 340 kJ
mol The relationship between the measured in vivo
half-lives and the apparent activation energy of inacti-
vation is clearly complex For example wild type and
mutant F have essentially the same value of DGDagger
(3619 and 3625 kJmol respectively) yet the in vivo
half-life of mutant F is close to three times that of WT
This may reflect that the irreversible inactivation of
luciferases can occur via several pathways [29ndash32]
making interpretations of apparent DGDagger values difficult
These analyses indicated largely similar activation ener-
gies for enzyme inactivation for both mutants and wild-
type enzymes in the range of 340 kJmol The fact that
the mutant luciferases show greatly increased half-lives
despite little variation in their activation energies for
inactivation is noteworthy This suggests that the mech-
anisms by which the various mutations stabilize the
enzyme do not simply come from enthalpically favorable
interactions increasing the activation energy for in-
activation Although all mutants express longer half-
lives compared to wild-type luciferase both in vitro and
in vivo the in vivo half-lives of all enzymes were signif-
icantly longer than those observed in vitro The mech-
anisms underlying the enhanced in vivo thermostability
are not known One factor is likely the activity of
chaperone proteins which could act to inhibit the
transition from native to molten globule state [33]
Indeed it has previously been shown that chaperones
prolong the half-lives of luciferases both in cell-free and
cell-based assays [27ndash2933] Consistent with this we
have shown that geldanamycin an inhibitor of the
chaperone Hsp90 reduces steady-state luciferase activ-
ities in vivo Notably the in vivo stability can also be
enhanced pharmacologically with phenylbenzothiazole
a competitive inhibitor of luciferin binding [34] Hence
in vivo stability might be coupled to activity yet this is
not explicitly the case as the specific activities of the
thermostable luciferases are comparable to wild type
In all cases thermostabilized luciferases accumulated
to higher levels than wild type as determined by the
relationship between luciferin-induced light output (ac-
tivity) and mRNA levels Notably these data do not
address the effects of these mutations on the reac-
tion kinetics which are being investigated elsewhere
Nonetheless the simplest explanation for the observed
results is the increased accumulation of luciferase en-
zyme with increased half-lives at in vivo temperatures In
either case the empirically observed increase in light
output by the cells and tumors transfected with thermo-
stabilized luciferase increased its efficiency as an in vivo
reporter gene Fewer numbers of cells can be imaged
therefore greatly increasing sensitivity Previously the
detection limit for bioluminescence imaging was deter-
mined to be approximately 1000 cells [126] The in vivo
bioluminescent data here suggest that the minimum
detectable cell number would be closer to 100 cells
Hence the use of thermostabilized luciferases may allow
monitoring of micro-metastases and the early stages of
tumor growth
Acknowledgments
We thank Prof Thomas Baldwin for helpful discussions in the prep-
aration of this manuscript and Ms Merry Warner for help in the pro-
duction of this manuscript The study was supported by the Hughes
and NSF-supported Undergraduate Biology Research Program (RR SM
SM) and NIH CA77375 (BB RJG)
References
[1] Contag CH Jenkins D Contag PR Negrin RS (2000) Use of
reporter genes for optical measurements of neoplastic disease
in vivo Neoplasia 241ndash 52
[2] Contag CH Spilman SD Contag PR Oshiro M Eames B Dennery
P Stevenson DK Benaron DA (1997) Visualizing gene expres-
sion in living mammals using a bioluminescent reporter Photo-
chem Photobiol 66523ndash 531
[3] Contag PR Olomu IN Stevenson DK Contag CH (1998)
Bioluminescent indicators in living mammals Nat Med 4
245ndash 247
[4] Rehemtulla A Stegman LD Cardozo SJ Gupta S Hall DE Contag
CH Ross BD (2000) Rapid and quantitative assessment of cancer
treatment response using in vivo bioluminescence imaging
Neoplasia 2491ndash 495
[5] Wetterwald A van der PG Que I Sijmons B Buijs J Karperien M
Lowik CW Gautschi E Thalmann GN Cecchini MG (2002)
Optical imaging of cancer metastasis to bone marrow A mouse
model of minimal residual disease Am J Pathol 1601143ndash 1153
[6] Shibata T Giaccia AJ Brown JM (2000) Development of a
hypoxia-responsive vector for tumor-specific gene therapy Gene
Ther 7493ndash498
[7] Shibata T Giaccia AJ Brown JM (2002) Hypoxia-inducible
Thermostable Luciferases Baggett et al 331
Molecular Imaging Vol 3 No 4 October 2004
regulation of a prodrug-activating enzyme for tumor-specific
gene therapy Neoplasia 440ndash 48
[8] Shin JH Yi JK Lee YJ Kim AL Park MA Kim SH Lee H Kim
CG (2003) Development of artificial chimerical gene regulatory
elements specific for cancer gene therapy Oncol Rep 10
2063ndash2069
[9] Chinnusamy V Stevenson B Lee BH Zhu JK (2002) Screening
for gene regulation mutants by bioluminescence imaging Sci
STKE 2002L10
[10] Rehemtulla A Hall DE Stegman LD Prasad U Chen G Bhojani
MS Chenevert TL Ross BD (2002) Molecular imaging of gene
expression and efficacy following adenoviral-mediated brain
tumor gene therapy Mol Imaging 143ndash55
[11] Chaudhuri TR Rogers BE Buchsbaum DJ Mountz JM Zinn KR
(2001) A noninvasive reporter system to image adenoviral-
mediated gene transfer to ovarian cancer xenografts Gynecol
Oncol 83432ndash 438
[12] Brun S Faucon-Biguet N Mallet J (2003) Optimization of
transgene expression at the posttranscriptional level in neural
cells Implications for gene therapy Mol Ther 7782ndash789
[13] Siemens DR Crist S Austin JC Tartaglia J Ratliff TL (2003)
Comparison of viral vectors Gene transfer efficiency and tissue
specificity in a bladder cancer model J Urol 170979ndash 984
[14] Nunn C Feuerbach D Lin X Peter R Hoyer D (2002) Pharma-
cological characterisation of the goldfish somatostatin sst5 re-
ceptor Eur J Pharmacol 436173ndash 186
[15] Kimm-Brinson KL Moeller PD Barbier M Glasgow H Jr
Burkholder JM Ramsdell JS (2001) Identification of a P2X7
receptor in GH(4)C(1) rat pituitary cells A potential target for a
bioactive substance produced by Pfiesteria piscicida Environ
Health Perspect 109457ndash 462
[16] Catania JM Parrish AR Kirkpatrick DS Chitkara M Bowden GT
Henderson CJ Wolf CR Clark AJ Brendel K Fisher RL Gandolfi
AJ (2003) Precision-cut tissue slices from transgenic mice as an
in vitro toxicology system Toxicol In Vitro 17201ndash 205
[17] Billard P DuBow MS (1998) Bioluminescence-based assays for
detection and characterization of bacteria and chemicals in
clinical laboratories Clin Biochem 311ndash 14
[18] Bitton G Koopman B (1992) Bacterial and enzymatic bioassays
for toxicity testing in the environment Rev Environ Contam
Toxicol 1251 ndash22
[19] Greer LF Szalay AA III (2002) Imaging of light emission from the
expression of luciferases in living cells and organisms A review
Luminescence 1743ndash 74
[20] Hastings JW (1996) Chemistries and colors of bioluminescent
reactions A review Gene 1735 ndash11
[21] Viviani VR (2002) The origin diversity and structure func-
tion relationships of insect luciferases Cell Mol Life Sci 59
1833ndash 1850
[22] Lall AB Ventura DS Bechara EJ de Souza JM Colepicolo-Neto P
Viviani VR (2000) Spectral correspondence between visual
spectral sensitivity and bioluminescence emission spectra in the
click beetle Pyrophorus punctatissimus (Coleoptera Elateridae)
J Insect Physiol 461137ndash 1141
[23] Viviani VR Silva AC Perez GL Santelli RV Bechara EJ Reinach FC
(1999) Cloning and molecular characterization of the cDNA for
the Brazilian larval click-beetle Pyrearinus termitilluminans
luciferase Photochem Photobiol 70254ndash 260
[24] Schmitter RE Njus D Sulzman FM Gooch VD Hastings JW
(1976) Dinoflagellate bioluminescence A comparative study of
in vitro components J Cell Physiol 87123ndash 134
[25] Day RN Kawecki M Berry D (1998) Dual-function reporter
protein for analysis of gene expression in living cells BioTech-
niques 25848ndash4 856
[26] Leclerc GM Boockfor FR Faught WJ Frawley LS (2000) De-
velopment of a destabilized firefly luciferase enzyme for mea-
surement of gene expression BioTechniques 29590ndash596 598
[27] Souren JE Wiegant FA van Hof P van Aken JM van Wijk R
(1999) The effect of temperature and protein synthesis on the
renaturation of firefly luciferase in intact H9c2 cells Cell Mol Life
Sci 551473ndash1481
[28] Souren JE Wiegant FA van Wijk R (1999) The role of hsp70
in protection and repair of luciferase activity in vivo experi-
mental data and mathematical modelling Cell Mol Life Sci 55
799ndash 811
[29] Herbst R Schafer U Seckler R (1997) Equilibrium intermediates
in the reversible unfolding of firefly (Photinus pyralis) luciferase
J Biol Chem 2727099ndash7105
[30] Herbst R Gast K Seckler R (1998) Folding of firefly (Photinus
pyralis) luciferase Aggregation and reactivation of unfolding
intermediates Biochemistry 376586ndash 6597
[31] Baldwin TO Chen LH Chlumsky LJ Devine JH Ziegler MM
(1989) Site-directed mutagenesis of bacterial luciferase Analysis
of the lsquolsquoessentialrsquorsquo thiol J Biolumin Chemilumin 440ndash48
[32] Chen LH Baldwin TO (1989) Random and site-directed muta-
genesis of bacterial luciferase Investigation of the aldehyde
binding site Biochemistry 282684ndash 2689
[33] Flynn GC Beckers CJ Baase WA Dahlquist FW (1993)
Individual subunits of bacterial luciferase are molten globules
and interact with molecular chaperones Proc Natl Acad Sci
USA 9010826ndash 10830
[34] Thompson JF Hayes LS Lloyd DB (1991) Modulation of firefly
luciferase stability and impact on studies of gene regulation
Gene 103171ndash 177
332 Thermostable Luciferases Baggett et al
Molecular Imaging Vol 3 No 4 October 2004
(HBSS) 54 mM KCl 04 mM KH2PO4 42 mM NaHCO3
137 mM NaCl 03 mM Na2HPO4 In order to gener-
ate HBSS at different pH values pH was adjusted by
adding either HCl or NaOH to the desired pH Native
firefly luciferase-recombinant protein was purchased
from RampD Systems (Minneapolis MN) (700-LF-01M)
LuciferinmdashD-luciferin potassium salt was a generous gift
from Brian Ross (University of Ann Arbor Michigan)
Luciferase Assay reagent (LAR) and Cell Culture Lysis Re-
agent (CCLR) were purchased from Promega (Madison
WI) Luciferase mutants were cloned into a pET23a(+)
bacterial expression vector at the NdeI and SalI sites of
the MCS and maintained in Escherichia coli B121 DE3
Wild-type luciferase was isolated from pGEM-luc from
Promega The mammalian expression vector used was
pcDNA31() from Invitrogen (Carlsbad CA) with a se-
lectable neomycin resistance gene
Production of Mutant Luciferases from Bacteria
Preliminary experiments were done to optimize for
induction time DH5a bacteria were transformed with a
pET23a(+)mutant luciferase construct Colonies of
bacteria were isolated then grown in liquid cultures of
LB broth (Sigma L 3152) in an orbital shaking incubator
One milliliter of cell suspension was removed the bacte-
rial cells pelleted then resuspended in 1 mL HBSS
pH 78 This sample was placed in the luminometer a
background reading was taken D-luciferin was added
and the light intensity was recorded IPTG was then
added to the remainder of the culture to a final concen-
tration of 01 mM and cultures were left in an orbital
shaking incubator Samples were then removed at multi-
ple time points post-IPTG induction and the assay pro-
cess was repeated Peak induction was seen between
1 and 2 hr In vitro experiments were performed by
isolating the mutant luciferase protein from bacterial
cultures In an orbital shaking incubator 2-mL starter
cultures were grown from isolated colonies incubated
overnight and then transferred to 100 mL LB broth After
incubating for 2 hr cells were induced with IPTG Two
hours post-induction cells were harvested and washed a
lysozyme buffer (9 mgmL lysozyme in PBS) was added
and the cells were subjected to a freezendashthaw cycle after
addition of Triton X-100 Samples were spun and super-
natant aliquoted then frozen for use with in vitro tem-
perature half-life assays
Mammalian Cell Culture
All mammalian cell lines were grown in DMEF-12
media (Sigma D0547) with 10 FBS Cells were pas-
saged weekly The parental cell lines MDA-mb-231
(metastatic breast) and SW-480 (colon) were plated into
six-well plates or 10-cm dishes for transfections Stable
cell lines were created by adding selection media (G418
sulfate Geneticin 400 mgmL Invitrogen) and cells
maintained were under selection Cells for mouse inoc-
ulations were expanded equally into several T-75 flasks
one flask was trypsinized and counted in an appropriate
number of flasks cells were scraped centrifuged and
resuspended in a volume of 11 salinecell suspension to
Matrigel (BD Biosciences Franklin Lakes NJ) so that a
100-mL inoculum contains 3 106 cells
Preparation of Mammalian Expression Vectors
DNA was isolated from colonies of B121 DE3 E coli
transformed with a bacterial expression vector carrying
one of six different mutant forms of luciferase that were
previously generated by a random mutagenesis screen in
yeast These mutant sequences were cloned into the
NdeI and SalI sites of the MCS of pET23a(+) (Tisi
unpublished) Competent DH5a cells were then trans-
formed with the various mutants designated A-F (see
Table 1) Each mutant DNA was isolated digested and
ligated into a mammalian expression vector All mutants
were transferred into the pcDNA31() mammalian
expression vector at ApaI and XhoI The wild-type
luciferase was transferred from pGEM-luc (Promega) to
pcDNA31() also at ApaI and XhoI SW-480 colon can-
cer cells were transiently transfected using FuGene-6
Table 1 Thermostability of Luciferases
Luciferase Mutations In vitro In vivo
T05 at 37C DG+ (kJmol) T05 at 37C
WT NA 306 36190 493 plusmn 214
Mutant A E345K T214A 85 plusmn 10 30973 1363 plusmn 297
Mutant B E345K I232A
T214A
155 plusmn 145 35340 1419 plusmn 157
Mutant C E345K A215L 736 plusmn 182 40365 1604 plusmn 353
Mutant D E345K I232A
T214A F295L
S420T
724 plusmn 31 27074 1281 plusmn 114
Mutant E E345K A215L
I232A T214A
F295L
821 plusmn 85 28068 2494 plusmn 587
Mutant F E345K A215L
I232A T214A
751 plusmn 981 36246 1355 plusmn 169
For in vitro studies luciferase mutants were cloned expressed and purified
from DH5a bacteria and incubated at various temperatures (from 21C to 45C)
for various times prior to assay at 23C Plots of enzyme activity (light output)
versus time were fitted to first-order exponential to obtain half-lives Arrhenius
plot of half-lives versus temperature was generated for each mutant to
determine the DG+ associated with the inactivation process For in vivo
studies SW-480 cells stably expressing each of these luciferases were treated
with 001 mM cycloheximide at 37C and extracted at time points thereafter
The resulting plot of light output versus time was fitted to a first-order
exponential to yield half-life
Thermostable Luciferases Baggett et al 325
Molecular Imaging Vol 3 No 4 October 2004
(Roche Indianapolis IN) with each of the mammalian
expression constructs Transfected cells were incubated
for 48 hr lyzed with CCLR (Promega) and assayed for
light Polyclonal stable transfectants were also created
by transfection of SW-480 cells or MDA-mb-231 cells
using FuGene-6 48-hr incubation followed by selec-
tion using media containing 04 mgmL G418 Cells con-
tinued to be passaged and grown in selection media
All stable lines were tested to confirm light production
Quantitative RT-PCR was conducted on RNA extracts of
the various transfected cell lines to determine levels of
message being produced by each cell line
Detection of Light Output in Cells and Extracts
For most studies light output was detected in vitro
using an SLM 8100C spectrofluorometer operating with-
out excitation Photons were collected by Hamamatsu
photomultipliers operating at room temperature with
attendant dark current For all studies the PMT voltage
and gains were kept constant at 1250 V and 10
respectively allowing comparison between assays run
at different times The reproducibility was verified in
parallel experiments (data not shown)
Detection of Light Output In Vivo
Wild-type luciferase and thermostable mutants are to
be compared to each other by imaging the cells in mice
Mutant luciferase cells were chosen for imaging studies
based on mRNA expression levels being comparable to
wild-type mRNA expression as well as having a long
half-life at 37C Mutant F was chosen as the mutant
luciferase for these studies SCID mice were inoculated
subcutaneously with MDA-mb-231WT on the left flank
and MDA-mb-231mut F on the right flank using 3 106 cells in 100 mL Matrigel On Day 8 tumors were
barely palpable The mice were anesthetized using a Ke-
tamine Acepromazine and Xylazine cocktail (72 mgkg
Ketamine 6 mgkg each Acepromazine and Xylazine)
then imaged using a VersArray 1300B cooled CCD cam-
era (Roper Scientific Tucson AZ) A top-illuminated im-
age was taken using a 100-msec exposure at f 16 The
luminescent image was then taken using a 10-min expo-
sure at f 28 5 min after an intraperitoneal injection of
175 mgkg luciferin An intensity map was created using
WinView32 software (Princeton Instruments Trenton
NJ) The final image was created by superimposing the
color intensity map onto the light image using Adobe
Photoshop 60 The imaging process was repeated on
Days 15 22 and 29 and caliper measurements taken of
all tumors each time (tumors were only palpable not
measurable until Day 22)
qRT-PCR
Quantitative RT-PCR was done by isolating RNA from
cell lines using a tRNA isolation mini-prep kit (Sigma
RTN-70) DNase treatment (Ambion Austin TX Cat
1906) of the samples and followed by a SuperScript one-
step RT-PCR reaction (Invitrogen) The RT-PCR reaction
was run using a Smart Cycler (Cepheid Sunnyvale CA)
Reactions were set up using previously designed PCR
primers for luciferase (forward-GGGATACGACAAGGA-
TATGGGC reverse-TGGAACAACTTTACCGACCGC) and
a GAPDH control and detected by SYBR Green dye
(Molecular Probes Eugene OR) Further experiments
were carried out using a primerprobe design Primers
and a TET-labeled probe for luciferase (forward-GGC-
GCGTTATTTATCGGAGTT reverse-TGGCGAGGGTGCT-
TACGT probe-TET-TTGCGCCCGCGAACGACATT) were
designed by using Primer Express software (Applied
Biosystems Foster City CA) A commercially available
FAM-labeled b-actin primer and probe set (Applied Bio-
systems) were used as an internal control Data were
expressed relative to glyceraldehydes phosphate dehy-
drogenase (GAPDH) or b-actin mRNA Both of these have
been shown to be robust control mRNA for these cell
lines (Morse et al submitted)
Results
Determination of Optimal pH and Temperature of
Wild-Type Luciferase
The activity of native (wild-type) firefly luciferase is
sensitive to both pH and temperature Optimum pH was
determined by incubating 20 mL of recombinant lucifer-
ase in 880 mL of HBSS adjusted to various pH levels
Baseline PMT current was monitored until stable at
which time 100 mL of LAR was added and the change in
light output was recorded in arbitrary units Light output
was highest with the HBSS between pH 7 and 9 When
these data were corrected for final pH the peak range
decreased significantly as shown in Figure 1A Conse-
quently HBSS at a pH of 78 prior to addition of LAR was
used for all subsequent studies as the pH of the solution
did not change upon addition of LAR
The effect of temperature on luciferase activity is il-
lustrated in Figure 1B which shows the time-dependent
light output following addition of luciferase and LAR to
HBSS and assayed at 23C and 40C As shown in this
figure light output remains constant at 23C whereas
less light is transiently emitted from the incubation at
40C The thermosensitive component was determined
by independently incubating LAR HBSS and luciferase
at various temperatures prior to analysis Neither LAR
nor HBSS showed any thermolability (data not shown)
326 Thermostable Luciferases Baggett et al
Molecular Imaging Vol 3 No 4 October 2004
Figure 1 Characterization of wild-type firefly luciferase in vitro and in vivo (A) pH sensitivity Commercial firefly luciferase was incubated at 23C in HBSS at
various pH values and LAR induced light output was measured Data are expressed as arbitrary units of bioluminescence plusmn SD (n 3 per datum) (B) Time course of
light output at 23C and 40C Luciferase and LAR were added to HBSS (pH 78) prewarmed to the indicated temperature and light captured by PMTs Data are
expressed as arbitrary units of bioluminescence Gains PMT voltages and volumes were identical between samples At 23C light was at a high intensity and remained
stable At 40C intensity was not as high initially and degraded over time (C) Decrease in light output from as a function of time at different temperatures Luciferase
was incubated at the indicated temperatures for the indicated amount of time after which it was cooled to 23C and assayed for light output by the addition of LAR
Data are expressed as arbitrary units of bioluminescence plusmn SD (n 3 per datum) (D) Half-lives at different temperatures with Arrhenius plot The half-lives of
luciferase were determined at different temperatures by exponential fit to data shown in C An inverse plot (inset) indicates an energy of activation of approximately
340 kJmol (E) Light output from cells following incubation at 27C and 37C Equivalent cultures of 9L glioma cells were incubated for 18 hr at either 23C or 37C
Cells were trypsinized and suspended in a cuvette containing HBSS at 23C For detection of in vivo luminescence luciferin was added to the cell suspension and the
luciferin induced light emission determined by PMTs Alternatively the in vitro luciferase activity was determined following lysis of the cells and addition of LAR Data
are expressed as arbitrary units of bioluminescence plusmn SD (n = 4 per datum)
Thermostable Luciferases Baggett et al 327
Molecular Imaging Vol 3 No 4 October 2004
However as shown in Figure 1C luciferase itself was
significantly thermolabile Luciferase was incubated at
different temperatures for various amounts of time in
HBSS (pH 78) after which the temperature was re-
duced to 23C and the increase in light output was mea-
sured in response to addition of LAR As shown in this
figure light output decreased with incubation time at
all temperatures The rates of decrease were multi-
phasic suggesting complex mechanisms yet were uni-
formly faster at higher temperatures Luciferase activity
was still present at up to 6 hr at 28C and 3 hr at 30C At
34C and 37C however luciferase activity was com-
pletely abolished by 50 and 20 min respectively From
these data half-lives were calculated by fitting the data to
simple first-order exponentials The half-lives at different
temperatures are shown in Figure 1D An inverse plot of
these data is shown in the inset These data were fit to
the Arrhenius equation k = A exp(EART) where k is the
rate of enzyme inactivation E is the activation energy
associated with the inactivation process in kJ per mole
and T is the absolute temperature in Kelvin This yields a
DGDagger activation energy of 3619 kJmol
An initial test was then conducted to assess whether
the thermolability of luciferase significantly affected
steady-state enzyme activity in vivo Cultures of 9L glioma
cells stably expressing WT luciferase were split and incu-
bated in parallel for 18 hr at 23C or 37C with the
expectation that lower temperatures would result in an
accumulation of enzyme At the end of the incubation
luciferase activity was assessed both in vivo with the
addition of luciferin to whole cells and following cell lysis
with the addition of LAR As shown in Figure 1E luciferase
levels increased significantly upon incubation at 23Ccompared to 37C supporting the hypothesis that lucif-
erase thermolability significantly affects steady-state en-
zyme accumulation in vivo
Thermostable Mutants
The previous data suggest that the thermolability of
luciferase could have a significant effect on steady-state
protein levels in vivo To further investigate this phe-
nomenon a series of thermostable mutants were ana-
lyzed (listed in Table 1) These were expressed and
isolated from DH5a bacteria and the in vitro half-lives
were determined as described in Materials and Methods
As shown in Table 1 and Figure 2B the in vitro half-lives
of these mutants were significantly longer as compared
to wild-type luciferase Note that the activation energy
DGDagger of enzyme inactivation remained between 280 and
404 kJmol for all mutants comparable to the 362 kJmol
for wild type
In Vivo Turnover Rates
A more detailed analysis of the in vivo significance
of thermolability was performed by determination of
in vivo protein turnover rates In these experiments
mutant luciferases were subcloned into mammalian
expression vectors (pcDNA31()) and stably expressed
in SW-480 colon carcinoma cells under selection with
G418 These cells were treated at 37C with 10 mM cy-
cloheximide which is sufficient to inhibit de novo pro-
tein synthesis The amount of active luciferase was
determined in vitro at different time points and the
subsequent rate of light reduction was used to estimate
the in vivo turnover rate A typical response is shown in
Figure 2C which shows the loss of light following
cycloheximide treatment of SW-480 cells expressing
luciferase mutant F As shown in this figure the light
decreased with first-order exponential kinetics with a
calculated half-life of 135 min Independent half-life
determinations (with n = 1 sample per time point)
were repeated at least four times per mutant and these
data were averaged A summary of results from all
mutants is presented in Table 1 Note that the in vivo
half-lives are significantly longer than those observed
in vitro and that in general the relative in vivo half-lives
compare favorably to the relative in vitro half-life values
(Figure 2B) In other words wild-type luciferase has the
shortest half-life and mutant E has the longest half-life
both in vitro and in vivo Western blot analyses show
higher luciferase protein levels therefore lower detec-
tion limits in mutant luciferase compared to wild-type
cell extracts (data not shown) Although the mech-
anisms behind the differences between in vivo and
in vitro half-lives are not known a reasonable hypothesis
is that this is due to the presence of chaperone proteins
in vivo [2728] This is supported by the observation that
geldanamycin an inhibitor of the chaperone Hsp90
leads to a reduction in steady-state wild-type luciferase
levels (Figure 2D) It should be noted that at this dose
(200 nM) geldanamycin is not toxic to MDA-mb-231
cells (data not shown) Therefore the decreased lucif-
erase activity was not due simply to cell death
In Vivo Imaging
To test the hypothesis that thermostabilization of
luciferases will lead to higher steady-state light output
mice were inoculated with tumor cells expressing either
wild-type or mutant luciferases In order for this com-
parison to be valid the steady-state luciferase mRNA
levels must be similar between two cell lines that are to
be compared SW-480 and MDA-mb-231 cells were trans-
fected with mutant and wild-type luciferases and mRNA
328 Thermostable Luciferases Baggett et al
Molecular Imaging Vol 3 No 4 October 2004
levels were compared by quantitative RT-PCR In initial
experiments primers for GAPDH were used to compare
luciferase levels by taking the log2 amount of luciferase
mRNA expressed relative to the log2 GAPDH product
from the same preparation Subsequent experiments
used a primerprobe design to assess by multiplex
analysis b-actin and luciferase levels within a single
reaction Steady-state luciferase mRNA levels were com-
pared across all cell lines and there was a general
agreement between mRNA and light output (data not
shown) Of all cell lines SW-480 cells expressing mutant
E and MDA-mb-231 cells expressing mutant F had mRNA
levels that were closest to their respective control cell
lines expressing wild-type luciferases (data not shown)
Although both of these were tested in vivo subsequent
RT-PCR from tumor extracts showed that SW-480 cells
expressing wild-type luciferase consistently lost mRNA
expression when grown in the absence of selection (data
not shown)
Consequently in vivo studies were carried out using
MDA-mb-231 transfected with WT and mutant F lucif-
erases which were shown to have comparable mRNA
levels and representative differences in their steady-state
light output as seen in Figure 3A Transfected WT or
mutant F MDA-mb-231 cells were grown as subcutaneous
xenografts in flanks of SCID mice imaged during tumor
growth All mutant tumors showed greater light intensity
than wild-type tumors SimplePCI software was used
to analyze the light intensity from bioluminescent im-
ages Images were converted to 16-bit TIF images and
were analyzed by implementing a threshold of twice
background to automatically select regions of light out-
put The selected regions were measured for number
of pixels in a region total light intensity over the region
Figure 2 Characterization of mutant luciferases in vitro and in vivo (A) Renaturation of mutant luciferase protein Thermostable mutant luciferase protein was
incubated at 37C for various amounts of time Light was either assayed immediately in the denatured state or allowed to renature at room temperature prior to
being assayed (B) In vitro and in vivo half-lives of wild-type and mutant luciferases In vitro half-lives were determined by IPTG induced bacteria and subsequent
luciferase protein isolation In vivo half-lives were determined from luciferase transfected mammalian tumor cell lines (C) In vivo light output at times following
cycloheximide Typical result showing effects of cyclohexamide inhibiting protein synthesis in cells transfected with thermostable mutant luciferase (D) Effects of
geldanamycin This suggests the role of chaperone activity in the stabilization of luciferase protein Geldanamycin inhibits chaperone activity thereby decreasing light
output without being toxic to the cell
Thermostable Luciferases Baggett et al 329
Molecular Imaging Vol 3 No 4 October 2004
and an average of intensity per pixel was calculated
(Figure 3B) As shown in Figure 3D the light output
from the tumor-expressing mutant F is significantly
higher than that of the tumor-expressing wild-type
luciferase In all mice imaged the mutant tumor pro-
duced greater light intensity than that of the wild-type
tumor on all days imaged Due to slightly varying tumor
growth rates most animals had larger WT tumors than
mutant tumors over the imaging time course whereas
a few had larger mutant F tumors than WT tumors To
verify that tumor size was not the influencing factor MR
images were taken to calculate the tumor volume be-
fore the tumors were palpable This showed that tumor
volume was not the reason for increased light intensity
Figure 3 (A) qRT-PCR Using a primerprobe design luciferase levels were compared to b -actin levels Results of MDA-mb-231 cells transfected with either wild-type or
mutant F luciferase that were used to inoculate mice are shown here Samples are compared at a cycle threshold (30 units) the point at which the slope of the curve
changes At this point the ratio of luciferase to b -actin shows that the expression of luciferase in WT is slightly higher than that of the mutant yet not significantly
different (B) Light output of WT and mutant F from tumors in vivo SimplePCI software was used to analyze images A threshold was set to automatically select regions
of increased intensity The areas selected were calculated for number of pixels in the region and total intensity within the region Area in pixels is an approximation of
tumor volume since tumors were not large enough for caliper measurements until Week 3 (C) In vivo imaging sensitivity Tumor volumes were initially measured by
MR imaging before they were large enough for caliper measurements Tumor volumes here were estimated based on MRI tumor volumes versus number of detectable
pixels for the remainder of the experiment only a percentage of the wild-type tumor is detectable compared to the detectable area of the mutant tumor Due to
increased sensitivity mutant luciferase can be imaged at a much smaller size with much greater intensity Tumor volumes through 4 weeks postinoculation showed
that wild-type tumors were larger than mutant F tumors (D) Bioluminescence of mouse bearing tumors expressing WT and mutant luciferases In all cases the
mutant luciferase showed greater light output than WT In this image MR images were taken to determine tumor volumes showing that although the WT tumor is four
times larger than the mutant tumor the mutant tumor has a higher light intensity greater light per pixel and greater detectable area
330 Thermostable Luciferases Baggett et al
Molecular Imaging Vol 3 No 4 October 2004
The MR tumor volume measurements were also useful
since imaging of tumors was possible more than 2 weeks
before caliper measurements could be made
Discussion
Luciferase is a powerful reporter gene for in vitro
detection of gene expression and has more recently
been used in in vivo bioluminescence imaging Because
the wild-type protein is relatively thermolabile at in vivo
temperatures it was hypothesized that this would limit
the in vivo accumulation of light emitting activity on a
per-cell basis This work has shown that thermostabili-
zation achieved through specific mutations and can lead
to higher steady-state levels of enzyme accumulation
in vivo In all cases heat-induced loss of enzyme activity
was associated with an energy of activation near 340 kJ
mol The relationship between the measured in vivo
half-lives and the apparent activation energy of inacti-
vation is clearly complex For example wild type and
mutant F have essentially the same value of DGDagger
(3619 and 3625 kJmol respectively) yet the in vivo
half-life of mutant F is close to three times that of WT
This may reflect that the irreversible inactivation of
luciferases can occur via several pathways [29ndash32]
making interpretations of apparent DGDagger values difficult
These analyses indicated largely similar activation ener-
gies for enzyme inactivation for both mutants and wild-
type enzymes in the range of 340 kJmol The fact that
the mutant luciferases show greatly increased half-lives
despite little variation in their activation energies for
inactivation is noteworthy This suggests that the mech-
anisms by which the various mutations stabilize the
enzyme do not simply come from enthalpically favorable
interactions increasing the activation energy for in-
activation Although all mutants express longer half-
lives compared to wild-type luciferase both in vitro and
in vivo the in vivo half-lives of all enzymes were signif-
icantly longer than those observed in vitro The mech-
anisms underlying the enhanced in vivo thermostability
are not known One factor is likely the activity of
chaperone proteins which could act to inhibit the
transition from native to molten globule state [33]
Indeed it has previously been shown that chaperones
prolong the half-lives of luciferases both in cell-free and
cell-based assays [27ndash2933] Consistent with this we
have shown that geldanamycin an inhibitor of the
chaperone Hsp90 reduces steady-state luciferase activ-
ities in vivo Notably the in vivo stability can also be
enhanced pharmacologically with phenylbenzothiazole
a competitive inhibitor of luciferin binding [34] Hence
in vivo stability might be coupled to activity yet this is
not explicitly the case as the specific activities of the
thermostable luciferases are comparable to wild type
In all cases thermostabilized luciferases accumulated
to higher levels than wild type as determined by the
relationship between luciferin-induced light output (ac-
tivity) and mRNA levels Notably these data do not
address the effects of these mutations on the reac-
tion kinetics which are being investigated elsewhere
Nonetheless the simplest explanation for the observed
results is the increased accumulation of luciferase en-
zyme with increased half-lives at in vivo temperatures In
either case the empirically observed increase in light
output by the cells and tumors transfected with thermo-
stabilized luciferase increased its efficiency as an in vivo
reporter gene Fewer numbers of cells can be imaged
therefore greatly increasing sensitivity Previously the
detection limit for bioluminescence imaging was deter-
mined to be approximately 1000 cells [126] The in vivo
bioluminescent data here suggest that the minimum
detectable cell number would be closer to 100 cells
Hence the use of thermostabilized luciferases may allow
monitoring of micro-metastases and the early stages of
tumor growth
Acknowledgments
We thank Prof Thomas Baldwin for helpful discussions in the prep-
aration of this manuscript and Ms Merry Warner for help in the pro-
duction of this manuscript The study was supported by the Hughes
and NSF-supported Undergraduate Biology Research Program (RR SM
SM) and NIH CA77375 (BB RJG)
References
[1] Contag CH Jenkins D Contag PR Negrin RS (2000) Use of
reporter genes for optical measurements of neoplastic disease
in vivo Neoplasia 241ndash 52
[2] Contag CH Spilman SD Contag PR Oshiro M Eames B Dennery
P Stevenson DK Benaron DA (1997) Visualizing gene expres-
sion in living mammals using a bioluminescent reporter Photo-
chem Photobiol 66523ndash 531
[3] Contag PR Olomu IN Stevenson DK Contag CH (1998)
Bioluminescent indicators in living mammals Nat Med 4
245ndash 247
[4] Rehemtulla A Stegman LD Cardozo SJ Gupta S Hall DE Contag
CH Ross BD (2000) Rapid and quantitative assessment of cancer
treatment response using in vivo bioluminescence imaging
Neoplasia 2491ndash 495
[5] Wetterwald A van der PG Que I Sijmons B Buijs J Karperien M
Lowik CW Gautschi E Thalmann GN Cecchini MG (2002)
Optical imaging of cancer metastasis to bone marrow A mouse
model of minimal residual disease Am J Pathol 1601143ndash 1153
[6] Shibata T Giaccia AJ Brown JM (2000) Development of a
hypoxia-responsive vector for tumor-specific gene therapy Gene
Ther 7493ndash498
[7] Shibata T Giaccia AJ Brown JM (2002) Hypoxia-inducible
Thermostable Luciferases Baggett et al 331
Molecular Imaging Vol 3 No 4 October 2004
regulation of a prodrug-activating enzyme for tumor-specific
gene therapy Neoplasia 440ndash 48
[8] Shin JH Yi JK Lee YJ Kim AL Park MA Kim SH Lee H Kim
CG (2003) Development of artificial chimerical gene regulatory
elements specific for cancer gene therapy Oncol Rep 10
2063ndash2069
[9] Chinnusamy V Stevenson B Lee BH Zhu JK (2002) Screening
for gene regulation mutants by bioluminescence imaging Sci
STKE 2002L10
[10] Rehemtulla A Hall DE Stegman LD Prasad U Chen G Bhojani
MS Chenevert TL Ross BD (2002) Molecular imaging of gene
expression and efficacy following adenoviral-mediated brain
tumor gene therapy Mol Imaging 143ndash55
[11] Chaudhuri TR Rogers BE Buchsbaum DJ Mountz JM Zinn KR
(2001) A noninvasive reporter system to image adenoviral-
mediated gene transfer to ovarian cancer xenografts Gynecol
Oncol 83432ndash 438
[12] Brun S Faucon-Biguet N Mallet J (2003) Optimization of
transgene expression at the posttranscriptional level in neural
cells Implications for gene therapy Mol Ther 7782ndash789
[13] Siemens DR Crist S Austin JC Tartaglia J Ratliff TL (2003)
Comparison of viral vectors Gene transfer efficiency and tissue
specificity in a bladder cancer model J Urol 170979ndash 984
[14] Nunn C Feuerbach D Lin X Peter R Hoyer D (2002) Pharma-
cological characterisation of the goldfish somatostatin sst5 re-
ceptor Eur J Pharmacol 436173ndash 186
[15] Kimm-Brinson KL Moeller PD Barbier M Glasgow H Jr
Burkholder JM Ramsdell JS (2001) Identification of a P2X7
receptor in GH(4)C(1) rat pituitary cells A potential target for a
bioactive substance produced by Pfiesteria piscicida Environ
Health Perspect 109457ndash 462
[16] Catania JM Parrish AR Kirkpatrick DS Chitkara M Bowden GT
Henderson CJ Wolf CR Clark AJ Brendel K Fisher RL Gandolfi
AJ (2003) Precision-cut tissue slices from transgenic mice as an
in vitro toxicology system Toxicol In Vitro 17201ndash 205
[17] Billard P DuBow MS (1998) Bioluminescence-based assays for
detection and characterization of bacteria and chemicals in
clinical laboratories Clin Biochem 311ndash 14
[18] Bitton G Koopman B (1992) Bacterial and enzymatic bioassays
for toxicity testing in the environment Rev Environ Contam
Toxicol 1251 ndash22
[19] Greer LF Szalay AA III (2002) Imaging of light emission from the
expression of luciferases in living cells and organisms A review
Luminescence 1743ndash 74
[20] Hastings JW (1996) Chemistries and colors of bioluminescent
reactions A review Gene 1735 ndash11
[21] Viviani VR (2002) The origin diversity and structure func-
tion relationships of insect luciferases Cell Mol Life Sci 59
1833ndash 1850
[22] Lall AB Ventura DS Bechara EJ de Souza JM Colepicolo-Neto P
Viviani VR (2000) Spectral correspondence between visual
spectral sensitivity and bioluminescence emission spectra in the
click beetle Pyrophorus punctatissimus (Coleoptera Elateridae)
J Insect Physiol 461137ndash 1141
[23] Viviani VR Silva AC Perez GL Santelli RV Bechara EJ Reinach FC
(1999) Cloning and molecular characterization of the cDNA for
the Brazilian larval click-beetle Pyrearinus termitilluminans
luciferase Photochem Photobiol 70254ndash 260
[24] Schmitter RE Njus D Sulzman FM Gooch VD Hastings JW
(1976) Dinoflagellate bioluminescence A comparative study of
in vitro components J Cell Physiol 87123ndash 134
[25] Day RN Kawecki M Berry D (1998) Dual-function reporter
protein for analysis of gene expression in living cells BioTech-
niques 25848ndash4 856
[26] Leclerc GM Boockfor FR Faught WJ Frawley LS (2000) De-
velopment of a destabilized firefly luciferase enzyme for mea-
surement of gene expression BioTechniques 29590ndash596 598
[27] Souren JE Wiegant FA van Hof P van Aken JM van Wijk R
(1999) The effect of temperature and protein synthesis on the
renaturation of firefly luciferase in intact H9c2 cells Cell Mol Life
Sci 551473ndash1481
[28] Souren JE Wiegant FA van Wijk R (1999) The role of hsp70
in protection and repair of luciferase activity in vivo experi-
mental data and mathematical modelling Cell Mol Life Sci 55
799ndash 811
[29] Herbst R Schafer U Seckler R (1997) Equilibrium intermediates
in the reversible unfolding of firefly (Photinus pyralis) luciferase
J Biol Chem 2727099ndash7105
[30] Herbst R Gast K Seckler R (1998) Folding of firefly (Photinus
pyralis) luciferase Aggregation and reactivation of unfolding
intermediates Biochemistry 376586ndash 6597
[31] Baldwin TO Chen LH Chlumsky LJ Devine JH Ziegler MM
(1989) Site-directed mutagenesis of bacterial luciferase Analysis
of the lsquolsquoessentialrsquorsquo thiol J Biolumin Chemilumin 440ndash48
[32] Chen LH Baldwin TO (1989) Random and site-directed muta-
genesis of bacterial luciferase Investigation of the aldehyde
binding site Biochemistry 282684ndash 2689
[33] Flynn GC Beckers CJ Baase WA Dahlquist FW (1993)
Individual subunits of bacterial luciferase are molten globules
and interact with molecular chaperones Proc Natl Acad Sci
USA 9010826ndash 10830
[34] Thompson JF Hayes LS Lloyd DB (1991) Modulation of firefly
luciferase stability and impact on studies of gene regulation
Gene 103171ndash 177
332 Thermostable Luciferases Baggett et al
Molecular Imaging Vol 3 No 4 October 2004