Thermomechanical evolution of the South Alpine rifted margin (North Italy): constraints on the...
13
EPSL ELSEVIER Earth and Planetary Science Letters 146 (1997) 181- 193 Thermomechanical evolution of the South Alpine rifted margin ( North Italy) : constraints on the strength of passive continental margins G. Bertotti aq *, M. ter Voorde a, S. Cloetingh a, V. Picotti b ’ Department of Sedimentary Geology, Vrije Unicersiteit. de Boelelaan 1085, 1081 HV Amsterdam, The Netherlands b Dipartimento di Science Geologiche. cia Zumboni 67, l-40127 Bologna. Italy Received 31 July 1996; accepted 28 October 1996 Abstract We have reconstructed the kinematic, thermal and rheological evolution of the Triassic-Cretaceous South Alpine passive continental margin (Northern Italy) and estimated lateral strength variations associated with rifting. Rifting initially caused the formation of a roughly symmetrical, ca. 100 km wide graben located 150-200 km away from the future break-up site. 30 Myr after the onset of rifting, the rift axis shifted laterally and eventually led to oceanic crust formation. The thermal evolution of the margin was first controlled by the waning of a thermal anomaly, which was emplaced shortly before rifting and was cooling during the first extensional stages. Numerical modelling of rifting and drifting, constrained by field data, is used to trace thermal and rheological changes affecting the rifted margin. The effects of the thermal anomaly are restricted to the first lo-20 Myr of rifting. Subsequently, isotherms are slightly affected by lithospheric thinning and show very little distortion after break-up. Rheological modelling demonstrates that the South Alpine lithosphere preserved substantial strength even shortly before break-up and became stronger thereafter. The modelling also shows that, at break-up and 100 Myr later, thinned domains of the margin are stronger than the less thinned ones. Kqvwords: Piedmont Alps; passive margins; continental margin; extension tectonics: rift zones 1. Introduction The mechanical configuration of the lithosphere resulting from rifting and passive continental margin formation processes is poorly understood. Geophysi- cal studies based on gravity anomalies on passive margins, along, for example, the North Atlantic, yield low effective elastic thickness values (Te) of the order of 5 km (e.g., [1,2]). The low Te values * Corresponding author. Fax: +31 20 6462457. E-mail: [email protected] obtained have led to the concept of a “frozen effec- tive elastic thickness (Te)“, according to which the lithosphere is weak at the end of rifting and remains so for tens of millions of years thereafter. However, high Te values of 20-28 km on other margins, such as that of New Zealand [3], suggest that low values are not ubiquitous. The concept of a lithosphere remaining weak during drifting also contrasts with the intuitive no- tion that, as thermal perturbations relax, a lithosphere with thin continental crust should be stronger than one with thick crust [4-61. To support this notion, 0012-821X/97/$12.00 Copyright 0 1997 Elsevier Science B.V. All rights reserved. PI1 SOOl2-821X(96)00214-2
Transcript of Thermomechanical evolution of the South Alpine rifted margin (North Italy): constraints on the...
EPSL ELSEVIER Earth and Planetary Science Letters 146 (1997) 18 1- 193
Thermomechanical evolution of the South Alpine rifted margin ( North Italy) : constraints on the strength of passive continental
margins
G. Bertotti aq * , M. ter Voorde a, S. Cloetingh a, V. Picotti b
’ Department of Sedimentary Geology, Vrije Unicersiteit. de Boelelaan 1085, 1081 HV Amsterdam, The Netherlands b Dipartimento di Science Geologiche. cia Zumboni 67, l-40127 Bologna. Italy
Received 31 July 1996; accepted 28 October 1996
Abstract
We have reconstructed the kinematic, thermal and rheological evolution of the Triassic-Cretaceous South Alpine passive continental margin (Northern Italy) and estimated lateral strength variations associated with rifting. Rifting initially caused the formation of a roughly symmetrical, ca. 100 km wide graben located 150-200 km away from the future break-up site. 30
Myr after the onset of rifting, the rift axis shifted laterally and eventually led to oceanic crust formation. The thermal evolution of the margin was first controlled by the waning of a thermal anomaly, which was emplaced shortly before rifting
and was cooling during the first extensional stages. Numerical modelling of rifting and drifting, constrained by field data, is
used to trace thermal and rheological changes affecting the rifted margin. The effects of the thermal anomaly are restricted to the first lo-20 Myr of rifting. Subsequently, isotherms are slightly affected by lithospheric thinning and show very little distortion after break-up. Rheological modelling demonstrates that the South Alpine lithosphere preserved substantial strength even shortly before break-up and became stronger thereafter. The modelling also shows that, at break-up and 100 Myr later, thinned domains of the margin are stronger than the less thinned ones.
Kqvwords: Piedmont Alps; passive margins; continental margin; extension tectonics: rift zones
1. Introduction
The mechanical configuration of the lithosphere
resulting from rifting and passive continental margin formation processes is poorly understood. Geophysi- cal studies based on gravity anomalies on passive
margins, along, for example, the North Atlantic, yield low effective elastic thickness values (Te) of the order of 5 km (e.g., [1,2]). The low Te values
* Corresponding author. Fax: +31 20 6462457. E-mail: [email protected]
obtained have led to the concept of a “frozen effec- tive elastic thickness (Te)“, according to which the
lithosphere is weak at the end of rifting and remains
so for tens of millions of years thereafter. However, high Te values of 20-28 km on other margins, such
as that of New Zealand [3], suggest that low values are not ubiquitous.
The concept of a lithosphere remaining weak during drifting also contrasts with the intuitive no- tion that, as thermal perturbations relax, a lithosphere
with thin continental crust should be stronger than one with thick crust [4-61. To support this notion,
0012-821X/97/$12.00 Copyright 0 1997 Elsevier Science B.V. All rights reserved. PI1 SOOl2-821X(96)00214-2
182 G. Bertotti et al./Earth and Planetary Science Letters 146 (1997) 181-193
only simple 1-D thermorheological modelling has been presented so far, neglecting processes such as
deformation kinematics and sediment blanketing ef-
fects. Furthermore, no “real” case has been used to test model predictions.
To constrain the thermal and rheological evolu-
tion of lithospheric strength during and after rifting,
we combine field data with numerical modelling. To
this purpose, we use a transect of the Late Triassic to Middle Jurassic Adriatic passive continental margin
which is presently exposed in the Southern Alps of
North Italy (Fig. 1). The South Alpine margin is
particularly well suited since intermediate to deep Mesozoic crustal levels are directly accessible to
investigation and its kinematics and thermal evolu-
tion during and after rifting are well constrained.
Several parameters of this margin, such as duration
of rifting and drifting and amount of extension are
representative for other rifted margin systems. A further useful feature of the South Alpine margin is
that, 100 Myr after break-up, it was loaded by
Alpine thrusting. The analysis of the associated flex- ure allows an important, independent test of the
strength results obtained.
We firstly reconstruct the crustal kinematic evolu- tion of the South Alpine transect. We apply numeri-
cal forward modelling techniques to derive the ther-
mal evolution of the margin from the onset of exten-
sion to break-up and drifting and study the rheologi-
cal configurations at the end of rifting and during
drifting. We then test the modelling results with
field-derived data. The approach adopted here is substantially different from other modelling studies
of passive margin evolution (e.g., [7] and references therein) in that we explicitly apply the model to a
“real” case with its rifting geometry and evolution-
ary history.
2. The Southern Alps from rifting to contraction
2.1. Kinematic eoolution
A large body of sedimentological, stratigraphic
and structural data collected over several decades
allows for a well constrained reconstruction of the
rifting and drifting evolution of the South Alpine
margin. Both timing of fault activity and the amount of displacement accommodated by a single fault are well known from detailed field studies ([9] and refer-
ences therein). This has allowed a palinspastic restoration of the upper crustal profile through the
South Alpine passive continental margin back to its
pre-rift situation, thereby constraining the amount
and timing of displacement accommodated by each
major fault [9]. The tectonic units presently exposed in the South-
em Alps underwent Late Triassic to Middle Jurassic
. . I L :i syn-erogenic I syn- and post-rift
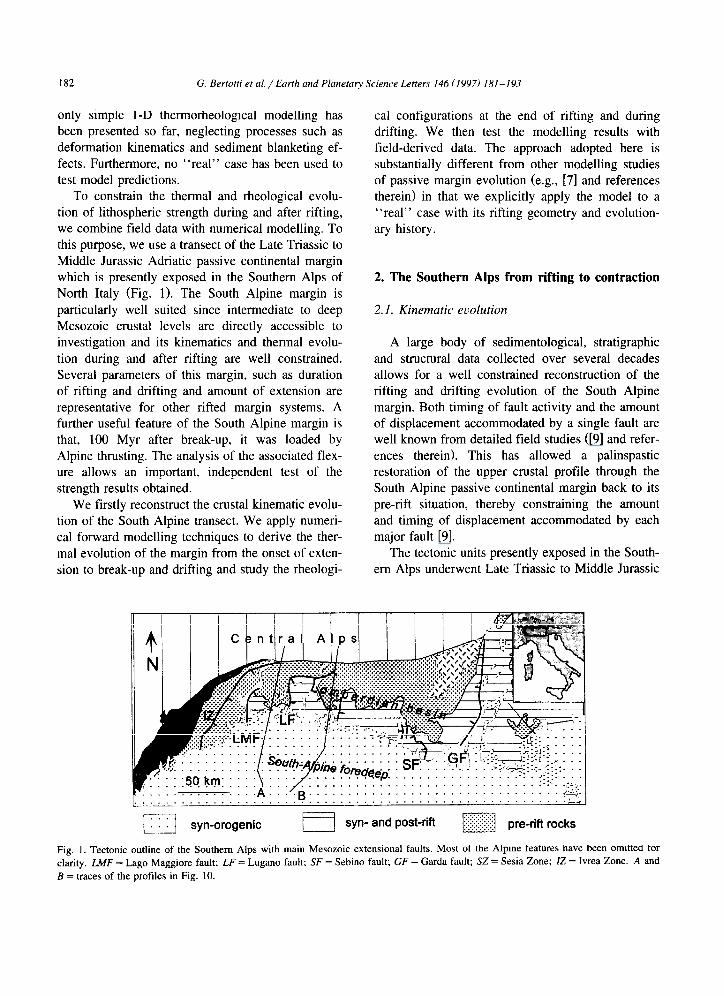
Fig. 1. Tectonic outline of the Southern Alps with main Mesozoic extensional faults. Most of the Alpine features have been omitted for
clarity. LMF = Lago Maggiore fault; LF = Lugano fault; SF = Sebino fault; GF = Garda fault; SZ = Sesia Zone; IZ = Ivrea Zone. A and
B = traces of the profiles in Fig. 10.
G. Bertotti et al. /Earth and Planetap Science Letters 146 (19971 181-193 183
extension in connection with relative movements between Europe and Adria, culminating in the late
Middle Jurassic formation of oceanic crust (Fig. 2) [8,9]. Rifting, leading to passive margin formation,
started in the Norian and was first localized some 150-200 km east of the site of future break-up (Fig.
2). Extension was mainly controlled by a set of four,
roughly N-S trending normal faults symmetrically delineating a strongly subsiding region, the Lombar-
dian basin. The two western faults, the Lago Mag-
giore and Lugano faults, dipped to the east while the
two eastern ones, the Sebino and Garda faults, dipped
to the west. Field data demonstrate that faults were listric [3,10] and can, in some cases, be followed
down to a paleo-depth of 12- 15 km [ 111. An overall
pure shear geometry for the extension in the Lom-
bardian basin (lfina,/linit,a, = 1.5) is compatible with the observed geometry and amount of displacement
of normal faults and with the subsidence pattern recorded by the sediments [ 1 I]. The Lombardian
basin was surrounded by two less extended regions: the Trento Plateau in the east and the Biellese to the
west. Stretching in the Lombardian basin gradually
ceased during the Toarcian and extension shifted westward affecting previously less stretched domains
and eventually leading to the opening of the Ligu-
ran-Piemont ocean. The shift in the site of extension has been associated with the progressive hardening
of the lithospheric column undergoing extension [9]. Low strain rates of the order of lo- I6 set- ’ and abnormally high initial Moho temperatures, such as
those reconstructed for South Alpine rifting ([9] and
[12], respectively) favour this behaviour (e.g., [7]). Extension during this second stage, which led to the
W canavese biellese lombar
Middle-Late Jurassic formation of oceanic crust,
was probably controlled by a major, possibly west- dipping lithospheric fault (e.g., [ 13,141). For most of
the subsequent drifting stage the margin was starved
and received a very small amount of sediments. Drifting continued until the Late Cretaceous, when it
was interrupted by the onset of convergence between
the Adria and Europe [ 151 and S-vergent thrusting of
the South Alpine margin ca. 100 Myr after break-up.
The South Alpine fold-and-thrust belt loaded the
E-W extended margin, thereby allowing for the deposition of a thick sedimentary wedge (South
Alpine foredeep).
2.2. The thermal evolution
Recently acquired petrographic and isotopic data have provided crucial constraints for the thermal
evolution of the South Alpine crust before, during and after rifting [12,16,17].
The thermal history of the South Alpine crust is mainly controlled by the emplacement of a thermal
anomaly in the Early-Middle Triassic and its subse-
quent waning [12,18]. The thermal anomaly can be quantitatively explained by the presence at lower
crustal depths of a large magmatic intrusion [ 12,191.
Waning of the thermal anomaly began at ca. 220 Ma, overlapping with the initial stages of rifting [ 121. The
subsequent crustal cooling caused the closure of
radiometric and fission track clocks and explains the Late Triassic to Jurassic absolute ages obtained from
several localities of the South Alpine basement (e.g.,
[ 12,16,19]). The upper 15 km of the Mesozoic South Alpine crust were below the zircon fission track
dian b a s i n trento E
0
Okm
50 km
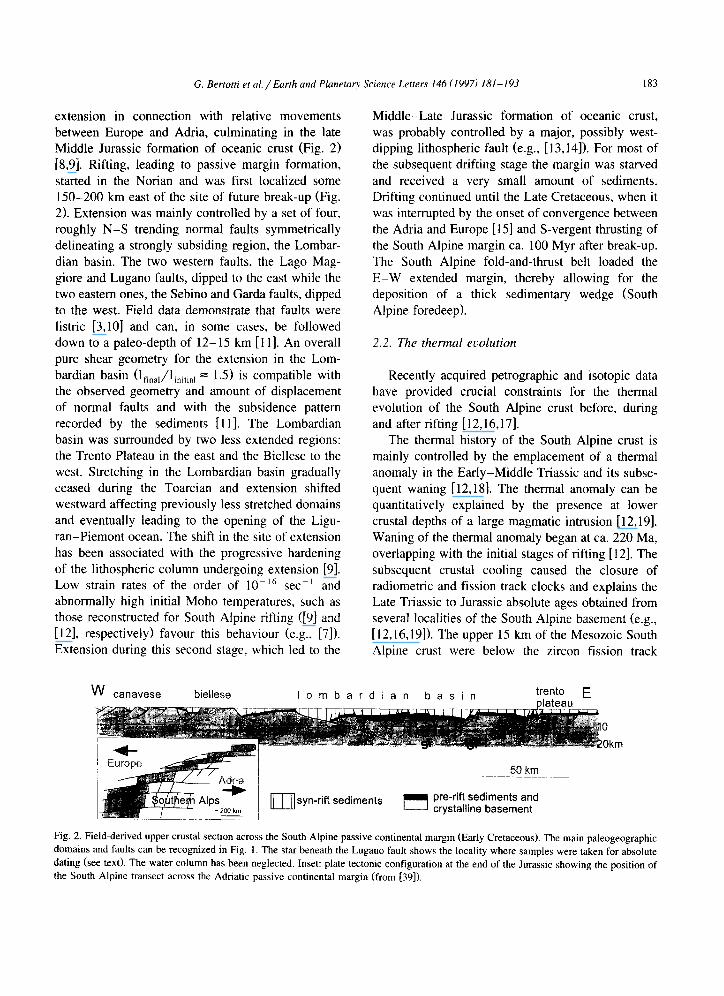
Fig. 2. Field-derived upper crustal section across the South Alpine passive continental margin (Early Cretaceous). The main paleogeographic
domains and faults can be recognized in Fig. 1. The star beneath the Lugano fault shows the locality where samples were taken for absolute
dating (see text). The water column has been neglected. Inset: plate tectonic configuration at the end of the Jurassic showing the position of
the South Alpine transect across the Adriatic passive continental margin (from (391).
184 G. Bertotti et al. /Earth and Planetary Science Letters 146 (1997) 181 -I 93
annealing temperature during the Early Cretaceous; that is, before Alpine contraction.
3. A quantitative model for the thermokinematic and rheological evolution
3.1. The thermokinematic numerical model
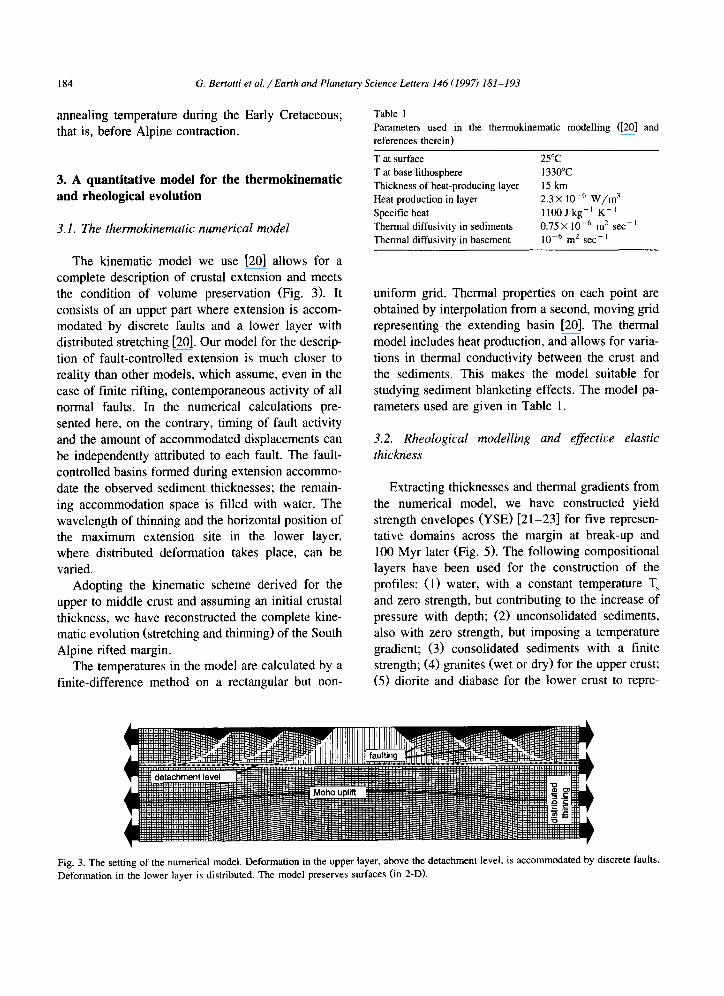
The kinematic model we use [20] allows for a complete description of crustal extension and meets the condition of volume preservation (Fig. 3). It consists of an upper part where extension is accom- modated by discrete faults and a lower layer with distributed stretching [20]. Our model for the descrip tion of fault-controlled extension is much closer to reality than other models, which assume, even in the case of finite rifting, contemporaneous activity of all normal faults. In the numerical calculations pre- sented here, on the contrary, timing of fault activity and the amount of accommodated displacements can be independently attributed to each fault. The fault- controlled basins formed during extension accommo- date the observed sediment thicknesses; the remain- ing accommodation space is filled with water. The wavelength of thinning and the horizontal position of the maximum extension site in the lower layer, where distributed deformation takes place, can be varied.
Adopting the kinematic scheme derived for the upper to middle crust and assuming an initial crustal thickness, we have reconstructed the complete kine- matic evolution (stretching and thinning) of the South Alpine rifted margin.
The temperatures in the model are calculated by a finite-difference method on a rectangular but non-
Table 1 Parameters used in the thermokinematic modelling ([20] and
references therein)
T at surface 25°C
T at base lithosphere 1330°C
Thickness of heat-producing layer 15km
Heat production in layer 2.3 X 10-s W/m’
Specific heat llOOJkg-’ K-’
Thermal diffusivity in sediments 0.75 X lo-” mz set- ’ Thermal diffusivity in basement 10e6 m’ set- ’
uniform grid. Thermal properties on each point are obtained by interpolation from a second, moving grid representing the extending basin [20]. The thermal model includes heat production, and allows for varia- tions in thermal conductivity between the crust and the sediments. This makes the model suitable for studying sediment blanketing effects. The model pa- rameters used are given in Table 1.
3.2. Rheological modelling and effective elastic thickness
Extracting thicknesses and thermal gradients from the numerical model, we have constructed yield strength envelopes (YSE) [21-231 for five represen- tative domains across the margin at break-up and 100 Myr later (Fig. 5). The following compositional layers have been used for the construction of the profiles: (1) water, with a constant temperature T, and zero strength, but contributing to the increase of pressure with depth; (2) unconsolidated sediments, also with zero strength, but imposing a temperature gradient; (3) consolidated sediments with a finite strength; (4) granites (wet or dry) for the upper crust; (5) diorite and diabase for the lower crust to repre-
Fig. 3. The setting of the numerical model. Deformation in the upper layer, above the detachment level, is accommodated by discrete faults.
Deformation in the lower layer is distributed. The model preserves surfaces (in 2-D).
G. Bertotti et al. / Earth and Planetary Science Letters 146 (1997) 181-193 185
&G_-___-______-’ <-------7 .-_____ 40-~----- -
-“-.---__--_~~-__-- / ’ \ /
/ i \
60 -&- --_________-----’ ‘-
‘---_--__68
-s---_______
a) at the onset of extension
Okm
20
40
Canavese Lombardian basin Trento plateau
___-_----
60
b) at break-up
Okm
60
c) 100 Myr after break-up 0 1OOkm I I
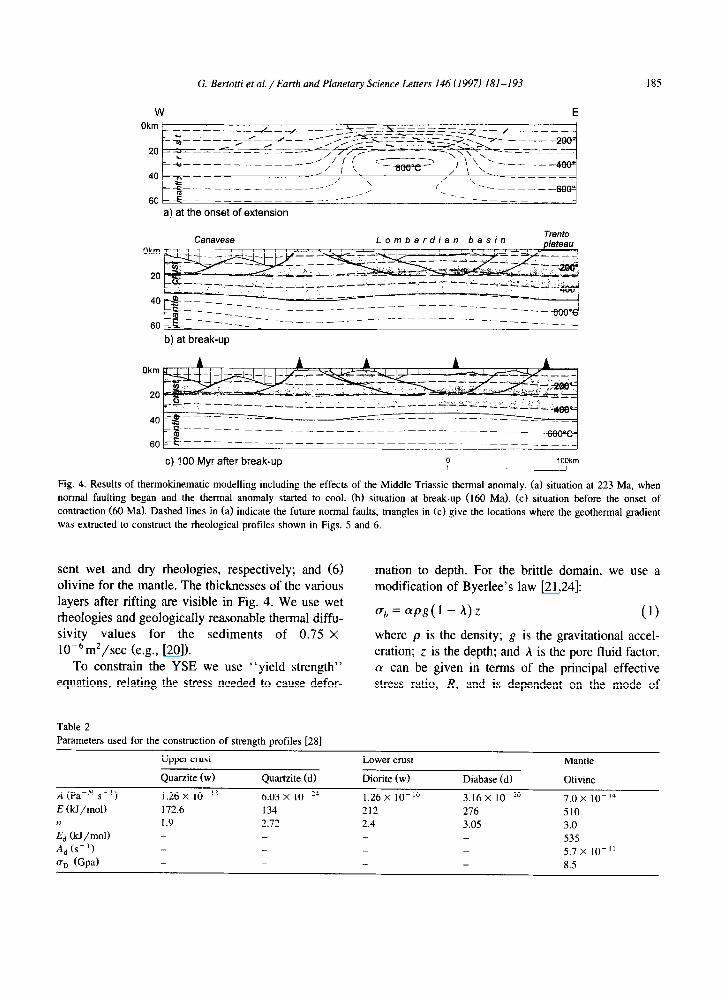
Fig. 4. Results of thermokinematic modelling including the effects of the Middle Triassic thermal anomaly. (a) situation at 223 Ma, when
normal faulting began and the thermal anomaly started to cool. (b) situation at break-up (160 Ma). (c] situation before the onset of
contraction (60 Ma). Dashed lines in (a) indicate the future normal faults, triangles in (c) give the locations where the geothermal gradient
was extracted to construct the rheological profiles shown in Figs. 5 and 6.
sent wet and dry rheologies, respectively; and (6) olivine for the mantle. The thicknesses of the various
layers after rifting are visible in Fig. 4. We use wet
rheologies and geologically reasonable thermal diffu- sivity values for the sediments of 0.75 X
10m6 m’/sec (e.g., [20]).
To constrain the YSE we use “yield strength”
equations, relating the stress needed to cause defor-
mation to depth. For the brittle domain, we use a
modification of Byerlee’s law [21,24]:
uh=cypg(l -h)z (9
where p is the density; g is the gravitational accel-
eration; z is the depth; and A is the pore fluid factor.
(Y can be given in terms of the principal effective
stress ratio, R, and is dependent on the mode of
Table 2
Parameters used for the construction of strength profiles [28]
Upper crust
Quarzite (w) Quartzite (d)
Lower crust
Diorite (w) Diabase (d)
Mantle
Olivine
A (PaaN s-‘) 1.26 x IO- ” 6.03 x lo-?’ 1.26 x IO- I4 3.16 x lo-?’ 7.0 x lo- ‘j E &J/mol)
n E. &J/mol)
A, (s-l)
(To (Gpa)
172.6 134 212 276 510
1.9 2.72 2.4 3.05 3.0 _ - 535
_ 5.7 x lo- ” _ _ 8.5
186 G. Bertotti et al. /Earth and Planetary Science Letters 146 f f997) 181-193
faulting. R is related to the coefficient of friction /1
as R=((p’+ 1) ‘I* + pj2. For thrust faulting, (Y = (R - 1); A is = 0 for zero pore pressure; and A = 0.4
for hydrostatic pore pressure. Following Ranalli [25], commonly the value for p is assumed to be 0.75.
For the “ductile” domain we use “Power law
creep” [26]:
,d=A-i/“k-i/” exp( E/nRT) (2)
or Dom law creep at high stresses where the Power
law creep breaks down [27,28]:
(3)
E is strain rate; A, n and E are empirically derived material constants; R is the gas constant (= 8.3 14
J/mol . K); and T is the absolute temperature. The
values of the parameters are given in Table 2. We are concerned with gross lateral variations
rather than precise absolute values (e.g., [291). In order to avoid problems related to phenomena such
as crustal-scale strain localization and changes in
deformation mechanisms, rheological modelling is
performed only for tectonically “quiet” times such as the drifting stage. We adopt therefore a low strain
rate of 1 X lo-” set-‘. Integrated strength values equivalent to the force
needed to lithospheric rupture [30] have been derived
from the rheological profiles, as shown in Fig. 5.
The YSE can also be translated in Te values [23]. We use the formulation for detached layers, since the
300km
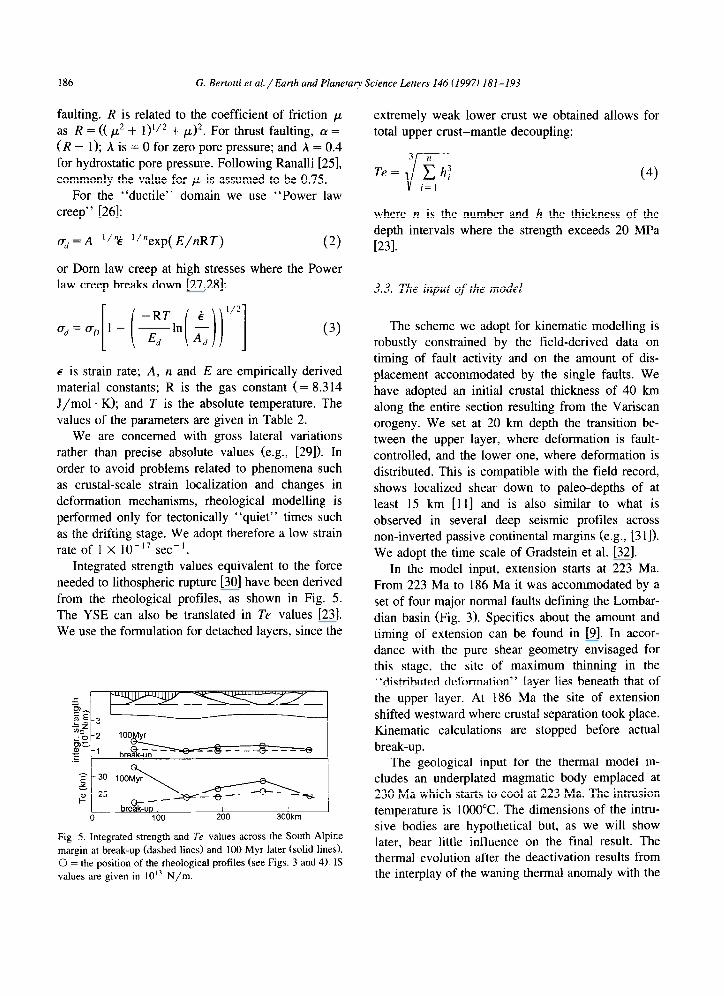
Fig. 5. Integrated strength and Te values across the South Alpine
margin at break-up (dashed lines) and 100 Myr later (solid lines).
0 = the position of the rheological profiles (see Figs. 3 and 4). IS
values are given in 10” N/m.
extremely weak lower crust we obtained allows for
total upper crust-mantle decoupling:
where n is the number and h the thickness of the
depth intervals where the strength exceeds 20 MPa
[231.
3.3. The input of the model
The scheme we adopt for kinematic modelling is
robustly constrained by the field-derived data on timing of fault activity and on the amount of dis-
placement accommodated by the single faults. We
have adopted an initial crustal thickness of 40 km
along the entire section resulting from the Variscan
orogeny. We set at 20 km depth the transition be- tween the upper layer, where deformation is fault-
controlled, and the lower one, where deformation is distributed. This is compatible with the field record,
shows localized shear down to paleo-depths of at
least 15 km [l 11 and is also similar to what is
observed in several deep seismic profiles across non-inverted passive continental margins (e.g., [311).
We adopt the time scale of Gradstein et al. [32].
In the model input, extension starts at 223 Ma.
From 223 Ma to 186 Ma it was accommodated by a set of four major normal faults defining the Lombar-
dian basin (Fig. 3). Specifics about the amount and timing of extension can be found in [9]. In accor-
dance with the pure shear geometry envisaged for this stage, the site of maximum thinning in the “distributed deformation” layer lies beneath that of
the upper layer. At 186 Ma the site of extension
shifted westward where crustal separation took place. Kinematic calculations are stopped before actual
break-up. The geological input for the thermal model in-
cludes an underplated magmatic body emplaced at 230 Ma which starts to cool at 223 Ma. The intrusion temperature is 1000°C. The dimensions of the intru- sive bodies are hypothetical but, as we will show later, bear little influence on the final result. The thermal evolution after the deactivation results from the interplay of the waning thermal anomaly with the
G. Beriotti et al. / Earth and Planetary Science Letters 146 (1997) 181-193 187
stretching-related mass movements and the blanket-
ing effects of sediments.
4. Thermal evolution, rheology and strength of
the South Alpine margin
4.1. Thermal euolution
The crustal and thermal configurations at the on- set of rifting and at break-up are shown in Fig. 4a,b.
Fig. 4c shows the thermal field 100 Myr later, shortly before the onset of convergence between the
African and European plates. The modelling results show that the thermal evolution of the South Alpine
lithosphere during the initial rifting stages is mainly controlled by the waning of the Middle Triassic
thermal anomaly. Extensional movements of fault
blocks do not substantially influence this pattern [20]. The model predicts that most of the thermal
perturbation had disappeared by the end of rifting: 100 Myr after break-up, the isotherms were practi- cally flat. Isotherms under the sedimentary basins are
slightly “pulled up” because of the blanketing effect of the basin-fill sediments (e.g., [20]).
The results of the model can be tested by compar-
ing the thermal distribution in depth with absolute
age data. The model predicts, for rocks lying at a paleo-depth of 14- 15 km along the Lake Como basement (star in Figs. 2 and 4), temperatures below
250°C at the end of rifting. This result is compatible with new Ar-Ar measurements on micas [ 121 and
preliminary zircon fission track data, which have produced Late Triassic to Middle Jurassic ages.
w
Canavese
Temperatures below 300°C have also been estab-
lished for the lower crustal rocks of the Ivrea zone which were part of the most distal section of the
preserved margin [33].
4.2. Strength euolution
To model the strength evolution of the South
Alpine rifted margin, we assume wet rheologies,
geologically reasonable thermal diffusivity values for the sediments of 0.75 . 10-6m2/s, and a strain rate of lo- ” s- ’ . Other parameters are given in Table 1.
A sensitivity analysis aimed at studying the influence of these parameters on the strength values will be
presented in a following section. Yield strength en-
velopes (YSE), integrated strength and Te values
have been obtained from rheological models for five representative localities along the passive margin for
the moment of break-up as well as 100 Myr later. Integrated strength (IS) curves at break-up (Fig.
5) show relatively constant values across the margin.
The IS values 100 Myr after break-up have increased while there is further thermal relaxation. However,
the cooling, and therefore the increase in strength, is slightly suppressed by the insulating effect of the sediments. Due to the combined effect of further
thermal relaxation leading to cooling in the lower
crust and mantle, and extra heating, due to heat production and sediment blanketing in the uppermost
crust, the lower crust and mantle gain strength in time after rifting, whereas the upper crust looses
strength.
Te values for the break-up stage are between 22 and 26 km, with the highest values in the stretched
E
Lombardian basin trento plateau
0 103Ull I
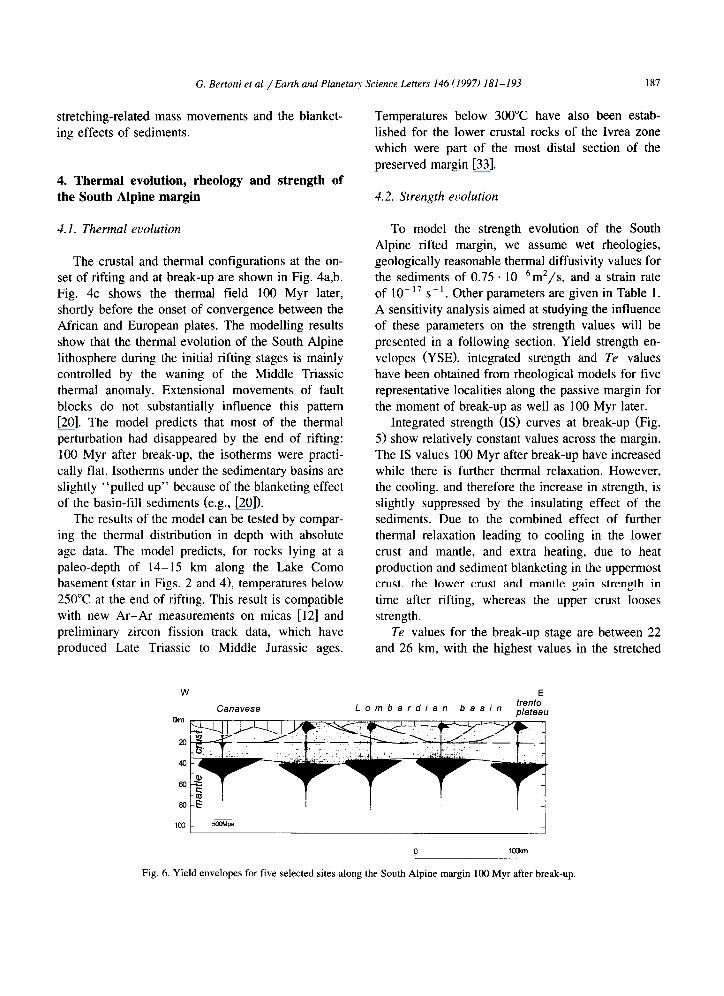
Fig. 6. Yield envelopes for five selected sites along the South Alpine margin 100 Myr after break-up.
188 G. Bertoffi et aL/Earrh and Planetary Science Letters 146 (1997) 181-193
Lombardian basin. Values in the most distal part of the margin are relatively low because of the strong thermal anomaly associated with break-up. Te values 100 Myr later have increased in the stretched seg- ments. The largest increase is produced for the distal part of the margin, which at this point is the strongest segment of the system. A clear correlation can be observed between the higher Te values and thinned parts of the margin.
Yield strength envelopes across the margin (Fig. 6) 100 Myr after break-up demonstrate that most of the predicted lithospheric strength is carried by the mantle. The upper crust provides a limited contribu- tion, whereas the lower crust is systematically very weak.
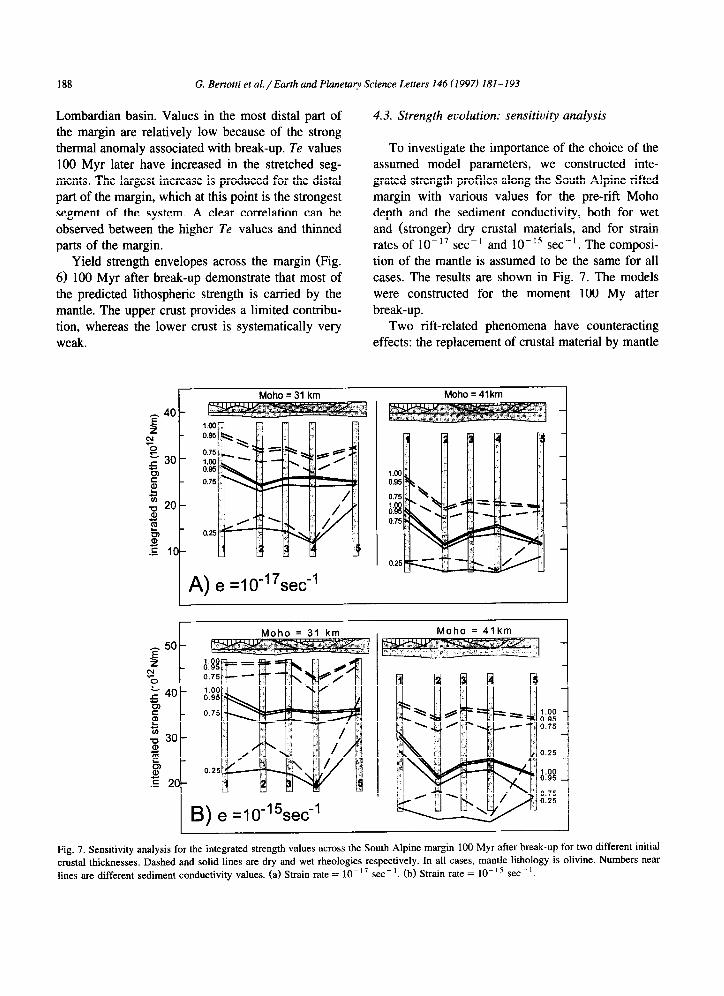
4.3. Strength evolution: sensitivity analysis
To investigate the importance of the choice of the assumed model parameters, we constructed inte- grated strength profiles along the South Alpine rifted margin with various values for the pre-rift Moho depth and the sediment conductivity, both for wet and (stronger) dry crustal materials, and for strain rates of lo-l7 set-I and lo-l5 set- ’ . The composi- tion of the mantle is assumed to be the same for all cases. The results are shown in Fig. 7. The models were constructed for the moment 100 My after break-up.
Two rift-related phenomena have counteracting effects: the replacement of crustal material by mantle
Moho = 31 km Moho = 41km
A) e =I 0-I 7secm1
Fig. 7. Sensitivity analysis for the integrated strength values across the South Alpine margin 100 Myr after break-up for two different initial crustal thicknesses. Dashed and solid lines are dry and wet rheologies respectively. In all cases, mantle lithology is olivine. Numbers near
lines are different sediment conductivity values. (a) Strain rate = IO-” set- ‘. (b) Strain rate = 10-l ’ set- ‘.
G. Bertotti et al. /Earth and Planetary Science Letters 146 (1997) 181-l 93 189
material causes lithosphere strengthening, whereas the replacement of the upper part of the crust by water or sediments causes weakening. This weaken-
ing might (temporarily) be increased by lithospheric heating at high stretching rates, or on a longer time-
scale by sediment blanketing. In Fig. 7a the follow- ing features can be observed:
M&o depth: Typically, an increase in Moho depth
is associated with a decrease in strength; this is simply related to the larger amount of crustal mate-
rial. Larger lateral variations along each profile are
observed in the deep Moho case than in the shallow
one. This is explained by the fact that, since the condition of area balancing is met, a deeper pre-rift
Moho results in a larger increase in mantle material during extension, and thus in an extra increase in
strength due to rifting.
Srrain rate: Higher strain rates are associated with higher strengths. The pattern of lateral variations
along each profile remains the same.
W
Sediment conductivity: A decrease in sediment
conductivity (K~,~) causes a general decrease in strength: due to the stronger insulating effect of the
sediments, the upper crust gets warmer and weaker. At very low diffusivity values, this weakening effect
can even overprint the strengthening caused by the
upwelling mantle material. The weakening is
strongest for sites 1 and 4, where the sediment pile is thickest. This can lead to an inversion of the general
pattern with sites representative of extended litho-
sphere (such as 4) being weaker than the surround-
ings.
Wet us. dry rheologies: Not surprisingly, dry rhe- ologies produce a higher lithospheric strength than
wet ones. The difference decreases with decreasing sediment conductivity and becomes very small for
extremely (unrealistically) low conductivity values
Of K,,d of 0.25 . 10m6 m/s2. The insulating effect of
the sediments is for these values so strong that the crust preserves only limited strength. Despite the
E O~m__~~~~~~_~~__~~~~~~~~_~__~____~__~~_~~~~_
~_~____---/-_~-_-----z ,-J--,__- 7-_1--____2*
20 - 2-_ _-G_L5d n z=.Yz_ --c-z--_~~--- zTz%-zd=--__= _ Z=e
L4____------___----__---------------___4
40-~---- Lo____--------------_----------------__666Qc
60-A 3
a) a the onset of extension
Okm
20
Canavese Lombardian basin Trento plateau
60
b) at break-up
Okm
60
c) IOOMyr after break-up IOOkm I
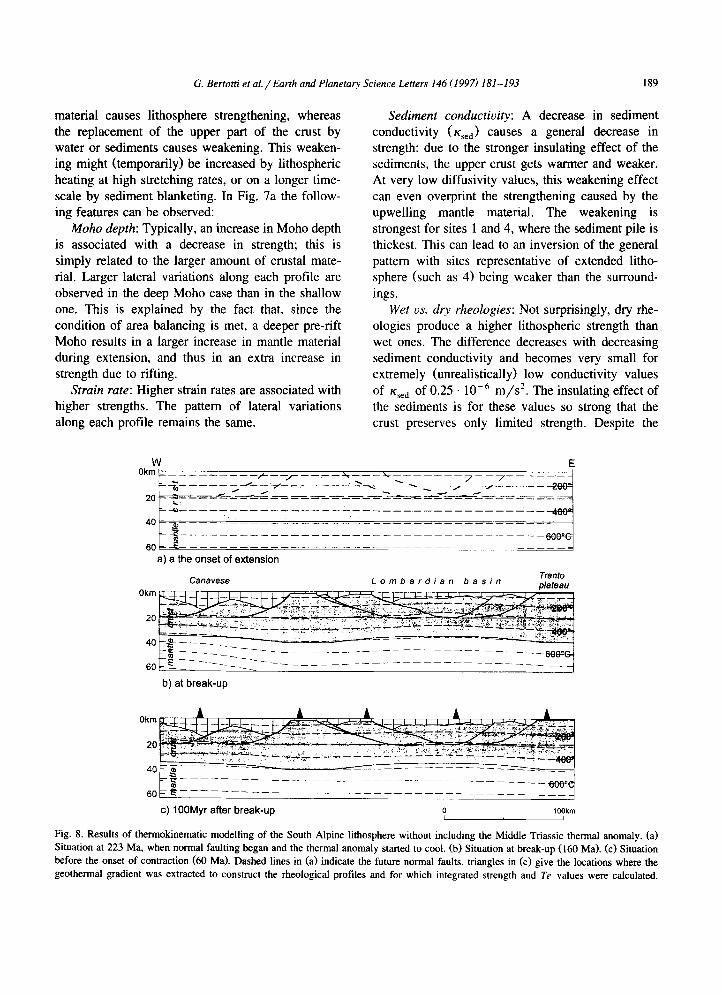
Fig. 8. Results of thermokinematic modelling of the South Alpine lithosphere without including the Middle Triassic thermal anomaly. (a)
Situation at 223 Ma, when normal faulting began and the thermal anomaly started to cool. (b) Situation at break-up (160 Ma). (c) Situation
before the onset of contraction (60 Ma). Dashed lines in (a) indicate the future normal faults, triangles in (c) give the locations where the
geothermal gradient was extracted to construct the rheological profiles and for which integrated strength and Te values were calculated.
190 G. Bertotti et al. /Earth and Planetary Science Letters 146 (1997) 181-193
different absolute values, wet and dry rheologies
produce the comparable pattern of lateral strength distribution. This, however, does not hold for very
low sediment conductivities.
Lateral effects of heating: Strength values at site 2 are typically lower than at site 5, despite the fact
that both sites are on non-extended lithosphere. This
is caused by the 2-D thermal calculations. The ef- fects of heating caused by sediment blanketing in the
neighbouring areas is noticed at site 2 but not at site
5.
4.4. The influence of the thermal anomaly on the strength distribution
Although we know that the thermal evolution of
the Mesozoic Southern Alps is controlled by the presence of a thermal anomaly in the initial rifting
stages, the dimensions and residence time of this
anomaly is largely speculative. To examine the influ-
ence of our assumption of a rather large and long- term intrusion, we also studied the other end-mem-
ber; that is, thermal evolution without any preceding magmatism. We thus run the model without consid-
ering the Middle Triassic thermal anomaly. The results of this thermokinematic modelling are
shown in Fig. 8 and demonstrate a much “quieter”
evolution than if an anomaly is included. Block
movements along the faults do not cause any notice- able disturbance of the isotherms. These are dis-
placed by lithospheric thinning but tend to regain their equilibrium situation relatively quickly: 100
Myr after break-up recovery is complete and the isotherms are practically flat.
Applying the same procedures described above,
we have constructed yield strength envelopes and
obtained integrated strength and Te values 100 Myr after break-up for the same localities as for the “intrusion model”. The numerical values are < 2%
off from the ones derived for the “intrusion model” and the yield strength profiles are practically identi-
cal.
5. Cross-check with other data sets
Our rheological modelling applied to the well constrained South Alpine case led to two major
conclusions:
(1) The South Alpine lithosphere preserved sub-
stantial strength even during the last stages of rifting immediately preceding break-up. This holds also for
the most distal segments of the margin, the areas closest to the site of ocean opening.
(2) 100 Myr after break-up the stronger domains of the margins are those which have undergone more
extension. This is a result of the nearly flat position
of the isotherms after break-up. Thinner areas have a larger proportion of mantle than less thinned ones
and are therefore stronger. In the following we check these predictions with
the data derived from other, mainly field-derived data.
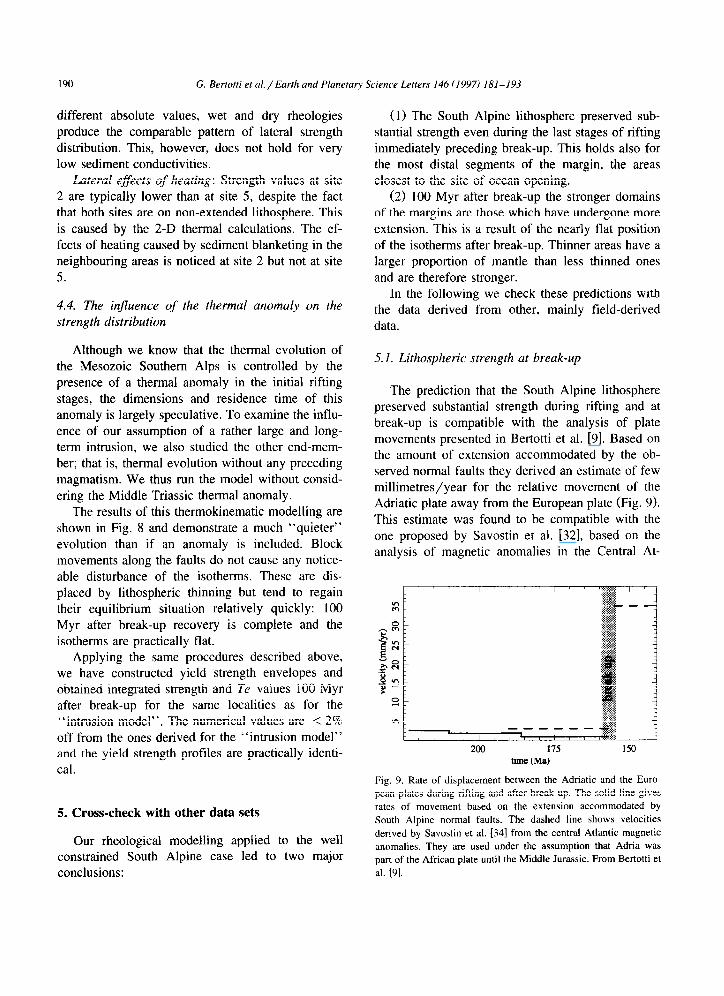
5.1. Lithospheric strength at break-up
The prediction that the South Alpine lithosphere preserved substantial strength during rifting and at
break-up is compatible with the analysis of plate
movements presented in Bertotti et al. [9]. Based on the amount of extension accommodated by the ob- served normal faults they derived an estimate of few
millimetres/year for the relative movement of the Adriatic plate away from the European plate (Fig. 9).
This estimate was found to be compatible with the
one proposed by Savostin et al. [32], based on the analysis of magnetic anomalies in the Central At-
8 1 2 7 I
--____
200 175 150 time (Ma)
Fig. 9. Rate of displacement between the Adriatic and the Euro-
pean plates during rifting and after break-up. The solid line gives
rates of movement based on the extension accommodated by
South Alpine normal faults. The dashed line shows velocities
derived by Savostin et al. 1341 from the central Atlantic magnetic
anomalies. They are used under the assumption that Adria was
part of the African plate until the Middle Jurassic. From Bertotti et
al. [9].

G. Bertotti et ul. / Earth and Planetu~ Science Letters 146 (1997) 181-193 191
lantic. According to Savostin et al. [32], velocities increased by an order of magnitude to a few centime-
tres/year around 160 Ma, which corresponds to the Adria-Europe break-up (Fig. 9). We interpret this
increase in velocities to be the result of the cessation
of the resistance opposed by the lithosphere to ten- sional forces. This is compatible with our predictions
of the South Alpine lithosphere preserving part of its
strength during the final stages of rifting.
5.2. Lateral uariations in lithospheric strength dur- ing and qfter dr$ing
The prediction that lithospheric segments which have undergone thinning (such as the lithosphere
underlying the Lombardian basin) are stronger than those which suffered less deformation is tested by
analyzing the shape of the Tertiary foredeep basin
which developed on top of the South Alpine litho- sphere, in front of S-vergent Alpine thrusting (Fig.
1). The analysis of foredeep geometries is in general considered to be a powerful tool in constraining Te values of loaded plates. Bertotti et al. [35] have
studied the geometry of the foredeep basin along N-S profiles crossing different domains of the older passive continental margins. Profile A (Fig. 1) is
mainly located in a domain which underwent limited extension. Profile B, in contrast, runs through the Lombardian basin, the most extended structure of the
margin. The position of the base foredeep along the
two profiles is shown in Fig. 10 and demonstrates that it was steeper in less extended regions (profile
distance (km)
6L1, _I-1 - 0 100 200 300
distance (km)
Fig. 10. Sections across the Tertiary South Alpine foredeep [35].
The trace of the sections is given in Fig. I. Mountain ranges are
shown only for geographical reference. Dashed lines are paleo-
bathymetries before loading. Triangles are data points for the
depth of base foredeep derived from seismic sections. Vertical
scale in kilometres. Note how the base foredeep is steeper in
profile A than in profile B.
A) than in the more extended ones (profile B). This is consistent with the predictions made by our study.
6. Discussion and conclusion
The results of this study demonstrate that the
thermal structure of the lithosphere at break-up is mainly a function of the geometry and rate of exten-
sion. Block movements associated with normal fault-
ing do not cause major disturbances. Magmatic events, on the contrary, can have profound influence
but their effect is only felt for time intervals of a few
millions of years. This holds also for large and deep intrusions. Magmatic events occurring in the initial
stages of rifting, bear no major influence on the
thermal and mechanical structures of the lithosphere at break-up and during drifting.
The South Alpine lithosphere preserved substan-
tial strength throughout rifting and drifting. Even at break-up, Te values of the most distal parts of the
future margin were > 15 km. Effective elastic thick-
ness values increase thereafter. The preservation of strength at break-up can have important conse-
quences on plate movements. Even during the last stages of rifting. the thinner
parts of the margin tend to be stronger than the less
thinned ones [4.5]. After a time span long enough to allow for thermal relaxation the lithospheric strength is controlled by the lithological composition of the
lithospheric column [6]. Thinned parts of the margin
have a higher proportion of strong mantle than crustal material compared with non-thinned segments and
are, therefore, stronger. Our numerical model shows
that thermal perturbations associated with rifting are mostly recovered within a time span of few tens of
million years. In the case of slow rifts, which most
passive margins are, this recovery can even happen
during or shortly after rifting, which appears to be the case for the Southern Alps.
Since the lithospheric strength drifting is mainly a
function of the composition of the lithologic column, the often made assumption of the effective elastic
thickness being controlled by an isotherm is not correct. In fact, our Te values at the end of rifting correspond to temperatures of 340”, 400”, 370”, 340” and 300°C from the most proximal (eastern) to the more distal (western) profile. These values remain very similar 100 Myr later, except for the most distal
192 G. Bertotti et al./Earth and Planetary Science Letters 146 (1997) IN-193
part of the margin where the Te corresponds to the and the evolution of foreland basins, Basin Res. 4, 169-178,
400°C isotherm. 1992.
The inferred Te values of the South Alpine litho- sphere during rifting were between 25 and 35 km and are therefore higher than those obtained from fitting deflection and gravity data on elastic wedges at passive margins (e.g., [1,36-381). Our Te values, in contrast, correlate well with those obtained with geophysical methods by Holt and Stem [3] on the western New Zealand passive continental margin. The New Zealand margin, similarly to the Southern Alps, remained starved of sediments for most of its drifting stage and only some 70 Myr later, with the onset of convergence, became loaded by a thick sedimentary wedge.
[3] W.E. Holt and T.A. Stem, Sediment loading on the Western
Platform of the New Zealand continent: Implications for the
strength of a continental margin, Earth Planet. Sci. Lett. 107,
523-538, 1991.
[4] P. England, Constraints on extension of continental litho-
sphere, J. Geophys. Res. 88, 1145-l 152, 1983.
[5] GE. Vink, W.J. Morgan and W-L. Zhao, Preferential rifting
of continents: A source of displaced terrains, J. Geophys.
Res. 89, 10,072-10,076, 1984.
[6] R.E. Oxburgh, Heterogeneous lithospheric stretching in the
early history of erogenic belts, in: Mountain Building Pro-
cesses, K.J. Hsil, ed., pp. 85-93, Academic, New York, NY,
1986.
[7] G. Bassi, Relative importance of strain rate and rheology for
the mode of continental extension, Geophys. J. Int. 122,
195-210, 1995.
The rheological profiles across the South Alpine margin support the notion that most of the litho- spheric strength both during the last stages of rifting and during drifting is carried by the mantle. The crust is, on the whole, much weaker. Particularly weak appears to be the lower crust, which even during drifting has very low strength. This can strongly affect subsequent tectonic events, such as renewed rifting or tectonic loading, when the af- fected lithosphere would behave in a decoupled rather than coupled mode [23].
[8] H.P. Laubscher and D. Bernoulli, Mediterrenean and Tethys,
in: The Ocean Basins and Margins 4A, The Eastern Mediter-
renean, A.E.M. Naim, W.H. Kanes and F.G. Stehli, eds.,
Plenum, New York, NY, 1977.
[9] G. Bertotti, V. Picotti, D. Bernoulli and A. Castellarin, From
rifting to drifting: tectonic evolution of the South-Alpine
upper crust from the Triassic to the Early Cretaceous, Sedi-
ment. Geol. 86, 53-76, 1993.
Acknowledgements
G.B. acknowledges financial support by AWON (project 75 1.356.026A). V.P. benefitted from MURST for his stay in Amsterdam. M.t.V. was supported by the IBS (Integrated Basin Studies) pro- ject, part of the Joule II research program funded by the Commission of European Communities (contract No. JOUZCT 91-010). J.-P. Burg and F. Beekman are thanked for valuable suggestions. M. Diament and F. Neubauer are thanked for their reviews. Publi- cation Nr. 961102 of the Netherlands Research School of Sedimentary Geology. [UC1
[lo] A.W. Bally and D. Bernoulli, Listric normal faults, Gceanol.
Acta, 26th Int. Geol. Congr., Paris, pp. 87-101, 1981.
[ 111 G. Bertotti, Early Mesozoic extension and Alpine shortening
in the western Southern Alps: The geology of the area
between Lugano and Menaggio (Lombardy, Northern Italy),
Mem. Sot. Geol. Padova 43, 17-123, 1991.
[12] C. Sanders, G. Bertotti, S. Tommasini, G. Davies and J.
Wijbrans, Triassic pegmatites in the Mesozoic middle crust
of the Southern Alps (Italy): fluid inclusions, radiometric
dating and tectonic implications, Eclog. Geol. Helv. 89,
505-525, 1996.
[13] M. Lemoine, P. Tricart and G. Boillot, Ultramafic and
gabbroic ocean floor of the Ligurian tethys (Alps, Corsica,
Apennines): in search of a genetic model, Geology 15,
622-625, 1987.
[14] D. Bernoulli, G. Bertotti and N. Froitzheim, Mesozoic faults
and associated sediments in the Austroalpine-South alpine
passive continental margin, Mem. Sot. Geol. It. 45, 25-38,
1990.
References
[15] J.F. Dewey, M.L. Helman, E. Turco, D.H.W. Hutton and
SD. Knott, Kinematics of western Meditetrenean, in: Alpine
Tectonics, M.P. Coward, D. Dietrich and R.G. Park, eds.,
Geol. Sot. London Spec. Publ. 45, 265-283, 1989.
[16] A. Mottana, M. Nicoletti, C. Petrucciani, G. Liborio, L. De
Capitani and R. Bocchio, Pm-Alpine and alpine evolution of
the South-Alpine basement of the Orobic Alps, Geol. Rund-
sch. 74, 353-366, 1985. [1] S. Fowler and D. McKenzie, Gravity studies at the Rockall
and Exmouth plateaux using SEASAT altimentry, Basin Res.
2, 27-34, 1989.
[2] A.B. Watts, The effective elastic thickness of the lithosphere
[17] V. Diella, MI. Spalla and A. Tunesi, Contrasting thermome-
chanical evolutions in the Southalpine metamorphic base-
ment of the orobic Alps (Central Alps, Italy), J. Metamorph.
Geol. 10, 203-219, 1992.
G. Bertotti et al./Earth and Planetary Science Lttters 146 (1997) 181-193 193
[18] G. Ferrara and F. Innocenti, Radiometric age evidence of a
Triassic thermal event in the Southern Alps, Geol. Rundsch.
63, 572-581, 1974.
[19] G. Bertotti and M. ter Voorde, Thermal effects of normal
faulting during rifted basin formation, 2. The Lugano-Val
Grande normal fault and the role of pre-existing thermal
anomalies, Tectonophysics 240, 145-157, 1994.
[20] M. Voorde and G. Bertotti, Thermal effects of normal fault-
ing during rifted basin formation, 1. A finite difference
model, Tectonophysics 240, 133-144, 1994.
[21] G. Ranalli and D.C. Murphy, Rheological stratification of the
lithosphere, Tectonophysics 132, 281-295, 1987.
[22] S. Cloetingh and E. Banda, Mechanical structure, in: A
Continent Revealed - The European Geotraverse, D. Blun-
dell, R. Freeman and S. Mueller, eds., pp. 80-90, Cambridge
Univ. Press, Cambridge, 1992.
[23] E. Burov and M. Diament, The effective elastic thickness
(Te) of continental lithosphere: What does it really mean? J.
Geophys. Res. 100, 3905-3928, 1995.
[24] J.D. Byerlee, Friction of rocks. Pure Appl. Geophys. 116,
615-626, 1978.
1251 G. Ranalli, Rheology of the Eti, 366 pp., Allen & Unwin,
London, 1987.
1261 S.H. Kirby, Rheology of the lithosphere, Rev. Geophys.
Space Phys. 21, 1458-1487, 1983.
[27] C. Goetze and B. Evans, Stress and temperature in the
bending lithosphere as constrained by experimental rock
mechanics, Geophys. J.R. As&on. Sot. 59, 463-478, 1979.
1281 M.C. Tsenn and N.L.Carter, Upper limits of power law creep
of rocks, Tectonophysics 136, l-26, 1987.
[29] D.L. Kohlstedt, B. Evans and S.J. Mackwell, Strength of the
lithosphere: Constraints imposed by laboratory experiments,
J. Geophys. Res. 100, 17,587-17,602, 1995.
[30] N. Kusznir. G. Marsden and S.S. Egan, A flexural-cantilever
simple-shear/pure-shear model of continental lithosphere ex-
tension: application to the Jeanne d’Arc Basin, Grand Banks
and Viking Graben, North Sea, in: The Geometry of Normal
Faults, A.M. Roberts, G. Yielding and B. Freeman, eds.,
Geol. Sot. London Spec. Publ. 56.41-60, 1991.
[31] C.E. Keen, G.S. Stockmal, H. Welsink, G. Quinlan and B.
Mudford, Deep crustal structure and evolution of the rifted
margin northeast of Newfoundland: Results from Lithoprobe
eats, Can. J. Earth Sci., 44, 1537-1545, 1987.
[32] F.M. Gradstein, F.P. Agterberg, J.G. Ogg, J. Hardenbol, P.
Van Veen, J. Thierry and Z. Huang, A Mesozoic time scale,
J. Geophys. Res. 99, 24,051-24,074, 1994.
[33] A. Burgi and KlStzli, New data on the evolutionary history
of the Ivrea zone (northern Italy), Bull. Swiss Assoc. Petrol.
Geol. Eng. 56, 49-70, 1990.
[34] L.A. Savostin, J.-C. Sibuet, L.P. Zonenshain, X. Le Pichon
and M.-J. Roulet, Kinematic evolution of the Tethys belt
from the Atlantic Ocean to the Pamirs since the Triassic,
Tectonophysics 123, l-35, 1986.
[35] G. Bertotti, V. Picotti and S. Cloetingh, Flexure-induced
lithospheric weakening in “retro-wedge” foredeep basins:
21/2-D evolution of the central western South-Alpine fore-
deep, submitted.
[36] C. Beaumont, C.E. Keen and R. Boutilier, On the evolution
of rifted continental margins: comparisons and models for
the Nova Scotia margin, Geophys. J.R. A&on. Sot. 70,
667-715, 1982.
[37] G.D. Kamer and A.B. Watts, On isostasy at Atlantic-type
continental margins, J. Geophys. Res. 87, 2923-2948, 1982.
1381 A.B. Watts, Crustal structure, gravity anomalies and flexure
of the lithosphere in the vicinity of the Canary Islands.
Geophys. J. Int. 119, 648-666, 1994.
1391 H. Weissert and D. Bernoulli, A transform margin in the
Mesozoic Tethys: evidence from the Swiss Alps, Geol.
Rundsch. 74, 665-679, 1985.