Thermodynamic Assessment of the NaF-KF-UF4 System - MDPI
19
Article Thermodynamic Assessment of the NaF-KF-UF 4 System Bianca Schacherl † , Rachel Eloirdi, Rudy J. M. Konings and Ondrej Beneš * Citation: Schacherl, B.; Eloirdi, R.; Konings, R.J.M.; Beneš, O. Thermodynamic Assessment of the NaF-KF-UF 4 System. Thermo 2021, 1, 232–250. https://doi.org/10.3390/ thermo1020016 Academic Editor: Sergey Vyazovkin Received: 8 June 2021 Accepted: 5 August 2021 Published: 27 August 2021 Publisher’s Note: MDPI stays neutral with regard to jurisdictional claims in published maps and institutional affil- iations. Copyright: © 2021 by the authors. Licensee MDPI, Basel, Switzerland. This article is an open access article distributed under the terms and conditions of the Creative Commons Attribution (CC BY) license (https:// creativecommons.org/licenses/by/ 4.0/). Joint Research Centre, European Commission, P.O. Box 2340, 76125 Karlsruhe, Germany; [email protected] (B.S.); [email protected] (R.E.); [email protected] (R.J.M.K.) * Correspondence: [email protected]; Tel.: +49-(0)7247-951-385 † Current address: Karlsruhe Institute of Technology (KIT), Institute for Nuclear Waste Disposal (INE), P.O. Box 3640, 76021 Karlsruhe, Germany. Abstract: In the Molten Salt Reactor (MSR) concept, metal fluorides are key components of possible fuel and coolant salts. The fast reactor option opens the possibility for alternatives to the Li based matrix salts, avoiding the costly 7 Li enrichment and the tritium production from residual 6 Li. Such alternatives can be based on NaF and KF as matrix components. In this study, two pseudo-binary phase diagrams of NaF-UF 4 and KF-UF 4 , and the NaF-KF-UF 4 pseudo-ternary system were experi- mentally investigated using Differential Scanning Calorimetry (DSC). The obtained data were used to perform a full thermodynamic assessment of the NaF-KF-UF 4 system. The calculated pseudo-ternary eutectic was found at 807 K and a 68.9-7.6-23.5 mol% NaF-KF-UF 4 composition. The comprehensive experimental and modelling data obtained in this work provide further extension of the JRCMSD thermodynamic database describing thermodynamic properties of key fuel and coolant salts for the MSR technology. Keywords: molten salt reactor fuel; phase diagram; molten fluoride salt; thermodynamics; JR- CMSD database 1. Introduction In the Generation IV initiative, six advanced nuclear reactors were selected as promis- ing candidates for a future nuclear fleet deployment. Among them, the Molten Salt Reactor (MSR) concept was chosen because of its high safety, reliability, and efficiency [1]. These favourable properties are largely due to the use of a homogenous salt mixture that serves as fuel and primary coolant. In the decision process used to select which matrix salt serves the best, important factors including neutronics, melting point, redox potentials, reprocessing scheme, physicochemical properties and economics [2] need to be evaluated carefully. Many early studies focused on thermal breeder reactors, which included the necessity to use the lithium fluoride based MSR fuel matrix [3]. However, recent developments raised the interest in reactor concepts that enable the use of alternative alkali and earth alkali salts [4]. With those salt mixtures, it is possible to avoid the costly 7 Li enrichment and also the in-reactor production of tritium from 6 Li residuals (always present in small quantities after enrichment) by neutron capture [5]. The next higher alkali fluorides, NaF and KF, might serve as alternative key matrix components of the MSR fuel to replace LiF. For this reason, the main focus of this study was to extend the existing JRCMSD thermodynamic database [6] by the full assessment of the NaF-KF-UF 4 system. With this thermodynamic description, it is possible to predict relevant properties of a multi-component fuel. This includes the melting behaviour, which plays a key role for the safety assessment, but also in economic aspects of MSRs. It is possible to lower the melting temperature of a possible fuel salt mixture, by using a multicomponent fluoride salt [7–10]. These systems are complex and need a well-reviewed comprehensive database to be able to model their physico- chemical behaviour. To obtain the full thermodynamic description of the NaF-KF-UF 4 system, thermodynamic optimisations of all related subsystems are necessary. Thermo 2021, 1, 232–250. https://doi.org/10.3390/thermo1020016 https://www.mdpi.com/journal/thermo
-
Upload
khangminh22 -
Category
Documents
-
view
2 -
download
0
Transcript of Thermodynamic Assessment of the NaF-KF-UF4 System - MDPI
Article
Thermodynamic Assessment of the NaF-KF-UF4 System
Bianca Schacherl † , Rachel Eloirdi, Rudy J. M. Konings and Ondrej Beneš *
�����������������
Citation: Schacherl, B.; Eloirdi, R.;
Konings, R.J.M.; Beneš, O.
Thermodynamic Assessment of the
NaF-KF-UF4 System. Thermo 2021, 1,
232–250. https://doi.org/10.3390/
thermo1020016
Academic Editor: Sergey Vyazovkin
Received: 8 June 2021
Accepted: 5 August 2021
Published: 27 August 2021
Publisher’s Note: MDPI stays neutral
with regard to jurisdictional claims in
published maps and institutional affil-
iations.
Copyright: © 2021 by the authors.
Licensee MDPI, Basel, Switzerland.
This article is an open access article
distributed under the terms and
conditions of the Creative Commons
Attribution (CC BY) license (https://
creativecommons.org/licenses/by/
4.0/).
Joint Research Centre, European Commission, P.O. Box 2340, 76125 Karlsruhe, Germany;[email protected] (B.S.); [email protected] (R.E.); [email protected] (R.J.M.K.)* Correspondence: [email protected]; Tel.: +49-(0)7247-951-385† Current address: Karlsruhe Institute of Technology (KIT), Institute for Nuclear Waste Disposal (INE),
P.O. Box 3640, 76021 Karlsruhe, Germany.
Abstract: In the Molten Salt Reactor (MSR) concept, metal fluorides are key components of possiblefuel and coolant salts. The fast reactor option opens the possibility for alternatives to the Li basedmatrix salts, avoiding the costly 7Li enrichment and the tritium production from residual 6Li. Suchalternatives can be based on NaF and KF as matrix components. In this study, two pseudo-binaryphase diagrams of NaF-UF4 and KF-UF4, and the NaF-KF-UF4 pseudo-ternary system were experi-mentally investigated using Differential Scanning Calorimetry (DSC). The obtained data were used toperform a full thermodynamic assessment of the NaF-KF-UF4 system. The calculated pseudo-ternaryeutectic was found at 807 K and a 68.9-7.6-23.5 mol% NaF-KF-UF4 composition. The comprehensiveexperimental and modelling data obtained in this work provide further extension of the JRCMSDthermodynamic database describing thermodynamic properties of key fuel and coolant salts for theMSR technology.
Keywords: molten salt reactor fuel; phase diagram; molten fluoride salt; thermodynamics; JR-CMSD database
1. Introduction
In the Generation IV initiative, six advanced nuclear reactors were selected as promis-ing candidates for a future nuclear fleet deployment. Among them, the Molten Salt Reactor(MSR) concept was chosen because of its high safety, reliability, and efficiency [1]. Thesefavourable properties are largely due to the use of a homogenous salt mixture that serves asfuel and primary coolant. In the decision process used to select which matrix salt serves thebest, important factors including neutronics, melting point, redox potentials, reprocessingscheme, physicochemical properties and economics [2] need to be evaluated carefully.
Many early studies focused on thermal breeder reactors, which included the necessityto use the lithium fluoride based MSR fuel matrix [3]. However, recent developments raisedthe interest in reactor concepts that enable the use of alternative alkali and earth alkalisalts [4]. With those salt mixtures, it is possible to avoid the costly 7Li enrichment and alsothe in-reactor production of tritium from 6Li residuals (always present in small quantitiesafter enrichment) by neutron capture [5]. The next higher alkali fluorides, NaF and KF,might serve as alternative key matrix components of the MSR fuel to replace LiF. For thisreason, the main focus of this study was to extend the existing JRCMSD thermodynamicdatabase [6] by the full assessment of the NaF-KF-UF4 system. With this thermodynamicdescription, it is possible to predict relevant properties of a multi-component fuel. Thisincludes the melting behaviour, which plays a key role for the safety assessment, but also ineconomic aspects of MSRs. It is possible to lower the melting temperature of a possible fuelsalt mixture, by using a multicomponent fluoride salt [7–10]. These systems are complexand need a well-reviewed comprehensive database to be able to model their physico-chemical behaviour. To obtain the full thermodynamic description of the NaF-KF-UF4system, thermodynamic optimisations of all related subsystems are necessary.
Thermo 2021, 1, 232–250. https://doi.org/10.3390/thermo1020016 https://www.mdpi.com/journal/thermo

Thermo 2021, 1 233
The NaF-KF pseudo-binary phase diagram was investigated in detail by Kurnakowand Zmczuznyj [11], Dombrovskaya and Koloskova [12], and Holm [13]. Holm reportedan eutectic point of X(KF) = 0.62 mol% [13]. The thermodynamic assessment of the NaF-KF subsystem was presented in our earlier study [14] and the data were further used inthis work.
NaF-UF4 phase transitions were first determined from thermal analysis while coolingby Barton et al. [15]. Thoma et al. [16] investigated the phase boundaries in the KF-UF4system by quenching after equilibration and identification of the phases by powder X-raydiffraction and optical microscopy. Thermal analysis and visual observations were used assupplementary methods.
A first study of the NaF-KF-UF4 system was presented by Thoma et al. [17] based onunpublished thermal analysis data from the period 1950–1958. From their data, the authorsderived a preliminary phase diagram but stated that they could not list invariant pointsbecause their data did not define the phase relationships [17].
In the current paper, an extensive experimental investigation of the two pseudo-binaryphase diagrams for NaF-UF4 and KF-UF4, and a pseudo-ternary investigation of the NaF-KF-UF4 system were performed using Differential Scanning Calorimetry (DSC) and basedon the obtained novel phase equilibrium data the full thermodynamic assessment of theNaF-KF-UF4 system was completed. For the NaF-UF4 system, 20 intermediate compo-sitions were synthesised and measured, while for the KF-UF4 system, 21 intermediatecompositions were evaluated. Furthermore, 12 different compositions from the pseudo-ternary field were measured for liquidus point determination and used to further optimisethe calculated phase diagram.
2. Experimental Section2.1. Sample Preparation
The commercially obtained compounds used in this study were NaF (99.995 w%metallic purity, source: Alfa Aesar, pr. Nr. 12964) and KF (99.99 w% metallic purity, source:Alfa Aesar, pr. Nr. 10980). Due to the hygroscopic nature of the fluoride compounds,moisture can accumulate during transport. To ensure moisture-free initial end-members,both NaF and KF were heated prior to the mixture synthesis in a Ni crucible underconstant argon flow in a tubular furnace at 400 ◦C for 4 h. The purity was verified bymelting point determination using DSC and by XRD powder diffraction phase analysis. Asshown in detail in our earlier study [18], both techniques provide complementary puritycontrol of the starting materials. The determined melting points of the end-members agreewell with the literature values; for NaF the melting point was determined as 1268 K [19](ref. value 1269 K) and KF as 1130 K [19] (ref. value 1131 K). The small differences inmelting temperatures are within the experimental precision of the applied method. UF4was synthesised from UO2 by hydro-fluorination with HF using the process described indetail by Soucek et al. [18]. First, a U(VI) nitrate solution was electrochemically reduced andprecipitated as uranium oxalate. The uranium oxalate was thermally decomposed at 1073 Kto UO2 with a large surface area and thus yielding small crystal sizes. This is key to achievehigh conversion rates during fluorination. Then, the UO2 was fluorinated at elevatedtemperatures in a specially designed fluorination apparatus under a constant HF gas flow.The melting point of UF4 was determined to be 1307.7 K, which is in perfect agreementwith an earlier determined value from Soucek et al. [18]. Furthermore, phase analysis byX-ray diffraction (XRD) showed the presence of UF4. No other phases were detected.
Samples and purified materials were only handled in glove boxes with monitoredinert argon atmosphere, with O2 and H2O levels lower than 2 ppm.
2.2. X-ray Diffraction Analyses
A Brucker AXS XRD D8 ADVANCE instrument was used for qualitative powderdiffraction analysis to assess the purity of the end-members (as discussed above) andphases in equilibrium of selected pseudo-ternary samples. All XRD measurements were

Thermo 2021, 1 234
performed at room temperature. Prior to XRD measurements all samples were embeddedin an epoxy glue (Hardmann Double Bubble Red Non Sag 04001 type), which is inert tosamples, to protect the sample from O2 and H2O absorption from the ambient atmosphere.The absence of interaction of the analyte with the matrix was confirmed using the NaFprecursor with three consecutive tests, performed at 10 min, 30 min, and 4 h of totalmeasurement time. No changes in the spectrum with prolonged X-ray irradiation timewere visible, which indicates the stability of the prepared sample, as shown in Figure 1.XRD measurements were performed in a glove box under nitrogen atmosphere (<2 ppmO2 and H2O).
Thermo 2021, 1, FOR PEER REVIEW 3
2.2. X-ray Diffraction Analyses A Brucker AXS XRD D8 ADVANCE instrument was used for qualitative powder dif-
fraction analysis to assess the purity of the end-members (as discussed above) and phases in equilibrium of selected pseudo-ternary samples. All XRD measurements were per-formed at room temperature. Prior to XRD measurements all samples were embedded in an epoxy glue (Hardmann Double Bubble Red Non Sag 04001 type), which is inert to sam-ples, to protect the sample from O2 and H2O absorption from the ambient atmosphere. The absence of interaction of the analyte with the matrix was confirmed using the NaF precursor with three consecutive tests, performed at 10 min, 30 min, and 4 h of total meas-urement time. No changes in the spectrum with prolonged X-ray irradiation time were visible, which indicates the stability of the prepared sample, as shown in Figure 1. XRD measurements were performed in a glove box under nitrogen atmosphere (<2 ppm O2 and H2O).
Figure 1. XRD pattern versus time of embedded NaF used in this study for synthesis of fuel mixtures. Plots show stability of the sample prepared under applied conditions at total times of 10 min, 30 min, and 4 h, respectively, as indicated within the figure.
XRD qualitative analyses of the NaF, KF, UF4 end-members, and the pseudo-ternary mixture were performed for a 2Θ range of 20°–120°, with a step size of 0.02° and recording time of 9 s per step. Phases in the sample were identified by comparison to single phase X-ray powder diffraction patterns compiled in the Powder Diffraction File (PDF-2) data-base [20]. This database is maintained and continually upgraded by the International Cen-tre for Diffraction Data (ICDD). The qualitative analyses was carried out using the ICDD database and Match software, version 1.11f [21].
The calibration of diffraction line positions and shapes determined through powder XRD was performed using the Standard Reference Material (SRM) 660b [22] provided by the National Institute of Standards and Technology (NIST). It consisted of lanthanum hex-aboride (LaB6) powder bottled under argon.
Figure 1. XRD pattern versus time of embedded NaF used in this study for synthesis of fuel mixtures.Plots show stability of the sample prepared under applied conditions at total times of 10 min, 30 min,and 4 h, respectively, as indicated within the figure.
XRD qualitative analyses of the NaF, KF, UF4 end-members, and the pseudo-ternarymixture were performed for a 2Θ range of 20◦–120◦, with a step size of 0.02◦ and record-ing time of 9 s per step. Phases in the sample were identified by comparison to singlephase X-ray powder diffraction patterns compiled in the Powder Diffraction File (PDF-2)database [20]. This database is maintained and continually upgraded by the InternationalCentre for Diffraction Data (ICDD). The qualitative analyses was carried out using theICDD database and Match software, version 1.11f [21].
The calibration of diffraction line positions and shapes determined through powderXRD was performed using the Standard Reference Material (SRM) 660b [22] providedby the National Institute of Standards and Technology (NIST). It consisted of lanthanumhexaboride (LaB6) powder bottled under argon.
2.3. Differential Scanning Caloriemtry for Phase Equilibrium Determination
A pressure resistant stainless steel crucible equipped with a nickel liner and sealedusing a procedure described by Beneš et al. [23], ensured precise and reliable measurementsof the fluoride mixtures. To realise accurate compositions of the fluoride mixtures, thecompounds were mixed in the glove box under argon atmosphere directly in the crucible.The exact weights of each component are given in Tables 1 and 2 in the Appendix A. The

Thermo 2021, 1 235
salt specimens were placed in the gas tight crucibles and measured in a Setaram multi-detector high temperature calorimeter (MDHTC 96) with an DSC detector using S-typethermocouples. The DSC detector was calibrated in the range of ca.450 K to ca.1250 K byusing pure standard metals (In, Sn, Pb, Al, Ag) for four different heating rates (3 K/min,5 K/min, 10 K/min, 15 K/min). This calibration curve was applied to the measured phaseequilibria of all mixtures. For all measurements, a constant heating rate of 10 K/min wasapplied with peak temperature of 1525 K, well above the melting point of the highestmelting end-member (i.e., UF4). This heating rate was chosen to ensure consistency in thissystematic study. Each measurement consisted of three heating cycles: the first one had adwell time of 2 h at the maximum temperature to achieve homogeneous mixing of the end-members by melting them together. Therefore, only the second and third heating cycleswere used for determination of the phase equilibria. Finally. the obtained equilibriumtemperatures of the second and the third cycles were averaged. The variation in the peakshapes can be seen in an exemplary DSC signal in Figure A1 in the Appendix A. Thephase transition temperature is derived from tangential analysis of the heat flow signal.The uncertainties differ depending on the shape of the DSC peak as highlighted in ourearlier study [24]. Eutectic and peritectic transitions as well as α-β and phase transitionsare determined by their onset temperature with an uncertainty of 5 K, while the liquidustransition is determined by the offset temperature, where the uncertainty can be up to 15 K.The phase transition data during cooling is often affected by super cooling effects; therefore,it was only used to verify the number of transitions occurring during crystallisation.
3. Thermodynamic Modelling
The experimental equilibrium data obtained in this work were used as a basis to modelthe NaF-UF4 and KF-UF4 pseudo-binary phase diagrams and the pseudo-ternary phasediagram. The modelling work was carried out according to the Calphad method, which isbased on the Gibbs Energy minimisation. All thermodynamic calculations performed inthis study were performed using the Factsage v7.1 software [25]. The thermodynamic datafor the NaF-KF phase diagram were taken from an optimised phase diagram published ina previous study [14].
3.1. Compounds
The Gibbs energy of the stoichiometric compounds can be described as
G(T) = ∆ f H0(298)− S0(298)·T +∫ T
298cp(T)dT − T·
∫ T
298
cp(T)T
dT, (1)
where ∆ f H0(298) and S0(298) are the standard enthalpy of formation and standard abso-lute entropy both at the reference temperature of 298.15 K and hydrostatic pressure of 1 bar.These thermodynamic parameters were manually optimised in this study for all interme-diate compounds for those thermodynamic data that do not exist in the literature. Theheat capacity was estimated based on the Neumann-Kopp rule (i.e., the additivity rule forthe end-members). Thermodynamic data of all compounds stabilised in the NaF-KF-UF4system used in the current assessment are listed in Table 1.

Thermo 2021, 1 236
Table 1. Thermodynamic data (∆fH298, S298, and cp(T)) of the compounds stabilised in the NaF-UF4, KF-UF4 and NaF-KF-UF4 systems.
Compound ∆fH298/kJ mol−1 S298/J K−1 mol−1 cp(T)/J K−1 mol−1 Reference
NaF (cr.) −576.65 51.21 47.63 + 0.01479·T − 464,300·T−2 [26]
NaF (liq.) −557.73 52.76 72.989 [26]
KF (cr.) −568.61 66.55 68.757 − 0.05776·T − 766718·T−2 +7.5405·10−5·T2 − 2.3886·10−8·T3 [18]
KF (liq.) −554.37 67.77 71.965 [18]
UF4 (cr.) −1914.20 151.70 114.519 + 0.02055·T − 413,159·T−2 [27]
UF4 (liq.) −1914.66 115.40 174.74 [27]
Na2[UF6] (cr.) −3095.98 265.30 209.779 + 0.05013·T − 1,341,759·T−2 This study
Na3[UF7] (α−cr.) −3649.90 347.30 257.409 + 0.06492·T − 1,806,059·T−2 This study
Na3[UF7] (β−cr.) −3649.40 347.91 257.409 + 0.06492·T − 1,806,059·T−2 This study
Na[U2F9] (cr.) −4434.45 350.90 276.669 + 0.055900·T − 1,290,618·T−2 This study
Na5[U3F17] (cr.) −8690.25 757.40 581.708 + 0.135615·T − 3,560,977·T−2 This study
Na7[U6F31] (cr.) −15,715.139 1255.984 1020.526 + 0.22686·T − 5,729,054·T−2 This study
K2[UF6] (α−cr.) −3092.856 318.97 252.034 − 0.094959·T − 1,946,596·T−2 +1.5081·10−4·T2 − 4.77713·10−8·T3 This study
K2[UF6] (β−cr.) −3092.36 319.56 252.034 − 0.094959·T − 1,946,596·T−2 +1.5081·10−4·T2 − 4.77713·10−8·T3 This study
K3[UF6] (cr.) −3668.41 404.34 320.791 − 0.15272·T − 2,713,314·T−2 +2.2621·10−4·T2 − 7.16569·10−8·T3 This study
K[U2F9] (cr.) −4434.01 382.95 297.796 − 0.016647·T − 1,593,036·T−2 +7.54049·10−5·T2 − 2.38856·10−8·T3 This study
K7[U6F31] (cr.) −15,680.03 1486.03 1168.418 −0.28097·T − 7,845,982·T−2 +5.27834·10−4·T2 − 1.67199·10−7·T3 This study
NaKUF6 (cr.) −3,114,000 269.46 230.907 − 0.022412·T − 1,644,177·T−2 +7.540486·10−5·T2 − 2.38856·10−8·T3 This study
Na2KUF7 (cr.) −3,700,000 320.67 278.537 − 0.007622·T − 2,108,477·T−2 +7.540486·10−5·T2 − 2.38856·10−8·T3 This study
3.2. Solutions
The Gibbs energy of a binary solution can be described as
G(T) = G0(T) + ∆Gid + ∆Gxs, (2)
where G0(T) is the standard Gibbs free energy of the mixing end-members, ∆Gid is theideal mixing term, and ∆Gxs is the excess Gibbs energy function.
The solid solutions in the NaF-KF system have been assessed earlier [14], and neitherthe NaF-UF4 nor the KF-UF4 system contain solid solutions. Thus, the only solution, whichwas subjected to thermodynamic assessment in this study, was the liquid solution. Wenote here that it is also likely that partial or full solubility in the solid state might occurbetween Na6U7F31 and K6U7F31, and between NaU2F9 and KU2F9; however, since wecould not experimentally address the presence of such solution(s), we did not include themin the assessment of the NaF-KF-UF4 pseudo-ternary system. This area may require furtherattention in future studies.
The excess Gibbs energy parameters of the liquid solution were described by themodified quasi-chemical model with a quadruplet approximation [28,29]. This is onthe one hand claimed a suitable model for describing ionic liquids, and on the other

Thermo 2021, 1 237
hand, it allowed us to maintain compatibility with the extensive JRCMSD thermodynamicdatabase [6] describing fluoride and chloride salt systems. The basis of this quadruplet is apolynomial formalism using the excess Gibbs energy parameters for the second nearestneighbour pair-exchange reaction:
(Na-F-Na) + (U-F-U) = 2(Na-F-U) ∆gNaU/F, (3)
(K-F-K) + (U-F-U) = 2(K-F-U) ∆gKU/F. (4)
As an example, for the NaF-UF4, system the ∆gNaU/F parameter can be expanded asa polynomial:
∆g NaUF
= ∆g0NaU
F∑
(i+j)≥q1
gijNaU
Fχi
NaUF
χjUNa
F. (5)
Furthermore, the model requires definition of a composition of the strongest shortrange ordering. This is achieved by defining cation-cation coordination numbers Zi,j
ij , inwhich i and j are the mixing cations. At this composition, the excess Gibbs energy of theliquid solution tends to have its minimum and thus is generally related to the eutecticpoint, i.e., to the lowest melting region. The coordination numbers are composition andtemperature independent, and they are defined during the phase diagram optimisation.The selected coordination numbers used in this study are listed in the Table 2 below:
Table 2. Cation-cation coordination numbers Zi,jij , for the mixing cations i and j used for the thermo-
dynamic modelling.
i j Zi,jij Zi,j
ij
Na U 3 6K U 3 6
To maintain electro neutrality in the system, once the cation-cation coordinationnumbers are selected the anion coordination numbers are calculated according to thefollowing equation:
qi
Ziij/FF
+qj
Zjij/FF
=2qF
ZFij/FF
.
The excess Gibbs energy parameters ∆g0NaU/F and gij
NaU/F were obtained by optimisationof the experimental data of the (Na,U)Fx and (K,U)Fx liquid solutions and the obtainedvalues are given below (in J·mol−1):
g00NaU = −25104 + 4.184·T, (6)
g10NaU = −26961 + 18.184·T, (7)
g01NaU = −40200 + 32.276·T, (8)
g00KU = −30304, (9)
g10KU = −15101 + 4.866·T, (10)
g01KU = −5417 − 5.276·T. (11)
The χNaU/F term from Equation (5) was determined by the composition of the solution;here, XNaNa, XNaU , and XUU represent the cation-cation pair mole fractions, given by
χNaU/F =XNaNa
XNaNa + XNaU + XUU. (12)
All optimisations of the excess Gibbs parameters of the liquid solution and the ther-modynamic data of the intermediate phases (as discussed above) were carried out using

Thermo 2021, 1 238
the so-called trial-error method until good agreement between the experimental data andthe calculation was achieved.
For the pseudo-ternary system calculation, the mixing cations were subdivided intotwo groups: (i) first containing the highly ionic Na and K constituents and (ii) the secondone containing U constituents with a more molecular-type behaviour. Taking this intoaccount, the asymmetric Kohler-Toop formalism was used to extrapolate the excess Gibbsparameters of the pseudo-ternary solutions of the NaF-KF-UF4 phase diagram from itspseudo-binary sub-systems. The extrapolated pseudo-ternary system was further opti-mised based on novel experimental data obtained from DSC measurements. The assessedpseudo-ternary parameters (in J/mol) are:
g001UK(Na) = 2000. (13)
4. Results4.1. Phase Equilibria Determination of the Pseudo-Binary NaF-UF4 and KF-UF4 Mixtures
The phase equilibria temperatures experimentally obtained in this study by DSC forthe NaF-UF4 and KF-UF4 system are presented in Tables 3 and 4 and in Figures 2 and 3,respectively. The type of equilibria were identified by the phase diagram assessmentand comparison to earlier studies [15,16]. For comparison, the equilibrium temperaturescalculated from the thermodynamic assessment performed in this study are shown inTables 3 and 4 as well. They demonstrate good agreement with the experimental data forthe whole composition range.
Table 3. Experimental phase equilibria and temperatures obtained by DSC for the NaF-UF4 system and the calculatedtransition temperatures at these compositions for comparison.
x (UF4)/mol% Type of EquilibriaTemperature/K
Experiment Calculation
0.100
Formation of Na3[UF7] 737 ± 5 K 738
α – β transition of Na3[UF7] 825 ± 5 K 823
Eutectic 887 ± 5 K 888
Liquidus 1201 ± 15 K 1198
0.150
Formation of Na3[UF7] 738 ± 5 K 738
α–β transition of Na3[UF7] 825 ± 5 K 823
Eutectic 885 ± 5 K 888
Liquidus 1120 ± 15 K 1122
0.175
Formation of Na3[UF7] 738 ± 5 K 738
α–β transition of Na3[UF7] 826 ± 5 K 823
Eutectic 884 ± 5 K 888
Liquidus 1064 ± 15 K 1064
0.201
Formation of Na3[UF7] 739 ± 5 K 738
unidentified 761 ± 15 K n.a.
α–β transition of Na3[UF7] 824 ± 5 K 823
Eutectic 886 ± 5 K 888
Liquidus 974 ± 15 K 980
0.250
Formation of Na3[UF7] 736 ± 5 K 738
unidentified 770 ± 15 K n.a.
α–β transition of UNa3F7 820 ± 5 K 823
Melting 887 ± 5 K 910
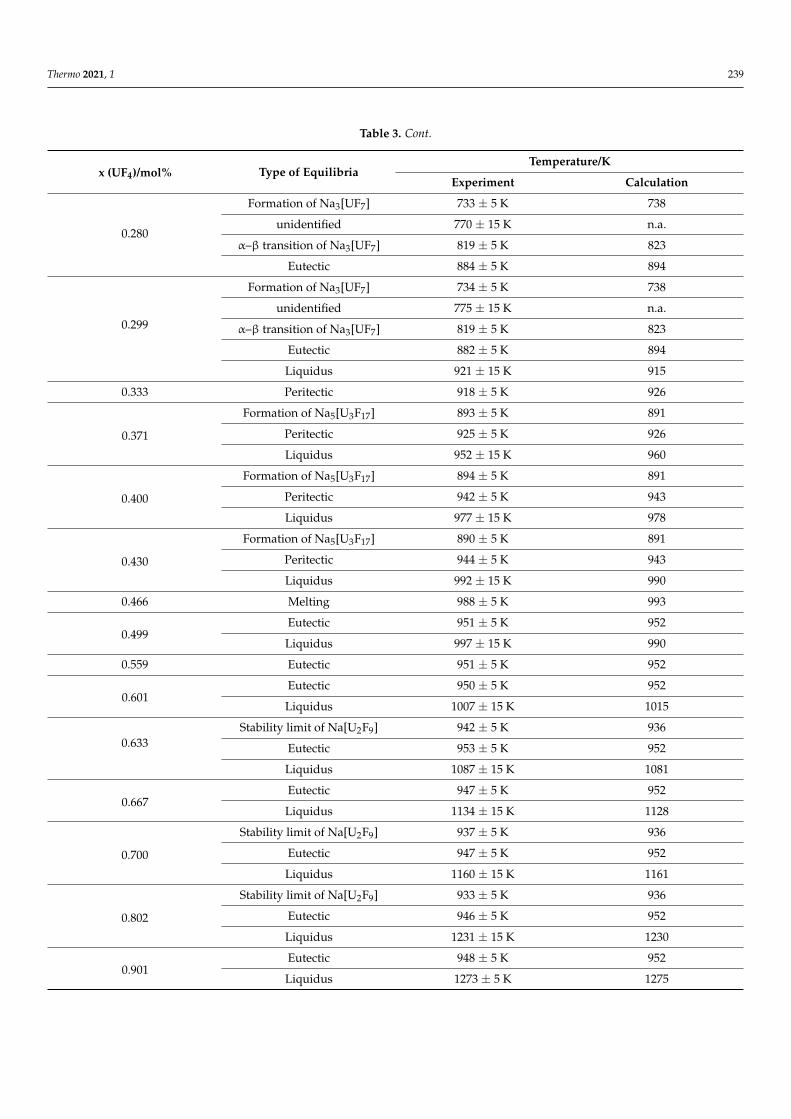
Thermo 2021, 1 239
Table 3. Cont.
x (UF4)/mol% Type of EquilibriaTemperature/K
Experiment Calculation
0.280
Formation of Na3[UF7] 733 ± 5 K 738
unidentified 770 ± 15 K n.a.
α–β transition of Na3[UF7] 819 ± 5 K 823
Eutectic 884 ± 5 K 894
0.299
Formation of Na3[UF7] 734 ± 5 K 738
unidentified 775 ± 15 K n.a.
α–β transition of Na3[UF7] 819 ± 5 K 823
Eutectic 882 ± 5 K 894
Liquidus 921 ± 15 K 915
0.333 Peritectic 918 ± 5 K 926
0.371
Formation of Na5[U3F17] 893 ± 5 K 891
Peritectic 925 ± 5 K 926
Liquidus 952 ± 15 K 960
0.400
Formation of Na5[U3F17] 894 ± 5 K 891
Peritectic 942 ± 5 K 943
Liquidus 977 ± 15 K 978
0.430
Formation of Na5[U3F17] 890 ± 5 K 891
Peritectic 944 ± 5 K 943
Liquidus 992 ± 15 K 990
0.466 Melting 988 ± 5 K 993
0.499Eutectic 951 ± 5 K 952
Liquidus 997 ± 15 K 990
0.559 Eutectic 951 ± 5 K 952
0.601Eutectic 950 ± 5 K 952
Liquidus 1007 ± 15 K 1015
0.633Stability limit of Na[U2F9] 942 ± 5 K 936
Eutectic 953 ± 5 K 952
Liquidus 1087 ± 15 K 1081
0.667Eutectic 947 ± 5 K 952
Liquidus 1134 ± 15 K 1128
0.700
Stability limit of Na[U2F9] 937 ± 5 K 936
Eutectic 947 ± 5 K 952
Liquidus 1160 ± 15 K 1161
0.802
Stability limit of Na[U2F9] 933 ± 5 K 936
Eutectic 946 ± 5 K 952
Liquidus 1231 ± 15 K 1230
0.901Eutectic 948 ± 5 K 952
Liquidus 1273 ± 5 K 1275

Thermo 2021, 1 240
Table 4. Experimental phase equilibria and temperatures obtained by DSC in the KF-UF4 system and the calculatedtransition temperatures at these compositions for comparison.
x (UF4)/mol% Type of EquilibriaTemperature/K
Experiment Calculation
0.050Eutectic 989 ± 5 K 988
Liquidus 1103 ± 5 K 1102
0.100Eutectic 992 ± 5 K 988
Liquidus 1066 ± 5 K 1045
0.150Eutectic 993 ± 5 K 988
Liquidus 1018 ± 5 K 1045
0.200Eutectic 992 ± 5 K 988
Liquidus 1170 ± 5 K 1172
0.250 Congruent melting 1218 ± 5 K 1217
0.300
Formation of K2[UF6] 704 ± 15 K 702
α–β transition of K2[UF6] 854 ± 5 K 855
Peritectic 1016 ± 5 K 1028
Liquidus 1188 ± 5 K 1181
0.333 *
Formation of K2[UF6] 700 ± 15 K 702
α–β transition of K2[UF6] 855 ± 5 K 855
Peritectic 1026 ± 5 K 1028
0.385
Formation of K2[UF6] 705 ± 15 K 702
α–β transition of K2[UF6] 882 ± 5 K 855
Eutectic 1013 ± 5 K 1026
Liquidus 1039 ± 5 K 1038
0.400
Formation of K2[UF6] 701 ± 15 K 702
α–β transition of K2[UF6] 854 ± 5 K 855
Eutectic 998 ± 5 K 1026
Liquidus 1050 ± 5 K 1049
0.430
Formation of K2[UF6] 706 ± 15 K 702
α–β transition of K2[UF6] 881 ± 5 K 855
Eutectic 1002 ± 5 K 1026
Liquidus 1062 ± 5 K 1062
0.462 Melting of K7[U6F31] 1056 ± 5 K 1068
0.500Eutectic 995 ± 5 K 1019
Liquidus 1047 ± 15 K 1062
0.545Eutectic 1016 ± 5 K 1019
Liquidus 1049 ± 15 K 1040
0.573 Eutectic 1018 ± 5 K 1019
0.603Eutectic 1005 ± 5 K 1019
Liquidus 1033 ± 15 K 1028
0.667
Eutectic 1014 ± 5 K 1019
Peritectic 1032 ± 5 K 1039
Liquidus 1076 ± 15 K 1065
Thermo 2021, 1 241
Table 4. Cont.
x (UF4)/mol% Type of EquilibriaTemperature/K
Experiment Calculation
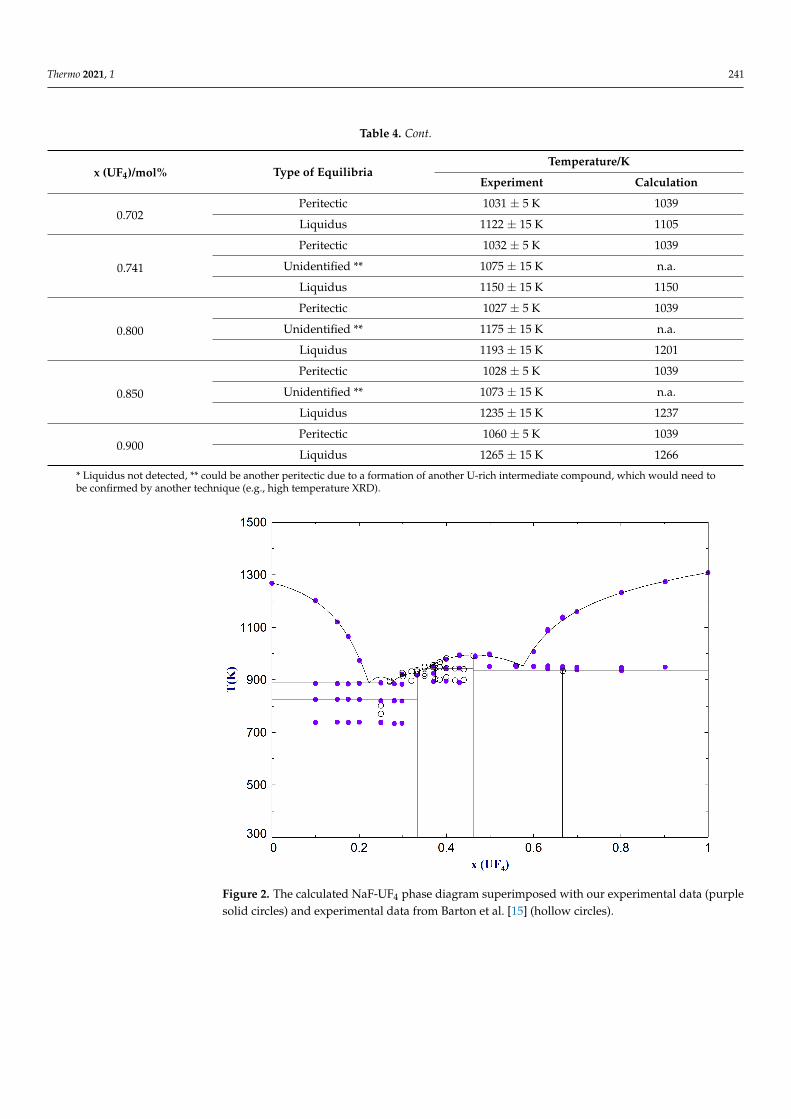
0.702Peritectic 1031 ± 5 K 1039
Liquidus 1122 ± 15 K 1105
0.741
Peritectic 1032 ± 5 K 1039
Unidentified ** 1075 ± 15 K n.a.
Liquidus 1150 ± 15 K 1150
0.800
Peritectic 1027 ± 5 K 1039
Unidentified ** 1175 ± 15 K n.a.
Liquidus 1193 ± 15 K 1201
0.850
Peritectic 1028 ± 5 K 1039
Unidentified ** 1073 ± 15 K n.a.
Liquidus 1235 ± 15 K 1237
0.900Peritectic 1060 ± 5 K 1039
Liquidus 1265 ± 15 K 1266
* Liquidus not detected, ** could be another peritectic due to a formation of another U-rich intermediate compound, which would need tobe confirmed by another technique (e.g., high temperature XRD).
Thermo 2021, 1, FOR PEER REVIEW 10
0.523 0.187 0.290 834 ± 15 832 0.549 0.171 0.280 845 ± 15 835 0.572 0.157 0.271 834 ± 15 836 0.601 0.136 0.263 842 ± 15 834 0.633 0.121 0.246 863 ± 15 832
4.3. Phase Diagram Assessments of the NaF-UF4 and KF-UF4 Systems Using the experimental equilibrium data obtained in this study and the data from the
literature [15,16], the pseudo-binary NaF-UF4 and KF-UF4 phase diagrams were thermo-dynamically assessed. They are presented in Figures 2 and 3, respectively. Overall, our experimental data agree well with most of the data presented in the literature, only a slight discrepancy was found for the equilibrium related to the formation of the K2UF6 com-pound. We decided to use our obtained data for the modelling of the KF-UF4 system but to verify this decision, independent measurement of different research group would be useful.
Good agreement between the measured experimental data (purple solid circles in the figures) and the model is evident, indicating a maximum discrepancy of about 15 K on the liquidus, but with most of the liquidus points within the ±5 K range.
The NaF-UF4 system is characterised by 3 eutectic points and 2 peritectic points. The lowest eutectic is at a temperature of T = 888 K and a composition of about X(UF4) = 22.2 mol%. The other two eutectic points are found at T = 894 K with X(UF4) = 27.6 mol% and T = 952 K with X(UF4) = 57.6 mol%. In total, 5 intermediate phases stabilise in the system. Na7[U6F31] and the high temperature phase Na3[UF7] melt congruently at T = 995 K and T = 910 K, respectively. Na2[UF6] and the second high temperature phase Na5[U3F17] exhibit peritectic melting at T = 926 K and T = 943 K, respectively. Na[U2F9] decomposes into UF4 and Na7[U6F31] at 936 K.
Figure 2. The calculated NaF-UF4 phase diagram superimposed with our experimental data (pur-ple solid circles) and experimental data from Barton et al. [15] (hollow circles). Figure 2. The calculated NaF-UF4 phase diagram superimposed with our experimental data (purplesolid circles) and experimental data from Barton et al. [15] (hollow circles).

Thermo 2021, 1 242
Thermo 2021, 1, FOR PEER REVIEW 11
Figure 3. The calculated KF-UF4 phase diagram superimposed with our experimental data (purple solid circles) and experimental data from Thoma et al. [16] (hollow circles).
In the KF-UF4 system, three eutectic and two peritectic points were identified. The lowest eutectic was found at T = 988 K with X(UF4)= 13.2 mol%, while the other eutectic points were calculated at T = 1026 K with X(UF4)= 37.4 mol% and T = 1019 K with X(UF4) = 57.7 mol%. Of four total intermediate compounds, K3[UF6] and K7[U6F31] show congruent melting points at T = 1217 K and T = 1068 K, respectively. The high temperature stoichio-metric phase K2[UF6] decomposes at the peritectic point at 1028 K. The second peritectic point is at 1039 K where K[U2F9] decomposes into UF4 and liquid.
All calculated pseudo-binary phase equilibria of the NaF-UF4 and KF-UF4 systems and their exact compositions are summarised in Tables 6 and 7, respectively.
Table 6. Invariant equilibria obtained from the calculated NaF-UF4 phase diagram.
X(UF4) Temperature Equilibrium 22.2 888 K Eutectic 25.0 738 K Na3UF7 formation 25.0 823 K α–β transition 25.0 910 K Congruent melting 27.6 894 K Eutectic 32.6 926 K Peritectic 35.4 943 K Peritectic 37.5 891 K Na5U3F17 formation 46.2 995 K Congruent melting 57.6 952 K Eutectic 66.7 936 K NaU2F9 decomposition
Figure 3. The calculated KF-UF4 phase diagram superimposed with our experimental data (purplesolid circles) and experimental data from Thoma et al. [16] (hollow circles).
4.2. Phase Equilibria Determination of the Pseudo-Ternary NaF-KF-UF4 Mixtures
Twelve pseudo-ternary compositions were measured with DSC to evaluate the liq-uidus behaviour of the NaF-KF-UF4 system. The obtained data of the liquidus points ofall measured compositions are reported in Table 5 and graphically represented in Figure 4.Similar to the two studied pseudo-binary systems the calculated temperatures based onour thermodynamic assessment are provided for comparison. Although other types ofequilibria (other than the here presented liquidus equilibria) were detected during DSCmeasurements, additional complementary analyses would be required to clearly identifythe type of equilibria. The confirmation of the nature of the invariant equilibria for most ofthe measured transitions was identified for potential future work. As this study focuses onthe melting point behaviour of the pseudo-ternary system, which is of great importance forthe MSR systems, the obtained experimental data on the liquidus behaviour provides theright benchmark. Only for one selected composition (close to the suggested lowest pseudo-ternary eutectic point) all equilibria were investigated to clarify the solidus temperature.More details are given in the discussion section.
Table 5. Experimentally determined liquidus equilibria of the NaF-KF-UF4 pseudo-ternary systemobtained by DSC and calculated liquidus temperatures at these compositions for comparison.
X (NaF) X (KF) X (UF4)Tliquidus/K
Experiment Calculation
0.453 0.100 0.448 971 ± 15 950
0.101 0.450 0.449 1026 ± 15 1027
0.200 0.400 0.400 1025 ± 15 982
0.497 0.279 0.224 906 ± 15 846
0.450 0.450 0.100 1051 ± 15 1048
Thermo 2021, 1 243
Table 5. Cont.
X (NaF) X (KF) X (UF4)Tliquidus/K
Experiment Calculation
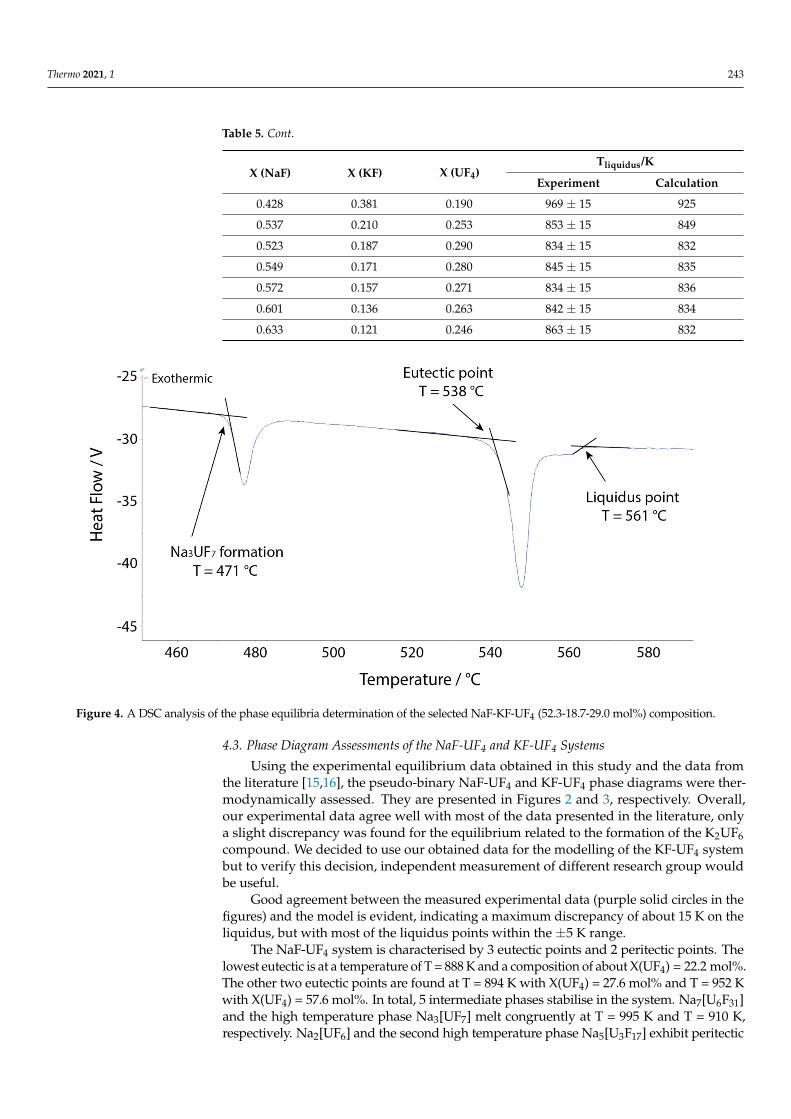
0.428 0.381 0.190 969 ± 15 925
0.537 0.210 0.253 853 ± 15 849
0.523 0.187 0.290 834 ± 15 832
0.549 0.171 0.280 845 ± 15 835
0.572 0.157 0.271 834 ± 15 836
0.601 0.136 0.263 842 ± 15 834
0.633 0.121 0.246 863 ± 15 832
Thermo 2021, 1, FOR PEER REVIEW 12
Table 7. Invariant equilibria obtained from the calculated KF-UF4 phase diagram.
X(UF4) Temperature Equilibrium 13.2 988 K Eutectic 25 1217 K Congruent melting
33.3 702 K K2UF6 formation 33.3 855 K α–β transition 37.1 1028 K Peritectic 37.4 1026 K Eutectic 46.2 1068 K Congruent melting 57.7 1019 K Eutectic 64.9 1039 K Peritectic
4.4. Phase Diagram Assessment of the NaF-KF-UF4 System The pseudo-ternary NaF-KF-UF4 system was thermodynamically assessed based on
the thermodynamic assessments of the pseudo-binary sub-systems (NaF-KF, NaF-UF4, and KF-UF4) and the experimental data measured in this study. The liquidus projection, together with the indicated measured data, is shown in Figure 5.
The calculated pseudo-ternary phase diagram contains 13 invariant equilibria and 13 phase fields of primary crystallisation. Two pseudo-ternary intermediate solid phases sta-bilise in the pseudo-ternary field; the equi-molar NaKUF4 phase and the Na2KUF7 phase. The latter phase was revealed by a XRD analysis performed in the current study.
The calculated lowest pseudo-ternary eutectic was found at 807 K and NaF-KF-UF4 (68.9-7.6-23.5 mol%) composition. The temperature is in good agreement with the experi-mentally determined eutectic temperature of 811 K, illustrated below in Figure 4. Alt-hough the shown example does not represent the exact composition of the eutectic point, the eutectic temperature corresponds to the onset point of the melting peak of the heat flow signal.
Figure 4. A DSC analysis of the phase equilibria determination of the selected NaF-KF-UF4 (52.3-18.7-29.0 mol%) compo-sition.
All calculated pseudo-ternary invariant equilibria are given in Table 8, while the pri-mary crystallisation phases are listed in the caption of Figure 5.
Figure 4. A DSC analysis of the phase equilibria determination of the selected NaF-KF-UF4 (52.3-18.7-29.0 mol%) composition.
4.3. Phase Diagram Assessments of the NaF-UF4 and KF-UF4 Systems
Using the experimental equilibrium data obtained in this study and the data fromthe literature [15,16], the pseudo-binary NaF-UF4 and KF-UF4 phase diagrams were ther-modynamically assessed. They are presented in Figures 2 and 3, respectively. Overall,our experimental data agree well with most of the data presented in the literature, onlya slight discrepancy was found for the equilibrium related to the formation of the K2UF6compound. We decided to use our obtained data for the modelling of the KF-UF4 systembut to verify this decision, independent measurement of different research group wouldbe useful.
Good agreement between the measured experimental data (purple solid circles in thefigures) and the model is evident, indicating a maximum discrepancy of about 15 K on theliquidus, but with most of the liquidus points within the ±5 K range.
The NaF-UF4 system is characterised by 3 eutectic points and 2 peritectic points. Thelowest eutectic is at a temperature of T = 888 K and a composition of about X(UF4) = 22.2 mol%.The other two eutectic points are found at T = 894 K with X(UF4) = 27.6 mol% and T = 952 Kwith X(UF4) = 57.6 mol%. In total, 5 intermediate phases stabilise in the system. Na7[U6F31]and the high temperature phase Na3[UF7] melt congruently at T = 995 K and T = 910 K,respectively. Na2[UF6] and the second high temperature phase Na5[U3F17] exhibit peritectic
Thermo 2021, 1 244
melting at T = 926 K and T = 943 K, respectively. Na[U2F9] decomposes into UF4 andNa7[U6F31] at 936 K.
In the KF-UF4 system, three eutectic and two peritectic points were identified. Thelowest eutectic was found at T = 988 K with X(UF4)= 13.2 mol%, while the other eutec-tic points were calculated at T = 1026 K with X(UF4)= 37.4 mol% and T = 1019 K withX(UF4) = 57.7 mol%. Of four total intermediate compounds, K3[UF6] and K7[U6F31] showcongruent melting points at T = 1217 K and T = 1068 K, respectively. The high temperaturestoichiometric phase K2[UF6] decomposes at the peritectic point at 1028 K. The secondperitectic point is at 1039 K where K[U2F9] decomposes into UF4 and liquid.
All calculated pseudo-binary phase equilibria of the NaF-UF4 and KF-UF4 systemsand their exact compositions are summarised in Tables 6 and 7, respectively.
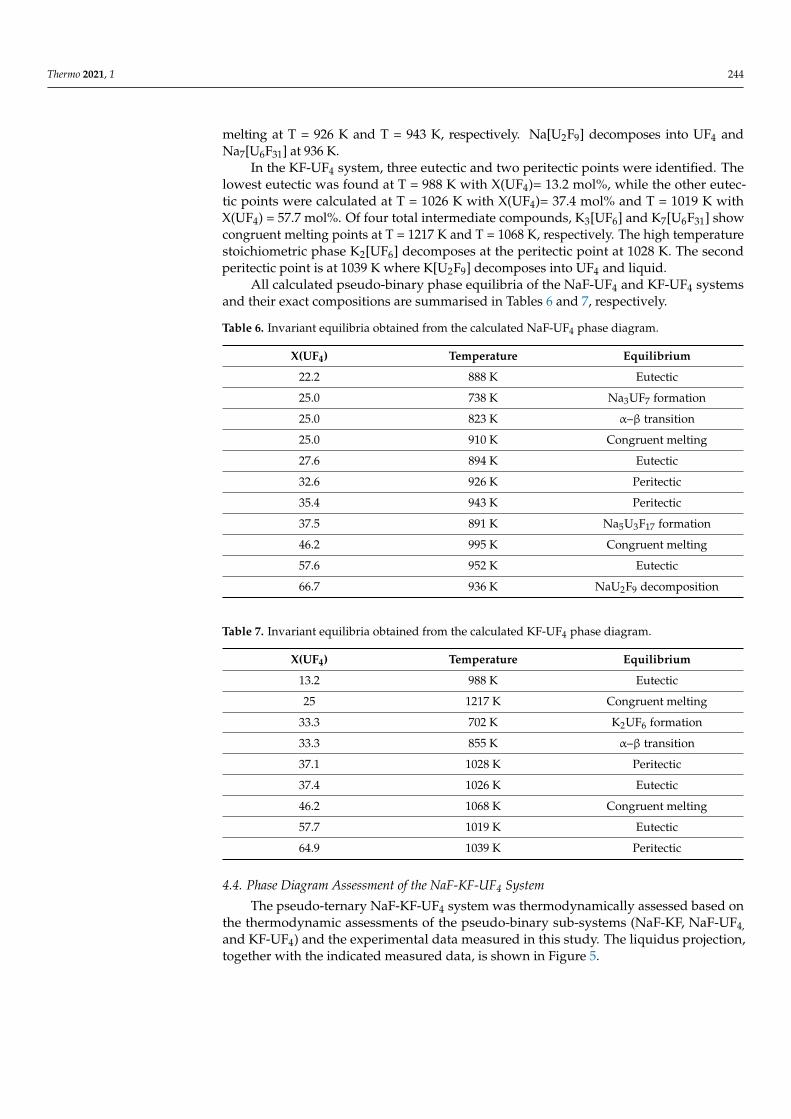
Table 6. Invariant equilibria obtained from the calculated NaF-UF4 phase diagram.
X(UF4) Temperature Equilibrium
22.2 888 K Eutectic
25.0 738 K Na3UF7 formation
25.0 823 K α–β transition
25.0 910 K Congruent melting
27.6 894 K Eutectic
32.6 926 K Peritectic
35.4 943 K Peritectic
37.5 891 K Na5U3F17 formation
46.2 995 K Congruent melting
57.6 952 K Eutectic
66.7 936 K NaU2F9 decomposition
Table 7. Invariant equilibria obtained from the calculated KF-UF4 phase diagram.
X(UF4) Temperature Equilibrium
13.2 988 K Eutectic
25 1217 K Congruent melting
33.3 702 K K2UF6 formation
33.3 855 K α–β transition
37.1 1028 K Peritectic
37.4 1026 K Eutectic
46.2 1068 K Congruent melting
57.7 1019 K Eutectic
64.9 1039 K Peritectic
4.4. Phase Diagram Assessment of the NaF-KF-UF4 System
The pseudo-ternary NaF-KF-UF4 system was thermodynamically assessed based onthe thermodynamic assessments of the pseudo-binary sub-systems (NaF-KF, NaF-UF4,and KF-UF4) and the experimental data measured in this study. The liquidus projection,together with the indicated measured data, is shown in Figure 5.

Thermo 2021, 1 245
Thermo 2021, 1, FOR PEER REVIEW 13
Table 8. Calculated invariant equilibria, temperatures, and compositions of the NaF-KF-UF4 system.
X (NaF) X (KF) X (UF4) T/K Equilibrium 32.6 11.1 56.3 898 Eutectic 30.4 18.8 50.8 893 Eutectic 21.8 66.0 12.2 893 Eutectic 60.0 6.5 33.5 891 Quasi-Peritectic 31.7 36.6 31.7 855 Quasi-Peritectic 50.4 27.5 22.1 841 Quasi-Peritectic 66.8 7.2 26.0 823 Peritectic 70.6 6.2 23.2 823 Quasi-Peritectic 36.8 32.2 31.0 820 Eutectic 66.0 8.2 25.8 810 Quasi-Peritectic 47.3 20.3 32.4 810 Quasi-Peritectic 45.0 22.2 32.8 808 Eutectic 69.0 7.5 23.5 807 Eutectic
Figure 5. The calculated liquidus projection of the NaF-KF-UF4 system. Isotherms are calculated in K with intervals of 20 K. The solid circles represent measured compositions and their determined liquidus temperature can be found in Table 5. The calculated primary crystallisation phase fields: (1) UF4; (2) U2KF9; (3) Na7U6F31; (4) K7U6F31; (5) K3UF7; (6) KF_s.s.; (7) NaF_s.s.; (8) Na2KUF7; (9) Na2UF6; (10) Na5U3F17; (11) α-Na3UF7; (12) β- Na3UF7; (13) K2UF6.
Figure 5. The calculated liquidus projection of the NaF-KF-UF4 system. Isotherms are calculated inK with intervals of 20 K. The solid circles represent measured compositions and their determinedliquidus temperature can be found in Table 5. The calculated primary crystallisation phase fields:(1) UF4; (2) U2KF9; (3) Na7U6F31; (4) K7U6F31; (5) K3UF7; (6) KF_s.s.; (7) NaF_s.s.; (8) Na2KUF7;(9) Na2UF6; (10) Na5U3F17; (11) α-Na3UF7; (12) β- Na3UF7; (13) K2UF6.
The calculated pseudo-ternary phase diagram contains 13 invariant equilibria and13 phase fields of primary crystallisation. Two pseudo-ternary intermediate solid phasesstabilise in the pseudo-ternary field; the equi-molar NaKUF4 phase and the Na2KUF7phase. The latter phase was revealed by a XRD analysis performed in the current study.
The calculated lowest pseudo-ternary eutectic was found at 807 K and NaF-KF-UF4(68.9-7.6-23.5 mol%) composition. The temperature is in good agreement with the ex-perimentally determined eutectic temperature of 811 K, illustrated below in Figure 4.Although the shown example does not represent the exact composition of the eutecticpoint, the eutectic temperature corresponds to the onset point of the melting peak of theheat flow signal.
All calculated pseudo-ternary invariant equilibria are given in Table 8, while theprimary crystallisation phases are listed in the caption of Figure 5.
Table 8. Calculated invariant equilibria, temperatures, and compositions of the NaF-KF-UF4 system.
X (NaF) X (KF) X (UF4) T/K Equilibrium
32.6 11.1 56.3 898 Eutectic
30.4 18.8 50.8 893 Eutectic
21.8 66.0 12.2 893 Eutectic
60.0 6.5 33.5 891 Quasi-Peritectic

Thermo 2021, 1 246
Table 8. Cont.
X (NaF) X (KF) X (UF4) T/K Equilibrium
31.7 36.6 31.7 855 Quasi-Peritectic
50.4 27.5 22.1 841 Quasi-Peritectic
66.8 7.2 26.0 823 Peritectic
70.6 6.2 23.2 823 Quasi-Peritectic
36.8 32.2 31.0 820 Eutectic
66.0 8.2 25.8 810 Quasi-Peritectic
47.3 20.3 32.4 810 Quasi-Peritectic
45.0 22.2 32.8 808 Eutectic
69.0 7.5 23.5 807 Eutectic
5. Discussion
The experimental re-investigation and thermodynamic modelling of the pseudo-binary NaF-UF4 and KF-UF4 systems provided the basis for extrapolation to the NaF-KF-UF4 system. Only small ternary excess Gibbs parameters of the liquid solution were usedfor the thermodynamic assessment. The calculated liquidus projection was correlated with12 experimentally measured data points (highlighted in Figure 5), which were further usedfor the optimisation of the pseudo-ternary system. The direct comparison of experimentaland calculated liquidus temperatures is shown in Table 5. It is clear that seven pointsagree within a 10 K discrepancy, four points are within 45 K error, and one point has adiscrepancy of 60 K. When the point with the highest discrepancy is plotted against theliquidus projection of the phase diagram, it is revealed that it belongs to a phase fieldwith a steep liquidus increase. Hence, the composition margin for both experimentaland modelling results can likely be the main cause. In this region, a small change ofcomposition has significant impact on the melting temperature. With this note, we concludethat the preliminary assessed pseudo-ternary system provides a good estimate on theliquidus propagation.
Although fairly good general agreement between the calculated phase diagram andthe measured data has been achieved, still a few items were identified for potential futureinvestigations. First of all, as already mentioned in Section 3, we had no experimentalevidence for the solid solution behaviour in the pseudo-ternary field, and therefore it wasnot considered in the current assessment. The presence of a solid solution might affect theliquidus surface of the pseudo-ternary field. More experimental data of the solid solutionand its composition extension, with a primary focus on the phase analysis, is needed andwe suggest this as a possible topic for future studies.
The same is true for the definition of stability limits of the pseudo-ternary intermediatecompounds. Thoma et al. suggested that the NaKUF6 intermediate compound was stable,but not many details are available on its stability range [17]. The phase diagram suggestedby Thoma et al. [17] indicates a sub-liquidus stability limit (i.e., no congruent melting wasobserved); however the exact range is unknown. In the current study, we followed thesesuggestions and with novel experimental data measured in this study, we optimised thethermodynamic data of this intermediate compound leading to a stability limit of 714 K.Similarly to the solid solution, the need for more data on stability of this phase (or itspresence) is suggested for future investigations.
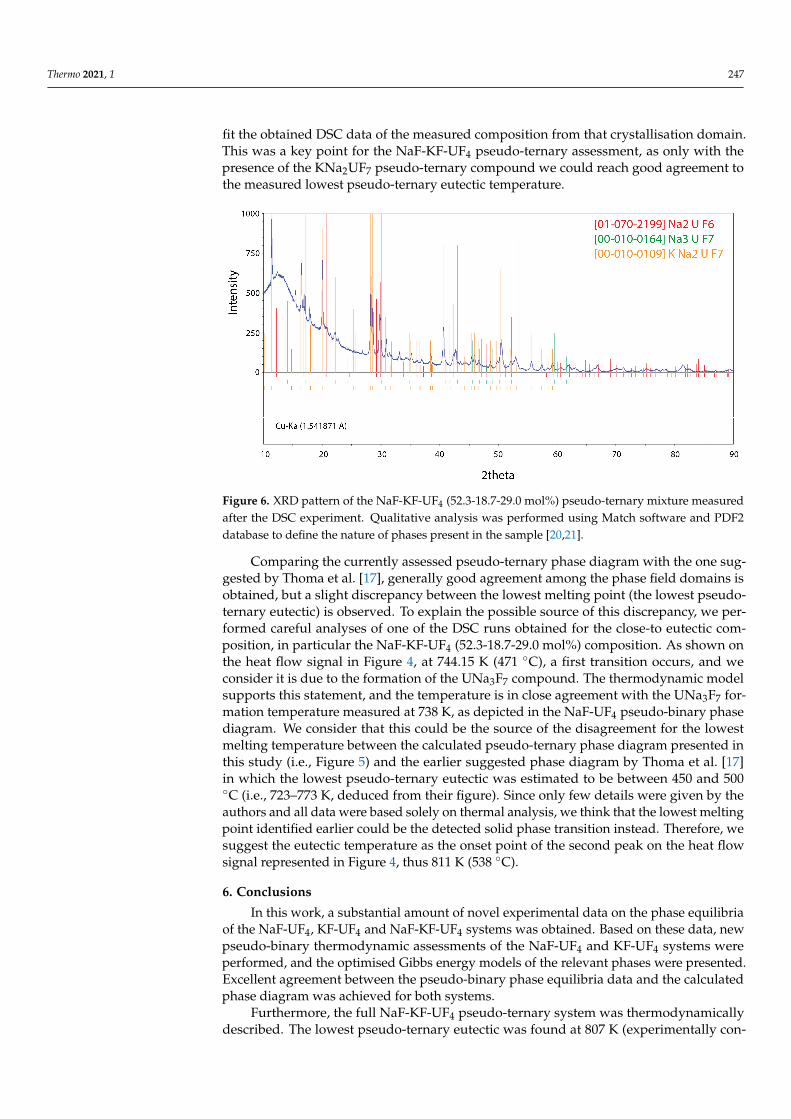
Furthermore, we performed XRD phase analyses of one selected composition from themid-range region (namely the NaF-KF-UF4 (52.3-18.7-29.0 mol%) mixture) using a samplethat has been analysed by DSC earlier and cooled down to room temperature. The obtaineddiffractogram is shown in Figure 6 and clearly indicates ternary equilibrium betweenNa2UF6, Na3UF7 and KNa2UF7. We took the evidence of the presence of the KNa2UF7pseudo-ternary phase into consideration and optimised its thermodynamic parameters to
Thermo 2021, 1 247
fit the obtained DSC data of the measured composition from that crystallisation domain.This was a key point for the NaF-KF-UF4 pseudo-ternary assessment, as only with thepresence of the KNa2UF7 pseudo-ternary compound we could reach good agreement tothe measured lowest pseudo-ternary eutectic temperature.
Thermo 2021, 1, FOR PEER REVIEW 15
We consider that this could be the source of the disagreement for the lowest melting tem-perature between the calculated pseudo-ternary phase diagram presented in this study (i.e., Figure 5) and the earlier suggested phase diagram by Thoma et al. [17] in which the lowest pseudo-ternary eutectic was estimated to be between 450 and 500 °C (i.e., 723–773 K, deduced from their figure). Since only few details were given by the authors and all data were based solely on thermal analysis, we think that the lowest melting point iden-tified earlier could be the detected solid phase transition instead. Therefore, we suggest the eutectic temperature as the onset point of the second peak on the heat flow signal represented in Figure 4, thus 811 K (538 °C).
Figure 6. XRD pattern of the NaF-KF-UF4 (52.3-18.7-29.0 mol%) pseudo-ternary mixture measured after the DSC experi-ment. Qualitative analysis was performed using Match software and PDF2 database to define the nature of phases present in the sample [20,21].
6. Conclusions In this work, a substantial amount of novel experimental data on the phase equilibria
of the NaF-UF4, KF-UF4 and NaF-KF-UF4 systems was obtained. Based on these data, new pseudo-binary thermodynamic assessments of the NaF-UF4 and KF-UF4 systems were performed, and the optimised Gibbs energy models of the relevant phases were pre-sented. Excellent agreement between the pseudo-binary phase equilibria data and the cal-culated phase diagram was achieved for both systems.
Furthermore, the full NaF-KF-UF4 pseudo-ternary system was thermodynamically described. The lowest pseudo-ternary eutectic was found at 807 K (experimentally con-firmed at 811 ± 5 K). Although we could not experimentally identify the exact lowest eu-tectic composition, the thermodynamic assessment points towards a composition of 68.9-7.6-23.5 mol% NaF-KF-UF4. This temperature is fairly low, thus NaF and KF might serve as alternative components to LiF. Further research on this particular system is recom-mended to confirm the composition of the lowest eutectic point and to fully determine the stability range of pseudo-ternary solid solutions and pseudo-ternary intermediate phases.
With the few identified issues left for further research, the thermodynamic assess-ment of the full NaF-KF-UF4 system presented in this study is a valuable contribution for further extension of the JRCMSD thermodynamic database. It describes well most of the phase field regions and provides a detailed experimental investigation of the surrounding region of the lowest melting point. The JRCMSD thermodynamic database, with this ex-tension, can serve, e.g., nuclear regulators for their thermodynamic properties predictions
Figure 6. XRD pattern of the NaF-KF-UF4 (52.3-18.7-29.0 mol%) pseudo-ternary mixture measuredafter the DSC experiment. Qualitative analysis was performed using Match software and PDF2database to define the nature of phases present in the sample [20,21].
Comparing the currently assessed pseudo-ternary phase diagram with the one sug-gested by Thoma et al. [17], generally good agreement among the phase field domains isobtained, but a slight discrepancy between the lowest melting point (the lowest pseudo-ternary eutectic) is observed. To explain the possible source of this discrepancy, we per-formed careful analyses of one of the DSC runs obtained for the close-to eutectic com-position, in particular the NaF-KF-UF4 (52.3-18.7-29.0 mol%) composition. As shown onthe heat flow signal in Figure 4, at 744.15 K (471 ◦C), a first transition occurs, and weconsider it is due to the formation of the UNa3F7 compound. The thermodynamic modelsupports this statement, and the temperature is in close agreement with the UNa3F7 for-mation temperature measured at 738 K, as depicted in the NaF-UF4 pseudo-binary phasediagram. We consider that this could be the source of the disagreement for the lowestmelting temperature between the calculated pseudo-ternary phase diagram presented inthis study (i.e., Figure 5) and the earlier suggested phase diagram by Thoma et al. [17]in which the lowest pseudo-ternary eutectic was estimated to be between 450 and 500◦C (i.e., 723–773 K, deduced from their figure). Since only few details were given by theauthors and all data were based solely on thermal analysis, we think that the lowest meltingpoint identified earlier could be the detected solid phase transition instead. Therefore, wesuggest the eutectic temperature as the onset point of the second peak on the heat flowsignal represented in Figure 4, thus 811 K (538 ◦C).
6. Conclusions
In this work, a substantial amount of novel experimental data on the phase equilibriaof the NaF-UF4, KF-UF4 and NaF-KF-UF4 systems was obtained. Based on these data, newpseudo-binary thermodynamic assessments of the NaF-UF4 and KF-UF4 systems wereperformed, and the optimised Gibbs energy models of the relevant phases were presented.Excellent agreement between the pseudo-binary phase equilibria data and the calculatedphase diagram was achieved for both systems.
Furthermore, the full NaF-KF-UF4 pseudo-ternary system was thermodynamicallydescribed. The lowest pseudo-ternary eutectic was found at 807 K (experimentally con-

Thermo 2021, 1 248
firmed at 811 ± 5 K). Although we could not experimentally identify the exact lowesteutectic composition, the thermodynamic assessment points towards a composition of68.9-7.6-23.5 mol% NaF-KF-UF4. This temperature is fairly low, thus NaF and KF mightserve as alternative components to LiF. Further research on this particular system is recom-mended to confirm the composition of the lowest eutectic point and to fully determine thestability range of pseudo-ternary solid solutions and pseudo-ternary intermediate phases.
With the few identified issues left for further research, the thermodynamic assessmentof the full NaF-KF-UF4 system presented in this study is a valuable contribution for furtherextension of the JRCMSD thermodynamic database. It describes well most of the phase fieldregions and provides a detailed experimental investigation of the surrounding region ofthe lowest melting point. The JRCMSD thermodynamic database, with this extension, canserve, e.g., nuclear regulators for their thermodynamic properties predictions needed forsafety assessments. At the same time, it may be consulted by companies developing moltensalt reactor technologies for the fuel composition optimisation of their multi-componentfuel mixture.
Author Contributions: Conceptualization, O.B.; methodology, O.B.; validation, B.S., O.B. andR.E.; formal analysis, B.S. and O.B..; investigation, B.S., O.B. and R.E.; resources, O.B., R.E. andR.J.M.K.; data curation, B.S., O.B. and R.E.; writing—original draft preparation, B.S. writing—reviewand editing, O.B. and R.J.M.K.; visualization, B.S. and O.B.; supervision, O.B.; project administra-tion O.B.; funding acquisition, O.B. All authors have read and agreed to the published version ofthe manuscript.
Funding: This research received no external funding.
Data Availability Statement: Not applicable.
Acknowledgments: B.S. would like to thank the EU program for Training and Mobility for thefunding of her traineeship.
Conflicts of Interest: The authors declare no conflict of interest. The funders had no role in the designof the study; in the collection, analyses, or interpretation of data; in the writing of the manuscript, orin the decision to publish the results.
Appendix A
Thermo 2021, 1, FOR PEER REVIEW 16
needed for safety assessments. At the same time, it may be consulted by companies de-veloping molten salt reactor technologies for the fuel composition optimisation of their multi-component fuel mixture.
Author Contributions: Conceptualization, O.B.; methodology, O.B.; validation, B.S., O.B. and R.E.; formal analysis, B.S. and O.B..; investigation, B.S., O.B. and R.E.; resources, O.B., R.E. and R.J.M.K.; data curation, B.S., O.B. and R.E.; writing—original draft preparation, B.S. writing—review and ed-iting, O.B. and R.J.M.K.; visualization, B.S. and O.B.; supervision, O.B.; project administration O.B.; funding acquisition, O.B. All authors have read and agreed to the published version of the manu-script.
Funding: B.S. would like to thank the EU program for Training and Mobility for the funding of her traineeship.
Data Availability Statement: Not applicable.
Acknowledgments: B.S. would like to thank the EU program for Training and Mobility for the funding of her traineeship.
Conflicts of Interest: The authors declare no conflict of interest. The funders had no role in the design of the study; in the collection, analyses, or interpretation of data; in the writing of the manu-script, or in the decision to publish the results.
Appendix A
Figure A1. Experimental DSC signal of a representative heating cycle of a NaF-UF4 sample with X(UF4) = 10mol%. The four equilibria are at 737 ± 5 K formation of Na3[UF7], at 825 ± 5 K α – β transition of Na3[UF7], at 887 ± 5 K eutectic equilibrium and at 1201 ± 15 K liquidus point.
Table A1. Intermediate NaF-UF4 compositions subjected to DSC measurements within this study.
Nr. X (UF4)/mol Fraction m (Mixture)/mg Nr. X (UF4)/mol Fraction m (Mixture)/mg 1 0.100 115.4 ± 0.2 11 0.430 110.3 ± 0.2 2 0.150 111.9 ± 0.2 12 0.466 112.6 ± 0.2 3 0.175 110.7 ± 0.2 13 0.499 106.8 ± 0.2 4 0.201 114.3 ± 0.2 14 0.559 110.3 ± 0.2 5 0.250 107.2 ± 0.2 15 0.601 105.8 ± 0.2
-260
-210
-160
-110
-60
300
400
500
600
700
800
900
1000
2600 3100 3600 4100 4600 5100 5600 6100
Heat
Flow
[µV]
Tem
pera
ture
[°C]
Time [s]
Figure A1. Experimental DSC signal of a representative heating cycle of a NaF-UF4 sample withX(UF4) = 10mol%. The four equilibria are at 737 ± 5 K formation of Na3[UF7], at 825 ± 5 K α – β
transition of Na3[UF7], at 887 ± 5 K eutectic equilibrium and at 1201 ± 15 K liquidus point.

Thermo 2021, 1 249
Table 1. Intermediate NaF-UF4 compositions subjected to DSC measurements within this study.
Nr. X (UF4)/mol Fraction m (Mixture)/mg Nr. X (UF4)/mol Fraction m (Mixture)/mg
1 0.100 115.4 ± 0.2 11 0.430 110.3 ± 0.2
2 0.150 111.9 ± 0.2 12 0.466 112.6 ± 0.2
3 0.175 110.7 ± 0.2 13 0.499 106.8 ± 0.2
4 0.201 114.3 ± 0.2 14 0.559 110.3 ± 0.2
5 0.250 107.2 ± 0.2 15 0.601 105.8 ± 0.2
6 0.280 108.1 ± 0.2 16 0.633 111.9 ± 0.2
7 0.299 113.6 ± 0.2 17 0.667 115.2 ± 0.2
8 0.333 110.2 ± 0.2 18 0.700 103.4 ± 0.2
9 0.371 101.7 ± 0.2 19 0.802 109.1 ± 0.2
10 0.400 103.6 ± 0.2 20 0.901 101.7 ± 0.2
Table 2. Intermediate KF-UF4 compositions subjected to DSC measurements within in this study.
Nr. X (UF4)/mol Fraction m (Mixture)/mg Nr. X (UF4)/mol Fraction m (Mixture)/mg
1 0.050 114.4 ± 0.2 12 0.500 104.6 ± 0.2
2 0.100 108.9 ± 0.2 13 0.545 99.7 ± 0.2
3 0.150 115.1 ± 0.2 14 0.573 107.4 ± 0.2
4 0.200 107.5 ± 0.2 15 0.603 108.0 ± 0.2
5 0.250 106.5 ± 0.2 16 0.667 108.3 ± 0.2
6 0.300 103.6 ± 0.2 17 0.702 97.9 ± 0.2
7 0.333 109.7 ± 0.2 18 0.741 108.9 ± 0.2
8 0.385 111.4 ± 0.2 19 0.800 101.6 ± 0.2
9 0.400 106.2 ± 0.2 20 0.850 104.1 ± 0.2
10 0.430 107.1 ± 0.2 21 0.900 112.7 ± 0.2
11 0.462 103.9 ± 0.2
References1. Serp, J.; Allibert, M.; Beneš, O.; Delpech, S.; Feynberg, O.; Ghetta, V.; Heuer, D.; Holcomb, D.; Ignatiev, V.; Kloosterman, J.L.; et al.
The molten salt reactor (MSR) in generation IV: Overview and perspectives. Prog. Nucl. Energy 2014, 77, 308–319. [CrossRef]2. Beneš, O.; E-Merle-Lucotte; Capelli, E.; Allibert, M.; Brovchenko, M.; Heuer, D.; Konings, R.J.M.; Delpech, S. Deliverable D3.7
Selection of the MSFR Fuel Salt Composition: Evaluation and Viability of Liquid Fuel Fast Reactor System (EVOL); Joint Research Centerof the European Commission Karlsruhe: Karlsruhe, Germany, 2013.
3. Robertson, R.C. MSRE Desing and operation Report Part 1: Description of reactor Desing; ORNL-TM 728; Oak Ridge NationalLaboratory: Oak Ridge, TN, USA, 1965.
4. Allibert, M.; Aufiero, M.; Brovchenko, M.; Delpech, S.; Ghetta, V.; Heuer, D.; Laureau, A.; Merle-Lucotte, E. Molten salt fastreactors. In Handbook of Generation IV Nuclear Reactor; Woodhead Publishing: Sawston, UK, 2016; pp. 157–188. [CrossRef]
5. Ignatiev, V.V.; Feynberg, O.S.; Zagnitko, A.V.; Merzlyakov, A.V.; Surenkov, A.I.; Panov, A.V.; Subbotin, V.G.; Afonichkin, V.K.;Khokhlov, V.A.; Kormilitsyn, M.V. Molten-salt reactors: New possibilities, problems and solutions articles. At. Energy 2012,112, 157–165. [CrossRef]
6. JRCMSD. Thermodynamic Database on Molten Salt Reactor Systems; European Commission, Joint Research Centre: Karlsruhe,Germany, 2021.
7. Grimes, W.R.; Cuneo, D.R.; Blankenship, F.F.; Keilholtz, G.W.; Poppendick, H.F.; Robinson, M.T. Chemical aspects of molten-fluoride-salt reactor fuels. In Fluid Fuel Reactors; Addison-Wesley Publishing Company, Inc.: Reading, MA, USA, 1958;pp. 569–594.
8. Williams, D.F. Assessment of Candidate Molten Salt Coolants for the NGNP/NHI Heat-Transfer Loop; ORNL/TM-2006/69; Oak RidgeNational Laboratory: Oak Ridge, TN, USA, 2006.
9. Cohen, S.I.; Powers, W.D.; Greene, N.D. A Physical Property Summary for ANP Fluoride Mixtures; ORNL-2150; Oak Ridge NationalLaboratory: Oak Ridge, TN, USA, 1952.

Thermo 2021, 1 250
10. Beneš, O.; Konings, R.J.M. Molten salt reactor fuel and coolant. In Comprehensive Nuclear Materials; Elsevier Science: Amsterdam,The Netherlands, 2012; pp. 359–389. [CrossRef]
11. Kurnakow, N.S.; Zmczuznyj, S.F. Isomorphismus der Kalium- und Natriumverbindungen, Zeitschrift Für Anorg. Chemie 1907,52, 186–201. [CrossRef]
12. Dombrovskaya, N.S.; Koloskova, Z.A. Double decomposition in the absence of a solvent. XXXVI. Irreversible reciprocal system ofsodium and potassium fluorides and bromides. Izv. Sekt. Fiz. Anal. 1938, 10, 28.
13. Holm, J.L. Phase relations in the systems NaF-LiF, NaF-KF, and NaF-RbF. Acta Chem. Scand. 1965, 19, 638–644. [CrossRef]14. Beneš, O.; Konings, R.J.M. Thermodynamic evaluation of the MF-LaF3 (M=Li, Na, K, Rb, Cs) systems. Calphad 2008, 32, 121–128.
[CrossRef]15. Barton, C.J.; Friedman, H.A.; Grimes, W.R.; Insley, H.; Moore, R.E.; Thoma, R.E. Phase equilibria in the alkali fluoride-uranium
tetrafluoride fused salt systems: I, The systems LiF-UF4 and NaF-UF4. J. Am. Ceram. Soc. 1958, 41, 63–69. [CrossRef]16. Thoma, R.E.; Insley, H.; Landau, B.S.; Friedman, H.A.; Grimes, W.R. Phase equilibria in the alkali fluoride-uranium tetrafluoride
fused salt systems: II, The systems KF-UF4 and RbF-UF4. J. Am. Ceram. Soc. 1958, 41, 538–544. [CrossRef]17. Thoma, R.E.; Barton, C.J.; Blakerly, J.P.; Moore, R.E.; Nessle, G.J.; Insley, H.; Friedman, H.A. The system NaF-KF-UF4. In Phase
Diagrams Nuclear Reactor Materials; ORNL-2548; Oak Ridge National Laboratory: Oak Ridge, TN, USA, 1959; p. 103.18. Soucek, P.; Beneš, O.; Claux, B.; Capelli, E.; Ougier, M.; Tyrpekl, V.; Vigier, J.-F.; Konings, R.J.M. Synthesis of UF4 and ThF4 by HF
gas fluorination and re-determination of the UF4 melting point. J. Fluor. Chem. 2017, 200, 33–40. [CrossRef]19. Chase, M.W., Jr. NIST-JANAF Thermochemical Tables, 4th ed.; American Institute of Physics: College Park, MD, USA, 1998.20. International Centre for Diffraction Data. PDF-2 Database. 2018. Available online: www.icdd.com (accessed on 16 August 2021).21. Putz, H.; Brandenburg, K. Match Software Version 1.11f, Crystal Impact GbR. 2011. Available online: https://www.crystalimpact.
de/match (accessed on 16 August 2021).22. Black, D.R.; Windover, D.; Henins, A.; Filliben, J.; Cline, J.P. Certification of standard reference material 660B. Powder Diffr. 2011,
26, 155–158. [CrossRef]23. Beneš, O.; Konings, R.J.M.; Wurzer, S.; Sierig, M.; Dockendorf, A. A DSC study of the NaNO3-KNO3 system using an innovative
encapsulation technique. Thermochim. Acta 2010, 509, 62–66. [CrossRef]24. Tosolin, A.; Soucek, P.; Beneš, O.; Vigier, J.-F.; Luzzi, L.; Konings, R.J.M. Synthesis of plutonium trifluoride by hydro-fluorination
and novel thermodynamic data for the PuF3-LiF system. J. Nucl. Mater. 2018, 503, 171–177. [CrossRef]25. Bale, C.W.; Bélisle, E.; Chartrand, P.; Decterov, S.A.; Eriksson, G.; Gheribi, A.E.; Hack, K.; Jung, I.H.; Kang, Y.B.; Melançon, J.; et al.
FactSage thermochemical software and databases, 2010–2016. Calphad 2016, 54, 35–53. [CrossRef]26. Konings, R.J.M.; van der Meer, J.P.M.; Walle, E. Chemical Aspects of Molten Salt Reactor Fuel; Techical Report; Institute for
Transuranium Elements (ITU): Karlsruhe, Germany, 2005.27. Konings, R.J.M.; Morss, L.R.; Fuger, J. Thermodynamic properties of actinides and actinide compounds. In The Chemistry of the
Actinide and Transactinide Elements; Morss, L.R., Edelstein, N.M., Fuger, J., Eds.; Springer: Dordrecht, The Netherlands, 2006;pp. 2113–2224. [CrossRef]
28. Pelton, A.D.; Chartrand, P.; Eriksson, G. The modified quasi-chemical model: Part IV. Two-sublattice quadruplet approximation.Metall. Mater. Trans. A Phys. Metall. Mater. Sci. 2001, 32, 1409–1416. [CrossRef]
29. Chartrand, P.; Pelton, A.D. The modified quasi-chemical model: Part III. Two sublattices. Metall. Mater. Trans. A Phys. Metall.Mater. Sci. 2001, 32, 1397–1407. [CrossRef]