
thermal scale modeling of the mariner IV spacecraft
174
thermal scale modeling of the mariner IV spacecraft GPO PRICE $ CFSTI PRICE(S) $ Hard copy (HC) Microfiche (MF) ff 653 July 65 ' // I \ 2[rthur/[I)!i.ttle,_nr.
-
Upload
khangminh22 -
Category
Documents
-
view
0 -
download
0
Transcript of thermal scale modeling of the mariner IV spacecraft

thermal scale modelingof the mariner IV spacecraft
GPO PRICE $
CFSTI PRICE(S) $
Hard copy (HC)
Microfiche (MF)
ff 653 July 65
' //
I
\
2[rthur/[I)!i.ttle,_nr.
RMAL SCALE MODELING OFMARINER IV SPACECRAFT ....
Fi_a J.2 a f
to
Jet Propulsion Laboratory
Contract 950789
Thls wd was performe_ for the Jet propulsion _,California Institute of Technology, sponsored by the
National Aeronautics and Space A_tration und_
Contract N A__7-1_,,
by
Frank Gabron
Robert W. Johnson
Arthur D. Little, Inc.
Cambridge, Massachusetts
A_ust 20, 1965
C-66326

Acknowledgments
During the design, fabrication and testing of the Thermal Scale
Model, it was necessary to obtain a large amount of information and
complete sets of drawings of Mariner IV from Jet Propulsion Laboratory.
Arthur D. Little, Inc., wishes to acknowledge the efforts of
Dr. J. M. F. Vickers and Dr. J. W. Lucas of Jet Propulsion Laboratory
in organizing and transmitting this data.
During the course of the program, Messrs. D. Lewis, L. Dumas and
D. Miller of Jet Propulsion Laboratory provided us valuable assistance
in interpreting the details of the drawings with respect to the thermal
behavior of the spacecraft.
The Phase III tests of the Thermal Scale Model were undertaken
in NASA Lewis Research Center Solar Simulator. The efforts of Dr.
Herman Mark, Mr. Ralph Sommers and other Lewis personnel who were re-
sponsible for the planning and execution of the tests are greatly
appreciated.
ii
_Irthttr/_._Little,_ttr.

Table of Contents
Acknowledgments
List of Tables
List of Figures
Introduction
Summary and Conclusions
PHASE II PROGRAM
A. Description of Phase II Model
I. Introduction
2. Scaling Procedures
3. Octagonal Bus Structure
4. Packaging Assembly
5. Scaling of Bolted Joints
6. Thermal Control Louvers
7. Post Injection Propulsion System
8. Insulation and Paint Treatments
B. Phase II Test Procedures
i. Description of Tests
2. Test Equipment and Measurements
C. Test Results
D. Discussion of Test Results
PHASE III PROGRAM
A. Description of Phase III Thermal Scale Model
io Introduction
2. Octagonal Bus
3. Magnetometer
4. Ion Chamber
5. Low-Gain Antenna
6. High-Gain Antenna
7. Cosmic Dust Detector
8. Sun Sensors
9. Trapped Radiation Detector
i0. Absorptivity Standard and Plasma Probe
ii
vi
viii
xi
I
4
6
8
II
16
2O
21
23
23
25
27
28
33
33
33
37
39
40
41
42
43
43
45
46
iii
_rthur _l._ittle,_.c.
Table of Contents (continued_
II. Insulation and Shielding 46
12. Solar Panels 48
13. Planetary Science 49
14. Canopus Tracker 49
15. Surface Finishes 50
B. Test Facility 51
C. Test Procedures 54
i. Description of Tests 54
2. Test Measurements 55
D. Test Results 58
E. Discussion of Temperature Predictions 61
i. Sunlit Appendages 61
2. Internal Bus Locations 62
3. Shaded Appendages 65
APPENDIX I - TSM POWER BREAKDOWN-PHASE II CONFIGURATION 91
APPENDIX II - JOINT CONDUCTANCE TEST RESULTS i00
APPENDIX III - TSM POWER BREAKDOWN-PHASE III CONFIGURATION 103
APPENDIX IV - CALCULATION OF ANTENNA HEAT LOSS ii0
APPENDIX V - TEMPERATURE CONTROL SURFACES SCIENCE & APPENDAGES 112
APPENDIX VI - ERROR ANALYSIS-SUNLIT APPENDAGES 114
APPENDIX VII - DISCUSSION OF CANOPUS TRACKER TESTS 117
iv
_rthur _l._ittle._Itr.
Table
7
8
9
i0
Ii
12
13
14
15
16
17
List of Tables
SUMMARY OF PHASE II TEST CONDITIONS 68
COMPARISON OF TEMPERATURE RESULTS--TEST i, PHASE II 69
COMPARISON OF TEMPERATURE RESULTS--TEST 2, PHASE II 70
COMPARISON OF TEMPERATURE RESULTS--TEST 3, PHASE II 71
COMPARISON OF AVERAGE BAY TEMPERATURES, PHASE II 72
COMPARISON OF TEMPERATURE DIFFERENCE ACROSS BOLTED 75
JOINTS--PHASE II
COMPARISON OF CHASSIS TEMPERATURE RESULTS--TEST i, PHASE II 76
COMPARISON OF TSM TEMPERATURES--TESTS 3 AND 3A, PHASE II 77
COMPARISON OF TSM TEMPERATURES--TESTS 3 AND 4, PHASE II 78
COMPARISON OF TSM AND MARINER IV TEMPERATURES, EARTH CRUISE 79
COMPARISON OF TSM AND MARINER IV TEMPERATURES, MARS CRUISE 80
COMPARISON OF TSM AND MARINER IV TEMPERATURES, MARS PLAYBACK 81
EFFECT OF SOLAR PANEL TEMPERATURE ON INTERNAL TEMPERATURES 82
THERMAL SCALE MODEL TEMPERATURE DATA, EARTH CRUISE 83
THERMAL SCALE MODEL TEMPERATURE DATA, MARS CRUISE 85
THERMAL SCALE MODEL TEMPERATURE DATA, MARS PLAYBACK 87
THERMAL SCALE MODEL TEMPERATURE DATA, MARS PLAYBACK, 89
HIGH SOLAR PANEL TEMPERATURE
v
_rthur _Ugittle._Jnr.

Figure
i
2
3
4
5
6
7
8
9
i0
ii
12
13
14
15
16
17
18
19
20
21
22
23
List of Figures
TEMPERATURE CONTROL MODEL - PHASE II CONFIGURATION
THERMAL SCALE MODEL - PHASE II CONFIGURATION
THERMAL SCALE MODEL (BAYS 5, 6, 7)
TOP VIEW - TSM BUS
BOTTOM VIEW - TSM BUS
BOTTOM VIEW - TCM BUS
INTERIOR VIEW - TSM
INTERIOR VIEW - TCM
TOP OCTAGONAL FRAME
CHASSIS ASSEMBLY
LONGERON
PACKAGING ASSEMBLY BAY 1
PACKAGING ASSEMBLY BAY 3
PACKAGING ASSEMBLY BAY 4
PACKAGING ASSEMBLY BAY 5
PACKAGING ASSEMBLY BAY 6
PACKAGING ASSEMBLY BAY 7
PACKAGING ASSEMBLY BAY 8
THERMAL CONTROL LOUVER BLADE ASSEMBLY
THERMAL CONTROL LOUVER ASSEMBLY
THERMAL CONTROL LOUVER PERFORMANCE
POST INJECTION PROPULSION SYSTEM
BAY 6 CONFIGURATION - TEST 3
Page
120
121
122
123
124
125
126
127
128
129
130
131
132
133
134
135
136
137
138
139
140
141
142
vi
_rthur _.little._.r.
Figure
24
25
26
27
28
29
3O
31
32
33
34
35
36
37
38
39
4O
List of Figures (continued)
MODIFIED BAY 6 CONFIGURATION - TEST 4 143
CONFIGURATION - MARINER IV SPACECRAFT 144
BOTTOM VIEW - MARINER IV SPACECRAFT 145
MARINER TEMPERATURE CONTROL MODEL 146
THERMAL SCALE MODEL - TOP VIEW 147
CONFIGURATION, MARINER-C SPACECRAFT AS OF 10-16-64 148
THERMAL SCALE MODEL 149
THERMAL SCALE MODEL 150
THERMAL SCALE MODEL - BOTTOM VIEW 151
THERMAL SCALE MODEL (LOUVERS AND UPPER SHIELD REMOVED) 152
THERMAL SCALE MODEL, BAYS I, 2, 3 153
THERMAL SCALE MODEL, BAYS 4, 5, 6 154
THERMAL SCALE MODEL, BAYS 7, 8 155
SCHEMATIC OF NASA LEWIS SPACE SIMULATOR 156
SOLAR ILLUMINATION PATTERN 157
SOLAR INTENSITY VARIATION 158
TSM CANOPUS TRACKER 159
vii
_rthur _._ittl_._nr.

Introduction
The interest in using thermal modeling techniques as a development
tool in producing a flight spacecraft is mainly derived from the high
costs of fabricating and testing full-scale prototype hardware. The
use of small, simplified thermal models will also, in many instances,
reduce the development time required to establish a workable thermal
control design. Furthermore, temperature predictions made with thermal
scale models may be inherently more accurate than predictions made with
full-scale prototypes of very large spacecraft due to the size and per-
formance limitations of presently available solar simulators.
The concept of using thermal scale modeling techniques for predicting
the temperatures of full-scale flight spacecraft from environmental
simulation tests of reduced-scale models has recently received attention
in the literature° The theoretical basis for the design of thermal
scale models has been established, and preliminary experiments with
extremely simple prototypes and models have been undertaken.
The work to be described herein comprises!the first known attempt
to predict the temperatures in an actual spacecraft, of considerable
complexity, by use of thermal modeling techniques.
In a one-year research and development program, a one-half scale
(approximately) thermal model of the Mariner IV spacecraft was designed,
fabricated and tested in a simulated solar environment. The over-all
objective of the program was to determine the feasibility of predicting
equilibrium temperatures in a complex flight spacecraft from environ-
mental simulation tests of a small-scale thermal model° The basis for
viii
_rthur/]l._ittle,_ar.

determining the feasibility of the technique was a comparison of scale
model temperatures, measured in solar simulation tests, with temperature
data obtained during the recent Mariner IV flight to Mars.
The aim of the contract was to develop a one-half scale thermal
model whose temperatures, at thermal equilibrium, would correspond to
those measured in a full-scale prototype within 5 degrees Fahrenheit.
Furthermore, the design, fabrication and testing of the Thermal Scale
Model (TSM) was to be completed without prior knowledge of the tempera-
tures that were measured by Jet Propulsion Laboratory in prototype tests.
The program was divided into three separate phases° Phase I, a
nine week effort, was an analysis and preliminary design effort. The
problems associated with detailed design and fabrication of the TSM
were studied, and a preliminary layout design for a 0.43 scale thermal
model of a Mariner Spacecraft was completed. This design was based on
a set of thermal scaling laws which predict identical temperatures at
homologous locations in model and prototype.
During Phase II, which was a 24 week effort, a 0.43 scale model
of the basic octagonal bus of a modified JPL Mariner Temperature
Control Model (TCM) was fabricated and tested in a thermal-vacuum
chamber. The tests were made in a cold-wall (LN 2 temperature) vacuum
chamber without solar simulation. The TSM tests were made at Arthur
D. Little, Inco, in a five foot diameter chamber. Independent tests
of the TCM were made under conditions of thermal similitude by Jet
Propulsion Laboratory° Temperature measurements at 48 locations
(identical thermocouple locations were used in the TSM and TCM) were
ix
2lrthur _.tittle._ar.

made at thermal equilibrium conditions.
Phase III, a 19 week effort, involved the design and fabrication
of thermally scaled versions of the superstructure, solar panels,
scientific experiments and other appendages on the Mariner IV spacecraft.
The Phase III TSM configuration, which was essentially a complete thermal
scale model of the Mariner IV, was tested in the NASA Lewis Research
Center Solar Simulator.
Temperature predictions made by use of the TSM were compared with
Mariner IV "cruise" flight data for the 98th and 180th flight day
measured from launch to determine the influence of solar intensity on
the accuracy of scale model predictions. (The solar intensity decreases
by approximately 30 _cr_ent during this interval of 82 days.) Compari-
sons of temperature predictions were also made for the '_ars Playback"
mode in which the internal power dissipation in the spacecraft is sig-
nificantly reduced.
The equilibrium temperatures at 75 locations within the thermal
model were measured in the solar simulation chamber for each of the
three tests. Twenty of the temperature measurements were made at homo-
logous locations in the model and Mariner IV, and these measurements
constitute the basis for comparing the scale model temperature predic-
tions with flight temperature data telemetered to Earth from Mariner IV.
_rthur/_._ittle,_nr.

Summary and Conclusions
The results of this program have shown that thermal scale modeling
techniques can be successfully applied to the prediction of flight tem-
peratures of a complex spacecraft. Temperature predictions made from
measurements with a small-scale thermal model in an environmental cham-
ber are sufficiently accurate to presently warrant the use of these
techniques in preliminary design and development of large, complex
spacecraft°
The thermal behavior of temperature-actuated, thermal control
louvers was successfully modeled at one-half scale, and the accuracy
of the thermal scale model was independent of the magnitude of the tem-
perature gradients within the structure.
The temperature differences across bolted joints, typical of those
used in power-dissipating, electronic subchassis, were measured in model
and prototype. In all tests, the thermal modeling of the joint conduc-
tances was within the experimental accuracy of the measurements.
Temperature predictions of both solar dependent and independent
spacecraft appendages were successful.
The accuracy of temperature predictions made for the Mariner IV
spacecraft by use of the half-scale thermal model tested in a simulated
solar environment is sunTnarized below° (The comparisons are based on
measurements at twenty homologous locations in the model and Mariner
IVo The basis for the comparison was temperature data telemetered to
Earth from the Mariner IV spacecraft.)
r
_trtllttr i_l.Kittle,_l,r.

Test i Earth Cruise Mode
Test 2 Mars Cruise Mode
Test 3 Mars Playback Mode
Number of Model Temperature Measure-ments With Indicated Error
5F < 10F _. 15F < 25F
14 15 16 19
3 ii 16 17
i 3 13 15
For the three tests, 48 percent of all measurements corresponded within
10F and 85 percent within 25F.
Subsequent analyses of the temperature predictions have shown that
significant improvements in the accuracy of the temperature predictions
would be expected in testing future models of similar complexity.
The results have also shown that large temperature errors can be
introduced in scale model temperature predictions by simplifications in
the details of construction. The treatment of details will be a govern-
ing factor in establishing a confidence level on the application of the
technique to larger and more complicated spacecraft. However, the reduc-
tion in ground handling problems and in testing time and costs, plus the
possibility for increasing the accuracy of temperature predictions of
very large spacecraft make the technique attractive°
The design and fabrication of the half-scale thermal model was
based on a group of thermal similitude relationships which, in theory,
produce identical temperatures at homologous locations in model and
prototype. The use of this "temperature preservation" scaling technique
requires that materials having different thermal conductivities be used
in model and prototype and that the surface properties (emittances and
solar absorptances) be identical in model and prototype. It is important
xii
_rthur _.tittIe,_nc.
to note that no difficulty was encountered in finding materials with the
proper thermal characteristics.
Further work is needed to correlate and compare the accuracy of
scale-model temperature predictions for a flight spacecraft with tempera-
ture predictions made by use of full-scale thermal test prototypes or
the actual flight spacecraft in ground testing with large solar simu-
lators.
This program was entirely devoted to the prediction of spacecraft
temperatures at thermal equilibrium. Additional work is needed to explore
the feasibility of applying thermal modeling techniques to spacecraft
where transient effects are important.
The thermal scale model of the Mariner IV was designed, fabricated
and tested in a one-year program. A considerable fraction of this period
was devoted to preliminary tests of only a portion of the spacecraft.
The results of the present program indicate that intermediate testing
could be by-passed in fabricating another thermal model of a spacecraft
of similar complexity. With the knowledge gained in this program, a
similar model could now be tested in solar simulation within approximately
seven months after design initiation. Improvements in the accuracy of
the temperature predictions and a significant cost reduction would be
anticipated.
xiii

PHASE II PROGRAM
A. Description of Phase II Model
i. Introduction
The objective of the Phase II test program was to compare tempera-
tures measured in a one-half scale model of the basic octagonal bus
of the Mariner IV spacecraft with temperatures measured independently
by Jet Propulsion Laboratory with a similar full-scale configuration.
These tests were made in cold-wall environmental chambers without solar
simulation since the temperatures of the octagonal bus of the Mariner
IV spacecraft are primarily governed by internal power dissipation.
For purposes of these special tests, a full-scale Mariner Tempera-
ture Control Model (TOM) was modified and tested by Jet Propulsion
Laboratory. (A TOM is identical to a flight spacecraft with the excep-
tion that the power dissipated in electronic subchassis is simulated
by heaters instead of the actual electronics and the various propellant
and pressurant containers are not filled. Jet Propulsion Laboratory
has determined that these differences are not important to the deter-
mination of temperature distributions in an actual Mariner-type space-
craft.)t
Views of the modified full-scale TCM and the half-scale TSM, as
used in the Phase II test program, are shown in Figures i and 2. The
modified TOM shown in Figure i consists of the octagonal bus structure.
The complete Mariner TOM was modified to this configuration by removing
all of the appendages including the solar panels. Thermal shields,
consisting of layers of "super-insulation" were attached to the top and
_rthur _._ittle,_nr.

bottom surfaces. By thermally shielding the top and bottom surfaces
the total internal power dissipated within the spacecraft was emitted
from the eight bays of the octagonal bus°
In previous solar simulation tests of the TCM (conducted by JPL),
it was found that the uppermost thermal shield did not act as an adia-
batic surface and the internal temperature of the bus was affected by
the heat leaks through the thermal shieldo Therefore, for the special
tests conducted in the Phase II program, a heated "hat" section was in-
stalled on the top of the bus to increase the total internal power
dissipation and thereby set the bus temperature within a normal opera-
ting temperature range.
The scale model was geometrically similar to the prototype TCM
except reduced in size. Many of the construction details in the TCM
were simplified in the TSM. These simplifications will be discussed
in following sections of this report.
The diameter of the prototype TCM was approximately 48 inches and
the height of the bus was 16 inches. The diameter of the scale model
was 21 inches and the height approximately 7 inches. The nominal in-
ternal power dissipation of the prototype TCM was 170 watts; the nom-
inal power dissipated in the scale model was 32 watts.
Five of the eight bays (Bays i, 3, 4, 7, and 8) were equipped with
temperature actuated thermal control louvers. These assemblies are
variable emittance devices which increase the effective emittance of the
bus with an increase in bus temperature. The louver assemblies used
on the TSM were thermally scaled versions of those used on the TCM.
_rthur _.tittle._ttr.

An over-all view of Bay 2, which contains the Post Injection Pro-
pulsion System, is also shown in Figure 2.
Figure 3 shows the exterior of Bays 5, 6 and 7 (right to left) of
the TSM. Bay 5 was completely shielded and Bay 6 was partially shielded.
The exposed area of Bay 6 in the TSM was scaled from the exposed area
of the TCM.
Top and bottom views, showing the interior of the TSM, are shown
in Figures 4 and 5o These photographs were taken prior to final assembly
and do not show the thermal control louvers or thermal shields. For
comparison, a bottom view of the JPL TCM (attached to a mounting ring)
is shown in Figure 6. It can be seen that much of the detail has been
reproduced in the TSM with the exception of some additional wiring.
The similarity of the mounting of the power dissipating electronic
subchassis in the TSM and TCM is shown in Figures 7 and 8. These in-
terior views show some of the details in Bays 6, 7 and 8.
In the following sections, we will discuss the procedures used in
designing the TSM and the details of construction of the components.
_Irthur B._LittleJJttr.

2. Scaling Procedures
The TSM was designed in accordance with a set of thermal scaling
laws which predict identical temperatures in model and prototype at
homologous locations. The use of this "temperature preservation" tech-
nique was specified by Jet Propulsion Laboratory. In addition, it was
desired to make model and prototype geometrically similar.
As it was desired to compare model and prototype temperatures at
thermal equilibrium conditions, no consideration was given to the simi-
litude parameters which govern transient scale modeling.
The theoretical basis for the design of thermal scale models of
spacecraft has been established and the results of successful experi-
ments with simplified thermal scale models--using the temperature pre-
Iservation technique--have been presented in the literature .
The following relationships were used as a basis for the design
of the TSM:
Em
-- 1EP
(1)
C_m
- IC_
P
(2)
k Lm m
k LP P
- R (3)
Cm
- iCP
(4)
l, Fowle, A. A., et. al., Thermal Scale Modelin$ of Spacecraft: An Experi-
mental Investisation _ paper presented at AIAA Space Simulation Testing
Conference, Pasadena, California, Nov. 16-18, 1964.
_rthur _l.Rittle._nr.
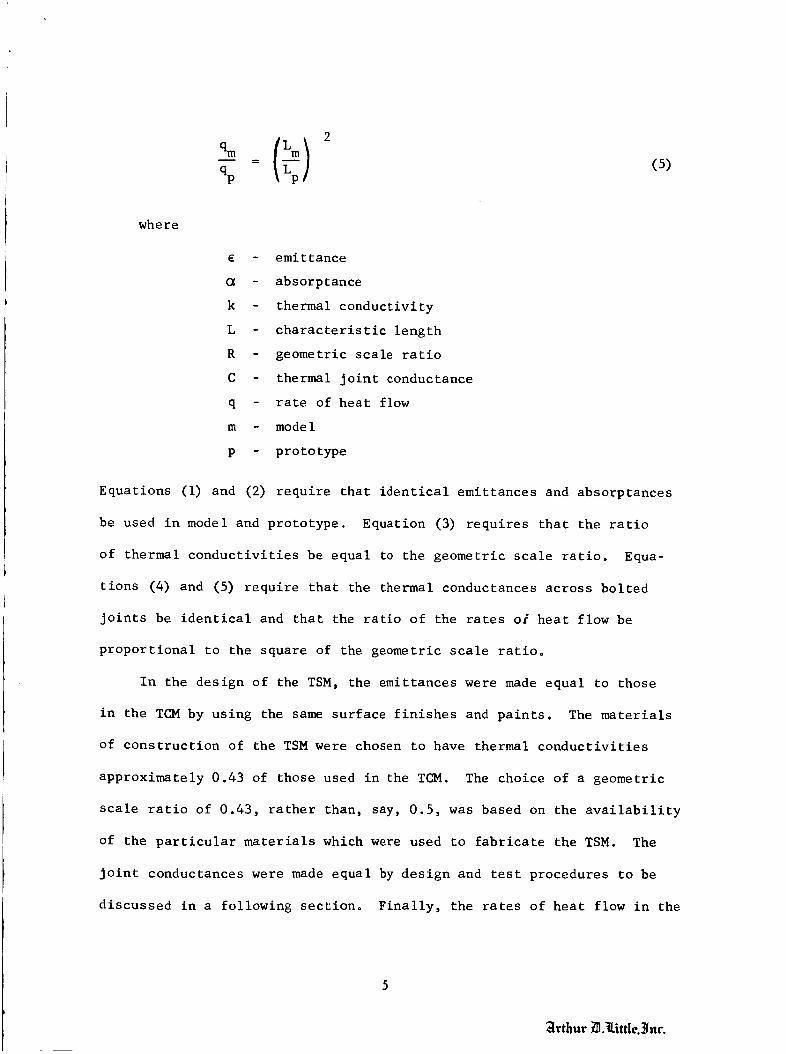
(5)
where
C - emittance
- absorptance
k - thermal conductivity
L - characteristic length
R - geometric scale ratio
C - thermal joint conductance
q - rate of heat flow
m - model
p - prototype
Equations (I) and (2) require that identical emittances and absorptances
be used in model and prototype. Equation (3) requires that the ratio
of thermal conductivities be equal to the geometric scale ratio. Equa-
tions (4) and (5) require that the thermal conductances across bolted
joints be identical and that the ratio of the rates of heat flow be
proportional to the square of the geometric scale ratio°
In the design of the TSM, the emittances were made equal to those
in the TCM by using the same surface finishes and paints. The materials
of construction of the TSM were chosen to have thermal conductivities
approximately 0.43 of those used in the TCM. The choice of a geometric
scale ratio of 0.43, rather than, say, 0.5, was based on the availability
of the particular materials which were used to fabricate the TSM. The
joint conductances were made equal by design and test procedures to be
discussed in a following section° Finally, the rates of heat flow in the
_[rthur _._itt|e,_Jnc.

model were designed to be 0.1849 times the rates that existed in the
prototype. In the Phase II configuration no external power was applied
to the prototype and, therefore, Equation (5) was satisfied by simply
scaling the internal power dissipation.
A further discussion of the details of the application of the
scaling parameters to the components that comprise the TSM is given in
the following sections.
3. Octagonal Bus Structure
The basic structural assembly consists of two octagonal frames
bolted together with longeronso To this assembly are bolted the eight
chassis plates (shear webs) which in turn support the electronic sub-
chassis.
During the preliminary design phase of our work, several analyses
were made to determine the relative effects of conduction and radiation
in determining the temperature gradients within the entire structure.
The results showed that the azimuthal temperature distribution in the
bus is mainly determined by radiative effects, whereas conductive effects
are important in determining the axial temperature distributions in the
chassis plates and the temperature patterns in the regions where power
dissipating sub-chassis are bolted to the chassis.
The shear webs were thus important with respect to conductive
effects, and we chose to use SAE 1015 steel for fabricating the shear
webs in the TSM.
The thermal conductivity of the ZK 60A magnesium TCM shear webs
was estimated to be 1.21 watts/cm-K and SAE 1015 steel has a conductivity
._rthur _l._ittl_._nr.

of approximately 0.519 watts/cm-K. The geometric scale ratio was
then set to be
L km m 0.519
- - - 0.43L k 1.21P P
This geometric scale factor was then applied to all of the dimen-
sions of the TCM to arrive at the proper dimensions of the TSM.
The octagonal frames were machined from an Alloy 9B aluminum bronze
1casting. This composition is reported to have a conductivity of
0.63 watts/cm-K which is 52% of the conductivity of the magnesium used
in the TCM. A drawing of the top frame section is shown in Figure 9.
The webs that were cast in this frame structure were not required from
the thermal standpoint but were provided for the attachment of equip-
ment to be used in the Phase III program.
The details of the shear webs are shown in Figure I0. These plates
were geometrically scaled in thickness from those used in the TCM and
were fabricated from SAE 1015 steel. As shown in Figure i0, several
of the shear webs were designed with varying thicknesses. Because of
the importance of conductance effects in determining the temperature
distributions within the shear webs, a scaled geometry was used in the
TSM, although some changes in the radii of the machined patterns
were made for ease of fabrication.
The magnesium longerons in the TCM were also thermally scaled by
using 1015 steel and scaled wall thicknesses in the TSM. Instead of
i. Metals Handbook, Volume i, Properties and Selection of Metals, 1961.
,_rthur _.Iittl_._nr.

fabricating the longerons from a single casting, the TSM longerons
were made from weldments as shown in Figure Ii.
4. Packaging Assembly
There are seven bays that dissipate power in the TCM--Bay 2 houses
the PIPS and does not have any internal power. Of those that dissipate
power, Bays 6, 8 and i dissipate 39, 20 and 14 percent of the total
internal power, respectively. Because of the wide variation in internal
power between bays, we simplified the electronic packaging in those bays
or modules that have small power dissipations. Since each bay was
treated in a slightly different manner, we will discuss the layout of
each bay in turn in the following paragraphs°
The individual modules are radiatively coupled to one another and
are conductively coupled to the shear web through bolted joints. The
emittance of the TSM modules is approximately the same as the corres-
ponding TCM modules. Gold plated boxes were used where required and the
emittance of the Dow 7 used on the TCM was reproduced by a black oxide
finish.
The modules that dissipate more than i watt (in the TCM) have
scaled radiating areas and conduction paths° For these TSM modules,
the number of shear web bolted connections were identical to the
number used in the TCM. The only geometrical difference between these
TSM modules and those used in the TCM was the location of the horizontal
divider to which the heater was attached. In the TSM the divider was
located at the bottom of the module instead of on a central plane. These
modules were made from SAE 1015 steel with scaled wall thicknesses.
2irthur _l._.ittle,_nc.
The modules in the TCM which dissipate less than one watt or have
no power dissipation were not exactly scaled in the TSM. The maximum
temperature rise of these modules if they are conductively decoupled
will be only 3 to 4 degrees C per watt of power dissipation. There-
fore, certain liberties were taken in modeling these modules. In these
cases, the modules were bolted to the shear web face but did not have
the bolted tab connections. These modules were fabricated from SAE
1015 steel and had scaled wall thicknesses. These modules were
similar in shape to the higher power modules except that two of the
vertical sides were omitted. This change did not appreciably affect
the radiative coupling between bays or modules, and did represent a con-
siderable simplification with respect to manufacturing.
Heaters and thermistors were affixed to each module in the same
relative locations as on the TCM. Each module was equipped with a
disconnect to facilitate the removal of a complete chassis assembly.
We will now discuss the characteristics of each chassis in turn.
A packaging assembly drawing for Bay i is shown in Figure 12. This
bay contains scaled versions of modules that dissipate more than and
less than one watt in the TCM. In Figure 12 the scaled powers for each
component are identified with the JPL identification as noted on the
JPL drawing J 4901042. The powers were obtained from the appropriate
2scaling ratio of (0.43) which is 0.185. (A listing of the TSM powers
and the thermocouple list used is presented in Appendix I.) An example
of the module construction we used for those TCM modules that dissipate
more than one watt is module 4A13. Examples of the simulation of
modules that dissipate less than one watt in the TCMare modules
8AI/8A2. One of these is shownin section A-A of Figure 12.
In Figures 13 and 14 are shownthe layouts of Bays 3 and 4. The
layout of Bay 3 is similar to the TCMwith the exceptions previously
noted. In order to simulate the gap between boxes 3AI and 6A8 on the
TCM,we combined the powers of modules3AI and 3A5, and modules 6A8 and
6AIO. This change is noted in Figure 14.
The assembly of Bay 5 is shown in Figure 15. The bay contains two
low emittance boxes, viz., 2RA2and 2RAIwhich dissipate rather large
amounts of power. Module 16Al--which does not dissipate power--was
simulated by use of a single plate bolted to the vertical membersof the
shear web. In the TCMthis module wasnot bolted to the shear web face
and we are merely representing the radiation blockage between the interior
of the shear web face and the interior of the bus.
The assembly of Bay 6 is shownin Figure 16. This bay has a
larger amount of power than any other bay, and also contains component
2PAl which singly dissipates more power than any other module or com-
ponent.
The assembly layout of Bay 7 is shown in Figure 17. In the TCM,
the attitude control electronics are attached to the left side of Bay 7.
Wehave simulated this componentby a single module having the same
approximate shape. This representation is shown in Figure 17 as module
7AI. The remaining modules were reasonable thermal versions of those
used in the TCMexcept that the area occupedby the gyro control (7A2)
in the TCMwas simulated by two smaller modules.
i0
_rthur _l.littlc._nc.
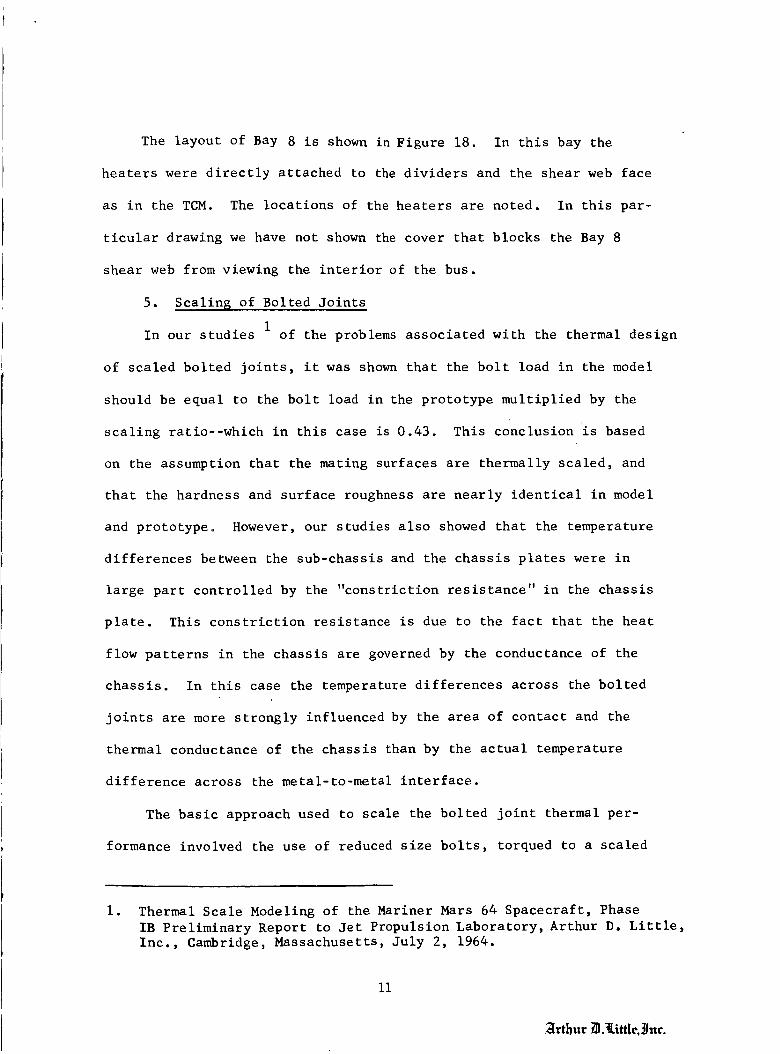
The layout of Bay 8 is shown in Figure 18. In this bay the
heaters were directly attached to the dividers and the shear web face
as in the TCM. The locations of the heaters are noted. In this par-
ticular drawing we have not shown the cover that blocks the Bay 8
shear web from viewing the interior of the bus.
5. Scaling of Bolted Joints
iIn our studies of the problems associated with the thermal design
of scaled bolted joints, it was shown that the bolt load in the model
should be equal to the bolt load in the prototype multiplied by the
scaling ratio--which in this case is 0.43. This conclusion is based
on the assumption that the mating surfaces are thermally scaled, and
that the hardness and surface roughness are nearly identical in model
and prototype° However, our studies also showed that the temperature
differences between the sub-chassis and the chassis plates were in
large part controlled by the "constriction resistance" in the chassis
plate. This constriction resistance is due to the fact that the heat
flow patterns in the chassis are governed by the conductance of the
chassis. In this case the temperature differences across the bolted
joints are more strongly influenced by the area of contact and the
thermal conductance of the chassis than by the actual temperature
difference across the metal-to-metal interface.
The basic approach used to scale the bolted joint thermal per-
formance involved the use of reduced size bolts, torqued to a scaled
i. Thermal Scale Modeling of the Mariner Mars 64 Spacecraft, Phase
IB Preliminary Report to Jet Propulsion Laboratory, Arthur D. Little,
Inc., Cambridge, Massachusetts, July 2, 1964.
ii
load. For example, the #8-32 titanium bolts (35 inch-lb torque) used
to join the chassis to frame were modeled by use of #6-32 stainless
bolts torqued to approximately 7 inch-pounds. The #6-32 stainless
bolts (18 inch-lb torque) used to attach the power dissipating sub-chassis
to the chassis plates were modeled by use of #4-40 stainless steel bolts
torqued to 5°5 inch-pounds. The bolt sizes and torques used in the
TSM were selected to have a scaled bolt load of approximately 43% of
the load that existed in the corresponding bolts of the TCM. The
loads were estimated from the friction torque characteristics of bolts
1presented in the literature o
In recognizing the uncertainties involved in basing the joint
designs on limited theory and approximate calculations of friction
coefficients, etc., we completed a series of ancillary tests to de-
termine whether the basic approach stated above would be applicable
to the thermal scaling of the joints between the power dissipating
modules (sub-chassis) and the chassis.
A TCM sub-chassis was bolted (in accordance with JPL specifications)
to a i0 inch diameter magnesium plate of approximately the same
thickness as the TCM chassis. A 25 watt heater was installed in the
sub-chassis_and the sub-chassis and back of the I0 inch plate were
"super-insulated". The assembly was placed in a small vacuum chamber
with a liquid nitrogen cooled interior shroud and temperature differences
across the bolted joint were measured. The i0 inch plate was used to
radiate the 25 watts to the cooled vacuum chamber shroud° A 0.43 scale
io Belford, R. B., et. al., Joint Design, Machine Design, March 21, 1963.
12
_rthur _l._ittle,_nr.
TSM sub-chassis and a scaled radiating plate (both were fabricated
from 1015 steel) were assembled in accordance with the scaling methods
discussed previously. The power input to the TSM chassis was scaled
to be 4.6 watts° This assembly was also used to make temperature
difference measurements in the vacuum chamber.
The full scale assembly was used to investigate the effects of
bolt torque, bolt material and the conductance of the radiating plate
on the temperature differences from the sub-chassis to the radiating
plate.
The basis of comparison for the tests was the temperature difference
measured with the TCM sub-chassis attached to the magnesium plate with
three #6-32 stainless steel bolts torqued to 18 inch-pounds. The
measured temperature difference for this configuration was 83.5 F with
25 watts of internal power dissipation. (The mean fourth power tempera-
ture of the radiating plate was used to arrive at the temperature
differences.) Reducing the bolt torque to 9 inch-pounds increased the
temperature difference to 107.3 F. Changing the bolt material from
stainless to titanium (at the same torque) did not affect the tempera-
ture difference° Increasing the thermal conductance of the radiating
plate by substituting a copper plate of the same thickness as the
magnesium plate--thereby increasing the conductance by a factor of
about three--decreased the temperature difference from 83.5 F to 41F.
This result shows the importance of scaling the conductive paths around
the bolted regions. The results of these tests are tabulated in
Appendix II.
13
_rthur i_l.tittle._J_tr.
From the results of these tests with the full-scale bolted joint
assembly, we concluded that the scaling of the conductive paths (i.e.,
the constriction resistance) and the bolt torque would be important in
determining the temperature patterns in the scaled sub-chassiso
Next, the TSM sub-chassis assembly was tested to determine whether
or not the temperature differences would correspond with those measured
in the full-scale assembly. It was desired to have the temperature
differences in the TSM assembly correspond with those measured in the
TCM assembly with the magnesium radiating plate and the bolts torqued
to 18 inch-pounds as this configuration is typical of the fully
assembled TCM.
The scaled TSM sub-chassis was bolted to the scaled radiating
plate with three #4-40 stainless screws torqued to 5.5 inch-pounds.
The measured temperature difference was 69.8 F which was lower than
the 83.5 F difference measured with the TCM sub-chassis. Reducing the
torque to 2.7 inch-pounds increased the difference to 88.9 F. At
this point, we could have chosen to set the bolt torques at about 4.7
inch-pounds and this presumably would have set the temperature difference
to correspond with the TCM sub-chassis assembly at 83.5 F. However,
we decided to investigate one additional variable, viz°, the size
of the clearance hole in the radiating plate since we had rather
arbitrarily used a clearance hole diameter of 0.125 inches in this
test setup. The clearance hole was enlarged to 0.149 inches and the
temperature difference increased from 69.8 F to 93.4 F (at 5.5 inch-
pounds of torque). This surprising result showed that the geometry of
14
_rthur _l.littl¢._nr.

the hole pattern was influential in determining the temperature distri-
bution for these sub-chassis. If the temperature difference is assumed
to be linear with clearance hole diameter, a 0o136 inch clearance hole
diameter in the TSM assembly (with a bolt torque of 5.5 inch-pounds) would
make the temperature differences in model and prototype correspond.
The holes for the sub-chassis bolts in the TSM chassis plates were
drilled to this diameter and the bolt torques set at 5.5 inch-pounds.
We anticipated that the thermally scaled joint problem would be
most critical for the bolted modules that dissipated relatively large
amounts of power in the TCM. Therefore, we did not complete any experi-
ments with the joints between the frame and chassis plates. In this
case, we believed that only small amounts of power would be transferred
between the frame and chassis and that the temperature differences would
be small.
In conclusion, we thermally scaled the bolted joints by use of a
limited amount of theory and the results of ancillary tests with a
full-scale JPL sub-chassis and a 0.43 thermal scale model of the sub-
chassis. The results of these tests were used to determine bolt torques
and clearance hole diameters which would provide temperature difference
correspondence in model and prototype.
15
_Irthur/il._ittle3Jac.

6. Thermal Control Louvers
The five sets of thermal control louvers used on the TCM are used
to regulate the bus temperatures. The normal operating temperature
range is from 55 to 80 F. The louver blades are fabricated from
polished aluminum which has a low infrared emittance. In the closed
position the blades shield the spacecraft bus. As the blades open, the
chassis--which is painted to have a high emittance--is exposed, thereby
increasing the effective emittance of the assembly. At temperatures
below 55 F, the louver blades are closed and the assembly has an
effective emittance of 0.12. At temperatures above 80 F, the louver
blades are wide open and the effective emittance of each assembly is
0.76. At 55 F a typical set of louvers will radiate 6.9 watts of
power and at 80 F the power dissipation will be 52.6 watts. These
iresults were obtained from JPL tests .
Each pair of louver blades on a TCM assembly is driven by a bi-
metallic spring which will rotate approximately 90 degrees with a tem-
perature change of 25 F. The bi-metallic actuating springs are radia-
tively coupled to the chassis of the spacecraft so that the angular
position of the blades is a function of the chassis temperature. Each
set of blades can be adjusted within a small range to set the temperature
at which the blades open.
In the tests completed by JPL with the modified TCM, the louver
blades on the assemblies mounted on Bays 7 and 8 were set to open at
55 F and on Bays i, 3 and 4, the blades were set to open at 63 F.
I. Mariner Louver Performance, Interoffice Memo by M. Gram, January15, 1964.
16
_rthur _._ittlt'._nr.

In designing the louver assemblies for the TSM, it was decided to
utilize the same method for controlling the blade angles and to retain,
as closely as possible, the geometrical characteristics of the TCM
assemblies. The design of the TSM louvers was thus based on a require-
ment to have eleven pairs of individually actuated blades in each
assembly. The scaling laws (c.f. Eq. i) require that the emittances
be identical in model and prototype, and that the ratio of conductivities
be equal to the scaling ratio. However, in the case of the louvers, the
power dissipated is controlled by radiative rather than conductive
effects° Therefore, the TSM louvers were made from the same material,
polished aluminum, to have essentially the same emittance as the pro-
totype TCM assembly.
An exploded view of a typical blade assembly for the 0.43 scale
TSM louvers is shown in Figure 19. This figure shows the bi-metallic
actuating spring, the micarta axle and nylon bushings used to support
the assembly. A view of a partially assembled set of blades is shown
in Figure 20. A fully assembled set of louvers, complete with center
section housing, is shown in Figure 3.
In designing the TSM louver assemblies at 0.43 scale, two problems
were encountered. First, hi-metallic springs less than half the size
of those used in the TCM were not readily available. Therefore, the
dimensions of the center section housing the springs were larger than
a scaled dimension thus reducing the effective radiating area of the
exposed chassis with the blades in the open position. Second, in
small bi-metal spring sizes, the maximum available rotation was
17
3 degrees of rotation per degree F temperature change. The TCMsprings
produced 3.6 degrees of rotation per degree F of temperature change.
Therefore, the temperature span associated with the fully closed to
fully open blade position was 5 F greater in the TSM.
To examine the thermal performance of a typical "scaled" TSM
louver assembly, an extra assembly was fabricated for testing. The
power dissipation vs. temperature characteristics of a TCMlouver
assembly were known from JPL tests and it was desired to compare these
results--on a scaled basis--with the measuredperformance of a TSM
louver assembly.
The power dissipation vs. temperature characteristics of a TSM
louver assembly were measured in a vacuumbell jar with a liquid nitrogen
cooled "black" inner shroud. The louver assembly was mounted on an
aluminum plate to which was affixed a heating element. The aluminum
plate was painted with PV I001 paint (also used on the TCM)on the
side facing the louver assembly and insulated with multi-foil super-
insulation on the other side° By measuring the temperature of the
aluminum plate and measuring the input power to the heater, the thermal
performance of the louver was obtained over a wide range of tempera-
tureso For this particular setup, the opening temperature of the
louver blades was set at approximately 55 F. A comparison of the TCM
louver and TSMlouver performance is shownin Figure 21. The upper
curve is based on JPL data scaled by Equation 5 (page 7) which requires
that the power be scaled in proportion to the geometric scale ratio
i. Vita-Var Paint Co., Orange, N. J., #15966.
18
_rthuv _.$ittlr,_nr.
(0.43) squared° The experimental data obtained with the scaled TSM
louver indicate that the effective radiating area was low. Between
the fully closed and open blade positions, the differences can be
attributed in part to spring characteristics and the problems associated
with "sticking" blades° The effective radiating area of the TSM louvers
was known to be approximately 10% low because of the additional non-
scaled area of the center housing. Therefore, to increase the effective
radiating area of the assemblies used on the TSM, the chassis were
painted with 3-M Optical Black Velvet paint instead of PV i00 paint.
The emittance of PV i00 was measured to approximately 0.85. The
emittance of 3-M paint was approximately 0.95. The substitution of
this paint thus increased the effective radiating area by 10%. No
additional experiments were made on the louver assembly with the 3-M
painted surface since this correction was relatively straightforward.
The temperature correspondence between model and prototype at a given
power level was estimated to be of the order of 5 F which was of the
same order as the experimental error. On the basis of this limited
test program, it was decided to use the TSM configuration without
further refinements to produce exact temperature correspondence. The
reasons for making this decision were twofold. Tests of each of the
five TCM and TSM louvers would be required to make precise comparisons,
and the use of five assemblies on the spacecraft tends to "smear out"
differences in the temperatures of individual bays.
It should be noted that in the assembly of the five sets of
louvers used on the TSM, the angular position of the blades was
19
_[rthur _._.ittle._Jar.

adjusted by setting the blades in the fully open position corresponding
to the "fully open" temperature of the TCM assemblies. This approach
was taken since the internal temperature of the spacecraft is more
sensitive to changes in effective emittance when the louvers are at or
near the fully open position.
7. Post In_ection Propulsion System
The PIPS consists of a group of propellant and pressurant tanks,
a rocket engine and associated controls° The entire bay containing
the PIPS system--as installed on the TCM--is thermally isolated from
the external environment by low emittance surfaces except for the
"black cavity" produced by the rocket exhaust nozzle. Since no power
is dissipated within the bay and the power radiated from the bay is
small due to the low effective emittance of the exterior surfaces,
errors associated with thermally modeling the system will have little
influence on the temperatures of the other seven bays° For this reason,
the TSM design was based on an approach which would simulate the gross
thermal behavior and, therefore, many simplifications were made in
designing a thermal mockup of the PIPS.
A drawing illustrating the TSM PIPS configuration is shown in
Figure 220 The geometry of the system was retained, however, much of
the detail used on the TCM such as piping, rocket motor insulation,
etc., was omitted from the TCM. The conductive paths in the exhaust
nozzle and jet vane support were approximately scaled from the thermal
standpoint, however, it was recognized that the temperatures within
the system would tend to "float". That is, because of the use of low
20
_rthur _.tittle,_n_.

conductivity materials and low emittances, the temperatures within the
nozzle, for example, are extremely sensitive to small changes in heat
flux. In the following discussion of the comparison of temperatures
measured for the TCM and TSM, it will be shown that the temperature
correspondence between mo_el and prototype in this particular bay was
poorer than in any other location.
8. Insulation and Paint Treatments
The top and bottom of the spacecraft bus were insulated by use of
multi-foil superinsulation. Approximately 12 layers of aluminized
Mylar separated by silk netting were used as an insulation package.
A similar system of insulation--from the thermal standpoint--was used
on the TCM. In this particular spacecraft configuration, small heat
leaks associated with the superinsulation package have little influence
on the internal temperatures because of the large amounts of power
radiated from the large areas of high emittance on the sides.
The thermal shields mounted on the sides of the TCM were made of
polished aluminum and were thermally "shorted" to the bus by aluminum
standoffs with bolts° Polished aluminum shields of approximately the
same thickness were used on the TSM. They were also thermally short-
circuited to the bus. Again, because of the large amounts of power
dissipated by the unshielded bays, the influence of differences in the
thermal coupling and emittances of the shields is small from the stand-
point of predicting interior temperatures.
Three types of paint were used on the interior of the TCM and the
same paint treatments were applied to the interior portions of the TSM.
21
_lrthur _l.ti_le.JJnr.

The interior surfaces of the bus and the longerons were painted with
Cat-A-Lac I Flat Black 463-3-8. The exterior portions of the longerons
were painted with Cat-A-Lac Gloss White 443-1-500. The exterior sur-
faces of the chassis were painted with PV i00 White 2. To insure that
the emittances in model and prototype were equivalent, the emittances
of several samples of each surface--painted by JPL to flight speci-
fications--were compared with samples of the same paint prepared by
ADL. The relative emittances were determined by calorimetric techniques
using the ADL Emissometer. The results showed that the maximum differ-
ence in the relative emittance was 1.2% for the three paints which have
total hemispherical emittances at room temperature ranging from 0.847
to 0.886.
i. Finch Paint Co., Torrance, California.
2. Vita-Var Paint Coo, Orange, New Jersey.
22
_vthur _l.tittle._nr.
s
B. Phase II Test Procedures
i. Description of Tests
The Phase II test program consisted of the experimental deter-
mination of the TSM "bus" temperatures for three different test con-
ditions. These TSM tests were performed in a thermal-vacuum chamber at
Arthur D. Little, Inc° Solar simulation was not used in these tests.
Three corresponding tests were performed by Jet Propulsion Laboratory
using a modified TCM. The temperatures at 48 locations within the "bus"
were measured at thermal equilibrium. The location of the temperature
measurements was identical in TCM and TSM.
Jet Propulsion Laboratory provided information on the TCM in-
ternal power, the power supplied to the TCM "hat section" for each test,
and the measured temperatures of the TCM '_at section". The measured
TCM bus temperatures were supplied to ADL following the submission of
the measured TSM temperatures to Jet Propulsion Laboratory.
The three tests undertaken in Phase II were designed to provide
information on the accuracy of the thermal scale model in three different
situations. In each of the three tests, the amount of power dissipated
in the "bus" was maintained constant at the '_arth Cruise" condition.
In Test i, the power supplied to the "hat section" was made rela-
tively small with respect to the power dissipated in the "bus" in order
to set the average bus temperature within the normal operating tempera-
tures of the thermal control louver assemblies° The purpose of this
test was to compare the measured temperature distributions of the TCM
and TSM when the louver assemblies were partially open.
23
_rthur _._ittle,_n_'.

In Test 2, the power supplied to the hat section was increased to
set the average "bus" temperature at or above the "fully open" position
of the thermal control louver assemblies. The purpose of this test
was to compare the measured temperature distributions at elevated tem-
perature levels when the thermal control function of the louver
assemblies was removed°
In Test 3, two of the thermal control louver assemblies were caged
in the fully-open position (Bays i and 3) and the remaining three
assemblies were caged in the fully-closed position (Bays 4, 7, 8). The
purpose of this test was to compare temperature distributions in the
TCM and TSM when the bus temperature gradients were intentionally made
large by forcing most of the internal power to be emitted by the two
bays with caged open louver assemblies.
In addition to the three aforementioned tests, two additional
tests were performed with the TSM. The first of these supplementary
tests, Test 3A, was performed to evaluate the influence of "heat leaks"
associated with gaps between the "flight-type" thermal shields on the
temperatures of the TSM. During the installation of the thermal
shields on the TSM, it was recognized that differences in the relative
gap dimensions between the TSM and TCM could exist because of tolerance
limits in the manufacture and final assembly of the shields. The gaps
between the thermal shields, which act as "black-body" cavities, were
covered with a low emittance aluminized tape and Test 3 was repeated
in order to assess the influence of these 'beat leak" paths on the
TSM temperatures.
24
_rthur _._i_le,_Jnc.

The second additional test of the TSM, Test 4, was performed to
determine the influence of substituting a simplified version of Bay 6
for the complicated assemblage of simulated electronic sub-chassis.
Test 4 was performed under the same conditions as Test 3, viz., with
two louver assemblies caged fully open and the remaining assemblies
caged closed° A view of the interior assembly of Bay 6, as used in
Test 3, is shown in Figure 23. The modified Bay 6 configuration used
in Test 4 is shown in Figure 24. This single heater dissipated the
same amount of power as the total amount dissipated in the five sub-
chassis used in the Test 3 configuration°
The internal powers that were dissipated in each test Of the
modified TCM and the TSM and the positions of the thermal control
louver assemblies are presented in Table i.
2o Test E_uipment and Measurements
The TSM tests were conducted in a five foot diameter thermal-vacuum
chamber with an interior shroud cooled to liquid nitrogen temperatures.
The interior surface of the shroud was coated with an optical black
paint to produce a high infrared emittanceo During the TSM tests the
internal pressure in the chamber was maintained in the 10 -6 torr range.
Power was supplied to the TSM by use of a 300 volt DC power supply
with 0.007 percent regulation. The individual heaters used within the
TSM were precision wire-wound power resistors. Power measurements were
made by current and resistance measurements. It was estimated that the
total power measurements were accurate to within 0.09 percent.
25
_rthur _._ittle._3_u'.
The temperatures were measured by use of calibrated, matched
thermistors° The entire lot of thermistors had resistance vs. tempera-
ture characteristics such that any single thermistor would have an
error of less than + 1/2 F over the temperature range of 32 to 212 F
when a single resistance vs. temperature curve was used° Calibrations
were made by the vendor to establish the resistance vs. temperature
curve and three point calibrations of each thermistor were made by
Arthur D. Little, Inc., as acceptance tests. These calibrations showed
that the maximum error was less than + 1/2 F.
A constant current of 30 microamps was supplied to the thermistors.
The voltages were read on a digital voltmeter. The voltages were trans-
lated to temperature by use of a digital computer data reduction pro-
gram. It was estimated that the total system error in measuring the
temperatures was of the order of + 1/2 F.
Temperature measurements of the TSM were recorded at approximately
one hour time intervals. The final steady-state temperature measure-
ments were made when the change in any temperature between three
successive readings was less than 0.i F. The time required for the TSM
to reach thermal equilibrium varied with the test condition, however,
the average time was approximately 12 hours.
26
_rthur/ll.tittle._nc.

Co Test Results
The measured temperatures for the three tests of the modified TCM
and the TSM are presented in Tables 2, 3, and 4. In each table,
the temperature differences between the TSM and the TCM measured at
,homologous locations are tabulated.
Comparisons of the average temperatures in each bay for the three
tests are presented in Table 5. Comparisons of the temperature levels
of each bay in the TCM and TSM were made by computing the average of
all of the temperature measurements within a given bay. The percentage
errors in the average temperatures of the TSM bays were based on the
average absolute temperatures of the TCM bays.
In Table 6, data are presented for the temperature differences
between four electronic sub-chassis and the shear webs to which they
are mounted. Comparisons of the measuredtemperature differences for
each of the three TCM and TSM tests are presented.
Comparisons of measured chassis temperatures in Test i of the TSM
and TCM are made in Table 7.
Tables 8 and 9 contain data on the two tests made only wi_h the
TSM. A comparison of Tests 3 and 3A--which were used to determine the
influence of heat leakage paths in the thermal shields--is made in Table
8.
The effect of making a simplified version of the Bay 6 heater arrange-
ment is shown in Table 9. In this table, the TSM temperatures
measured in Tests 3 and 4 are compared.
Thermocouple #324 was not recorded in the JPL tests of the TCM. The
temperatures at the same location measured in the TSM are listed for
re ference.
27
_rthur/_.tittlr,_Jn¢.

D. Discussion of Test Results
This discussion of the test results must be prefaced by the remark
that the prediction of the spacecraft bus temperatures by use of the
one-half scale thermal model was remarkably good° Generally speaking,
the results show that the temperatures within a spacecraft structure,
typical of the Mariner Mars 64, could be predicted by thermal modeling
techniques to within 5 degrees Fahrenheit°
In reviewing the data obtained in all of the tests, there were only
three temperature measurements that fell outside of the limits of
accuracy generally required for thermal design purposes° These three
temperature measurements were made within the Post Injection Propulsion
System and the umbilical connector. A simplified thermal model of the
PIPS was used in the TSM, and the umbilical connector was "mocked-up"
rather than scaled from the thermal standpoint.
The approach used in designing and fabricating the Thermal Scale
Model was based on the objective of accurately predicting the tempera-
tures of bus structure and the electronic sub-chassis, particularly
those having a high internal power dissipation° For this reason, con-
siderable emphasis was placed on the scaling of the thermal control
louver assemblies and the bolted joints through which large amounts of
power are being transferred.
The data indicate that this objective was met with considerable
success°
The detailed temperature comparisons for the Phase II test program
will be discussed in the following paragraphs.
28
_[rthur _l._ittle._xtc.
The results of Test l--a test in which all louvers were free to
operate normally--indicate that the average absolute error in the TSM
temperatures was 5°2 F, or one percent of the absolute temperature°
(The absolute values of all differences were summed and averaged over
the 44 bus temperature measurements.) Four temperatures were in error
by i0 F or greater and only ten were in error by more than 6 F. In par-
ticular, the largest errors were encountered in Bay 2. The maximum
error was 31.5 F as measured in the rocket nozzle. The errors associated
with Bay 2 measurements are due to the relatively poor thermal coupling
between these elements and the remainder of the spacecraft, and the
fact that no internal power is dissipated in Bay 2o Furthermore, be-
cause of the large temperature gradients in these areas the temperature
correspondence between TCM and TSM is subject to larger errors.
In Test i, the temperature correspondence in the Bays with high
internal power, such as Bays 6 and 8, is extremely good although in
general the model ran slightly lower in temperature than the TCM. In
a following discussion of Tests 3 and 3A, it will be shown that the
presence of non-scaled gaps between the thermal shields--which act as
"black-body" cavities--caused the model temperatures to be slightly low°
The results of Test 2 show that the temperature errors follow the
same pattern as in Test i; however, as expected the errors are slightly
larger because of the higher temperature level and the fact that the
thermal control function of the louver assemblies was deleted by
driving the louvers wide open at these high temperature levels° The
average absolute error between the TCM and TSM for Test 2 was 7.7 F, or
29
_lrthur/_l._ittle._Jnc.
about 1.4 percent of the absolute temperature level° The "hat" tem-
perature measurements showed that the "hat section" in the model was
nearly 30 degrees F colder than the TCM. The power to the "hat section"
was appropriately scaled and small heat leaks in the super-insulation on
the top of the hat would not result in a difference of this magnitude°
An examination of the details of the TSM and TCM indicated that the TCM
had proportionately more radiative blockage between the hat and the
bus° The blockage is due to the presence of wiring, connections, and
the cable troughs. This effect would tend to decrease the hat tempera-
tures of the TSM for a properly scaled power dissipation in the hat
itself°
Test 3 forms the basis of a temperature comparison with increased
temperature gradients in the bus and with the louvers on three bays
caged closed. The average absolute error between the TCM and TSM was
4°7 F in Test 3° This is slightly less than the error in Test i. The
test results showed that the temperature differences across the octagonal
bus were significantly altered° The temperature difference between
Bays 3 and 7--on opposing sides of the octagonal structure--was less
than 5 F in Test I and over 40 F in Test 3. A conclusion that can be
drawn from the comparisons of Tests I and 3 is that the accuracy of
the temperature predictions is preserved when the temperature differences
between bays are increased by an order of magnitude° This result is
appropriate to considerations of the application of thermal modeling
techniques to other spacecraft designs where temperature gradients within
the structure are significant°
30
_rthur/_l._ittlcJJar.

The comparison of average bay temperatures as presented in Table 5
summarizes the errors in average temperature correspondence° The average
bay temperatures correspond to within one percent for Tests i and 3 and
the maximum error is less than 1°5 percent.
The comparison of the temperature differences across four electronic
sub-chassis, as presented in Table 6, indicates that the modeling of the
joint conductances was within the experimental accuracy of the measure-
ments. The temperature drop across the bolted joint in sub-chassis
2PAl--which has a large power dissipation--corresponded to within two
degrees° Similar correspondence was obtained for sub-chassis 2PSl which
had a joint temperature drop of nearly 30 degrees F.
The temperatures of the chassis, i.e=, the shear webs, are compared
in Table 7 for Test i. The average absolute error of the 16 measure-
ments was 3.3 degrees F. The results indicate that the accuracy of
temperature predictions was of the same order as the accuracy of the
experimental measurements°
The influence of the heat leakage paths between the gaps in the
thermal shields is shown in the data presented in Table 8 for Tests
3 and 3A. These test results were obtained in two similar tests of the
TSMo The data indicate that covering the gaps in the thermal shields
with low emittance aluminized tape increased the average temperature
level of the model by about 5 degrees F. However, in Bay 3 the tempera-
ture level was increased by about i0 degrees F. It was noted that the
measured temperatures in Bay 3 of the TSM were disproportionately lower
* The accuracy of the TCM measurements was estimated to be + i F by JPL.
The accuracy of the TSM measurements was estimated to be + 1/2 F.
31
_thur/_._ittle,_ar.
than the other bays when compared to the TCM results. The results of
Test 3A indicate that part of the error was due to "non-scaled" gaps
between the thermal shields used on Bay 3o It should be noted that
dimensional tolerances associated with these gaps are significant from
the thermal standpoint° Deviations in the "gap areas" of two full-scale
spacecraft or a model of the full-scale spacecraft can result in
appreciable temperature differences.
The results of Test 4, which was made with a simplified version
of Bay 6, point out the fact that a complicated bay can be simplified
without appreciable error in the temperatures° The chassis temperatures
in Bay 6 were within a few degrees of the Test 3 results with either
the TSM or TCM. This change did not appreciably alter the temperatures
of the remainder of the bus. Therefore, in future thermal modeling
studies, one should consider the possibilities of using simplified
heating arrangements to determine structural temperatures.
32
_[_thur_._ittle,_nr.

PHASE III PROGRAM
A. Description of Phase III Thermal Scale Model
i. Introduction
The purpose of the Phase II program was to fabricate a model of the
spacecraft bus, which is sun-independent, and to compare model tempera-
tures with temperatures measured in a modified prototype of Mariner IV.
Since the full-scale prototype used in the Phase II tests was based on
an early development model of Mariner IV, it was necessary to modify and
update the TSM bus to correspond to the Mariner IV flight spacecraft.
Since the purpose of the Phase III program was to investigate the
accuracy of applying thermal modeling techniques to a complete spacecraft
with appendages whose temperatures are sun-dependent, it was necessary to
add thermally scaled versions of many of the appendages on Mariner IV.
The TSM configuration used in the Phase III test program was essen-
tially a thermally scaled version of the Mariner IV flight spacecraft.
Two views of the Mariner IV illustrating the over-all configuration and
the appendages are presented in Figures 25 and 26.
The orientation of the Mariner IV is maintained during flight such
that the roll axis as shown in Figure 25 is colinear with the spacecraft
sun vector. Therefore, during the cruise portion of the flight from
Earth to Mars, the solar panels, upper thermal shield and appendages
above the upper thermal shield are in direct sunlight. The sides of the
octagonal bus, the lower thermal shield and the appendages below the
lower thermal shield are shaded from sunlight.
During the flight, the solar intensity decreases by approximately
58 percent as the spacecraft travels from Earth to Mars and moves away
33
_rthur _l._ittlejl._.

from the sun. The total flight period from Earth to Mars encounter is
approximately 230 days. The upper thermal shield is used to insulate
the octagonal structure from solar energy. The internal temperatures of
the octagonal bus and the electronics packages are maintained at a rela-
tively constant level by the internal power dissipation and the action
of the six sets of thermal control louvers. The temperatures of the
appendages above the upper thermal shield and the solar panels are de-
termined by the solar intensity, their internal power dissipation and
the degree to which they are thermally coupled to the octagonal bus
structure. Thus, the temperatures of the appendages above the upper
thermal shield and the solar panels are solar-dependent, whereas the
temperatures of the appendages below the lower thermal shield are basic-
ally independent of the solar intensity.
The change in solar intensity with respect to time is quite small
(of the order of 1/2 percent per day) and, therefore, the temperatures
of even solar-dependent appendages change very slowly. (A typical value
for the ion chamber which is a solar-dependent appendage with a small
thermal time constant is 1/2 OF per day.) Because transient effects are
not important to the general temperature level of the Mariner IV space-
craft, the thermal scale model was not designed for predicting transient
temperatures and the tests of the model were made at thermal equilibrium.
The geometric scaling ratio of 0.43, which was used in designing
the octagonal bus structure during Phase II, was also used in obtaining
the dimensions of the appendages used on the Phase III configuration.
The relative sizes of the 0.43 scale TSM and the full scale prototype
34
_[rthur _._itt[e,3Jar.

are clearly shown in Figures 27 and 28.
The full-scale prototype shown in Figure 27 is an early version of
a JPL temperature control model equipped with dummy solar panels which
are considerably shorter than the actual flight versions.
The solar panels used on the TSM were electrically heated mock-ups
designed to provide the proper thermal boundary conditions on the TSM
bus and external equipment. The panels were electrically heated since
the solar beam used in the Phase III simulation tests was not large
enough to illuminate an entire panel.
Figures 30 through 33 also show some of the details of construction
of the appendages used on the TSM. Many of the appendages on the TSM
were mocked-up or eliminated rather than thermally scaled. The primary
objective of the program was to predict temperatures of several solar-
dependent appendages and several appendages attached to the spacecraft
below the lower thermal shield. In addition to the temperatures within
the bus, effort was concentrated on thermally scaling the magnetometer,
ion chamber, and trapped radiation detector whose temperatures are solar-
dependent and the Canopus tracker, television camera and science platform
thermal simulator (SPITS) whose temperatures are essentially solar-
independent. However, the thermal characteristics of other appendages
were scaled in situations where the temperatures of the appendages were
believed to influence the bus temperature°
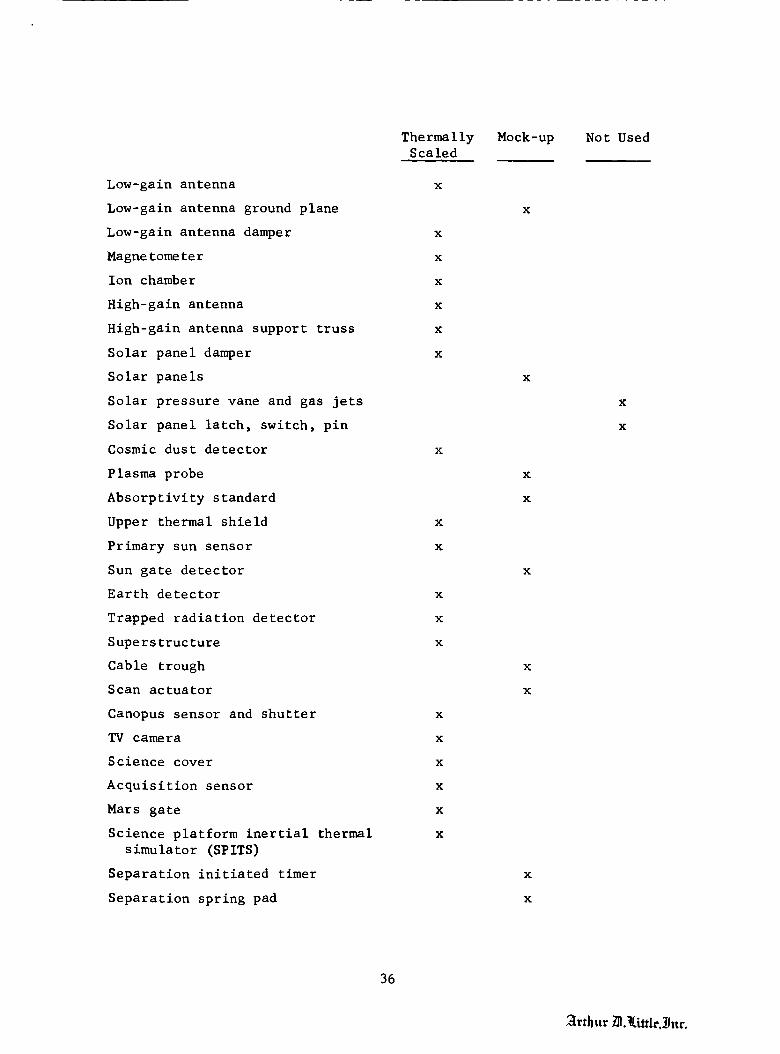
The following table lists and classifies the external appendages
depending on whether they were scaled, mocked-up or not used on the TSM.
The locations of the appendages are identified in Figure 29.
35
_[rthur _._ittI_._nr.
Low-gain antenna
Low-gain antenna ground plane
Low-gain antenna damper
Magnetometer
Ion chamber
High-gain antenna
High-gain antenna support truss
Solar panel damper
Solar panels
Solar pressure vane and gas jets
Solar panel latch, switch, pin
Cosmic dust detector
Plasma probe
Absorptivity standard
Upper thermal shield
Primary sun sensor
Sun gate detector
Earth detector
Trapped radiation detector
Superstructure
Cable trough
Scan actuator
Canopus sensor and shutter
TV camera
Science cover
Acquisition sensor
Mars gate
Science platform inertial thermal
simulator (SPITS)
Separation initiated timer
Separation spring pad
ThermallyScaled
x
x
x
x
x
x
x
x
x
x
x
x
x
x
x
x
x
x
x
Mock-up
x
x
x
x
x
x
x
x
Not Used
x
x
36
2[rthur _._.ittle,_nr.

Sun sensors - secondary
Pyrotechnic arming switch
In-flight disconnect
Cosmic ray telescope
Lower thermal shield
Thermally
Scaled
Mock-up
x
x
x
Not Used
A discussion of the details of construction of the TSM and the
changes made in the octagonal bus structure to update the bus to simu-
late flight configuration will be presented in the following sections.
2. Octagonal Bus
The octagonal bus was modified during the Phase III program to
account for changes which had been made in the design of Mariner IV.
The changes in the TSM Phase II configuration were associated with a
new internal power distribution, changing the peripheral thermal shields
and increasing the number of louver assemblies from five to six.
The heaters used in the TSM subchassis to simulate the power dissi-
pated by the electronics in the spacecraft were wired so that the in-
ternal power could be changed to simulate a "cruise mode" of the space-
craft or a '%_ars playback" mode where the internal power is reduced.
The detailed power breakdown for the bus for both operational modes is
presented in Appendix III.
Figure 33 illustrates the basic bus configuration and the super-
structure ring supporting the high gain antenna.
Six of the eight bays (I, 3, 5, 6, 7, and 8) were equipped with
scaled thermal control louvers (c.f. Figures 34, 35 and 36). The tem-
37
_[rthur _i.tittle._J,c.
peratures at which the louver blades were fully open were adjusted in
accordance with Mariner IV specifications. The "full-open" temperature
was set at 80F for Bays 7 and 8 and 85F for the remaining bays. Four
louver blades were removed from the Bay 6 assembly to simulate the flight
assembly. These details are shown in Figure 35. Three blades were
removed from the lower right corner and one from the upper left corner.
38
_[rthur/_l._ittle,_ar.

3. Magnetometer
The flight configuration of the Mariner IV magnetometer comprised
a sensor ball, electronic chassis located above and below the sensor
ball, and a thermal shield. The hollow sensor ball was 4.350 inches
in diameter, and was made from fiberglas, gold plated to have a low
emittance. The electronic chassis attached to the top and bottom of the
sensor ball were made of 6061-T6 aluminum polished to have a low emit-
tance. The thermal shield consisted of a single aluminum foil to which
were attached i0 layers of 1/4 mil aluminized mylar and a single layer
of 5 mil aluminized teflon. The teflon layer faced the sun and the en-
tire assembly was thermally isolated from the upper electronics chassis.
The shield assembly shaded the upper electronics chassis and a portion
of the sensor ball from direct sunlight.
The TSM version of the magnetometer was a 2 inch diameter, 0.032
in. wall thickness, stainless steel ball, which was gold plated to have
a low emittance. The electronic chassis, located above and below the
sensor ball, were made from 6061-T6 aluminum, chemically polished to
obtain a low emittance surface. Instead of using a multi-layered in-
sulation shield, the TSM thermal shield consisted of a single polished
aluminum plate thermally isolated from the chassis. A thin teflon
sheet was cemented to this shield to provide the same surface emittance
as the outer layer of the flight magnetometer shield.
The TSM magnetometer was attached to the low-gain antenna by Ii00
aluminum brackets. The magnetometer was isolated from the brackets by
use of micarta stand-offs. Four #2-56 screws held the magnetometer.
39
_rthur/_._ittleJJur.
The magnetometer mounting brackets were attached to the antenna by four
aluminum rivets. This construction, from a thermal standpoint, was
similar to the method used in supporting the magnetometer to the antenna
on the flight configuration.
The magnetometer assembly used on the TSM was not designed by
exactly scaling all of the conductive paths on the full-scale version.
The approach taken here was to provide a scaled amount of power dissipa-
tion, scale the effective radiating area and isolate the magnetometer
from the antenna, and use a thermal shield to shadow part of the mag-
netometer. The effective radiating area was scaled by using the same
surface finishes, retaining over-all geometric similarity and scaling
down the dimensions by the scaling ratio of 0.43. Similar materials in
model and prototype were, in fact, used to fabricate the electronic sub-
chassis. The reasons for this approach stem from the fact that the in-
ternal power was small and, therefore, gradients within the structure
were judged to be small.
4. Ion Chamber
The ion chamber experiment consists of an electronic chassis,
an ion sensor ball, a detector tube and a thermal shield which partially
shadows the electronic chassis from direct sunlight. The ion chamber
was attached to the low-gain antenna by use of thermal standoffs.
The 5 inch diameter ball of the prototype ion sensor was fabricated
from stainless steel and had a wall thickness of 0.010 inches. A black
oxide coating was applied to the exterior surface. The temperatures
within the ball were judged to be governed by radiative effects rather
than conductive effects. Therefore, the ion chamber used on the TSM
4O
_rthur _._ittleJJnr.

was also made from stainless steel (because of availability) with a
wall thickness of 0.032 inches.
The prototype GM detector was made from a thin wall stainless tube.
A nylon rod with the same paint pattern was used on the TSM.
The gold plated prototype electronics chassis was made from
ZK 60 T-5 magnesium (k = 1.21 watts/cm-K), while the model chassis was
fabricated from 1015 steel (k = 0.64 watts/cm-K). The wall thicknesses
were 0.062 in. and 0.031 in. for the prototype and model. In this
case, the thermal scaling laws were not strictly adhered to since
the wall thickness was reduced by 0.5 rather than 0.43 and the ratio
of conductivities was 0.53 instead of 0.43. It was believed that these
differences would not appreciably change the temperature distributions.
The prototype thermal shield consisted of a i/4-inch thick, alumi-
num honeycomb. The top surface was painted and the bottom surface polished
to have a low emittance. A i/8-inch micarta shield, painted in the same
fashion, was used on the TSM. A i/4-mil aluminized mylar sheet was
cemented to the bottom to produce a low emittance surface.
5. Low-Gain Antenna
The prototype low-gain antenna was a 3.875 inch ID, 6061-T6 alumi-
num alloy tube, with a .025 inch wall thickness. The ground plane,
magnetometer and ion chamber were attached to the antenna. The external
surface of the antenna was highly polished (mirror-like finish) in order
to obtain a low emittance surface. The lower end of the antenna was
riveted to a ring and bolted to the bus. Two support rods were used to
stabilize the antenna. One of these support rods was attached to the
41
_rthur _}._ittle,_Jnr.

bus and the other to the superstructure ring. These support rods are
identified as the short and long dampers for the low-gain antenna. One
damper was black anodized, the other was painted. The prototype ground
plane was a i/4-inch aluminun honeycomb ring, 7 inches in diameter. The
top and sides were painted, the bottom surface was polished aluminum.
Due to the fact that the ion chamber and magnetometer assemblies
were thermally isolated from the antenna, their temperatures are not
significantly influenced by the antenna temperature. In addition, the
heat loss from the bus via the shaded antenna was conservatively calcu-
lated to be small with respect to the total internal power dissipated
within the spacecraft. This calculation is presented in Appendix IV.
Therefore, the TSM antenna was designed to simulate rather than exactly
scale the temperature distributions in the prototype.
The TSM antenna was fabricated from a 1.75 inch OD aluminum tube
having a wall thickness of 0.022 inch. The exterior surface was polished
to have essentially the same emittance as the prototype. The TSM ground
plane was made from i/8-inch thick micarta, and painted with the same
paints as used on the prototype. The two dampers used to support the
antenna on the TSM were made from I/4-inch diameter fiberglas rod. They
were also painted to have the same surface characteristics as the proto-
type.
6. Hi_h-Gain Antenna
The temperature of the high-gain antenna does not significantly in-
fluence other temperatures within the spacecraft since it is supported
by a structure of low conductance. Of more importance was the shadow
42
_[rthur _._ittIe._J_c.
pattern cast by the antenna on the spacecraft bus. Therefore, the over-
all shape of the prototype antenna was scaled so that the shadow patterns
would he similar in model and prototype. The TSM antenna was made from
i/8-inch thick aluminum, the prototype antenna was fabricated from alumi-
num honeycomb. Identical surface finishes were used in model and proto-
type.
The antenna feed was more or less mocked-up from the prototype.
Conductive paths were not scaled, but the surface finishes and over-all
geometry were made similar.
7. Cosmic Dust Detector
The prototype cosmic dust detector consisted of a rectangular, mag-
nesium sensing plate (with a vacuum deposited aluminum outer surface)
which protruded from the upper thermal shield. An electronic subchassis
was attached to the sensing plate below the thermal shield. The entire
assembly was supported by the superstructure.
The TSM sensing plate for the detector was fabricated from aluminum,
polished to have a low emittance, with a wall thickness of 0.032 inches.
Calculations showed that the temperature gradients in the sensing plate
would be small and that the total heat leak from the plate would be small
because of its low surface emittance. For these reasons, the conductive
paths were not scaled exactly; however, the proper area and a low sur-
face emittance were used on the modeled version of the detector.
8. Sun Sensors
The sun sensors on the prototype are mounted to pedestals which, in
turn, are attached to the spacecraft bus by three #6-32 bolts. No pro-
visions were made for thermally isolating the sensors or pedestals. The
43
_lrthur _l._i.ttle,_Jnc.

sensor pedestals were made from ZK 60 magnesium, gold plated on the out-
side to have a low emittance.
The design of the TSM sun sensor assembly was based on the fact
that the heat flow through the pedestal walls would influence the tem-
perature of the sensor and the heat flow into or out of the bus. The
same paint patterns and surface finishes were used in model and prototype
and the conductive paths in pedestal were scaled as follows.
The heat flow paths in the pedestal were two-dimensional and,
therefore, the wall thicknesses can be distorted to obtain the proper
scaled conductive paths. Equation 3 requires that the ratio of conduc-
tivities of model and prototype be equal to the geometric scaling ratio.
However, for one or two-dimensional heat flow patterns, it is only nec-
essary to make the conductances scale in model and prototype for identi-
cal temperature distributions. The relationship is
k 6 = k 8 R 2 (3a)m m p p
where
k - thermal conductivity
8 - wall thickness
R - geometric scale factor
p - prototype
m - model
Thus, the product of conductivity and wall thickness must be scaled for
thermal similitude. It was desired to use a reasonably thick wall sec-
tion (for fabrication purposes) of low conductivity such as 410 stain-
less steel.
44
_¢thur/_._ittle._.c.

The required wall thickness of the model pedestal is given by:
k
S -- S -_ R2m p k
m
Inserting the following numerical values
we find that
SP
R = 0.43 - the scale ratio
k = 1.20 watts/cm-K (ZK 60 mag.)P
k = 0.27 watts/cm-K (410 S.S.)m
= 0.040 in.
S = 0.032 inches.m
The actual fabrication was made with 20 gauge material with a thickness
of 0.036 inches.
The previous calculation illustrates the fact that where the heat
flow patterns are not three-dimensional, a combination of selecting a
material and convenient wall thickness can be used to produce modeled
sections of approximately the right conductance.
The sensors which were mounted on the pedestals were machined
from aluminum in the TSM. Because of their small size and short path
lengths for heat flow, it was judged that only a small temperature grad-
ient could exist. The surface finishes and over-all geometry were made
similar in model and prototype.
9. Trapped Radiation Detector
The chassis of the prototype detector was fabricated from AZ31B
magnesium alloy with a thickness of approximately 0.030 inches. Four
45
_rthur/ll._ittle,_nr.

detector tubes mounted on the chassis were thermally coupled to the chassis
by use of indium foil washers. The chassis was thermally isolated from
the frame of the spacecraft by insulating washers at the four bolting
points.
The TSM Chassis was fabricated from 0.030 inch thick 304 stainless
steel and micarta washers were used to thermally isolate the chassis
from the bus. Indium foil gaskets were used at the joint between the
detector tubes and chassis. Identical paint and surface finishes were
used in model and prototype.
I0. Absorptixity Standard and Plasma Probe
These instruments were both conductively isolated from the space-
craft bus by use of insulating washers and the upper thermal shield pre-
vented radiation transfer from these instruments to the spacecraft bus.
Thus, their temperatures were not important to the over-all temperature
level of the spacecraft.
The absorptivity standard used on the TSM was a mock-up. The over-
all geometry was scaled; however, no attempt was made to scale the con-
ductive paths within the instrument. The plasma probe used on the TSM
was geometrically scaled and similar paint patterns were used on model
and prototype.
ii. Insulation and Shielding
The lower thermal shield of the prototype consisted of 20 layers of
I/4-mil thick aluminized mylar and two layers of l-mil aluminized teflon.
The 20 layers of aluminized mylar were placed between the two layers
of aluminized teflon. In both cases, the teflon sheets faced outward.
46
2Irthur/_._ittle.3htc.

Lightweight aluminum angles were sewn to the insulation and bolted to
the spacecraft frame to support the assembly.
It was estimated that the heat flow through the lower shield was
small with respect to that dissipated by the louver assemblies. On
the reduced scale TSM version, only five layers of aluminized mylar
were used. The reduction in the number of layers was based on previous
experience which has shown that it is possible to increase the heat leak
in small packages because the proportions of exposed edges and seams
increase with respect to the total area as the size is reduced.
The upper thermal shield used on the prototype was composed of 30
layers of i/4-mil thick aluminized mylar, a layer of l-mil aluminized
teflon, and a layer of 5-mil thick black dacron. The outer surface of
the upper thermal shield was black dacron, and to this was sewn 30 layers
of aluminized mylar and a layer of aluminized teflon.
The TSM upper thermal shield was composed of one layer of 5-mil
black dacron and five layers of i/4-mil aluminized mylar. This assembly
was sewn together with the black dacron material facing outward.
Portions of the eight bays on the bus were shielded by use of thin
(0.010 inch) polished aluminum shields having a low emittance. These
peripheral shields were used at the edges of the louver assemblies and
on the corners of the octagonal bus. Bay 4 was entirely shielded with
a peripheral shield (c.f. Figure 35). The prototype thermal shields
were thermally shorted at the attachment points. The TSM peripheral
shields were also made of polished aluminum approximately 0.010 inches
thick and they were thermally shorted to the bus structure. The louver
47
_rthur _l._ittle,_nr.

assemblies have a high effective radiating area by comparison to the
effective radiating area of the shields; and, therefore, the degree to
which conductive paths in the shields or emittances are scaled is rela-
tively unimportant as long as the emittance is reasonably low. In order
to preserve the low emittance in model and prototype, it was decided to
use similar materials in both.
12. Solar Panels
In the solar simulation tests of the TSM, the solar beam was not
large enough to completely illuminate the four solar panels. Therefore,
the incident solar flux which would normally be absorbed was simulated by
use of heaters attached to the bottom of each solar panel.
As shown in Figures 25 and 28, the geometry of the TSM solar panels
was distorted. In the flight spacecraft, the temperatures of the outboard
sections of the solar panels do not influence the spacecraft temperatures
because the radiant interchange view factor becomes extremely small.
The widths of the TSM panels were geometrically scaled from the proto-
type. The length was chosen on the basis of radiant interchange. At
the extreme outboard edge of the TSM panel, the view factor to the space-
craft bus was calculated to be of the order of 2 percent, whereas the
view factor at the inboard edge is approximately 50 percent.
The conductive paths in the TSM solar panels were not scaled from
the prototype except that similar mounting arrangements, reduced in scale,
were used to support the panels at the spacecraft bus. The reason that
conductive paths were not scaled is that the solar flux which is uniformly
absorbed on the panels is large with respect to the flux emanating from
the spacecraft. The temperature gradients in the panels are, therefore, small.
48
_lrthur _l._ittle,_ttr.
The heaters used to provide the proper boundary temperatures on the
TSM solar panels were designed to have a uniform spatial power dissipa-
tion. Data on the effective solar absorptance of a prototype panel was
used to calculate the power to be dissipated in each of the four solar
panel heaters for the TSM tests in which the solar panels were not
illuminated.
13. Planetary Science
The planetary science instruments consist of a TV camera, Mars
gate, acquisition sensor, SPITS, and a movable science cover. This
equipment is extremely complex and the design of the TSM version was
primarily based on an attempt to reproduce, in scaled fashion, the
effective radiating area of the entire system. Thus, the heat leak
from the spacecraft bus would be scaled.
The science equipment, being on the shaded side of the bus, radiates
to the outer space environment and is radiatively coupled by high emit-
tance surfaces to the interior of the bus above the lower thermal shield.
Some conductive coupling to the bus is made via the rotating support
structure.
The TSM version of these instruments was considerably simplified
in detail; however, the over-all dimensions and surface emittances were
properly scaled.
14. Canopus Tracker
The prototype canopus tracker consisted of an internal chassis to
which the electronics, light baffles, and detector were attached. The
structure was made of 6061 aluminum approximately 0.050 inches thick
49
_rthur _l._ittb,_nr.

and was bolted to the lower frame of the bus without any thermal isolation
by four #8-32 screws. An 0.020 inch thick polished aluminum thermal shield
was bolted to the chassis. Electrical connections between the canopus
tracker and the interior of the bus were made by an electrical connector
and cable assembly.
A view of the interior of the scaled TSM canopus tracker and thermal
shield is shown in Figure 40. The chassis was scaled (c.f. Equation 3a)
by use of 0.029 inch thick 1018 steel. Four #6-32 screws were used for
mounting. The thermal shield was not conductively scaled. It was fab-
ricated from 0.020 inch thick polished aluminum, and bolted directly to
the chassis. The aperture size was scaled and the interior surface
finishes were identical in model and prototype.
15. Surface Finishes
Since it was desired to have identical surface properties in model
and prototype, the various paint patterns used on the flight version
were reproduced in the model. Because space does not permit listing
all of the paint patterns in detail, the characteristics of the thermal
control surfaces are summarized in Appendix V for each of the appendages.
50
_rthur/11._ittle,_.r.

B. Test Facility
The solar simulation tests of the Phase III TSM configuration
were conducted in the NASA Lewis Research Center Solar Simulator. A
schematic drawing of this facility is shown in Figure 37.
The working space is approximately 6 feet in diameter and i0 feet
in length. The inner shroud is coated to have a high infrared emittance
and solar absorptance and was cooled to liquid nitrogen temperature for
the TSM tests. (The facility does have provisions for cooling the shroud
to near liquid helium temperatures; however, this feature was not used
in the TSM tests.) During all tests of the TSM the pressures with the
-6test chamber were maintained below i0 torr.
A modified Genarco ME-6, 28 KW, Carbon Arc Lamp is used as an
energy source. Various diaphragms and a set of fused quartz absorbing
plates are used to control the intensity of the simulated solar radia-
tion at the test plane.
The radiation enters the optical tower via a system of condenser
lenses, a flat mirror and a small field lens mounted in the side of the
optical tower. A spherical collimator of 15 foot focal length is used
to direct the radiation through a 36 inch diameter fused quartz lens,
which is mounted approximately 12 feet above the test plane. The optical
tower is evacuated during operation to minimize the required thickness
of the large quartz window, to minimize the absorption in the optical
path and to keep the large optical elements clean.
The intensity of the simulated beam is measured and continuously
monitored during testing by use of three water-cooled Hy-Cal Engineering
51
_thur _l._ittI_._nr.

Co. calorimeters mounted on a 20 inch diameter circle in a plane approxi-
mately six feet above the test plane. The Hy-Cal detectors were cali-
brated before and after the TSM tests by NASA Lewis personnel. The stated I
accuracy of the solar intensity measurements was + 5 percent.
The collimation of the solar simulator beam in the NASA Lewis
Simulator is reported 2 to be less than 2 degrees. The uniformity of the
beam varies over the test plane. In three of the four quadrants, the
uniformity of illumination is reported 3 to be within approximately + 5
percent over a 22 inch diameter. The intensity in one quadrant falls
off by approximately 20 percent at a diameter of 20 inches due to the
"tail flame" formation in the arc lamp source.
A diagram showing the solar illumination pattern of the TSM during
the tests at NASA Lewis is presented in Figure 38. The location of the
circle of illumination with respect to the model is shown in Figure 13
with the shadow pattern of the intensity sensors. It can be seen that
the illumination pattern was slightly de-centered with respect to the
spacecraft and that the shadow of one of the intensity sensors (viz.,
sensor #i) fell on the exposed area of the Trapped Radiation Detector.
This situation was unavoidable since it was desired to have the low-gain
antenna located between sensors #I and #2--where the intensity of the
beam was most uniform--and major modifications to the support system were
required to relocate the sensors.
i. Sommers, R., NASA Lewis Research Center, Personal Communication,
June 15, 1965.
2. Uguccini, Orlando W., and Pollack, John L., '_ Carbon-Arc Solar Simu-
lator," Paper 62-WA-241, ASME, 1962.
3. Mark, H., NASA Lewis Research Center, Personal Communication, April 27,
1965.
52
_rthur _._ittle._nr.

During the test program, the desired solar intensity was set by
taking the average readings of the solar intensities as measured by the
#i and #2 Hy-Cal sensors. The simulated solar intensities were varied
by inserting various numbers of fused quartz absorbing plates in the
beam at the carbon arc lamp. During the TSM tests, the simulated solar
intensity was varied from a maximum of 0.091 watts/cm 2 (65.5 percent
of one solar constant) to a minimum of approximately 0.059 watts/cm 2
(42 percent of one solar constant) to simulate a range of flight inten-
sities.
53
_trthur _]._ittle,_nr.
C. Test Procedures
i. Description of Tests
The basic objective of the Phase III test program was to compare
the measured TSM temperatures with flight data obtained from the
Mariner IV at two solar intensity levels with a constant internal power
dissipation. These two tests were chosen to simulate the "cruise"
conditions of the spacecraft where the internal power dissipation is
relatively high. A third test was chosen to simulate a '_ars Playback"
mode where the internal power dissipation in the spacecraft is rela-
tive ly low.
The first test of the TSM was completed with a simulated solar
intensity equal to 65.5 percent of one solar constant (0.091 watts/cm 2
or 288.3 Btu/hr-ft 2). This test is identified with an '_arth Cruise"
operating mode. This simulated solar intensity corresponds to the solar
intensity incident upon the Mariner IV, 98 flight days from launch.
The power dissipation in the TSM was adjusted to simulate the cruise
mode of the Mariner IV with the cruise science and TWT "on", and the
cavity amplifier and battery charger "off."
The second test of the TSM was completed at a simulated solar
intensity equal to 45.5 percent of one solar constant (0.063 watts/cm 2
or 199.6 Btu/hr-ft2). This test is identified with a '_4ars Cruise"
operating mode. The simulated solar intensity corresponds to 180 flight
days. Both the '_arch Cruise" and '_4ars Cruise" TSM tests were completed
with the same internal power dissipation.
The third test of the TSM was completed at a simulated solar in-
tensity equal to 42 percent of one solar constant (0.059 watts/cm 2 or
54
_Irthur _l._l/.ittle,_Jnc.

186.9 Btu/hr-ft2). This test is identified with a '_ars Playback"
operating mode. The simulated solar intensity corresponds to the actual
intensity at 234 flight days. In the Mars Playback simulation, the in-
ternal power dissipated within the TSM was adjusted to simulate the
changes that occur in the Mariner power dissipation. The total internal
power dissipation in the bus of the Mariner decreases from approximately
149 watts to 137.5 watts in switching from the "Cruise" to 'Playback"
modes. In addition, in the 'Playback" mode no power is dissipated in
the magnetometer, ion chamber, cosmic dust and trapped radiation detec-
tors, the cosmic ray telescope and television assembly.
A fourth test of the TSMwas completed to determine the influence
of the temperatures of the simulated solar panels on the bus tempera-
tures of the TSM. With the TSM operating in a 'hMars Playback" mode,
the input power to the mocked-up solar panels was increased to arbi-
trarily raise their temperature by approximately 2OF.
The four tests of the TSM were completed in succession without
removing the TSM from the simulator. The time required to complete the
four tests (from pre-cooling of the chamber to removal of the model)
was approximately 72 hours; however, a considerable fraction of this
time was used in obtaining the proper simulated solar intensity. During
the tests, it was found that the TSM would reach thermal equilibrium
within a maximum time of approximately 5 hours provided that the
solar simulator could be held at a constant intensity for this period.
2. Test Measurements
Power was supplied to the TSM by use of a 300 volt DC power supply
with 0.007 percent regulation. The individual heaters used within the
55
_rthur _._ittle._n¢.

TSM were precision wire-wound power resistors. Power measurements
were made by current and resistance measurements. It was estimated
that the total power measurements were accurate to within 0.09 percent.
An auxiliary 36 volt DC, voltage regulated power supply was used to
supply power to the solar panel mock-ups.
The total power dissipated in the TSM was 27.616 watts for the
Earth and Mars cruise modes and 25.269 watts for the Mars Playback
mode. The total power dissipated within the mocked-up solar panels
was as follows:
Earth Cruise
Mars Cruise
Mars Playback
329.06 watts
199.08 watts
183.25 watts
Temperature measurements were made at 75 locations within the TSM.
Twenty of the 75 temperature sensors in the TSM were located at points
corresponding to the locations of the temperature sensors used in the
Mariner IV spacecraft for data transmission.
The TSM temperatures were measured by use of calibrated, matched
thermistors. The entire lot of thermistors had resistance vs. tempera-
ture characteristics such that any single thermistor would have an
error of less than + 1/2 F over the temperature range of 32 to 200 F
when a single resistance vs. temperature curve was used. Calibrations
were made by the vendor to establish the resistance vs. temperature
curve and three point calibrations of each thermistor were made by
Arthur D. Little, Inc., as acceptance tests.
A constant current of 30 microamps was supplied to the thermistors.
The voltages were read on a digital voltmeter. The voltages were trans-
56
_rthur _l._ittle,_J.r.

lated to temperature by use of a digital computer data reduction program.
It was estimated that the total system error in measuring the tempera-
tures was of the order of + 1/2 F in the range of 32 to 200 F. Below
32 F the accuracy of the measurements decreases. At temperatures in the
range of -20 F the accuracy is estimated to be + 5F.
The temperatures of the TSM were recorded at approximately half-
hour intervals until the TSM approached thermal equilibrium. Readings
were then taken at 15 minute intervals until the largest temperature
change over several consecutive readings was of the order of 1/2 F,
and the changes in temperature were random.
57
_lrthttr _l.$ittle,_nr.
D. Test Results
Tables i0, ii and 12 list the measured TSM temperatures and the
flight temperatures of Mariner IV as recorded by Jet Propulsion Labora-
tory.
The '_arth Cruise" temperatures measured for the TSM are in re-
markably good agreement with flight data with several exceptions. The
trapped radiation detector temperature was over 20F lower than the flight
measurement. The temperature predictions for the bus were also in good
agreement with flight results with the exception of the lower ring at
the Canopus mount on Bay 8 and the bottom of the attitude control N 2
tank also located in the vicinity of Bay 8. The TSM temperature pre-
dictions for the Canopus tracker showed poor agreement with flight
results while the TV camera and SPITS (Science Platform Inertial Thermal
Simulator) showed good agreement.
The data for the "Mars Cruise" mode are presented in Table Ii.
A comparison of the data for the E_rtb and Mars Cruise modes shows that
the entire temperature level of the spacecraft decreases appreciably
with a decrease in the solar intensity. The temperature drop of the
isolated sunlit appendages is approximately 30F. The thermal control
action of the louver assemblies and the relatively high internal power
dissipated within the bus reduces the temperature drop in the bus to
less than 1OF.
The largest errors in the temperature predictions for both the
Earth Cruise and Mars Cruise modes occur at the same locations; and,
in general, the TSM operated at a lower temperature level than Mariner IV.
58
_Irthur _._Little._.r.
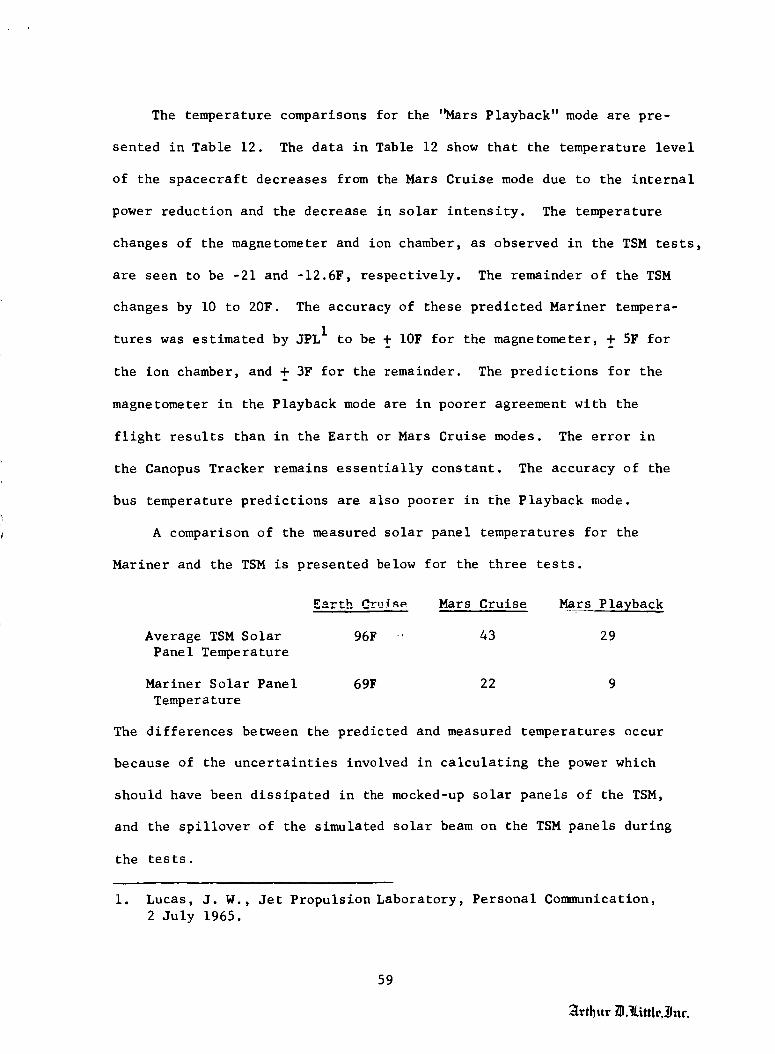
The temperature comparisons for the '_ars Playback" mode are pre-
sented in Table 12. The data in Table 12 show that the temperature level
of the spacecraft decreases from the Mars Cruise mode due to the internal
power reduction and the decrease in solar intensity. The temperature
changes of the magnetometer and ion chamber, as observed in the TSM tests,
are seen to be -21 and -12.6F, respectively. The remainder of the TSM
changes by i0 to 20F. The accuracy of these predicted Mariner tempera-
tures was estimated by JPL I to be + 10F for the magnetometer, + 5F for
the ion chamber, and + 3F for the remainder. The predictions for the
magnetometer in the Playback mode are in poorer agreement with the
flight results than in the Earth or Mars Cruise modes. The error in
the Canopus Tracker remains essentially constant. The accuracy of the
bus temperature predictions are also poorer in the Playback mode.
A comparison of the measured solar panel temperatures for the
Mariner and the TSM is presented below for the three tests.
Average TSM Solar
Panel Temperature
Mariner Solar Panel
Temperature
Earth Or,_,__ Mars Cruise Mars Playback
96F ' 43 29
69F 22 9
The differences between the predicted and measured temperatures occur
because of the uncertainties involved in calculating the power which
should have been dissipated in the mocked-up solar panels of the TSM,
and the spillover of the simulated solar beam on the TSM panels during
the tests.
i. Lucas, J. W., Jet Propulsion Laboratory, Personal Communication,
2 July 1965.
59
_lrthttr _._ittle,_Jm-.
Table 13 sun1_arizes the results of two tests made with the TSM
to determine the influence of solar panel temperature on the internal
temperatures of the bus. In both tests, the TSM power dissipation in
the bus was maintained constant. The data indicate that a 20F tempera-
ture change in the solar panel temperature changes the average internal
bus temperatures by approximately 2F.
Complete sets of temperature data for the four tests completed with
the TSM are presented in Tables 14, 15, 16, and 17. The first five
columns are channel identifications for the TSM, the full-scale TCM
and the MC-3 (Mariner IV)spacecraft thermocouple and telemetry channels.
The measured TSM temperatures are listed in columns 6 and 7.
60
_Irthur i_l._Littie,_rtr.

E. Discussion of Temperature Predictions
i. Sunlit Appendages
The temperature predictions for the ion chamber and magnetometer
for the '_arth Cruise" and '_ars Cruise" modes were extremely good.
The error was less than 6F at '_arth Cruise" and less than 13F at '%W_ars
Cruise." For these appendages whose temperatures are to a large extent
controlled by the solar intensity, the predictions are close to the
limit of experimental accuracy.
Temperature comparisons for the '_ars Playback" mode--where the
internal power dissipated in the magnetometer and ion chamber is switched
off--show that both TSM appendages were considerably higher in tempera-
ture than the predicted flight temperature. The errors were approxi-
mately 8F for the ion chamber and 27F for the magnetometer. An error
analysis of these sunlit appendages is presented in Appendix VI. The
results of this analysis show that an uncertainty of + 5 percent in
the simulated solar intensity would alone account for errors of + 5F
in the temperatures of these components. Other factors which must be
considered are the uncertainty intervals in the measured flight and test
temperatures.
The TSM temperature predictions for the Trapped Radiation Detector
were of questionable value. The TSM was installed in the NASA Lewis
Space Simulator in such a location that the area of the solar beam with
the best uniformity would fall upon the ion chamber and magnetometer
which were the two sunlit items of most importance to this modeling
study. Unfortunately, a shadow of one of the Hy-Cal intensity sensors
61
_rthur _._ittlc,3Jm-.

(mounted above the model) was cast on the exposed area and on the
shield covering the trapped radiation detector. This shadow pattern,
shown in Figure 38, could not be rearranged without major modifications
to the support ring and Hy-Cal water cooling lines and it was decided
to accent the errors which would be introduced by the shadow. In each
of the three tests, the detector temperature was 20 to 30F below the
flight temperature. Although it is anticipated that a significant frac-
tion of the error was introduced by the shadow pattern, further tests
would be required to determine the magnitude of the uncertainty.
2. Internal Bus Locations
In general, the TSM predictions for the bus temperatures were
sufficiently accurate for engineering purposes with the exception of the
Bay 8 lower ring above the Canopus tracker, and the bottom of the N 2
sphere also located in the vicinity of Bay 8. Comparing the three tests,
it can be seen that the bus temperature prediction errors tend to in-
crease as the absolute temperature level of the spacecraft decreases,
and the TSM bus is lower in temperature than the flight spacecraft.
At the Mars Cruise and Mars Playback modes, all of the bays except 6
and 8 are at a sufficiently low temperature to force the thermal con-
trol louvers closed. In this situation, the interior bus temperatures
are highly dependent upon the heat leakage in the louvers and the gaps
around the peripheral thermal shields. Small differences in the power
dissipated by the louver assemblies in the closed position produce
rather large uncertainties in temperature. For example, in a typical
set of fully-closed TSM louvers, a heat leak of I00 milliwatts will
produce a temperature change of 10F.
62
_rthur _ll.litth'._.t-.
The temperature comparisons of flight and TSM data also show that
the Bay 6 TSM temperature was approximately 12F higher than the corres-
ponding flight data at '_arth Cruise." This difference is attributed
to errors in the thermal performance of the scaled TSM louver assemblies.
In this particular bay, four of the louver blades are removed so that
approximately 20 percent of the effective reradiating area of the shear
web is unaffected by the position of the louver blades. In previous
tests of the TSM louver assemblies (c.f. Figure 21), it was shown that
the thermal performance of the half-scale louver assemblies did not
exactly correlate, on a scaled basis, the measured performance of a full-
scale assembly. The test results showed that an error of 5 percent in
the effective reradiating area of the louver assemblies would produce an
error of approximately 7F in the average bay temperature with the louver
blades wide open. Non-scaled areas and differences in the emittances
of the shear web between model and prototype could easily account for
an error of 5 to i0 percent in the reradiating area.
The uncertainty in the average bus temperature due to the errors
in simulating the thermal boundary conditions for the solar panels is
less than 2F.
The TSM lower ring and N 2 tank temperatures were 30F below the
temperatures measured for the flight spacecraft (c.f. channels 430 and
218 in Table I0). Also the complete temperature results of the TSM
listed in Table 14 show that the temperature difference between the top
and bottom (near the lower ring) of Bay 8 was approximately 20F. Pre-
vious Phase II thermal tests of the bus, with the same internal power
dissipation, showed that the temperature difference was less than 5F.
63
_[rthur _._ittle,_ttc.

The N 2 tank is radiatively coupled to the lower thermal shield and,
therefore, its temperature is sensitive to changes in the heat flux
through the lower thermal shield. Previous Phase II tests of the bus
with a similar lower thermal shield showed that the temperature of the
same N 2 tank was approximately equal to the average Bay 8 temperature.
In these Phase Ill tests, its temperature was considerably below the
average Bay 8 temperature.
The temperature prediction errors associated with the lower ring
(frame) and the bottom of the N 2 bottle, both in Bay 8, are traceable,
in part, to heat leaks in the lower thermal shield. During transpor-
tation of the model to NASA Lewis, a large electrical connector worked
loose within the model and completely punctured the lower thermal shield
in the vicinity of Bay 8. Due to scheduling problems, a new thermal
shield could not be fitted, and it was necessary to repair the damaged
shield by interleaving additional layers of aluminized mylar between the
torn segments. Thermal short circuits resulting from these repairs
undoubtedly affected the efficiency of the super-insulation blanket.
In addition, it is noted that the temperature predictions for the
Canopus tracker were in error. It will be shown in a following section
that the power radiated from the Canopus tracker was excessive and,
therefore, this additional heat leak influenced the frame (lower ring)
and Bay 8 temperature predictions. Unfortunately, it is difficult
analytically to compute the relative importance of the damaged lower
thermal shield or the increased heat leak from the Canopus tracker
on the internal bus temperatures. However, the results of a simplified
64
_rthur _._{ttIt',_rtt'.

error analysis of the TSM Canopus tracker thermal performance show
that the error in the average TSM bus temperature was of the order of
6F due to the increased heat leak from the Canopus tracker.
3. Shaded Appendages
The TSM temperature predictions for the TV camera and SPITS were
accurate to within approximately 10F for all tests. The predictions
for the Canopus tracker were, however, in error by 50 to 60F.
The temperature of the Canopus tracker (c.f. Figure 40) is con-
trolled by its internal power dissipation, the rate of heat flow through
the joint where four bolts are used to attach the appendage to the
lower frame, and its effective radiating area.
The temperature difference across the bolted joint can be obtained
by comparing the measurement channels 430 and 410 in Table I0. For
the TSM, the temperature difference across the joint was approximately
30F whereas the measured temperature difference across the joint in
Mariner IV was only 5F. Several effects could produce this situation°
If the internal power dissipation in the TSM Canopus tracker was in-
correctly scaled, the temperature could be in error. A check of the
heater circuit showed that the power was correctly modeled and that
the power was dissipated during the testing. An improperly scaled
joint wi_h a high thermal resistance would increase the temperature
difference across the joint. Finally, if the TSM version of the
Canopus tracker were to have an effective radiating area larger than
that predicted by the scaling laws, the temperature difference across
the joint would increase due to the increased heat flow rate and the
temperature of the Canopus would be too low. An error in the effective
65
_rthur _._itt[e,3Jm-.

radiating area could be caused by differences in the emittance or
effective shielding factor of the thermal shield between the TSM and
Mariner IV. Furthermore, a non-scaled power dissipation would influence
the temperatures of the lower ring of the bus.
After completing the solar simulation tests, the TSM Canopus
tracker was removed from the bus and a number of tests were completed
to determine the cause of the error in the TSM temperature predictions.
The tracker was mounted on a heated plate whose temperature could be
varied to simulate the lower ring temperature. Super-insulation was
placed between the Canopus tracker and the plate (except for the mounting
bolt penetrations) to simulate the effect of the lower thermal shield.
The unit was tested in a small, cold-wall, vacuum chamber. The test
results are presented in Appendix VII.
The first two tests were run with the Canopus tracker in its
original test condition to verify that the temperatures measured in
the _olar simulation _sts could be reproduced in the small test
chamber. The third test was made to determine the influence of bolt
torque, and, therefore, the joint conductance, on the temperature dif-
ference across the joint. The results of this test showed that in-
creasing the bolt torque by a factor of three decreased the temperature
difference by approximately 8F. However, the temperature difference
was still in error by 20 to 25F. A fourth test was run to determine
the influence of adding additional light baffles in the aperture of
the Canopus tracker since in the design of the scaled version four
baffles used in the prototype configuration were eliminated. This
change did not influence the temperatures. A final test was conducted
66
_[rthur _II._i,Ie._nr.

to determine whether or not the shielding on the Canopus tracker was
effective. Two layers of i/4-mil aluminized mylar super-insulation
were applied to the exterior surface except for the aperture. The
results of this test showed that the addition of the insulation de-
creased the temperature drop to 2F which was approximately the tempera-
ture difference as measured in Mariner IV.
The test results showed that the errors in the Canopus tracker
temperature predictions were caused by a combination of errors in
modeling the joint conductance and the effective radiating area of the
thermal shield surrounding the chassis. The non-scaled radiating area
effect was dominant. The error in the effective radiating area could
have been produced by scaling errors in: i) the emittance of the thermal
shield; 2) the conductive paths in the shield; and 3) the areas of exposed
gaps between the edges of the thermal shields. Because of time limi-
tations the actual source of this error was not determined by further
tests. However, it is anticipated that Jet Propulsion Laboratory
will make further tests to determine the source of the uncertainty.
A summary of the test data on the Canopus tracker and an analysis
of the uncertainties is presented in Appendix VII.
67
_rthur _l._ittle,_n_.

TABLE i
SUMMARY OF PHASE II TEST CONDITIONS
Power (watts)
TCM Bus
TCM Hat
TCM TOTAL
TSM Bus
TSM Hat
TSM TOTAL
Test 1 Test 2 Test 3 Test 3A Test 4
147o37 147.37 147.37
23.6 264.0 50.2
170.97 411.37 197.57
27.21 27.21 27.21 27.21 27.21
4.36 48.81 9.28 9.28 9.28
31.57 76.02 36.49 36.49 36.49
Louver Positions
Bay 1
Bay 3
Bay 4
Bay 7
Bay 8
Free Free
Free Free
Free Free
Free Free
Free Free
Caged Open Caged Open
_o_o_ nDen Caged Open
Caged Closed Caged Closed
Caged Closed Caged Closed
Caged Closed Caged Closed
Caged Open
Caged Open
Caged Closed
Caged Closed
Caged Closed
68
_thur _l.tit_le,_nr.
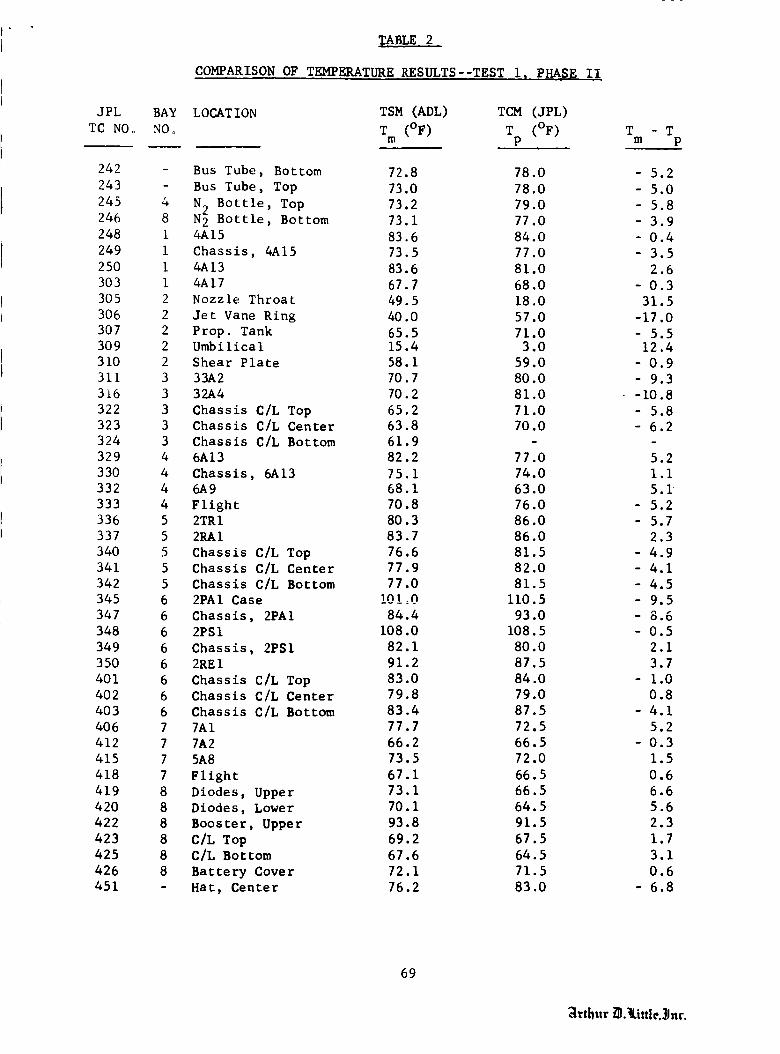
_,BLE 2
COMPARISON OF TEMPERATURE RESULTS--TEST i, PHASE II
JPL
TC NO o
BAY LOCATION TSM (ADL) TCM (JPL)
NO o Y (°F) T (°F)m p
242
243
245
246
248
249
250
303
305
306
307
309
310
311
3i6
322
323
324
329
330
332
333
336
337
340
341
342
345
347
348
349
350
401
402
403
406
412
415
418
419
420
422
423
425
426
451
Bus Tube, Bottom 72.8 78.0
Bus Tube, Top 73.0 78.0
4 N 2 Bottle, Top 73.2 79.08 N 2 Bottle, Bottom 73.1 77.0
i 4A15 83.6 84.0
I Chassis, 4A15 73.5 77.0
I 4A13 83.6 81.0
i 4A17 67.7 68.0
2 Nozzle Throat 49.5 18.0
2 Jet Vane Ring 40.0 57.0
2 Prop. Tank 65.5 71.02 Umbilical 15.4 3.0
2 Shear Plate 58.1 59.0
3 33A2 70.7 80.0
3 32A4 70.2 81.0
3 Chassis C/L Top 65.2 71.0
3 Chassis C/L Center 63.8 70.0
3 Chassis C/L Bottom 61.9
4 6A13 82.2 77.0
4 Chassis, 6A13 75.1 74.04 6A9 68.1 63.0
4 Flight 70.8 76.0
5 2TRI 80.3 86.0
5 2RAI 83.7 86.0
5 Chassis C/L Top 76.6 81.5
5 Chassis C/L Center 77.9 82.0
5 Chassis C/L Bottom 77.0 81.5
6 2PAl Case !0!o0 110.5
6 Chassis, 2PAl 84.4 93.0
6 2PSI 108.0 108.5
6 Chassis, 2PSI 82.1 80.0
6 2REI 91.2 87.5
6 Chassis C/L Top 83.0 84.0
6 Chassis C/L Center 79.8 79.0
6 Chassis C/L Bottom 83.4 87.5
7 7AI 77.7 72.5
7 7A2 66.2 66.5
7 5A8 73.5 72.0
7 Flight 67.1 66.5
8 Diodes, Upper 73.1 66.5
8 Diodes, Lower 70.1 64.5
8 Booster, Upper 93.8 91.5
8 C/L Top 69.2 67.5
8 C/L Bottom 67.6 64.5
8 Battery Cover 72.1 71.5
- Hat, Center 76.2 83.0
r _
mTP
-5.2
- 5.0
-5.8
-3.9
- 0.4
-3.5
2.6
-0.3
31.5
-17.0
- 5.5
12.4
0.9
9.3
-i0.8
5.8
6.2
5.2
i.i
5.1
5.2
5.7
2.3
- 4.9
-4.1
4.5
9.5
8.6
0.5
2.1
3.7
1.0
0.8
-4.1
5.2
-0.3
1.5
0.6
6.6
5.6
2.3
1.7
3.1
0.6
- 6.8
69
_rthur _l._Litth..]lnr.

JPL
TC NO o
242
243
245
246
248
249
250
303
305
306
307
309
310
311
3i6
322
323
324
329
330
332
333
336
337
340
341
34?
345
347
348
349
350
401
402
403
406
412
415
418
419
420
422
423
425
426
451
TABLE 3
COMPARISON OF TEMPERATURE RESULTS--TEST 2, PHASE II
BAY LOCATION TSM (ADL) TCM (JPL)
NO. T (OF) T (OF)m p
Tm
TP
Bus Tube, Bcttom 145.1 160.0 - 14.9
Bus Tube, Top 139.1 151.0 - 11.9
4 N2 Bottle, Top 147.8 159.0 - 11.28 N2 Bottle, Bottom 126.7 143.0 16.3
I 4A15 104.2 III.0 6.8
i Chassis, 4A15 96ol 102.5 6.4
i 4A13 103.4 117.0 13.6
i 4A17 91.5 97.5 6.0
2 Nozzle Throat 95°3 64.0 31.3
2 Jet Vane Ring 83.8 109.5 - 25.7
2 Prop. Tank 120.0 134.0 - 14.0
2 Umbilical 45.8 32.0 13.8
2 Shear Plate 108.2 i00.0 8.2
3 33A2 107o6 118.0 - 10.4
3 32A4 96.1 iii.0 - 14.9
3 Chassis C/L Top 95.8 i01.0 - 5.2
3 Chassis C/L Center 85.3 90.0 - 4.7
3 Chassis C/L Bottom 85.0 - -
4 6A13 119.7 109.0 10.7
4 Chassis, 6A13 110.8 102.5 8.3
4 6A9 95.5 84.0 11.5
4 Flight 99.2 103.0 - 3.8
5 2TR I 138.9 144.0 - 5. i
5 2RAI 134.3 138.0 - 3.7
5 Chassis C/L Top 133.8 136.0 - 2.2
5 Chassis C/L Center 130.1 134.0 - 3.9
5 Chassis C/L Bottom 126.3 131.0 - 4.7
6 2PAl Case 144.7 157.0 - 12.3
6 Chassis, 2PAl 129.9 141.0 - ii.i
6 2PSI 152.6 155.0 - 2.4
6 Chassis, 2PSI 126o3 124.0 2.3
6 2REI 133. i 132.0 i.I
6 Chassis C/L Top 134.3 135.5 1.2
6 Chassis C/L Center 123.7 123.5 0.2
6 Chassis C/L Bottom 127.9 134.0 6.1
7 7AI 114.0 112.0 2.0
7 7A2 95.0 102.0 - 7.0
7 5A8 112.2 112.0 0.2
7 Flight 95.4 99.0 - 3.6
8 Diodes, Upper 103.7 96.0 7.7
8 Diodes, Lower 95.0 93.0 2.0
8 Booster, Upper 122.2 118.0 4.2
8 C/L Top 99.4 95.0 4.4
8 C/L Bottom 89.9 90.5 - 0.6
8 Battery Cover 114.0 115.0 - 1.0
- Hat, Center 185.2 214.0 - 28.8
70
_tthur _l._ittleJJn¢.

JPL
TC NO o
242
243
245
246
248
249
250
303
305
306
307
309
310
311
3i6
322
323
324
329
330
332
333
336
337
340
341
342
345
347
348
349
350
401
402
403
406
412
415
418
419
420
422
423
425
426
451
TABLE 4
COMPARISON OF TEMPERATURE RESULTS--TEST 3, PHASE II
BAY LOCAT ION
NOo
Bus Tube, Bcttom
Bus Tube, Top
4 N2 Bottle, Top8 N2 Bottle, Bottomi 4A15
i Chassis, 4A15
i 4A13
i 4AI 7
2 Nozzle Throat
2 Jet Vane Ring
2 Prop. Tank
2 Umbilical
2 Shear Plate
3 33A2
3 32A4
3 Chassis C/L Top
3 Chassis C/L Center
3 Chassis C/L Bottom
4 6A13
4 Chassis, 6A13
4 6A9
4 Flight5 2TRI
5 2RAI
5 Chassis C/L Top
5 Chassis C/L Center
5 Chassis C/L Bottom
6 2PAl Case
6 Chassis, 2PAl
6 2PSI
6 Chassis, 2PSI
6 2RE I
6 Chassis C/L Top
6 Chassis C/L Center
6 Chassis C/L Bottom
7 7AI
7 7A2
7 5A8
7 Flight
8 Diodes, Upper
8 Diodes, Lower
8 Booster, Upper
8 C/L Top
8 C/L Bottom
8 Battery Cover
- Hat, Center
TSM (ADL) TCM (JPL)
T (OF) r (OF)m p
74.5 80.0
73.9 78.5
74.8 79.5
73.6 77.5
63.5 64.5
51.9 54.5
63.6 62.5
46.4 46.5
38.1 9.0
29.8 45.5
55.3 60.5
-0.1 -I0.5
45.6 39.5
48. i 55.5
45.5 57.5
40.9 44.0
35.0 37.5
35.1
82.0 73.5
74.0 69.5
65.2 69.5
68.8 71.5
82.9 87.5
85.6 87.5
78.6 82.0
79.5 82.078.2 81.5
103.8 "_LJI".5
87.5 95.5
111.9 112.5
86.9 85.0
95.7 93.0
87.6 89.0
83.8 83.5
87.7 91.5
88.1 83.5
77.2 79.0
86.2 85.5
80.8 81.5
85.9 80.582.0 77.5
98.6 95.5
81.2 80.0
78.1 75.0
77.9 75.5
83.8 94.0
Tm
TP
- 5.5
4.6
4.7
3.9
1.0
2.6
i.I
- 0.i
29.1
- 15.7
- 5.2
I0.4
6.1
- 7.4
- 12.0
- 3.1
- 2.5
8.5
4.5
- 4.3
- 2.7
- 4.6
- 1.9
- 3.4
- 2.53.3
9.7
8.0
0.6
1.9
2.7
- 1.4
0.3
- 3.8
4.6
- 1.8
0.7
- 0.7
5.4
4.5
3.1
1.2
3.1
2.4
- 10.2
71
_rthttr _l._.itt|e, JJ.r.

TABLE 5
COMPARISON OF AVERAGE BAY TEMPERATURES
PHASE II
BAY I
LOUVERED
Internal Power (Earth Cruise)
TCM (JPL)
TSM (ADL)
Error in Model Temperature (%)
TCM 20.898 watts TSM 3.864 watts
Test 1 Test 2 Test 3
77.5F 107.OF 57.0F
77.0F 98.8F 56.4F
-0.093 -1.446 -0.116
BAY 2
POST INJECTION PROPULSION SYSTEM
Internal Power TCM 0.0 watts
Test i Test 2
41o6F 87.9F
45.7F 90.6F
(_) +0.817 +0.493Error
TCM (JPL)
TSM (ADL)
in Model Temperature
BAY 3
LOUVERED
Internal Power (Earth Cruise)
TCM (JPL)
TSM (ADL)
Error in Model Temperature (%)
TSM 0.0 watts
Test 3
28.8F
33.9F+1.044
TCM 9.118 watts TSM 1.686 watts
Test I _est 2 Test 3
70.8F 96.6F 45.0F
66.4F 93.9F 40.9F
-0.829 -0.485 -0.811
72
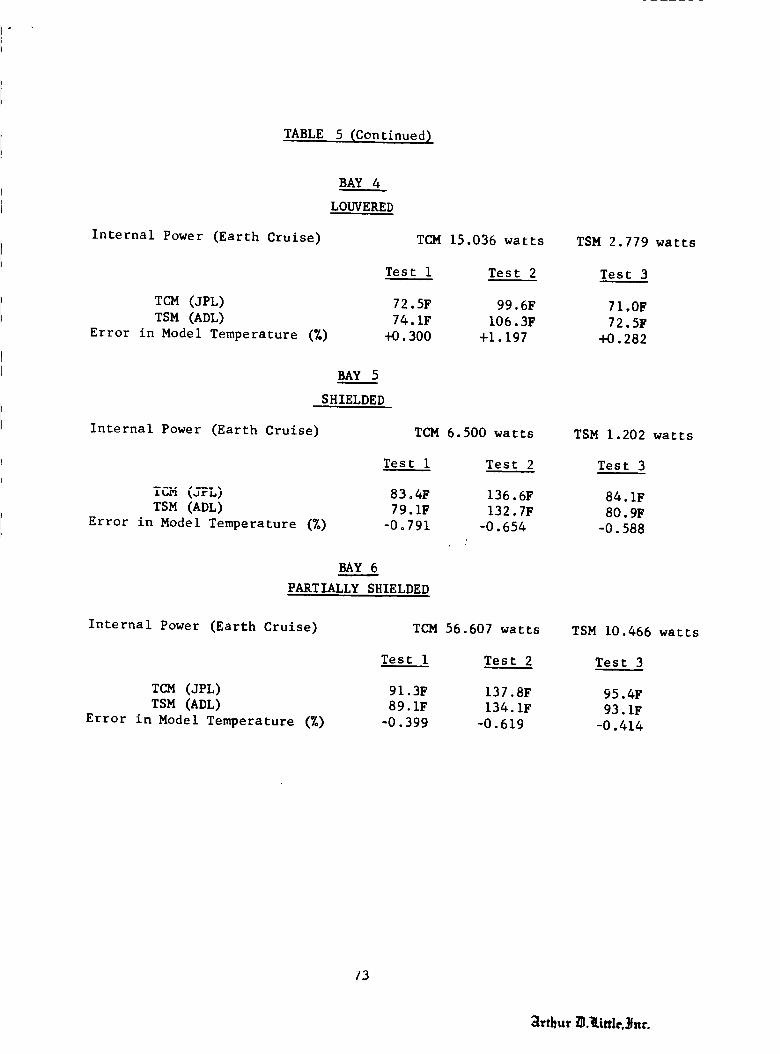
TABLE 5 (Continued)
Internal Power (Earth Cruise)
TCM (JPL)
TSM (ADL)
Error in Model Temperature (%)
BAY 4
LOUVERED
TCM 15.036 watts
Test i Test 2
72.5F 99.6F
74. IF 106.3F
+0.300 +1.197
BAY 5
SHIELDED
Internal Power (Earth Cruise) TCM 6.500 watts
Test i Test 2
ICM (jFL)
TSM (ADL)
Error in Model Temperature (%)
83,4F
79. IF
-0.791
136.6F
132.7F
-0. 654
BAY 6
PARTIALLY SHIELDED
TSM 2.779 watts
Test 3
71.OF
72.5F
+0.282
TSM 1.202 watts
Test 3
84.1F
80.9F
-0.588
Internal Power (Earth Cruise)
TCM (JPL)
TSM (ADL)
Error in Model Temperature (%)
TCM 56°607 watts
Test 1
91.3F
89. IF
-0. 399
Test 2
137.8F
134. IF
-0.619
TSM 10.466 watts
Test 3
95.4F
93.1F
-0.414
73
_lrthur _l.tittle3J.r.
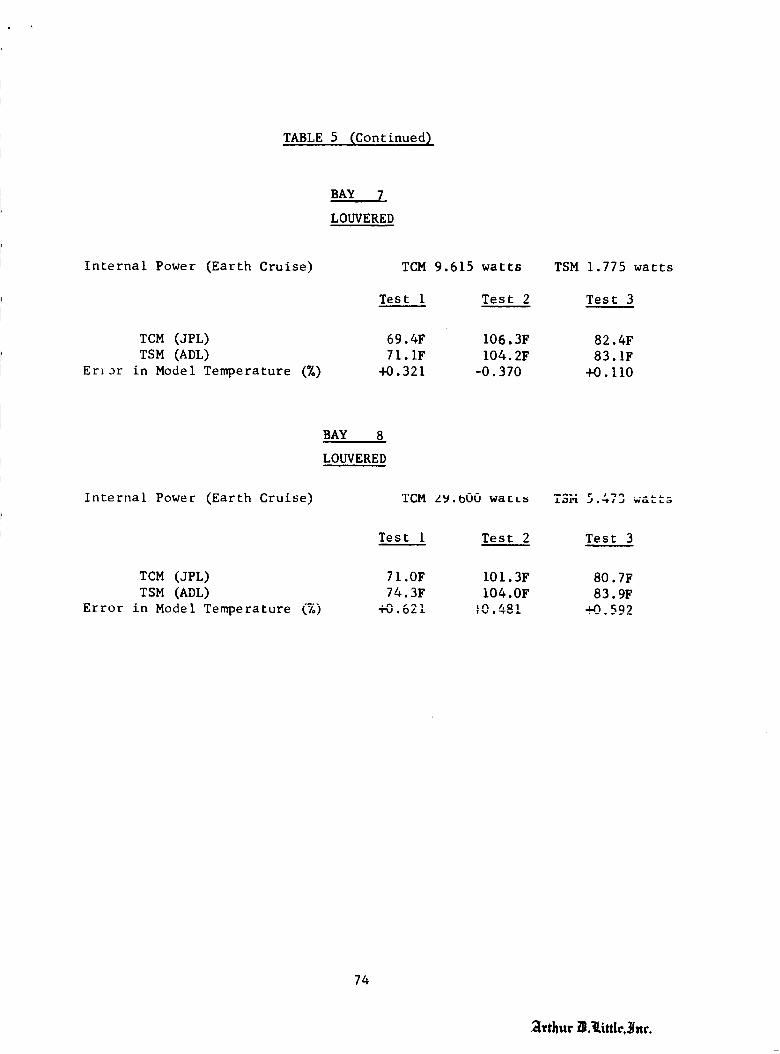
TABLE 5 (Continued)
BAY 7
LOWERED
Internal Power (Earth Cruise) TCM 9.615 watts
Test 1 Test 2
TSM 1.775 watts
Test 3
TCM (JPL)
TSM (ADL)
Erlor in Model Temperature (%)
69.4F 106.3F 82.4F
71. IF 104.2F 83. IF
+0.321 -0.370 +0. II0
BAY 8
LOUVERED
Internal Power (Earth Cruise)
TCM (JPL)
TSM (ADL)
Error in Model Temperature (%)
TCM ZW.b00 watts
Test 1 Test 2 Test 3
71.0F IOI.3F 80.7F
74.3F 104 .OF 83.9F
.n -,_I ./'% /.Q1 -_ _q9
74
_rthur i_.titth'.3Jar.
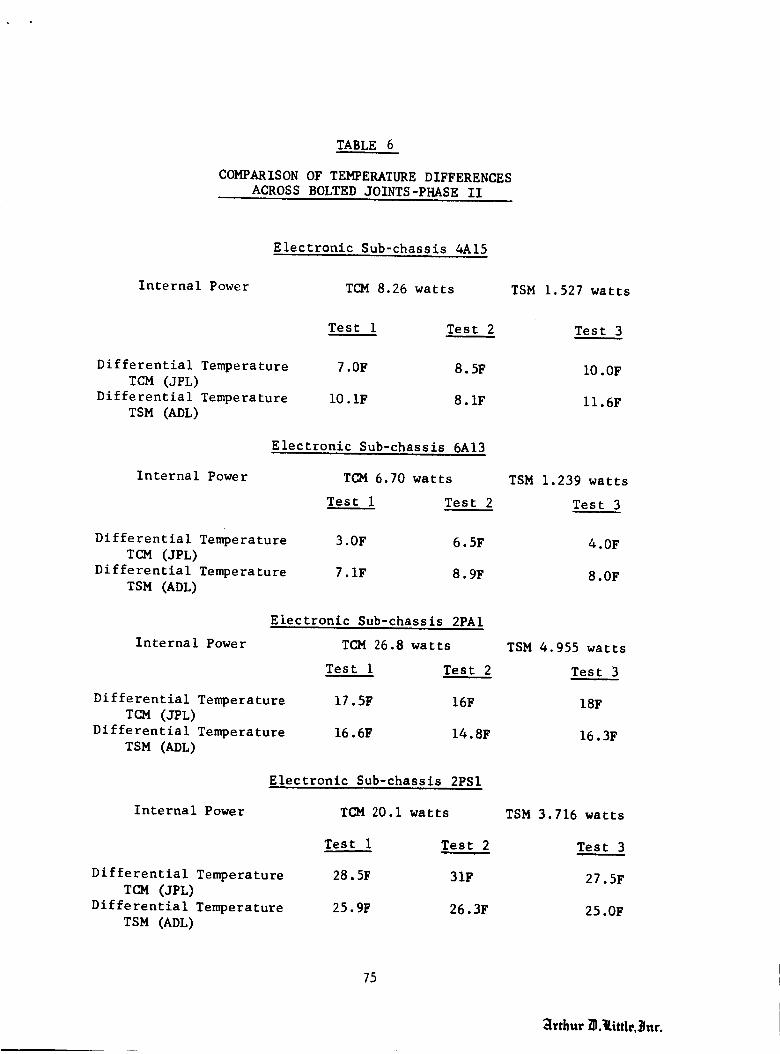
TABLE 6
COMPARISON OF TEMPERATURE DIFFERENCES
ACROSS BOLTED JOINTS-PHASE II
Electronic Sub-chassis 4A15
Internal Power TCM 8.26 watts TSM 1.527 watts
Test 1 Test 2 Test 3
Differential Temperature
TCM (JPL)
Differential Temperature
TSM (ADL)
7.OF 8.5F i0. OF
i0. IF 8. IF ii. 6F
Electronic Sub-chassis 6A13
Internal Power TCM 6.70 watts
Test i Test 2
Differential Temperature
TCM (JPL)
Differential Temperature
TSM (ADL)
TSM 1.239 watts
Test 3
3.OF 6.5F 4.OF
7,1F 8o9F 8.OF
Internal Power
Electronic Sub-chassis 2PAl
Differential Temperature
TCM (JPL)
Differential Temperature
TSM (ADL)
TCM 26.8 watts TSM 4.955 watts
Test______!l Test 2 Test 3
17.5F 16F 18F
16.6F 14.8F 16,3F
Internal Power
Electronic Sub-chassis 2PSI
TC_ 20.1 watts
Test 2
31F
26.3F
Differential Temperature
TCM (JPL)
Differential Temperature
TSM (ADL)
Test 1
28.5F
25.9F
TSM 3.716 watts
Test 3
27.5F
25.0F
75
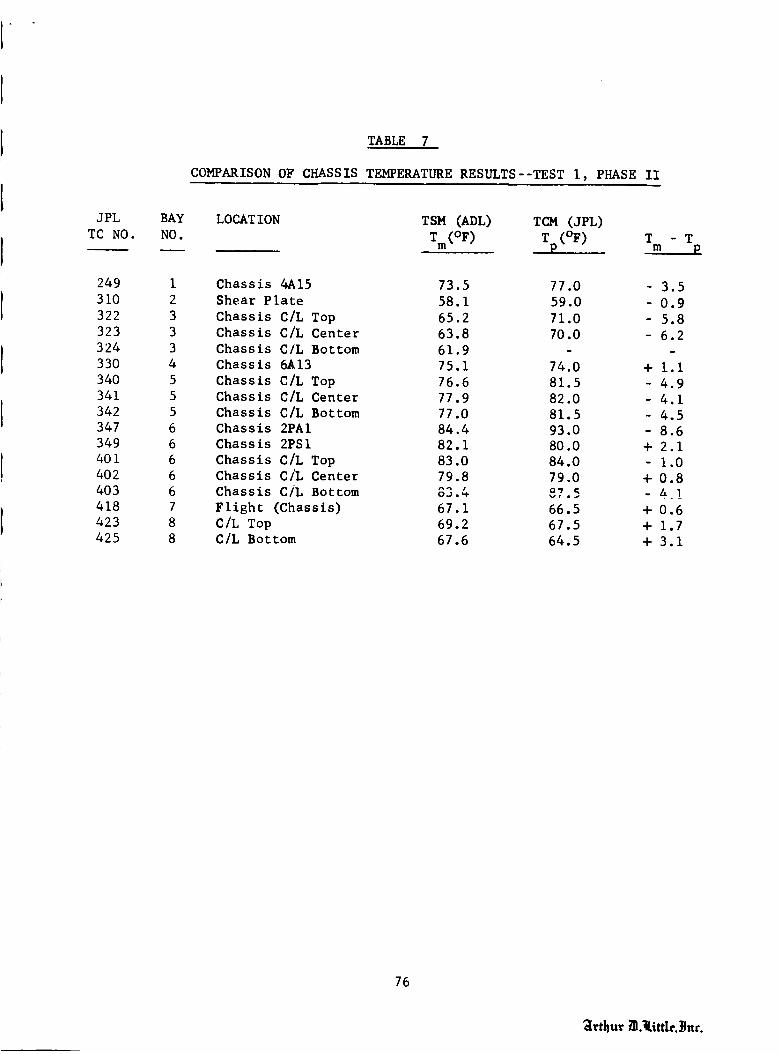
JPL
TC NO.
249
310
322
323
324
330
340
341
342
347
349
401
402
403
418
423
425
BAY
NO.
TABLE 7
COMPARISON OF CHASSIS TEMPERATURE RESULTS--TEST i, PHASE II
LOCAT ION TSH (ADL) TCM (JPL)
Tm (OF) Tp (OF) Tm- T
P
Chassis 4A15
Shear Plate
Chassis C/L Top
Chassis C/L Center
Chassis C/L Bottom
Chassis 6A13
Chassis C/L Top
Chassis C/L Center
Chassis C/L Bottom
Chassis 2PAl
Chassis 2PSl
Chassis C/L Top
Chassis C/L Center
Chassis C/L Bottom
Flight (Chassis)
C/L Top
C/L Bottom
73.5 77.0 - 3.5
58.1 59.0 - 0.9
65.2 71.0 - 5.8
63.8 70.0 - 6.2
61.9
75.1 74.0 + I.I
76.6 81.5 - 4.9
77.9 82.0 - 4.1
77.0 81.5 4.5
84.4 93.0 8.6
82.1 80.0 + 2.1
83.0 84.0 1.0
79.8 79.0 + 0.8
83.4 °7.5 - 41
67.1 66.5 ÷ 0.6
69.2 67.5 + 1.7
67.6 64.5 + 3.1
76
_vthur _.tittle._nr.
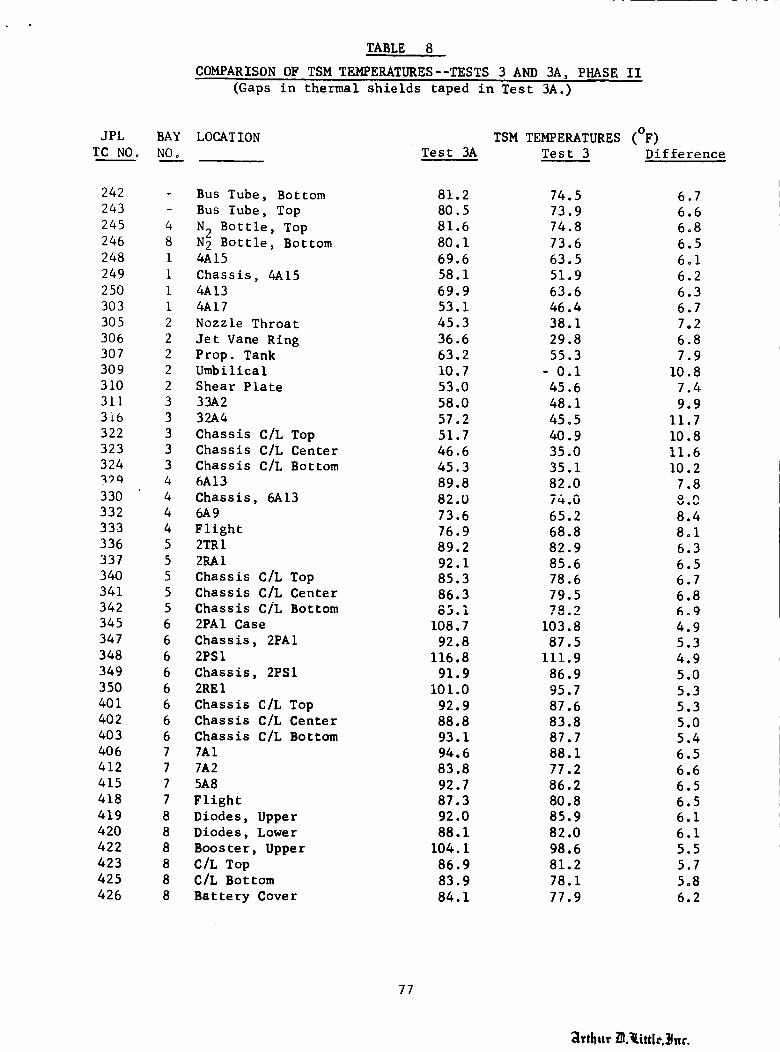
TABLE 8
COMPARISON OF TSM TEMPERATURES--TESTS 3 AND 3A, PHASE II
(Gaps in thermal shields taped in Test 3A.)
JPL BAY LOCATION
TC NOo NOo
TSM TEMPERATURES (°F)
Test 3A Test 3 Difference
242 - Bus Tube, Bottom
243 - Bus Tube, Top
245 4 N2 Bottle, Top246 8 N2 Bottle, Bottom
248 i 4A15
249 i Chassis, 4A15
250 i 4A13
303 i 4A17
305 2 Nozzle Throat
306 2 Jet Vane Ring
307 2 Prop. Tank
309 2 Umbilical
310 2 Shear Plate
311 3 33A2
3i6 3 32A4
322 3 Chassis C/L Top
323 3 Chassis C/L Center
324 3 Chassis C/L Bottom
_Pq 4 6A13
330 4 Chassis, 6A13
332 4 6A9
333 4 Flight
336 5 2TRI
337 5 2RAI
340 5 Chassis C/L Top
341 5 Chassis C/L Center
342 5 Chassis C/L Bottom
345 6 2PAl Case
347 6 Chassis, 2PAl
348 6 2PSI
349 6 Chassis, 2PSI
350 6 2REI
401 6 Chassis C/L Top
402 6 Chassis C/L Center
403 6 Chassis C/L Bottom
406 7 7AI
412 7 7A2
415 7 5A8
418 7 Flight
419 8 Diodes, Upper
420 8 Diodes, Lower
422 8 Booster, Upper
423 8 C/L Top
425 8 C/L Bottom
426 8 Battery Cover
81.2 74.5 6.7
80.5 73.9 6.6
81.6 74.8 6.8
80.1 73.6 6.5
69.6 63.5 6°1
58.1 51.9 6.2
69.9 63.6 6.3
53.1 46.4 6.7
45.3 38.1 7.2
36.6 29.8 6.8
63.2 55.3 7.9
10.7 - 0.i 10.8
53°0 45.6 7.4
58.0 48. I 9.9
57.2 45.5 11.7
51.7 40.9 I0.8
46.6 35.0 Ii.6
45.3 35.1 I0.2
89.8 82.0 7.8
82 .O 74.0 g .0
73.6 65.2 8.4
76.9 68.8 8ol
89.2 82.9 6.3
92.1 85.6 6.5
85.3 78.6 6.7
86.3 79.5 6.8
85.1 78.2 6.9
108.7 i03.8 4.9
92.8 87.5 5.3
116.8 111.9 4.9
91.9 86.9 5.0
I01.0 95.7 5.3
92.9 87.6 5.3
88.8 83.8 5.0
93.1 87.7 5.4
94.6 88.1 6.5
83.8 77.2 6.6
92.7 86.2 6.5
87.3 80.8 6.5
92.0 85.9 6.1
88.1 82.0 6.1
104.1 98.6 5.5
86.9 81.2 5.7
83.9 78.1 5.8
84.1 77.9 6.2
77
_lrthur _.li.le,_nc
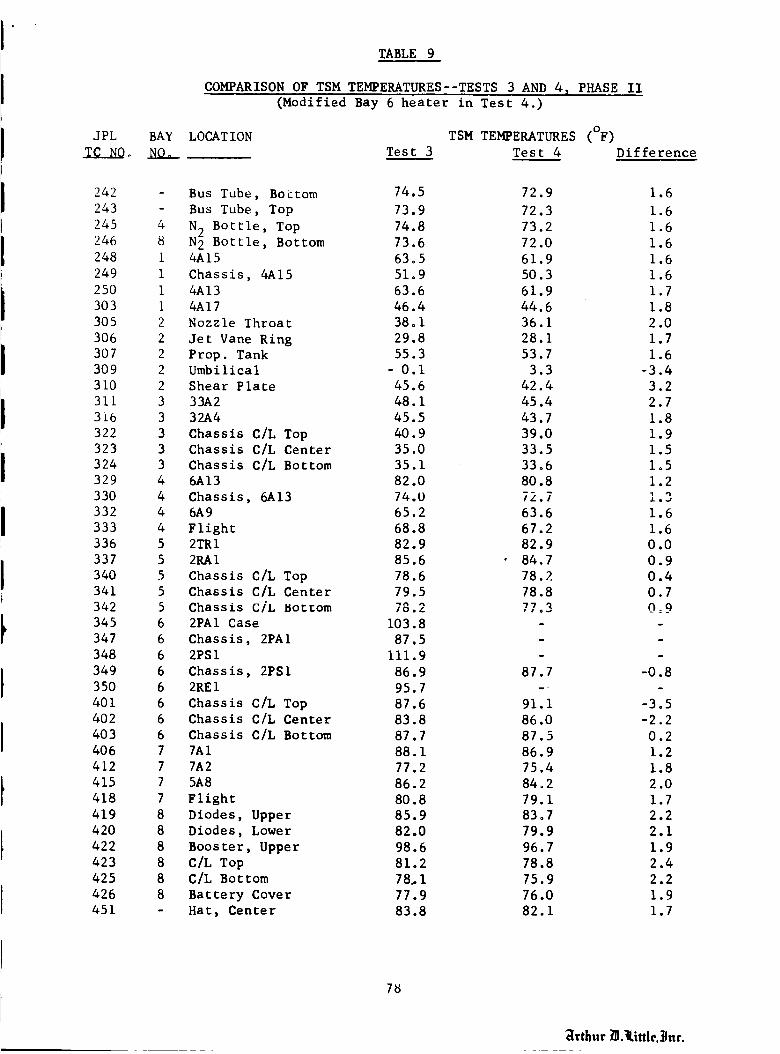
JPL BAYTCNOo NO_
TABLE 9
COMPARISON OF TSM TEMPERATURES--TESTS 3 AND 4_ PHASE II
(Modified Bay 6 heater in Test 4.)
LOCATION TSM TEMPERATURES (°F)
Test 3 Test 4 Difference
242
243
245
246
248
249
250
303
305
306
307
309
310
311
3i6
322
323
324
329
330
332
333
336
337
340
341
342
345
347
348
349
350
401
402
403
406
412
415
418
419
420
422
423
425
426
451
- Bus Tube, Bottom 74.5 72.9 1.6
- Bus Tube, Top 73.9 72.3 1.6
4 N 2 Bottle, Top 74.8 73.2 1.68 N 2 Bottle, Bottom 73.6 72.0 1.6
1 4A15 63°5 61.9 1.6
i Chassis, 4A15 51.9 50.3 1.6
i 4A13 63.6 61.9 1.7
I 4A17 46.4 44.6 1.8
2 Nozzle Throat 38.1 36.1 2.0
2 Jet Vane Ring 29.8 28.1 1.7
2 Prop. Tank 55.3 53.7 1.6
2 Umbilical 0.I 3.3 -3.4
2 Shear Plate 45.6 42.4 3.2
3 33A2 48. i 45.4 2.7
3 32A4 45.5 43.7 1.8
3 Chassis C/L Top 40.9 39.0 1.9
3 Chassis C/L Center 35.0 33.5 1.5
3 Chassis C/L Bottom 35.1 33°6 1o5
4 6A13 82.0 80.8 1.2
4 Chassis, 6A13 74.0 72.7 1.3
4 6A9 65.2 63.6 1.6
4 Flight 68.8 67.2 1.6
5 2TRI 82.9 82.9 0.0
5 2RAI 85.6 • 84.7 0.9
5 Chassis C/L Top 78.6 78.2 0.4
5 Chassis C/L Center 79.5 78.8 0.7
5 Chassis C/L Bottom 78.2 77.3 0:9
6 2PAl Case 103.8 - -
6 Chassis, 2PAl 87.5 - -
6 2PSI 111.9 -
6 Chassis, 2PSI 86.9 87.7 -0.8
6 2REI 95.7 -
6 Chassis C/L Top 87.6 91.1 -3.5
6 Chassis C/L Center 83.8 86.0 -2.2
6 Chassis C/L Bottom 87.7 87.5 0.2
7 7AI 88.1 86.9 1.2
7 7A2 77.2 75.4 1.8
7 5A8 86.2 84=2 2.0
7 Flight 80.8 79.1 1.7
8 Diodes, Upper 85.9 83.7 2.2
8 Diodes, Lower 82.0 79.9 2.1
8 Booster, Upper 98.6 96.7 1.9
8 C/L Top 81.2 78.8 2.4
8 C/L Bottom 78..1 75.9 2.2
8 Battery Cover 77.9 76.0 1.9
Hat, Center 83.8 82.1 1.7
7_
_lvthur _l.tittle._nc.

TABLE i0
_OMPARISON OF TSM AND MARINER IV TEMPERATURES
Operating mode:
Day from launch:
Solar intensity:
Sunlit Appendages
Magnetometer
lon Chamber
Trapped Radiation Detector
Internal Bus Locations
Bay i
Bay 2
Bay 3
Bay 4
Bay 5
Bay 6
Bay 7
Power R_gulator, Bay 8
Battery, Bay 8
Lower Ring, Bay 8, at Canopus Mount
Upper Ring, Bay 2
M/C Fuel Tank
N 2 Tank, Bottom
N 2 Tank, Top
Shaded Appendages
Canopus Tracker
Television Camera
SPITS
Earth Cruise
98
0.091 watts/cm 2 (S/S = 0.655)o
Temperatures (F)
Mariner 4 TSMChannel Difference
439 - 3 2.9 - 5.9
419 19 22.7 - 3.7
438 65 41.4 +23.6
401 67 68.4 - 1.4
421 57 57.7 - 0.7
402 64 61.6 + 2.4
423 64 65.2 - 1.2
404 64 65.6 - 1.6
405 74 85.4 -11.4
426 61 63.2 - 2.2
407 88 90.1 - 2.1
428 67 63.1 + 3.9
430 58 34.4 +23.6
431 66 64.2 + 1.8
217 60 58.0 + 2.0
218 62 45.0 +17.0
219 63 60.2 + 2.8
410 55 1.3 +53.7
418 21 19.2 + 1.8
437 21 22.0 - 1.0
79
_Irthur _lflLittle._ttr.

TABLE ii
COMPARISON OF TSM AND MARINER IV TEMPERATURES
Operating mode: Mars Cruise
Day from launch: 180
Solar intensity: 0.063 watts/cm 2 (S/So
Sunlit Appendages
Magnetometer
lon Chamber
Trapped Radiation Detector
Internal Bus Locations
Bay I
Bay 2
Bay 3
_ay
Bay 5
Bay 6
Bay 7
Power Regulator, Bay 8
Battery, Bay 8
Lower Ring, Bay 8, at Canopus Mount
Upper Ring, Bay 2
M/C Fuel Tank
N 2 Tank, Bottom
N 2 Tank, Top
Shaded Appendages
Canopus Tracker
Television Camera
SPITS
Channel
= 0.455)
Temperatures _F_
Mariner 4 TSM Difference
439 -29 -18.1 -10.9
419 -13 0oi -12.9
438 52 20.3 +31.7
401 62 55.7 + 6.3
421 45 33.4 +11.6
402 54 42.2 +11.8
423 57 47.4 + 9.6
404 61 54.1 + 6.9
405 71 78.1 - 7.1
426 59 54.1 + 4.9
407 84 79.7 + 4.3
428 62 51.7 +10.3
430 55 26.4 +28.6
431 50 37.8 +12.2
217 52 39.3 +12.7
218 56 32.1 +23.9
219 54 43.4 +10.6
410 52 - 4.6
418 17 7.0
437 15 9.3
+56.6
+I0.0
+5.7
80
_Irtllur _.little,_nc.

TABLE 12
COMPARISON OF TSM AND MARINER IV TEMPERATURES
Operating mode:
Day from launch:
Solar intensity:
Mars Playback
234
0.059 watts/cm 2 (S/S ° = 0.42)
Temperatures (F)
Channel Mariner 4 TSM Difference
Sunlit Appendages
Magne tome ter 439 -66 -39 -27
Ion Chamber 419 -21" -12.7 -8.3
Trapped Radiation Detector 438 39 6.4 +32.6
Internal Bus Locations
Bay I 401 54 43.5 +i0.5
Bay 2 421 33 20.1 +12.9
_'_-j__ 402 34 20.3 +13.7
Bay 4 423 47 34.3 +12.7
Bay 5 404 59 46.7 +12.3
Bay 6 405 70 71.7 1.7
Bay 7 426 57 45.6 +11.4
Power Regulator, Bay 8 407 77 69.9 + 7.1
Battery, Bay 8 428 57 41.8 +15.2
Lower Ring, Bay 8, at Canopus Mount 430 52 18.5 +33.5
Upper Ring, Bay 2 431 38 24.0 +14.0
M/C Fuel Tank 217 39 23.5 +15.5
N 2 Tank, Bottom 218 50 22.0 +28.0
N 2 Tank, Top 219 45 31.6 +13.4
Shaded Appendages
Canopus Tracker 410 50 -i0.7 +60.7
Television Camera 418 9 - 2.4 +11.4
SPITS 437 9 0.3 + 9.3
* lon chamber temperature is estimated by JPL to be less than -21F.
81
_Irtl}ur _}.litt[e,_nc.
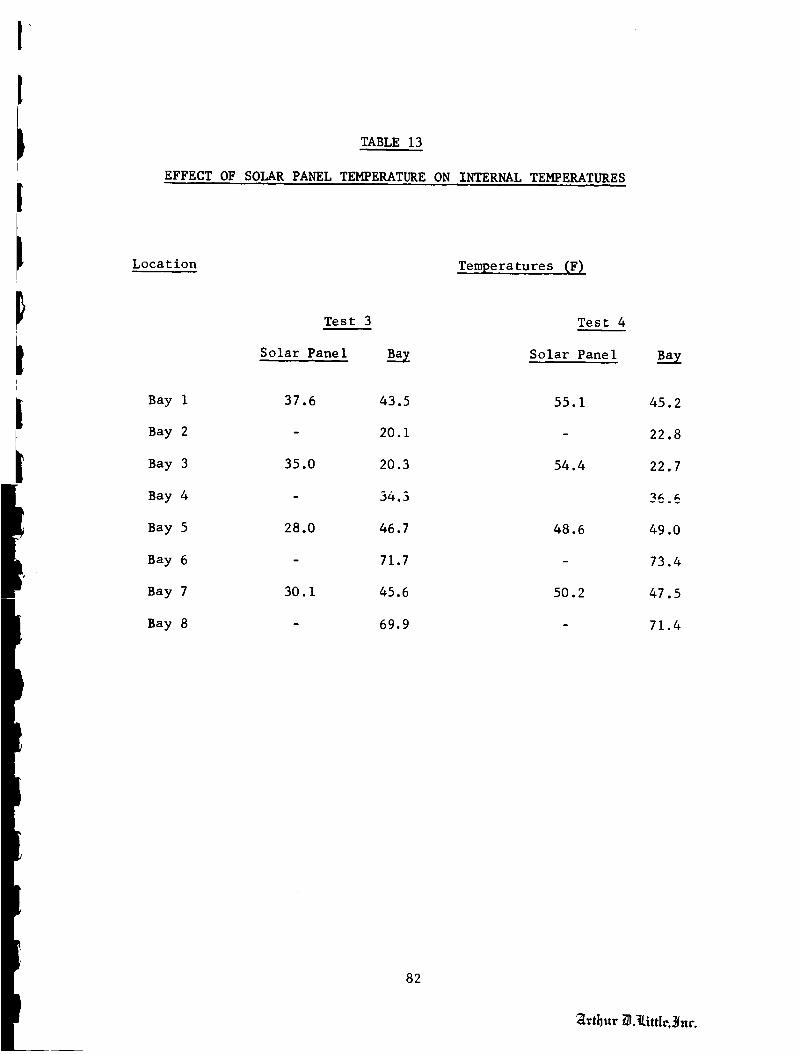
t ,
TABLE 13
EFFECT OF SOLAR PANEL TEMPERATURE ON INTERNAL TEMPERATURES
Location Temperatures (F)
Test 3 Test 4
Solar Panel Bay Solar Panel
Bay I 37.6 43.5 55.1
Bay 2 - 20.1 -
Bay 3 35.0 20.3 54.4
Bay 4 34.3
Bay 5 28.0 46.7 48.6
Bay 6 - 71.7 -
Bay 7 30.1 45.6 50.2
Bay 8 - 69.9 -
Bay
45.2
22.8
22.7
36.6
49.0
73.4
47.5
71.4
82
_rthur/_._ittle._ar.
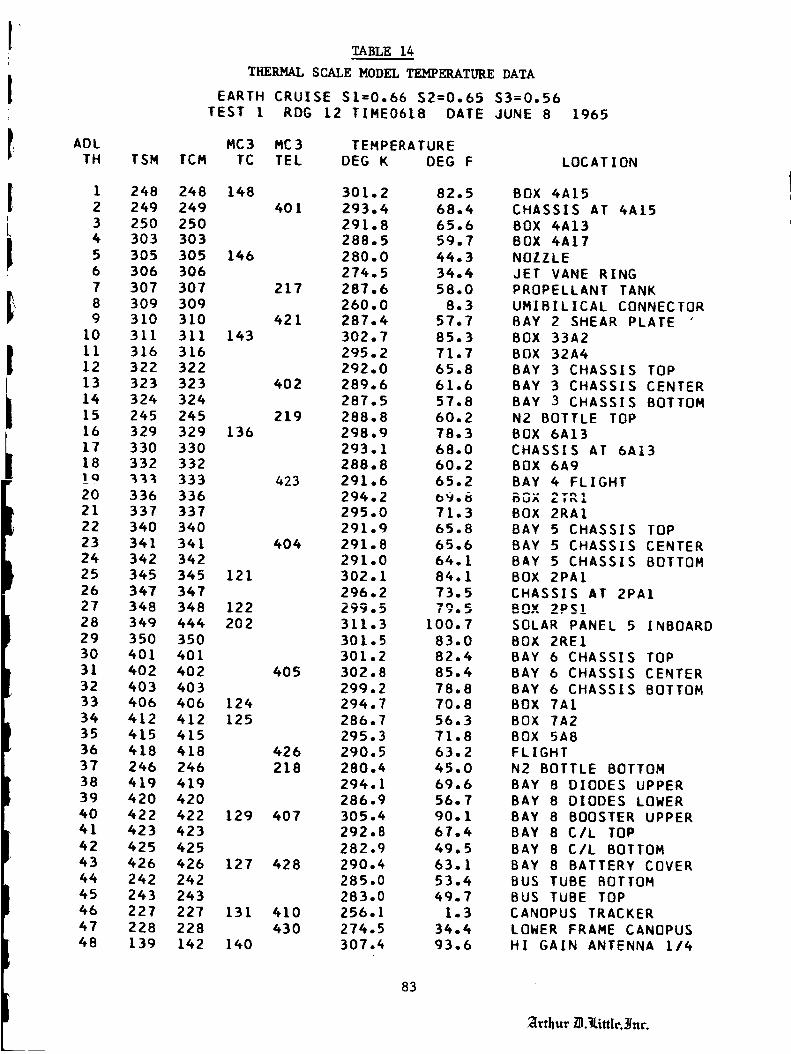
ADLTH TSM
TABLE 14
THEILMALSCALE MODEL TEHPERATURE DATA
EARTH CRUISE $I=0.66 $2=0.65 S3=0.56
TEST I RDG 12 TIME06[8 DATE JUNE 8
MC3 MC3 TEMPERATURETCM TC TEL DEG K DEG F
1965
LOCATION
1 248 248 148 301.2 82,5
2 249 249 401 293.4 68.4
3 250 250 291.8 65,6
4 303 303 288.5 59.75 305 305 146 280.0 44.36 306 306 274.5 34.47 307 307 217 287.6 58.08 309 309 260.0 8,39 310 310 421 287.4 57.7
10 311 311 143 302.7 85.3
11 316 316 295.2 71.712 322 322 292.0 65.813 323 323 402 289.6 61.6
14 324 324 287.5 57.815 245 245 219 288.8 60.216 329 329 136 298.9 78.317 330 330 293.1 68.018 332 332 288.8 60.2!o _3_ 333 423 291.6 65.220 336 336 294.2 b_.621 337 337 295.0 71.322 340 340 291.9 65.823 341 341 404 291.8 65.624 342 342 291.0 64.125 345 345 121 302.1 84.1
26 347 347 296.2 73.527 348 348 122 Lvv._ ,.._28 349 444 202 311.3 100.729 350 350 301.5 83.030 401 401 301.2 82.431 402 402 405 302.8 85.432 403 403 299.2 78.833 406 406 124 294.7 70.8
34 412 412 125 286.7 56.335 415 415 295.3 71.836 418 418 426 290.5 63.237 246 246 218 280.4 45.038 419 419 294.1 69.639 420 420 286.9 56.740 422 422 129 407 305.4 90.141 423 423 292.8 67.442 425 425 282.9 49.543 426 426 127 428 290.4 63.144 242 242 285.0 53.445 243 243 283.0 49.746 227 227 131 410 256.1 1.347 228 228 430 274.5 34.448 139 142 140 307.4 93.6
83
BOX 4A15
CHASSIS AT 4A15
BOX 4A13BOX 4A17
NOZZLE
JET VANE RING
PROPELLANT TANK
UMIBILICAL CONNECTORBAY 2 SHEAR PLATE
BOX 33A2BOX 32A4BAY 3 CHASSIS TOP
BAY 3 CHASSIS CENTER
BAY 3 CHASSIS BOTTOM
N2 BOTTLE TOPBOX 6A13CHASSIS AT 6A13BOX 6A9BAY 4 FLIGHTBOX 2Tgl
BOX 2RA[
BAY 5 CHASSIS TOP
BAY 5 CHASSIS CENTERBAY 5 CHASSIS BOTTOM
BOX 2PAlCHASSIS AT 2PAlnnv _P_!
SOLAR PANEL 5 INBOARDBOX 2RE1
BAY 6 CHASSIS TOPBAY 6 CHASSIS CENTER
BAY 6 CHASSIS BOTTOM
BOX 7A1BOX 7A2BOX 5A8FLIGHTN2 BOTTLE BOTTOMBAY 8 DIODES UPPERBAY B DIODES LOWERBAY 8 BOOSTER UPPERBAY 8 C/L TOPBAY 8 C/L BOTTOMBAY 8 BATTERY COVER
BUS TUBE BOTTOM
BUS TUBE TOP
CANOPUS TRACKER
LOWER FRAME CANOPUS
HI GAIN ANTENNA 1/4
_rthur ZLtittle,_nr.
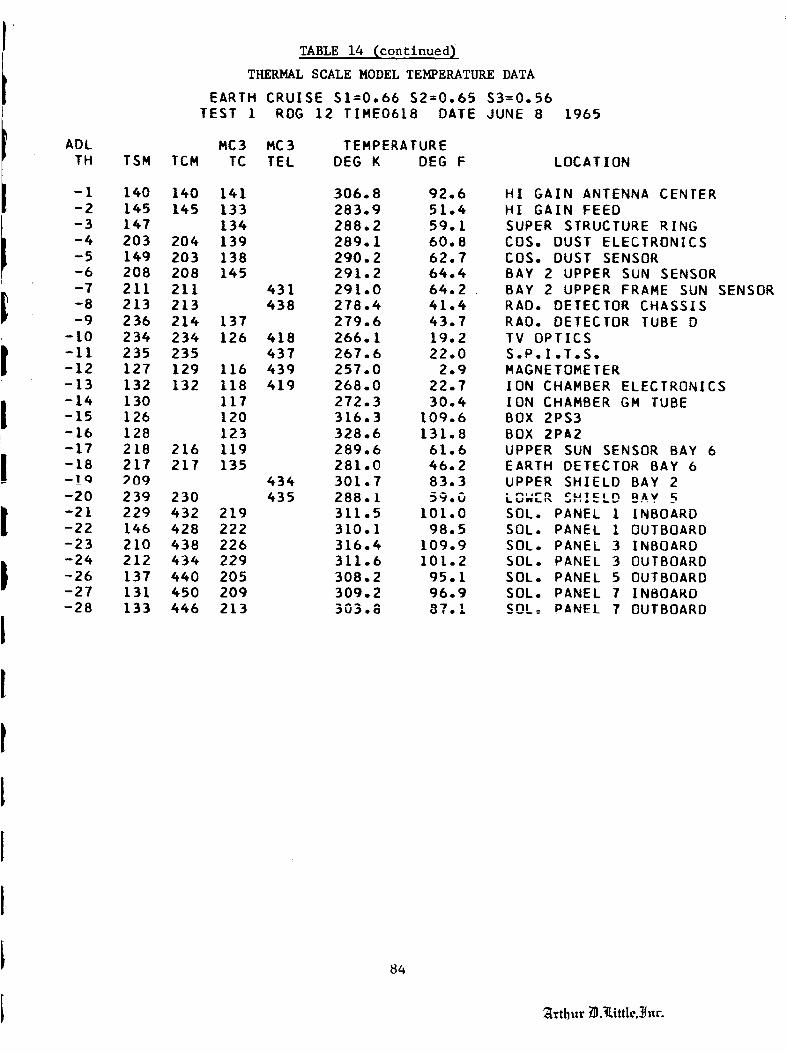
ADLTH
-1-2-3-4-5-6-7-8-9
-tO-11-12-13-14-15-16-17-18-IQ-20-21-22-23-24-26-27-28
TSM
140
145
147
203
1492O8
211213
236
234
235
127
132
130
126
128
218
217
209
239
229
146
210
212
137
131
133
TABLE 14 (continued)
THERMAL SCALE MODEL TEMPERATURE DATA
EARTH CRUISE S1=0.66 $2=0.65 $3=0.56TEST 1 RDG 12 TIME0618 DATE JUNE 8 1965
MC3 MC3 TEMPERATURE
TCM TC TEL DEG K DEG F LOCATION
140 141 306.8 92.6145 133 283.9 51.4
134 288.2 59.1
204 139 289.1 60.8203 138 290.2 62.7
208 145 291.2 64.4
211 431 291.0 64.2
213 438 278.4 41.4214 137 279.6 43.7234 126 418 266.1 19.2235 437 267.6 22.0129 I16 439 257.0 2.9
132 118 419 268.0 22.7
I17 272.3 30.4120 316.3 109.6
123 328.6 131.8216 119 289.6 61.6217 135 281.0 46.2
434 301.7 83.3230 435 288.1 59.0
432 219 311.5 IOl.O
428 222 310.1 98.5438 226 316.4 109.9434 229 311.6 101.2440 205 308.2 95.1
450 209 309.2 96.9446 213 303.8 87.I
HI GAIN ANTENNA CENTERHI GAIN FEED
SUPER STRUCTURE RING
COS. DUST ELECTRONICS
COS. DUST SENSOR
BAY 2 UPPER SUN SENSOR
BAY 2 UPPER FRAME SUN SENSOR
RAD. DETECTOR CHASSIS
RAD. DETECTOR TUBE D
TV OPTICS
S.P.I.T.S.
MAGNETOMETER
ION CHAMBER ELECTRONICS
ION CHAMBER GM TUBE
BOX 2PS3
BOX 2PA2
UPPER SUN SENSOR BAY 6
EARTH DETECTOR BAY 6UPPER SHIELD BAY 2
SOL. PANEL 1 INBOARD
SOL. PANEL I OUTBOARD
SOL. PANEL 3 INBOARD
SOL. PANEL 3 OUTBOARD
SOL. PANEL 5 OUTBOARD
SOL. PANEL 7 INBOARDSOL= PANEL 7 OUTBOARD
84
31:thur/_l._ittle._Jnr.

ADL
TH
I
2
3
4
5
6
7
8
9
I0
II
12
13
14
15
16
1718
20
21
22
2324
25
2627
28
2930
31
3233
34
35
36
37
38
39
40
41
42
43
44
45
46
47
48
TSM
24824925O30330530630730931031131632232332424532933033233333633734O34134234534734834935O4014O24034O6412415418246419420422423425426242243227228139
TCM
2482492503033O53063073093103113163223233242453293303323__333633734034134234534734844435O4014024O34O6412415418246419420422423425426242243227228142
TABLE 15
THERMAL SCALE MODEL TEMPERATURE DATA
MARS CRUISE SI=0.43 $2=0.48 $3=0.44TEST 2 RDG 8 TIMEOIO0 DATE JUNE 9 1965
MC3 MC3 TEMPERATURE
TC TEL DEG K DEG F LOCATION
148 294.6 70.5401 286.3 55.7
284.8 52.9280.7 45.6
146 270.1 26.4265.3 17.9
217 277.2 39.3252.1 -5.9
421 274.0 33.4143 290.6 63.4
284.4 52.2280.5 45.2
402 278.9 42.2277.0 38.8
219 279.5 43.4136 289.1 60.7
282.9 49.5279.9 44.1
_93 281.7 47.4287.2 b z.2289.4 61.2284.7 52.7
404 285.4 54.1284.5 52.4
121 298.1 76.8291.9 65.7
122 29_.7 70.8
202 282.7 49.1298.2 77.0296.8 74.5
405 298.8 78.1294.9 71.I
124 289.6 61.6125 281.5 47.0
288.9 60.3426 285.4 54.1218 273.2 32.1
288.4 59.5282.0 47.8
129 407 299.6 79.7287.4 57.6278.2 4t.O
127 428 284.1 51.7276.4 37.8274.7 34.8
131 410 252.8 -4.6430 270.1 26.4
140 280.4 45.0
BOX 4A15CHASSIS AT 4A15BOX 4A13BOX 4A17NOZZLE
JET VANE RING
PROPELLANT TANK
UMIBILICAL CONNECTOR
BAY 2 SHEAR PLATE
BOX 33A2
BOX 32A4
BAY 3 CHASSIS TOP
BAY 3 CHASSIS CENTERBAY 3 CHASSIS BOTTOM
N2 BOTTLE TOP
BOX 6A13CHASSIS AT 6A13
BOX 6A9BAY 4 FLIGHIBO_ 2TRI
BOX 2RAIBAY 5 CHASSIS TOPBAY 5 CHASSIS CENTER
BAY 5 CHASSIS BOTTOM
BOX 2PAl
CHASSIS AT 2PAl50X 2PS!
SOLAR PANEL 5 INBOARDBOX 2RE1BAY 6 CHASSIS TOPBAY 6 CHASSIS CENTERBAY 6 CHASSIS BOTTOMBOX 7At
BOX 7A2
BOX 5A8FLIGHTN2 BOTTLE BOTTOM
BAY 8 DIODES UPPER
BAY 8 DIODES LOWER
BAY 8 BOOSTER UPPERBAY 8 C/L TOPBAY 8 C/L BOTTOMBAY 8 BATTERY COVER
BUS TUBE BOTTOMBUS TUBE TOP
CANOPUS TRACKER
LOWER FRAME CANOPUSHI GAIN ANTENNA 114
85
_Irthur B._i, ttI_,_]._.

ADLTH
-I
-2-3
-4
-5
-6
-7
-8
-9
-I0
-II
-12
-13
-14
-15
-16
-17
-18
-20
-21
-22
-23-24
-26-27
-28
TSM
140
145
147
203
149
2O8
211
213
236
234
235127
132130
126
128
218217
4CU't
239
229
146
210
212
[37
13!
133
TCM
TABLE 15 (continued)
THERMAL SCALE MODEL TEMPERATURE DATA
MARS CRUISE S1=0.43 $2=0.48 $3=0.44TEST 2 RDG 8 TINEOIO0 DATE JUNE 9
MC3 MC3 TEMPERATURE
TC TEL DEG K DEG F
1965
140 141 280.0 44.3
145 133 260.7 9.6134 270.9 27.9
204 139 275.2 35.7203 138 275.3 35.9208 145 273.0 31.8
211 431 276.4 37.8213 438 266.6 20.3214 137 265.6 18.4
234 126 418 259.3 7.0235 437 260.6 9.3129 I16 439 245.3 -18.1
132 118 419 255.4 -0.I
117 255.2 -0.3
120 312.4 102.6123 325.0 125.3
216 119 280.5 45.2
217 135 272.3 30.5434 285.4 54.0
230 435 281.4 46.9
432 219 281.1 46.2
428 222 279.6 43.6438 226 283.8 51.1434 229 280.3 44.944n 205 279.5 43.5450 209 281.2 46.4466 213 276.4 37.9
LOCATION
HI GAIN ANTENNA CENTERHI GAIN FEED
SUPER STRUCTURE RING
COS, DUST ELECTRONICSCOS, DUST SENSOR
BAY 2 UPPER SUN SENSOR
BAY 2 UPPER FRAME SUN SENSOR
RAD. DETECTOR CHASSIS
RAD. DETECTOR TUBE D
TV OPTICS
S.P.I.T.S.
MAGNETOMETER
ION CHAMBER ELECTRONICS
ION CHAMBER GM TUBE
BOX 2PS3
BOX 2PA2
UPPER SUN SENSOR BAY 6
EARTH DETECTOR BAY 6
UPPER SHIELD BAY 2
LOWER "',,FL n _^v
SOL. PANEL 1 INBOARD
SOL. PANEL I OUTBOARD
SOL. PANEL 3 INBOARD
SOL. PANEL 3 OUTBOARD
SOL. PANEL 5 OUTBOARD
SOL, PANEL 7 INBOARDS TM OaNFI 7 OUTBOARD
86
_Irthur _l.Rittle,_Jur.

TABLE 16
THERMAL SCALE MODEL TEMPERATURE DATA
MARS PLAYBACK SI=0.40 $2=0.44 S3=0.46
TEST 3 RDG 8 TIME2400 DATE JUNE 9 1965
ADL
TH TSM TCM
MC3 MC3 TEMPERATURE
TC TEL DEG K DEG F LOCATION
1 248 248 148
2 249 249 401
3 250 250
4 303 303
5 305 305 146
6 306 3067 307 307 217
8 309 309
9 310 310 421IO 311 311 143
II 316 316
12 322 322
13 323 323 40214 324 32415 245 245 219
16 329 329 136
17 330 33018 332 33219 333 33_ 423
20 336 336
21 337 33722 340 340
23 341 341 404
24 342 342
25 _5 345 12!
26 3_? 34727 348 348 12228 349 444 20229 350 35030 401 401
31 402 402 40532 403 40333 406 406 124
34 412 412 125
35 415 415
36 418 418 426
37 246 246 218
38 419 419
39 420 42040 422 422 129 40741 423 42342 425 42543 426 426 127 42844 242 24245 243 24346 227 227 131 41047 228 228 43048 139 142 140
288.2 59.1279.5 43.5278.0 40.6272.8 31.4262.0 11.9257.9 4.5268.4 23.5245.4 -17.9266.6 20.1
267.9 22.5267.9 22.5267.3 21.5266.7 20.3265.7 18.5272.9 31.6
282.8 49.3275.9 36.9273.1 32.0274.6 36.3283.3 50.3285.2 53.7281.1 46.2
281.3 46.7280.0 44.4294.5 70.4288.3 59.2
290.9 64.0270.9 28.0294.8 71.0293.1 68.0295.2 71.7291.3 64.6
285.1 53.4276.8 38.6284.0 51.4
280.7 45.6267.6 22.0283.3 50.3277.1 39.1
294.2 69.9282.1 48.1273.3 32.3278.6 41.8
270.1 26.4268.5 23.7249.5 -I0.7
265.7 18.5
274.1 33.7
87
80X 4A15
CHASSIS AT 4A15
BOX 4A13
BOX 4A17
NOZZLE
JET VANE RING
PROPELLANT TANK
UMIBILICAL CONNECTOR
BAY 2 SHEAR PLATE
BOX 33A280X 32A4BAY 3 CHASSIS TOP
BAY 3 CHASSIS CENTER
BAY 3 CHASSIS BOTTOMN2 BOTTLE TOP
BOX 6A13
CHASSIS AT 6A13BOX 6A9BAY 4 FLIGHT_OX 2TRI
BOX 2RA1
BAY 5 CHASSIS TOP
BAY 5 CHASSIS CENTER
BAY 5 CHASSIS BOTTOMBOX 2PAl
CH_SS!_ AT 2PAlBOX 2PS|
SOLAR PANEL 5 INBOARD
BOX 2REI
BAY 6 CHASSIS TOP
BAY 6 CHASSIS CENTER
BAY 6 CHASSIS BOTTOMBOX 7AIBOX 7A2
BOX 5A8
FLIGHT
N2 BOTTLE BOTTOM
BAY 8 DIODES UPPER
BAY 8 DIODES LOWER
BAY 8 BOOSTER UPPER
BAY 8 C/L TOP
BAY 8 CIL BOTTOM
BAY 8 BATTERY COVER
BUS TUBE BOTTOM
BUS TUBE TOP
CANOPUS TRACKER
LOWER FRAME CANOPUS
HI GAIN ANTENNA 1/4
_rthur _.:tLittle, Jj.r.

TABLE 16 (continued)
THERMAL SCALE MODEL TEMPERATURE DATA
MARS PLAYBACK SI=0.40 $2=0.44 S3=0.46
TEST 3 RDG 8 TIME2400 DATE JUNE 9 1965
ADL MC3 MC3
TH TSM TCM TC TEL
-I 140 140 141
-2 145 145 133
-3 147 134
-4 203 204 139
-5 149 203 138
-6 208 208 145-7 211 211 431-8 213 213 438-9 236 214 137
-I0 234 234 126 418
-II 235 235 437-12 127 129 116 439
-13 132 132 118 419
-14 130 117
-15 126 120
-16 128 123-17 218 216 119
-18 217 217 135
-19 209 434-20 239 230 435
-21 229 432 219
-22 146 428 222
-23 210 438 226-24 212 434 229
-26 13: 440 _^=
-27 131 450 209-28 133 446 213
TEMPERATURE
DEG K DEG F LOCATION
274.8 34.9
254.9 -0.8
265.4 18.1
268.2 23.1
268.3 23.3
266.8 20.5268.7 24.0259.0 6.4258.5 5.6254.1 -2.4255.2 -0.3233.9 -38.6248.3 -12.7249.7 -I0.3
309.1 96.7
321.7 119.4
276.0 37.0268.2 23.127o,_ 43.1
276.6 38.2276.3 37.6274.8 35.0274.9 35.0272.2 30.3269.0 24.6272.1 _u.i
268.5 23.6
HI GAIN ANTENNA CENTER
HI GAIN FEED
SUPER STRUCTURE RING
COS. DUST ELECTRONICS
COS. DUST SENSOR
BAY 2 UPPER SUN SENSOR
BAY 2 UPPER FRAME SUN SENSOR
RAD. DETECTOR CHASSIS
RAD. DETECTOR TUBE D
TV OPTICS
S.P.I.T.S.MAGNETOMETER
ION CHAMBER ELECTRONICS
ION CHAMBER GM TUBE
BOX 2PS3
BOX 2PA2UPPER SUN SENSOR BAY 6EARTH DETECTOR BAY 6UPPER SHIELD BAY 2LOWEK S;_IELD BAY 5
SOL. PANEL I INBOARD
SOL. PANEL I OUTBOARD
SOL. PANEL 3 INBOARD
SOL. PANEL 3 OUTBOARD
SOL. PANEL 5 OUTBOARD
,-n. oaN_l 7 INBOARD
_n, DaMF! 7 OUTBOARD
_8
_[rthur _l._ittle,_nr.
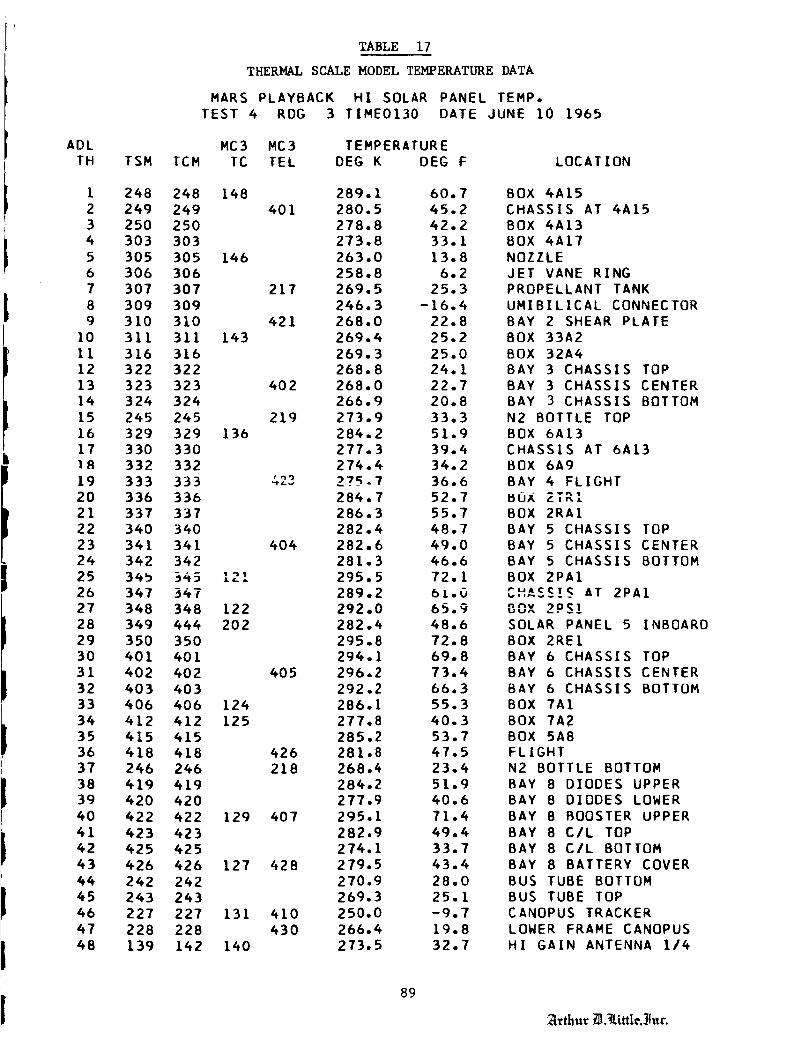
TABLE 17
THERMAL SCALE MODEL TEMPERATURE DATA
MARS PLAYBACK HI SOLAR PANEL TEMP.
TEST 4 RDG 3 TIMEOI30 DATE JUNE 10 1965
ADL MC3 MC3 TEMPERATURE
TH TSM TCM TC TEL DEG K DEG F LOCATION
I 248 248 148 289.1 60.7
2 249 249 401 280.5 45.2
3 250 250 278.8 42.2
4 303 303 273.8 33.15 305 305 146 263.0 13.8
6 306 306 258.8 6.27 307 307 217 269.5 25.3
8 309 309 246.3 -16.49 310 310 421 268.0 22.8
I0 311 311 143 269.4 25.2
II 316 316 269.3 25.012 322 322 268.8 24.1
13 323 323 402 268.0 22.714 324 324 266.9 20.8I5 245 245 219 273.9 33.3
16 329 329 136 284.2 51.9
17 330 330 277.3 39.418 332 332 274.4 34.219 333 333 422 275-7 36.620 336 336 284.7 52.721 337 337 286.3 55.7
22 340 340 282.4 48.723 341 341 404 282.6 49.024 342 342 281.3 46.625 34b 345 121 295.5 72.1
26 347 347 289.2 bl.O27 348 348 122 292.0 65.9
28 349 444 202 282.4 48.629 350 350 295.8 72.8
30 401 401 294.1 69.831 402 402 405 296.2 73.432 403 403 292.2 66.333 406 406 124 286.1 55.334 412 412 125 277.8 40.335 415 415 285.2 53.736 418 418 426 281.8 47.537 246 246 218 268.4 23.438 419 419 284.2 51.939 420 420 277.9 40.640 422 422 129 407 295.1 71.441 423 423 282.9 49.442 425 425 274.1 33.743 426 426 127 428 279.5 43.444 242 242 270.9 28.045 243 243 269.3 25.146 227 227 131 410 250.0 -9.747 228 228 430 266.4 19.8
48 139 142 140 273.5 32.7
BOX 4A15
CHASSIS AT 4A15
BOX 4A13
BOX 4A17
NOZZLE
JET VANE RING
PROPELLANT TANK
UMIBILICAL CONNECTOR
BAY 2 SHEAR PLATE
80X 33A2
BOX 32A4BAY 3 CHASSIS TOPBAY 3 CHASSIS CENTERBAY 3 CHASSIS BOTTOM
N2 BOTTLE TOP
BOX 6A13
CHASSIS AT 6A13BOX 6A9
BAY 4 FLIGHT
BOX 2TRIBOX 2RAI
BAY 5 CHASSIS TOP
BAY 5 CHASSIS CENTERBAY 5 CHASSIS BOTTOM
BOX 2PAl
Cu,c¢lq AT 2PAlII_vv. --
_nv _0_!SOLAR PANEL 5 INBOARDBOX 2REI
BAY 6 CHASSIS TOP
BAY 6 CHASSIS CENTER
BAY 6 CHASSIS BOTTOMBOX 7AI
BOX 7A2BOX 5A8FLIGHT
N2 BOTTLE BOTTOM
BAY 8 DIODES UPPER
BAY 8 DIODES LOWER
BAY 8 BOOSTER UPPERBAY 8 C/L TOPBAY 8 C/L BOTTOM
BAY 8 BATTERY COVER
BUS TUBE BOTTOM
BUS TUBE TOP
CANOPUS TRACKER
LOWER FRAME CANOPUS
HI GAIN ANTENNA I/4
89
_rthur B _ittle,_nr

ADLTH
-1-2-3-4-5-6-7-8-g
-10-iX-12-13-14.-15-16-17-18-lq-20-21-22-23-24.-26-27-28
Ts i
14014.5147203"14.9208211213236234-235127132130126128218217
239229146210212137131133
TCM
140
145
204
203
208
211
213
214
234
235
129
132
216
217
230
1,32
44428
44438
4443444
440
44450
4444446
TABLE 17 (continued)
THERMAL SCALE MODEL TEMPERATURE DATA
MARS PLAYBACK HI SOLAR PANEL TEMP.
TEST 41 RDG 3 TIME0130 DATE JUNE I0 1965
MC3 MC3 TEMPERATURE
TC TEL DEG K DEG F LOCATION
14441 271.8 29.6133 252.6 -444.913444 26444.9 17.1139 268.6 23.7138 268.6 23.814445 267.5 21.7
44431 269.9 26.1
44438 260.1 8.444137 259.444 7.2
126 44418 25444.6 -1.344437 255.8 0.7
116 44439 23444.2 -38.1
I18 44419 24448.5 -12.4
117 24446.7 -15.6
120 310.0 98.444123 322.6 121.1
II9 276.5 38.0
135 268.7 24.0
4443444 279.444 4443.244435 277.7 4440.2
219 286.0 55.1222 28444.9 53.1226 285.6 5444.444229 283.0 4449.7205 280.5 4445.2209 283.2 _O.Z213 279.3 4443.0
HI GAIN ANTENNA CENTERHI GAIN FEED
SUPER STRUCTURE RING
COS. DUST ELECTRONICSCOS. DUST SENSOR
BAY 2 UPPER SUN SENSOR
BAY 2 UPPER FRAME SUN SENSOR
RAD. DETECTOR CHASSIS
RAD. DETECTOR TUBE D
TV OPTICS
S.P.I.T.S.
MAGNETOMETER
ION CHAMBER ELECTRONICS
ION CHAMBER GM TUBE
BOX 2PS3
BOX 2PA2
UPPER SUN SENSOR BAY 6
EARTH DETECTOR BAY 6UPPER SHIELD BAY 2
LOWER SHIELD BAY 5
SOL, PANEL I INBOARD
SOL. PANEL I OUTBOARD
SOL. PANEL 3 INBOARDSOL. PANEL 3 OUTBOARD
SOL. PANEL 5 OUTBOARD
SOL. PANEL T INBOARDSOL. PANEL 7 OUTBOARD
90
2lrthur/3 _llittle._nr

APPENDIX I
TSM POWER BREAKDOWN
PHASE II CONFIGURATION
BAY i - POWER SUBSYSTEM
D 3611-016
Identification
Pyrotechnic Control (8AI/SA2)
Inverter (4A15)
Battery Charger (4A13)
Inverter 4A18
Pyrotechnic Control 8AI/SA2
Power Distribution (4All)
Power Synchronizer (4A12)
Inverter (_AI7)
Total Power
TSM Number of
Power (Watts) Resistors
.093 1
1.527 2
1.479" 2
0 0
.093 i
.299 I
.372 i
0 0
3.864
BAY 2 - PIPS
This Bay has no power dissipation.
4A13 dissipates 1.479 watts at Earth Cruise Mode and 0 watt atMars Cruise.
91
_[rthur _.tittl_,_nr.

APPENDIX I (continued)
BAY 3 - SCIENTIFIC EQUIPMENT
D 3611-011
Identification
Magnetometer Electronics (33A2)
Magnetometer Electronics (33A3)
Scan Electronics (31A2)
Scan Electronics (31A3)
U. V. Electronics (34A2)
T. V. Power Supply (36A6)
Analog - Digital T.V. Encoder (36A5)
Deflection and Control (36A4)
Video Channels and Computer (36A3)
Plasma Electronics 2 (32A3)
Plasma Electronics 3 (32A4)
DAS Power Supply (20A5)
R,,ff_r Mpmnrv (20AI_
NRT DAS Logic (ZUAJ)
RT DAS Logic (2OA2)
RT DAS Logic (20A4)
Cosmic Ray Telescope (21AI)
TSM Number of
Power (Watts) Resistors
•484 2
•246 I
0 0
0 0
0 0
0 0
0 0
0 0
0 0
•104 i
.153 2
•346 i
.094 I
0 0
no/. 1
0 0
.094 i
.072 I
i .686
92
_l:thur _l.t_.ttlc.]Jnr.
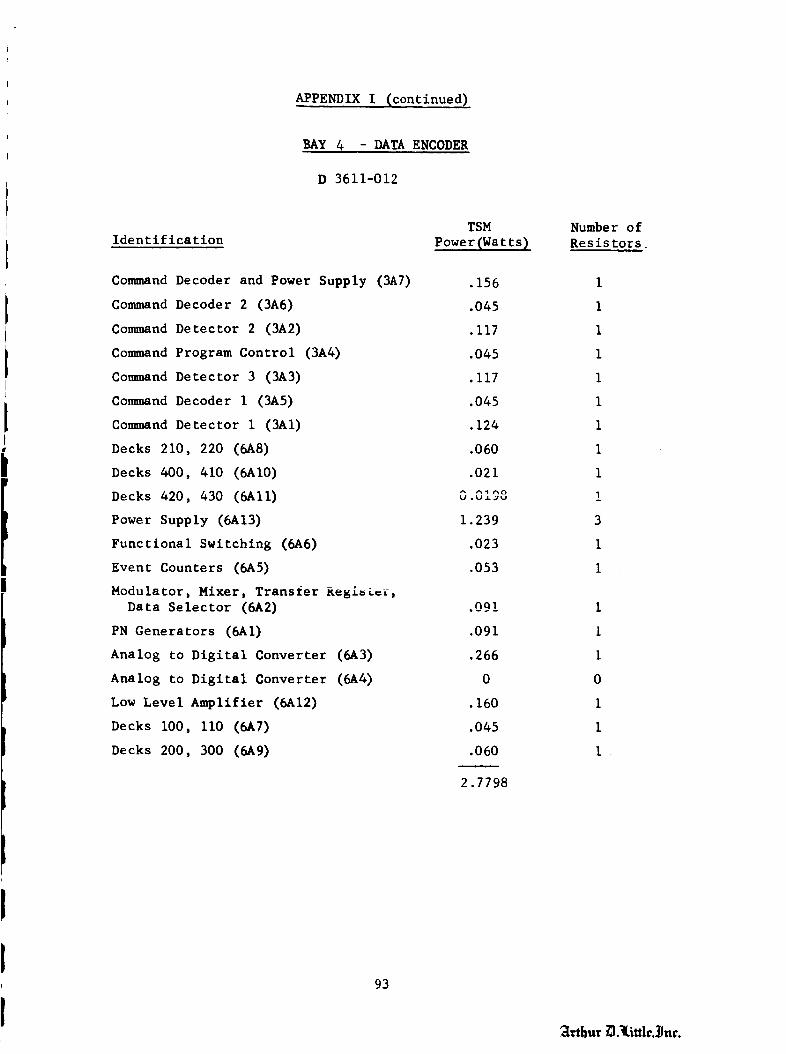
APPENDIX I (continued)
BAY 4 - DATA ENCODER
D 3611-012
Identification
Command Decoder and Power Supply (3A7)
Command Decoder 2 (3A6)
Command Detector 2 (3A2)
Command Program Control (3A4)
Command Detector 3 (3A3)
Command Decoder I (3A5)
Command Detector I (3AI)
Decks 210, 220 (6A8)
Decks 400, 410 (6AI0)
Decks 420, 430 (6611)
Power Supply (6A13)
Functional Switching (6A6)
Event Counters (665)
Modulator, Mixer, Transfer ke_ibL=r,
Data Selector (662)
PN Generators (6AI)
Analog to Digital Converter (6A3)
Analog to Digital Converter (6A4)
Low Level Amplifier (6A12)
Decks i00, ii0 (667)
Decks 200, 300 (669)
TSM
Power(Watts)
.156
.045
.117
.045
.117
.045
.124
.060
.021
0 0 _°• J. _ L.n
I .239
.023
.053
.09!
.091
.266
0
•160
•045
.060
2.7798
Number of
Resistors
I
I
i
0
i
i
I
93
_lvthur _l.tittle,_nt.
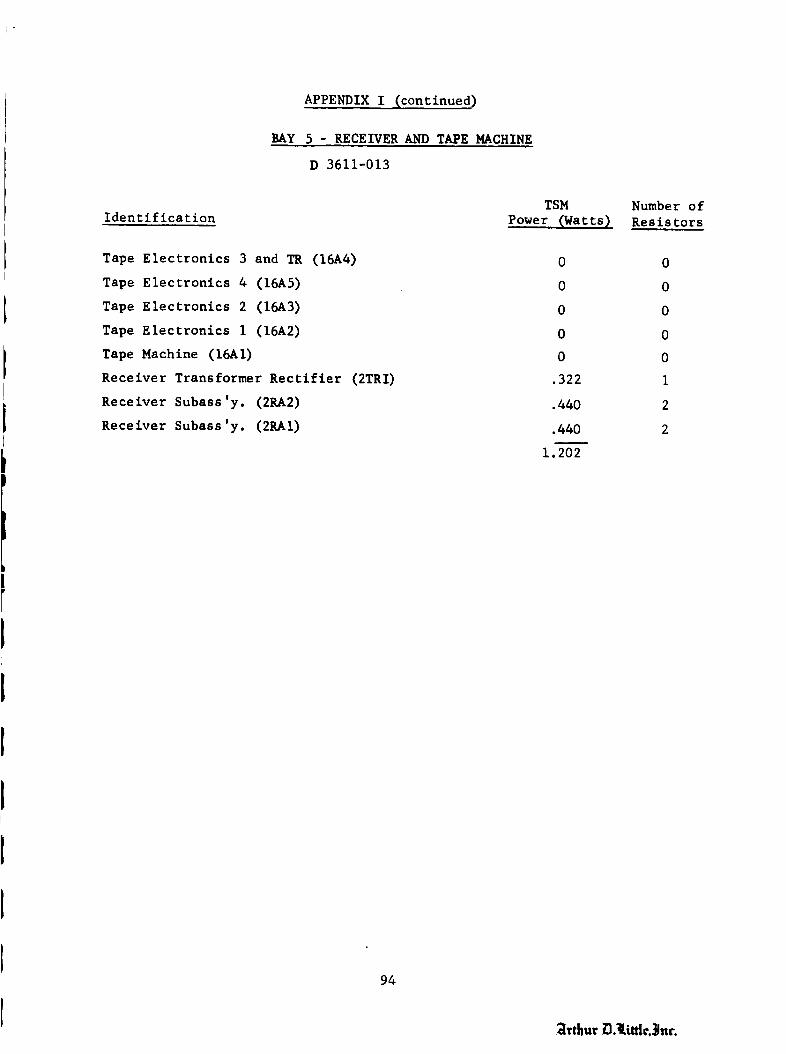
APPENDIX I (continued)
BAY 5 - RECEIVER AND TAPE MACHINE
D 3611-013
Identification
Tape Electronics 3 and TR (16A4)
Tape Electronics 4 (16A5)
Tape Electronics 2 (16A3)
Tape Electronics I (16A2)
Tape Machine (16AI)
Receiver Transformer Rectifier (2TRI)
Receiver Subass 'y. (2RA2)
Receiver Subass'y. (2RAI)
TSM Number of
Power (Watts_ Resistors
0 0
0 0
0 0
0 0
0 0
.322 1
.440 2
•440 2
1.202
94
_lrthur i_l.little._nr.
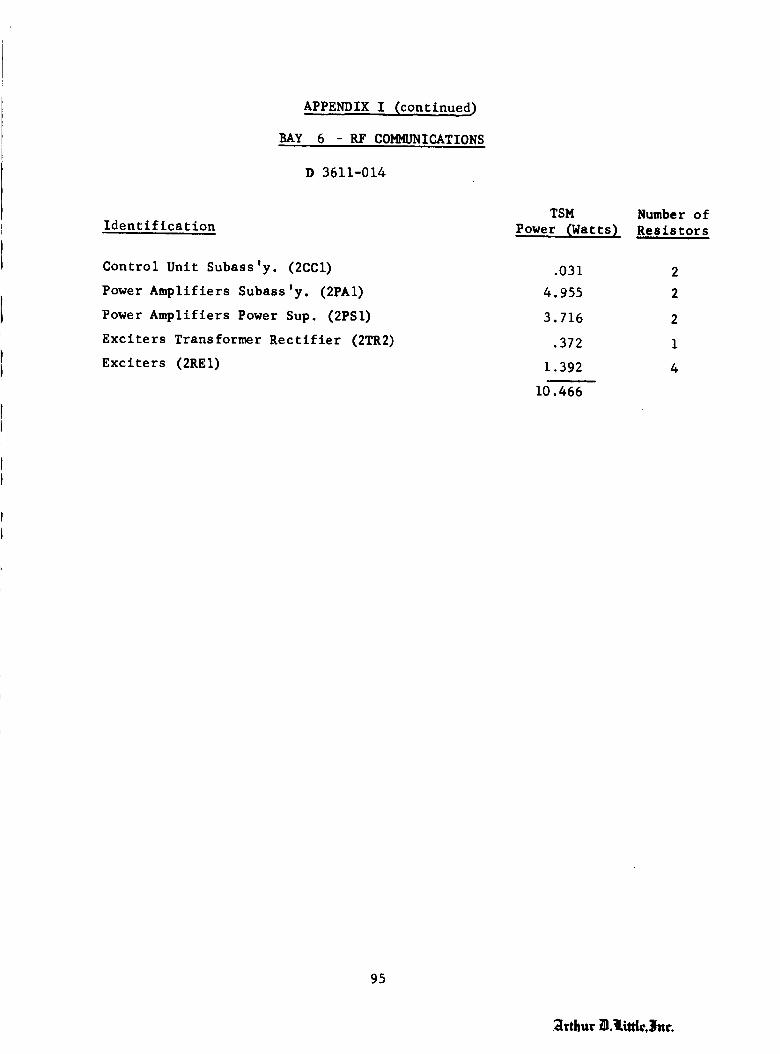
APPENDIX I (continued)
BAY 6 RF COMMUNICATIONS
D 3611-014
Identification
Control Unit Subass'y. (2CCi)
Power Amplifiers Subass'y. (2PAl)
Power Amplifiers Power Sup. (2PSI)
Exciters Transformer Rectifier (2TR2)
Exciters (2RE I)
TSM Number of
Power (Watts) Resistors
.031 2
4.955 2
3.716 2
.372 i
1.392 4
10.466
95
_rtbur _.t_k'.3nr.

BAY
Identification
APPENDIX I (continued)
7 - ATTITUDE CONTROL AND CC&S
D 3611-015
Attitude Control Electronics (7AI)
CC&S Transformer Rectifier (5A8)
End Counter (5A3)
Central Clock (bAI)
Launch Counter (5A2)
Maneuver Clock (5A4)
Maneuver Duration (5A5)
Address Register and Maneuver
Duration O,,tput (5A6)
...... no_n_r (5A7)
Gyro Control Ass'y. (7A2)
TSM Number of
Power (Watts) Resistors
0.5695 _ i
.645 2
.080 i
.080 i
.080 i
.080 I
.080
.080 I
.080 I
0 0
1.7745
96
_lvthur _.tittle._,¢.
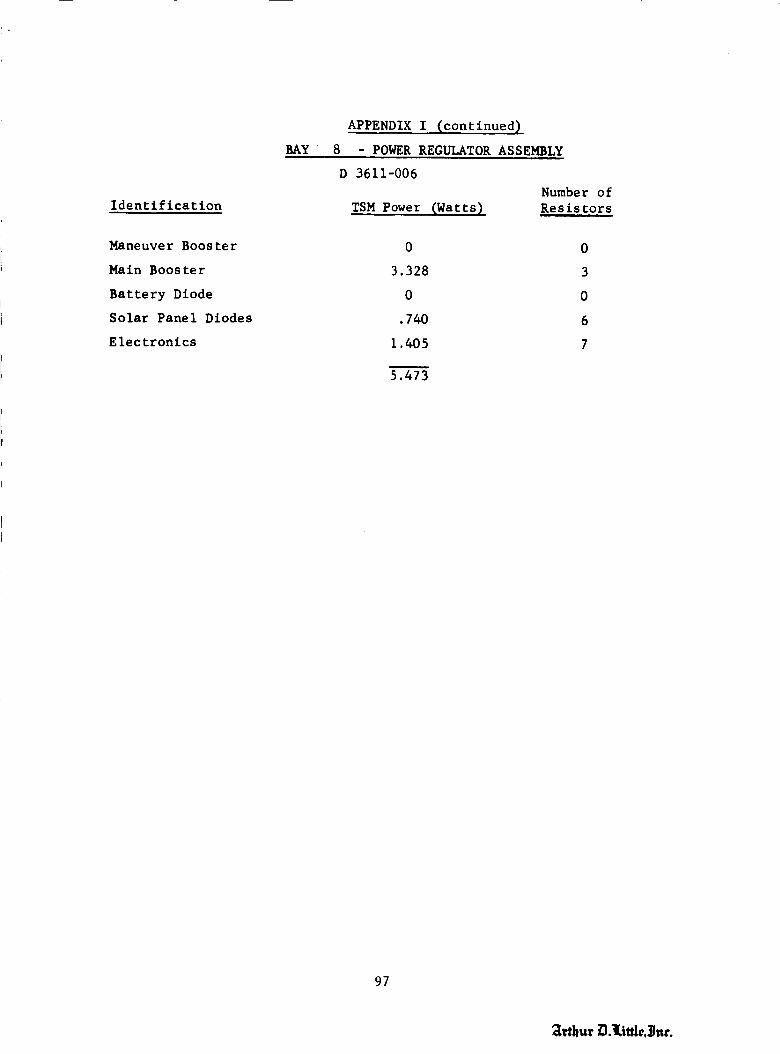
Identification
Maneuver Booster
Main Booster
Battery Diode
Solar Panel Diodes
Electronics
BAY
APPENDIX I (continued)
8 - POWER REGULATOR ASSEMBLY
D 3611-006
TSM Power
0
3.328
0
•740
I.405
5.473
(Watts)
Number of
Resistors
0
3
0
6
7
97
_lrthur _.little. _nc.

JPL
No.
242
243
245
246
248
249
250
303
305
306
307
309
310
311
316
322
323
324
329
330
332
333
336
337
34O
341
342
345
APPENDIX I (continued)
TSM THERMOCOUPLE LIST
Phase II Configuration
Location
Bus tube at bottom
Bus tube at top
Bay 4 A/C nitrogen bottle, top
Bay 8 A/C nitrogen bottle, bottom
Bay i, 4A15
Bay i, chassis at 4A15
Bay I, 4A13
Bay i, 4A17
Bay 2, mldcourse nozzle near throat
Bay 2, -,,.Id_v_--"r.__in__dp Jet vane
rlng
Bay 2, propellant tank
Bay 2, umbilical connector
Bay 2, shear plate
Bay 3, 33A2
Bay q; 32A4
Bay 3, chassis centerllne top
Bay 3, chassis centerllne center
Bay 3, chassis centerllne bottom
Bay 4, 6A13
Bay 4, chassis at 6A13
Bay 4, 6A9
Bay 4, flight
Bay 5, 2TRI
Bay 5, 2RAI
Bay 5, chassis centerllne top
Bay 5, chassis centerllne center
Bay 5, chassis centerline bottom
Bay 6, 2PAl case
98
_rthur/J._ittleJJar.

JPL
No.
347
348
349
350
401
402
403
4O6
412
415
418
419
420
422
423
LOK
426
451
452
453
454
APPENDIX I (continued)
Location
Bay 6, chassis at 2PAl
Bay 6, 2PSI
Bay 6, chassis at 2PSI
Bay 6, 2RE1
Bay 6, chassis centerline top
Bay 6, chassis centerline center
Bay 6, chassis centerline bottom
Bay 7, 7AI, one-third down
Bay 7, 7A2, gyro #2
Bay 7, 5A8
Bay 7, flight
Bay 8, solar panel diodes (upper,
bay 7 side)
Bay 8, _ular panel d_oa_s (lower,
bay 7 side)
Bay 8, main booster (upper, bay I
side)
Bay 8, vertical centerline top
Bay 8, vertical cenL=L-linc bcttO_
Bay 8, battery case
Hat Center
Hat Edge Bay 6
Hat Edge Bay 2
Flight Shield Bay 5
* ADL Numbering System--not used by JPLo
99
_[vthur _3.tttt[e,_.c.

APPENDIX II
JOINT CONDUCTANCE TEST RESULTS
The following data pertains to tests made with a full-scale electronic
subchassis bolted to a radiating plate and a 0.43 scale model of that
system. The purpose of the tests was to measure the subchassis tempera-
ture for different bolting torques, screw materials, and conductances of
a radiating plate to which the subchassis was bolted. In the tests the
power dissipated in the full-scale subchassis was maintained constant at
25 watts. The power dissipated in the 0.43 scale subchassis assembly was
held constant at 4.6 watts (c.f. Equation 5 which relates the power
dissipation to the scaling ratio).
The primary measurement was the tempeLature cf the _ubchassiso
Since a constant amount of power was dissipated in the subcha_is _'_--
use of a heater) and all of the power was dissipated by the radiating
plate, the average temperature of the radiating plate was a constant.
• ' _ +=mn_ratureThe temperature ;_;#°_=ne_s as stated below are Da_=u ON
measurements of the subchassis and the average temperature of the radia-
ting plate. An attempt was made to measure the temperatures in the ra-
diating plate, however, the plate was not isothermal and the temperature
measurements were strongly influenced by the conductance of the plate
and the exact location of the thermocouples. Therefore, it was decided
to use an average or reference temperature for temperature difference
calculations.
The screw torques were measured with commercial torque wrenches
and the absolute accuracy of the torques is subject to question. However,
several tests were made to determine the reproducibility of the test
i00
_rthur _l.tittle,_Jnr.

APPENDIX II (continued)
results. Between two identical thermal tests, the three screws were
removed and retorqued. The differences in the measured temperatures of
the subchassis were less than 2F.
The results of seven tests of the two subchassis assemblies are
presented in the following table.
i01
_¢thur/_l.tittle,_nr.
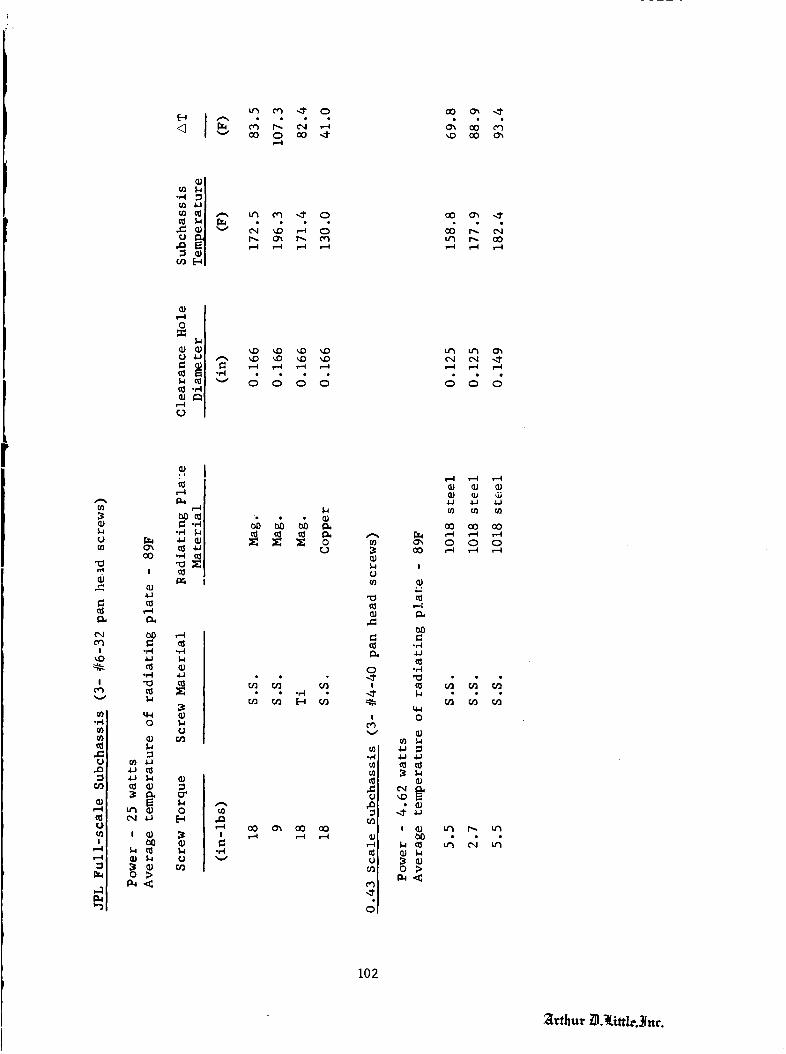
| _ * ° ° °
v O0 0 O0,'-4
O0 _ "..I"
V C_I _ ,-4 0 oO I'_ cq
f-I ,...4
r-I0
_ •g v o d d o
0
,--.4 ,--4 ,--.4
0
0
I
_u
I
!
m
gI
t_,e-.l
JJ
•,-4 .,-4
.-I _J
0 I-4U
bl_ • 0eq .IJ (-.4
(1_ I-* 0
0
• • or4 •
o..,-4v
0
0(/)
n_
0
0
I
Ioh
m
g
g
I
_.)
1.4
0
•1_ .IJ
• QJ
4-J _ _
CO O0 CO,--4 ,--.4 ,..-40 0 0
i02
_rthur _.gittle._nr.
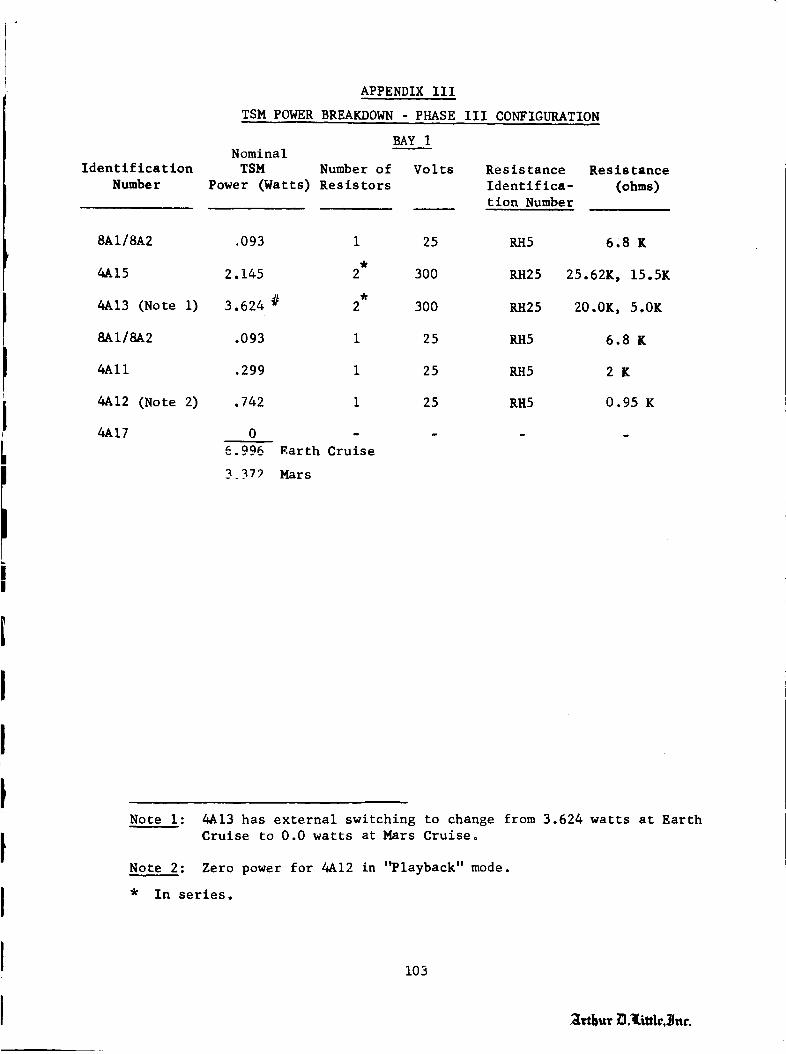
Identification
Number
APPENDIX III
TSM POWER BREAKDOWN - PHASE III CONFIGURATION
BAY 1Nominal
TSM Number of Volts
Power (Watts) Resistors
Re sis tance Res is tance
Identifica- (ohms)tion Number
8AI/SA2 .093 i 25 RH5 6.8 K
4A15 2.145 2 300 RH25 25.62K, 15.5K
4A13 (Note i) 3.624 # 2 300 RH25 20.0K, 5.0K
8AI/SA2 .093 I 25 RH5 6.8 K
4All .299 I 25 RH5 2 K
4A12 (Note 2) .742 I 25 RH5 0.95 K
4A17 0 ....
6.996 Earth Cruise
337P Mars
Note I: 4A13 has external switching to change from 3.624 watts at Earth
Cruise to 0.0 watts at Mars Cruise.
Note 2: Zero power for 4A12 in 'Playback" mode.
* In series.
103
_trtbur _._ittlc,_nr.

Identification
Number
APPENDIX III (continued)
BAY 3
Nominal
TSM Number of Volts Resistance
Power (Watts) Resistors Identifica-
tion Number
Resistance
(ohms)
33A2 .738 I 25 RH5 .95K
33A3 .246 1 25 RH5 2 .5 K
32A2 .104 i 25 RH5 6 K
32A3 .153 I 25 RH5 4 K
32A4 .679 i 25 RH5 .95K
20A5 .094 i 25 RH5 6.8 K
20A3 .094 i 25 RH5 6.8 K
20A4 .094 ! 25 RH5 6.8 K
21AI °072 i 25 RH5 9 K
Note:
2.274
Zero power in this bay during "playback" mode.
104
21¢thur/_._ittle,_Jar.
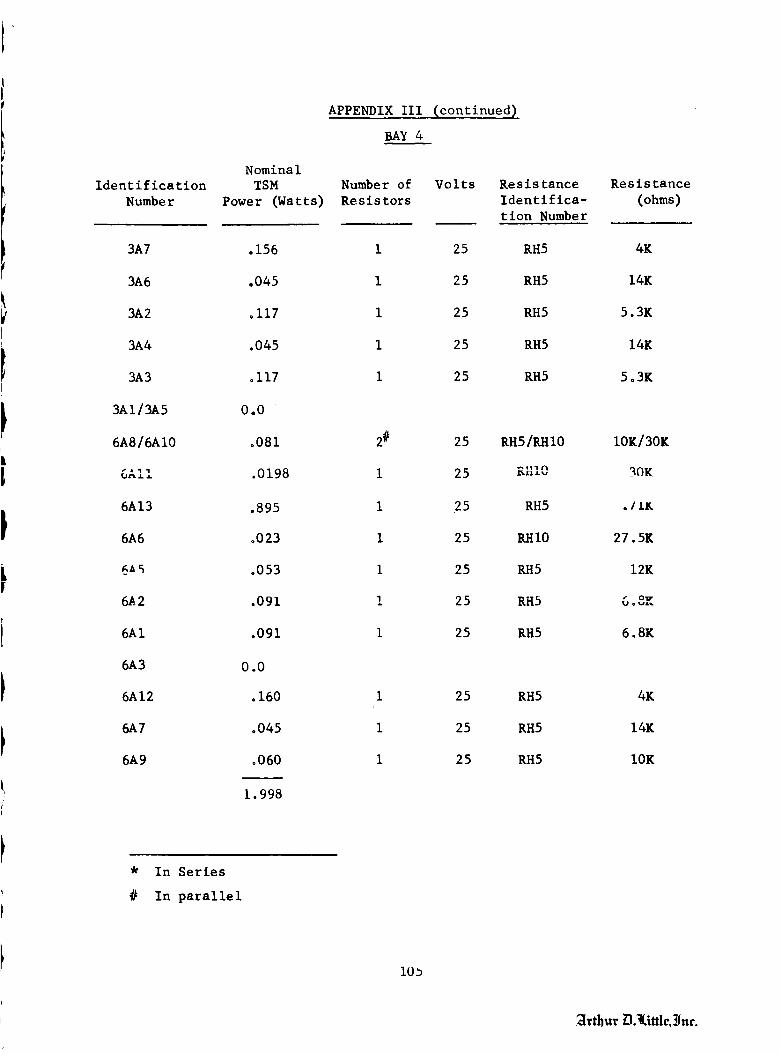
Identification
Number
3A7
3A6
3A2
3A4
3A3
3AII3A5
6A8/6AI0
tall
6A13
6A6
_A 5
6_2
6AI
6A3
6A12
6A7
6A9
Nominal
TSM
Power (Watts)
.156
.045
o117
.045
o117
0.0
o081
.0198
.895
o023
.053
.091
.091
0.0
.160
,045
°060
I.998
APPENDIX III <continued)
BAY 4
Number of Volts
Resistors
I
i
i
i
1
2#
1
1
1
1
I
1
1
1
1
Resistance
Identifica-
tion Number
Resistance
(ohms)
25 RH5 4K
25 RH5 14K
25 RH5 5.3K
25 RH5 14K
25 RH5 5o3K
25 RH5/RHI0 10K/30K
25 _n_ _OK
25 RH5 .l£m
25 RBI0 27.5K
25 RH5 12K
25 RH5 6° °v
25 RH5 6.8K
25 RH5
25 RH5
25 RH5
4K
14K
10K
* In Series
# In parallel
i0_
_¢thur/3._ittle,_nr.

Identification
Number
Nominal
TSM
Power (Watts)
2TRI
2RA2
2RAI
.322
.625
.440
1.387
APPENDIX III (continued)
BAY 5
Number of Volts
Resistors
Resistance
Identifica-
tion Number
1 25 RH5
2# 25 RH5
2 25 RH5
Resistance
(ohms)
2K
1.25K, 5.0K
0.71, 0.71
Playback Mode
16A4 •760 2# 25 RH5 0.95K, 6.OK
* In series.
# In parallel.
106
_¢thur _l._ittlr,$ar.
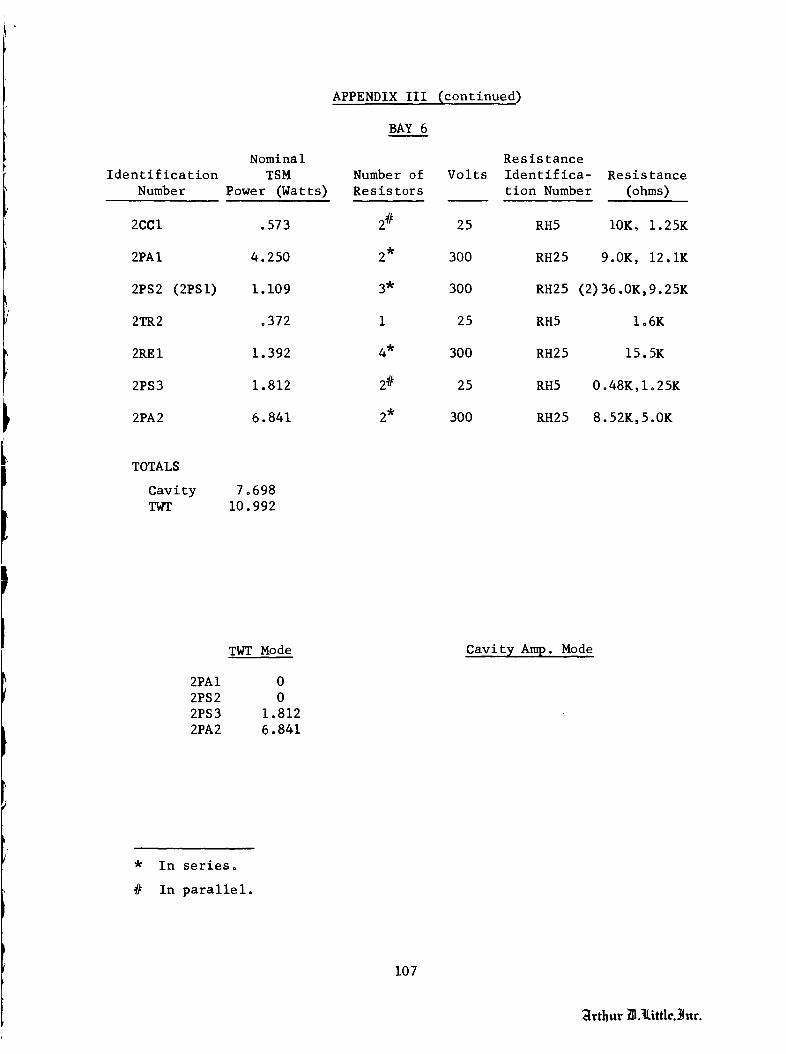
APPENDIX III (continued)
Identification
Number
2C01
2PAl
2PS2 (2PS i)
2TR2
2RE i
2PS3
2PA2
TOTALS
CavityTWT
Nominal
TSM
Power (Watts)
.573
4. 250
1.109
=372
1.392
1.812
6. 841
7°698
10.992
BAY 6
Number of
Resistors
2#
2*
3*
i
4*
2#
2*
Volts
25
3OO
3OO
25
3OO
25
3OO
Resistance
Identifica-
tion Number
RH5
RH25
RH25
RH5
RH25
RH5
RH25
Resistance
(ohms)
10K, 1.25K
9.0K, 12olK
(2)36.0K,9.25K
Io6K
15.5K
0.48K,Io25K
8.52K,5.0K
2PAl
2PS2
2PS3
2PA2
TWT Mode
0
0
1.812
6.841
Cavity Amp. Mode
* In series°
# In parallel.
107
_[_thur _._ittle,_rtt'.

Identification
Number
APPENDIX III (continued_
BAY 7
Nominal
TSM Number of
Power (Watts) Resistors
7AI .569 2#
5A8 .645 2
5A3 .080 i
5AI .080 i
5A2 .080 i
5A4 .080 i
5A5 .080 i
5A6 .080 I
5A7 .080 i
7A2 0
1.7749
Volts Resistance
Identifica-
tion Number
Resistance
(ohms)
25 RH5 9.0K, 1.25K
25 RH5 .48K
25 RH5 8K
25 RH5 8K
25 RH5 8K
25 RH5 8K
25 RH5 8K
25 RH5 8K
25 RH5 o_U_
* In series
# In parallel
108
2ivthur/_l._i.ttlc._J_tr.

APPENDIX III
BAY 8
(continued)
Nominal
Identification TSM Number of Volts Resistance Resistance
Number Power (Watts) Resistors Identifica- (ohms)tion Number
Main Booster 3.328 3 300
Solar Panel Diodes .740 6 300
E lectronics i.405 7 300
5.473
RH25 9K
RH25 20K
RH25 25.62K
RH25 8.52K
RH25 5o0K
EXTERNAL EXPERIMENTS
M_=netometer 0.185 1 Z5 RH5 4o0K
Ion Chamber 0.092 i 25 RH5 6.8K
Canopus 0.277 2* 25 RH5 0o48K,I.75K
Cosmic Dust 0.030 2* 25 RH5 10K, 10K
Trapped Rad. 0 _on I 25 K_5 _ N_eVU_ .....
Hi-gain Feed 0.107 i 25 RH5 6.0K
Note: All external experiments have zero power in playback mode, except
the Canopus, and Hi-gain feed.
*In series
109
_Icthur _l.Rittle,_ar.

APPENDIX IV
CALCULATION OF ANTENNA HEAT LOSS
We consider the antenna to be shaded from sunlight and joined to
the spacecraft bus without any thermal contact resistance. If the an-
tenna tube is assumed to be infinitely long, the heat loss from the
spacecraft bus which is maintained at a temperature T is given by the
expression
2q = 2/5 k A p c _ T 5
where
q
k
A
p
E
T
- heat loss
- thermal conductivity
- crossectional area of tube
- perimeter
- surface emittance
- spacecraft bus temperature
The prototype antenna tube has the following characteristics
k = 1.55 watts/cm-K (6061 AI)
2A = 1.96 cm
p = 30.9 cm
= 0.03 (assumed value for polished aluminum)
T = 300K
The calculated heat loss is 3.94 watts. The heat loss is actually
expected to be lower than this figure due to the thermal contact re-
sistance at the joint between the antenna and spacecraft and the fact
that the tube is infinitely long.
The antenna used in the TSM was constructed of aluminum and it
was a 1.75 inch OD tube with a wall thickness of 0.020 inches. The
maximum heat leak for this configuration is calculated to be 1.44 watts.
Ii0
2lrthur _13-Little._ar.
APPENDIX IV (continued)
For perfect thermal scaling, the ratio of heat leaks would be pro-
portional to the square of the scaling ratio or 0.73 watts for the
0.43 scale model. The resultant error in the average bus temperature
of Lhe scale model is estimated to be less than IF (c.f. the results
of Test i and 2 of Phase II where the influence of internal power
on the average temperature is approximately 0.5F per watt of internal
power) .
iii
_[rthur _._ittle,_uc
Component
I. Omni Ground Plane
APPENDIX V
TEMPERATURE CONTROL SURFACES
SCIENCE AND APPENDAGES
2. Omni Antenna Mast
Description
3. Magnetometer Sensor
Laminar x-500 green paint on top andsides.
4. lon Chamber
Polished aluminum exterior; buffed
aluminum interior.
5. High Gain Antenna
Polished aluminum chassis; vacuum
deposited aluminum Helmholz coil
cover.
6. lon Chamber Thermal Shieid
Polished metal except black oxide onion ball and G-M tube. PV-100 white
paint pattern on G-M tube.
7. High Gain Feed
Concave face and potted edges are
Laminar x-500 green paint.
.
9.
Laminar x-500 gr_n paint on top andsides.
Solar _anei SLLu_t.re
PV-IO0 white paint pattern and polished
aluminum.
Solar Panel Boost Dampers
Laminar x-500 black paint.
i0. Omni Mast Long Damper
PV-100 white paint on cylindrical
body of dampers.
Ii.
12.
13.
PV-100 white paint on cylindrical
body of damper.
Omni Mast Short Damper Outer tube is black anodize.
High Gain Support Structure Polished aluminum and gold plate.
MIT Plasma Probe Unpolished gold plate on body. PV-100
white paint on top.
14. Cosmic Dust Detector Clear Laminar x-500 on bottom and sides
of electronics. Vacuum deposited
aluminum detector plate with aluminum-
silicone paint pattern.
112
_rthur _l._ittle,_ac.

Component
15. Sun Sensors
16. Sun Gate
17. Earth Detector
18. Canopus Tracker
19. Sun Sensor Pedestals
20. Science Cover
21. High Gain Feed Support Truss
22. TV Camera
23. Science Platform Inertial-
Thermal Simulator (SPITS)
Mars Gate
Planetary Sensor
26. Planet Scan Platform
27. Planet Science Mounting
28. Octagon Science Installation
29. Science Installation 26AI and
33AI
30. Trapped Radiation Detector
31. Separation Initiated
32. Pyro Arming Switch
33. Cosmic Ray Telescope
APPENDIX V (continued)
Description
Cat-a-Lac black paint pattern and
polished aluminum.
As machined aluminum.
Polished aluminum body. Black
anodized cavity.
Polished aluminum.
Cat-a-Lac _hite paint on outboard
surface. Polished gold plate exterior
elsewhere. Cat-a-Lac black paint inside.
Polished aluminum.
As received plastic.
Polished gold p_=_=......=L_ p_1_=h=_.......]-minum.
Polished aluminum.
Polished aluminum.
Polished gold plate and _olighcdaluminum.
Polished aluminum and Cat-a-Lac black
paint.
Polished gold plate, Cat-a-Lac white
paint, and ARF-2 white paint.
Polished aluminum.
Polished aluminum.
ARF-2 white paint on radiator.
113
APPENDIX Vl
ERROR ANALYSIS - SUNLIT APPENDAGES
The magnetometer and ion chamber were thermally isolated from
the low-gain antenna and their temperatures were primarily determined
by internal power dissipation, the amount of sunlight absorbed, and
their effective radiating area.
The general form of the heat balance equation for a radiatively
coupled component with internal power is
where
_T 4 = aS+b
T average temperature of the body
S solar intensity
and a and b are constants.
The constant "a" is of the form
a = f (no' ¢o' p, Ap, A)
where
- solar absorptanceo
e - emit tanceo
- shielding factor of insulation
A - projected areaP
A - total area
and the constant "b" is of the form
where
b = f (P, _, A)
p n internal power dissipation.
114
2lrthur/_._ittle._ar.
APPENDIX Vl Icoqtinued)
By using the measured temperatures of the Mariner IV at the Earth
and Mars Cruise conditions, the constants can be evaluated.
The equations are
where
4
m
4_T.
l
= 0.1764S + 0.0075
= 0.2457S + 0.0061
T - magnetometer temperaturem
T. - ion chamber temperature1
From these equations, we can evaluate the uncertainty in the tempera-
tures for a given uncertainty interval in either of the constants.
ih_ _esults =_ tabulated below
Uncertainty in Temperature (F)
Magne tome te r Ion Chamber
A_- -I-_,o + 4F + 5F
Ab-- = + 5% + 1.5F + 1.3F
b - -
The results show that a 5 percent error in scaling the surface finishes
or shielding, etc., will introduce an error of approximately 5F in the
temperatures of the ion chamber and magnetometer.
We can also differentiate these equations to find the influence
of an uncertainty in solar intensity on the average temperatures.
We have evaluated these expressions at the Mars Playback intensity and
find
i15
_Irthur O._Little,_htr.
APPENDIX Vl (continued)
742 K cm2/watt
_l_] = 749 K cm2/watt
i
At the Mars Playback intensity the uncertainty in temperature is approxi-
mately 4F for a 5 percent change in solar intensity. The conclusion
is that a "perfectly" scaled model of either the ion chamber or magne-
tometer would be subject to an error in temperature of + 4F in a test
chamber where the solar intensity was controlled to + 5%.
116
_rthur _._ittI_._lm-.
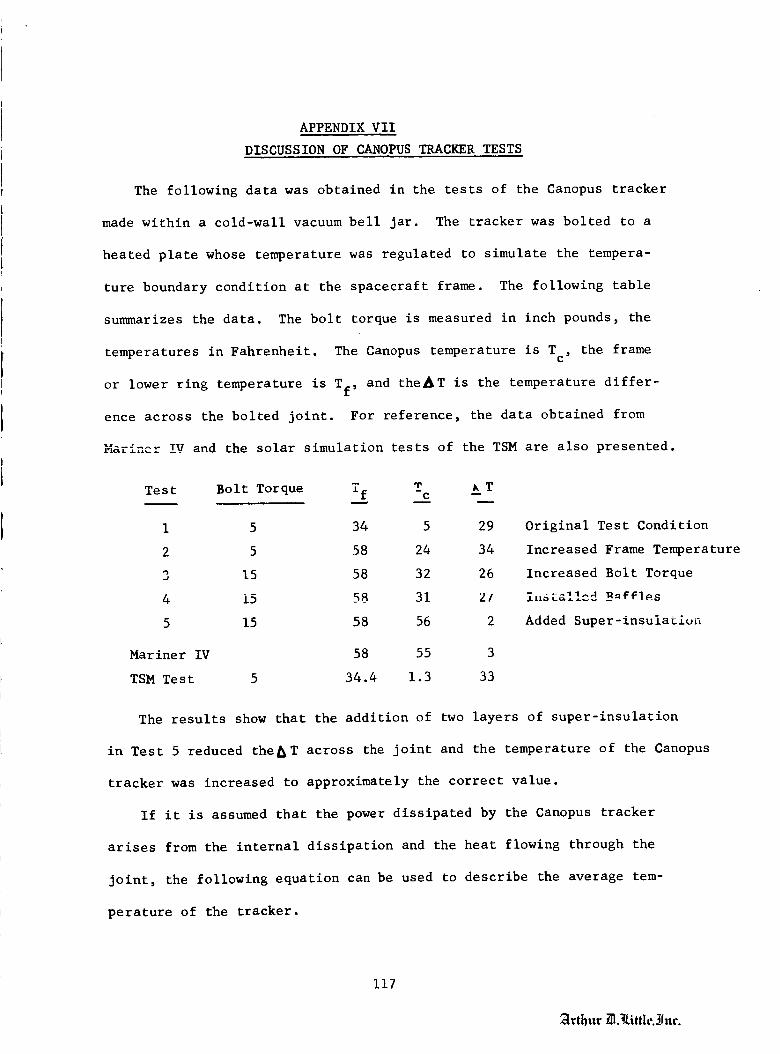
APPENDIX Vll
DISCUSSION OF CANOPUS TRACKER TESTS
The following data was obtained in the tests of the Canopus tracker
made within a cold-wall vacuum bell jar. The tracker was bolted to a
heated plate whose temperature was regulated to simulate the tempera-
ture boundary condition at the spacecraft frame. The following table
summarizes the data. The bolt torque is measured in inch pounds, the
temperatures in Fahrenheit. The Canopus temperature is Tc, the frame
or lower ring temperature is Tf, and thefT is the temperature differ-
ence across the bolted joint. For reference, the data obtained from
....... Tv and the solar simulation tests of the TSM are also presentedn= _-- ^r
Test Bolt Torque Yf Tc _&T
I 5 34 5 29
2 5 58 24 34
3 15 58 32 26
4 15 58 31 2/
5 15 58 56 2
Mariner IV 58 55 3
TSM Test 5 34.4 1.3 33
Original Test Condition
Increased Frame Temperature
Increased Bolt Torque
iL_stal!cd _ffles
Added Super-insulation
The results show that the addition of two layers of super-insulation
in Test 5 reduced thefT across the joint and the temperature of the Canopus
tracker was increased to approximately the correct value.
If it is assumed that the power dissipated by the Canopus tracker
arises from the internal dissipation and the heat flowing through the
joint, the following equation can be used to describe the average tem-
perature of the tracker.
117
_rthur _._ittle,_.c.
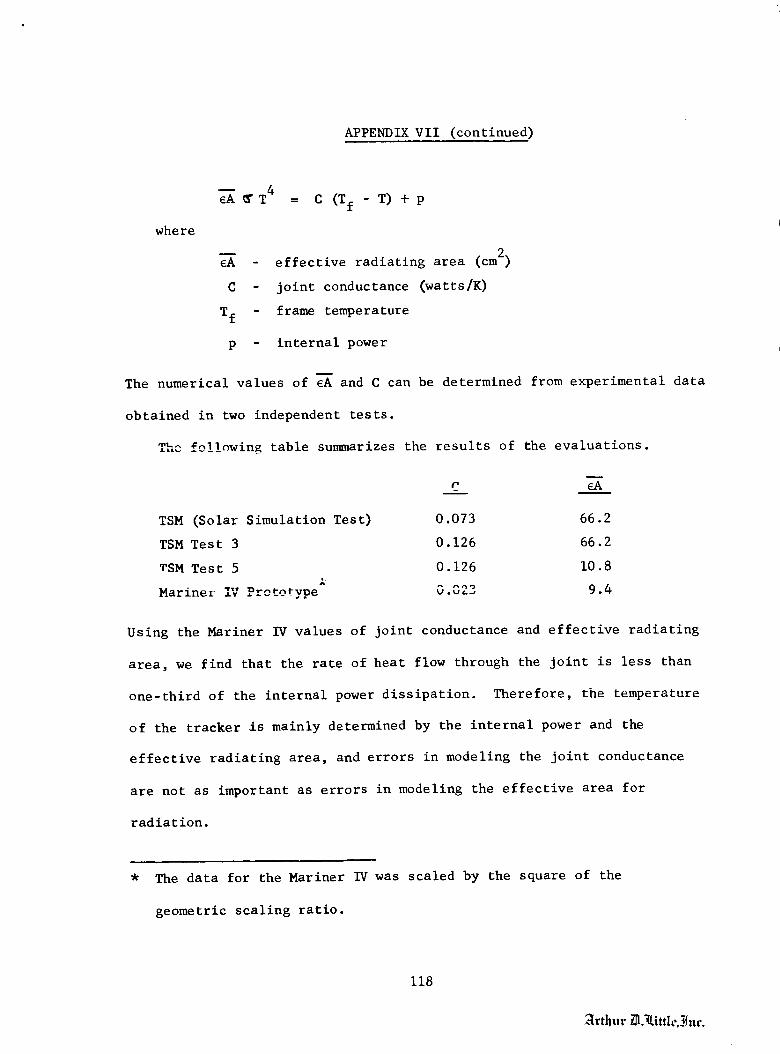
APPENDIX Vll (continued)
where
_ T4 = C (Tf - T) + p
eA -
C -
Tf -
p -
effective radiating area (cm 2)
joint conductance (watts/K)
frame temperature
internal power
The numerical values of cA and C can be determined from experimental data
obtained in two independent tests.
_^ #_11owing table summarizes the results of the evaluations.
m
eA
TSM (Solar Simulation Test) 0.073 66.2
TSM Test 3 0.126 66.2
TSM Test 5 0.126 10.8
Mariner IV =_en_vDe 0.u_o 9.4
Using the Mariner IV values of joint conductance and effective radiating
area, we find that the rate of heat flow through the joint is less than
one-third of the internal power dissipation. Therefore, the temperature
of the tracker is mainly determined by the internal power and the
effective radiating area, and errors in modeling the joint conductance
are not as important as errors in modeling the effective area for
radiation.
* The data for the Mariner IV was scaled by the square of the
geometric scaling ratio.
118
_[rthttr _l.;Little,__lttr.

APPENDIX Vll (continued)
The data clearly show that the radiating area of the original TSM
design was in error by a factor of six. Adding the super-insulation
reduced the effective area to approximately the correct value.
Two factors could have influenced the errors made in the effective
area of the tracker. First, in small scale, the area of the gaps be-
tween the thermal shields becomes a larger percentage of the total
area and these gaps have an effective emittance of nearly unity.
Second, there may have been temperaturegradients in the shield used
on the prototype and the presence of temperature gradients decreases
the effective radiating area because of the "fin effect." The conduc-
tive path_ in the thermal shield of the TSM Canopus tLackcr wer_ not
scaled and, therefore, it would be possible to dissipate more poweL
at a given internal temperature. Third, there could be a difference
bat_ee_ the emittance of the prototype and model thermal shield. We
expect this to be a remote possibility as both shields were made
from polished aluminum and a factor of six in the emittance is unlikely.
On the basis of these limited test results we conclude that an
error in modeling the effective radiating area of the TSM Canopus
tracker led to a significant error in its temperature. Further tests
will be required to determine whether an uncertainty in the emittance
of the shield, the presence of a temperature gradient in the shield,
or non-scaled gaps in the shield produced the errors.
119
_rthur _3-Little,_nr.

_.-
t
I
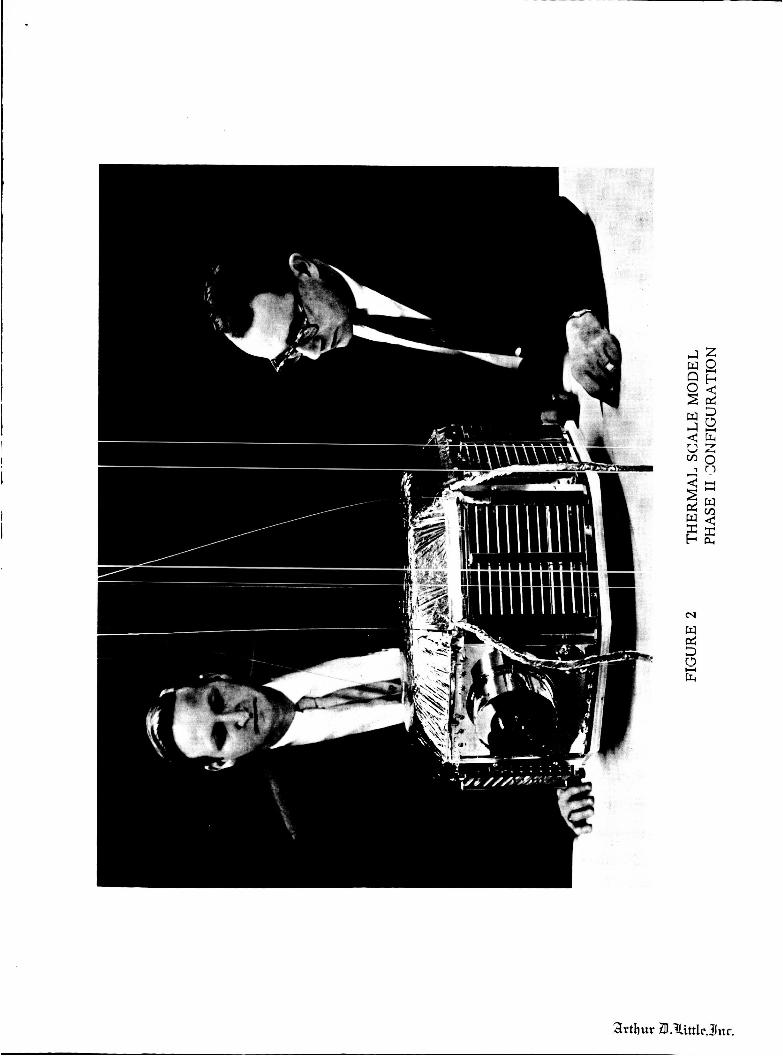
I4 W 0 n 2i
Y U
w v3 c
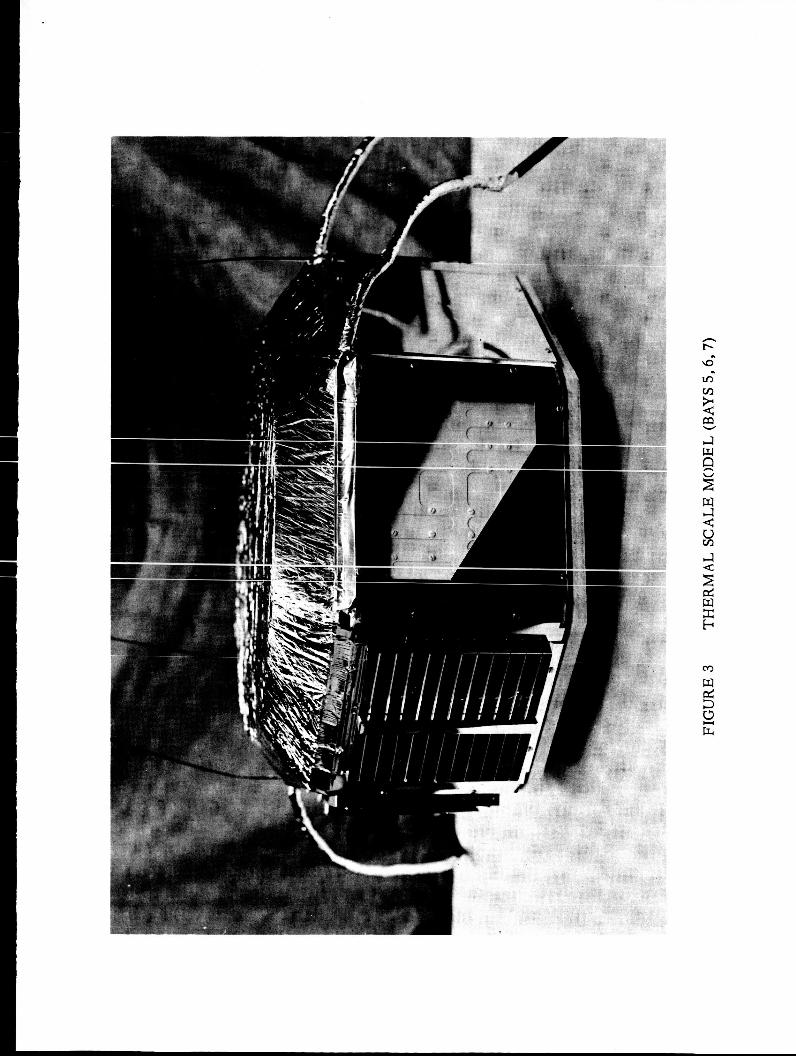

FIGURE 4 TOP VIEW - TSM BUS

FIGURE 5 BOTTOM VIEW - TSM BUS

FIGURE 6 BOTTOM VIEW - TCM BUS

c m t-c I
3 w > d
d
Y
9
5 U
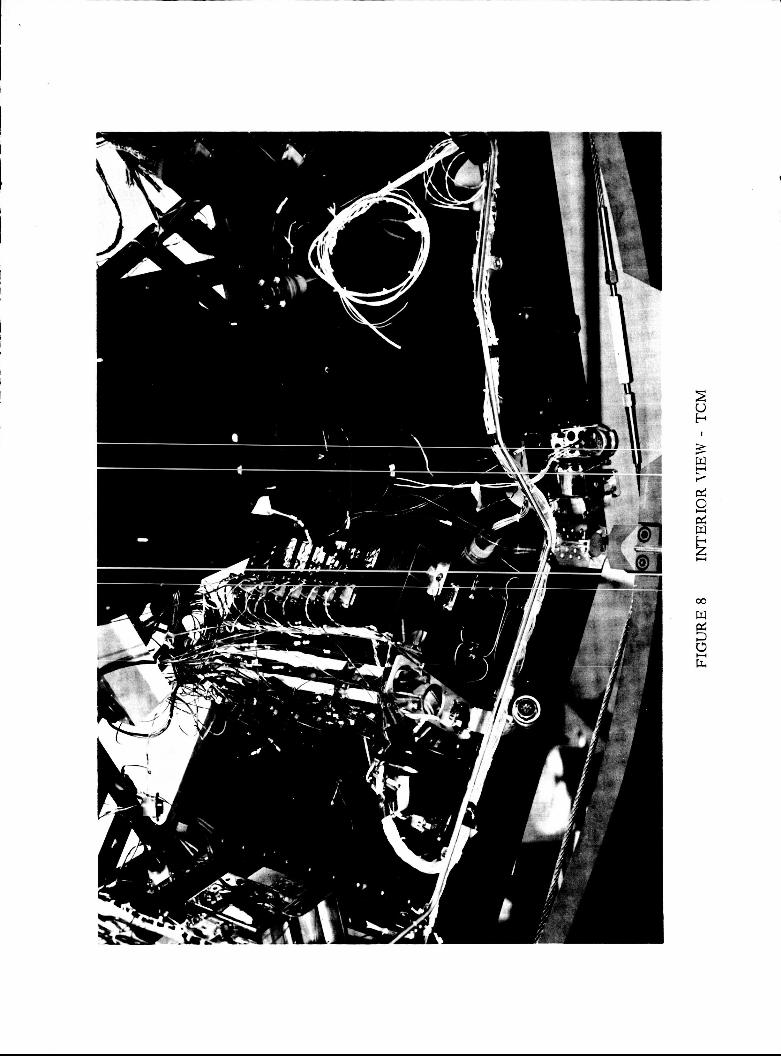
P

!!
i,
• I I " I _ I " I I I " I " I ° I '_

II|1
-- _lllJiJ
N
Ill
,t
z I _ I - I
t_
0
fu o
0
0
0 0 0 0 0 0 C_
0 0 0 0 0 0
0
o 0 0 0 o 0 o 0 0 0
0
0 0 0 0 o o 0 0 0 0
00 0 0 0 0 0 0 0 0 o
v o
@ ® @ @@ @ @ @
-_I o°....... ooo--- _ o o o o o o o o o o
o o o o o o o _; o o
i "_ 0 o 0 o 0 o
/o o o o o (2
m
0 0
_o
o
o
oo
o
oI
/ i!i_l_U,
0 o o o
0 0 0 0
o
o
o o o o
o o o o
ioli I - I
il '_ iI
_E
0 _ I0
o o 0
(0 o 0
o
o
0 0 0
[ ]0 0 o
[ ]
[ ]o o o
ohjOy-L_j_ I°[i
ofo
0
0
(Jc_ o
o o
] _ m1o o o
1[ ]o o o
0 0 0 0 0
0 0 0 0 0
r_
o o o o o o o
[- 1 C )0 0 0 0 0 0
_I " o ojI o 01
o o o o
o
o
0
o o o o
oo o o o o
o o o O 0
( ] [ ]o o_ o o o o o
o
o
o
o
I = I _ I " I i°i ! I _' I " I "

m
" o I . i* I i L i o ! i t _/J_//- oo.5 I
•, I
Jil,_/_ll,
\\\
I = I _ I _ t !°! i I o I " I * I
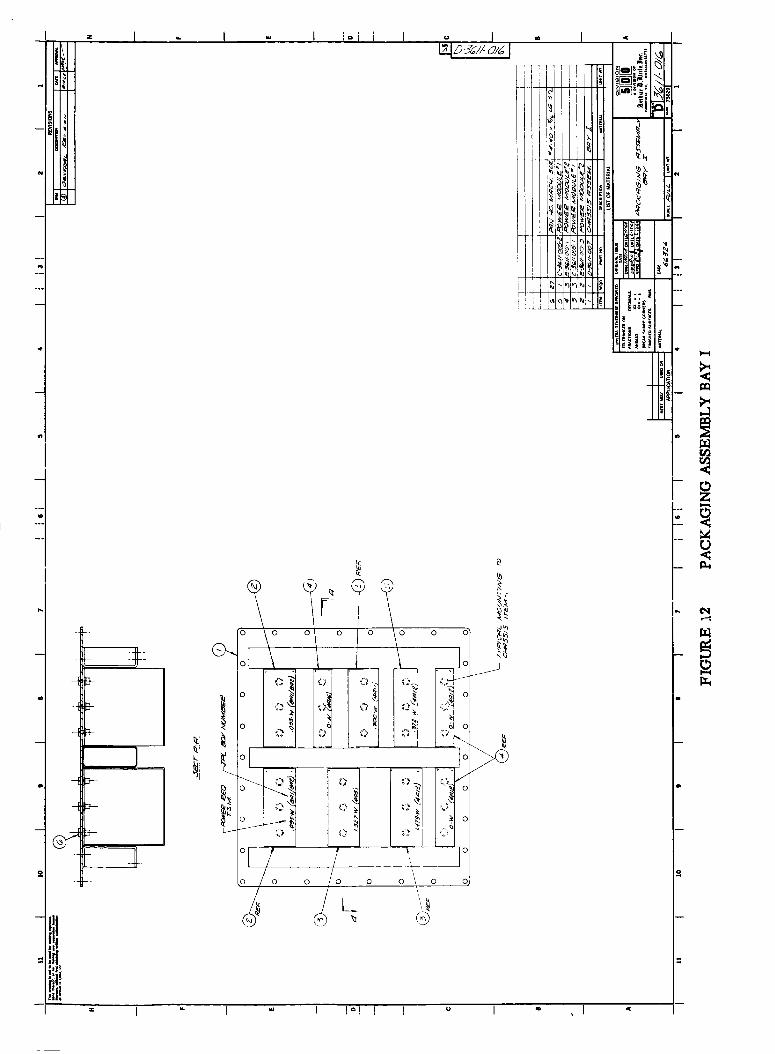
i
®
I ioii I
0 0
0
@
° I
u
_ IX¢
,.. eSl

I ,,, i io_ i I
cqr
0 0 0 0 0 0
_11 _ -_ i
L
0 0 0 0
G @
I
[i
r_
eo

I .- I - I ioi i I
m
L I
iiiii!ilib
0
o I
= I _" I * I i°! ,i I _ I " I '_
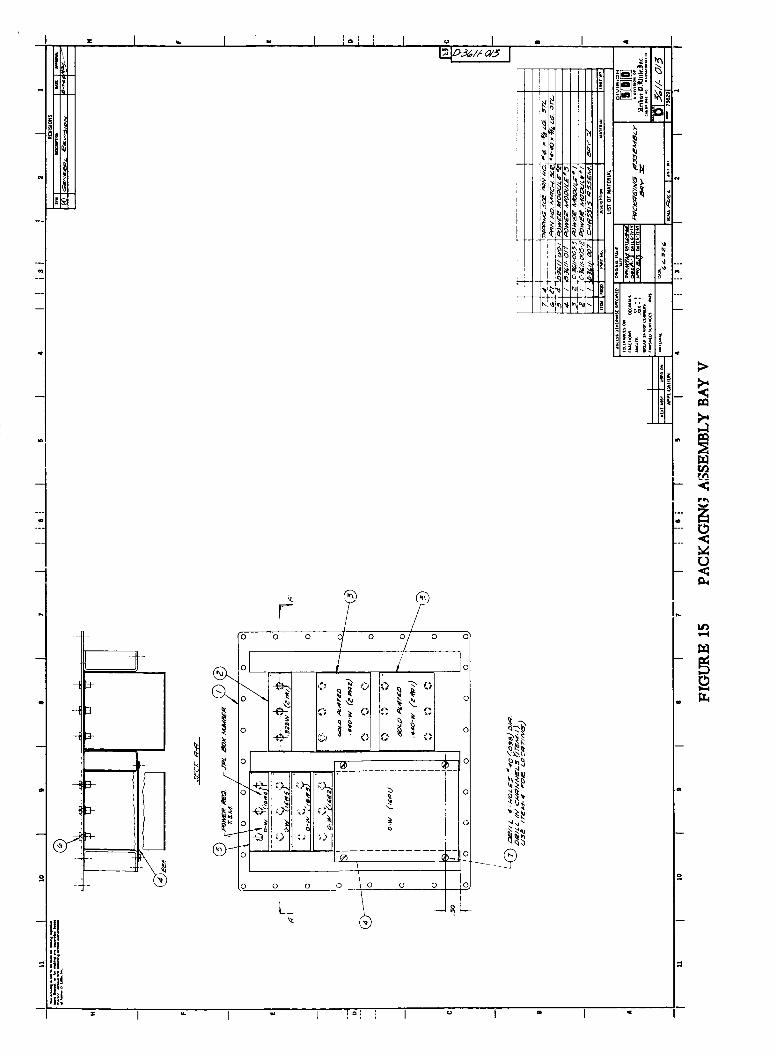
u
o
-7
.. L_
ill
IH
It|
I - I
I
I °
i i i i _<-_it°l:l
_t
F-
0 0 0
0
ol
,' _,,_ _ ,_-_._
4XII<'HI'.'_11:J_
o o
L_c
:,7i oo................ ____1°
,m
0 I_0 0
@
oj
I ,, I

ii
o
--I
" i- "
Itl_l i
I|
I|1@1 I
_o
0 0
\
ioii u - I
i__3"_!'_1__i_llI_, I_;_ ._1_1I_1_
ii l_rl_'_l'' _,1_11_1
[! _;"i"1'_1' '_l'ii_l
_'I f,,,_ _"
-_-:-- I
i--
I
,!
|!
D
_ I " I " I I°! I I ° I ® I "

i|l_I
_i i i i_.I ' ' '
I|I_II
-I
4
--_--
" I
I - I i°i i I
V"
R"
_Io\I ........,._
0 0 O/ 0 (D 0
I " I !°! I I _
0
0
0
0
0
! !
I " I
1I_I.I-I-!-II_I
- ._
I.
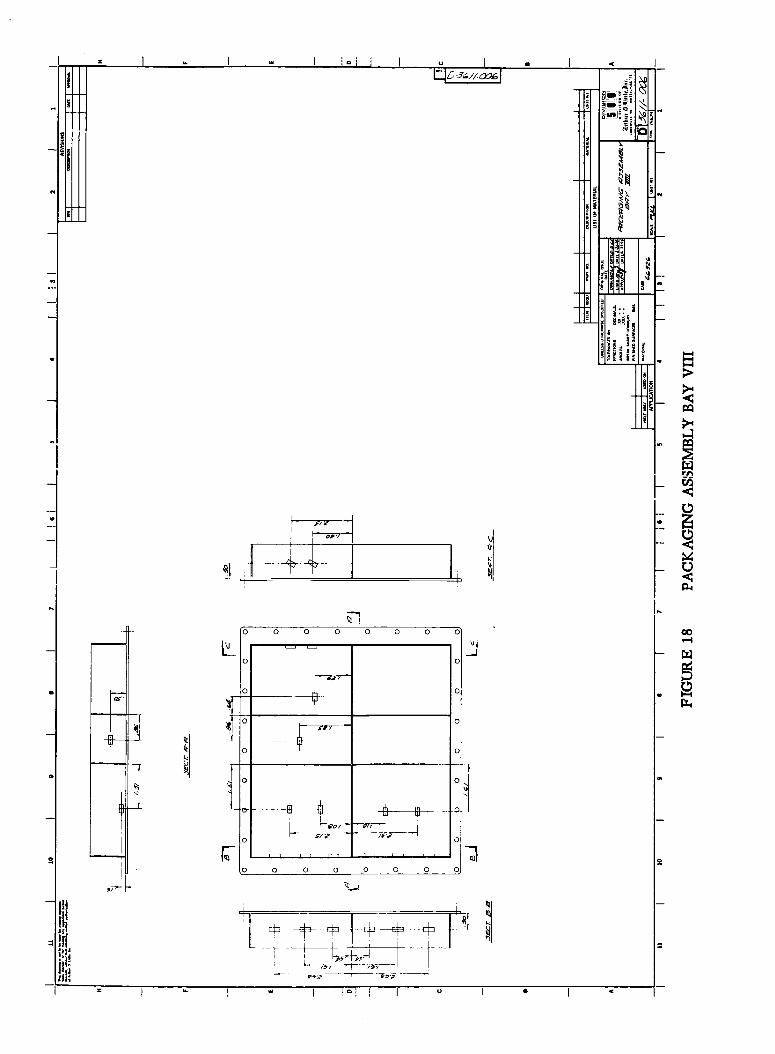
. I|/
-- _lllI!1
I11
o
.11,
I
i
ioi i I o I
i,
L
_V
0 0 0 0 0 0 0
0 0 0 0 0 0 O_
2/
_
L

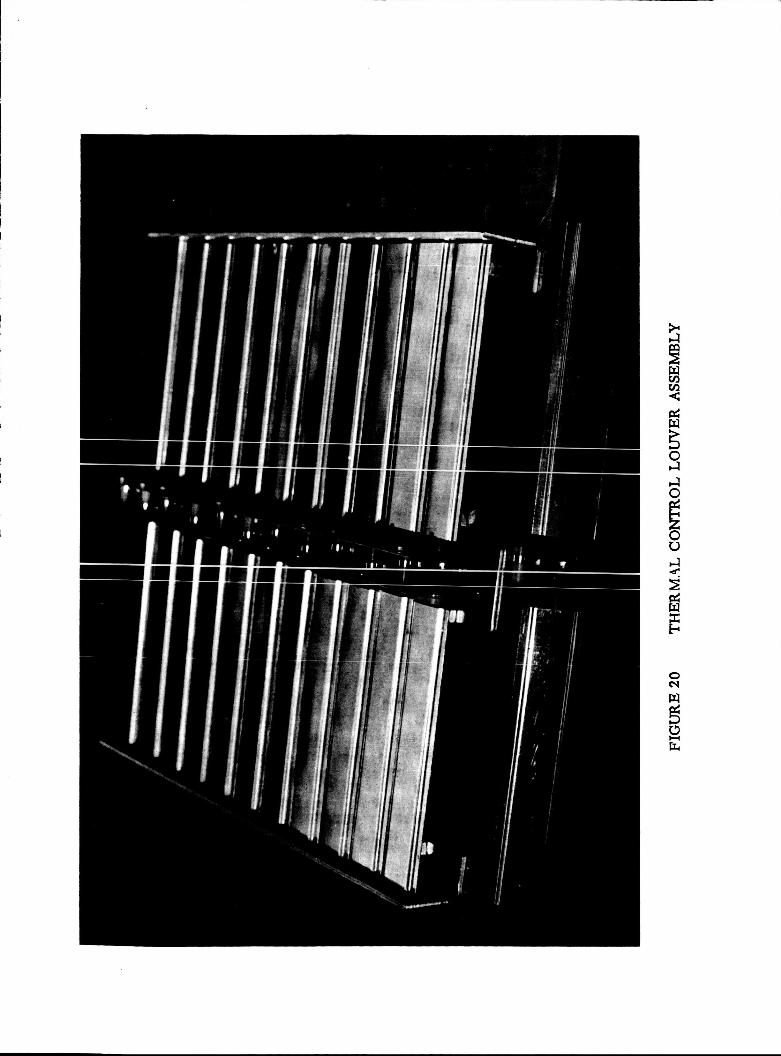

\\
.Q
E
<
:>
0M
r_
i1;
6
1
I
,.Q
_ <
o.1
b,
%
%%%
0 eq o
o
Z<
m_©
g_" o
m
0
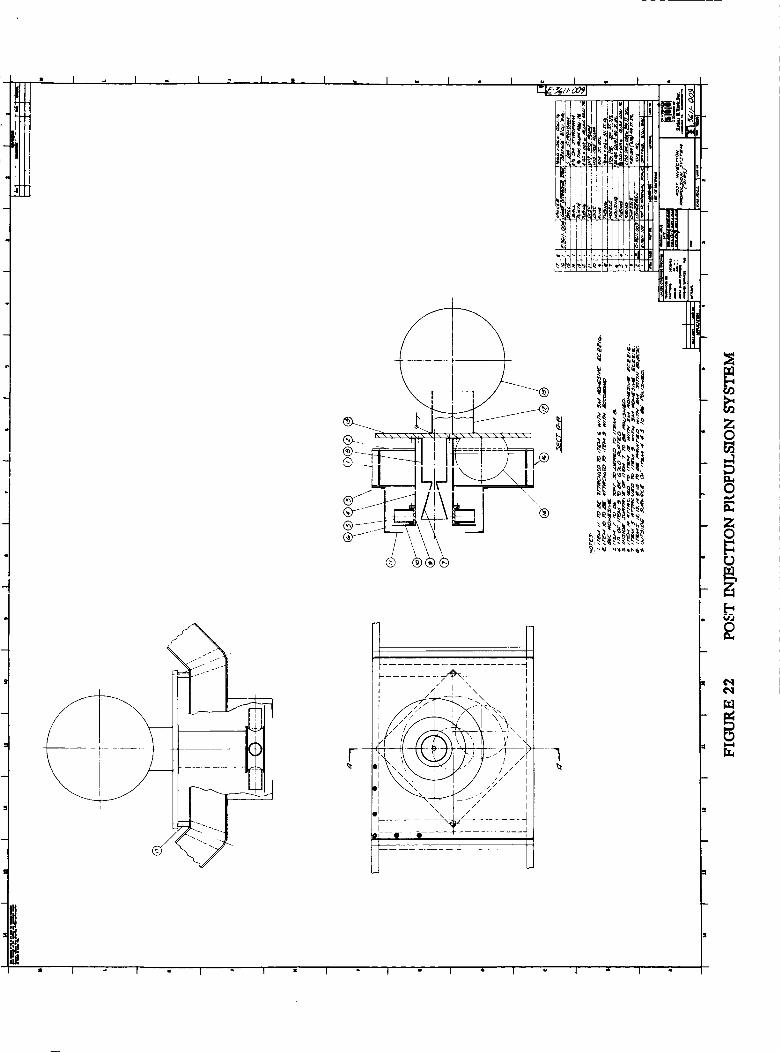
I I - I I I - I o I - I
i
Ill
iliII
titi
-4-
I r \
F __ ---3
t! ',ill
iil
iI ,I1,,,i ltt_i
0, i_l!,_._
_._: ,_
I
il_lItll
I_l?l_l: ::::
i i,_ll_ llll
-i._i.iT_i"I'_!_i'1 I_1
i:r.1
zo
,..tID
I :0- Z
0
r,.,)
¢',,1
lIl
i.=,l
il.,
• I I - I I " I " I " I ° I u I • I "
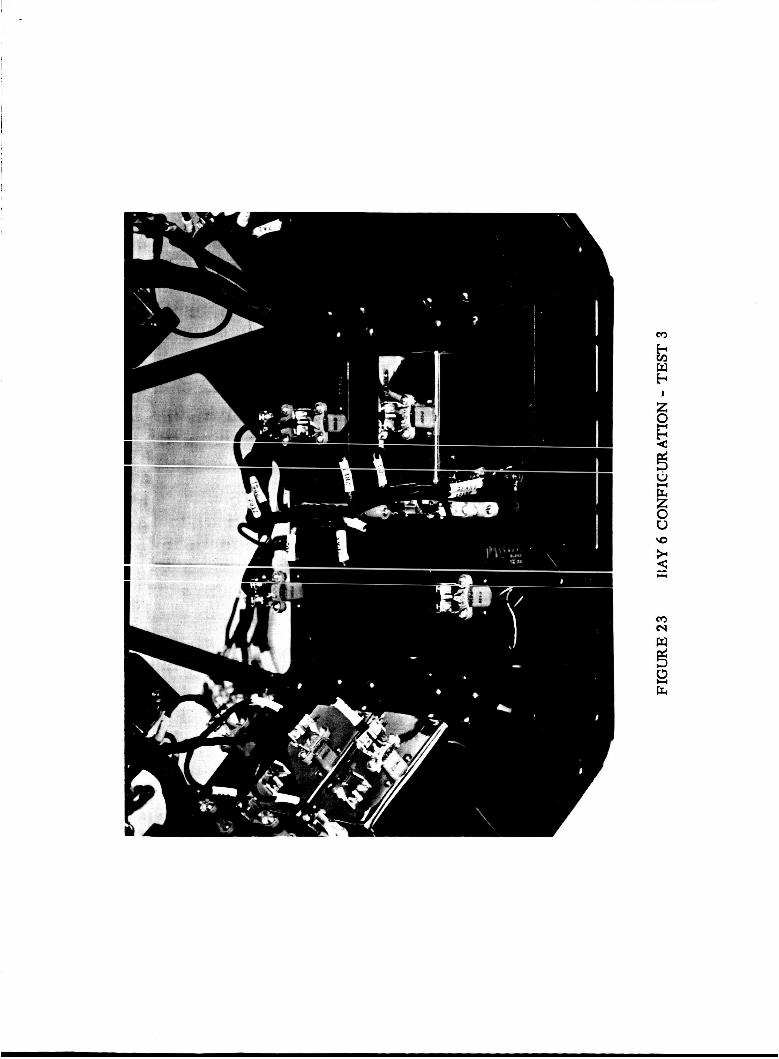
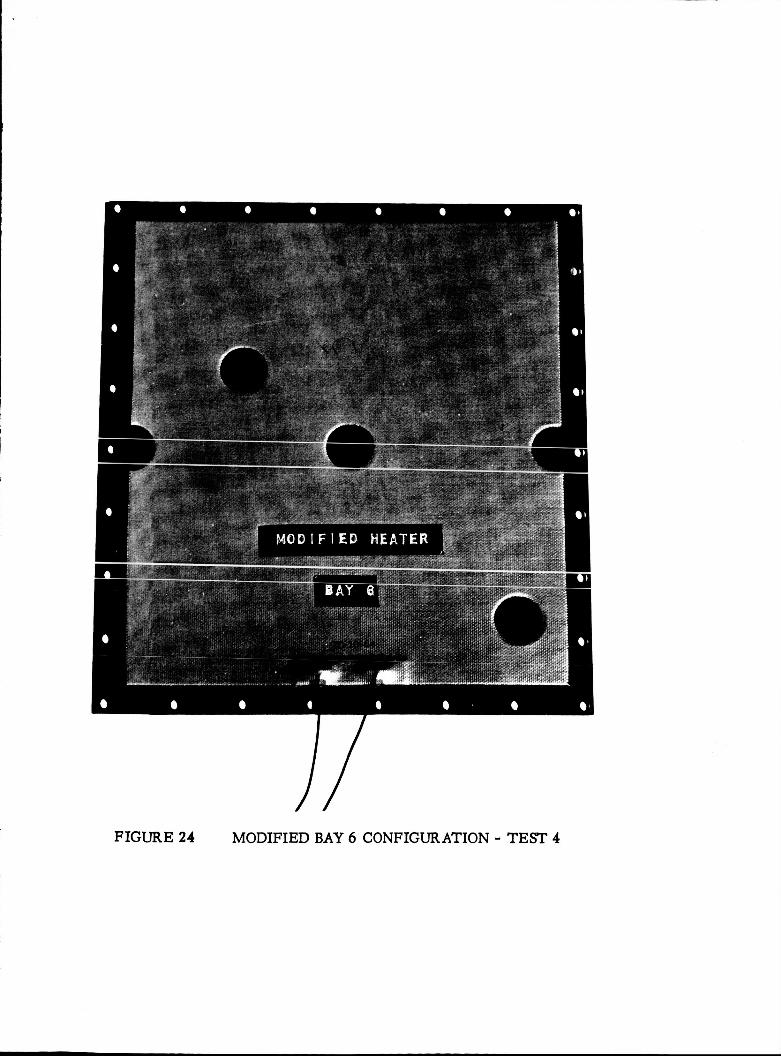
FIGURE 24 MODIFIED BAY 6 CONFIGURATION - TEST 4


FIGURE 27 MARINER MARS 64 TEMPERAl’URE CONTROL MODEL
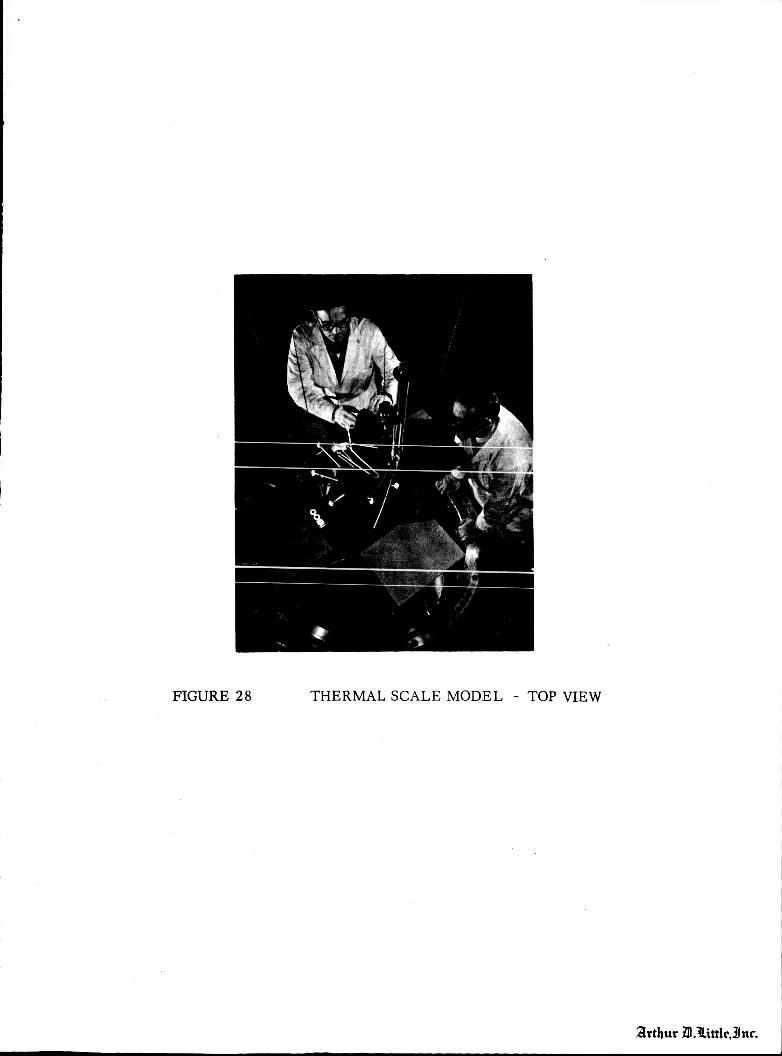
FIGURE 28 THERMAL SCALE MODEL - TOP VIEW
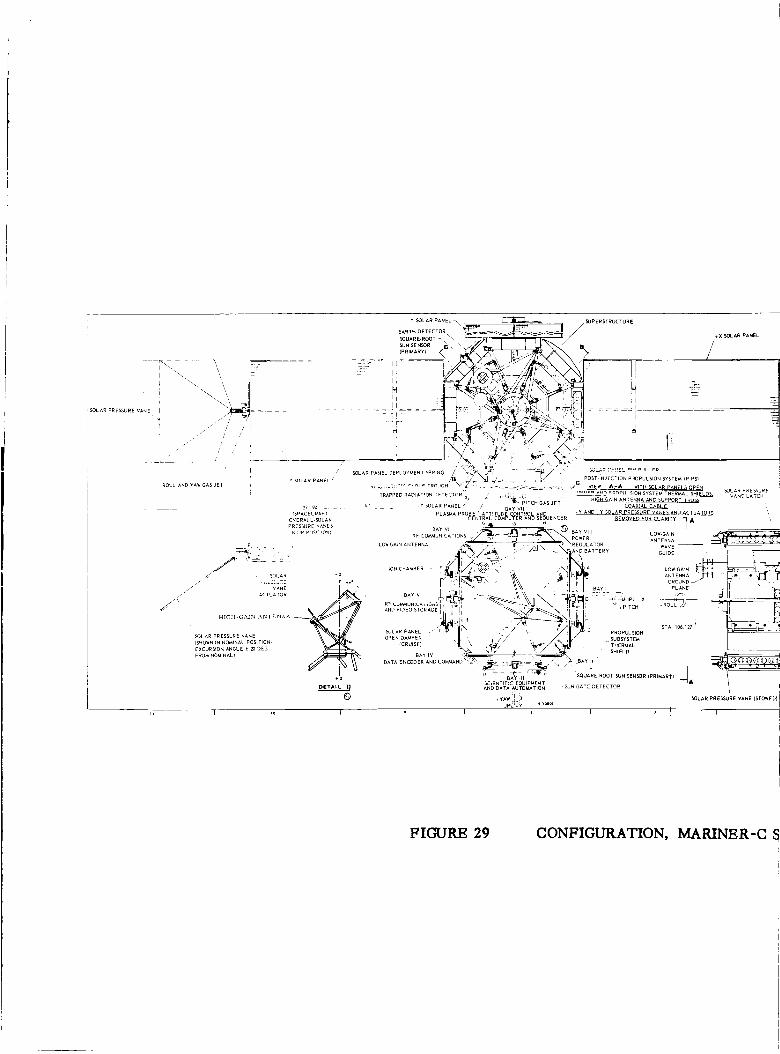
j _PERSTRUCTURE
/," ÷X SOLAR PANEL
/i1>,
---- 271 94 .....
[SPACECRAFT
OVERAL L SOLAR
PRESSURE VANES
IN UP POSFTION_
SOLAR - z
/" .... _.uz r ,..
/ VANE ,L_/ - _CTUATOR
HIGH-GAIN ANTENNA _
SOLAR PRESSURE VANE
(SHOWN IN NOMINAL POSITION
EXCURSION ANGLE ± 20 DEGFROM NOMINAL)
*z
OZTA_L
o
FIGURE 29 CONFIGURATION, MARINER-C
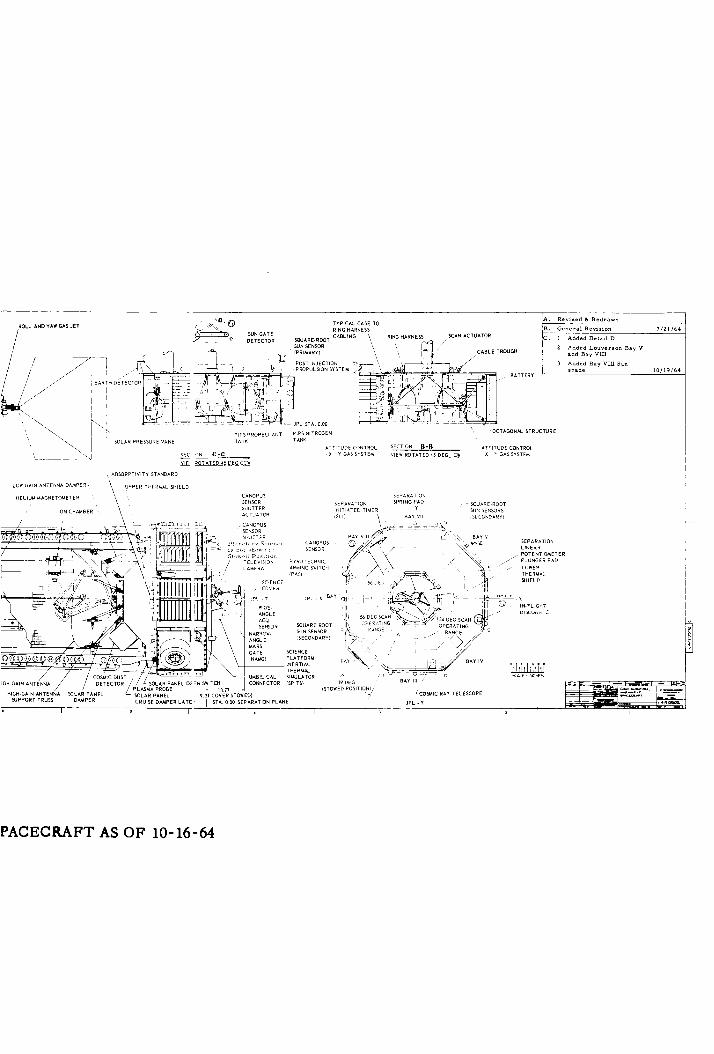
7/ZI/64
10/19/64
PACECKAFT AS OF 10-16-64

FIGURE 30 THERMAL SCALE MODEL
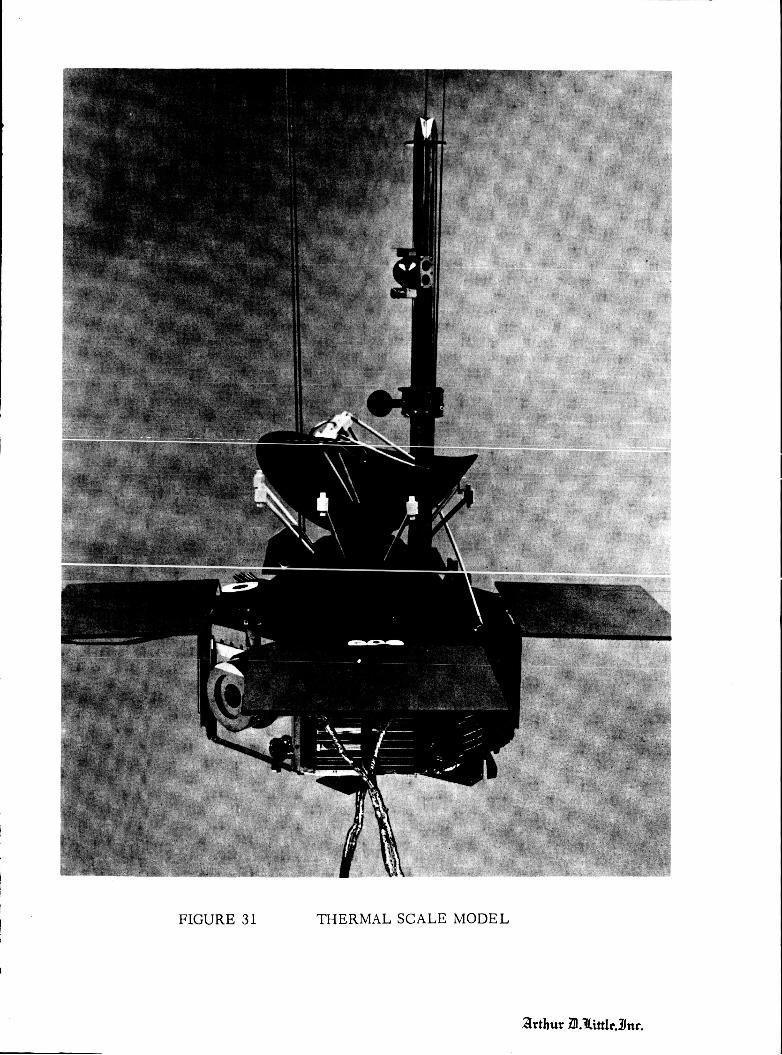
t
FIGURE 31 THERMAL SCALE MODEL
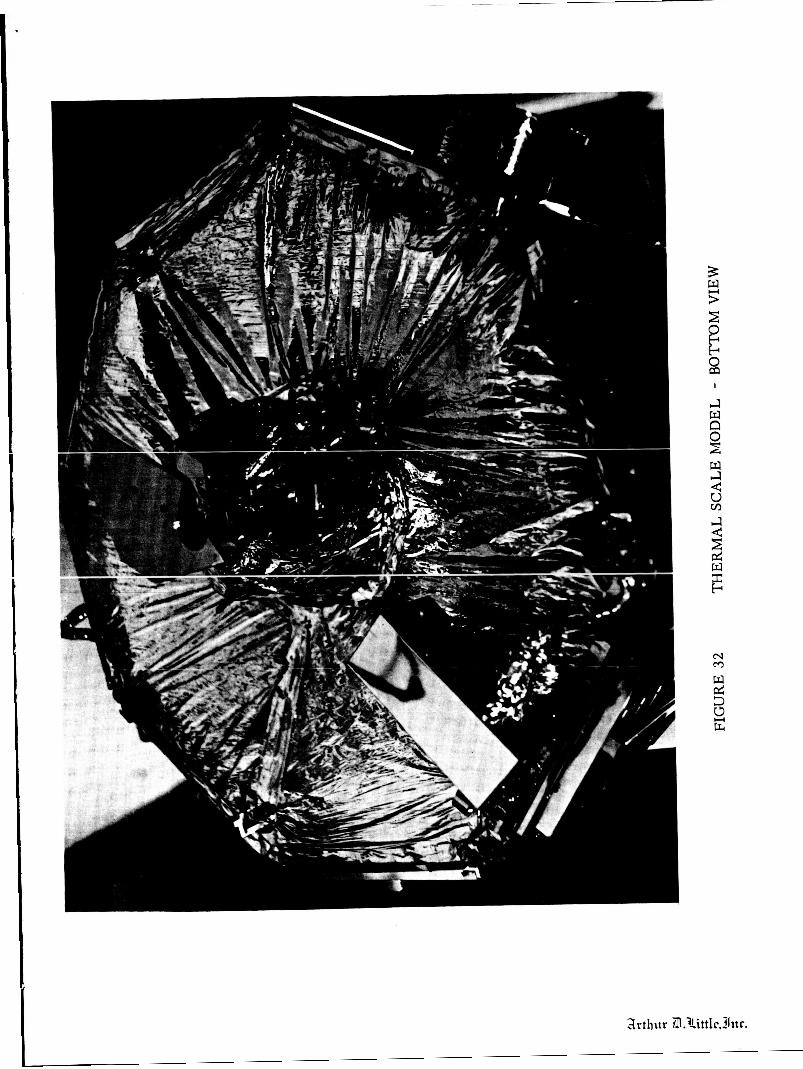
3 r t h iir .%i ttl r. 31 it c.

FIGURE 33 THERMAL SCALE MODEL - LOUVERS AND UPPER SHIELD REMOVED
2 r t h ut 2D .XittIc, %n t.


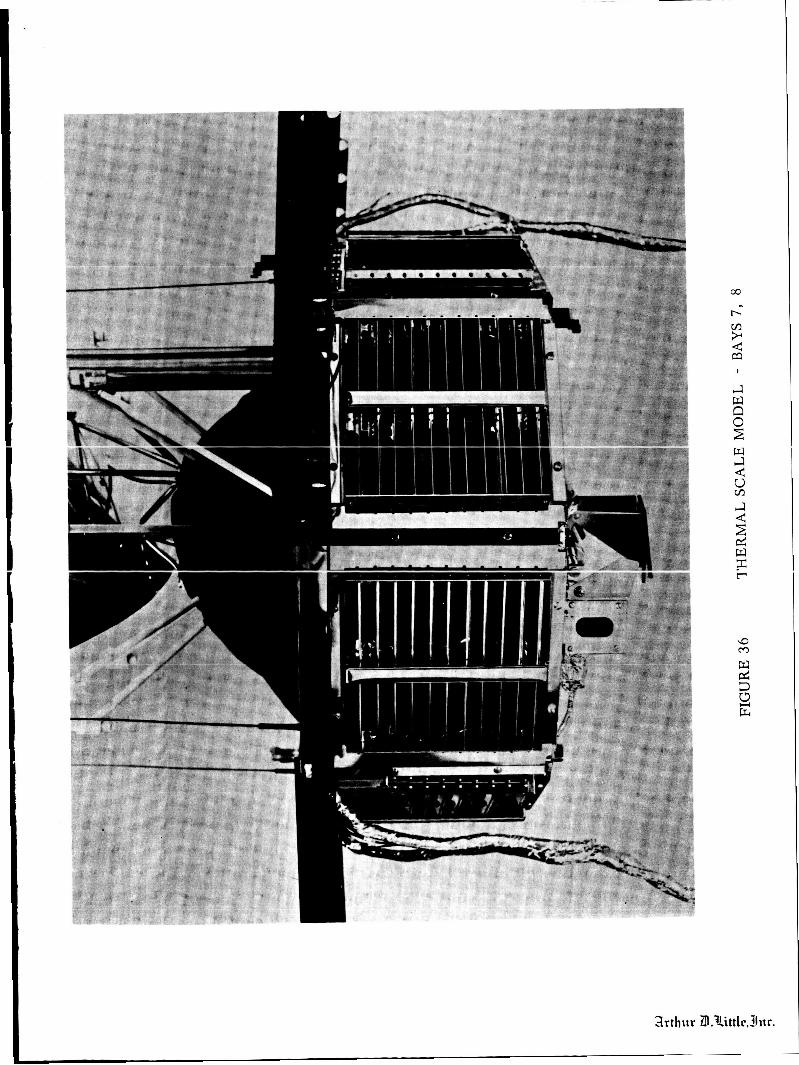
art h ur D .%ittlc,/ln r.
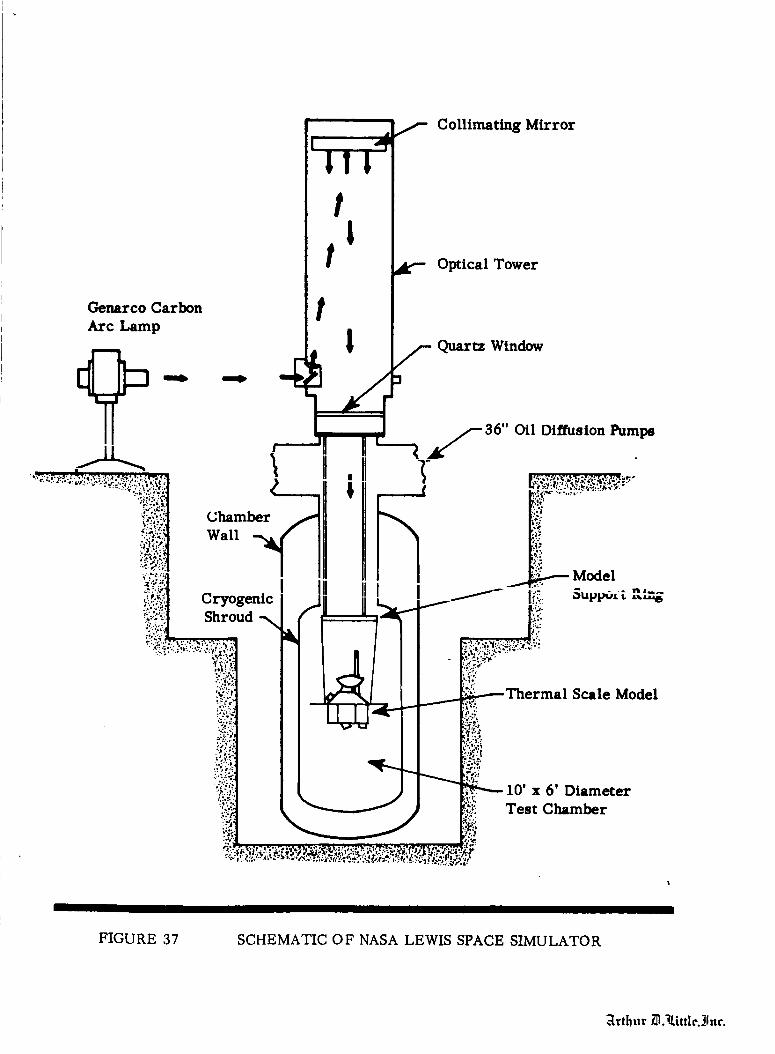
Collimating Mirror
PIt _-- Optical Tower
Genarco Carbon t
Arc Lamp I
_ __ -- _ 4 _ Quartz Window
II _ f 36" Oil Diffusion Pumps
'*:,'_'_'T-.s+:.+. '- _;+.':_.'..+;.;':s+;".'++.+'....:n["_.,'l . U II II ') __.,:.,.................. _':_+':_'_'i:_:'_'_",;,".:::x..t_| JP II • II * _" '..+_;".'+':""
".'.:+_ii_i'J "---qH "II • ' _+:+........._.-.:_!_J Chamber /'tll II _ t;,-_:
__:_"+ I m ,,, . -...-._....',
"1' _l II I_/ II _.++:+++-
+;'."." 5??:'
FIGURE 37 SCHEMATIC OF NASA LEWIS SPACE SIMULATOR
.':trthur Z11.+.Little,jlnr.

\\
I i
Sen_or "'^ _,,1,,,. 1 on TRD [
Shadow of IntensitySensor No. 3
Circle of Illumination
Approximately 24" Diameter
FIGURE 38 SOLAR ILLUMINATION PATTERN
.2Irthur O.tLittle._lttr.
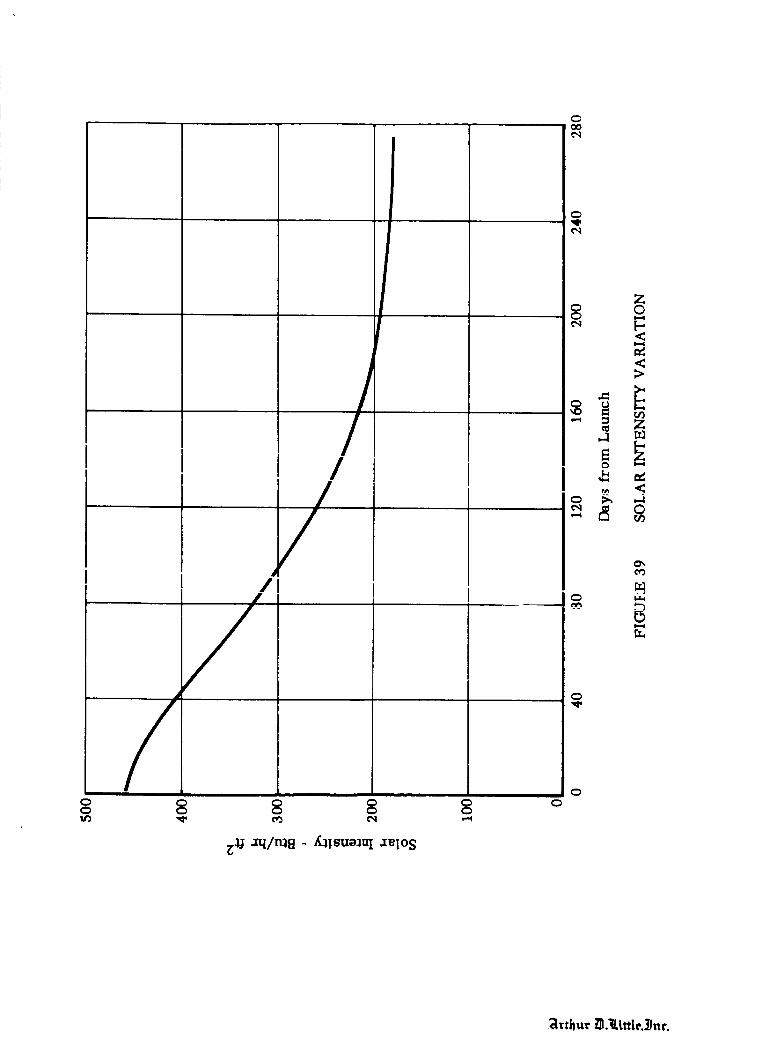
/
/
Oo g g g
0Q0t"q
0
J_
g3d _q/m8 - _!suo:luI ZelOS
0
0
o_
.'-3
{3
_rthur i_.Rtttle._ur.

FIGURE 40 TSM CANOPUS TRACKER