Thermal management of high temperature polymer electrolyte membrane fuel cell stacks in the power...
23
1 Thermal management of high temperature polymer electrolyte membrane fuel cell stacks in the power range of 1 to 10kWe E. Harikishan Reddy a, b, [email protected] , Sreenivas Jayanti a, ∗ [email protected] , Dayadeep S. Monder b, C, [email protected] a Department of Chemical Engineering, IIT Madras, Chennai 600036, India b Department of Chemical Engineering, IIT Hyderabad, Yeddumailaram 502205, India C Department of Energy Science and Engineering, Indian Institute of Technology Bombay, Mumbai 400076, India ∗ Corresponding author. Tel.: +91 44 22574168; fax: +91 44 22574152. Originally published in Journal of Power Sources, Elsevier B.V. http://dx.doi.org/10.1016/j.ijhydene.2014.09.132 Abstract Maintaining optimal temperature of the stack is critical for efficient operation of high temperature polymer electrolyte membrane fuel cells. While a number of possibilities of thermal management exist for small stacks, the problem becomes more complicated for larger stacks. In the present study, the thermal management of stacks in the power range of 1- 10 kWe is considered through computational fluid dynamics simulations. It is shown that large stacks need to have dedicated cooling plates through which a coolant is circulated. Further, stacks of the size of 10 kWe can have reasonably low cell temperature variations (∼20 K) only by passing pre-heated liquid coolant through the coolant plates. Estimates show that the concomitant increase in the coolant flow rate induces large pressure drops, of the order of 30 bar, if a four-parallel serpentine is used on an active cell area of 30 cm × 30 cm. It is therefore necessary to use parallel channel flow fields with carefully designed feeder manifolds to maintain optimal cell temperatures and reasonably low coolant pressure drops in large stacks. Keywords: High temperature PEM fuel cells; Thermal management; Scale-up; Coolant circulation system; Pressure drop; Computational fluid dynamics
Transcript of Thermal management of high temperature polymer electrolyte membrane fuel cell stacks in the power...
1
Thermal management of high temperature polymer electrolyte membrane fuel cell
stacks in the power range of 1 to 10kWe
E. Harikishan Reddya, b,
,
Sreenivas Jayantia, ∗[email protected]
,
Dayadeep S. Monder b,
aDepartment of Chemical Engineering, IIT Madras, Chennai 600036, India
bDepartment of Chemical Engineering, IIT Hyderabad, Yeddumailaram 502205, India
CDepartment of Energy Science and Engineering, Indian Institute of Technology Bombay, Mumbai 400076, India
∗Corresponding author. Tel.: +91 44 22574168; fax: +91 44 22574152.
Originally published in Journal of Power Sources, Elsevier B.V.
http://dx.doi.org/10.1016/j.ijhydene.2014.09.132
Abstract
Maintaining optimal temperature of the stack is critical for efficient operation of high
temperature polymer electrolyte membrane fuel cells. While a number of possibilities of
thermal management exist for small stacks, the problem becomes more complicated for larger
stacks. In the present study, the thermal management of stacks in the power range of 1-
10 kWe is considered through computational fluid dynamics simulations. It is shown that
large stacks need to have dedicated cooling plates through which a coolant is circulated.
Further, stacks of the size of 10 kWe can have reasonably low cell temperature variations
(∼20 K) only by passing pre-heated liquid coolant through the coolant plates. Estimates show
that the concomitant increase in the coolant flow rate induces large pressure drops, of the
order of 30 bar, if a four-parallel serpentine is used on an active cell area of 30 cm × 30 cm. It
is therefore necessary to use parallel channel flow fields with carefully designed feeder
manifolds to maintain optimal cell temperatures and reasonably low coolant pressure drops in
large stacks.
Keywords: High temperature PEM fuel cells; Thermal management; Scale-up; Coolant
circulation system; Pressure drop; Computational fluid dynamics
2
Introduction
High temperature proton exchange membrane fuel cells (HT-PEMFCs) can be
operated up to a maximum temperature in the range of 180-200 °C, and thereby offer
advantages such as simplified water management due to the release of product water in
vapour form and high carbon monoxide (CO) tolerance, thereby allowing a wider choice of
fuels [1–4]. Due to their good dynamic response and high efficiency compared to internal
combustion engines, PEM fuel cells are well-suited to serve as power trains in vehicles such
as scooters and cars. Several aspects of HT-PEMFCs have been investigated in the past
couple of decades [5–16]. As a result, the principal features of HT-PEMFCs in terms of the
materials, processes and performance characteristics are well-understood at a cell level. A
recent review of advances in high temperature PEM fuel cells is given by Bose et al. [17].
One of the topics that has been receiving attention lately is the issue of thermal management
of HT-PEMFCs [18]. Currently available HT-PEM fuel cells offer lower current/power
densities than low temperature proton exchange membrane fuel cells (LT-PEMFCs) and
being able to maintain a uniformly high temperature in HT-PEMFC stacks is expected to
reduce this performance gap (see for example, [7,19]). A number of strategies are adopted for
thermal management of fuel cell stacks [20,21] and these have been critically reviewed
recently by Zhang and Kandlikar [22].
The cooling of the fuel cell stack can be achieved in a number of ways. These include
active cooling with air or liquid coolants, passive cooling with cooling fins and heat
spreaders, evaporative cooling and cooling with a separate air flow [22]. Passive cooling
methods have the limitation that they can be used only for very small stacks. Active cooling
methods, in which the coolant fluid is pumped through cooling passages within the stack, are
capable of greater heat removal from the stack and have received attention for cooling of LT-
PEMFCs [23–26]. Thermal management of PEMFC stacks requires two considerations,
namely, the initial heating up of the stack to the operating temperature and later maintaining
it at a constant operating temperature. Andreasen et al. [18] studied various cooling strategies
for an HT-PEMFC stack and concluded that the start-up time could be reduced by sending
pre-heated cathode air rather than using direct electrical heating. A number of stack thermal
management studies have been reported in the literature. These include the study of
Andreasen et al. [27] for an air-cooled HT-PEMFC stack designed for a hybrid electrical
vehicle; the studies of Scholta et al. [28,29] for a 5-cell, air/liquid cooled stack and a 10-cell
stack cooled using heat pipes; the study of Song et al. [30] for a natural circulation driven
water cooling system; and Kvesicetal and the work of Kvesic et al. [31,32] who developed a
multi-scale, three-dimensional model for a stack containing one coolant channel in each
bipolar plate. Kvesic et al. showed that with pre-heating of the reactants and coolant, the cell
3
temperature variation can be reduced to within the range of 3-6 K for a hydrogen-fed
stack [31] and to about 9 to 10 K for a stack fed with reformate gas [32]. This is in agreement
with the results of Scholta et al. [29] who reported a cell temperature variation of 56 K for an
inlet coolant temperature of 373 K. Modeling studies by the present authors of cooling of a
1 kWe stack by using cathode air [33] and a separate liquid coolant circuit [34] confirmed the
importance of coolant inlet temperature. The modeling results from the last study [34] are
broadly in agreement with the experimentally measured cell to cell variation of 6 to 8 K by
Supra et al. [14].
Most of the detailed studies reported hitherto have been performed for small stacks,
typically of 1 kWe or less. This is the power requirement of a scooter or a golf-
cart [35,36] and is far smaller than what is required for a motor car, where a fuel cell stack in
the range of 40 to 100 kWe [37] may be required. There is increasing interest in stacks of kW
range as evidenced by the recent studies of Jansen et al. [38] and Samsun et al. [4]. Samsun
et al. studied a 5 kWe HT-PEMFC stack designed as part of an auxiliary power unit using an
onboard reformer fueled by diesel and kerosene. The electrical power output from a stack can
be increased either by increasing the number of cells, or by increasing the active area of each
cell, or by using a modular construction of stacks of small size. Having a large number of
cells may demand more mechanical strength from the cell materials as significant
compression is required to ensure leak proofing. Also, the tie rods become longer and weight
of the other accessories increases. Increasing the active cell area poses thermal management
problems and uniform distribution of reactants may also become an appreciable problem.
One would envisage therefore a modular construction of stacks of reasonably small sizes. In
the present work, we consider issues related to the scaling up of a 1 kWe stack to about
10 kWe by using larger cells.
Some of the issues involved in the scale-up can be understood from the following
considerations. Increase in the stack size reduces the surface area (per unit volume) available
for heat transfer by an external air flow over the stack; the distance from the surface to the
core of the stack also increases. Our estimates of natural convective heat transfer show that,
due to these two factors, the fraction of total heat produced removed through the edges by
natural convection is reduced from 4.67% to 2.35% with an increase in active cell size from
10 × 10 cm (100 cm2) to 25 × 25 cm (625 cm
2). In the case of forced draft, an air velocity of
25 m/s (90 kmph) leads to a temperature difference of 50 K between the surface and the core
for a 10 × 10 cm cell. If the cell size is increased to 25 × 25 cm, the temperature difference
for the same air velocity increases to 120 K, i.e., parts of the cell along the outer edge will
operate at cell temperatures as low as 80 °C, which will be disastrous for a PBI-based
membrane. Therefore, operation of a HT-PEMFC stack with larger cells using forced draft
4
cooling alone is not feasible. A large stack needs to be cooled by passing a coolant through
the stack through specially-made passages. This brings in additional constraints of parasitic
power consumption for coolant circulation and the need for maintaining the coolant
temperature at optimal levels. Increase in the cell size from 10 × 10 cm to 20 × 20 cm
increases the total length of traverse of a single serpentine flow field by a factor of four and
may therefore quadruple the pressure drop for coolant circulation. The pressure drop for
coolant circulation also becomes important when cell temperature variations are to be kept as
low as possible, as will be shown later.
In the present work, we study these issues by evaluating the optimal conditions for
coolant circulation for 24-cell stacks of active cell areas of 10 × 10 cm, 20 × 20 cm and
30 × 30 cm, corresponding to a nominal stack power of 1, 4 and 9 kWe when the HT-PEMFC
operates at 0.5 V and 0.9 A/cm2 [32]. A stack model previously used for analysis of
integrated cathode air cooling [33] and external coolant circulation [34] is used to investigate
the pressure drop and cell temperature variations for the three cells with different cooling
strategies. Details of these studies and the results obtained are discussed below.
Description of the mathematical model
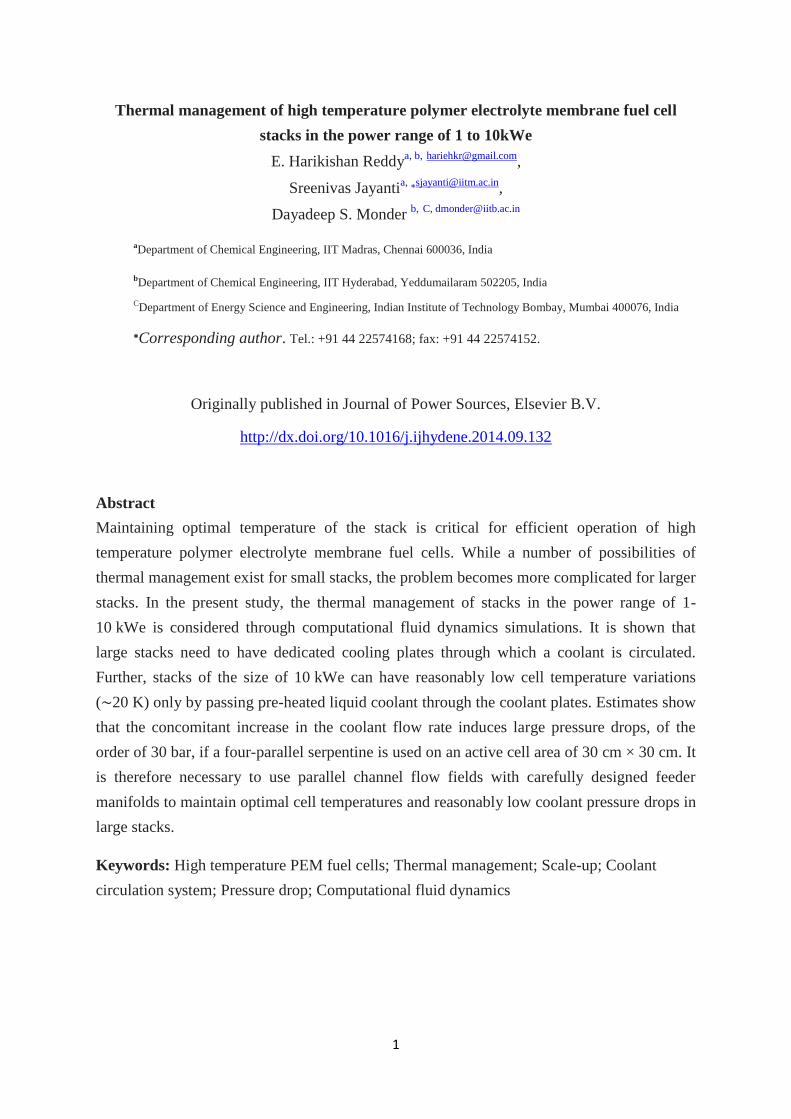
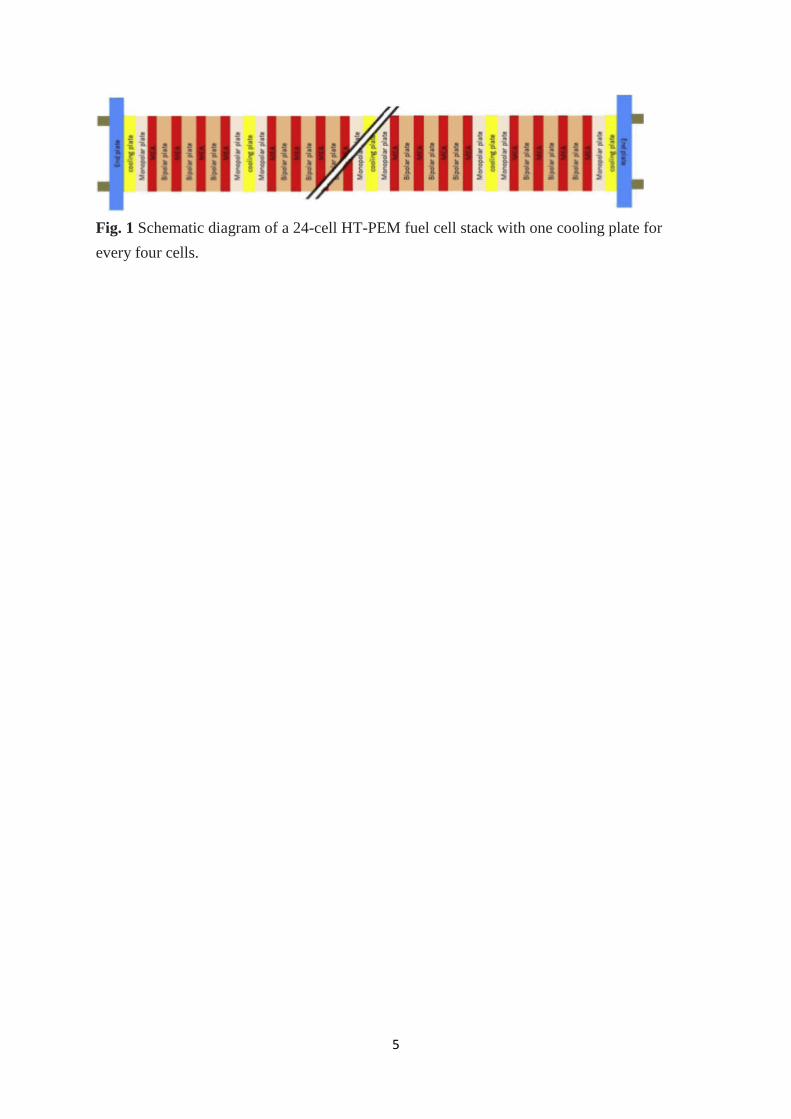
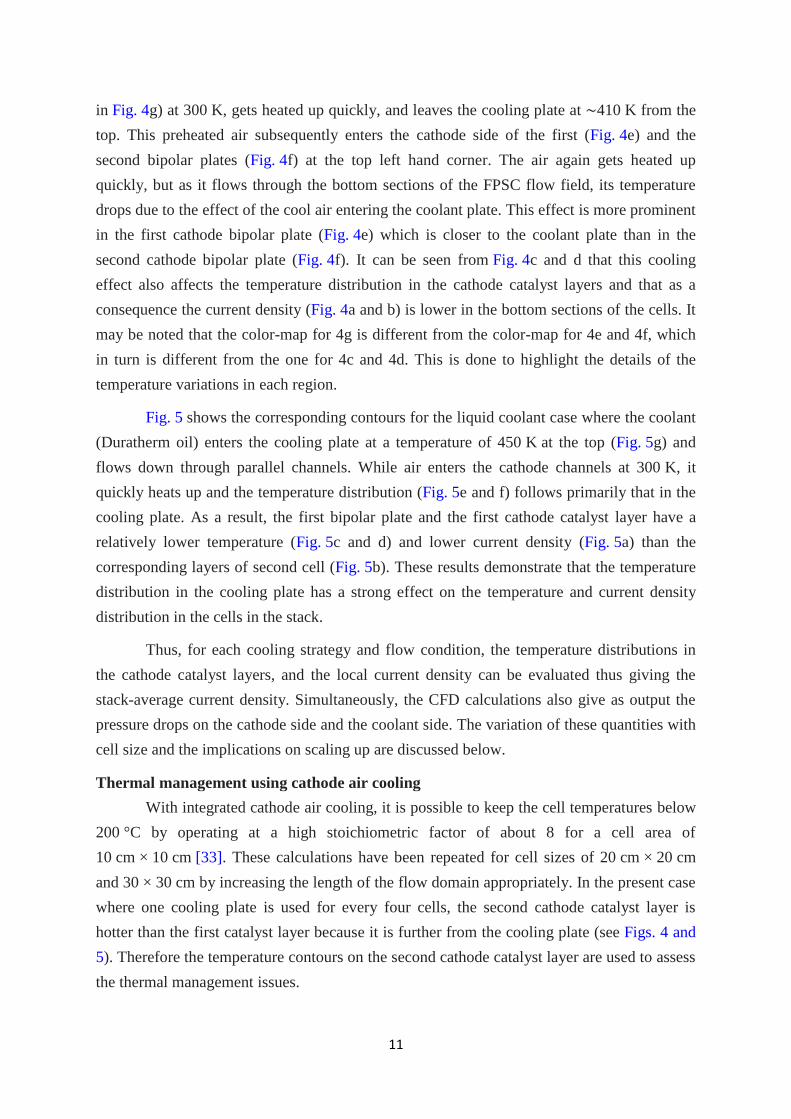
The mathematical model corresponds to a 24-cell stack, shown schematically
in Fig. 1, in which one coolant plate is provided for every four cells. Since the focus of the
present work is on thermal management and thus primarily on heat transfer, a simplified
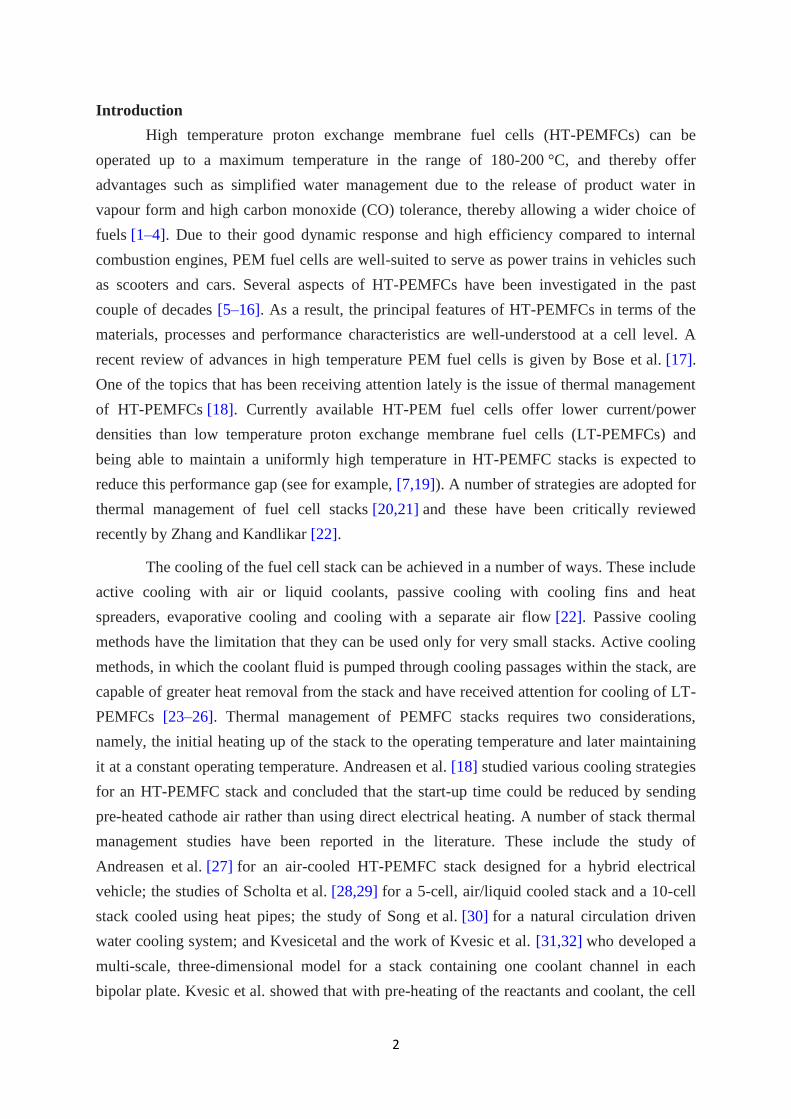
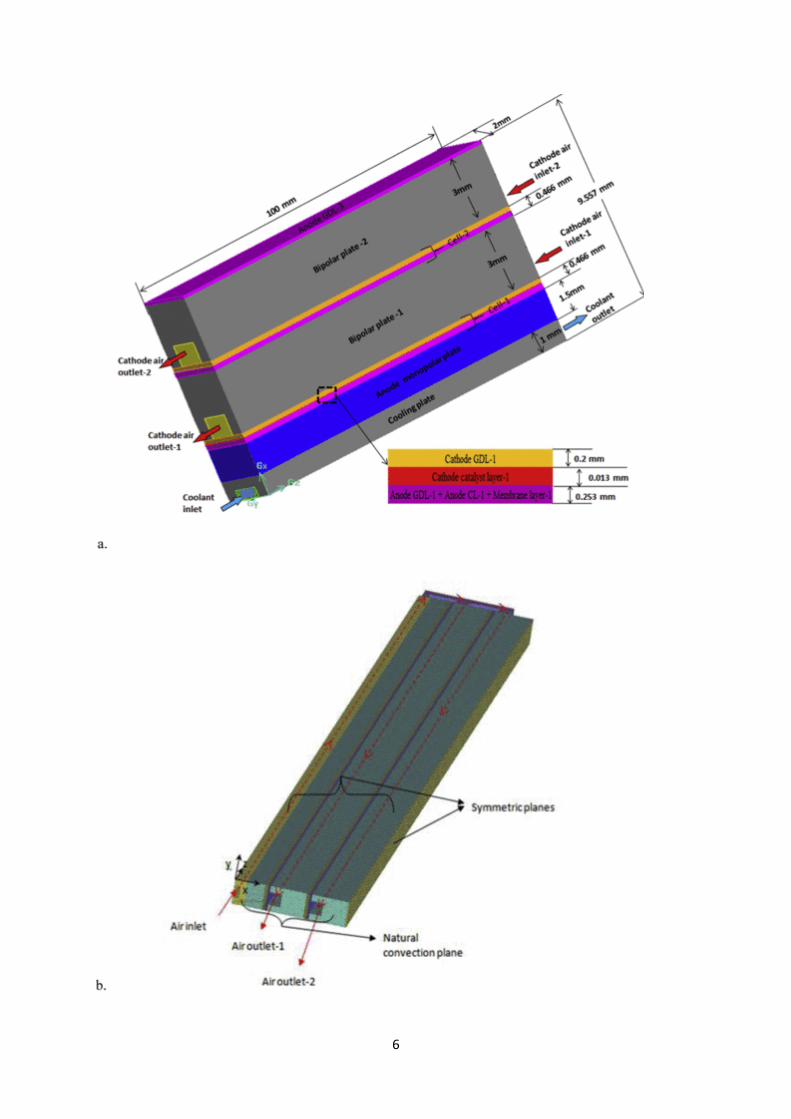
model of the cell is used. The resolved features of the stack include six regions (see Fig. 2a).
Starting from the bottom of the figure, these are: 1) the coolant plate, 2) the anode monopolar
plate, 3) a thin low conductivity region consisting of anode gas diffusion layer (GDL), the
anode catalyst layer, and the membrane, 4) the cathode catalyst layer where the entirety of the
cell's heat generation is assumed to occur, 5) the cathode side GDL, and 6) the bipolar plate.
The complete details of the air flow channels in the bipolar plate and the coolant flow
channels in the cooling plate are also included in the model geometry. It may be noted that in
this model, the anode side flow field is not resolved and its role in the overall heat transfer is
assumed to be negligible [34]. The model shown in Fig. 2 accounts for one half of the self-
repeating unit of sandwich of layers centered around a typical coolant plate shown in Fig. 1.
Accordingly, only one-half of the cooling plate is included in the computational domain. The
length and breadth of the computational domain change with the size of the active area of the
cell; however, the thicknesses of the various layers are assumed to be constant. The
dimensions of each feature in the repeating unit for a 10 cm × 10 cm cell are also given
in Fig. 2a. In all cases, the height of the air channels and the coolant channels is maintained
constant at 1 mm.
5
Fig. 1 Schematic diagram of a 24-cell HT-PEM fuel cell stack with one cooling plate for
every four cells.
6
7
Fig. 2 Schematic diagram of (a) the resolved features of the computational domain, and (b)
boundary conditions.
In this computational domain, the velocity and pressure fields in the cathode side of
the bipolar plate and the flow of the coolant in the coolant channels are resolved by solving
the Navier-Stokes equations using well-established techniques of computational fluid
dynamics (CFD). In each case, the flow is assumed to be incompressible, and the
corresponding material properties, such as density and viscosity, are specified. There is one
inlet and one outlet for both fluids. At the inlets the average normal velocity into the
computational domain is specified and at the outlets, the flow is assumed to be fully
developed. A no-slip boundary condition is used at the walls. The temperature field in all the
layers is obtained by solving the heat conduction equation with appropriate source and
boundary conditions. In the cathode catalyst layers, the following local volumetric heat
generation term, including both the reversible and irreversible terms [33,34], is added as a
heat source to the heat balance equation:
Q = (−ΔH/2F−Vcell) i
Here, Q is the heat released per unit volume, ΔH is the enthalpy of water formation in
the gaseous phase, F is Faraday's constant, Vcell is the electric potential at which the fuel cell
is operated and i is the local current density.
The local current density is a function of a number of electrochemical parameters
which cannot be resolved in a stack-level model. In view of this, the dependence of the
current density on the local temperature of the cell and the operating potential is captured
using the following correlations [33] using the empirical data of Korsgaard et al. [7]:
at Vcell = 0.5 V
at Vcell = 0.6 V
where T is in K and i is in A/cm2.
Within the stack, the heat conduction in the solid layers is solved as a conjugate
problem with the convective flow of cathode air and/or coolant (as appropriate) assuming no
contact resistances at the interfaces of the various layers. The boundary conditions for the
heat transfer problem consist of specified inlet temperature at the inlet to the domain; the
fully developed flow boundary condition at the outlets; and a constant natural convective heat
transfer coefficient of 9 W/m2 K at all exposed walls with an ambient temperature of
300 K [34].
All the simulations have been done using the commercial CFD code ANSYS-
FLUENT. Second order accuracy was maintained in the discretization of the governing
8
equations. Hexahedral grid elements were used to discretize the domain. An optimal grid
density, previously established by comparing with analytical and experimental results from
the literature [34], has been used in the present study. Therefore, the number of grid elements
increased with increasing domain size; the total number of cells was in the range of 0.8 to 4
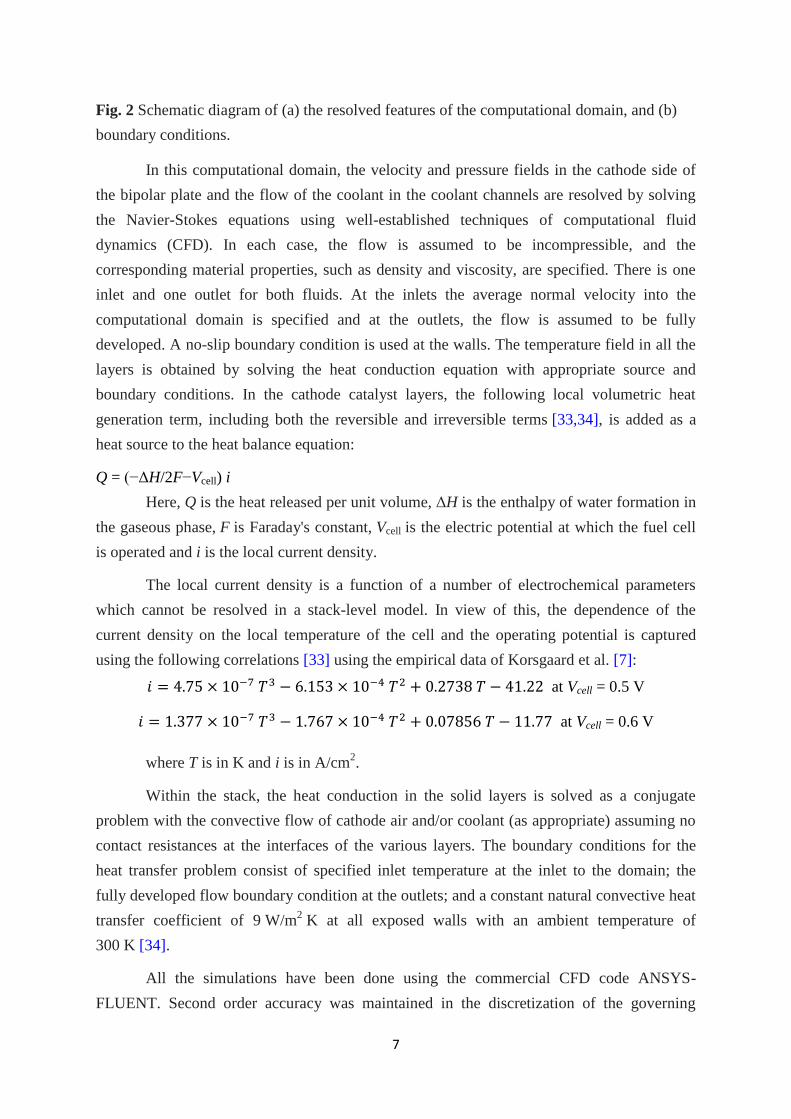
million. Based on previous studies [33,34,39], a four-parallel serpentine field was used for
the cathode side. For the coolant flow, three flow fields, namely, parallel, wide-parallel and
four-parallel serpentine flow fields have been used; these are shown schematically in Fig. 3.
A number of calculations, covering a range of air and coolant flow rates, inlet temperatures,
and geometrical dimensions of the cell, have been performed using the above computational
model. In each case, for a given cooling strategy, geometry, cell stoichiometry and inlet fluid
temperatures, the coolant flow rates were adjusted until the maximum temperature in the
model geometry reached 473 K. This would then constitute the thermal management strategy
for maintaining the given stack at as high a temperature as possible.
Fig. 3 Schematic diagram of the three flow fields used on the cooling plates.
Results and discussion
This work presents results for simulations of two approaches to stack cooling: 1)
integrated air cooling, and 2) a liquid coolant circuit. Both approaches use the geometry given
in Fig. 2. In the first approach, the air to be fed to the fuel cell stack is circulated through the
coolant channels and thus preheated before it is supplied to the fuel cell cathodes through the
air channels (see Fig. 2a). In the second approach, a liquid coolant is circulated through
9
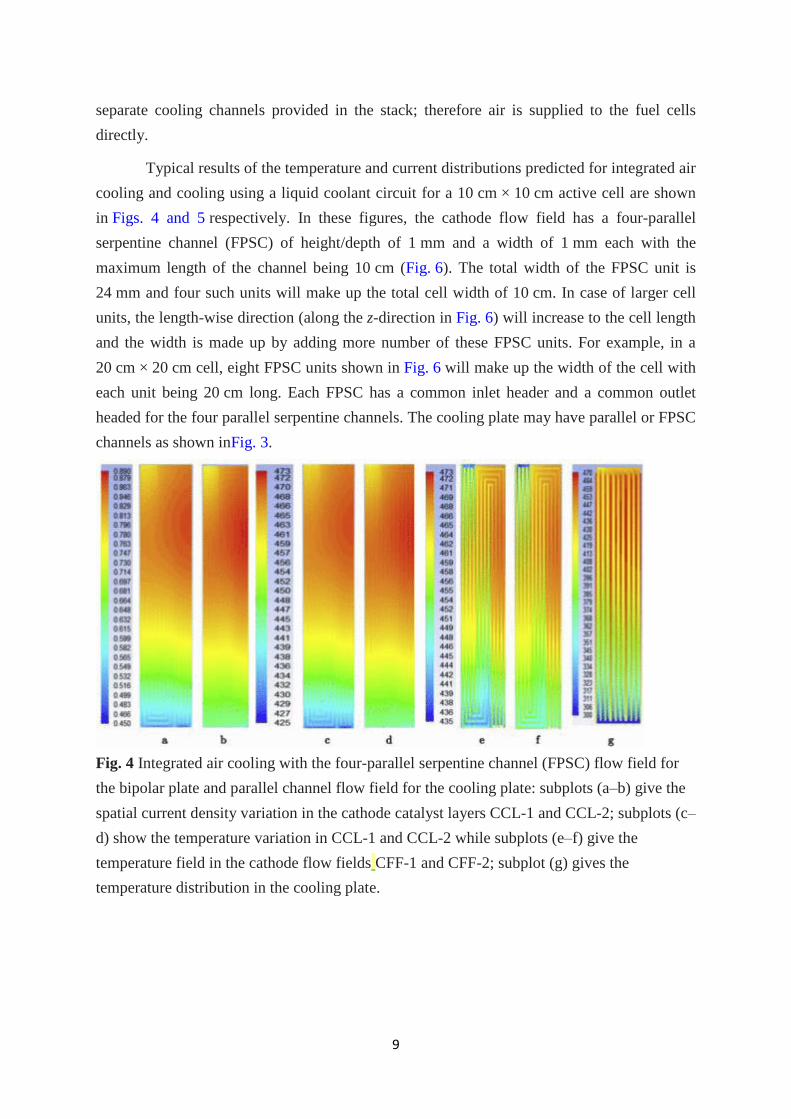
separate cooling channels provided in the stack; therefore air is supplied to the fuel cells
directly.
Typical results of the temperature and current distributions predicted for integrated air
cooling and cooling using a liquid coolant circuit for a 10 cm × 10 cm active cell are shown
in Figs. 4 and 5 respectively. In these figures, the cathode flow field has a four-parallel
serpentine channel (FPSC) of height/depth of 1 mm and a width of 1 mm each with the
maximum length of the channel being 10 cm (Fig. 6). The total width of the FPSC unit is
24 mm and four such units will make up the total cell width of 10 cm. In case of larger cell
units, the length-wise direction (along the z-direction in Fig. 6) will increase to the cell length
and the width is made up by adding more number of these FPSC units. For example, in a
20 cm × 20 cm cell, eight FPSC units shown in Fig. 6 will make up the width of the cell with
each unit being 20 cm long. Each FPSC has a common inlet header and a common outlet
headed for the four parallel serpentine channels. The cooling plate may have parallel or FPSC
channels as shown inFig. 3.
Fig. 4 Integrated air cooling with the four-parallel serpentine channel (FPSC) flow field for
the bipolar plate and parallel channel flow field for the cooling plate: subplots (a–b) give the
spatial current density variation in the cathode catalyst layers CCL-1 and CCL-2; subplots (c–
d) show the temperature variation in CCL-1 and CCL-2 while subplots (e–f) give the
temperature field in the cathode flow fields CFF-1 and CFF-2; subplot (g) gives the
temperature distribution in the cooling plate.
10
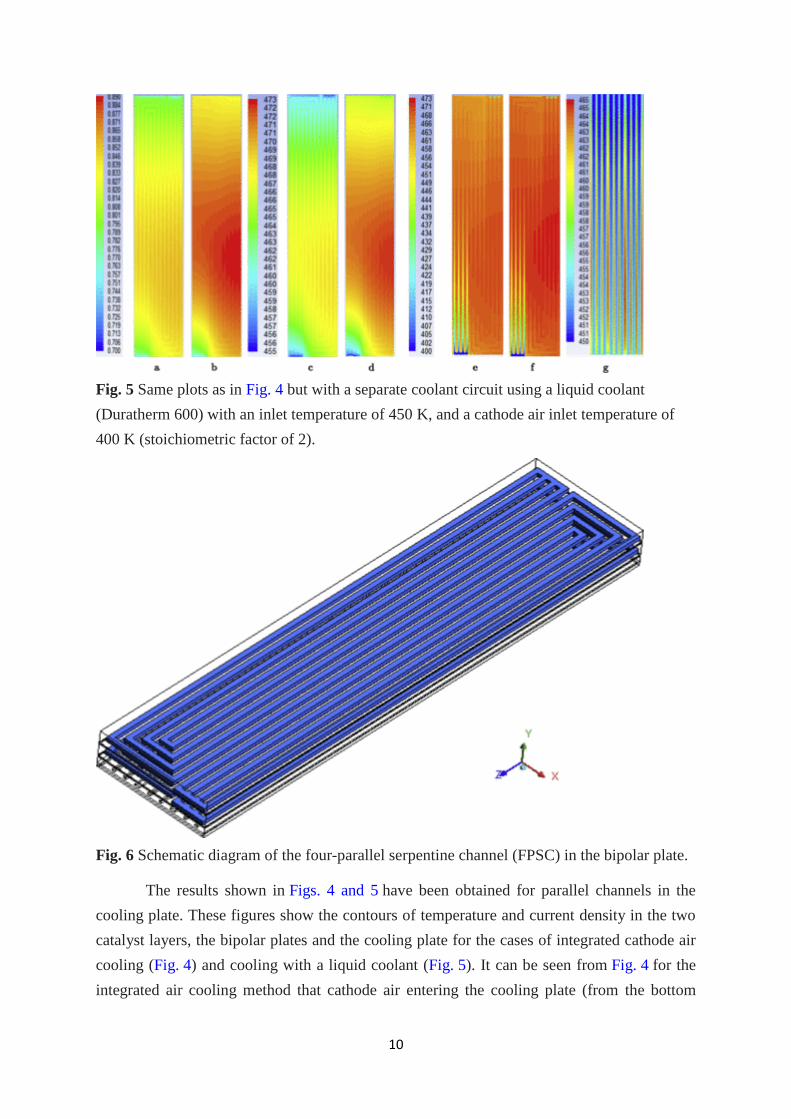
Fig. 5 Same plots as in Fig. 4 but with a separate coolant circuit using a liquid coolant
(Duratherm 600) with an inlet temperature of 450 K, and a cathode air inlet temperature of
400 K (stoichiometric factor of 2).
Fig. 6 Schematic diagram of the four-parallel serpentine channel (FPSC) in the bipolar plate.
The results shown in Figs. 4 and 5 have been obtained for parallel channels in the
cooling plate. These figures show the contours of temperature and current density in the two
catalyst layers, the bipolar plates and the cooling plate for the cases of integrated cathode air
cooling (Fig. 4) and cooling with a liquid coolant (Fig. 5). It can be seen from Fig. 4 for the
integrated air cooling method that cathode air entering the cooling plate (from the bottom
11
in Fig. 4g) at 300 K, gets heated up quickly, and leaves the cooling plate at ∼410 K from the
top. This preheated air subsequently enters the cathode side of the first (Fig. 4e) and the
second bipolar plates (Fig. 4f) at the top left hand corner. The air again gets heated up
quickly, but as it flows through the bottom sections of the FPSC flow field, its temperature
drops due to the effect of the cool air entering the coolant plate. This effect is more prominent
in the first cathode bipolar plate (Fig. 4e) which is closer to the coolant plate than in the
second cathode bipolar plate (Fig. 4f). It can be seen from Fig. 4c and d that this cooling
effect also affects the temperature distribution in the cathode catalyst layers and that as a
consequence the current density (Fig. 4a and b) is lower in the bottom sections of the cells. It
may be noted that the color-map for 4g is different from the color-map for 4e and 4f, which
in turn is different from the one for 4c and 4d. This is done to highlight the details of the
temperature variations in each region.
Fig. 5 shows the corresponding contours for the liquid coolant case where the coolant
(Duratherm oil) enters the cooling plate at a temperature of 450 K at the top (Fig. 5g) and
flows down through parallel channels. While air enters the cathode channels at 300 K, it
quickly heats up and the temperature distribution (Fig. 5e and f) follows primarily that in the
cooling plate. As a result, the first bipolar plate and the first cathode catalyst layer have a
relatively lower temperature (Fig. 5c and d) and lower current density (Fig. 5a) than the
corresponding layers of second cell (Fig. 5b). These results demonstrate that the temperature
distribution in the cooling plate has a strong effect on the temperature and current density
distribution in the cells in the stack.
Thus, for each cooling strategy and flow condition, the temperature distributions in
the cathode catalyst layers, and the local current density can be evaluated thus giving the
stack-average current density. Simultaneously, the CFD calculations also give as output the
pressure drops on the cathode side and the coolant side. The variation of these quantities with
cell size and the implications on scaling up are discussed below.
Thermal management using cathode air cooling
With integrated cathode air cooling, it is possible to keep the cell temperatures below
200 °C by operating at a high stoichiometric factor of about 8 for a cell area of
10 cm × 10 cm [33]. These calculations have been repeated for cell sizes of 20 cm × 20 cm
and 30 × 30 cm by increasing the length of the flow domain appropriately. In the present case
where one cooling plate is used for every four cells, the second cathode catalyst layer is
hotter than the first catalyst layer because it is further from the cooling plate (see Figs. 4 and
5). Therefore the temperature contours on the second cathode catalyst layer are used to assess
the thermal management issues.
12
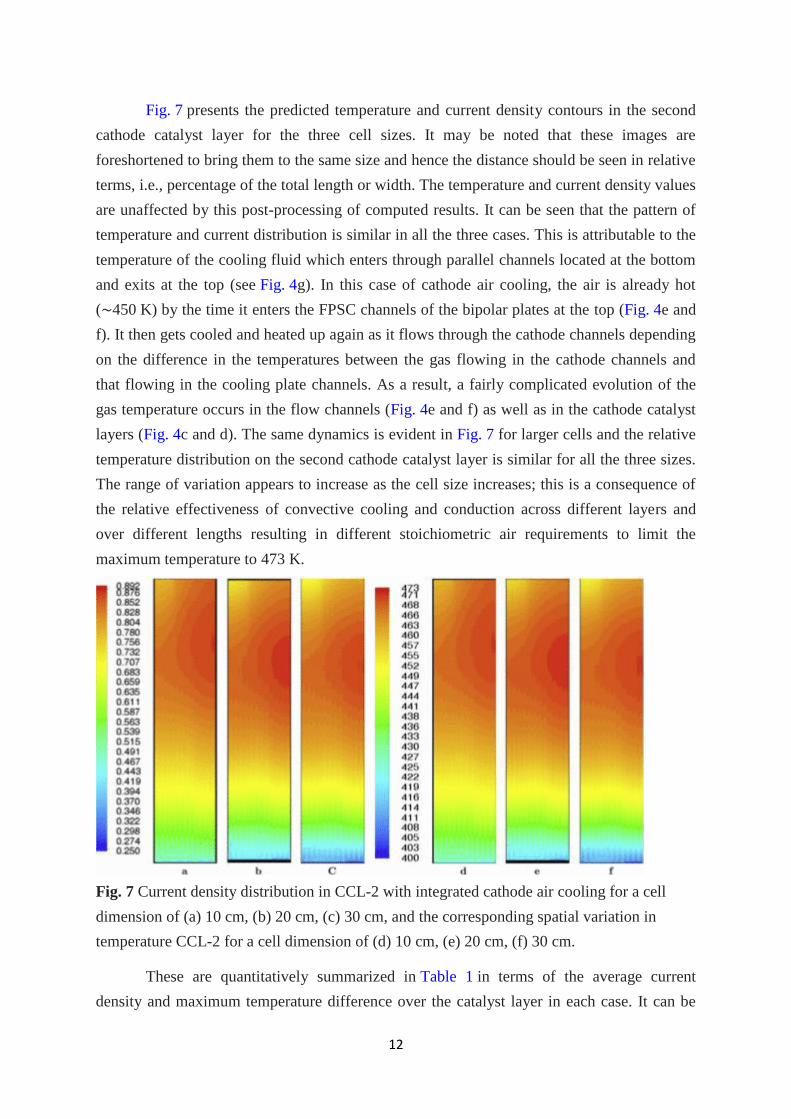
Fig. 7 presents the predicted temperature and current density contours in the second
cathode catalyst layer for the three cell sizes. It may be noted that these images are
foreshortened to bring them to the same size and hence the distance should be seen in relative
terms, i.e., percentage of the total length or width. The temperature and current density values
are unaffected by this post-processing of computed results. It can be seen that the pattern of
temperature and current distribution is similar in all the three cases. This is attributable to the
temperature of the cooling fluid which enters through parallel channels located at the bottom
and exits at the top (see Fig. 4g). In this case of cathode air cooling, the air is already hot
(∼450 K) by the time it enters the FPSC channels of the bipolar plates at the top (Fig. 4e and
f). It then gets cooled and heated up again as it flows through the cathode channels depending
on the difference in the temperatures between the gas flowing in the cathode channels and
that flowing in the cooling plate channels. As a result, a fairly complicated evolution of the
gas temperature occurs in the flow channels (Fig. 4e and f) as well as in the cathode catalyst
layers (Fig. 4c and d). The same dynamics is evident in Fig. 7 for larger cells and the relative
temperature distribution on the second cathode catalyst layer is similar for all the three sizes.
The range of variation appears to increase as the cell size increases; this is a consequence of
the relative effectiveness of convective cooling and conduction across different layers and
over different lengths resulting in different stoichiometric air requirements to limit the
maximum temperature to 473 K.
Fig. 7 Current density distribution in CCL-2 with integrated cathode air cooling for a cell
dimension of (a) 10 cm, (b) 20 cm, (c) 30 cm, and the corresponding spatial variation in
temperature CCL-2 for a cell dimension of (d) 10 cm, (e) 20 cm, (f) 30 cm.
These are quantitatively summarized in Table 1 in terms of the average current
density and maximum temperature difference over the catalyst layer in each case. It can be
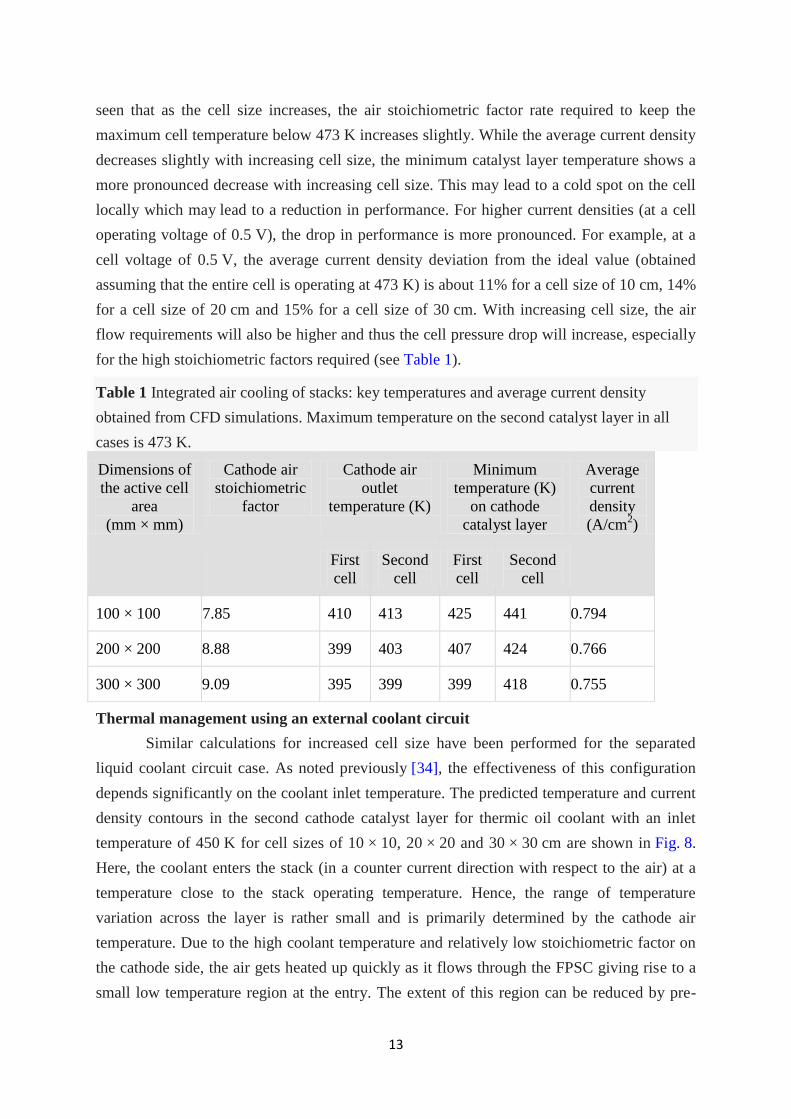
13
seen that as the cell size increases, the air stoichiometric factor rate required to keep the
maximum cell temperature below 473 K increases slightly. While the average current density
decreases slightly with increasing cell size, the minimum catalyst layer temperature shows a
more pronounced decrease with increasing cell size. This may lead to a cold spot on the cell
locally which may lead to a reduction in performance. For higher current densities (at a cell
operating voltage of 0.5 V), the drop in performance is more pronounced. For example, at a
cell voltage of 0.5 V, the average current density deviation from the ideal value (obtained
assuming that the entire cell is operating at 473 K) is about 11% for a cell size of 10 cm, 14%
for a cell size of 20 cm and 15% for a cell size of 30 cm. With increasing cell size, the air
flow requirements will also be higher and thus the cell pressure drop will increase, especially
for the high stoichiometric factors required (see Table 1).
Table 1 Integrated air cooling of stacks: key temperatures and average current density
obtained from CFD simulations. Maximum temperature on the second catalyst layer in all
cases is 473 K.
Dimensions of
the active cell
area
(mm × mm)
Cathode air
stoichiometric
factor
Cathode air
outlet
temperature (K)
Minimum
temperature (K)
on cathode
catalyst layer
Average
current
density
(A/cm2)
First
cell
Second
cell
First
cell
Second
cell
100 × 100 7.85 410 413 425 441 0.794
200 × 200 8.88 399 403 407 424 0.766
300 × 300 9.09 395 399 399 418 0.755
Thermal management using an external coolant circuit
Similar calculations for increased cell size have been performed for the separated
liquid coolant circuit case. As noted previously [34], the effectiveness of this configuration
depends significantly on the coolant inlet temperature. The predicted temperature and current
density contours in the second cathode catalyst layer for thermic oil coolant with an inlet
temperature of 450 K for cell sizes of 10 × 10, 20 × 20 and 30 × 30 cm are shown in Fig. 8.
Here, the coolant enters the stack (in a counter current direction with respect to the air) at a
temperature close to the stack operating temperature. Hence, the range of temperature
variation across the layer is rather small and is primarily determined by the cathode air
temperature. Due to the high coolant temperature and relatively low stoichiometric factor on
the cathode side, the air gets heated up quickly as it flows through the FPSC giving rise to a
small low temperature region at the entry. The extent of this region can be reduced by pre-
14
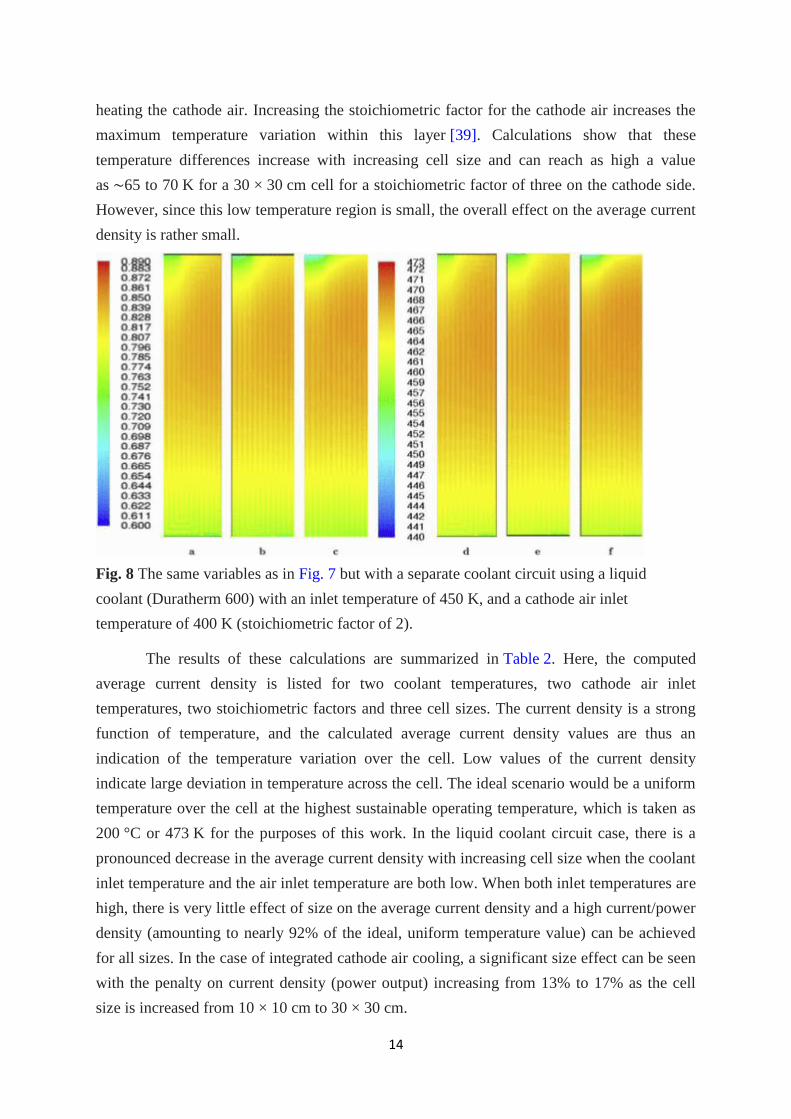
heating the cathode air. Increasing the stoichiometric factor for the cathode air increases the
maximum temperature variation within this layer [39]. Calculations show that these
temperature differences increase with increasing cell size and can reach as high a value
as ∼65 to 70 K for a 30 × 30 cm cell for a stoichiometric factor of three on the cathode side.
However, since this low temperature region is small, the overall effect on the average current
density is rather small.
Fig. 8 The same variables as in Fig. 7 but with a separate coolant circuit using a liquid
coolant (Duratherm 600) with an inlet temperature of 450 K, and a cathode air inlet
temperature of 400 K (stoichiometric factor of 2).
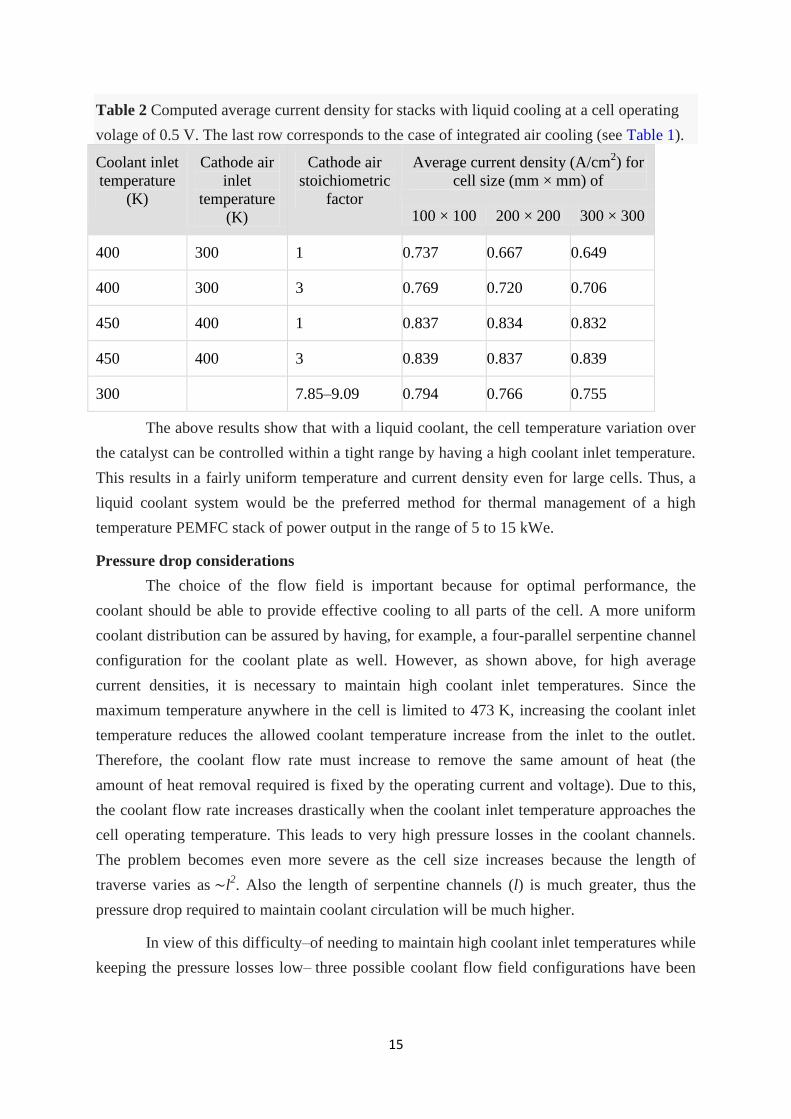
The results of these calculations are summarized in Table 2. Here, the computed
average current density is listed for two coolant temperatures, two cathode air inlet
temperatures, two stoichiometric factors and three cell sizes. The current density is a strong
function of temperature, and the calculated average current density values are thus an
indication of the temperature variation over the cell. Low values of the current density
indicate large deviation in temperature across the cell. The ideal scenario would be a uniform
temperature over the cell at the highest sustainable operating temperature, which is taken as
200 °C or 473 K for the purposes of this work. In the liquid coolant circuit case, there is a
pronounced decrease in the average current density with increasing cell size when the coolant
inlet temperature and the air inlet temperature are both low. When both inlet temperatures are
high, there is very little effect of size on the average current density and a high current/power
density (amounting to nearly 92% of the ideal, uniform temperature value) can be achieved
for all sizes. In the case of integrated cathode air cooling, a significant size effect can be seen
with the penalty on current density (power output) increasing from 13% to 17% as the cell
size is increased from 10 × 10 cm to 30 × 30 cm.
15
Table 2 Computed average current density for stacks with liquid cooling at a cell operating
volage of 0.5 V. The last row corresponds to the case of integrated air cooling (see Table 1).
Coolant inlet
temperature
(K)
Cathode air
inlet
temperature
(K)
Cathode air
stoichiometric
factor
Average current density (A/cm2) for
cell size (mm × mm) of
100 × 100 200 × 200 300 × 300
400 300 1 0.737 0.667 0.649
400 300 3 0.769 0.720 0.706
450 400 1 0.837 0.834 0.832
450 400 3 0.839 0.837 0.839
300 7.85–9.09 0.794 0.766 0.755
The above results show that with a liquid coolant, the cell temperature variation over
the catalyst can be controlled within a tight range by having a high coolant inlet temperature.
This results in a fairly uniform temperature and current density even for large cells. Thus, a
liquid coolant system would be the preferred method for thermal management of a high
temperature PEMFC stack of power output in the range of 5 to 15 kWe.
Pressure drop considerations
The choice of the flow field is important because for optimal performance, the
coolant should be able to provide effective cooling to all parts of the cell. A more uniform
coolant distribution can be assured by having, for example, a four-parallel serpentine channel
configuration for the coolant plate as well. However, as shown above, for high average
current densities, it is necessary to maintain high coolant inlet temperatures. Since the
maximum temperature anywhere in the cell is limited to 473 K, increasing the coolant inlet
temperature reduces the allowed coolant temperature increase from the inlet to the outlet.
Therefore, the coolant flow rate must increase to remove the same amount of heat (the
amount of heat removal required is fixed by the operating current and voltage). Due to this,
the coolant flow rate increases drastically when the coolant inlet temperature approaches the
cell operating temperature. This leads to very high pressure losses in the coolant channels.
The problem becomes even more severe as the cell size increases because the length of
traverse varies as ∼l2. Also the length of serpentine channels (l) is much greater, thus the
pressure drop required to maintain coolant circulation will be much higher.
In view of this difficulty–of needing to maintain high coolant inlet temperatures while
keeping the pressure losses low– three possible coolant flow field configurations have been
16
considered in the present study. These are schematically shown in Fig. 3 and can be described
as follows:
•
A parallel flow field with a channel width of 1 mm and a land width also of 1 mm.
•
A parallel flow field with a channel width of 2 mm and a land width of 0.5 mm with
the land width being 1 mm for every third channel.
•
A four-parallel serpentine channel with channel and land widths of 1 mm each.
While the first and the third flow fields require no further elaboration, the second one
is designed to reduce the pressure drop by increasing the width of the flow channels.
However, the rib width decreases as the flow channel width is increased, and this can lead to
buckling of the interconnect/flow-plate. Another factor to keep in mind is that the effective
resistance of the interconnect will increase as the rib width decreases. Thus one cannot
increase the ratio of flow channel width to rib width indefinitely, and the larger land area for
every third channel provides additional mechanical support as well as additional area for
current collection required for the second design above. One could perform a detailed
structural analysis to come up with an ‘optimal’ ratio of flow channel width to rib width but
this is beyond the scope of the current study. Increasing the channel width also reduces the
number of parallel channels for a given cell face area and thus reduces the flow
maldistribution problem associated with parallel flow channels [40].
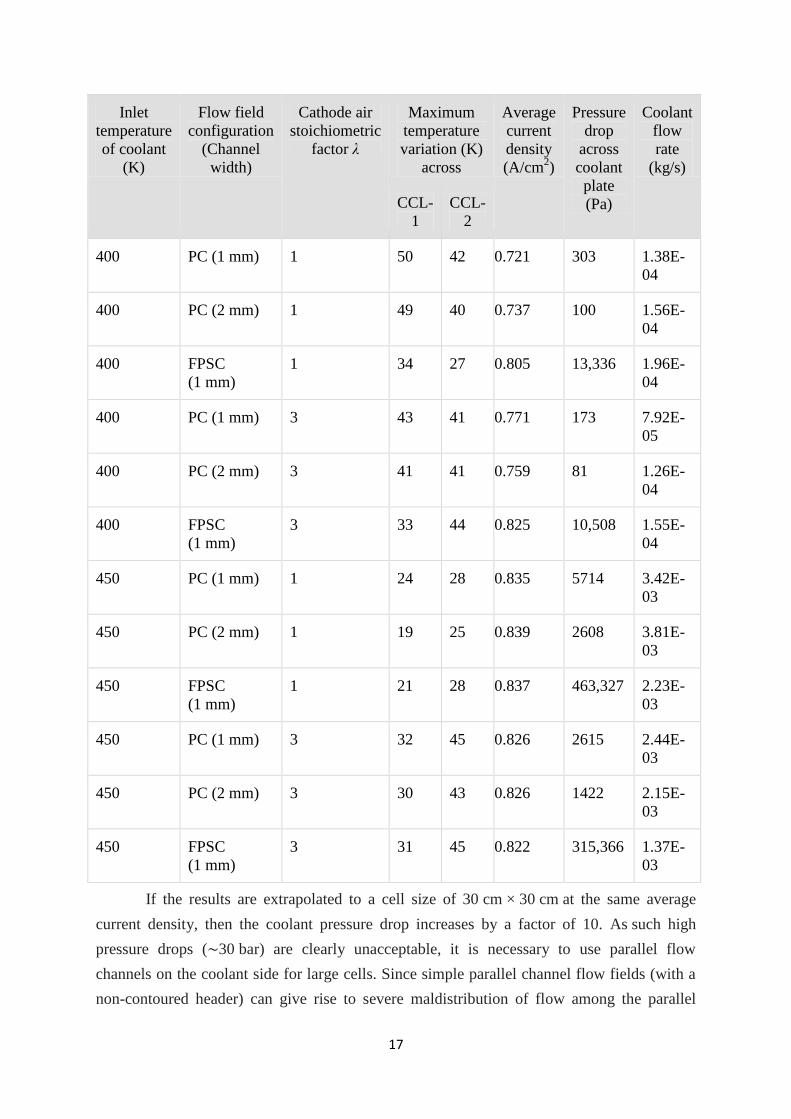
Flow and temperature calculations have been done for different coolant plate
configurations for a cell size of 10 cm × 10 cm. The results are summarized in Table 3 where
the pressure drop, the coolant flow, maximum ΔT (across the volume of one cell), and
average current density are given for each case. It can be seen that while the thermal and
electrical efficiency of the cell improves with increasing coolant inlet temperature, the
coolant flow rate requirement increases by an order of magnitude when the coolant inlet
temperature is increased from 400 K to 450 K (for a maximum cell temperature of 473 K)
leading to a more than 20-fold increase in the pressure drop across the cell. The pressure drop
with the FPSC flow field for the cooling plate is nearly 50 times higher and is of the order of
3 bar. The effect of cooling duty can also be seen in the fact that the pressure drop decreases
by about 30% when the cathode air stoichiometric factor is increased from 1 to 3, which
lowers the cooling requirement from the liquid coolant circuit.
Table 3 Comparison of different flow field configurations in the cooling plate: PC = parallel
channel; FPSC = four parallel channel; CCL = cathode catalyst layer.
17
Inlet
temperature
of coolant
(K)
Flow field
configuration
(Channel
width)
Cathode air
stoichiometric
factor λ
Maximum
temperature
variation (K)
across
Average
current
density
(A/cm2)
Pressure
drop
across
coolant
plate
(Pa)
Coolant
flow
rate
(kg/s)
CCL-
1
CCL-
2
400 PC (1 mm) 1 50 42 0.721 303 1.38E-
04
400 PC (2 mm) 1 49 40 0.737 100 1.56E-
04
400 FPSC
(1 mm)
1 34 27 0.805 13,336 1.96E-
04
400 PC (1 mm) 3 43 41 0.771 173 7.92E-
05
400 PC (2 mm) 3 41 41 0.759 81 1.26E-
04
400 FPSC
(1 mm)
3 33 44 0.825 10,508 1.55E-
04
450 PC (1 mm) 1 24 28 0.835 5714 3.42E-
03
450 PC (2 mm) 1 19 25 0.839 2608 3.81E-
03
450 FPSC
(1 mm)
1 21 28 0.837 463,327 2.23E-
03
450 PC (1 mm) 3 32 45 0.826 2615 2.44E-
03
450 PC (2 mm) 3 30 43 0.826 1422 2.15E-
03
450 FPSC
(1 mm)
3 31 45 0.822 315,366 1.37E-
03
If the results are extrapolated to a cell size of 30 cm × 30 cm at the same average
current density, then the coolant pressure drop increases by a factor of 10. As such high
pressure drops (∼30 bar) are clearly unacceptable, it is necessary to use parallel flow
channels on the coolant side for large cells. Since simple parallel channel flow fields (with a
non-contoured header) can give rise to severe maldistribution of flow among the parallel
18
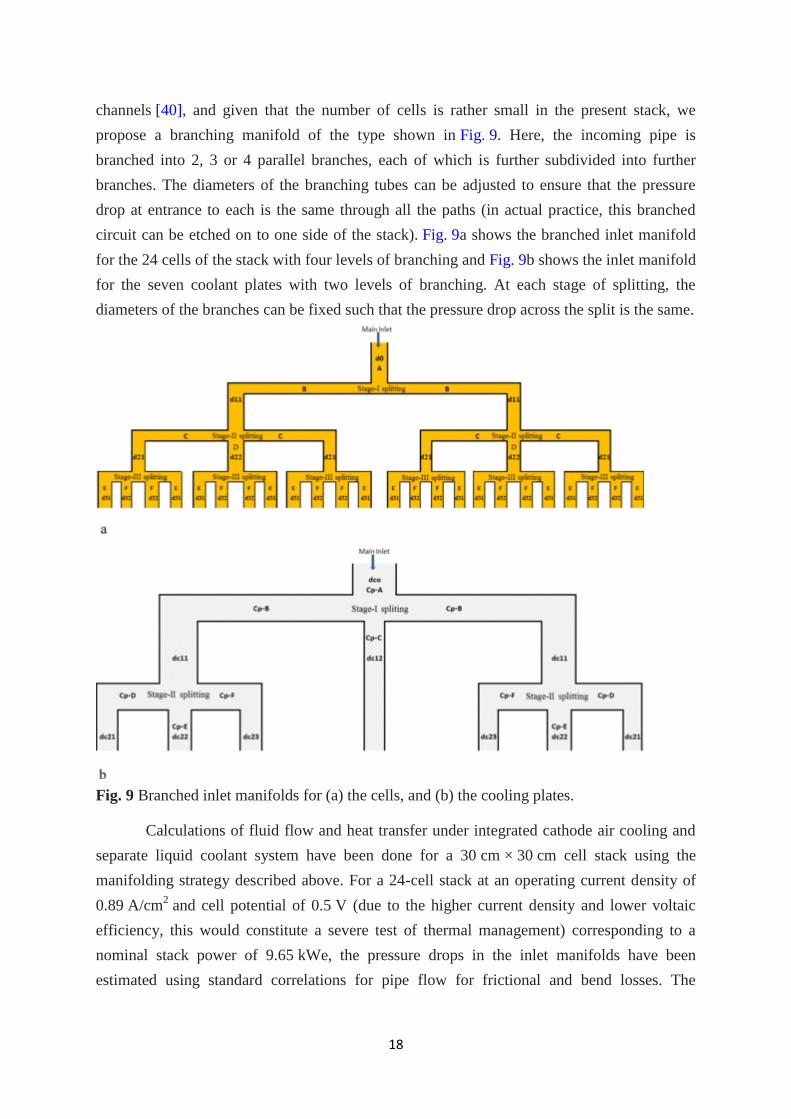
channels [40], and given that the number of cells is rather small in the present stack, we
propose a branching manifold of the type shown in Fig. 9. Here, the incoming pipe is
branched into 2, 3 or 4 parallel branches, each of which is further subdivided into further
branches. The diameters of the branching tubes can be adjusted to ensure that the pressure
drop at entrance to each is the same through all the paths (in actual practice, this branched
circuit can be etched on to one side of the stack). Fig. 9a shows the branched inlet manifold
for the 24 cells of the stack with four levels of branching and Fig. 9b shows the inlet manifold
for the seven coolant plates with two levels of branching. At each stage of splitting, the
diameters of the branches can be fixed such that the pressure drop across the split is the same.
Fig. 9 Branched inlet manifolds for (a) the cells, and (b) the cooling plates.
Calculations of fluid flow and heat transfer under integrated cathode air cooling and
separate liquid coolant system have been done for a 30 cm × 30 cm cell stack using the
manifolding strategy described above. For a 24-cell stack at an operating current density of
0.89 A/cm2 and cell potential of 0.5 V (due to the higher current density and lower voltaic
efficiency, this would constitute a severe test of thermal management) corresponding to a
nominal stack power of 9.65 kWe, the pressure drops in the inlet manifolds have been
estimated using standard correlations for pipe flow for frictional and bend losses. The
19
pressure drops in the flow fields (FPSC for cathode flow field and parallel flow fields for
coolant channels) have been calculated as part of the CFD simulations.
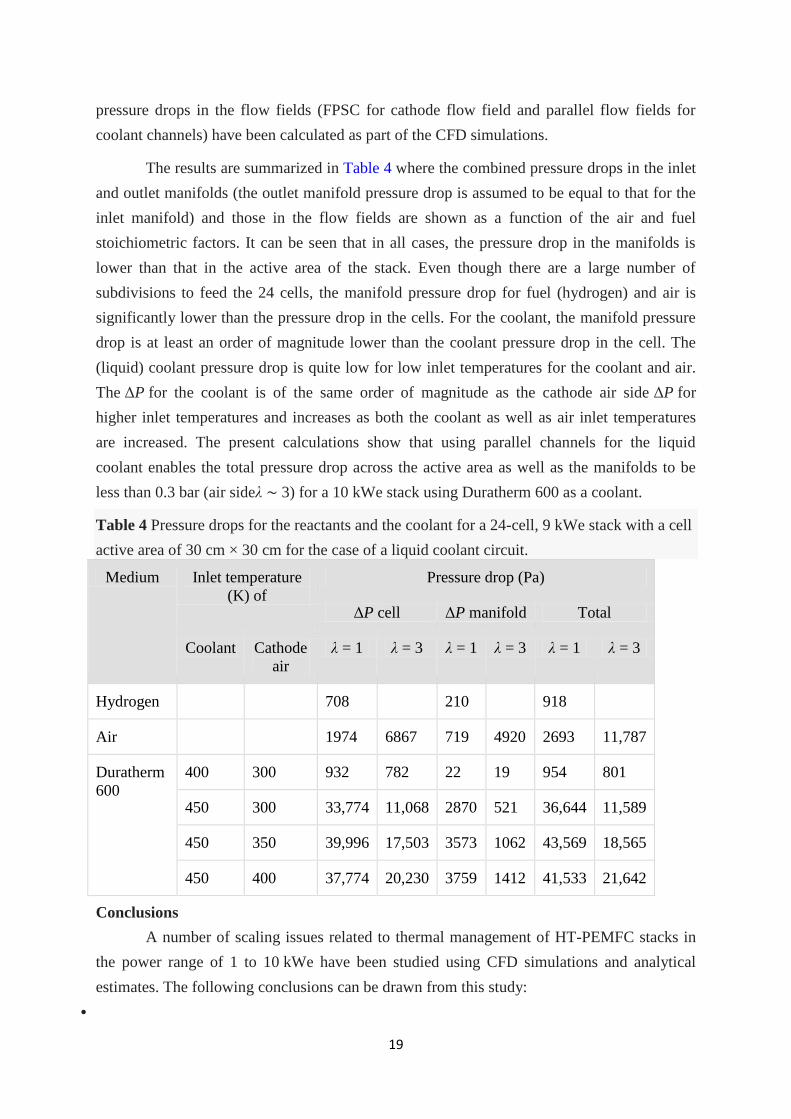
The results are summarized in Table 4 where the combined pressure drops in the inlet
and outlet manifolds (the outlet manifold pressure drop is assumed to be equal to that for the
inlet manifold) and those in the flow fields are shown as a function of the air and fuel
stoichiometric factors. It can be seen that in all cases, the pressure drop in the manifolds is
lower than that in the active area of the stack. Even though there are a large number of
subdivisions to feed the 24 cells, the manifold pressure drop for fuel (hydrogen) and air is
significantly lower than the pressure drop in the cells. For the coolant, the manifold pressure
drop is at least an order of magnitude lower than the coolant pressure drop in the cell. The
(liquid) coolant pressure drop is quite low for low inlet temperatures for the coolant and air.
The ΔP for the coolant is of the same order of magnitude as the cathode air side ΔP for
higher inlet temperatures and increases as both the coolant as well as air inlet temperatures
are increased. The present calculations show that using parallel channels for the liquid
coolant enables the total pressure drop across the active area as well as the manifolds to be
less than 0.3 bar (air sideλ ∼ 3) for a 10 kWe stack using Duratherm 600 as a coolant.
Table 4 Pressure drops for the reactants and the coolant for a 24-cell, 9 kWe stack with a cell
active area of 30 cm × 30 cm for the case of a liquid coolant circuit.
Medium Inlet temperature
(K) of
Pressure drop (Pa)
ΔP cell ΔP manifold Total
Coolant Cathode
air
λ = 1 λ = 3 λ = 1 λ = 3 λ = 1 λ = 3
Hydrogen 708 210 918
Air 1974 6867 719 4920 2693 11,787
Duratherm
600
400 300 932 782 22 19 954 801
450 300 33,774 11,068 2870 521 36,644 11,589
450 350 39,996 17,503 3573 1062 43,569 18,565
450 400 37,774 20,230 3759 1412 41,533 21,642
Conclusions
A number of scaling issues related to thermal management of HT-PEMFC stacks in
the power range of 1 to 10 kWe have been studied using CFD simulations and analytical
estimates. The following conclusions can be drawn from this study:
•
20
For stacks much larger than 1 kWe, cooling of the stack by convection drawing air
over the external surface of the stack can lead to unacceptable temperature variations within
the stack. Thus cooling must be done using dedicated plates through which a coolant is
circulated.
•
For stacks in the 1 to 5 kWe range (cells that are 10 to 2o cm long), circulation of the
cathode air through the cooling plate channels at a stoichiometric factor of about 10 should be
sufficient to maintain the temperature variation over the cell to within 40 K. For larger cells
and/or a more uniform temperature distribution, a separate coolant circuit using a liquid
coolant such as Duratherm 600 can be used to control the variations to within 20 K.
•
While using a four-parallel serpentine flow field for the bipolar plates appears to be a
good working compromise between the need for ensuring uniform reactant distribution and
minimizing parasitic pumping losses, the pressure drops for large cells can be as high as 10 to
30 bar.
•
It may be therefore necessary to use parallel channel flow fields in the cooling plate
(with an attendant need for careful design of the inlet and outlet headers) to avoid excessive
pressure losses which are associated with the need to operate at high coolant inlet
temperatures. Use of wider parallel channels will have the dual advantage of increasing flow
uniformity (by having fewer numbers of parallel channels) and lower pressure drop (by
increasing the hydraulic diameter of the channel).
In summary, the options for thermal management of HT-PEMFC stacks of the size of
10 kWe are limited. A carefully designed liquid coolant circuit, including identification of
optimal operating conditions, is necessary to maintain uniform and high operating
temperature of the fuel cells in the stack.
References
[1] J. Zhang, Z. Xie, J. Zhang, Y. Tang, C. Song, T. Navessin, et al., High temperature PEM fuel
cells, J Power Sources 160, 2009, 872–891.
[2] R. Ahluwalia, T. Hua and J. Peng, On-board and off-board performance of hydrogen storage
options for light-duty vehicles, Int J Hydrogen Energy 37, 2011, 2891–2910.
[3] V. Jaggi and S. Jayanti, A conceptual model of a high-efficiency, stand-alone power unit based
on a fuel cell stack with an integrated auto-thermal ethanol reformer, Appl
Energy 110, 2013, 295–303.
21
[4] R.C. Samsun, J. Pasel, H. Janssen, W. Lehnert, R. Peters and D. Stolten,Design and test of a
5 kWe high-temperature polymer electrolyte fuel cell system operated with diesel and
kerosene, Appl Energy 114, 2014,238–249.
[5] J.T. Wang, R. Savinell, J. Wainright, M. Litt and H. Yu, A H2–O2 fuel cell using acid doped
polybenzimidazole as polymer electrolyte, Electrochim Acta 41, 1996, 193–197.
[6] H.J. Kim, S.Y. Cho, S.J. An, Y.C. Eu, J.Y. Kim, H.K. Yoon, et al., Synthesis of poly (2,5-
benzimidazole) for use as a fuel-cell membrane, Macromol Rapid Commun 25, 2004, 894–
897.
[7] A.R. Korsgaard, R. Refshauge, M.P. Nielsen, M. Bang and S.K. Kær,Experimental
characterization and modeling of commercial polybenzimidazole-based MEA performance, J
Power Sources 162, 2006,239–245.
[8] K. Scott, S. Pilditch and M. Mamlouk, Modelling and experimental validation of a high
temperature polymer electrolyte fuel cell, J Appl Electrochem 37, 2007, 1245–1259.
[9] J. Peng, J.Y. Shin and T.W. Song, Transient response of high temperature PEM fuel cell, J
Power Sources 179, 2008, 220–231.
[10] K. Scott and M. Mamlouk, A cell voltage equation for an intermediate temperature proton
exchange membrane fuel cell, Int J Hydrogen Energy 34, 2009, 9195–9202.
[11] C. Siegel, G. Bandlamudi and A. Heinzel, Systematic characterization of a PBI/H3 PO4 sol-gel
membrane-modeling and simulation, J Power Sources 196, 2010, 2735–2749.
[12] A. Shamardina, A. Chertovich, A.A. Kulikovsky and A.R. Khokhlov, A simple model of a
high temperature PEM fuel cell, Int J Hydrogen Energy 35, 2010, 9954–9962.
[13] L. Luke, H. Janßen, M. Kvesic, W. Lehnert and D. Stolten, Performance analysis of HT-PEFC
stacks, Int J Hydrogen Energy 37, 2012, 9171–9181.
[14] J. Supra, H. Janßen, W. Lehnert and D. Stolten, Temperature distribution in a liquid-cooled
HT-PEFC stack, Int J Hydrogen Energy 38, 2013,1943–1951.
[15] S.J. Andreasen, L. Ashworth, S. Sahlin, H.-C. Becker Jensen and S.K. Kaer,Test of hybrid
power system for electrical vehicles using a lithium-ion battery pack and a reformed
methanol fuel cell range extender, Int J Hydrogen Energy 39, 2014, 1856–1863.
[16] J. Park and K. Min, Dynamic modeling of a high-temperature proton exchange membrane fuel
cell with a fuel processor, Int J Hydrogen Energy 39, 2014, 10683–10696.
[17] S. Bose, T. Kuila, T.X.H. Nguyen, N.H. Kim, K.T. Lau and J.H. Lee, Polymer membranes for
high temperature proton exchange membrane fuel cell: recent advances and challenges, Prog
Polym Sci 36, 2011, 813–836.
22
[18] S.J. Andreasen and S.K. Kær, Modelling and evaluation of heating strategies for high
temperature polymer electrolyte membrane fuel cell stacks, Int J Hydrogen
Energy 33, 2008, 4955–4964.
[19] J. Zhang, Y. Tang, C. Song and J. Zhang, Polybenzimidazole-membrane-based PEM fuel cell
in the temperature range of 120–200oC, J Power Sources 72, 2007, 163–171.
[20] J. Larminie and A. Dicks, Fuel cell systems explained, 2000, Wiley; New York.
[21] A. Faghri and Z. Guo, Challenges and opportunities of thermal management issues related to
fuel cell technology and modeling, Int J Heat Mass Transfer 48, 2005, 3891–3920.
[22] G. Zhang and S.G. Kandlikar, A critical review of cooling techniques in proton exchange
membrane fuel cell stacks, Int J Hydrogen Energy 37, 2012, 2412–2429.
[23] S.H. Yu, S. Sohn, J.H. Nam and C.J. Kim, A numerical study to examine the performance of
multi-pass serpentine flow fields for cooling plates in polymer electrolyte membrane fuel
cells, J Power Sources 194, 2009,697–703.
[24] R. Cozzolino, S.P. Cicconardi, E. Galloni, M. Minutillo and A. Perna,Theoretical and
experimental investigations on thermal management of a PEMFC stack, Int J Hydrogen
Energy 36, 2011, 8030–8037.
[25] S.M. Baek, S.H. Yu, J.H. Nam and C.J. Kim, A numerical study on uniform cooling of large-
scale PEMFCs with different coolant flow field designs, Appl Therm Eng 31, 2011, 1427–
1434.
[26] S. Asghari, H. Akhgar and B.F. Imani, Design of thermal management subsystem for a 5 kW
polymer electrolyte membrane fuel cell system, J Power Sources 196, 2011, 3141–3148.
[27] S.J. Andreasen, L. Ashworth, I.N.M. Reman, P.L. Rasmussen and M.P.Nielsen, Modeling and
implementation of a 1 kW, air-cooled HTPEM fuel cell in a hybrid electrical vehicle, ECS
Trans 12, 2008, 639–650.
[28] J. Scholta, W. Zhang, L. Jörissenc and W. Lehnert, Conceptual design for an externally cooled
HT-PEMFC stack, ECS Trans 12, 2008, 113–118.
[29] J. Scholta, M. Messerschmidt, L. Jörissen and Ch Hartnig, Externally cooled high temperature
polymer electrolyte membrane fuel cell stack, J Power Sources 190, 2009, 83–85.
[30] T.W. Song, K.H. Choi, J.R. Kim and J.S. Yi, Pumpless thermal management of water-cooled
high temperature proton exchange membrane fuel cells, J Power Sources 196, 2011, 4671–
4679.
[31] M. Kvesic, U. Reimer, D. Froning, L. Luke, W. Lehnert and D. Stolten, 3D modeling of a
200 cm2 HT-PEFC short stack, Int J Hydrogen Energy 37, 2012, 2430–2439.
23
[32] M. Kvesic, U. Reimer, D. Froning, L. Luke, W. Lehnert and D. Stolten, 3D modeling of an
HT-PEFC stack using reformate gas, Int J Hydrogen Energy 37, 2012, 12438–12450.
[33] E.H. Reddy and S. Jayanti, Thermal management strategies for a 1 kWe stack of a high
temperature proton exchange membrane fuel cell, Appl Therm Eng 48, 2012, 465–475.
[34] E.H. Reddy, D.S. Monder and S. Jayanti, Parametric study of an external coolant system for a
high temperature polymer electrolyte membrane fuel cell, Appl Therm Eng 58, 2013, 155–
164.
[35] I. Tolj, M.V. Lototskyy, M.W. Davids, S. Pasupathi, G. Swart and B.G. Pollet,Fuel cell-battery
hybrid powered light electric vehicle (golf cart): influence of fuel cell on the driving
performance, Int J Hydrogen Energy 38, 2013,10630–10639.
[36] Fuel cell scooters and solar hydrogen refuelling station launched in Hawaii, Fuel
CellToday. http://goo.gl/hpW40t [last accessed 09.09.14].
[37] M. Ehsani, Y. Gao and A. Emadi, Modern electric, hybrid electric and fuel cell vehicles, 2nd
ed., 2010, CRC Press; Boca Raton, Florida, USA.
[38] H. Jansen, J. Supra, L. Luke, W. Lehnert and D. Stolten, Development of HT-PEFC stacks in
the kW range, Int J Hydrogen Energy 38, 2013,4705–4713.
[39] E.H. Reddy, Thermal management studies for a high temperature proton exchange membrane
fuel cell stack, 2013, Indian Institute of Technology Hyderabad, India, [Ph.D. thesis].
[40] S. Maharudrayya, S. Jayanti and A.P. Deshpande, Flow distribution and pressure drop in
parallel channel configurations of planar fuel cells, J Power Sources 144, 2005, 94–106