HHS Public Access - CDC stacks
19
Heptadecanoylcarnitine (C17) a novel candidate biomarker for propionic and methylmalonic acidemias during expanded newborn screening Sabrina Malvagia 1,* , Christopher A. Haynes 2,* , Laura Grisotto 3 , Daniela Ombrone 1 , Silvia Funghini 1 , Elisa Moretti 4 , Kathleen McGreevy 5 , Annibale Buggeri 3 , Renzo Guerrini 6 , Raquel Yahyaoui 7 , Uttam Garg 8 , Mary Seeterlin 9 , Donald Chace 10 , Victor De Jesus 2 , and Giancarlo la Marca 1 1 Newborn Screening, Biochemistry and Pharmacology Laboratories, Clinic of Pediatric Neurology, Meyer Children’s University Hospital, Florence, Italy 2 Newborn Screening and Molecular Biology Branch, Centers for Disease Control and Prevention, Atlanta, GA 3 Department of Statistics, Computer Science and Applications ‘G. Parenti’ University of Florence, Florence, Italy 4 Analytics and Early Formulations Department, Chiesi Farmaceutici S.P.A., Parma, Italy 5 Research, Innovation and International Relations Office, Meyer Children’s University Hospital, Florence, Italy 6 Pediatric Neurology Unit and Laboratories, Meyer Children's University Hospital, Viale Pieraccini 24, 50139 Florence, Italy 7 Newborn Screening and Clinical Laboratory, Málaga Regional Hospital, Málaga, Spain 8 Department of Pathology and laboratory Medicine, Children’s Mercy Hospital, Kansas City, MO, USA 9 Newborn Screening Section, Michigan Department of Community Health, Bureau of Laboratories, Chemistry and Toxicology, Lansing, MI, USA 10 The Pediatrix Center for Research, Education and Quality Pediatrix Medical Group, Concord Terrace Sunrise, FL, USA Abstract Background—3-hydroxypalmitoleoyl-carnitine (C16:1-OH) was recently reported to be elevated in acylcarnitine profile of propionic acidemia (PA) or methylmalonic acidemia (MMA) patients during expanded newborn screening (NBS). High levels of C16:1-OH, combined with other Corresponding author: Giancarlo la Marca, Newborn Screening, Biochemistry and Pharmacology Laboratories, Clinic of Pediatric Neurology, Meyer Children’s University Hospital, Viale Pieraccini 24, 50139 Florence, Italy. Tel.:+390555662988; fax: +390555662489. [email protected], [email protected]. * equally contributed HHS Public Access Author manuscript Clin Chim Acta. Author manuscript; available in PMC 2017 August 31. Published in final edited form as: Clin Chim Acta. 2015 October 23; 450: 342–348. doi:10.1016/j.cca.2015.09.012. Author Manuscript Author Manuscript Author Manuscript Author Manuscript
-
Upload
khangminh22 -
Category
Documents
-
view
6 -
download
0
Transcript of HHS Public Access - CDC stacks
Heptadecanoylcarnitine (C17) a novel candidate biomarker for propionic and methylmalonic acidemias during expanded newborn screening
Sabrina Malvagia1,*, Christopher A. Haynes2,*, Laura Grisotto3, Daniela Ombrone1, Silvia Funghini1, Elisa Moretti4, Kathleen McGreevy5, Annibale Buggeri3, Renzo Guerrini6, Raquel Yahyaoui7, Uttam Garg8, Mary Seeterlin9, Donald Chace10, Victor De Jesus2, and Giancarlo la Marca1
1Newborn Screening, Biochemistry and Pharmacology Laboratories, Clinic of Pediatric Neurology, Meyer Children’s University Hospital, Florence, Italy
2Newborn Screening and Molecular Biology Branch, Centers for Disease Control and Prevention, Atlanta, GA
3Department of Statistics, Computer Science and Applications ‘G. Parenti’ University of Florence, Florence, Italy
4Analytics and Early Formulations Department, Chiesi Farmaceutici S.P.A., Parma, Italy
5Research, Innovation and International Relations Office, Meyer Children’s University Hospital, Florence, Italy
6Pediatric Neurology Unit and Laboratories, Meyer Children's University Hospital, Viale Pieraccini 24, 50139 Florence, Italy
7Newborn Screening and Clinical Laboratory, Málaga Regional Hospital, Málaga, Spain
8Department of Pathology and laboratory Medicine, Children’s Mercy Hospital, Kansas City, MO, USA
9Newborn Screening Section, Michigan Department of Community Health, Bureau of Laboratories, Chemistry and Toxicology, Lansing, MI, USA
10The Pediatrix Center for Research, Education and Quality Pediatrix Medical Group, Concord Terrace Sunrise, FL, USA
Abstract
Background—3-hydroxypalmitoleoyl-carnitine (C16:1-OH) was recently reported to be elevated
in acylcarnitine profile of propionic acidemia (PA) or methylmalonic acidemia (MMA) patients
during expanded newborn screening (NBS). High levels of C16:1-OH, combined with other
Corresponding author: Giancarlo la Marca, Newborn Screening, Biochemistry and Pharmacology Laboratories, Clinic of Pediatric Neurology, Meyer Children’s University Hospital, Viale Pieraccini 24, 50139 Florence, Italy. Tel.:+390555662988; fax: +390555662489. [email protected], [email protected].*equally contributed
HHS Public AccessAuthor manuscriptClin Chim Acta. Author manuscript; available in PMC 2017 August 31.
Published in final edited form as:Clin Chim Acta. 2015 October 23; 450: 342–348. doi:10.1016/j.cca.2015.09.012.
Author M
anuscriptA
uthor Manuscript
Author M
anuscriptA
uthor Manuscript
hydroxylated long chain acylcarnitines are related to long-chain 3-hydroxyacyl-CoA
dehydrogenase deficiency (LCHADD).
Methods—The acylcarnitine profile of two LCHADD patients was evaluated using liquid
chromatography-tandem mass spectrometric method. A specific retention time was reported for
each hydroxylated long chain acylcarnitine. The same method was applied to some neonatal dried
blood spots (DBS) from PA and MMA patients presenting abnormal C16:1-OH concentrations.
Results—The final retention time of the peak corresponding to C16:1-OH in LCHADD patients
differed from those in MMA and PA patients. Heptadecanoylcarnitine (C17) has been identified as
the novel biomarker specific for PA and MMA patients through high resolution mass spectrometry
(Orbitrap) experiments. We found that 21 out of 23 neonates (22 MMA, and 1PA) diagnosed
through the Tuscany region NBS program had significantly higher levels of C17 compared to
levels detected in controls.
Twenty-three maternal deficiencies (21 vitamin B12 deficiency, 1 homocystinuria and 1 gastrin
deficiency) and 82 false positive for propionylcarnitine (C3) results were also analyzed.
Conclusions—This paper reports on the characterization of a novel biomarker able to detect
propionate disorders during expanded newborn screening (NBS). The use of this new biomarker
may improve the analytical performances of NBS programs especially in laboratories where
second tier tests are not performed.
Keywords
propionic acidemia; methylmalonic acidemia; expanded newborn screening; acylcarnitine; heptadecanoylcarnitine
Introduction
Propionic and methylmalonic acidemias are inborn errors of propionate metabolism that
originate from the incorrect catabolism of isoleucine, valine, threonine, methionine, odd-
chain fatty acids and cholesterol (1).
Propionic acidemia (PA, OMIM 606054) is a result of defective activity of propionyl-CoA
carboxylase, an enzyme that catalyzes the conversion of propionyl-CoA to methylmalonyl-
CoA. It is caused by mutation in the genes PCCA (OMIM 232000) and PCCB (OMIM
232050) which encode for alpha and beta subunits of propionyl-CoA carboxylase,
respectively (2).
Methylmalonic acidemia (MMA) is a genetically heterogeneous disorder caused by either
mutations in the MUT gene encoding for the methylmalonyl-CoA mutase (OMIM 609058)
(and causing partial, mut (−), or complete mut 0, enzyme deficiency) or a defect in the
transport or biosynthesis of MUT coenzyme adenosylcobalamin (AdoCbl). AdoCbl defect
are classified according to complementation group in CblA, caused by mutation in the
MMAAgene (OMIM 607481), and CblB, caused by mutation in the MMAB gene (OMIM
607568).
Malvagia et al. Page 2
Clin Chim Acta. Author manuscript; available in PMC 2017 August 31.
Author M
anuscriptA
uthor Manuscript
Author M
anuscriptA
uthor Manuscript
Combined methylmalonic acidemia and homocystinuria may be seen in complementation
groups CblC (OMIM 277400), CblD (OMIM 277410), and CblF (OMIM 277380).
Methylmalonic acidemia may be due to a mutation in the gene CD320 (OMIM 606475)
encoding the transcobalamin receptor TCBLR or a mutation in the methylmalonyl-CoA
epimerase gene (OMIM 608419) (3, 4).
The clinical manifestations of these disorders include vomiting, lethargy, coma, intermittent
ketoacidosis, hyperglycinemia, neutropenia, thrombocytopenia, hyperammonemia and
hypoglycemia. The severity of clinical and biochemical phenotype is associated with
different genes and/or mutations involved. Diagnosis and treatment of patients with
MMA/PA can prevent acute acidosis and metabolic decompensation (5). Expanded newborn
screening (NBS) for metabolic diseases by tandem mass spectrometry allows pre-
symptomatic detection and early treatment of affected newborns with MMA or PA.
The Acylcarnitine profile of dried blood spot (DBS) samples from newborns with propionate
metabolism defect usually shows increased levels of propionylcarnitine (C3). This analyte is
used worldwide as a marker for both defects, but it is not specific and causes large numbers
of false-positive results (6). In order to improve the specificity of the test, some authors have
suggested including the calculation of metabolite ratios C3/C2, C3/C16, C3/Met in the
newborn screening panel and to use specific algorithms (7).
In a previous published paper we proposed a second-tier test (2nd TT) able to reveal the
presence of 3-OH-propionic or methylmalonic acids on the same dried blood spot. The
application of this 2nd TT in all newborns with C3 above the cut off levels has potentially
allowed a positive predictive value close to 100% to be achieved (8).
Some newborn screening laboratories are still not performing 2nd TT when C3 is outside the
normal ranges; they are therefore forced to keep a relatively high C3 cut off to avoid an
unsustainable number of false positive results.
While laboratories performing 2nd TT for C3 have minimized false-positive rate, the risk of
false negative results remains because 2nd TT is only applied to initial out-of-range
screening results.
Methylmalonic acidemia combined with homocystinuria (CblC defect) can be missed during
newborn screening because of the initial low levels of C3 (9, 10) as well as maternal vitamin
B12 deficiencies (11).
Several papers have recently reported that in many patients affected by PA or MMA,
newborn screening results showed an increased concentration of 3-hydroxyhexadecenoyl (or
3-hydroxypalmitoleoyl) -carnitine (C16:1-OH) in addition to elevated C3 and related ratios,
even if no correlation with the diseases’ pathogenesis was recognized at that time (7, 11).
C16:1-OH and other hydroxylated long chain acylcarnitines are well-known markers of
long-chain 3-hydroxyacyl-CoA dehydrogenase deficiency (LCHADD) and/or trifunctional
protein (TFP) deficiency.
Malvagia et al. Page 3
Clin Chim Acta. Author manuscript; available in PMC 2017 August 31.
Author M
anuscriptA
uthor Manuscript
Author M
anuscriptA
uthor Manuscript

In this paper we provide evidence that the new biomarker involved in PA and MMA is
heptadecanoylcarnitine C17 and not C16:1-OH.
Finally, we investigate the diagnostic value of this new biomarker for improving the
sensitivity and the specificity of NBS for propionate metabolism disorders.
MATERIALS AND METHODS
Retrospective study population
DBS samples are routinely collected from all neonates born in the Italian regions of Tuscany
and Umbria (about 40000/year) for NBS (12). In order to have the highest possible
sensitivity, a 2nd TT for free methylmalonic and 3-OH-propionic acid has been performed
since 2007 if first screen C3 value is ≥ 3.3 µmol/L. The cutoff value (98th percentile of our
population, based on 50000 NBS tests) corresponds to approximately 2 % of 2nd TT per
year.
Twenty-three affected neonates were evaluated in this study: 22 with heterogeneous genetic
disorders of MMA, one with PA. In addition, a retrospective revaluation was performed on
23 newborns with MMA due to maternal deficiency (21 vitamin B12 deficiencies, one
homocystinuria and one cobalamin malabsorption due to gastric atrophy).
Eighty-two false-positives (C3 ≥ 3.3 µmol/L, and negative at 2nd TT) detected during the
same period were also evaluated for comparative analysis.
Five controls for each of the index cases (n=635) were taken randomly and blinded in the
same analytic batch. We proceeded in the same way for the cases with MMA due to
maternal deficiency (n=138). Low birth weight infants (<1800g), newborns receiving
parenteral nutrition or a blood transfusion before newborn screening test were excluded.
All experiments were conducted in compliance with Institutional Review Board guidelines
of the Meyer Children’s Hospital Ethic Committee.
Standards
C17 and C17-D3 were purchased from GiottoBiotech (Florence, Italy). Stock solutions of
chemical and labelled standards at 100 mmol/L were prepared in methanol and stored at-
20°C. Working solutions were prepared daily from stock solutions at final concentration of
0.01 µmol/L. Other reagents, such as HPLC-grade water, formic acid, and methanol, were
purchased from Panreac (Barcelona, Spain). Labelled acylcarnitine internal standards were
purchased from Cambridge Isotope Laboratories (Andover, MA, USA); a stock solution was
made in methanol. The standard acylcarnitine concentrations were in the range 7.6–152
mmol/L.
LC-MS/MS method for C16:1-OH isobaric compound separation
Two DBS (about 6.4–6.8 µL whole blood) for each sample were extracted with 200 µL of
methanol for 25 min at room temperature. The extract was then transferred to a clear 1.5 mL
vial for LC-MS/MS analysis.
Malvagia et al. Page 4
Clin Chim Acta. Author manuscript; available in PMC 2017 August 31.
Author M
anuscriptA
uthor Manuscript
Author M
anuscriptA
uthor Manuscript

The data were obtained using an API 4000 triple quadrupole mass spectrometer (AB
SCIEX, Toronto, Canada) equipped with Turbo Ion Spray source and operating in MRM
positive ion mode. The ion spray voltage was set to 5200 V, the gas 1 and gas 2 were set
both at 30 and 45 respectively and the temperature was set to 450 °C.
Two MS/MS experiments were performed: an MRM experiment to monitor the transition
414.5>85.1 m/z specific for C16:1-OH acylcarnitine, and a precursor of 85 m/z scan
experiment to analyze all acylcarnitines in the range of 300–500 Da.
The chromatographic separation was achieved using an Agilent 1260 Infinity HPLC
capillary system (Agilent Technologies, Waldbronn, Germany), operating in gradient mode,
coupled with a thermostated autosampler and fully controlled by Analyst Software (Version
1.5.2).
The chromatographic run was performed by using a Synergi Polar column, 4 µm, 150×2 mm
(Phenomenex, Torrance, CA) at a flow rate of 200 µL/min; the eluate was directed into the
ESI source without splitting. The mobile phase was composed by water +0.1 % formic acid
(phase A, pH 2.8) and methanol + 0.1% formic acid (phase B).
Separation was achieved using a linear gradient from 90% to 30% (phase A) over 50
minutes; the conditions were maintained for 15 minutes, after which the mobile phase was
returned to the starting conditions within 0.5 minutes and re-equilibrated for 9.5 minutes.
The total run time was 75 minutes. The injection volume was 20 µL, and the autosampler
temperature was maintained at 4°C throughout the analyses.
Orbitrap experiments
A Nexera liquid chromatograph (Shimadzu, Kyoto, Japan) coupled to a Thermo Q Exactive
mass spectrometer (Thermo Fisher Scientific, Waltham, USA) was used for liquid
chromatography–mass spectrometry (LC-MS) measurements. The mass spectrometer,
operated in positive electrospray (ESI+) mode, was equipped with a heated ESI source
(HESI-II, at 200°C) and the ionization voltage was set to 3.5 kV at a capillary temperature of
320°C. The scan event cycle used a full scan mass spectrum (100–1000 Da) at a resolving
power of 140.000 (at m/z 200) and three corresponding data dependent MS/MS events
acquired at a resolving power of 70.000 using HCD. The three most intense ions detected
during full scan MS triggered data dependent scanning. Data dependent scanning was
performed with and without the use of a precursor ion list. The MS/MS activation
parameters were an isolation width of 4 Da, stepped collision energies of 20, 30, and 35 V
and an activation time of 30 milliseconds. The mass accuracy was determined from an
external calibration performed the same day. The software Xcalibur 3.0.63 (Thermo Fisher
Scientific, Waltham, USA) was used for data acquisition.
C17
The fragmentation patterns of C17 and C17-D3 were recorded by infusing standard solutions
(0.1 mg/L) at 10 µL/min, directly in the ESI source of the API 4000. Three specific MRM
transitions (414.4>85 m/z, 414.4>355.1 m/z, 414.4>253.1 m/z; 417.4>85 m/z, 417.4>358.1
m/z, 417.4>256.1 m/z, for C17 and C17-D3 respectively) were recorded with experimentally
Malvagia et al. Page 5
Clin Chim Acta. Author manuscript; available in PMC 2017 August 31.
Author M
anuscriptA
uthor Manuscript
Author M
anuscriptA
uthor Manuscript

optimized declustering, collision energy and collision exit potential values (42V, 25V and
29V, respectively).
Statistical analysis
We used the STATA 13 (T Stat s.r.l., College Station, Texas) for statistical analysis and
descriptive statistics (means, standard deviation) to describe participants’ main variables.
ANOVA and Bartlett’s test were used to analyze the difference between the three groups
(MMA/PA cases, negative controls and false-positives C3 ≥ 3.3 µmol/L).
To assess and compare the diagnostic accuracy of the measured biomarkers (C3, C17,
C3/C0, C3/C2, C3/C4, C3/C16, C3/Met, methionine) we calculated sensitivity, specificity,
area under the receiver operating characteristic (ROC) curve (AUC). We chose the cut-off
that maximized the percentage of correctly classified and, in case of equal AUC, sensitivity.
Finally, we have defined a testing strategy combining information from the biomarkers.
When appropriate, confidence intervals (CI) were calculated using likelihood (13). Level of
significance was set at 5% two sided.
Results
In order to understand the significance of the increased concentration of C16:1-OH observed
on DBS of patients with propionate metabolism defect, we performed a chromatographic
separation of the extracts obtained from neonatal DBS of controls, MMA, PA and LCHADD
patients.
Two MS/MS experiments were monitored during the chromatographic separation: a MRM
for the transition 414.5>85.1 m/z and a precursor ion scan of 85 m/z, enabling the
measurement of all acylcarnitines in the range 300–500 m/z.
The total ion current of the MRM experiments revealed a practically flat baseline in control
samples (two small peaks were detectable at about 60.6 and 61.9 minutes). The profile
obtained from LCHADD samples showed one intense peak at retention time (RT) 52.6
minutes (peak 1) and two smaller peaks (about 60.8 and 62.0 minutes, peak 2 and peak 3,
respectively) while PA and MMA samples reveals only the two peaks at 60.6 and 62.0
minutes (Figure 1). High resolution LC-Orbitrap MS and MS/MS experiments have
demonstrated that peak 1 corresponds to C16:1-OH (as expected in LCHADD patient, data
not shown) while peaks 2 and 3 correspond to acylcarnitine C17 (Figure S1). Considering
that the pKa of the carboxyl group of acylcarnitines is 3.8 (14), dissociated and
undissociated isoforms were present (the elution mixture measured pH 3.25 at
approximately RT 60 minutes).
Low- and high-resolution MS/MS spectra of C17 chemical standards and related RT
corresponded to those found in PA and MMA patients.
Malvagia et al. Page 6
Clin Chim Acta. Author manuscript; available in PMC 2017 August 31.
Author M
anuscriptA
uthor Manuscript
Author M
anuscriptA
uthor Manuscript
Considering that NBS laboratories usually measure the metabolite C16:1-OH/C17 in
precursor ion scan mode by using labelled C16 as internal standard, and considering that
their concentration and MS signal is significantly different and potentially not accurate, we
decided to add new specific MRMs using D3-C17 at 0.01 µmol/L. A precursor ion scan of
85 m/z can be also used by adding D3-C17 as internal standard.
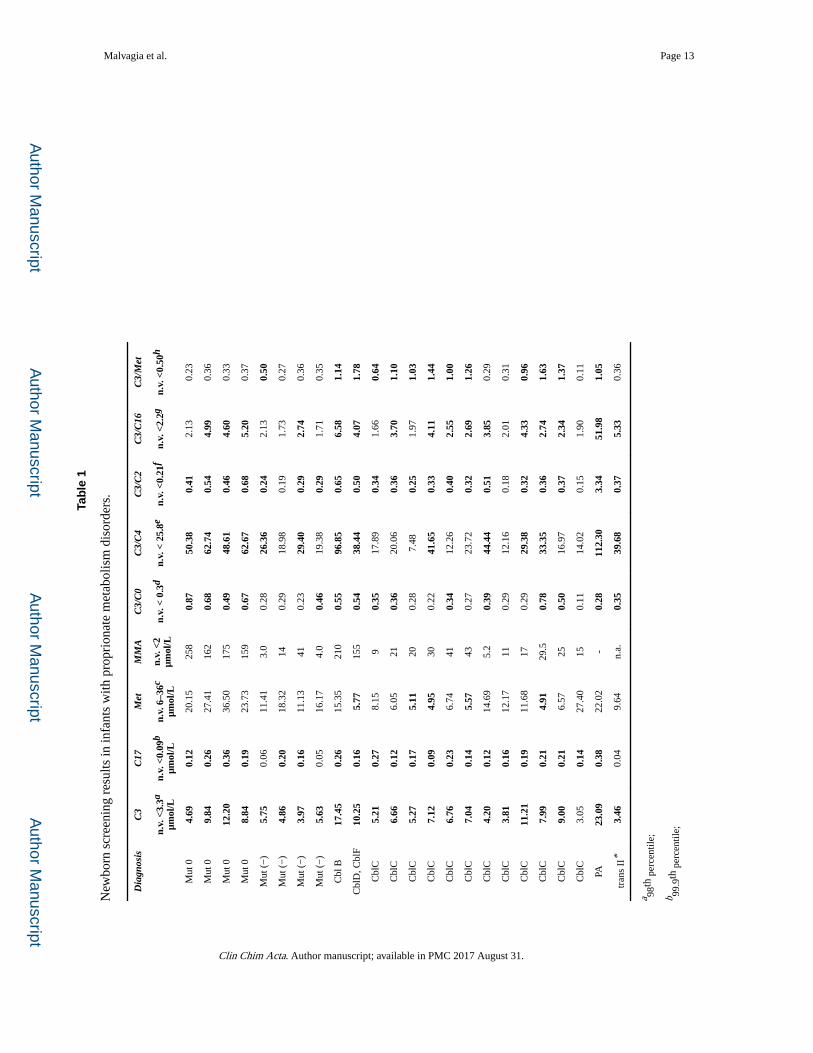
Biomarker concentrations from neonatal DBS were reported for patients (Table 1) and
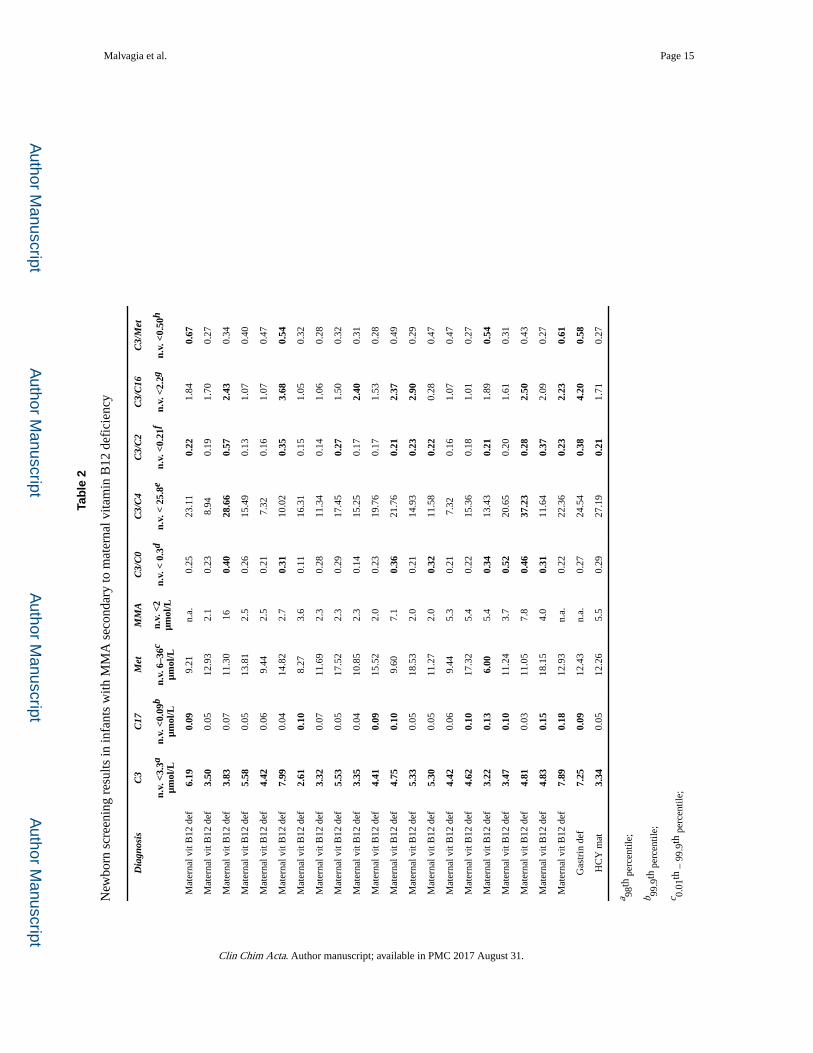
maternal deficiencies (Table 2).
Statistical analysis
Box-plot of cases, controls and false-positives show the distribution of biomarker
concentrations within each group (Figure S2). The group means (ANOVA) and variances
(Bartlett-test) were significantly different from each other for all biomarkers except
methionine (Met) (Table 3). For this reason we decided to exclude the biomarker Met from
the diagnostic analysis.
Table 4 shows the results of diagnostic analysis. The best diagnostic performance for
metabolism defects (MMA and PA) was observed by C17 with cut-off set up to 0.092
µmol/L (corresponding to the 99.8 percentile) 91.30% sensitivity (95% CI 72.0%; 98.9%);
99.84% specificity (95% CI 99.1%; 100%) and AUC = 0.956 (95% CI 0.897; 1.000); C3
with cut-off set up to 5.633 µmol/L (corresponding to the 99.93 percentile) 65.22%
sensitivity (95% CI 42.7%; 83.6%); 99.51% specificity (95% CI 98.6%; 99.9%) and AUC =
0.824 (95% CI 0.724; 0.923) and C3/C16 ratio with cut-off set up to 2.338 (corresponding to
the 99.4 percentile) 65.22% sensitivity (95% CI 42.7%; 83.6%); 98.69% specificity (95% CI
97.4%; 99.4%) and AUC = 0.820 (95% CI 0.720; 0.919).
Based on these results we explored a combination of biomarkers (Table 5): the best strategy
was a parallel testing of C17 and C3 (tests are declared positive if C17 ≥ 0.092 µmol/L or C3
≥ 5.633 µmol/L) with AUC = 0.997; 95% CI 0.994; 1.000; 100% sensitivity (95% CI 85.2%;
100%), 99.35% specificity (95% CI 98.3%; 99.8%).
Discussion
In this paper we have demonstrated that a new metabolite, C17 acylcarnitine, is suggestive
for the diagnosis of propionate metabolism defects (MMA and PA) and should be
considered an important biomarker. The presence of large amounts of odd-numbered long-
chain fatty acids in adipose tissue (from 8% to 10% of total fatty acids vs 1% in normal
controls) during fetal life in newborns suffering of propionate metabolism defects has been
largely reported from Wendel and collaborators (15–17). During periods of acute catabolism,
such as in the early days of life, the mobilization and the oxidation of odd-chain fatty acids
from adipose tissue leads to the production of extensive amounts of toxic propionyl-CoA in
the mitochondria. Fatty acid synthase catalyzes the synthesis of palmitate from acetyl-CoA
and malonyl-CoA, in the presence of NADPH, into long-chain saturated fatty acids. The
excess of propionyl-CoA in the mitochondria could be considered to be the likely cause of
the production of a small percentage of heptadecanoic fatty acid. This acid, like most other
carboxylic acids, can be activated by acyl-CoA synthases to form heptadecanoyl-CoA,
Malvagia et al. Page 7
Clin Chim Acta. Author manuscript; available in PMC 2017 August 31.
Author M
anuscriptA
uthor Manuscript
Author M
anuscriptA
uthor Manuscript
which cannot be oxidized to carbon dioxide in mammalian cells. As a result, heptadecanoyl-
CoA accumulates in cells and becomes a substrate for several acyl-CoA transferases. These
reactions generate heptadecanoic-conjugates and among them C17 detectable by newborn
screening tests. The Tuscany region’s newborn screening program began in 2004; out of
more than 500000 newborns screened, 23 affected by inborn errors of propionate
metabolism have been identified. The study of C17 neonatal concentration in this group
showed 21 measurements higher than cutoff values, confirming the high prognostic
significance of the biomarker. It should be noted that this biomarker would have failed in the
identification of two newborns with MMA mut (−) phenotype (and one newborn affected by
transcobalamin II deficiency; disorder not included in our NBS panel). In our experience the
sensitivity of C17 can be considered comparable to or higher than C3/C2 ratio (20/23 correct
identifications, plus transcobalamin II deficiency). Considering our cut-off levels, other
ratios presented less sensitivity (Table 1).
In 2007, after one CblC false negative result, we developed a 2nd TT for the detection of 3-
OH propionic acid and methylmalonic acid on DBS (8), reducing the upper C3 cutoff value
to 98th percentile of our population, corresponding to 3.3 µmol/L. The previous C3 cutoff
5.65 µmol/L corresponded to 99.95th percentile. Eight affected newborns (three mut (−) and
five CblC) tested after 2007 presented with a C3 concentration lower than 5.65 µmol/L.
Furthermore, one CblC patient was subjected to 2nd TT during this study because he
presented with a high C17 level (0.14 µmol/L) even with normal C3 concentration (3.05
µmol/L).
Statistical analysis demonstrated that C17 is able to distinguish negative newborn specimen
results (controls + false negative) from positive ones better than other parameters previously
used in our NBS program (Figure S2A). It should be noted that C17 alone seems to be the
biomarker with the best correct classification as compared to other biomarkers. For NBS
laboratories that are still not performing 2nd TT, the inclusion of C17 as specific biomarker
could significantly improve the sensitivity of the first tier test.
Otherwise we consider the combination of first and second-tier testing for many metabolic
disorders to be the best working practice for achieving the most benefit from NBS programs
(18). In our daily practice we have modified our NBS protocol as reported in Figure S3.
Different considerations must be done for maternal vitamin B12 deficiencies. Poor nutrition,
such as a vegetarian diet during pregnancy, can lead to vitamin B12 deficiency causing
serious problems in newborn metabolism. Some babies whose mothers had vitamin B12
deficiency show a MMA and homocysteine accumulation (19). A severe maternal vitamin
B12 deficiency in breast-fed infants can cause failure to thrive, developmental regression,
anemia and nerve-related disorders. Prolonged metabolic decompensation can lead to severe
lethargy progressing slowly to coma and irreversible neurological damage (20).
Early identification of these cases can make life-saving interventions prior to clinical
manifestation possible (21). However, vitamin B12 supplementation should be always
recommended in vegetarian/vegan mothers during pregnancy as well as while breastfeeding.
Malvagia et al. Page 8
Clin Chim Acta. Author manuscript; available in PMC 2017 August 31.
Author M
anuscriptA
uthor Manuscript
Author M
anuscriptA
uthor Manuscript

In our NBS program we were able to identify 19 maternal vitamin B12 deficiencies, one
maternal homocystinuria and one maternal gastrin deficiency because our C3 cut-off. The
power of C17 alone for the detection of maternal disorders (without 2nd TT) should be
considered only moderately important, as it was capable of identifying only 10/23 cases
(sensitivity 43.48%) (Table 2). On the other hand, two additional vitamin B12 deficiencies
were discovered during this study through 2nd TT because they presented C17 at 0.1 µmol/L
and 0.13 µmol/L upon NBS test even if the C3 values were normal (2.61 and 3.22 µmol/L,
respectively). Moreover the possibility of detecting a maternal deficiency is consistently low
if 2nd TT is not performed and the corresponding C3 cut-off is maintained high to reduce the
C3-related false positive rate.
Conclusions
The results of this study strongly suggest the evaluation of C17 as primary biomarker
(together with C3 and ratios) for propionate metabolism defects, especially in NBS
laboratories where 2nd TT is still not available.
The use of 2nd TT is a worldwide NBS good practice parameter that greatly improves the
specificity of the first screening results. However, 2nd TT depends on the results of the first
tier test and the final sensitivity will be influenced by the cut off value of the primary
marker. While this study has some limitations (exclusion of low birth weight infants <1800g
and newborns receiving parenteral nutrition or a blood transfusion before newborn screening
test), in our experience the evaluation of the new biomarker C17 improved sensitivity
suggesting the utility of performing the 2nd TT even when the primary marker C3 falls
within normal limits (two maternal vitamin B12 deficiencies and 1 CblC). However, a false-
negative result cannot be excluded when both biomarkers (C3 and C17) are lower than the
cut offs and 2nd TT is not performed.
Supplementary Material
Refer to Web version on PubMed Central for supplementary material.
Acknowledgments
Use of trade names is for identification only and does not imply endorsement by the US Centers for Disease Control and Prevention, the Public Health Service, or the U.S. Department of Health and Human Services. The findings and conclusions in this report are those of the authors and do not necessarily represent the views of the US Centers for Disease Control and Prevention.
Abbreviations
C16:1-OH 3-hydroxypalmitoleoyl-carnitine
PA propionic acidemia
MMA methylmalonic acidemia
LCHADD long-chain 3-hydroxyacyl-CoA dehydrogenase deficiency
DBS dried blood spot
Malvagia et al. Page 9
Clin Chim Acta. Author manuscript; available in PMC 2017 August 31.
Author M
anuscriptA
uthor Manuscript
Author M
anuscriptA
uthor Manuscript
C17 heptadecanoylcarnitine
C3 propionylcarnitine
C3/C2 propionylcarnitine/acetylcarnitine
C3/C16 propionylcarnitine/palmitoylcarnitine
C3/Met propionylcarnitine/methionine
2nd TT second-tier test
NBS newborn screening
MRM multiple reaction monitoring
HCD higher energy collisional dissociation
ESI electrospray ionization
RT retention time
ROC receiver operating characteristic
AUC area under the curve
CI confidence intervals
References
1. Thompson GN. Inborn errors of propionate metabolism: methylmalonic and propionic acidaemias. J Paediatr Child Health. 1992; 28:134–5. [PubMed: 1562361]
2. Fenton, WA., Gravel, RA., Rosenblatt, DS. Disorders of propionate and methylmalonate metabolism. In: Scriver, CR.Beaudet, AL.Sly, WS., Valle, D., editors. The Metabolic and Molecular Bases of Inherited Disease. 8. New York: McGraw-Hill; 2001. p. 2165-93.
3. Quadros EV, Lai SC, Nakayama Y, Sequeira JM, Hannibal L, Wang S, et al. Positive newborn screen for methylmalonic acidemia identifies the first mutation in TCblR/CD320, the gene for cellular uptake of transcobalamin-bound vitamin B(12). Hum Mutat. 2010; 31:924–9. [PubMed: 20524213]
4. Dobson CM, Gradinger A, Longo N, Wu X, Leclerc D, Lerner-Ellis J, et al. Homozygous nonsense mutation in the MCEE gene and siRNA suppression of methylmalonyl-CoA epimerase expression: a novel cause of mild methylmalonic acidemia. Mol Genet Metab. 2006; 88:327–33. [PubMed: 16697227]
5. Deodato F, Boenzi S, Santorelli FM, Dionisi-Vici C. Methylmalonic and propionic acidemia. Am J Med Genet C Semin Med Genet. 2006; 142C:104–12. [PubMed: 16602092]
6. la Marca G, Malvagia S, Casetta B, Pasquini E, Donati MA, Zammarchi E. Progress in expanded newborn screening for metabolic conditions by LC-MS/MS in Tuscany: update on methods to reduce false tests. J Inherit Metab Dis. 2008; 31(Suppl2):S395–404. [PubMed: 18956250]
7. McHugh D, Cameron CA, Abdenur JE, Abdulrahman M, Adair O, Al Nuaimi SA, et al. Clinical validation of cutoff target ranges in newborn screening of metabolic disorders by tandem mass spectrometry: a worldwide collaborative project. Genet Med. 2011; 13:230–54. [PubMed: 21325949]
8. la Marca G, Malvagia S, Pasquini E, Innocenti M, Donati MA, Zammarchi E. Rapid 2nd-tier test for measurement of 3-OH-propionic and methylmalonic acids on dried blood spots: reducing the false-
Malvagia et al. Page 10
Clin Chim Acta. Author manuscript; available in PMC 2017 August 31.
Author M
anuscriptA
uthor Manuscript
Author M
anuscriptA
uthor Manuscript

positive rate for propionylcarnitine during expanded newborn screening by liquid chromatography-tandem mass spectrometry. Clin Chem. 2007; 53:1364–9. [PubMed: 17510301]
9. Chace DH, DiPerna JC, Kalas TA, Johnson RW, Naylor EW. Rapid diagnosis of methylmalonic and propionic acidemias: quantitative tandem mass spectrometric analysis of propionylcarnitine in filter-paper blood specimens obtained from newborns. Clin Chem. 2001; 47:2040–4. [PubMed: 11673377]
10. Wilcken B, Wiley V, Hammond J, Carpenter K. Screening newborns for inborn errors of metabolism by tandem mass spectrometry. N Engl J Med. 2003; 348:2304–12. [PubMed: 12788994]
11. Lindner M, Ho S, Kölker S, Abdoh G, Hoffmann GF, Burgard P. J Newborn screening for methylmalonic acidemias--optimization by statistical parameter combination. Inherit Metab Dis. 2008; 31:379–85.
12. la Marca G. Mass spectrometry in clinical chemistry: the case of newborn screening. J Pharm Biomed Anal. 2014; 101:174–82. [PubMed: 24844843]
13. Van Belle, G., Fisher, LD., Heagerty, PJ., Lumley, T. Biostatistics: A Methodology for the health sciences. 2. Wiley; 2004.
14. Ho JK, Duclos RI, Hamilton JA. Interactions of acyl carnitines with model membranes: a (13)C-NMR study. J Lipid Res. 2002; 43:1429–39. [PubMed: 12235174]
15. Wendel U. Abnormality of odd-numbered long-chain fatty acids in erythrocyte membrane lipids from patients with disorders of propionate metabolism. Pediatr Res. 1989; 25:147–50. [PubMed: 2919129]
16. Wendel U, Baumgartner R, van der Meer SB, Spaapen LJ. Accumulation of odd-numbered long-chain fatty acids in fetuses and neonates with inherited disorders of propionate metabolism. Pediatr Res. 1991; 29:403–5. [PubMed: 1852536]
17. Wendel U, Zass R, Leupold D. Contribution of odd-numbered fatty acid oxidation to propionate production in neonates with methylmalonic and propionic acidaemias. Eur J Pediatr. 1993; 152:1021–3. [PubMed: 8131803]
18. Ombrone D, Giocaliere E, Forni G, Malvagia S, la Marca G. Expanded newbornscreening by mass spectrometry: New tests, future perspectives. Mass Spectrom Rev. 2015 May 7.
19. Campbell CD, Ganesh J, Ficicioglu C. Two newborns with nutritional vitamin B12 deficiency: challenges in newborn screening for vitamin B12 deficiency. Haematologica. 2005; 90(Suppl12):S45.
20. Stabler SP, Allen RH, Savage DG, Lindenbaum J. Clinical spectrum and diagnosis of cobalamin deficiency. Blood. 1990; 76:871–81. [PubMed: 2393714]
21. Demir N, Koc A, Üstyol L, Peker E, Abuhandan M. Clinical and neurological findings of severe vitamin B12 deficiency in infancy and importance of early diagnosis and treatment. J Paediatr Child Health. 2013; 49:820–4. [PubMed: 23781950]
Malvagia et al. Page 11
Clin Chim Acta. Author manuscript; available in PMC 2017 August 31.
Author M
anuscriptA
uthor Manuscript
Author M
anuscriptA
uthor Manuscript

Figure 1. The LC-MS/MS profile obtained from LCHADD neonatal samples.
Malvagia et al. Page 12
Clin Chim Acta. Author manuscript; available in PMC 2017 August 31.
Author M
anuscriptA
uthor Manuscript
Author M
anuscriptA
uthor Manuscript
Author M
anuscriptA
uthor Manuscript
Author M
anuscriptA
uthor Manuscript
Malvagia et al. Page 13
Tab
le 1
New
born
scr
eeni
ng r
esul
ts in
infa
nts
with
pro
prio
nate
met
abol
ism
dis
orde
rs.
Dia
gnos
isC
3C
17M
etM
MA
C3/
C0
C3/
C4
C3/
C2
C3/
C16
C3/
Met
n.v.
<3.
3aµm
ol/L
n.v.
<0.
09b
µmol
/Ln.
v. 6
–36c
µmol
/Ln.
v. <
2µm
ol/L
n.v.
< 0
.3d
n.v.
< 2
5.8e
n.v.
<0.
21f
n.v.
<2.
2gn.
v. <
0.50
h
Mut
04.
690.
1220
.15
258
0.87
50.3
80.
412.
130.
23
Mut
09.
840.
2627
.41
162
0.68
62.7
40.
544.
990.
36
Mut
012
.20
0.36
36.5
017
50.
4948
.61
0.46
4.60
0.33
Mut
08.
840.
1923
.73
159
0.67
62.6
70.
685.
200.
37
Mut
(−
)5.
750.
0611
.41
3.0
0.28
26.3
60.
242.
130.
50
Mut
(−
)4.
860.
2018
.32
140.
2918
.98
0.19
1.73
0.27
Mut
(−
)3.
970.
1611
.13
410.
2329
.40
0.29
2.74
0.36
Mut
(−
)5.
630.
0516
.17
4.0
0.46
19.3
80.
291.
710.
35
Cbl
B17
.45
0.26
15.3
521
00.
5596
.85
0.65
6.58
1.14
Cbl
D, C
blF
10.2
50.
165.
7715
50.
5438
.44
0.50
4.07
1.78
Cbl
C5.
210.
278.
159
0.35
17.8
90.
341.
660.
64
Cbl
C6.
660.
126.
0521
0.36
20.0
60.
363.
701.
10
Cbl
C5.
270.
175.
1120
0.28
7.48
0.25
1.97
1.03
Cbl
C7.
120.
094.
9530
0.22
41.6
50.
334.
111.
44
Cbl
C6.
760.
236.
7441
0.34
12.2
60.
402.
551.
00
Cbl
C7.
040.
145.
5743
0.27
23.7
20.
322.
691.
26
Cbl
C4.
200.
1214
.69
5.2
0.39
44.4
40.
513.
850.
29
Cbl
C3.
810.
1612
.17
110.
2912
.16
0.18
2.01
0.31
Cbl
C11
.21
0.19
11.6
817
0.29
29.3
80.
324.
330.
96
Cbl
C7.
990.
214.
9129
.50.
7833
.35
0.36
2.74
1.63
Cbl
C9.
000.
216.
5725
0.50
16.9
70.
372.
341.
37
Cbl
C3.
050.
1427
.40
150.
1114
.02
0.15
1.90
0.11
PA23
.09
0.38
22.0
2-
0.28
112.
303.
3451
.98
1.05
tran
s II
*3.
460.
049.
64n.
a.0.
3539
.68
0.37
5.33
0.36
a 98th
per
cent
ile;
b 99.9
th p
erce
ntile
;
Clin Chim Acta. Author manuscript; available in PMC 2017 August 31.

Author M
anuscriptA
uthor Manuscript
Author M
anuscriptA
uthor Manuscript
Malvagia et al. Page 14c 0.
01th
– 9
9.9t
h pe
rcen
tile;
d 99.2
th p
erce
ntile
;
e 99.7
th p
erce
ntile
;
f 99.5
th p
erce
ntile
;
g 99.3
th p
erce
ntile
;
h 99.9
th p
erce
ntile
* diso
rder
not
incl
uded
in th
e T
usca
ny r
egio
n N
BS
pane
l; th
is p
atie
nt w
as n
ot c
onsi
dere
d in
the
stat
istic
al a
naly
sis
Clin Chim Acta. Author manuscript; available in PMC 2017 August 31.
Author M
anuscriptA
uthor Manuscript
Author M
anuscriptA
uthor Manuscript
Malvagia et al. Page 15
Tab
le 2
New
born
scr
eeni
ng r
esul
ts in
infa
nts
with
MM
A s
econ
dary
to m
ater
nal v
itam
in B
12 d
efic
ienc
y
Dia
gnos
isC
3C
17M
etM
MA
C3/
C0
C3/
C4
C3/
C2
C3/
C16
C3/
Met
n.v.
<3.
3aµm
ol/L
n.v.
<0.
09b
µmol
/Ln.
v. 6
–36c
µmol
/Ln.
v. <
2µm
ol/L
n.v.
< 0
.3d
n.v.
< 2
5.8e
n.v.
<0.
21f
n.v.
<2.
2gn.
v. <
0.50
h
Mat
erna
l vit
B12
def
6.19
0.09
9.21
n.a.
0.25
23.1
10.
221.
840.
67
Mat
erna
l vit
B12
def
3.50
0.05
12.9
32.
10.
238.
940.
191.
700.
27
Mat
erna
l vit
B12
def
3.83
0.07
11.3
016
0.40
28.6
60.
572.
430.
34
Mat
erna
l vit
B12
def
5.58
0.05
13.8
12.
50.
2615
.49
0.13
1.07
0.40
Mat
erna
l vit
B12
def
4.42
0.06
9.44
2.5
0.21
7.32
0.16
1.07
0.47
Mat
erna
l vit
B12
def
7.99
0.04
14.8
22.
70.
3110
.02
0.35
3.68
0.54
Mat
erna
l vit
B12
def
2.61
0.10
8.27
3.6
0.11
16.3
10.
151.
050.
32
Mat
erna
l vit
B12
def
3.32
0.07
11.6
92.
30.
2811
.34
0.14
1.06
0.28
Mat
erna
l vit
B12
def
5.53
0.05
17.5
22.
30.
2917
.45
0.27
1.50
0.32
Mat
erna
l vit
B12
def
3.35
0.04
10.8
52.
30.
1415
.25
0.17
2.40
0.31
Mat
erna
l vit
B12
def
4.41
0.09
15.5
22.
00.
2319
.76
0.17
1.53
0.28
Mat
erna
l vit
B12
def
4.75
0.10
9.60
7.1
0.36
21.7
60.
212.
370.
49
Mat
erna
l vit
B12
def
5.33
0.05
18.5
32.
00.
2114
.93
0.23
2.90
0.29
Mat
erna
l vit
B12
def
5.30
0.05
11.2
72.
00.
3211
.58
0.22
0.28
0.47
Mat
erna
l vit
B12
def
4.42
0.06
9.44
5.3
0.21
7.32
0.16
1.07
0.47
Mat
erna
l vit
B12
def
4.62
0.10
17.3
25.
40.
2215
.36
0.18
1.01
0.27
Mat
erna
l vit
B12
def
3.22
0.13
6.00
5.4
0.34
13.4
30.
211.
890.
54
Mat
erna
l vit
B12
def
3.47
0.10
11.2
43.
70.
5220
.65
0.20
1.61
0.31
Mat
erna
l vit
B12
def
4.81
0.03
11.0
57.
80.
4637
.23
0.28
2.50
0.43
Mat
erna
l vit
B12
def
4.83
0.15
18.1
54.
00.
3111
.64
0.37
2.09
0.27
Mat
erna
l vit
B12
def
7.89
0.18
12.9
3n.
a.0.
2222
.36
0.23
2.23
0.61
Gas
trin
def
7.25
0.09
12.4
3n.
a.0.
2724
.54
0.38
4.20
0.58
HC
Y m
at3.
340.
0512
.26
5.5
0.29
27.1
90.
211.
710.
27
a 98th
per
cent
ile;
b 99.9
th p
erce
ntile
;
c 0.01
th –
99.
9th
perc
entil
e;
Clin Chim Acta. Author manuscript; available in PMC 2017 August 31.

Author M
anuscriptA
uthor Manuscript
Author M
anuscriptA
uthor Manuscript
Malvagia et al. Page 16d 99
.2th
per
cent
ile;
e 99.7
th p
erce
ntile
;
f 99.5
th p
erce
ntile
;
g 99.3
th p
erce
ntile
;
h 9.9t
h pe
rcen
til
Clin Chim Acta. Author manuscript; available in PMC 2017 August 31.

Author M
anuscriptA
uthor Manuscript
Author M
anuscriptA
uthor Manuscript
Malvagia et al. Page 17
Table 3
ANOVA and Bartlett’s test results for all biomarkers.
ANOVA Bartlett's test
F(2) P-value Χ2(2) P-value
C3 573.450 <0.001 692.750 <0.001
C17 454.720 <0.001 459.696 <0.001
Met 2.410 0.090 0.437 0.804
C3/C0 151.560 <0.001 70.620 <0.001
C3/C4 239.530 <0.001 362.769 <0.001
C3/C2 23.680 <0.001 266.749 <0.001
C3/C16 68.430 <0.001 190<0.001 <0.001
C3/Met 74.250 <0.001 240<0.001 <0.001
Clin Chim Acta. Author manuscript; available in PMC 2017 August 31.

Author M
anuscriptA
uthor Manuscript
Author M
anuscriptA
uthor Manuscript
Malvagia et al. Page 18
Table 4
Cut-off, sensitivity, specificity and AUC for biomarkers of MMA/PA metabolism defects. 95% confidence
intervals in parentheses
Cut-off Sensitivity Specificity AUC
C3 ≥ 5.63365.22% 99.51% 0.824
(42.7%; 83.6%) (98.6%; 99.9%) (0.724; 0.923)
C17 ≥ 0.09291.30% 99.84% 0.956
(72.0%; 98.9%) (99.1%; 100%) (0.897; 1.000)
C3/C0 ≥ 0.33952.17% 99.02% 0.756
(30.6%; 73.2%) (97.9%; 99.6%) (0.652; 0.860)
C3/C4 ≥ 29.37652.17% 99.35% 0.758
(30.6%; 73.2%) (98.3%; 99.8%) (0.653; 0.862)
C3/C2 ≥ 1.1204.35% 99.84% 0.521
(0.11%; 21.9%) (99.1%; 100%) (0.478; 0.564)
C3/C16 ≥ 2.33865.22% 98.69% 0.820
(42.7%; 83.6%) (97.4%; 99.4%) (0.720; 0.919)
C3/Met ≥ 0.50456.52% 99.84% 0.782
(34.5%; 76.8%) (99.1%; 100%) (0.678; 0.885)
Clin Chim Acta. Author manuscript; available in PMC 2017 August 31.

Author M
anuscriptA
uthor Manuscript
Author M
anuscriptA
uthor Manuscript
Malvagia et al. Page 19
Table 5
Sensitivity, specificity and AUC for a combination of tests for MMA/PA. 95% confidence intervals in
parentheses
Sensitivity Specificity AUC
C17≥0.092 or C3≥5.633 100% 99.30% 0.997
(85.2%; 100%) (98.3%; 99.8%) (0.994; 1.000)
C17≥0.092 or C3/C16 ≥2.338 91.30% 98.50% 0.949
(72%; 98.9%) (97.2%; 99.3%) (0.890; 1.000)
C17≥0.092 or C3≥5.633 or C3/C16≥2.338 100% 98.50% 0.993
(85.2%; 100%) (97.2%; 99.3%) (0.988; 0.997)
Clin Chim Acta. Author manuscript; available in PMC 2017 August 31.