HHS Public Access - eScholarship
21
Photoactivatable Genetically-Encoded Calcium Indicators for targeted neuronal imaging Shai Berlin 1,2 , Elizabeth C. Carroll 1 , Zachary L. Newman 1 , Hitomi O. Okada 1,† , Carson M. Quinn 1 , Benjamin Kallman 1,2 , Nathan C. Rockwell 3 , Shelley S. Martin 3 , J. Clark Lagarias 3 , and Ehud Y. Isacoff 1,2,4,* 1 Department of Molecular and Cell Biology, University of California Berkeley, Berkeley, California, USA 2 Helen Wills Neuroscience Institute, University of California Berkeley, Berkeley, California, USA 3 Department of Molecular and Cellular Biology, University of California Davis, Davis, California, USA 4 Physical Bioscience Division, Lawrence Berkeley National Laboratory, Berkeley, California, USA Abstract Circuit mapping requires knowledge of both structural and functional connectivity between cells. While optical tools have been made to assess either the morphology and projections of neurons or their activity and functional connections, few probes integrate this information. We have generated a family of photoactivatable Genetically Encoded Ca 2+ Indicators (pa-GECIs) that combines attributes of high-contrast photo-labeling with high-sensitivity Ca 2+ detection in a single-color, protein-sensor. We demonstrate the utility of pa-GECIs in cultured neurons and in vivo in Drosophila and zebrafish larvae. We show how single cells can be selected out of dense populations for Golgi-like visualization of morphology and high signal-to-noise measurements of activity, synaptic transmission and connectivity. Our design strategy is readily transferrable to other sensors based on circularly permutated GFP (cpGFP). Users may view, print, copy, and download text and data-mine the content in such documents, for the purposes of academic research, subject always to the full Conditions of use:http://www.nature.com/authors/editorial_policies/license.html#terms * Correspondence to: [email protected], 510-642-9853. † Current address: Center for Innovation in Immunoregulative Technology and Therapeutics, Kyoto University, Yoshida-konoe, Sakyo-ku, Kyoto, Japan Authors Contributions S.B., E.C.C. and E.Y.I. conceived of the project. S.B. designed sequences and constructed clones with help from H.O.O. S.B. performed all experiments in cultured cells and patching experiments. Z.L.N. maintained transgenic Drosophila lines and conducted larval Drosophila experiments with help from S.B. and E.C.C. B.K. conducted adult Drosophila experiments with help from S.B. E.C.C. and Z.L.N. E.C.C. conducted zebrafish experiments with help from C.M.Q. and S.B. S.S.M. purified proteins with supervision of J.C.L and N.C.R. E.C.C. and S.B. characterized the purified proteins. S.B., E.C.C, Z.L.N. and E.Y.I wrote the manuscript. Competing financial interests The authors declare no competing financial interests. HHS Public Access Author manuscript Nat Methods. Author manuscript; available in PMC 2016 March 01. Published in final edited form as: Nat Methods. 2015 September ; 12(9): 852–858. doi:10.1038/nmeth.3480. Author Manuscript Author Manuscript Author Manuscript Author Manuscript
-
Upload
khangminh22 -
Category
Documents
-
view
0 -
download
0
Transcript of HHS Public Access - eScholarship

Photoactivatable Genetically-Encoded Calcium Indicators for targeted neuronal imaging
Shai Berlin1,2, Elizabeth C. Carroll1, Zachary L. Newman1, Hitomi O. Okada1,†, Carson M. Quinn1, Benjamin Kallman1,2, Nathan C. Rockwell3, Shelley S. Martin3, J. Clark Lagarias3, and Ehud Y. Isacoff1,2,4,*
1 Department of Molecular and Cell Biology, University of California Berkeley, Berkeley, California, USA
2 Helen Wills Neuroscience Institute, University of California Berkeley, Berkeley, California, USA
3 Department of Molecular and Cellular Biology, University of California Davis, Davis, California, USA
4 Physical Bioscience Division, Lawrence Berkeley National Laboratory, Berkeley, California, USA
Abstract
Circuit mapping requires knowledge of both structural and functional connectivity between cells.
While optical tools have been made to assess either the morphology and projections of neurons or
their activity and functional connections, few probes integrate this information. We have
generated a family of photoactivatable Genetically Encoded Ca2+ Indicators (pa-GECIs) that
combines attributes of high-contrast photo-labeling with high-sensitivity Ca2+ detection in a
single-color, protein-sensor. We demonstrate the utility of pa-GECIs in cultured neurons and in
vivo in Drosophila and zebrafish larvae. We show how single cells can be selected out of dense
populations for Golgi-like visualization of morphology and high signal-to-noise measurements of
activity, synaptic transmission and connectivity. Our design strategy is readily transferrable to
other sensors based on circularly permutated GFP (cpGFP).
Users may view, print, copy, and download text and data-mine the content in such documents, for the purposes of academic research, subject always to the full Conditions of use:http://www.nature.com/authors/editorial_policies/license.html#terms* Correspondence to: [email protected], 510-642-9853.†Current address: Center for Innovation in Immunoregulative Technology and Therapeutics, Kyoto University, Yoshida-konoe, Sakyo-ku, Kyoto, Japan
Authors ContributionsS.B., E.C.C. and E.Y.I. conceived of the project. S.B. designed sequences and constructed clones with help from H.O.O. S.B. performed all experiments in cultured cells and patching experiments. Z.L.N. maintained transgenic Drosophila lines and conducted larval Drosophila experiments with help from S.B. and E.C.C. B.K. conducted adult Drosophila experiments with help from S.B. E.C.C. and Z.L.N. E.C.C. conducted zebrafish experiments with help from C.M.Q. and S.B. S.S.M. purified proteins with supervision of J.C.L and N.C.R. E.C.C. and S.B. characterized the purified proteins. S.B., E.C.C, Z.L.N. and E.Y.I wrote the manuscript.
Competing financial interestsThe authors declare no competing financial interests.
HHS Public AccessAuthor manuscriptNat Methods. Author manuscript; available in PMC 2016 March 01.
Published in final edited form as:Nat Methods. 2015 September ; 12(9): 852–858. doi:10.1038/nmeth.3480.
Author M
anuscriptA
uthor Manuscript
Author M
anuscriptA
uthor Manuscript
Introduction
An important part of understanding brain function lies in deciphering how individual
neurons integrate synaptic inputs to function together in circuits. This requires detailed
information of structural and functional connectivity. Since Golgi staining was first
discovered to fill sparsely distributed neurons, enabling morphological tracing and physical
connectivity to be assessed by contemporaries like Ramόn y Cajal1, structural mapping of
neuronal circuits has progressed with development of optical highlighting tools2-8. In
particular, photoactivatable fluorescent proteins (PA-FP) have provided a non-invasive way
to highlight individual cells in situ in live tissues, facilitating tracking fine neuronal
processes with a clarity that cannot be achieved with dense expression of standard FPs9-13.
Genetically Encoded Ca2+ Indicators (GECIs14-16) have, likewise, revolutionized modern
neurobiology by enabling non-invasive, rapid measurements of changes in intracellular
Ca2+, an important correlate of neuronal activity and excitatory synaptic transmission17,18. It
would be therefore a major benefit for mapping of neuronal circuits with a single protein
reporter with the dual capability of photo-activated morphological highlighting and
reporting Ca2+ activity, which could also be genetically targeted.
Here, we present a set of novel photoactivatable GECIs (pa-GECIs) that combine attributes
of high-contrast in situ highlighting with high-sensitivity Ca2+ detection. Out of the GECI
superfamily19-22, we focused on the commonly used GCaMP indicators because they have
single emission color, express efficiently in a large number of preparations and have high
sensitivity16,23-25. We arrive at a rational design in which mutations of a small set of key
residues in the FP domain confers high contrast photoactivation onto GCaMPs with
retention of Ca2+ sensitivity. Our pa-GECIs enable resolution of Ca2+ activity in processes
and dendritic spines in individual neurons, selected in situ in culture and in vivo. We show
this engineering strategy to be transferable among different GCaMP versions and related
GECIs, suggesting that this method will be applicable to future generations of GECIs and
potentially to other sensors, based on circularly permuted GFP20,26-29.
Results
Engineering photoactivatable GCaMPs
We designed a photoactivatable GECI based on the structure and function of the
photoactivatable green fluorescent protein (PA-GFP)11,30 (see Supplementary Notes).
Briefly, we rationally introduced mutations within the fluorescent protein of various
GCaMPs to yield superfolder photoactivatable GCaMPs (spa-GCaMPs) (Fig. 1a) that show
strong, near-UV-dependent photoactivation and large Ca2+ responses in several cell lines,
primary cultured hippocampal neurons and cultured glia (Supplementary Figs. 1-4 and Video 1). From in vitro measurements, we found that spa-GCaMP6f has an apparent Ca2+
affinity (Kd of ~650 nM) similar to the parent, GCaMP6f-WT23 (Supplementary Fig. 5).
spa-GCaMP6 highlights morphology and reports on Ca2+ activity
We assessed the functionality of the spa-GCaMP6 family in cultured hippocampal neurons.
Prior to photoactivation, neurons expressing spa-GCaMP6 variants exhibit very little
Berlin et al. Page 2
Nat Methods. Author manuscript; available in PMC 2016 March 01.
Author M
anuscriptA
uthor Manuscript
Author M
anuscriptA
uthor Manuscript
fluorescence when imaged with 488 nm laser excitation (Fig. 1b, Supplementary Videos 2-4). To identify cells that express spa-GCaMP, we used brief, low intensity illumination at
405 nm (5 μW, <0.64 μs dwell/pixel) that generated sufficient green emission for
visualization but, importantly, caused no persistent photoactivation (Supplementary Figure 6). Higher intensity 405 nm illumination (2.1 mW, 0.64-1 μs dwell/pixel) on selected soma
induced large and persistent increases in somatic fluorescence that spread throughout the
cell within minutes (Fig. 1b). As observed with other cytosolic photoactivatable FPs12,31,
spa-GCaMP6f highlighted neuronal processes by diffusion, with distant processes
displaying a short delay in filling (Fig. 1c, d). Repeated bouts of photoactivation caused no
deleterious effect on cell health, as measured by membrane potential or evoked currents
(Supplementary Figure 7a, b).
We next assessed the sensitivity with which spa-GCaMP6 variants detect action potentials
(APs) by combining loose-patching and confocal imaging. Electrical and fluorescent signals
simultaneously recorded from cultured neurons expressing either spa-GCaMP6f or spa-
GCaMP6s showed that fluorescence transients closely followed APs (Fig. 2a, b), with larger
ΔF/Fs in spa-GCaMP6s (Fig. 2c). Single APs were also detected by both spa-GCaMP6f and
spa-GCaMP6s (Fig. 2a-c), but with signals that were 4-5 fold smaller than the parent
GCaMPs, consistent with differences in basal brightness (Supplementary Figure 7c-e).
Somatic photoactivation in hippocampal neurons enabled APs to be detected continuously
for over 30 minutes, and importantly, continuous imaging with 488 nm for such extended
periods of time did not itself induce further photoactivation (Supplementary Figures 8a-c).
Dendritic processes filled with photoactivated spa-GCaMP6f displayed large Ca2+-transients
(Fig. 2d), substantially larger than the somatic responses; spa-GCaMP6s- soma: 1.84 ± 0.26
(±s.e.m., n = 12) vs. processes: 5.22 ± 0.95 ( n = 9) (Supplementary Figure 8b), as
previously reported for the parent GCaMPs32,33. spa-GCaMP6f filling of dendritic spines
was bright enough to visualize fine structure and provide a robust readout of Ca2+ activity in
spine heads (ΔF/F = 3.7 ± 1.5, n = 35) (Fig. 2e). As observed with conventional calcium
indicators34,35, spines with shorter (typically thicker) necks displayed a considerably higher
coupling to the shaft (i.e. higher cross correlation factor [CCF]) than mushroom-type spines
(neck length ~1-2.5 μm) or filopodia (>2.5 μm), which typically had longer, thinner necks
(Fig. 2f and Supplementary Video 5). Highlighted spines could be imaged at high speed
(line-scans at 1 kHz) with minimal signal loss or increase in baseline fluorescence
(Supplementary Figure 9a). Centripetal highlighting (from processes to soma) could also
be achieved by photoactivation in distal dendrites that filled the dendrite, secondary
dendrites and soma, where Ca2+ activity could then be imaged (Supplementary Figure 9b-d). Importantly, photoactivation in dendrites and dendritic spines did not affect spontaneous
synaptic transmission (Supplementary Figure 10).
Finally, we found that 2-photon (2P) photoactivation was efficiently achieved with
750-76036 nm excitation (Supplementary Figure 11a-c). Imaging at 940 nm37 did not
produce photoactivation in cultured neurons or astrocytes, as seen by the stable baseline
fluorescence (Supplementary Figs. 11c-f). Detecting activity in soma, but also in small
structures was also achievable using 2P imaging (following 2P photoactivation), such as
Berlin et al. Page 3
Nat Methods. Author manuscript; available in PMC 2016 March 01.
Author M
anuscriptA
uthor Manuscript
Author M
anuscriptA
uthor Manuscript
synaptic contacts (Supplementary Figure 11g-j). These results show that spa-GCaMPs are
photostable, efficiently photoactivated (1 or 2P) without affecting cell health, and
subsequently sensitive enough to report on neuronal activity for extended periods without
additional photoactivation by the imaging laser (either 1P or 2P imaging).
Mapping cellular and synaptic connectivity
Efforts to map functional connections and analyze dendritic computations are often
hampered by the difficulty of tracing morphology, and detecting activity, in individual
processes under dense GECI expression38. On the other hand, sparse expression limits the
likelihood of finding connected cells. To model these challenges, we transfected high
density dissociated neurons to easily find multiple spa-GCaMP6-expressing cells in the field
of view of a 20x objective. To note, aside using low intensity 405 nm illumination for cell
detection, because spa-GCaMP displays weak, albeit detectable, basal fluorescence (i.e.
prior photoactivation), this feature could also be used to detect highly expressing cells. Not
only did this enable us to identify cells, it also permitted the detection of neuronal activity
and connectivity among cells (Supplementary Figure 12).
To map synaptic connectivity, we photoactivated neurons sequentially, waiting 2-10 minutes
for each cell to fill before the next cell was photoactivated (Fig. 3a, b). In this way, we
traced the morphology of each cell independently and pseudo-colored it to identify sites of
apparent contact where synapses might be located (Fig. 3c). We then imaged Ca2+ activity
in the full field of view. APs, recorded in loose-patch or whole-cell mode, were consistently
followed by large Ca2+ transients in the soma and proximal axon, which then spread into
dendrites (Fig. 2 and Supplementary Figures 12c and 13f-g). These somatic Ca2+
transients in one cell were often associated with local Ca2+ transients at dendritic sites of
other highlighted cells at locations of contact with the axon of the first cell (Fig. 3c),
suggesting functional synapses. These were visualized as activity correlation maps, and
revealed functional connections with a wide range of correlation strengths, from very
reliable contacts with an almost 1:1 correspondence, and large contact area, to smaller
contacts with weak correlation (Fig. 3d, e and Supplementary Figure 13, but also additional
examples in Supplementary Figure 14 and Video 11). These experiments demonstrate the
potential of spa-GCaMP6 for functional circuit mapping in dense preparations.
spa-GCaMPs in Drosophila in vivo
We next tested functional highlighting in vivo in Drosophila melanogaster. We generated
multiple transgenic lines with spa-GCaMP6f or sspa-GCaMP6f inserted in various
chromosomes (Supplementary Figure 15) under the control of the Gal4-UAS expression
system39. First, we focused on the larval ventral nerve cord (VNC) of third instar larvae
expressing UAS-spa-GCaMP6f under the control of the motor neuron-specific Gal4, OK6-
Gal4 (ref. 40)(Fig. 4a). Illumination of the VNC (Fig. 4b), triggered robust photoactivation,
yielding bright fluorescently fills of somata and fine processes (ΔF/F= 8.5 ± 0.6, n = 27, 4
larvae, Supplementary Figure 15b), which diffused out of the region of photoactivation
(Supplementary Video 8). Spontaneous, widespread and directional Ca2+ activity was
frequently observed in the VNC, as observed when using conventional Ca2+ indicators41,42
(Supplementary Figure 15c). Antidromic stimulation of motor neuron axons evoked large
Berlin et al. Page 4
Nat Methods. Author manuscript; available in PMC 2016 March 01.
Author M
anuscriptA
uthor Manuscript
Author M
anuscriptA
uthor Manuscript

fluorescence signals by spa-GCaMP6f, that were larger in neuropil than in somata (Fig. 4c, d), with similar evoked activity patterns as observed for GCaMP6f-WT23 (Supplementary Figure 15d). The similarities between the patterns of activity further suggest that the
photoactivation process did not damage or change the activity of the neurons
(Supplementary Fig. 15d).
Backward highlighting from processes to soma was also possible with photoactivation in the
peripheral nerve (n = 5 animals). Photoactivation at the presynaptic motor neuron terminals
of the neuromuscular junction allowed detection of presynaptic Ca2+ transients following
motor nerve stimulation (Supplementary Figure 16a-c). Photoactivation at the axon
terminal did not induce a detectable morphological change, or affect muscle membrane
potential or resistance, EPSP or miniature EPSP amplitude, or miniature EPSP frequency
(Supplementary Figure 16d-i).
As in cultured cells, 2P photoactivation was also achieved using 2P illumination of single
motor neurons in the VNC (Supplementary Figure 17a). Ca2+ responses to electrical
stimulation could then be imaged by 1- or 2P excitation (at 940 nm) without further
photoactivation (Supplementary Figure 17b-e), indicating that pa-GCaMP is fully
compatible with 2P microscopy, and that neither 1P imaging of the pa-GECI at 488 nm, nor
2P imaging at 940 nm, causes substantial photoactivation (Supplementary Figures 11, 12 and 17).
To test spa-GCaMP6 in vivo in a light scattering, dense tissue, we turned to brain imaging of
transgenic adult flies. Flies were mounted and the head cuticle was opened to reveal the
brain43 (Fig. 4e; Supplementary Figure 18a). 2P photoactivation of spa-GCaMP6f in the
antennal lobe (AL) and mushroom body (MB) was efficient (Supplementary Figure 18b, c). To image Ca2+ activity in response to a physiological stimulus, we focused on the
gustatory nerve axons and terminals in the subesophogeal zone (SEZ) by crossing UAS-spa-
GCaMP6f flies with Gr5a-Gal4 flies to drive expression only in sweet sensory cells13. We
photoactivated the axon terminals at the SEZ with 2P illumination at 760 nm light (600-700
ms bouts at 5-7 mW/pixel), at depths of 25-50 μm and imaged with 488 nm (Fig. 4f). Application of sucrose to the proboscis, but not of the bitter-tastant denatonium, triggered
robust, progressively desensitizing Ca2+ transients in the highlighted axon terminals (Fig. 4f-h). Following more than 30 minutes, we observed that the fluorescence signal spread
from axon endings towards the somata in the proboscis that enabled tracing parts of these
neuronal projections (n = 3)(Supplementary Figure 18d). Ca2+ transients measured with
photoactivated spa-GCaMP6f were similar in shape and kinetics to those obtained with the
parent GCaMP, GCaMP6f-WT (Supplementary Figure 18e, f), although they were ~5-fold
smaller in amplitude (Supplementary Figure 18g). To further test the ability to confine
photoactivation to individual cells in a very dense preparation, we turned to image Kenyon
cells in the mushroom body of the Drosophila larva. To identify individual cells amongst the
hundreds of cells located at the Calyx44, we expressed a nuclear red marker (nls-mCherry),
which allowed us to target and photoactivate individual cells by 760 nm (Supplementary Figure 18h). Together, these observationsdemonstrate that spa-GCaMP6f can provide an in
vivo readout of neuronal activity as well as highlighting from optically selected cells in the
Berlin et al. Page 5
Nat Methods. Author manuscript; available in PMC 2016 March 01.
Author M
anuscriptA
uthor Manuscript
Author M
anuscriptA
uthor Manuscript

scattering medium of the young and adult Drosophila brain, and is compatible with two
color imaging.
pa-GCaMPs in zebrafish in vivo
To test in vivo functional highlighting in a model vertebrate, we generated a UAS-sspa-
GCaMP6f construct to inject into embryos of zebrafish expressing Gal4. In a motor neuron
selective Gal4 , 1P photoactivation of somata was sufficient to highlight axon terminals
located 180 ± 20 μm (n = 7) away within 10 minutes (Fig. 5a). At approximately 30 hours
post-fertilization (hpf), highlighted motor neurons showed large spontaneous fluorescent
activity (Fig. 5b), typical of previously described spontaneous activity45,46. In an enhancer
trap Gal4 line broadly targeting retinal cells, 2P photoactivation of single Müller glia cells
yielded an increase in basal fluorescence by 7-fold, which highlighted distal regions of the
cell within 5 minutes (Fig. 5c and Supplementary Figure 19a), and revealed hotspots of
fast Ca2+ activity (Supplementary Video 9), as well as fine structural features (Fig. 5d; Supplementary Video 10), similar to observations with conventional indicators47.
Photoactivated cells remained visible for long periods of time; for instance, muscle cells
photoactivated by 405 nm have 72 ± 8% change in basal fluorescence over 24 hr period (n =
3 animals). Photoactivation was also compatible with two-color in vivo imaging when UAS-
sspa-GCaMP6f was co-expressed with a membrane-bound version of the red fluorescent
protein KillerRed48: brief bouts of 405 nm light (rastering 2.1 mW, 1.8 s, 0.64 μs dwell/
pixel) sufficient to photoactivate sspa-GCaMP6f did not affect the fluorescence a red
fluorescent protein (Supplementary Figure 19b, c).
To test whether pa-GECIs would be suitable for chronic imaging in vivo, we photoactivated
sspa-GCaMP6f in retinal ganglion cell axons in the tectum at 5 days post-fertilization (dpf).
2P photoactivation at individual axon terminals (5 mW/pixel, 1 sec every 10 frames) yielded
robust local photoactivation in the illuminated area (~20-fold). Photoactivated molecules
spread to highlight additional branches in the same axonal arbor within 30 minutes (Fig. 5e).
The highlighting was long lasting enough to enable chronic imaging to track the dynamic
remodeling of immature axonal branches (Fig. 5f). The degree of branch tip remodeling
observed with sspa-GCaMP6f highlighting was comparable to control experiments made
with a sparsely expressed non-photoactivatable membrane bound GFP (Supplementary Figure 19d, e), suggesting that neither the expression of sspa-GCaMP6f nor 2P
photoactivation in the fine processes of the axons affect axonal arbor development.
Engineering other cpGFP-based Ca2+ indicators
There would be a major advantage if the strategy that worked to create photoactivatable
GCaMPs could be transferrable to other GECIs. We asked whether the green variant of the
GECO family, G-GECO1.2 (ref. 20), could also be made photoactivatable. G-GECO1.2 has
a high sequence homology with GCaMPs (>85%), and an even higher homology around the
chromophore (Supplementary Figure 20). We introduced the three mutations (Fig. 6a) that
made GCaMP photoactivatable along with an additional mutation in the cpGFP next to the
linker (Fig. 6a and Supplementary Figure 20c, d) to generate pa-G-GECO1.2*. pa-G-
GECO1.2* expressed robustly and showed strong photoactivation in cultured hippocampal
neurons (n = 8)(Fig. 6b). Once photoactivated, pa-G-GECO1.2* rapidly filled the cell's
Berlin et al. Page 6
Nat Methods. Author manuscript; available in PMC 2016 March 01.
Author M
anuscriptA
uthor Manuscript
Author M
anuscriptA
uthor Manuscript
processes, including dendrites and dendritic spines (Fig. 6b,c and Supplementary Figure 20a) and robustly reported on Ca2+ activity (Fig. 6d).
Discussion
We describe a generalizable strategy for generating photoactivatable GECIs by introducing
PA-GFP mutations into the conserved FP domain of GCaMPs. Two analogous approaches
have been reported. First, a photoactivated TNXL (PA-TNXL) was made using PA-GFP as
a fluorescence resonance energy transfer donor and a non-emitting fluorescent protein
acceptor49. While PA-TNXL exhibits small signals, among other limitations50, more
sensitive TNXL-based reporters, e.g., Twitch51, may make it possible to engineer a higher
sensitivity PA-TNXL. However, it remains to be seen whether photoactivation can be
transferred to Twitch, which structurally differs from PA-TNXL in many aspects. The
second approach consists of a photoconvertible GECI, GR-GECO, which shifts fluorescence
from green to red following near-UV illumination52. The sensitivity of the red form of GR-
GECO is considerably higher than with our pa-GECIs, allowing active cells to be readily
selected prior photoconversion. However, because GR-GECO occupies both green and red
channels, it may be difficult to use in combination with additional fluorescent proteins (see
Supplementary Discussion).
With pa-GECI, expressing cells could be identified, and Ca2+ activity detected, under weak
illumination that did not produce significant photoactivation (Supplementary Figures 5, 6, 8,
12). Expressing cells could then be targeted for photoactivation with one of four strategies:
i) Group targeting by illumination in a continuous region of interest (e.g. Fig. 4; Supplementary Figures 2, 6, 15 and 17), ii) Single cell photoactivation (e.g. Figs. 1, 5, 6;
Supplementary Figures 3, 8, 10-12, 14 and 17; Supplementary Videos 2-4), iii) Sequential
single cell photoactivation (e.g. Fig. 3; Supplementary Figures 12-14; Supplementary
Videos 2 and 7), and iv) Simultaneous photoactivation of individual cells (e.g.
Supplementary Figures 11, 15, 17 and Supplementary Video 6).
Once photoactivated, the pa-GECIs diffuse quickly and efficiently throughout the cell to
enable the mapping of fine cellular architecture and report on action potential firing or
synaptic transmission. Sequential photoactivation enables the morphology and projections of
a series of neurons to be reconstructed and this, then, permits a powerful form of functional
connectivity mapping using a straightforward cross-correlation analysis. The pa-GECIs can
be efficiently photoactivated and imaged with either 1- or 2P illumination on standard
microscopes and function in mammalian primary neuronal cell culture, as well as in vivo in
Drosophila and zebrafish. The pa-GECIs can function at multiple scales, from composite
activity of large groups of neurons to sensory-specific activity in a few projections in a
limited subpopulation of neurons. They are bright enough and sufficiently persistent to
enable highlighting and tracking of cellular morphology over time scales that are relevant
for development. Importantly, neither photoactivation nor imaging has an impact on the
electrical properties, synaptic transmission or morphology of the cells. Because the
absorbance of the pre-activated spa-GCaMPs peaks at ~400 nm and is negligible at
wavelengths >510 nm11 (Supplementary Figure 5d), it should be compatible with red-
Berlin et al. Page 7
Nat Methods. Author manuscript; available in PMC 2016 March 01.
Author M
anuscriptA
uthor Manuscript
Author M
anuscriptA
uthor Manuscript
shifted opsins, such as ReaChR53, Jaws54 or ChRimson55, which are optimally excited with
wavelengths >600 nm, which does not photoactivate spa-GCaMPs.
Directed evolution has proven powerful for optimizing the performance of other
photoactivatable proteins, but the set of mutations that work in one protein could not be
easily transferred to others56,57. In contrast, our rational design strategy was sufficient to
rapidly generate multiple single colored, monomeric pa-GECIs from some of the most
broadly used GECIs. We show that the three necessary and sufficient residues for efficient
photoactivation are transferable from GCaMPs to G-GECOs (Fig. 6), suggesting that it
could be extended to other GECIs, such as GCaMP7, 8, GCaMP-fast, and ultra-fast-
GCaMP16,23-25,58,59, as well as to future GECIs. The observation that different
combinations of mutations and truncations tested here are well tolerated by several cpGFP-
based Ca2+-indicators is of significance not only for Ca2+ sensors, but potentially also for
other cpGFP-based indicators, such as inositol-sensors28, diacylglycerol-sensors27,
glutamate sensors60 and voltage sensors29,61.
Online Methods
Molecular biology
GCaMP3 (plasmid #22692) and GCaMP6s, m and f (#40753, 4, 5, respectively), and G-
GECO1.2 (#32446) were purchased from Addgene. All GCaMP indicators are composed of
the Methionine-Glycine-Serine sequence, denoted MGS (without the Arginine62), directly
followed by an artificial poly Histidine-tag; denoted MGS-HISx6, a transcript stabilizing
sequence from gene 10 of phage T7, the Xpress epitope and the enterokinase cleavage
recognition sequence, denoted RSET62, a M13 fragment from myosin light chain kinase, a
circularly permutated GFP (cpGFP) and calmodulin (CaM)63. G-GECO is of similar design,
but does not contain the MGS and RSET domains64. Point mutations were done using
standard PCR reactions. For full list of primers see Table 1. Following the introduction of
the numerous mutations found in superfolder GFP onto GCaMP3 along with the 3 mutation
required for photoactivation (denoted by spa), the modified spa-cpGFP fragment was
incorporated into GCaMP6 (s, m and f) in two steps, rather than re-introducing all the
mutations anew in GCaMP6. To do so, we only amplified the cpGFP component from
GCaMP3, using the forward-5′-
GGTCGGCTGAGCTCACTCGAGAACGTCTATATCACCGCCGACAAGCAG and
reverse 5′- CTCTTCAGTCAGTTGGTCCGGCAGGTTGTATTCCAGCTTGTGCCC
primers, to generate a MEGA primer, which was directly used to amplify and introduce
cpSPA into GCaMP6. To generate shorter versions of the various spa-GCaMPs (sspa-
GCaMPs), we truncated the MGS and RSET domains. To generate pa-GECO1.0 and 1.2, we
used the same set of primers used for pa-GCaMP3. Knowingly, by using the GCAMP3
V115H primer-set, we introduced an additional mutation (M84K, G-GECO numbering) in
pa-GECO, denoted pa-GECO* (see Supplementary Note), because this incorporated
Lysine lines the hole of the barrel and was suspected to play an important role in solution
accessibility, thus fluorescence (see Supplementary Figure 10). pa-G-GECO1.2 (without
the K84 mutation) displayed similar properties as pa-G-GECO1.2*, albeit slightly smaller
Ca2+-responses. To insert the various clones into pRSETB (Kindly provided by R.Y. Tsien),
Berlin et al. Page 8
Nat Methods. Author manuscript; available in PMC 2016 March 01.
Author M
anuscriptA
uthor Manuscript
Author M
anuscriptA
uthor Manuscript
we introduced a BgLII restriction site before the starting codon upstream to the His(x6)-tag.
This was done to remove the entire RSET sequence found in the original vector and to allow
insertion of the modified RSET sequence found in the various GCaMPs (see list of primers
and Supplementary Figure 6).
Tissue culture and transfection
HEK293T and HeLa cells were purchased from the Molecular and Cell Biology Tissue
Culture Facility, University of California, Berkeley. All cells were tested for Mycoplasma
and authenticated by DDC Medical. Cells were maintained in DMEM with 5% FBS on
poly-L-lysine-coated 12 mm glass coverslips at 37°C, 5% CO2 and transiently co-
transfected with 0.5-1 μg of the various pa-GECIs plasmids using Lipofectamine 2000
(Invitrogen). Imaging was performed 10-12h after transfection. Dissociated postnatal rat
hippocampal neurons (P0-P5) were prepared and transfected as described previously65, kept
in 32-37°C, 5% CO2 and transiently transfected with 0.5-1 μg of cDNA encoding the
various pa-GECIs by the calcium phosphate method and imaged at 13-15 DIV.
Calcium Imaging
HEK293T, HeLa cells and cultured hippocampal neurons were imaged in a standard
extracellular solution containing (in mM): 138 NaCl, 1.5 KCl, 1.2 MgCl2, w/o 2.5 CaCl2
(unless indicated otherwise), 10 D-glucose, 10 Hepes, 1 EDTA (where indicated), pH 7.4.
Imaging was done using an upright confocal microscope (Zeiss, LSM-780/880) with a 20x
water-immersion objective, equipped with 405, 488, 561 nm lasers as well as a 690-1040 nm
tunable 2P laser, with a spectrally-resolved 32-pixel GaAsP detector array or BIG-1/2
GaAsP detectors. Brief pulses of 405 nm (rastering at 2.1 mW/pixel, dwell time ~0.64-1.23
μs/pixel) were used to illuminate selected regions. To detect cells prior photoactivation,
rapid, single line rastering was performed using low intensity 405 nm illumination (5 μW/
pixel) with a large increase in gain (30-45% increase). ΔF/F was calculated as fluorescence
at time t (Ft) subtracted from initial fluorescence at time 0 (Fi), divided by fluorescence at
time 0; ΔF/F=(Ft-Fi)/Fi. For mean ΔF/F, we averaged the fluorescence before
photoactivation to reflect Fi and average fluorescence following photoactivation to reflect Ft.
Titration curves were fitted with a Hill-type equation; f=axb/(cb+xb), with a=1.
Two-Photon imaging (940 nm) and photoactivation (760 nm) of Drosophila Kenyon cells in
vivo (see below) was done on a custom built 3i/Sutter In Vivo SLM system. Spatially
targeted photoactivation was performed using a 2P digital holography66,67, using a
commercial spatial light modulator system (Phasor; Intelligent Imaging Innovations, Inc.).
Holograms were calculated from user-defined ROIs based on images obtained from
fluorescence images of the preparation. NIR laser pulses encoding phase holograms were
projected onto the back aperture of a 20x/1.0NA water-dipping objective.
Electrophysiology
Patch clamp recordings used an Axopatch 200A amplifier. Recordings were carried out 2-3
days after transfection of 15 days in vitro (DIV) hippocampal neurons. When in whole cell
mode, cells were voltage-clamped at −60 mV or Current-clamped at I=0 (to assess resting
potential). Pipettes had resistances of 8-12 MΩ and were filled with a solution containing (in
Berlin et al. Page 9
Nat Methods. Author manuscript; available in PMC 2016 March 01.
Author M
anuscriptA
uthor Manuscript
Author M
anuscriptA
uthor Manuscript
mM): 140 K-gluconate, 10 NaCl, 2 MgATP, 1 CaCl(H2O)2, 5 EGTA, 2 MgCl2(H2O)6, 10
Hepes, pH 7.3. Loose patching was performed using a similar internal solution, but with
pipettes with lower resistance (3-5 MΩ). After partial seal was formed (30-50 MΩ),
recordings were done in current clamp mode (lowpass Bessel Filter at 10 kHz). Whereas
most neurons exhibited spontaneous activity that allowed investigating the fluorescence
correlates, in some cells we induced action potential firing by brief 0.5 ms voltage triggers
(voltage ZAP). For the dissociated rat hippocampal neurons, the extracellular recording
solution contained (in mM): 138 NaCl, 1.5 KCl, 1.2 MgCl2, 10 D-glucose, 2.5 CaCl2, 10
Hepes, pH 7.4 (NaOH). Electrophysiological data was recorded with pClamp and analyzed
by Clampfit 10.2 software.
Zebrafish
spa-GCaMP6f and sspa-GCaMP6f were cloned with a 10X repeat of an upstream activating
sequence (UAS) into a pT2KXIG-delta-IN vector containing Tol2 transposon recognition
sites 68 and SV40 polyA, using restriction enzyme sites AscI and MluI (inserted into the
vector) for ligation (see Supplementary Table 1). The resulting pT2-UAS-s/spa-GCaMP6f
constructs were diluted to 50 ng/uL with 0.25 ng Tol2 transposase and 0.05% Phenol Red
(Sigma) and injected into embryos at the 1-2 cell stage. Transiently expressing embryos
were raised in 0.05% PTU and embedded in 1.4% agarose without anesthetic for imaging.
Eggs were obtained by incrossing transgenic fish expressing Gal4 using the following lines:
motor neuron expression, Tg[mnx1-gal4]69 and Tg[s1020t-gal4;UAS-KillerRed]; Muller
glia, Tg[s1003t-gal4]; retinal ganglion cells, Tg[ath5-gal4]. Control experiments for retinal
ganglion cell axon dynamics were done by injecting an ath5-gap43-GFP plasmid at 50
ng/uL into AB embryos at the 2-4 cell stage.
Transgenic Drosophila melanogaster adults and larvae
spa-GCaMP6f and sspa-GCaMP6f DNA were cloned into the pUAST vector70. UAS-spa-
GCaMP6f and UAS-sspa-GCaMP6f transgenic flies were made with P-element
transformation (BestGene Inc., 2918 Rustic Bridge, Chino Hills CA) into the w1118
background (Table 2). Expression was driven in larval motor neurons using the OK6-
Gal471. Flies were raised on standard corn-meal and molasses media at 25°C. Third instar
larvae with the genotype w1118; OK6-Gal4;UAS-spa-GCaMP6f were selected for all
experiments unless otherwise noted. Larvae were dissected and imaged in HL3 solution
containing (in mM): 70 NaCl, 5 KCl, 0.45 CaCl2, 20 MgCl2, 10 NaHCO3, 5 trehalose, 115
sucrose, 5 HEPES, pH 7.2. For imaging evoked activity (orthodromic and antidromic) larvae
were imaged in HL3 solution as mentioned above, but with (in mM): 1.5 CaCl2 and 7 mM
Glutamate (to reduce muscle contraction and movements by desensitizing postsynaptic
glutamate receptors). Larvae were dissected by making a longitudinal dorsal incision,
removing all organs, and pinning the cuticle flat under high tension to prevent significant
movement upon body wall muscle contraction. The CNS and peripheral motor neurons were
left intact. Targeted photoactivation and recording of spontaneous activity was performed on
an upright confocal microscope (Zeiss LSM-780)(as described in Calcium Imaging) or on a
spinning disk confocal microscope (3i) equipped with a spatial light modulator (PhasorTM,
3i) to target 405 nm laser. Nerve stimulation was induced with a suction electrode filled with
HL3. Imaging of Kenyon cells was done on dissected third instar larvae bearing the
Berlin et al. Page 10
Nat Methods. Author manuscript; available in PMC 2016 March 01.
Author M
anuscriptA
uthor Manuscript
Author M
anuscriptA
uthor Manuscript
genotype: Genotype: w1118; UAS-mCherry-nls/UAS-spa-GCaMP6f; UAS-spa-GCaMP6f/
UAS-spa-GCaMP6f; OK107-Gal4/+, and imaged in the HL3 solution mentioned above, but
with 0.45 mM Ca2+.
For in vivo imaging of adult fly's SEZ, experiments were performed as described in 72 where
2 day old female flies were placed into a small slit on a plastic mount, such that the head
was separated from the rest of the body. Following immobilization of the head using nail-
polish, the head cuticle was dissected open, in ice-cold hemolymph-like (AHL) solution
devoid of Ca2+ and Mg2+, to reveal the brain. However, legs and proboscis were left intact.
Before imaging, the AHL solution was replaced with AHL containing Ca2+ and Mg2+.
Application of sucrose to the proboscis was performed as described in 73.
Purified proteins
His(X6)-tagged proteins were expressed and purified as previously described74, with several
modifications. Competent E. coli (T7 express Competent, Biolabs) were transformed with
different pRSET-spa/WT-GCaMP6 clones, pelleted and lysed. Lysate was clarified by
ultracentrifugation and proteins were isolated on a column. Eluted proteins (by imidazole
gradient) were dialyzed for 2 days in darkness. Initial dialysis was performed in 20 mM Tris
pH 7.8, 100 mM NaCl, 10% glycerol (v/v) and 1 mM EDTA to remove imidazole and
(most) residual Ca2+. This was followed by a second dialysis, but without EDTA.
Absorption and excitation emission spectrum measurements were done on a Cary
spectrophotometer and a Photon Technology International fluorimeter, respectively.
Calcium titrations were done using EGTA-buffered Ca2+ solutions (Calcium Calibration
Buffer Kit #1, Life Technologies). Purified GCaMP variants were diluted 1:100 in 30 mM
MOPS, pH 7.2, 100 mM KCl containing either 10 mM EGTA ([Ca2+]free= 0 μM) or 10 mM
CaEGTA ([Ca2+]free]= 39 μM free calcium). These were mixed in various ratios (as
specified by the kit) to give 11 different Calcium concentrations. Green GCaMP
fluorescence (excitation 485 nm, 5 nm bandpass; emission 510 nm, 5 nm bandpass) was
measured using a fluorimiter. Sigmoidal binding functions (f=axb/(cb+xb), with a=1), were
fitted to the calcium titration fluorescence data to extract the Kd for Ca2+ for each GCaMP
variant. pH titrations were carried out by diluting concentrated purified proteins into pH
buffers containing 50 mM citrate, 50 mM Tris, 50 mM glycine, 100 mM NaCl, and either 5
mM CaCl2 or 5 mM EDTA. pKa values were determined from the inflection point of a
sigmoid fit to 520 nm fluorescence versus pH.
Statistical analysis
Results are shown as mean ± SEM. Multiple group comparison was performed using one-
way analysis of variance (ANOVA) with post hoc Tukey test (all-pairwise analysis) and two
group comparisons were done using two-tailed t-test (SigmaPlot 2011). Correlations
between two independent parameters were examined using Spearman correlation. Asterisks
indicate statistically significant differences as follows: *, P < 0.05; **, P < 0.01; ***, P <
0.001.
Berlin et al. Page 11
Nat Methods. Author manuscript; available in PMC 2016 March 01.
Author M
anuscriptA
uthor Manuscript
Author M
anuscriptA
uthor Manuscript

Correlation maps
Movies were corrected for exponential bleach (if any) and registered to correct for x-y drift.
ROIs were selected semi-automatically using the Analyze Particles plug-in in ImageJ. Zero-
lag correlations were computed on ΔF/F traces in Matlab.
Structure rendering
Protein structures were rendered using Pymol (PyMOL™, 2010 Schrodinger, LLC.). Neural
tracing was performed using Imaris 8 (Bitplane) and ImageJ (NIH).
Animal Usage
All animal experiments were done under oversight by the university of California
institutional review board (Animal Care and Use Committee).
Supplementary Material
Refer to Web version on PubMed Central for supplementary material.
Acknowledgments
We thank C. Stanley and Z. Fu for help with molecular biology, H. Aaron for technical help with microscopy and C. Chang for use of fluorimeter. We also want to thank R.Y. Tsien (University of California San Diego) for the pRSETB vector, J.L. Bruses (University of Kansas) for the generous gift of the mnx1-Gal4 construct and D. Friedmann for generating mnx1-Gal4 transgenic zebrafish line. The work was supported by National Science Foundation Graduate Research Fellowship 1106400 (Z.L.N), National Science Foundation MRI grant 1041078 (E.Y.I), NIHGMS R01 GM068552 (J.C.L.) and National Institutes of Health Nanomedicine Development Center for the Optical Control of Biological Function 2PN2EY01824 (E.Y.I).
References
1. Cajal SR. Estructura de los centros nerviosos de las aves. Revista Trimestral de Histología Normal y Patológica. 1888; 1:1–10.
2. Chung K, Deisseroth K. CLARITY for mapping the nervous system. Nat. Methods. 2013; 10:508–13. [PubMed: 23722210]
3. Lichtman JW, Livet J, Sanes JR. A technicolour approach to the connectome. Nat. Rev. Neurosci. 2008; 9:417–22. [PubMed: 18446160]
4. Livet J, et al. Transgenic strategies for combinatorial expression of fluorescent proteins in the nervous system. Nature. 2007; 450:56–62. [PubMed: 17972876]
5. Wickersham IR, Finke S, Conzelmann KK, Callaway EM. Retrograde neuronal tracing with a deletion-mutant rabies virus. Nat. Methods. 2007; 4:47–9. [PubMed: 17179932]
6. Alivisatos AP, et al. Nanotools for neuroscience and brain activity mapping. ACS Nano. 2013; 7:1850–66. [PubMed: 23514423]
7. Underwood E. New Tools Light Up the Intricacies of the Brain. Science. 2013; 342:917–918. [PubMed: 24264967]
8. Oh SW, et al. A mesoscale connectome of the mouse brain. Nature. 2014
9. Lien AD, Scanziani M. In vivo Labeling of Constellations of Functionally Identified Neurons for Targeted in vitro Recordings. Front. Neural Circuits. 2011; 5:16. [PubMed: 22144948]
10. Peter M, et al. Transgenic mouse models enabling photolabeling of individual neurons in vivo. PLoS One. 2013; 8:e62132. [PubMed: 23626779]
11. Patterson GH, Lippincott-Schwartz J. A photoactivatable GFP for selective photolabeling of proteins and cells. Science. 2002; 297:1873–7. [PubMed: 12228718]
Berlin et al. Page 12
Nat Methods. Author manuscript; available in PMC 2016 March 01.
Author M
anuscriptA
uthor Manuscript
Author M
anuscriptA
uthor Manuscript
12. Ruta V, et al. A dimorphic pheromone circuit in Drosophila from sensory input to descending output. Nature. 2010; 468:686–90. [PubMed: 21124455]
13. Wang Z, Singhvi A, Kong P, Scott K. Taste representations in the Drosophila brain. Cell. 2004; 117:981–91. [PubMed: 15210117]
14. Miyawaki A, et al. Fluorescent indicators for Ca2+ based on green fluorescent proteins and calmodulin. Nature. 1997; 388:882–7. [PubMed: 9278050]
15. Tian L, Looger LL. Genetically encoded fluorescent sensors for studying healthy and diseased nervous systems. Drug Discov. Today Dis. Models. 2008; 5:27–35. [PubMed: 19461949]
16. Nakai J, Ohkura M, Imoto K. A high signal-to-noise Ca2+ probe composed of a single green fluorescent protein. Nat. Biotechnol. 2001; 19:137–41. [PubMed: 11175727]
17. Berridge MJ, Lipp P, Bootman MD. The versatility and universality of calcium signalling. Nat. Rev. Mol. Cell Biol. 2000; 1:11–21. [PubMed: 11413485]
18. Zucker RS. Calcium- and activity-dependent synaptic plasticity. Curr. Opin. Neurobiol. 1999; 9:305–13. [PubMed: 10395573]
19. McCombs JE, Palmer AE. Measuring calcium dynamics in living cells with genetically encodable calcium indicators. Methods. 2008; 46:152–9. [PubMed: 18848629]
20. Zhao Y, et al. An expanded palette of genetically encoded Ca2+ indicators. Science. 2011; 333:1888–91. [PubMed: 21903779]
21. Tian L, Hires SA, Looger LL. Imaging neuronal activity with genetically encoded calcium indicators. Cold Spring Harb. Protoc. 2012; 2012:647–56. [PubMed: 22661439]
22. Whitaker M. Genetically encoded probes for measurement of intracellular calcium. Methods Cell Biol. 2010; 99:153–82. [PubMed: 21035686]
23. Chen TW, et al. Ultrasensitive fluorescent proteins for imaging neuronal activity. Nature. 2013; 499:295–300. [PubMed: 23868258]
24. Tian L, et al. Imaging neural activity in worms, flies and mice with improved GCaMP calcium indicators. Nat. Methods. 2009; 6:875–81. [PubMed: 19898485]
25. Chen Y, et al. Structural insight into enhanced calcium indicator GCaMP3 and GCaMPJ to promote further improvement. Protein Cell. 2013; 4:299–309. [PubMed: 23549615]
26. Wu J, et al. Improved orange and red Ca2+ indicators and photophysical considerations for optogenetic applications. ACS Chem. Neurosci. 2013; 4:963–72. [PubMed: 23452507]
27. Tewson P, et al. Simultaneous detection of Ca2+ and diacylglycerol signaling in living cells. PLoS One. 2012; 7:e42791. [PubMed: 22912738]
28. Sakaguchi R, et al. A single circularly permuted GFP sensor for inositol-1,3,4,5-tetrakisphosphate based on a split PH domain. Bioorg. Med. Chem. 2009; 17:7381–6. [PubMed: 19762247]
29. St-Pierre F, et al. High-fidelity optical reporting of neuronal electrical activity with an ultrafast fluorescent voltage sensor. Nat. Neurosci. 2014; 17:884–9. [PubMed: 24755780]
30. Henderson JN, et al. Structure and mechanism of the photoactivatable green fluorescent protein. J. Am. Chem. Soc. 2009; 131:4176–7. [PubMed: 19278226]
31. Ruthazer ES, et al. Bulk electroporation of retinal ganglion cells in live Xenopus tadpoles. Cold Spring Harb. Protoc. 2013; 2013:771–5. [PubMed: 23906915]
32. Yamada Y, Mikoshiba K. Quantitative comparison of novel GCaMP-type genetically encoded Ca(2+) indicators in mammalian neurons. Front. Cell. Neurosci. 2012; 6:41. [PubMed: 23060748]
33. Wu J, et al. A long Stokes shift red fluorescent Ca2+ indicator protein for two-photon and ratiometric imaging. Nat. Commun. 2014; 5:5262. [PubMed: 25358432]
34. Noguchi J, Matsuzaki M, Ellis-Davies GC, Kasai H. Spine-neck geometry determines NMDA receptor-dependent Ca2+ signaling in dendrites. Neuron. 2005; 46:609–22. [PubMed: 15944129]
35. Araya R, Jiang J, Eisenthal KB, Yuste R. The spine neck filters membrane potentials. Proc. Natl. Acad. Sci. U S A. 2006; 103:17961–6. [PubMed: 17093040]
36. Schneider M, Barozzi S, Testa I, Faretta M, Diaspro A. Two-photon activation and excitation properties of PA-GFP in the 720-920-nm region. Biophys. J. 2005; 89:1346–52. [PubMed: 15908572]
37. Drobizhev M, Makarov NS, Tillo SE, Hughes TE, Rebane A. Two-photon absorption properties of fluorescent proteins. Nat. Methods. 2011; 8:393–9. [PubMed: 21527931]
Berlin et al. Page 13
Nat Methods. Author manuscript; available in PMC 2016 March 01.
Author M
anuscriptA
uthor Manuscript
Author M
anuscriptA
uthor Manuscript

38. Branco T, Staras K, Darcy KJ, Goda Y. Local dendritic activity sets release probability at hippocampal synapses. Neuron. 2008; 59:475–85. [PubMed: 18701072]
39. Brand AH, Perrimon N. Targeted gene expression as a means of altering cell fates and generating dominant phenotypes. Development. 1993; 118:401–15. [PubMed: 8223268]
40. Aberle H, et al. wishful thinking encodes a BMP type II receptor that regulates synaptic growth in Drosophila. Neuron. 2002; 33:545–58. [PubMed: 11856529]
41. Fox LE, Soll DR, Wu CF. Coordination and modulation of locomotion pattern generators in Drosophila larvae: effects of altered biogenic amine levels by the tyramine beta hydroxlyase mutation. J. Neurosci. 2006; 26:1486–98. [PubMed: 16452672]
42. Kohsaka H, Okusawa S, Itakura Y, Fushiki A, Nose A. Development of larval motor circuits in Drosophila. Dev. Growth. Differ. 2012; 54:408–19. [PubMed: 22524610]
43. Marella S, et al. Imaging taste responses in the fly brain reveals a functional map of taste category and behavior. Neuron. 2006; 49:285–95. [PubMed: 16423701]
44. Kurusu M, et al. Genetic control of development of the mushroom bodies, the associative learning centers in the Drosophila brain, by the eyeless, twin of eyeless, and Dachshund genes. Proc. Natl. Acad. Sci. U S A. 2000; 97:2140–4. [PubMed: 10681433]
45. Saint-Amant L, Drapeau P. Motoneuron activity patterns related to the earliest behavior of the zebrafish embryo. J. Neurosci. 2000; 20:3964–72. [PubMed: 10818131]
46. Muto A, Kawakami K. Imaging functional neural circuits in zebrafish with a new GCaMP and the Gal4FF-UAS system. Commun. Integr. Biol. 2011; 4:566–8. [PubMed: 22046464]
47. Shigetomi E, Kracun S, Sofroniew MV, Khakh BS. A genetically targeted optical sensor to monitor calcium signals in astrocyte processes. Nat. Neurosci. 2010; 13:759–66. [PubMed: 20495558]
48. Bulina ME, et al. A genetically encoded photosensitizer. Nat. Biotechnol. 2006; 24:95–9. [PubMed: 16369538]
49. Matsuda T, Horikawa K, Saito K, Nagai T. Highlighted Ca2+ imaging with a genetically encoded 'caged' indicator. Sci. Rep. 2013; 3:1398. [PubMed: 23474844]
50. Mank M, et al. A FRET-based calcium biosensor with fast signal kinetics and high fluorescence change. Biophys. J. 2006; 90:1790–6. [PubMed: 16339891]
51. Thestrup T, et al. Optimized ratiometric calcium sensors for functional in vivo imaging of neurons and T lymphocytes. Nat. Methods. 2014; 11:175–82. [PubMed: 24390440]
52. Hoi H, Matsuda T, Nagai T, Campbell RE. Highlightable Ca2+ indicators for live cell imaging. J. Am. Chem. Soc. 2013; 135:46–9. [PubMed: 23256581]
53. Lin JY, Knutsen PM, Muller A, Kleinfeld D, Tsien RY. ReaChR: a red-shifted variant of channelrhodopsin enables deep transcranial optogenetic excitation. Nat. Neurosci. 2013; 16:1499–508. [PubMed: 23995068]
54. Chuong AS, et al. Noninvasive optical inhibition with a red-shifted microbial rhodopsin. Nat. Neurosci. 2014; 17:1123–9. [PubMed: 24997763]
55. Klapoetke NC, et al. Independent optical excitation of distinct neural populations. Nat. Methods. 2014; 11:338–46. [PubMed: 24509633]
56. Subach FV, et al. Photoactivatable mCherry for high-resolution two-color fluorescence microscopy. Nat. Methods. 2009; 6:153–9. [PubMed: 19169259]
57. Subach FV, Patterson GH, Renz M, Lippincott-Schwartz J, Verkhusha VV. Bright monomeric photoactivatable red fluorescent protein for two-color super-resolution sptPALM of live cells. J. Am. Chem. Soc. 2010; 132:6481–91. [PubMed: 20394363]
58. Muto A, Ohkura M, Abe G, Nakai J, Kawakami K. Real-time visualization of neuronal activity during perception. Curr. Biol. 2013; 23:307–11. [PubMed: 23375894]
59. Nordine Helassa EE, Carter Tom, Bradley Jonathan, Ogden David, Török Katalin. Ultrafast Genetically Encoded Calcium Indicators for visualizing Calcium Flux and Action Potentials. Biophysical Society Meeting. 2014
60. Marvin JS, et al. An optimized fluorescent probe for visualizing glutamate neurotransmission. Nat. Methods. 2013; 10:162–70. [PubMed: 23314171]
Berlin et al. Page 14
Nat Methods. Author manuscript; available in PMC 2016 March 01.
Author M
anuscriptA
uthor Manuscript
Author M
anuscriptA
uthor Manuscript
61. Baker BJ, et al. Genetically encoded fluorescent sensors of membrane potential. Brain Cell Biol. 2008; 36:53–67. [PubMed: 18679801]
62. Tian L, et al. Imaging neural activity in worms, flies and mice with improved GCaMP calcium indicators. Nat. Methods. 2009; 6:875–81. [PubMed: 19898485]
63. Nakai J, Ohkura M, Imoto K. A high signal-to-noise Ca2+ probe composed of a single green fluorescent protein. Nat. Biotechnol. 2001; 19:137–41. [PubMed: 11175727]
64. Zhao Y, et al. An expanded palette of genetically encoded Ca2+ indicators. Science. 2011; 333:1888–91. [PubMed: 21903779]
65. Szobota S, et al. Remote control of neuronal activity with a light-gated glutamate receptor. Neuron. 2007; 54:535–45. [PubMed: 17521567]
66. Oron D, Papagiakoumou E, Anselmi F, Emiliani V. Two-photon optogenetics. Prog. Brain Res. 2012; 196:119–43. [PubMed: 22341324]
67. Carroll EC, et al. Two-photon brightness of azobenzene photoswitches designed for glutamate receptor optogenetics. Proc. Natl. Acad. Sci. U S A. 2015; 112:E776–85. [PubMed: 25653339]
68. Suster ML, Kikuta H, Urasaki A, Asakawa K, Kawakami K. Transgenesis in zebrafish with the tol2 transposon system. Methods Mol. Biol. 2009; 561:41–63. [PubMed: 19504063]
69. Zelenchuk TA, Bruses JL. In vivo labeling of zebrafish motor neurons using an mnx1 enhancer and Gal4/UAS. Genesis. 2011; 49:546–54. [PubMed: 21538811]
70. Brand AH, Perrimon N. Targeted gene expression as a means of altering cell fates and generating dominant phenotypes. Development. 1993; 118:401–15. [PubMed: 8223268]
71. Aberle H, et al. wishful thinking encodes a BMP type II receptor that regulates synaptic growth in Drosophila. Neuron. 2002; 33:545–58. [PubMed: 11856529]
72. Marella S, Mann K, Scott K. Dopaminergic Modulation of Sucrose Acceptance Behavior in Drosophila. Neuron. 2012; 73:941–950. [PubMed: 22405204]
73. Marella S, et al. Imaging taste responses in the fly brain reveals a functional map of taste category and behavior. Neuron. 2006; 49:285–95. [PubMed: 16423701]
74. Hirose M, et al. Structure of the human-heart fatty-acid-binding protein 3 in complex with the fluorescent probe 1-anilinonaphthalene-8-sulphonic acid. J Synchrotron Radiat. 2013; 20:923–8. [PubMed: 24121341]
Berlin et al. Page 15
Nat Methods. Author manuscript; available in PMC 2016 March 01.
Author M
anuscriptA
uthor Manuscript
Author M
anuscriptA
uthor Manuscript
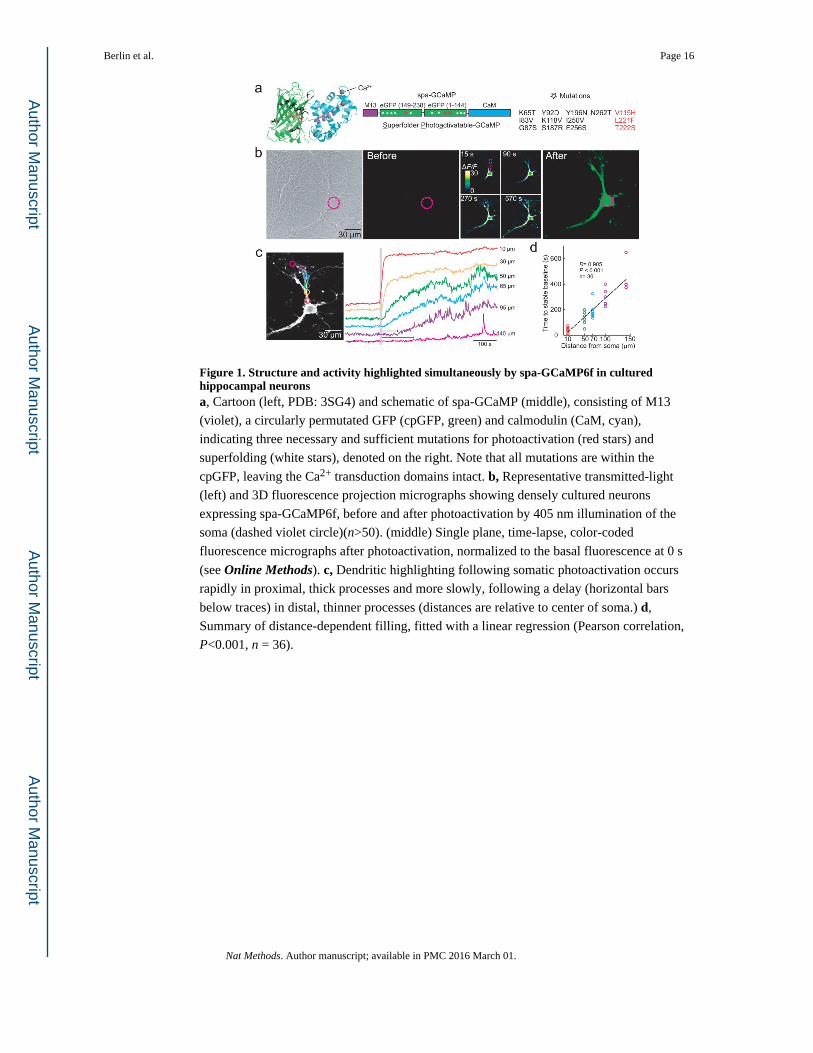
Figure 1. Structure and activity highlighted simultaneously by spa-GCaMP6f in cultured hippocampal neuronsa, Cartoon (left, PDB: 3SG4) and schematic of spa-GCaMP (middle), consisting of M13
(violet), a circularly permutated GFP (cpGFP, green) and calmodulin (CaM, cyan),
indicating three necessary and sufficient mutations for photoactivation (red stars) and
superfolding (white stars), denoted on the right. Note that all mutations are within the
cpGFP, leaving the Ca2+ transduction domains intact. b, Representative transmitted-light
(left) and 3D fluorescence projection micrographs showing densely cultured neurons
expressing spa-GCaMP6f, before and after photoactivation by 405 nm illumination of the
soma (dashed violet circle)(n>50). (middle) Single plane, time-lapse, color-coded
fluorescence micrographs after photoactivation, normalized to the basal fluorescence at 0 s
(see Online Methods). c, Dendritic highlighting following somatic photoactivation occurs
rapidly in proximal, thick processes and more slowly, following a delay (horizontal bars
below traces) in distal, thinner processes (distances are relative to center of soma.) d,
Summary of distance-dependent filling, fitted with a linear regression (Pearson correlation,
P<0.001, n = 36).
Berlin et al. Page 16
Nat Methods. Author manuscript; available in PMC 2016 March 01.
Author M
anuscriptA
uthor Manuscript
Author M
anuscriptA
uthor Manuscript
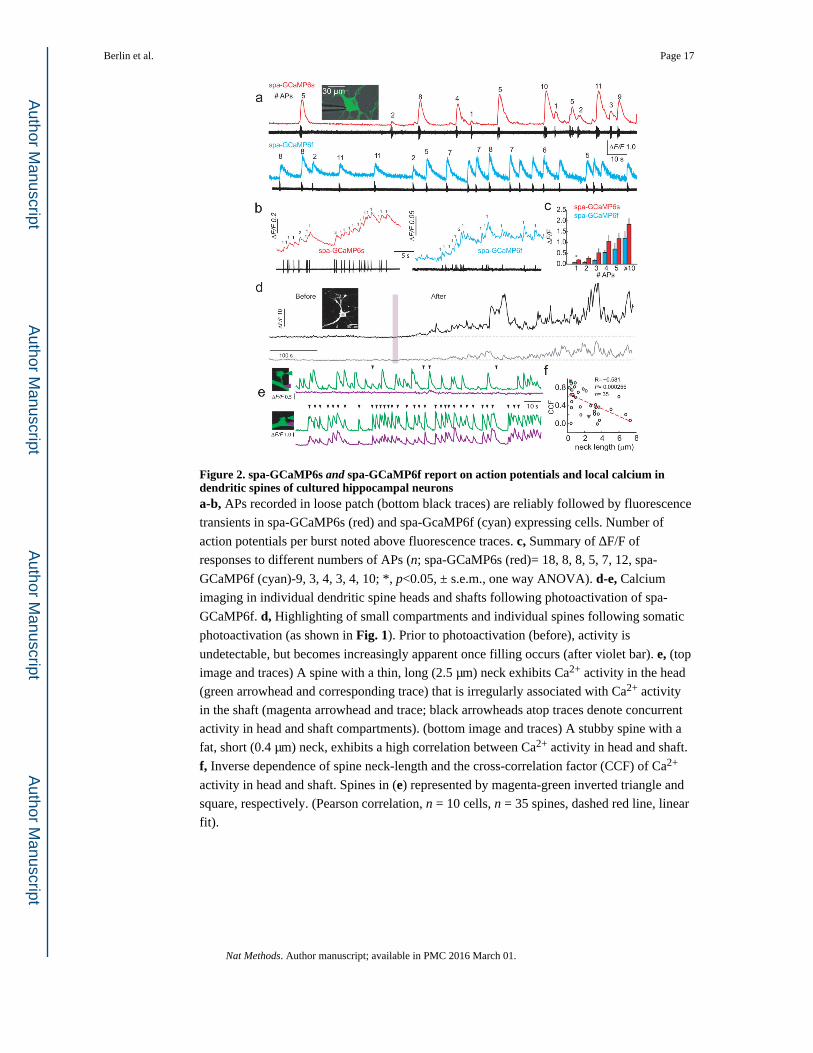
Figure 2. spa-GCaMP6s and spa-GCaMP6f report on action potentials and local calcium in dendritic spines of cultured hippocampal neuronsa-b, APs recorded in loose patch (bottom black traces) are reliably followed by fluorescence
transients in spa-GCaMP6s (red) and spa-GcaMP6f (cyan) expressing cells. Number of
action potentials per burst noted above fluorescence traces. c, Summary of ΔF/F of
responses to different numbers of APs (n; spa-GCaMP6s (red)= 18, 8, 8, 5, 7, 12, spa-
GCaMP6f (cyan)-9, 3, 4, 3, 4, 10; *, p<0.05, ± s.e.m., one way ANOVA). d-e, Calcium
imaging in individual dendritic spine heads and shafts following photoactivation of spa-
GCaMP6f. d, Highlighting of small compartments and individual spines following somatic
photoactivation (as shown in Fig. 1). Prior to photoactivation (before), activity is
undetectable, but becomes increasingly apparent once filling occurs (after violet bar). e, (top
image and traces) A spine with a thin, long (2.5 μm) neck exhibits Ca2+ activity in the head
(green arrowhead and corresponding trace) that is irregularly associated with Ca2+ activity
in the shaft (magenta arrowhead and trace; black arrowheads atop traces denote concurrent
activity in head and shaft compartments). (bottom image and traces) A stubby spine with a
fat, short (0.4 μm) neck, exhibits a high correlation between Ca2+ activity in head and shaft.
f, Inverse dependence of spine neck-length and the cross-correlation factor (CCF) of Ca2+
activity in head and shaft. Spines in (e) represented by magenta-green inverted triangle and
square, respectively. (Pearson correlation, n = 10 cells, n = 35 spines, dashed red line, linear
fit).
Berlin et al. Page 17
Nat Methods. Author manuscript; available in PMC 2016 March 01.
Author M
anuscriptA
uthor Manuscript
Author M
anuscriptA
uthor Manuscript

Figure 3. Functional highlighting of functionally connected cultured hippocampal neuronsa, Time lapse images of sequential somatic photoactivation (violet circle) of three closely
situated sspa-GCaMP6f expressing neurons (1, 2 and 3) with ~2-5 minutes apart between
photoactivation (n = 7). b, 3D projection image showing filling of the three neurons 7 min
after photoactivation of cell #3. c, Sequential photoactivation enables neurons 1-3 to be
traced with high fidelity, then color-coded to help identify crossing points between processes
(white arrowheads) that could form potential synaptic contacts. d, (top) Black and white
image (as shown in c) overlaid with a cross-correlation map (see Online Methods). Selected
points of contact shown in c (arrowheads) are underscored by dashed circles and roman
numerals. (bottom) A high power image of a potential contact between the long and thin
axon-like process of neuron #1 (magenta) and a thick dendritic segment of neuron #2
(region “i”, green), spanning over 10 μm. e, Time resolved fluorescent traces of Ca2+
activity (color coded based on the correlation map shown in d as well as enumerated with
roman numerals as shown in d) for the different points of contact (size of region on
correlation map reflects the region of interest from which fluorescence was collected. Hot
colors (yellow to red) indicate strong correlated activity with neuron #1 (top, dark red trace),
whereas cold colors (light green to blue) indicate less of a correlation. Bottom three traces
depict regions (arrowheads in d) outside the selected regions in neuron #2.
Berlin et al. Page 18
Nat Methods. Author manuscript; available in PMC 2016 March 01.
Author M
anuscriptA
uthor Manuscript
Author M
anuscriptA
uthor Manuscript
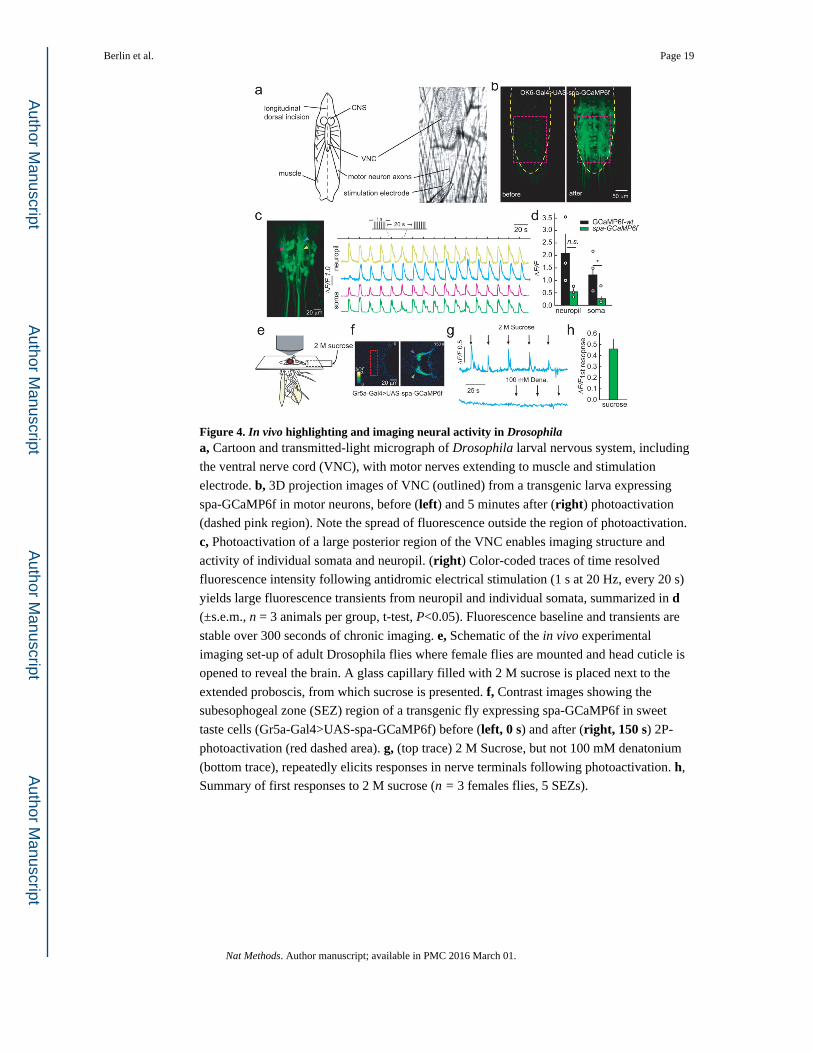
Figure 4. In vivo highlighting and imaging neural activity in Drosophilaa, Cartoon and transmitted-light micrograph of Drosophila larval nervous system, including
the ventral nerve cord (VNC), with motor nerves extending to muscle and stimulation
electrode. b, 3D projection images of VNC (outlined) from a transgenic larva expressing
spa-GCaMP6f in motor neurons, before (left) and 5 minutes after (right) photoactivation
(dashed pink region). Note the spread of fluorescence outside the region of photoactivation.
c, Photoactivation of a large posterior region of the VNC enables imaging structure and
activity of individual somata and neuropil. (right) Color-coded traces of time resolved
fluorescence intensity following antidromic electrical stimulation (1 s at 20 Hz, every 20 s)
yields large fluorescence transients from neuropil and individual somata, summarized in d (±s.e.m., n = 3 animals per group, t-test, P<0.05). Fluorescence baseline and transients are
stable over 300 seconds of chronic imaging. e, Schematic of the in vivo experimental
imaging set-up of adult Drosophila flies where female flies are mounted and head cuticle is
opened to reveal the brain. A glass capillary filled with 2 M sucrose is placed next to the
extended proboscis, from which sucrose is presented. f, Contrast images showing the
subesophogeal zone (SEZ) region of a transgenic fly expressing spa-GCaMP6f in sweet
taste cells (Gr5a-Gal4>UAS-spa-GCaMP6f) before (left, 0 s) and after (right, 150 s) 2P-
photoactivation (red dashed area). g, (top trace) 2 M Sucrose, but not 100 mM denatonium
(bottom trace), repeatedly elicits responses in nerve terminals following photoactivation. h,
Summary of first responses to 2 M sucrose (n = 3 females flies, 5 SEZs).
Berlin et al. Page 19
Nat Methods. Author manuscript; available in PMC 2016 March 01.
Author M
anuscriptA
uthor Manuscript
Author M
anuscriptA
uthor Manuscript
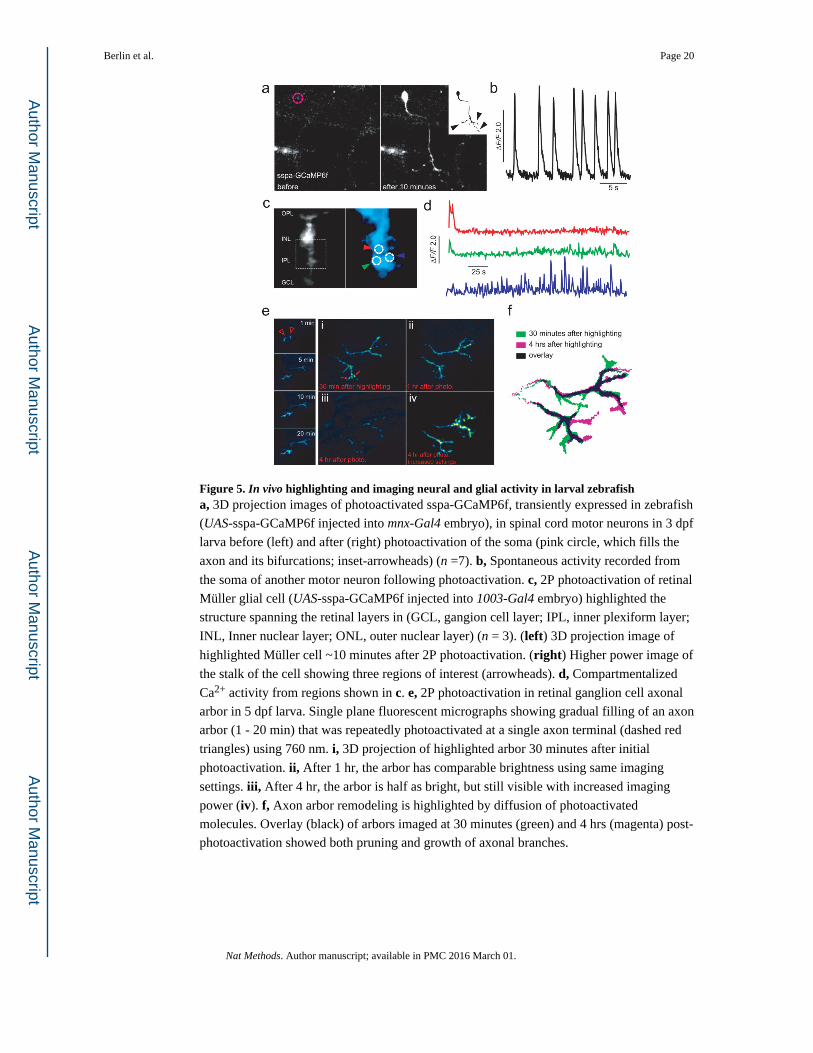
Figure 5. In vivo highlighting and imaging neural and glial activity in larval zebrafisha, 3D projection images of photoactivated sspa-GCaMP6f, transiently expressed in zebrafish
(UAS-sspa-GCaMP6f injected into mnx-Gal4 embryo), in spinal cord motor neurons in 3 dpf
larva before (left) and after (right) photoactivation of the soma (pink circle, which fills the
axon and its bifurcations; inset-arrowheads) (n =7). b, Spontaneous activity recorded from
the soma of another motor neuron following photoactivation. c, 2P photoactivation of retinal
Müller glial cell (UAS-sspa-GCaMP6f injected into 1003-Gal4 embryo) highlighted the
structure spanning the retinal layers in (GCL, gangion cell layer; IPL, inner plexiform layer;
INL, Inner nuclear layer; ONL, outer nuclear layer) (n = 3). (left) 3D projection image of
highlighted Müller cell ~10 minutes after 2P photoactivation. (right) Higher power image of
the stalk of the cell showing three regions of interest (arrowheads). d, Compartmentalized
Ca2+ activity from regions shown in c. e, 2P photoactivation in retinal ganglion cell axonal
arbor in 5 dpf larva. Single plane fluorescent micrographs showing gradual filling of an axon
arbor (1 - 20 min) that was repeatedly photoactivated at a single axon terminal (dashed red
triangles) using 760 nm. i, 3D projection of highlighted arbor 30 minutes after initial
photoactivation. ii, After 1 hr, the arbor has comparable brightness using same imaging
settings. iii, After 4 hr, the arbor is half as bright, but still visible with increased imaging
power (iv). f, Axon arbor remodeling is highlighted by diffusion of photoactivated
molecules. Overlay (black) of arbors imaged at 30 minutes (green) and 4 hrs (magenta) post-
photoactivation showed both pruning and growth of axonal branches.
Berlin et al. Page 20
Nat Methods. Author manuscript; available in PMC 2016 March 01.
Author M
anuscriptA
uthor Manuscript
Author M
anuscriptA
uthor Manuscript
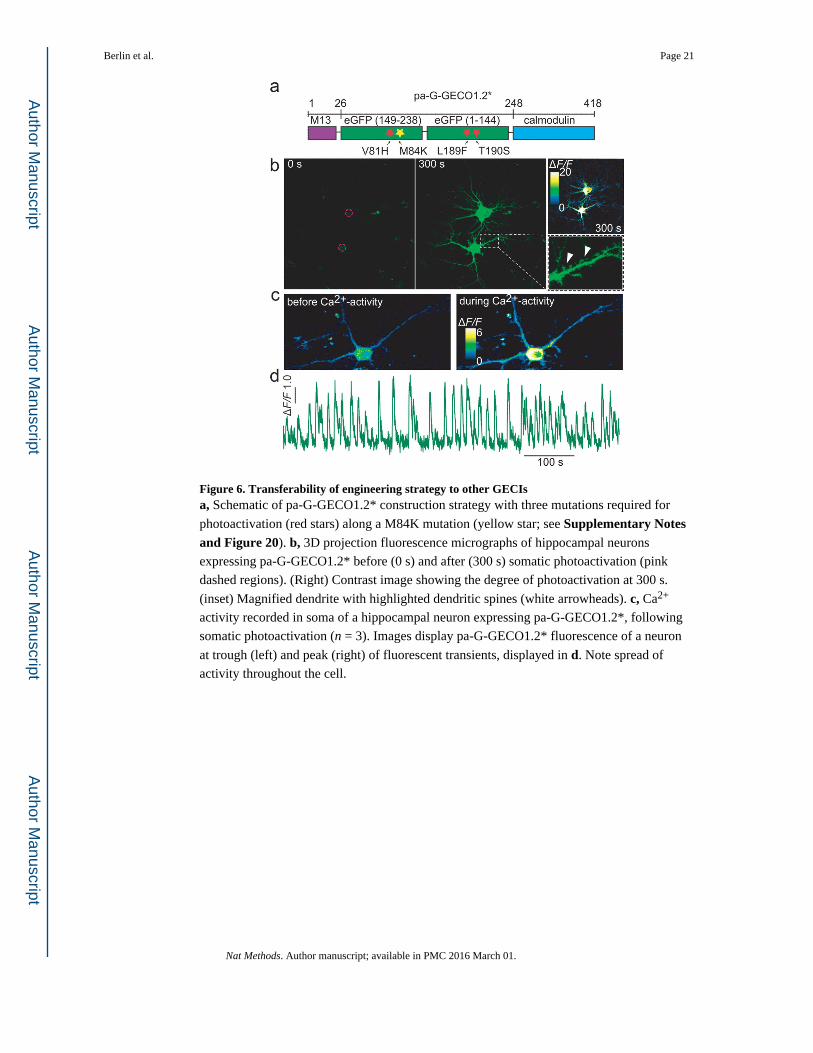
Figure 6. Transferability of engineering strategy to other GECIsa, Schematic of pa-G-GECO1.2* construction strategy with three mutations required for
photoactivation (red stars) along a M84K mutation (yellow star; see Supplementary Notes and Figure 20). b, 3D projection fluorescence micrographs of hippocampal neurons
expressing pa-G-GECO1.2* before (0 s) and after (300 s) somatic photoactivation (pink
dashed regions). (Right) Contrast image showing the degree of photoactivation at 300 s.
(inset) Magnified dendrite with highlighted dendritic spines (white arrowheads). c, Ca2+
activity recorded in soma of a hippocampal neuron expressing pa-G-GECO1.2*, following
somatic photoactivation (n = 3). Images display pa-G-GECO1.2* fluorescence of a neuron
at trough (left) and peak (right) of fluorescent transients, displayed in d. Note spread of
activity throughout the cell.
Berlin et al. Page 21
Nat Methods. Author manuscript; available in PMC 2016 March 01.
Author M
anuscriptA
uthor Manuscript
Author M
anuscriptA
uthor Manuscript