The World of Project Management - COPYRIGHTED MATERIAL
32
C • H • A • P • T • E • R 1 1 The World of Project Management Once upon a time there was a heroine project manager. Her projects were never late. They never ran over budget. They always met contract specifications and invariably satisfied the expectations of her clients. And you know as well as we do, anything that begins with “Once upon a time . . .” is just a fairy tale. This book is not about fairy tales. Throughout these pages we will be as realistic as we know how to be. We will explain project management practices that we know will work. We will describe project management tools that we know can help the project manager come as close as Mother Nature and Lady Luck will allow to meeting the expectations of all who have a stake in the outcome of the project. 1.1 WHAT IS A PROJECT? The accomplishment of important tasks and goals in organizations today is being achieved increasingly through the use of projects. As a result, a new kind of organization is emerging to deal with the accelerating growth in the number of multiple, simultane- ously ongoing, and often interrelated projects in organizations. This project oriented organization, often called “enterprise project management” (Levine, 1998), “manage- ment by projects” (Boznak, 1996), and similar names, was created to tie projects more closely to the organization’s goals and strategy and to integrate and centralize manage- ment methods for the growing number of ongoing projects. Why this emphasis on project management? The answer is simple: Daily, organiza- tions are asked to accomplish work activities that do not fit neatly into business-as-usual. A software group may be asked to develop an application program that will access U.S. government data on certain commodity prices and generate records on the value of commodity inventories held by a firm; the software must be available for use on April 1. The Illinois State Bureau for Children’s Services may require an annually updated COPYRIGHTED MATERIAL
-
Upload
khangminh22 -
Category
Documents
-
view
0 -
download
0
Transcript of The World of Project Management - COPYRIGHTED MATERIAL

c • h • a • p • t • e • r
1
1The World of Project Management
Once upon a time there was a heroine project manager. Her projects were never late. They never ran over budget. They always met contract specifications and invariably satisfied the expectations of her clients. And you know as well as we do, anything that begins with “Once upon a time . . .” is just a fairy tale.
This book is not about fairy tales. Throughout these pages we will be as realistic as we know how to be. We will explain project management practices that we know will work. We will describe project management tools that we know can help the project manager come as close as Mother Nature and Lady Luck will allow to meeting the expectations of all who have a stake in the outcome of the project.
1.1 WHAT IS A PROJECT?
The accomplishment of important tasks and goals in organizations today is being achieved increasingly through the use of projects. As a result, a new kind of organization is emerging to deal with the accelerating growth in the number of multiple, simultane-ously ongoing, and often interrelated projects in organizations. This project oriented organization, often called “enterprise project management” (Levine, 1998), “manage-ment by projects” (Boznak, 1996), and similar names, was created to tie projects more closely to the organization’s goals and strategy and to integrate and centralize manage-ment methods for the growing number of ongoing projects.
Why this emphasis on project management? The answer is simple: Daily, organiza-tions are asked to accomplish work activities that do not fit neatly into business-as-usual. A software group may be asked to develop an application program that will access U.S. government data on certain commodity prices and generate records on the value of commodity inventories held by a firm; the software must be available for use on April 1. The Illinois State Bureau for Children’s Services may require an annually updated
Mantel_c01.indd 1 9/6/2016 4:41:20 PM
COPYRIG
HTED M
ATERIAL
2 • Chapter 1 / the World of projeCt ManageMent
census of all Illinois resident children, aged 17 years or younger, living with an illiterate single parent; the census must begin in 18 months. A manufacturer initiates a process improvement project to offset higher energy costs.
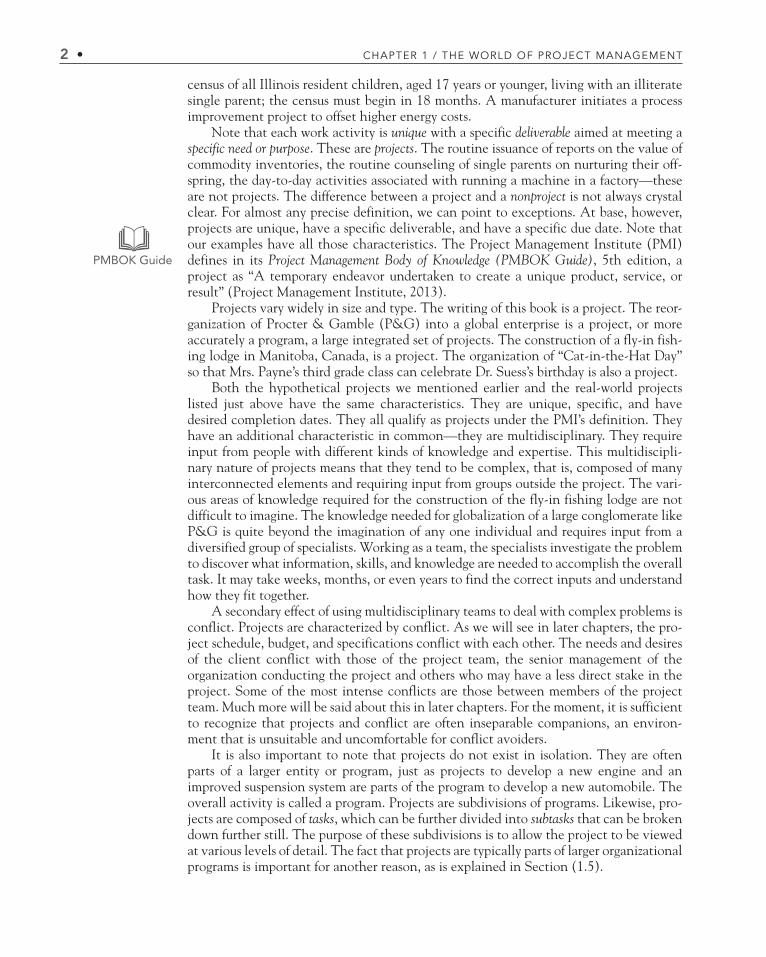
Note that each work activity is unique with a specific deliverable aimed at meeting a specific need or purpose. These are projects. The routine issuance of reports on the value of commodity inventories, the routine counseling of single parents on nurturing their off-spring, the day-to-day activities associated with running a machine in a factory—these are not projects. The difference between a project and a nonproject is not always crystal clear. For almost any precise definition, we can point to exceptions. At base, however, projects are unique, have a specific deliverable, and have a specific due date. Note that our examples have all those characteristics. The Project Management Institute (PMI) defines in its Project Management Body of Knowledge (PMBOK Guide), 5th edition, a project as “A temporary endeavor undertaken to create a unique product, service, or result” (Project Management Institute, 2013).
Projects vary widely in size and type. The writing of this book is a project. The reor-ganization of Procter & Gamble (P&G) into a global enterprise is a project, or more accurately a program, a large integrated set of projects. The construction of a fly-in fish-ing lodge in Manitoba, Canada, is a project. The organization of “Cat-in-the-Hat Day” so that Mrs. Payne’s third grade class can celebrate Dr. Suess’s birthday is also a project.
Both the hypothetical projects we mentioned earlier and the real-world projects listed just above have the same characteristics. They are unique, specific, and have desired completion dates. They all qualify as projects under the PMI’s definition. They have an additional characteristic in common—they are multidisciplinary. They require input from people with different kinds of knowledge and expertise. This multidiscipli-nary nature of projects means that they tend to be complex, that is, composed of many interconnected elements and requiring input from groups outside the project. The vari-ous areas of knowledge required for the construction of the fly-in fishing lodge are not difficult to imagine. The knowledge needed for globalization of a large conglomerate like P&G is quite beyond the imagination of any one individual and requires input from a diversified group of specialists. Working as a team, the specialists investigate the problem to discover what information, skills, and knowledge are needed to accomplish the overall task. It may take weeks, months, or even years to find the correct inputs and understand how they fit together.
A secondary effect of using multidisciplinary teams to deal with complex problems is conflict. Projects are characterized by conflict. As we will see in later chapters, the pro-ject schedule, budget, and specifications conflict with each other. The needs and desires of the client conflict with those of the project team, the senior management of the organization conducting the project and others who may have a less direct stake in the project. Some of the most intense conflicts are those between members of the project team. Much more will be said about this in later chapters. For the moment, it is sufficient to recognize that projects and conflict are often inseparable companions, an environ-ment that is unsuitable and uncomfortable for conflict avoiders.
It is also important to note that projects do not exist in isolation. They are often parts of a larger entity or program, just as projects to develop a new engine and an improved suspension system are parts of the program to develop a new automobile. The overall activity is called a program. Projects are subdivisions of programs. Likewise, pro-jects are composed of tasks, which can be further divided into subtasks that can be broken down further still. The purpose of these subdivisions is to allow the project to be viewed at various levels of detail. The fact that projects are typically parts of larger organizational programs is important for another reason, as is explained in Section (1.5).
PMBOK Guide
Mantel_c01.indd 2 9/6/2016 4:41:20 PM

1.1 What IS a projeCt • 3
Finally, it is appropriate to ask, “Why projects?” The reason is simple. We form projects in order to fix the responsibility and authority for the achievement of an organi-zational goal on an individual or small group when the job does not clearly fall within the definition of routine work.
Trends in Project Management
Many recent developments in project management are being driven by quickly changing global markets, technology, and education. Global competition is putting pressure on prices, response times, and product/service innovation. Computer and telecommunica-tion technology, along with rapidly expanding higher education across the world allows the use of project management for types of projects and in regions where these sophisti-cated tools had never been considered before. The most important of these recent devel-opments are covered in this book.
Achieving Strategic Goals There has been a growing use of projects to achieve an organization’s strategic goals, and a new role has arisen to help attain the target benefits desired by the funder of the project: a project “owner” (Section 1.5). Additionally, exist-ing major projects are screened to make sure that their objectives support the organiza-tion’s strategy and mission. Projects that do not have clear ties to the strategy and mission are not approved. A discussion of this is given in Section 1.6, where the Project Portfolio Process is described.
PMOs for Improving Project Effectiveness A variety of efforts are being pursued to improve the process and results of project management, whether strategic or routine. These efforts are typically now being led by a formal Project Management Office (PMO, Section 2.5) that provides training in project management skills and techniques such as the use of phase gates and agile (Section 3.4), earned value (Section 7.3), critical ratios (Section 7.4), and other such approaches; continually evaluates and helps improve the organization’s project management “maturity” (Section 7.5); educates project managers about the evolving ancillary goals of the organization (Section 8.1); and generally helps oversee the organization’s portfolio of programs and projects (Section 1.6).
Virtual Projects With the rapid increase in globalization of industry, many projects now involve global teams whose members operate in different countries and different time zones, each bringing a unique set of talents to the project. These are known as vir-tual projects because the team members may never physically meet before the team is disbanded and another team reconstituted. Advanced telecommunications and com-puter technology allow such virtual projects to be created, do their work, and complete their project successfully (see Section 2.1).
Quasi-Projects Led by the demands of the information technology/systems depart-ments, project management is now being extended into areas where the project’s objectives are not well understood, time deadlines unknown, and/or budgets undeter-mined. This ill-defined type of project is extremely difficult to conduct and to date has often resulted in setting an artificial due date and budget, and then specifying project objectives to meet those limits. However, new tools for these quasi-projects are now being developed—agile management, prototyping, phase-gating, and others—to help these projects achieve results that satisfy the customer in spite of the unknowns.
Best Practice
Mantel_c01.indd 3 9/6/2016 4:41:20 PM

4 • Chapter 1 / the World of projeCt ManageMent
1.2 PROJECT MANAGEMENT VS. GENERAL MANAGEMENT
As is shown in Table 1-1, project management differs from general management largely because projects differ from what we have referred to as “nonprojects.” The naturally high level of conflict present in projects means that the project manager (PM) must have special skills in conflict resolution. The fact that projects are unique means that the PM must be creative and flexible, and have the ability to adjust rapidly to changes. When managing nonprojects, the general manager tries to “manage by exception.” In other words, for nonprojects almost everything is routine and is handled routinely by subordi-nates. The manager deals only with the exceptions. For the PM, almost everything is an exception.
Major Differences
Certainly, general management’s success is dependent on good planning. For projects, however, planning is much more carefully detailed and project success is absolutely dependent on such planning. The project plan is the result of integrating all informa-tion about a project’s deliverables, generally referred to as the “scope” of the project, and its targeted date of completion. “Scope” has two meanings. One is “product scope,” which defines the performance requirements of a project, and “project scope,” which details the work required to deliver the product scope (see Chapter 5, p. 105 of PMBOK, 2013). To avoid confusion, we will use the term scope to mean “product scope” and will allow the work, resources, and time needed by the project to deliver the product scope to the customer to be defined by the project’s plan (discussed in detail in Chapter 3). Therefore, the scope and due date of the project determine its plan, that is, its budget, schedule, control, and evaluation. Detailed planning is criti-cally important. One should not, of course, take so much time planning that nothing ever gets done, but careful planning is a major contributor to project success. Project planning is discussed in Chapter 3 and is amplified throughout the rest of this book.
A project, then, is a temporary endeavor undertaken to create a unique product or service. It is specific, timely, usually multidisciplinary, and typically conflict ridden. Projects are parts of overall programs and may be broken down into tasks, subtasks, and further if desired. Current trends in project management include achieving stra-tegic goals, achieving routine goals, improving project effectiveness, virtual projects, and quasi-projects.
PMBOK Guide
Table 1-1 Comparison of Project Management and General Management
Dimension Project Management General Management
Type of Work Activity Unique Routine
Management Approach Ability to adapt to change Manage by exception
Planning Critical Important
Budgeting Start from scratch, multiple budget periods Modify budget from previous budget period
Sequence of Activities Must be determined Often predetermined
Location of Work Crosses organizational units Within an organizational unit
Reporting Relationships Informal Well defined
Mantel_c01.indd 4 9/6/2016 4:41:21 PM

1.2 projeCt ManageMent VS. general ManageMent • 5
Project budgeting differs from standard budgeting, not in accounting techniques, but in the way budgets are constructed. Budgets for nonprojects are primarily modifications of budgets for the same activity in the previous period. Project budgets are newly created for each project and often cover several “budget periods” in the future. The project budget is derived directly from the project plan that calls for specific activities. These activities require resources, and such resources are the heart of the project budget. Similarly, the project schedule is also derived from the project plan.
In a nonproject manufacturing line, the sequence in which various things are done is set when the production line is designed. The sequence of activities often is not altered when new models are produced. On the other hand, each project has a schedule of its own. Previous projects with deliverables similar to the one at hand may provide a rough template for the current project, but its specific schedule will be determined by the time required for a specific set of resources to do the specific work that must be done to achieve each project’s specific scope by the specific date on which the project is due for delivery to the client. As we will see in later chapters, the special requirements associated with projects have led to the creation of special managerial tools for budgeting and scheduling.
The routine work of most organizations takes place within a well-defined structure of divisions, departments, areas, and similar subdivisions of the total enterprise. The typical project cannot thrive under such restrictions. The need for technical knowledge, informa-tion, and special skills almost always requires that departmental lines be crossed. This is simply another way of describing the multidisciplinary character of projects. When pro-jects are conducted side-by-side with routine activities, chaos tends to result—the non-projects rarely crossing organizational boundaries and the projects crossing them freely. These problems and recommended actions are discussed at greater length in Chapter 2.
Even when large firms establish manufacturing plants or distribution centers in dif-ferent countries, a management team is established on site. For projects, “globalization” has a different meaning. Individual members of project teams may be spread across coun-tries, continents, and oceans, and speak several different languages. Some project team members may never even have a face-to-face meeting with the project manager, though transcontinental and intercontinental video meetings combining telephone and com-puter are common.
The discussion of structure leads to consideration of another difference between project and general management. In general management, there are reasonably well-defined reporting relationships. Superior-subordinate relationships are known, and lines of authority are clear. In project management this is rarely true. The PM may be relatively low in the hierarchical chain of command. This does not, however, reduce his or her responsibility of completing a project successfully. Responsibility without the authority of rank or position is so common in project management as to be the rule, not the exception.
Negotiation
With little legitimate authority, the PM depends on negotiation skills to gain the coop-eration of the many departments in the organization that may be asked to supply tech-nology, information, resources, and personnel to the project. The parent organization’s standard departments have their own objectives, priorities, and personnel. The project is not their responsibility, and the project tends to get the leftovers, if any, after the depart-ments have satisfied their own need for resources. Without any real command authority, the PM must negotiate for almost everything the project needs.
It is important to note that there are three different types of negotiation, win-win negotiation, win-lose negotiation, and lose-lose negotiation. When you negotiate the
Mantel_c01.indd 5 9/6/2016 4:41:21 PM
6 • Chapter 1 / the World of projeCt ManageMent
purchase of a car or a home, you are usually engaging in win-lose negotiation. The less you pay for a home or car, the less profit the seller makes. Your savings are the other party’s losses—win-lose negotiation. This type of negotiation is never appropriate when dealing with other members of your organization. If you manage to “defeat” a department head and get resources or commitments that the department head did not wish to give you, imagine what will happen the next time you need something from this individual. The PM simply cannot risk win-lose situations when negotiating with other members of the organization.
Lose-lose negotiation occurs when one party is unwilling to assert his or her position aggressively while at the same time resists cooperating with the other party. This often occurs in situations where one or both of the parties are conflict avoiders. When one party is not willing to help the other party achieve his or her objective and at the same time is unwilling to pursue his or her own objectives, the end result is that both parties lose.
Within the organization, win-win negotiation is mandatory. In essence, in win-win negotiation both parties must try to understand what the other party needs. The problem you face as a negotiator is how to help other parties meet their needs in return for their help in meeting the needs of your project. When negotiation takes place repeatedly between the same individuals, win-win negotiation is the only sensible procedure. PMs spend a great deal of their time negotiating. General managers spend relatively little. Skill at win-win negotiating is a requirement for successful project managing (see Fisher and Ury, 1983; Jandt, 1987; and Raiffa, 1982).
One final point about negotiating: Successful win-win negotiation often involves taking a synergistic approach by searching for the “third alternative.” For example, con-sider a product development project focusing on the development of a new printer. A design engineer working on the project suggests adding more memory to the printer. The PM initially opposes this suggestion, feeling that the added memory will make the printer too costly. Rather than rejecting the suggestion, however, the PM tries to gain a better understanding of the design engineer’s concern.
Based on their discussion, the PM learns that the engineer’s purpose in requesting additional memory is to increase the printer’s speed. After benchmarking the competi-tion, the design engineer feels the printer will not be competitive as it is currently con-figured. The PM explains his fear that adding the extra memory will increase the cost of the printer to the point that it also will no longer be cost competitive. Based on this discussion the design engineer and PM agree that they need to search for another (third) alternative that will increase the printer’s speed without increasing its costs. A couple of days later, the design engineer identifies a new ink that can simultaneously increase the printer’s speed and actually lower its total and operating costs.
Project management differs greatly from general management. Every project is planned, budgeted, scheduled, and controlled as a unique task. Unlike nonprojects, projects are often multidisciplinary and usually have considerable need to cross departmental boundaries for technology, information, resources, and personnel. Crossing these boundaries tends to lead to intergroup conflict. The development of a detailed project plan based on the scope and due date of the project is critical to the project’s success.
Unlike their general management counterparts, project managers have respon-sibility for accomplishing a project, but little or no legitimate authority to command the required resources from the functional departments. The PM must be skilled at win-win negotiation to obtain these resources.
Mantel_c01.indd 6 9/6/2016 4:41:21 PM
1.3 What IS Managed? the three goalS of a projeCt • 7
1.3 WHAT IS MANAGED? THE THREE GOALS OF A PROJECT
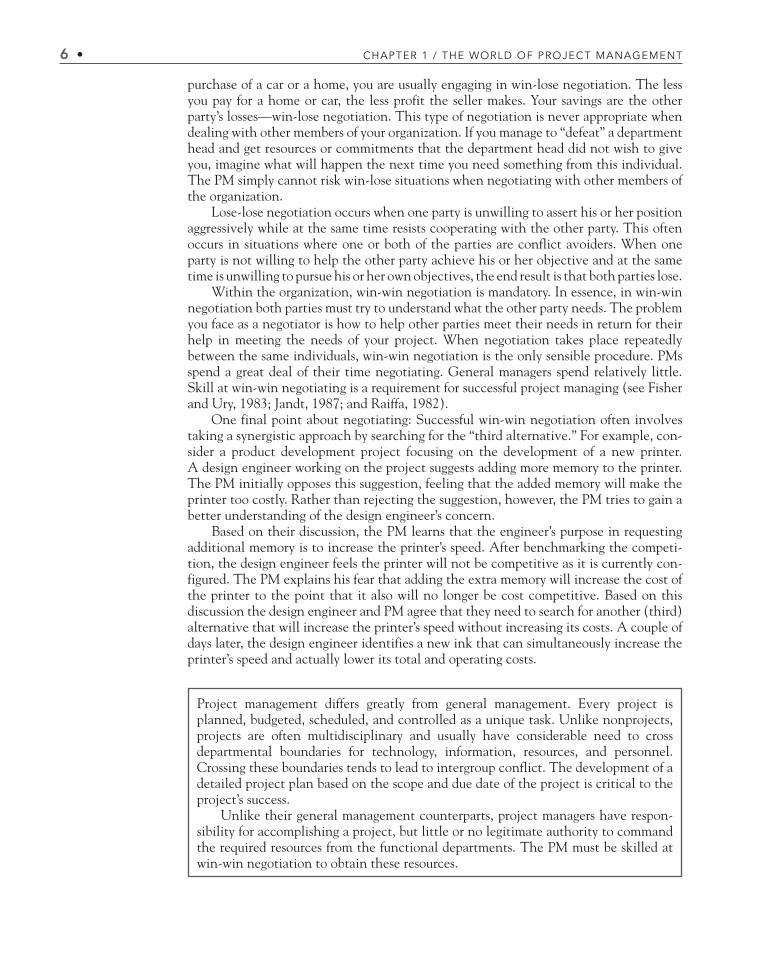
The performance of a project, commonly called its “efficiency,” is assessed on the basis of three criteria, variously known as the “triple constraints,” the “iron triangle,” the “golden constraints,” and so on. Is the project on time or early? Is the project on or under budget? Does the project deliver the scope to the agreed-upon specification? Figure 1-1 shows the three goals of a project specifications. The performance of the project and the PM is measured by the degree to which these goals are achieved. A recent issue, however, has arisen: meeting a project’s triple constraints often does not achieve the aims of the pro-ject for the client, known as the project’s “effectiveness;” that is, the project didn’t deliver the benefits the client was hoping to gain. However, not meeting the project’s triple constraint usually dooms the project to failure. This issue is discussed further in Section 1.5.
One of these goals, the project’s specifications or “scope,” is set primarily by the cli-ent (although the client agrees to all three when contracting for the project). It is the client who must decide what capabilities are required of the project’s deliverables—and this is what makes the project unique. Some writers insist that “quality” is a separate and distinct goal of the project along with time, cost, and scope. We do not agree because we consider quality an inherent part of the project scope.
If we did not live in an uncertain world in which best made plans often go awry, managing projects would be relatively simple, requiring only careful planning. Unfortunately, we do not live in a predictable (deterministic) world, but one characterized by chance events (uncertainty). This ensures that projects travel a rough road. Murphy’s law seems as universal as death and taxes, and the result is that the most skilled planning is upset by uncertainty. Thus, the PM spends a great deal of time adapting to unpredicted change. The primary method of adapting is to trade off one objective for another. If a construction project falls behind schedule because of bad weather, it may be possible to get back on schedule by adding resources—in this case, probably labor using overtime and perhaps some additional equipment. If the budget cannot be raised to cover the additional resources, the PM may have to negotiate with the client for a later delivery
Trade-Offs
Required scope
Budget limit
Due date
Performance targets
Time(“schedule”)
Cost
Scope
Figure 1-1 Scope, cost, and time project performance targets.
Mantel_c01.indd 7 9/6/2016 4:41:21 PM

8 • Chapter 1 / the World of projeCt ManageMent
date of the building. If neither cost nor schedule can be negotiated, the client may be willing to cut back on some of the features in the building in order to allow the project to finish on time and budget (e.g., substituting carpet for tile in some of the spaces). As a final alternative, the contractor may have to “swallow” the added costs (or pay a penalty for late delivery) and accept lower profits.
This example illustrates a fundamental point. Namely, managing the trade-offs among the three project goals is in fact one of the primary roles of the project manager. Furthermore, managing these trade-offs in the most effective manner requires that the project manager have a clear understanding of how the project supports broader organi-zational goals. Thus, the organization’s overall strategy is the most important considera-tion for managing the trade-offs that will be required among the three project goals.
All projects are always carried out under conditions of uncertainty. Well-tested soft-ware routines may not perform properly when integrated with other well-tested routines. A chemical compound may destroy cancer cells in a test tube—and even in the bodies of test animals—but may kill the host as well as the cancer. Where one cannot find an acceptable way to deal with a problem, the only alternative may be to stop the project and start afresh to achieve the desired deliverables.
As we note throughout this book, projects are all about uncertainty. Therefore, in addition to effectively managing trade-offs, the second major role of the project manager is dealing with uncertainty, that is, managing risks. The time required to complete a project, the availability and costs of key resources, the timing of solutions to technologi-cal problems, a wide variety of macroeconomic variables, the whims of a client, the actions taken by competitors, even the likelihood that the output of a project will per-form as expected, all these exemplify the uncertainties encountered when managing projects. While there are actions that may be taken to reduce the uncertainty, no actions of a PM can ever eliminate it.
As Hatfield (2008) points out, projects are complex and include interfaces, interde-pendencies, and many assumptions, any or all of which may turn out to be wrong. Also, projects are managed by people, which adds to the uncertainty. Gale (2008a) reminds us that the uncertainties include everything from legislation that can change how we do business, to earthquakes and other “acts of God.” Therefore, in today’s turbulent business environment, effective decision making is predicated on an ability to manage the ambi-guity that arises while we operate in a world characterized by uncertain information. (Risk management is discussed in Chapter 11 of the PMBOK, 5th ed., 2013.)
The first step in managing risk is to identify these potentially uncertain events and the likelihood that any or all may occur. This is called risk analysis. Different managers and organizations approach this problem in different ways. Gale advises expecting the unexpected; some managers suggest considering those things that keep one awake at night. Many organizations keep formal lists, a “risk register,” and use their Project Management Office (PMO, discussed in Chapter 2) to maintain and update the list of risks and approaches that have been successful in the past in dealing with specific risks. This information is then incorporated into the firm’s business-continuity and disaster-recovery plans. Every organization should have a well-defined process for dealing with risk, and we will discuss this issue at greater length in Section 3.5. At this point we simply overview risk analysis.
The essence of risk analysis is to make estimates or assumptions about the probability distributions associated with key parameters and variables and to use analytic decision models or Monte Carlo simulation models based on these distributions to evaluate the desirability of certain managerial decisions. Real-world problems are usually large enough that the use of analytic models is very difficult and time consuming. With modern computer software, simulation is not difficult.
Trade-Offs
PMBOK Guide
Risk
Best Practice
Mantel_c01.indd 8 9/6/2016 4:41:22 PM
1.3 What IS Managed? the three goalS of a projeCt • 9
A mathematical model of the situation is constructed that models the relationship between unknown input variables and important outcomes. The model is run (or repli-cated) repeatedly, starting from a different point each time based on random choices of values from the probability distributions of the input variables. Outputs of the model are used to construct statistical distributions of outcomes of interest to decision makers, such as costs, profits, completion dates, or return on investment. These distributions are the risk profiles of the outcomes associated with a decision. Risk profiles can be analyzed by the manager when considering a decision, along with many other factors such as strategic concerns, behavioral issues, fit with the organization, cost and scheduling issues, and so on.
Thus in this book, we adopt the point of view that the two primary roles of the pro-ject manager are managing trade-offs and managing risks. Because these two roles are fundamental to the work of the project manager, icons are displayed throughout the book in the left margin when these topics are discussed. It is also important to point out that these two roles are highly integrated with one another. Indeed, managing risk is actually tightly coupled with managing the three traditional goals of project management. For example, the more uncertainty the project manager faces, the greater the risk that the project will go over budget, finish late, and/or not meet its original scope. However, beyond these rather obvious relationships, there is also a more subtle connection. In particular, project risk can actually be thought of as a fourth trade-off opportunity at the project manager’s disposal. For example, the project’s budget can be increased in order to collect additional data that in turn will reduce the uncertainty related to how long it will take to complete the project. Likewise, the project’s deadline can be reduced, but this will increase the uncertainty about whether it will be completed on time.
Most of the trade-offs PMs make are reasonably straightforward if the organization’s strategy is well understood and trade-offs are discussed during the planning, budgeting, and scheduling phases of the project. Usually they involve trading time and cost, but if we cannot alter either the schedule or the budget, the scope of the project may be altered or additional risk accepted. Frills on the finished product may be foregone, capabilities not badly needed may be compromised. From the early stages of the project, it is the PM’s duty to know which elements of project performance are sacrosanct.
One final comment on this subject: Projects must have some flexibility. Again, this is because we do not live in a deterministic world. Occasionally, a senior manager (who does not have to manage the project) presents the PM with a document precisely listing a set of deliverables, a fixed budget, and a firm schedule. This is failure in the making for the PM. Unless the budget is overly generous, the schedule overlong, and the delivera-bles easily accomplished, the system is, as mathematicians say, “overdetermined.” If Mother Nature so much as hiccups, the project will fail to meet its rigid parameters. A PM cannot be successful without flexibility to manage the trade-offs.
Risk
Trade-Offs
The two primary roles of the project manager are to manage trade-offs among three interrelated objectives and to manage risks. The three interrelated objectives are: to (1) meet the budget, (2) finish on schedule, and (3) generate deliverables that satisfy the client. Because we live in an uncertain world, as work on the project proceeds, unexpected problems are bound to arise. These chance events will threaten the pro-ject’s schedule or budget or scope. The PM must now decide how to trade off one project goal against another (e.g., to stay on schedule by assigning extra resources to the project may mean it will run over the predetermined budget). If the schedule, budget, and scope are rigidly predetermined, the project is probably doomed to failure unless the preset schedule and budget are overly generous or the difficulty in meeting the specifications has been seriously overestimated.
Mantel_c01.indd 9 9/6/2016 4:41:22 PM
10 • Chapter 1 / the World of projeCt ManageMent
1.4 THE LIFE CYCLES OF PROJECTS
All organisms have a life cycle. They are born, grow, wane, and die. This is true for all living things, for stars and planets, for the products we buy and sell, for our organizations, and for our projects as well. A project’s life cycle measures project completion as a func-tion of either time (schedule) or resources (budget). The subject of project life cycles is discussed in PMBOK’s Chapter 2 on Organizational Influences and Project Life Cycle. This life cycle must be understood because the PM’s managerial focus subtly shifts at dif-ferent stages of the cycle (Adams and Barndt, 1983; Kloppenborg and Mantel, 1990). During the early stages, the PM must make sure that the project plan really reflects the wishes of the client as well as the abilities of the project team and is designed to be consistent with the goals and objectives of the parent organization.
As the project goes into the implementation stage of its life cycle, the PM’s atten-tion turns to the job of keeping the project on budget and schedule—or, when chance interferes with progress, to negotiating the appropriate trade-offs to correct or minimize the damage. At the end of the project, the PM turns into a “fuss-budget” to assure that the specifications of the project are truly met, handling all the details of closing out the books on the project, making sure there are no loose ends, and that every “i” is dotted and “t” crossed.
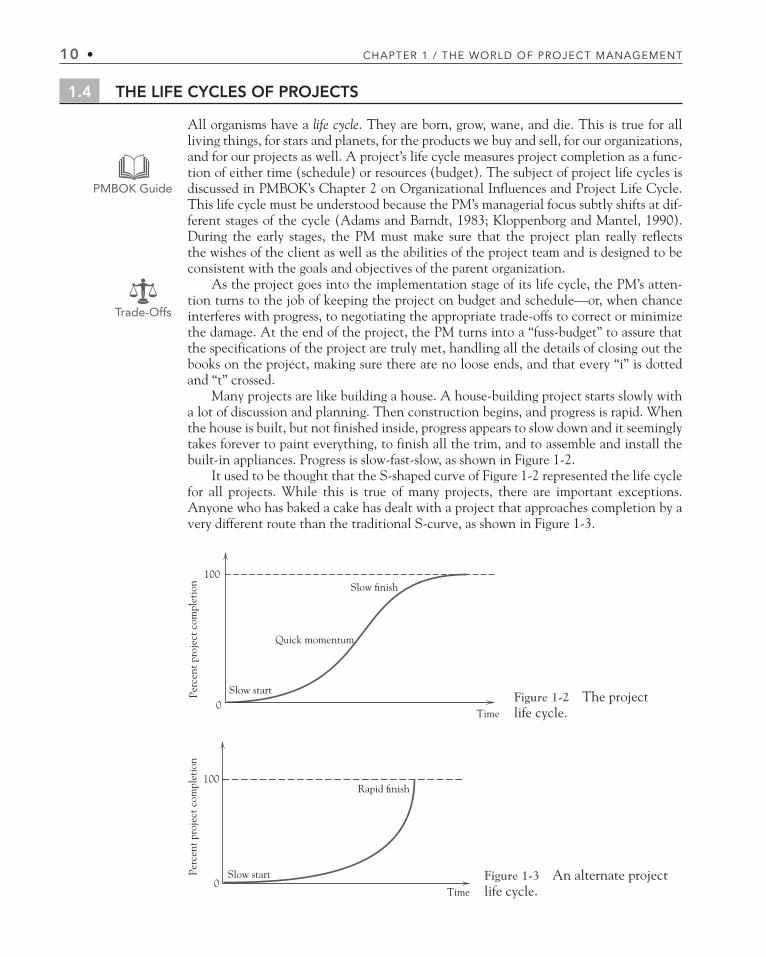
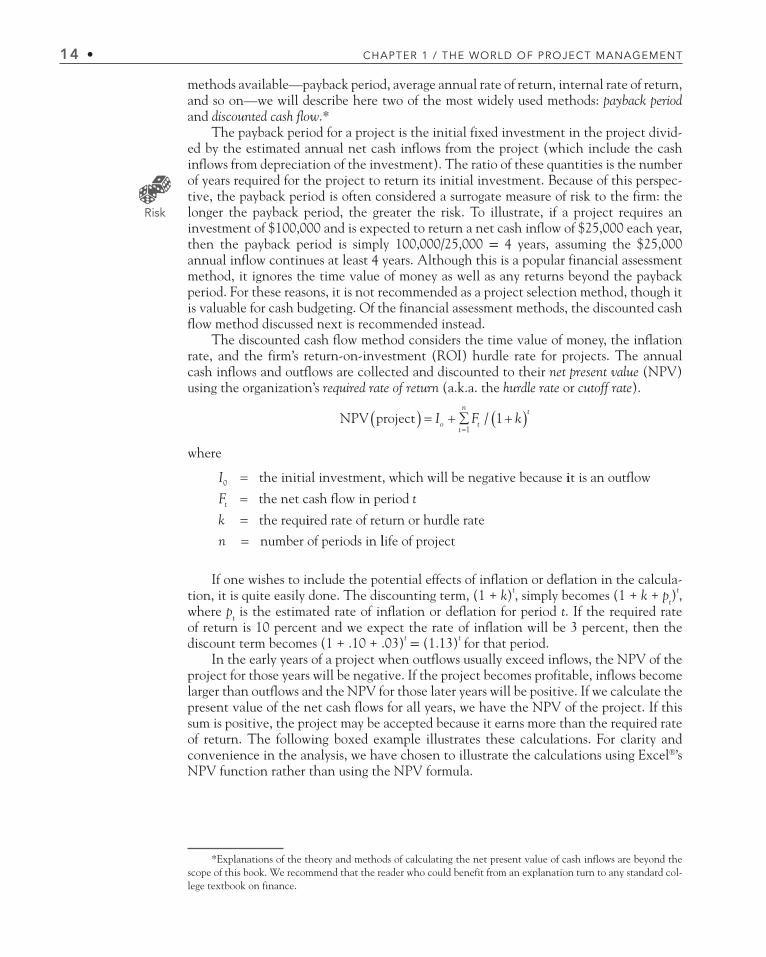
Many projects are like building a house. A house-building project starts slowly with a lot of discussion and planning. Then construction begins, and progress is rapid. When the house is built, but not finished inside, progress appears to slow down and it seemingly takes forever to paint everything, to finish all the trim, and to assemble and install the built-in appliances. Progress is slow-fast-slow, as shown in Figure 1-2.
It used to be thought that the S-shaped curve of Figure 1-2 represented the life cycle for all projects. While this is true of many projects, there are important exceptions. Anyone who has baked a cake has dealt with a project that approaches completion by a very different route than the traditional S-curve, as shown in Figure 1-3.
PMBOK Guide
Trade-Offs
100
Time
Perc
ent p
roje
ct c
ompl
etio
n
0Slow start
Slow �nish
Quick momentum
Figure 1-2 The project life cycle.
Perc
ent p
roje
ct c
ompl
etio
n
0Time
100
Slow start
Rapid �nish
Figure 1-3 An alternate project life cycle.
Mantel_c01.indd 10 9/6/2016 4:41:22 PM

1.5 SeleCtIng projeCtS to Meet organIZatIonal oBjeCtIVeS • 11
The process of baking a cake is straightforward. The ingredients are mixed while the oven is preheated, usually to 350°F. The mixture (technically called “goop”) is placed in a greased pan, inserted in the oven, and the baking process begins. Assume that the entire process from assembling the ingredients to finished cake requires about 45 minutes—15 minutes for assembling the materials and mixing, and 30 minutes for baking. At the end of 15 minutes we have goop. Even after 40 minutes, having baked for 25 minutes, it may look like cake but, as any baker knows, it is still partly goop inside. If a toothpick (our grand-mothers used a broom straw) is inserted into the middle of the “cake” and then removed, it does not come out clean. In the last few minutes of the process, the goop in the middle becomes cake. If left a few minutes too long in the oven, the cake will begin to burn on the bottom. Project Cake follows a J-shaped path to completion much like Figure 1-3.
There are many projects that are similar to cake—the development of computer software, and many chemical engineering projects, for instance. In these cases the PM’s job begins with great attention to having all the correct project resources at hand or guar-anteed to be available when needed. Once the “baking” process is underway—the inte-gration of various sets of code or chemicals—one can usually not add missing ingredients. As the process continues, the PM must concentrate on determining when the project is complete—“done” in the case of cake, or a fully debugged program in the case of software.
In later chapters, we will also see the importance of the shape of the project’s life cycle on how management allocates resources or reacts to potential delays in a project. Management does not need to know the precise shape of the life cycle, but merely whether its completion phase is concave (Figure 1-2) or convex (Figure 1-3) to the baseline.
1.5 SELECTING PROJECTS TO MEET ORGANIZATIONAL OBJECTIVES
As noted earlier, a major trend occurring in organizations is the use of project management to implement the organization’s strategic objectives, especially organizational change. Organizations spend about $100 billion a year on creating competitive strategies (Morgan et al., 2007, p. 1), yet 90 percent of them (thousands) fail due to poor execution of these projects. This has stimulated a variety of new research into why these projects, even when successful, often don’t attain the strategic benefits the organization desired. Some of these research streams are called “change management,” “benefit realization management,” and other such terms. One new approach gaining attention has been the creation of a new position in the project governance structure called the “project owner,” an agent of the funding organization with the responsibility of ensuring that the project results in the stra-tegic benefits desired by the funder (Zwikael et al., 2015). The project owner works closely with the project manager and the executive “sponsor” (champion) of the project in the project manager’s organization, as well as all project stakeholders, to ensure that the strategic benefits are realized when the project is eventually implemented and operationalized.
Not all of an organization’s projects will be strategy implementation or organiza-tional change projects, but all of the projects in the organization’s portfolio should be
There are two different paths (life cycles) along which projects progress from start to completion. One is S-shaped, and the other is J-shaped. It is an important distinc-tion because identifying the different life cycles helps the PM to focus attention on appropriate matters to ensure successful project completion.
Best Practice
Mantel_c01.indd 11 9/6/2016 4:41:22 PM

12 • Chapter 1 / the World of projeCt ManageMent
consistent with the organization’s strategic goals. In what follows, we first discuss a vari-ety of common project selection methods. We then describe the process of strategically selecting the best set of projects for implementation, called the Project Portfolio Process.
Project selection is the process of evaluating individual projects or groups of projects and then choosing to implement a set of them so that the objectives of the parent organi-zation are achieved. Before a project begins its life cycle, it must have been selected for funding by the parent organization. Whether the project was proposed by someone within the organization or an outside client, it is subject to approval by a more or less formal selection process. Often conducted by a committee of senior managers, the major function of the selection process is to ensure that several conditions are considered before a commitment is made to undertake any project. These conditions vary widely from firm to firm, but several are quite common: (1) Is the project potentially profitable? Does it have a chance of meeting our return-on-investment hurdle rate? (2) Is the project required by law or the rules of an industrial association; i.e., a “mandate?” (3) Does the firm have, or can it easily acquire, the knowledge and skills to carry out the project suc-cessfully? (4) Does the project involve building competencies that are considered con-sistent with our firm’s strategic plan? (5) Does the organization currently have the capacity to carry out the project on its proposed schedule? (6) In the case of R&D pro-jects, if the project is technically successful, does it meet all requirements to make it economically successful? This list could be greatly extended.
The selection process is often complete before a PM is appointed to the project. Why, then, should the PM be concerned? Quite simply, the PM should know exactly why the organization selected the specific project because this sheds considerable light on what the project (and hence the PM) is expected to accomplish, from senior manage-ment’s point of view, with the project. The project may have been selected because it appeared to be profitable, or was a way of entering a new area of business, or a way of building a reputation of competency with a new client or in a new market. This knowl-edge can be very helpful to the PM by indicating senior management’s goals for the pro-ject, which will point to the desirability of some trade-offs and the undesirability of others.
There are many different methods for selecting projects, but they may be grouped into two fundamental types, nonnumeric and numeric. The former does not use numbers for evaluation; the latter does. At this point it is important to note that many firms select projects before a detailed project plan has been developed. Clearly, if the potential pro-ject’s scope, budget, and due dates have not been determined, it will be quite impossible to derive a reasonably accurate estimate of the project’s success. Rough estimations may have to suffice in such cases, but specific plans should be developed prior to final project selection. Obviously, mandated projects are an exception. For mandates, budget esti-mates do not matter but scope and due dates are still important. Mandates must be selected. We will deal further with the selection problem when we consider the Project Management Office in Chapter 2.
Nonnumeric Selection Methods
The Sacred Cow At times, the organization’s Chief Executive Officer (CEO) or other senior executive either formally or casually suggests a potential product or service that the organization might offer to its customers. The suggestion often starts, “You know, I was thinking that we might . . .” and concludes with “. . . Take a look at it and see if it looks sensible. If not, we’ll drop the whole thing.”
Whatever the selection process, the aforementioned project will be approved. It becomes a “Sacred Cow” and will be shown to be technically, if not economically, feasible. This may seem irrational to new students of project management, but such a judgment
Trade-Offs
Mantel_c01.indd 12 9/6/2016 4:41:22 PM

1.5 SeleCtIng projeCtS to Meet organIZatIonal oBjeCtIVeS • 13
ignores senior management’s intelligence and valuable years of experience—as well as the subordinate’s desire for long-run employment. It also overlooks the value of support from the top of the organization, a condition that is necessary for project success (Green, 1995).
The Operating/Competitive Necessity This method selects any project that is necessary for continued operation of a group, facility, or the firm itself. A “mandated” project obviously must be selected. If the answer to the “Is it necessary . . . ?” question is “yes,” and if we wish to continue using the facility or system to stay in business, the pro-ject is selected. The Investment Committee of a large manufacturing company started to debate the advisability of purchasing and installing pumps to remove 18 inches of flood water from the floor of a small, but critical production facility. The debate stopped imme-diately when one officer pointed out that without the pumps the firm was out of business.
The same questions can be directed toward the maintenance of a competitive posi-tion. Some years ago, General Electric almost decided to sell a facility that manufactured the large mercury vapor light bulbs used for streetlights and lighting large parking lots. The lighting industry had considerable excess capacity for this type of bulb and the resulting depressed prices meant they could not be sold profitably. GE, however, felt that if they dropped these bulbs from their line of lighting products, they might lose a signifi-cant portion of all light bulb sales to municipalities. The profits from such sales were far in excess of the losses on the mercury vapor bulbs.
Comparative Benefits Many organizations have to select from a list of projects that are complex, difficult to assess, and often noncomparable, for example, United Way organ-izations and R&D organizations. Such institutions often appoint a selection committee made up of knowledgeable individuals. Each person is asked to arrange a set of potential projects into a rank-ordered set. Typically, each individual judge may use whatever criteria he or she wishes to evaluate projects. Some may use carefully determined technical criteria, but others may try to estimate the project’s probable impact on the ability of the organiza-tion to meet its goals. While the use of various criteria by different judges may trouble some, it results from a purposeful attempt to get as broad a set of evaluations as possible.
Rank-ordering a small number of projects is not inherently difficult, but when the number of projects exceeds 15 or 20, the difficulty of ordering the group rises rapidly. A Q-sort* is a convenient way to handle the task. First, separate the projects into three subsets, “good,” “fair,” and “poor,” using whatever criteria you have chosen—or been instructed to use. If there are more than seven or eight members in any one classification, divide the group into two subsets, for instance, “good-plus” and “good-minus.” Continue subdividing until no set has more than seven or eight members. Now, rank-order the items in each subset. Arrange the subsets in order of rank, and the entire list will be in order. Last, review the stack and shift any cards that seem out of place until the classifications are satisfactory.
The committee can make a composite ranking from the individual lists any way it chooses. One way would be to number the items on each individual list in order of rank, and then add the ranks given to each project by each of the judges. Projects may then be approved in the order of their composite ranks, at least until the organization runs out of available funds.
Numeric Selection Methods
Financial Assessment Methods Most firms select projects on the basis of their expected economic value to the firm. Although there are many economic assessment
*The Q-sort is a handy, useful, and easy-to-use technique. See Helin and Souder (1974).
Mantel_c01.indd 13 9/6/2016 4:41:22 PM
14 • Chapter 1 / the World of projeCt ManageMent
methods available—payback period, average annual rate of return, internal rate of return, and so on—we will describe here two of the most widely used methods: payback period and discounted cash flow.*
The payback period for a project is the initial fixed investment in the project divid- ed by the estimated annual net cash inflows from the project (which include the cash inflows from depreciation of the investment). The ratio of these quantities is the number of years required for the project to return its initial investment. Because of this perspec-tive, the payback period is often considered a surrogate measure of risk to the firm: the longer the payback period, the greater the risk. To illustrate, if a project requires an investment of $100,000 and is expected to return a net cash inflow of $25,000 each year, then the payback period is simply 100,000/25,000 = 4 years, assuming the $25,000 annual inflow continues at least 4 years. Although this is a popular financial assessment method, it ignores the time value of money as well as any returns beyond the payback period. For these reasons, it is not recommended as a project selection method, though it is valuable for cash budgeting. Of the financial assessment methods, the discounted cash flow method discussed next is recommended instead.
The discounted cash flow method considers the time value of money, the inflation rate, and the firm’s return-on-investment (ROI) hurdle rate for projects. The annual cash inflows and outflows are collected and discounted to their net present value (NPV) using the organization’s required rate of return (a.k.a. the hurdle rate or cutoff rate).
NPV project I F kot
n
t
t
11/
where
I0 the initial investment, which will be negative because iit is an outflow
the net cash flow in period
the requ
F t
kt
iired rate of return or hurdle ratenumber of periods in n llife of project
If one wishes to include the potential effects of inflation or deflation in the calcula-tion, it is quite easily done. The discounting term, (1 + k)t, simply becomes (1 + k + pt)
t, where pt is the estimated rate of inflation or deflation for period t. If the required rate of return is 10 percent and we expect the rate of inflation will be 3 percent, then the discount term becomes (1 + .10 + .03)t = (1.13)t for that period.
In the early years of a project when outflows usually exceed inflows, the NPV of the project for those years will be negative. If the project becomes profitable, inflows become larger than outflows and the NPV for those later years will be positive. If we calculate the present value of the net cash flows for all years, we have the NPV of the project. If this sum is positive, the project may be accepted because it earns more than the required rate of return. The following boxed example illustrates these calculations. For clarity and convenience in the analysis, we have chosen to illustrate the calculations using Excel®’s NPV function rather than using the NPV formula.
Risk
*Explanations of the theory and methods of calculating the net present value of cash inflows are beyond the scope of this book. We recommend that the reader who could benefit from an explanation turn to any standard col-lege textbook on finance.
Mantel_c01.indd 14 9/6/2016 4:41:22 PM

1.5 SeleCtIng projeCtS to Meet organIZatIonal oBjeCtIVeS • 15
Perhaps the most difficult aspect related to the proper use of discounted cash flow is determining the appropriate discount rate to use. While this determination is made by senior management, it has a major impact on project selection, and therefore, on the life of the PM. For most projects the hurdle rate selected is the organization’s cost of capital, though it is often arbitrarily set too high as a general allowance for risk. In the case of particularly risky projects, a higher hurdle rate may be justified, but it is not a good gen-eral practice. If a project is competing for funds with alternative investments, the hurdle
Ceramic Sciences, Inc.*
Ceramic Sciences, Inc. (CSI) is a large producer of decorative ceramic pots. The firm is considering the installation of a new manufacturing line that will, it is hoped, improve the quality of its pots as well as their vases designed to hold artificial flowers.
The plant engineering department has submitted a project proposal that esti-mates the following investment requirements: an initial investment of $125,000 to be paid up-front to the Pocketa Machine Corporation, an additional investment of $100,000 to install the machines, and another $90,000 to add new material han-dling systems and integrate the new equipment into the overall production system. Delivery and installation is estimated to take 1 year, and integrating the entire system should require an additional year. Thereafter, the engineers predict that scheduled machine overhauls will require further expenditures of about $15,000 every second year, beginning in the fourth year. They will not, however, overhaul the machinery in the last year of its life.
The project schedule calls for the line to begin production in the third year, and to be up-to-speed by the end of that year. Projected manufacturing cost savings and added profits resulting from higher quality are estimated to be $50,000 in the first year of operation and are expected to peak at $120,000 in the second year of operation, and then to follow the gradually declining pattern shown in Table A.
Project life is expected to be 10 years from project inception, at which time the proposed system will be obsolete and will have to be replaced. It is estimated that the machinery will have a salvage value of $35,000. CSI has a 13 percent hurdle rate for capital investments and expects the rate of inflation to be about 2 percent per year over the life of the project. Assuming that the initial expenditure occurs at the begin-ning of the year and that all other receipts and expenditures occur as lump sums at the end of the year, we can prepare the Net Present Value analysis for the project as shown in Table A. Note that Excel’s built in Net Present Value function NPV was used to facilitate the analysis. The NPV function has two arguments: the discount rate and the range that contains the cash flows to be discounted.
Because the first cash flow of – $125,000 occurs at the beginning of the first period, there is no need to discount it as it is already in present value terms. The remaining cash flows are assumed to occur at the end of their respective periods. For example, the $115,000 cash flow associated with 20X4 is assumed to occur at the end of the fifth period. According to the results, the Net Present Value of the project is positive and, thus, the project can be accepted. (The project would have been rejected if the hurdle rate had been 15 percent or if the inflation rate was 4 percent, either one resulting in a discount rate of 17 percent.)
Risk
*The authors thank John Wiley & Sons for permission to adapt material from Meredith J. R., Mantel, S. J., and Shafer, S. M., Project Management: A Managerial Approach, 9th ed. New York, John Wiley & Sons, 2015 for use in this section and in Section 1.6.
Mantel_c01.indd 15 9/6/2016 4:41:22 PM

16 • Chapter 1 / the World of projeCt ManageMent
rate may be the opportunity cost of capital, that is, the rate of return the firm must forego if it invests in the project instead of making an alternative investment. Another common, but misguided practice is to set the hurdle rate high as an allowance for resource cost increases. Neither risk nor inflation should be treated so casually. Specific corrections for each should be made if the firm’s management feels it is required. We recommend strongly a careful risk analysis, which we will discuss in further detail throughout this book.
Because the present value of future returns decreases as the discount rate rises, a high hurdle rate biases the analysis strongly in favor of short-run projects. For example, given a rate of 20 percent, a dollar 10 years from now has a present value of only $.16, (1/1.20)10 = 0.16. The critical feature of long-run projects is that costs associated with them are spent early in the project and have high present values while revenues are delayed for several years and have low present values.
This effect may have far-reaching implications. The high interest rates during the 1970s and 1980s, and again in the 2000s, forced many firms to focus on short-run projects. The resulting disregard for long-term technological advancement led to a deterioration in the ability of some U.S. firms to compete in world markets (Hayes and Abernathy, 1980).
The discounted cash flow methods of calculation are simple and straightforward. Like the other financial assessment methods, it has a serious defect. First, it ignores all nonmonetary factors except risk. Second, because of the nature of discounting, all the discounted methods bias the selection system by favoring short-run projects. Let us now examine a selection method that goes beyond assessing only financial profitability.
Financial Options and Opportunity Costs A more recent approach to project selection employs financial analysis that recognizes the value of positioning the organ-ization to capitalize on future opportunities. It is based on the financial options
Table A
=B5−C5 [Copy to D6:D15]
=$65,000 cost savings + $35,000 salvage value
=D5+NPV(B1+B2,D6:D15)
A B C D
4 Year In�ow Out�ow Net Flow
5 20X0* $0 $1,25,000 −$1,25,000
6 20X0 $0 $1,00,000 −$1,00,000
7
1
23
20X1 $0 $90,000 −$90,000
8 20X2 $50,000 $0 $50,000
9 20X3 $1,20,000 $15,000 $105,000
10 20X4 $1,15,000 $0 $1,15,000
11 20X5 $1,05,000 $15,000 $90,000
12 20X6 $97,000 $0 $97,000
13 20X7 $90,000 $15,000 $75,000
14 20X8 $82,000 $0 $82,000
15
16
17
20X9 $1,00,000 $0 $1,00,000
Total $7,59,000 $3,60,000 $3,99,000
NPV $17,997
*t = 0 at the beginning of 20X0
Hurdle Rate 13.0%
In�ation Rate 2.0%
Mantel_c01.indd 16 9/6/2016 7:43:43 PM

1.5 SeleCtIng projeCtS to Meet organIZatIonal oBjeCtIVeS • 17
approach to valuing prospective capital investment opportunities. Through a financial option an organization or individual acquires the right to do something but is not required to exercise that right. For example, you may be familiar with stock options. When a person or organization purchases a stock option, they acquire the right to pur-chase a specific number of shares of a particular stock at a specified price within a specified time frame. If the market price of the stock moves above the specified option price within the specified time frame, the entity holding the option can exercise its right and thereby purchase the stock below the fair market price. If the market price of the stock remains below the specified option price, the entity can choose not to exer-cise its right to buy the stock.
To illustrate the analogy of financial options to project selection, consider a young biotech firm that is ready to begin clinical trials to test a new pharmaceutical product in humans. A key issue the company has to address is how to produce the drug both now in the low volumes needed for the clinical trials and in the mass quantities that will be needed in the future should the new drug succeed in the clinical trial phase. Its options for producing the drug in low volumes for the clinical trials are to invest in an in-house pilot plant or to immediately license the drug to another company. If it invests in an in-house pilot plan, it then has two future options for mass producing the drug: (1) invest in a commercial scale plant or (2) license the manufacturing rights. In effect then, investing now in the pilot plant provides the pharmaceutical company with the option of building a commercial scale plant in the future, an option it would not have if it chooses to license the drug right from the start. Thus by building the in-house pilot plant the pharmaceutical company is in a sense acquiring the right to build a commer-cial plant in the future. While beyond the scope of this book, we point out to the reader that in addition to the traditional approaches to project selection, the decision to build the pilot plant can also be analyzed using valuation techniques from financial options theory. In this case the value of having the option to build a commercial plant can be estimated.
In addition to considering the value of future opportunities a project may provide, the cost of not doing a project should also be considered. This approach to project selec-tion is based on the well-known economic concept of “opportunity cost.” Consider the problem of making an investment in one of only two projects. An investment in Project A will force us to forgo investing in Project B, and vice versa. If the return on A is 12 percent, making an investment in B will have an opportunity cost of 12 percent, the cost of the opportunity forgone. If the return on B is greater than 12 percent, it may be preferred over selecting Project A.
The same selection principle can be applied to timing the investment in a given project. R&D projects or projects involving the adoption of new technologies, for example, have values that may vary considerably with time. It is common for the passage of time to reduce uncertainties involved in both technological and commer-cial projects. The value of investing now may be higher (or lower) than investing later. If a project is delayed, the values of its costs and revenues at a later period should be discounted to their present value when compared to an investment not delayed.
Occasionally, organizations will approve projects that are forecast to lose money when fully costed and sometimes even when only direct costed. Such decisions by upper management are not necessarily foolish because there may be other, more important reasons for proceeding with a project, such as to:
• Acquire knowledge concerning a specific or new technology
• Get the organization’s “foot in the door”
Mantel_c01.indd 17 9/6/2016 4:41:23 PM

18 • Chapter 1 / the World of projeCt ManageMent
• Obtain the parts, service, or maintenance portion of the work
• Allow them to bid on a lucrative, follow-on contract
• Improve their competitive position
• Broaden a product line or line of business
Of course, such decisions are expected to lose money in the short term only. Over the longer term they are expected to bring extra profits to the organization. It should be understood that “lowball” or “buy-in” bids (bidding low with the intent of cutting cor-ners on work and material, or forcing subsequent contract changes) are unethical prac-tices, violate the PMI Code of Ethics for Project Managers (see PMBOK, p. 2, 2013), and are clearly dishonest.
Scoring Methods Scoring methods were developed to overcome some of the disad-vantages of the simple financial profitability methods, especially their focus on a single criterion. The simplest scoring approach, the unweighted 0–1 factor method, lists multiple criteria of significant interest to management. Given a list of the organization’s goals, a selection committee, usually senior managers familiar with both the organization’s crite-ria and potential project portfolio, check off, for each project, which of the criteria would be satisfied; for example, see Figure 1-4. Those projects that exceed a certain number of check-marks may be selected for funding.
PMBOK Guide
Project ________________________________________________________________________
Rater _____________________________Date ________________________________________
QualifiesDoes Not Qualify
No increase in energy requirements xPotential market size, dollars xPotential market share, percent xNo new facility required xNo new technical expertise required xNo decrease in quality of final product xAbility to manage project with current personnel xNo requirement for reorganization xImpact on work force safety xImpact on environmental standards xProfitability
Rate of return more than 15% after tax xEstimated annual profits more than $250,000 x
Time to break-even less than 3 years xNo need for external consultants xConsistency with current line of business xImpact on company image
With customers xWith our industry x
Totals 12 5
Figure 1-4 A sample project selection form, an unweighted 0–1 scoring model.
Mantel_c01.indd 18 9/6/2016 4:41:23 PM

1.5 SeleCtIng projeCtS to Meet organIZatIonal oBjeCtIVeS • 19
All the criteria, however, may not be equally important and the various projects may satisfy each criterion to different degrees. To correct for these drawbacks, the weighted factor scoring method was developed. In this method, a number of criteria, n, are considered for evaluating each project, and their relative importance weights, wj, are estimated. The sum of the weights over all the j criteria is usually set arbitrarily at 1.00, though this is not mandatory. It is helpful to limit the criteria to just the major factors and not include criteria that are only marginal to the decision, such as representing only 2 or 3 percent importance. A rule of thumb is to keep n less than eight factors because the more important factors with weights of, say 20 percent or more force the weights of the less important factors to be insignificant. The impor-tance weights, wj, can be determined in any of a number of ways: a particular indi-vidual’s subjective belief, available objective factors such as surveys or reports, group composite beliefs such as simple averaging among the group members, and so on.
In addition, a score, sij, must be determined for how well each project i satisfies each criterion j. Each score is multiplied by its category weight, and the set of scores is summed to give the total weighted score, Si = Σj sij wj for each project, i, from which the best project is then selected. Typically, a 5-point scale is used to ascertain these scores, though 3-, 7-, and even 9-point scales are sometimes used. The top score, such as 5, is reserved for excellent performance on that criterion such as a return on investment (ROI) of 50 percent or more, or a reliability rating of “superior.” The bottom score of 1 is for “poor performance,” such as an ROI of 5 percent or less, or a reliability rating of “poor.” The middle score of 3 is usually for average or nominal performance (e.g., 15–20% ROI), and 4 is “above average” (21–49% ROI) while 2 is “below average” (6–14% ROI). Notice that the bottom score, 1, on one category may be offset by very high scores on other categories. Any condition that is so bad that it makes a project unacceptable, irrespective of how good it may be on other criteria, is a constraint. If a project violates a constraint, it is removed from the set and not scored.
Note two characteristics in these descriptions. First, the categories for each scale need not be in equal intervals—though they should correspond to the subjective beliefs about what constitutes excellent, below average, and so on. Second, the five-point scales can be based on either quantitative or qualitative data, thus allowing the inclusion of financial and other “hard” data (cash flows, net present value, mar-ket share growth, costs) as well as “soft” subjective data (fit with the organization’s goals, personal preferences, attractiveness, comfort). And again, the soft data also need not be of equal intervals. For example, “superior” may rate a 5 but “OK” may rate only a 2.
The general mathematical form of the weighted factor scoring method is
S s wij
n
ij j1
where
S
si
ij
the total weighted score of the th projectthe score
i
of the th project on the th criterion
the weight or im
i j
wj pportance of the th criterionj
Best Practice
Mantel_c01.indd 19 9/6/2016 4:41:23 PM
20 • Chapter 1 / the World of projeCt ManageMent
Using a Weighted Scoring Model for an Election Campaign Project
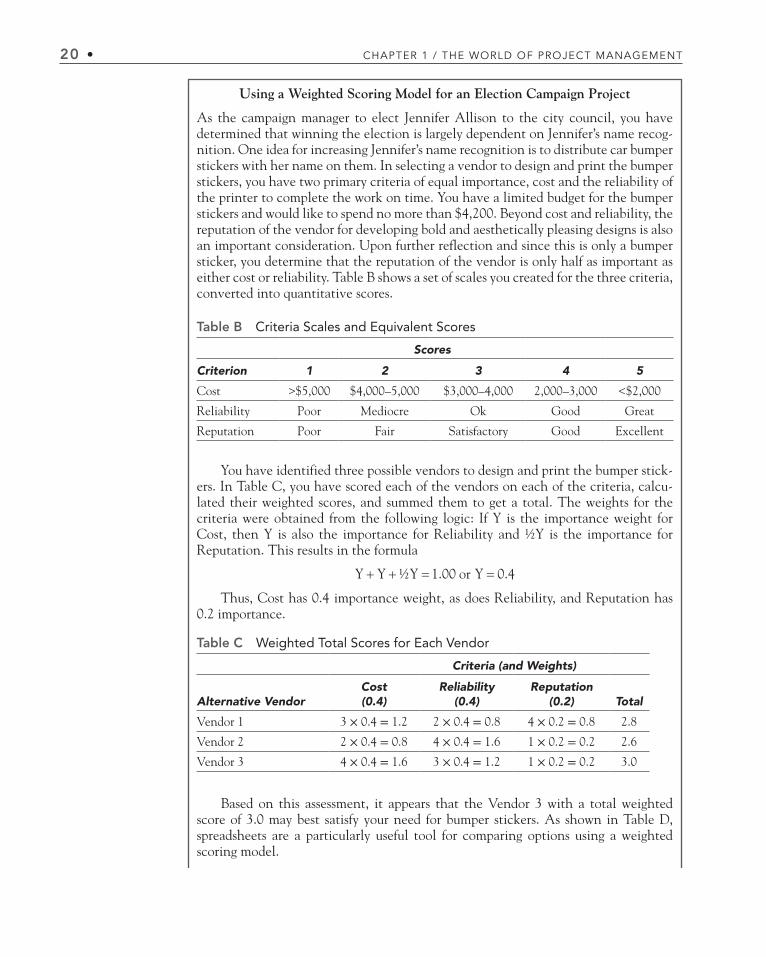
As the campaign manager to elect Jennifer Allison to the city council, you have determined that winning the election is largely dependent on Jennifer’s name recog-nition. One idea for increasing Jennifer’s name recognition is to distribute car bumper stickers with her name on them. In selecting a vendor to design and print the bumper stickers, you have two primary criteria of equal importance, cost and the reliability of the printer to complete the work on time. You have a limited budget for the bumper stickers and would like to spend no more than $4,200. Beyond cost and reliability, the reputation of the vendor for developing bold and aesthetically pleasing designs is also an important consideration. Upon further reflection and since this is only a bumper sticker, you determine that the reputation of the vendor is only half as important as either cost or reliability. Table B shows a set of scales you created for the three criteria, converted into quantitative scores.
Table B Criteria Scales and Equivalent Scores
Scores
Criterion 1 2 3 4 5
Cost >$5,000 $4,000–5,000 $3,000–4,000 2,000–3,000 <$2,000
Reliability Poor Mediocre Ok Good Great
Reputation Poor Fair Satisfactory Good Excellent
You have identified three possible vendors to design and print the bumper stick-ers. In Table C, you have scored each of the vendors on each of the criteria, calcu-lated their weighted scores, and summed them to get a total. The weights for the criteria were obtained from the following logic: If Y is the importance weight for Cost, then Y is also the importance for Reliability and ½Y is the importance for Reputation. This results in the formula
Y Y Y or Y½ . .1 00 0 4
Thus, Cost has 0.4 importance weight, as does Reliability, and Reputation has 0.2 importance.
Table C Weighted Total Scores for Each Vendor
Criteria (and Weights)
Alternative VendorCost (0.4)
Reliability (0.4)
Reputation (0.2) Total
Vendor 1 3 × 0.4 = 1.2 2 × 0.4 = 0.8 4 × 0.2 = 0.8 2.8
Vendor 2 2 × 0.4 = 0.8 4 × 0.4 = 1.6 1 × 0.2 = 0.2 2.6
Vendor 3 4 × 0.4 = 1.6 3 × 0.4 = 1.2 1 × 0.2 = 0.2 3.0
Based on this assessment, it appears that the Vendor 3 with a total weighted score of 3.0 may best satisfy your need for bumper stickers. As shown in Table D, spreadsheets are a particularly useful tool for comparing options using a weighted scoring model.
Mantel_c01.indd 20 9/6/2016 4:41:23 PM

1.6 the projeCt portfolIo proCeSS • 21
Project selection is an inherently risky process. Throughout this section we have treated risk by “making allowance” for it. Managing and analyzing risk can be handled in a more straightforward manner. By estimating the highest, lowest, and most likely values that costs, revenues, and other relevant variables may have, and by making some other assumptions about the world, we can estimate outcomes for the projects among which we are trying to make selections. This is accomplished by simulating project outcomes. In Section 4.5, we will demonstrate how to do this using Crystal Ball® (CB) on a sample selection problem.
1.6 THE PROJECT PORTFOLIO PROCESS
The Project Portfolio Process (PPP) attempts to link the organization’s projects directly to the goals and strategy of the organization. This occurs not only in the project’s initia-tion and planning phases, but also throughout the life cycle of the projects as they are managed and eventually brought to completion. This topic is compared to project and program management in PMBOK’s Chapter 1: Introduction. Thus, the PPP is also a means for monitoring and controlling the organization’s strategic projects, as will be reiterated in Chapter 7: Monitoring and Controlling the Project. On occasion this will
Risk
The PM should understand why a project is selected for funding so that the pro-ject can be managed to optimize its advantages and achieve its objectives. There are two types of project selection methods: numeric and nonnumeric. Both have their advantages. Of the numeric methods, there are two subtypes—methods that assess the profits associated with a project and more general methods that measure non-monetary advantages in addition to the monetary pluses. Of the financial methods, the discounted cash flow is best. In our judgment, however, the weighted scoring method is the most useful.
PMBOK Guide
Table D Creating a Weighted Scoring Model in a Spreadsheet
A B C D E
1 Criteria Cost Reliability Reputation
2 Weights 0.4 0.4 0.2
3
4 Alternative Vendor Cost Reliability Reputation Total
5 Vendor 1 3 2 4 2.8
6 Vendor 2 2 4 1 2.6
7 Vendor 3 4 3 1 3.0
8
9 Formula
10 Cell E5 = SUMPRODUCT(B$2:D$2,B5:D5)
11 (copy to cells E6:E7)
Mantel_c01.indd 21 9/6/2016 4:41:23 PM
22 • Chapter 1 / the World of projeCt ManageMent
mean shutting down projects prior to their completion because their risks have become excessive, their costs have escalated beyond their expected benefits, another (or a new) project does a better job of supporting the goals, or any of a variety of similar reasons. The steps in this process generally follow those described in Longman, Sandahl, and Speir (1999) and Englund and Graham (1999).
The first step is to appoint a Project Council to establish and articulate a strategic direction for projects. The Council should report to a senior executive since it will be responsible for allocating funds to those projects that support the organization’s goals and controlling the allocation of resources and skills to the projects. In addition to senior management, other appropriate members of the Project Council include program man-agers, project managers of major projects; the head of the PMO, and general managers who can identify key opportunities and risks facing the organization.
Next, various project categories are identified so the mix of projects funded by the organization will be spread appropriately across those areas making major contributions to the organization’s goals. In addition, within each category criteria are established to discriminate between very good and even better projects using the weighted scoring model previously discussed. The criteria are also weighted to reflect their relative importance.
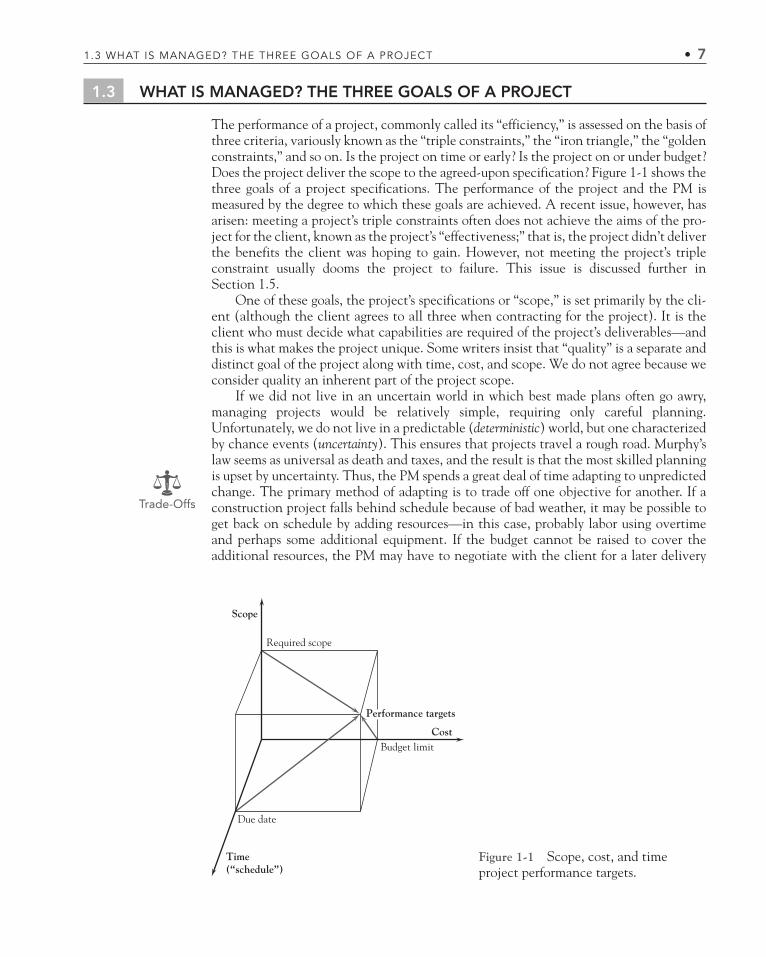
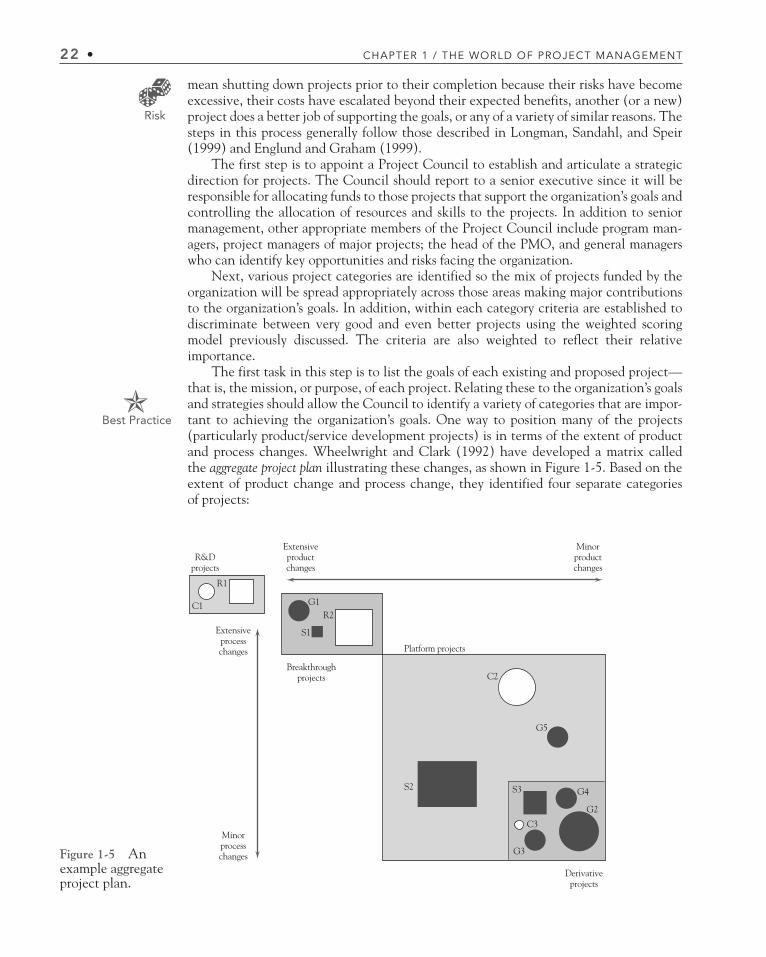
The first task in this step is to list the goals of each existing and proposed project—that is, the mission, or purpose, of each project. Relating these to the organization’s goals and strategies should allow the Council to identify a variety of categories that are impor-tant to achieving the organization’s goals. One way to position many of the projects (particularly product/service development projects) is in terms of the extent of product and process changes. Wheelwright and Clark (1992) have developed a matrix called the aggregate project plan illustrating these changes, as shown in Figure 1-5. Based on the extent of product change and process change, they identified four separate categories of projects:
Risk
Best Practice
Derivativeprojects
Breakthroughprojects
Extensiveproductchanges
Platform projects
C2
G5
G1
R1
C1
S1
R2
S2
Extensiveprocesschanges
Minorprocesschanges
R&Dprojects
Minorproductchanges
S3 G4
G2
C3
G3Figure 1-5 An example aggregate project plan.
Mantel_c01.indd 22 9/6/2016 4:41:24 PM

1.6 the projeCt portfolIo proCeSS • 23
1. Derivative projects These are projects with objectives or deliverables that are only incrementally different in both product and process from existing offerings. They are often meant to replace current offerings or add an extension to current offerings (lower priced version, upscale version).
2. Platform projects The planned outputs of these projects represent major departures from existing offerings in terms of either the product/service itself or the process used to make and deliver it, or both. As such, they become “platforms” for the next genera-tion of organizational offerings, such as a new model of automobile or a new type of insurance plan. They form the basis for follow-on derivative projects that attempt to extend the platform in various dimensions.
3. Breakthrough projects Breakthrough projects typically involve a newer technology than platform projects. It may be a “disruptive” technology that is known to the industry or something proprietary that the organization has been developing over time. Examples here include the use of fiber-optic cables for data transmission, cash-balance pension plans, and hybrid gasoline-electric automobiles.
4. R&D projects These projects are “blue-sky,” visionary endeavors, oriented toward using newly developed technologies, or existing technologies in a new manner. They may also be for acquiring new knowledge, or developing new technologies themselves.
The size of the projects plotted on the array indicates the size/resource needs of the project, and the shape may indicate another aspect of the project (e.g., internal/external, long/medium/short term, or whatever aspect needs to be shown). The numbers indicate the order, or time frame, in which the projects are to be (or were) implemented, sepa-rated by category, if desired.
The aggregate project plan can be used to:
• View the mix of projects within each illustrated aspect (shape)
• Analyze and adjust the mix of projects within each category or aspect
• Assess the resource demands on the organization, indicated by the size, timing, and number of projects shown
• Identify and adjust the gaps in the categories, aspects, sizes, and timing of the projects
• Identify potential career paths for developing project managers, such as team members of a derivative project, then team member of a platform project, man-ager of a derivative project, member of a breakthrough project, and so on
For each existing and proposed project, assemble the data appropriate to that cate-gory’s criteria. Include the timing, both date and duration, for expected benefits and resource needs. Use the project plan, a schedule of project activities, past experience, expert opinion, whatever is available to get a good estimate of these data. If the project is new, you may want to fund only enough work on the project to verify the assumptions.
Next, use the criteria score limits, or constraints as described in our discussions of scoring models, to screen out the weaker projects. For example, have costs on existing projects escalated beyond the project’s expected benefits? Has the benefit of a project lessened because the organization’s goals have changed? Also, screen in any projects that do not require deliberation, such as projects mandated by regulations or laws, projects that are competitive or operating necessities (described above), projects required for environmental or personnel reasons, and so on. The fewer projects that need to be com-pared and analyzed, the easier the work of the Council.
Mantel_c01.indd 23 9/6/2016 4:41:24 PM

24 • Chapter 1 / the World of projeCt ManageMent
When we discussed financial models and scoring models, we urged the use of multi-ple criteria when selecting projects. ROI on a project may be lower than the firm’s cut-off rate, or even negative, but the project may be a platform for follow-on projects that have very high benefits for the firm. Wheatly (2009) also warns against the use of a single criterion, commonly the return on investment (ROI), to evaluate projects. A project aimed at boosting employee satisfaction will often yield improvements in output, quality, costs, and other such factors. For example, Mindtree, of Bangalore, India, measures ben-efits on five dimensions; revenue, profit, customer satisfaction, employee satisfaction, and intellectual capital created—in sum, “Have we become a better company?”
Next, assess the availability of both internal and external resources, by type, depart-ment, and timing. Timing is particularly important, since project resource needs by type typically vary up to 100 percent over the life cycle of projects. Needing a normally plenti-ful resource at the same moment it is fully utilized elsewhere may doom an otherwise promising project. Eventually, the Council will be trying to balance aggregate project resource needs over future periods with resource availabilities, so timing is as important as the amount of maximum demand and availability. Many managers insist on trying to schedule resource usage as closely as possible to system capacity. This is almost certain to produce a catastrophe (see Section 6.3, subsection on Resource Loading/Leveling and Uncertainty).
Then use multiple screens to reduce the number of competing projects. The first screen should be each project’s support of the organization’s goals, but other possible screens might be:
• Whether the required competence exists in the organization
• Whether there is a market for the offering
• The likely profitability of the offering
• How risky the project is
• If there is a potential partner to help with the project
• If the right resources are available at the right times
• If the project uses the organization’s strengths, or depends on its weaknesses
• If the project is synergistic with other important projects
• If the project is dominated by another existing or proposed project
• If the project has slipped in its desirability since the last evaluation
Now apply the scores and criterion weights to rank the projects within each category. It is acceptable to hold some hard-to-measure criteria out for subjective evaluation, such as riskiness, or development of new knowledge. Subjective evaluations can be translated from verbal to numeric terms easily by the Delphi* Method, pairwise comparisons, or other methods.
Finally, select the projects to be funded and those to be held in reserve. That is, determine the mix of projects across the various categories and time periods. Next be sure to leave some percentage (e.g., 20%) of the organization’s resource capacity free for new opportunities, crises in existing projects, errors in estimates, and so on. Then allocate
*The Delphi Method, developed more than 40 years ago, is still unequaled as a method for transforming the diverse subjective opinions of a group into a numeric scale. See Dalkey (1969).
Mantel_c01.indd 24 9/6/2016 4:41:24 PM
1.7 the MaterIalS In thIS teXt • 25
the categorized projects in rank order to the categories according to the mix desired. It is usually good practice to include some speculative projects in each category to allow future options, knowledge improvement, additional experience in new areas, and so on. The focus should be on committing to fewer projects but with sufficient funding to allow project completion. Document why late projects were delayed and why any were defended.
Be sure to make the results of the PPP widely known, including the documented reasons for project cancellations, deferrals, and nonselection as was mentioned earlier. Top management must now make their commitment to this project portfolio process totally clear by supporting the process and its results. This may require a PPP champion near the top of the organization. As project proposers come to understand and appreciate the workings and importance of the PPP, their proposals will more closely fit the profile of the kinds of projects the organization wishes to fund. As this happens, it is important to note that the Council will have to concern itself with the reliability and accuracy of proposals competing for limited funds. Senior management must fully fund the selected projects. It is unethical and inappropriate for senior management to undermine PPP and the Council as well as strategically important projects by playing a game of arbitrarily cutting χ percent from project budgets. It is equally unethical and inappropriate to pad potential project budgets on the expectation that they will be arbitrarily cut.
Finally, the process must be repeated on a regular basis. The Council should deter-mine the frequency, which to some extent will depend on the speed of change within the organization’s industry. For some industries, quarterly analysis may be best, while in slow-moving industries yearly may be fine.
In an article on competitive intelligence, Gale (2008b) reports that Cisco Systems Inc. constantly tracks industry trends, competitors, the stock market, and end users to stay ahead of their competition and to know which potential projects to fund. Pharmaceutical companies are equally interested in knowing which projects to drop if competitors are too far ahead of them, thereby saving millions of dollars in development and testing costs.
1.7 THE MATERIALS IN THIS TEXT
When reading a text, it is helpful to understand how the book is organized and where it will take the reader. Following this introductory chapter, our attention goes to the vari-ous roles the PM must play and the ways projects are organized. Chapter 2 focuses on the behavioral and structural aspects of projects and their management. It describes the PM’s roles as communicator, negotiator, and manager. It also includes a discussion of project management as a profession and reports briefly on the Project Management Institute (PMI), the PM’s professional organization. Then attention turns to the ways in which
Projects are often subdivisions of major programs. Long-run success is determined by the organization’s portfolio of projects. Classified by the extent of innovation in prod-uct and process, there are four types of projects: derivative, breakthrough, platform, and R & D projects. The actual mix of projects is a direct expression of the organi-zation’s competitive strategy. A proper mix of project categories can help ensure its long-run competitive position. It is important for the Project Council or PMO to preplan project portfolio adjustments to respond to significant changes in the state of competition and other environmental changes.
Mantel_c01.indd 25 9/6/2016 4:41:24 PM

26 • Chapter 1 / the World of projeCt ManageMent
projects can be organized within the parent establishment. Matrix organization is dis-cussed at length as are the conflicts and managerial problems that matrix organizations tend to foster. Finally, the chapter moves to the project team: its purposes and the wide-spread use of transdisciplinary teams. Using transdisciplinary teams to plan and carry out the project is a source of both creativity and conflict. The process of building effective teams is briefly covered.
The remainder of the book is designed to conform to the life cycle of any project, whatever the shape of the life cycle curve. Chapter 3 covers the process of planning and launching the project, construction of the work breakdown structure (WBS), and responsibil-ity assignment matrices. These activities require the project team to estimate resource and time requirements for accomplishing what the project plan has described. The chapter ends with a full discussion of the topic of risk management. Chapter 4 discusses the construction of a project budget and further illustrates the use of risk management for budgeting.
Chapter 5 covers scheduling, the Program Evaluation Review Technique (PERT), the Critical Path Method (CPM), and Gantt charts, the most common ways of illustrat-ing the project schedule. Schedules will be calculated under conditions of uncertainty in two ways: (1) using standard probability theory, and (2) using simulation. In Chapter 6 resource allocation is discussed. To begin, we consider the problem of crashing a project, that is, using additional resources in order to shorten project duration. Then we deal with two fundamental problems of resource management. First, a schedule of resource usage must be prepared (a.k.a., resource loading). Second, we adjust the resource loads to avoid gluts and shortages of valuable resources, (a.k.a., resource leveling). The problems of resource usage when there are multiple projects competing for a limited resource pool are then covered, as are ways of dealing with these problems. The chapter ends with a discus-sion of Goldratt’s Critical Chain (1997).
The subjects of Chapter 7 are monitoring and controlling projects. The nature of project data collection is explained, and various types of project reports, including earned value reports, are illustrated and discussed. Following this, we cover the general purposes and mechanisms for project control. The chapter ends with a section devoted to the control of change on a project. It is here that we discuss “scope creep” and how to control it.
Chapter 8 deals with evaluating, auditing, and closing down projects. The project team often fears evaluation and auditing. Team members usually equate these activities with fault finding, but when correctly used they are valuable aids for the PM and team. Project closure is usually ignored or treated as a trivial problem in practice—and in most works on project management. We feel it is an important and complex process that may cause serious problems if not handled properly.
Throughout this book there are illustrations of the tools and reports used by project managers. Many of these were produced using Microsoft Project® (MSP), Crystal Ball® (CB), and Excel®. (All illustrations and applications generated by MSP, CB, and Excel®, or any other application software will be clearly identified.) There are literally hundreds of project management software packages on the market. Most of them perform with reasonable competence in the tasks for which they were designed. Of the packages intended for overall project management, MSP is by far the favorite, with roughly half the total market. There is also a large number of specialized software packages, for exam-ple, report generators, and special risk management packages. Most are compatible with MSP or Excel®, often seamlessly so, and we mention some of them when relevant. In the past decade or two, spreadsheet software has become highly sophisticated. Excel®, for example, can perform simulations and statistical analysis as well as handle the usual arithmetic, accounting, and financial calculations.
Mantel_c01.indd 26 9/6/2016 4:41:24 PM

dISCuSSIon queStIonS • 27
When one reads the literature of project management, one sees much about risk management. Too often, it may seem to the reader that risk management is a highly spe-cific task. It isn’t. Risk management is a reference to a class of ideas, methods, and tech-niques that aids the management of projects being carried out in an uncertain world. Outside factors can affect projects in a wide variety of ways, and so our discussions of risk management cannot be restricted to a chapter on the subject. They appear throughout the book. Tools and techniques are introduced as they are needed to deal with specific problems. The reader should note that these tools have wide application beyond project management and most are valuable for the general manager as well as the PM.
With this introduction, let us begin our study of project management.
REVIEW QUESTIONS
1. What are the primary roles of a project manager? How are the primary roles related to one another?
2. Contrast a project from a nonproject.3. Contrast win-lose negotiation, lose-lose negotiation,
and win-win negotiation and explain why the latter is so important in project management.
4. Identify the three goals of a project. What does it mean for a project to be “overdetermined?”
5. Contrast the two types of project life cycles and discuss why it is important to know which type the current project is following.
6. How does the weighted scoring approach avoid the drawbacks of the NPV approach? Can the two approaches be combined? How? What weights would be appropriate if they were combined?
7. Why is it suggested that factors with less than 2 per-cent or 3 percent impact not be considered in the weighted scoring approach?
8. Draw a distinction between a project and a program. Why is the distinction important?
9. Why are R&D projects in a company’s Aggregate Pro-ject Plan significantly different in type from the firm’s Derivative, Breakthrough, and Platform projects?
Risk
DISCUSSION QUESTIONS1. Contrast the three types of nonnumeric project selec-
tion methods. Could any specific case combine two of them, such as the sacred cow and the operating neces-sity, or the comparative benefits and the competitive necessity?
2. What errors in a firm’s project portfolio might the Wheelwright and Clark aggregate project plan graphi-cally identify?
3. You are the project manager of a team of software spe-cialists working on a project to produce a piece of application software in the field of project manage-ment. Give some examples of things that might go wrong on such a project and the sorts of trade-offs you might have to make.
4. In Figure 1-5, what distribution of large and small cir-cles and squares across the four boxes would character-ize a strong, well-positioned product development business? A weak business?
5. Give several examples of projects found in your city, region, or country—avoiding those used as examples in the chapter.
6. For each of the projects identified in the answer to Question 5, is the life cycle for the project S-shaped or J-shaped? Why?
7. Construct a list of factors, conditions, and circum-stances you think might be important for a manufac-turing firm to evaluate during the project selection process. Do the same for a computer repair shop.
8. How might you use project management for doing a major school work assignment?
9. What advantages are lost if the sum of the weights in a weighted scoring approach does not add to 1.0?
10. Why is it important for a project to have “flexibility?”
Mantel_c01.indd 27 9/6/2016 4:41:24 PM

28 • Chapter 1 / the World of projeCt ManageMent
1. A 4-year financial project is forecast to have net cash inflows of $20,000; $25,000; $30,000; and $50,000 in the next 4 years. It will cost $75,000 to implement the project, payable at the beginning of the project. If the required rate of return is 0.2, conduct a discounted cash flow calculation to determine the NPV.
2. A company has established a project team to identify a location for a new manufacturing facility. Use a weighted scoring model to analyze three candidate locations (A, B, C) for setting up the new factory. The relative weights for each criterion are shown in the following table. A score of 1 represents unfavorable, 2 satisfactory, and 3 favorable.
Location
Category Weight A B C
Labor costs 20 1 2 3Labor productivity 20 2 3 1Labor supply 10 2 1 3Union relations 10 3 3 2Material supply 10 2 1 1Transport costs 25 1 2 3Infrastructure 5 2 2 2
3. (a) Compare your answer in Exercise 2 to the answer you would have found if you had used an unweighted, 0-1 scoring model. Assume that a score of 1 means does not qualify and a 2 or 3 means it does qualify.
(b) Next, revise the unweighted model by deleting all categories that, as recommended, have a weight of less than 20 percent. Compare to your answer to (a) above and also Exercise 2. Which method seems best?
4. Using a spreadsheet for Exercise 2, find the following:(a) What would be your recommendation if the
weight for the transport cost went down to 10 and the weight for union relations went up to 25?
(b) Suppose location A received a score of 3 for transport cost and location C received a score of 2 for transport cost. Would your recommendation change under these circumstances?
(c) The VP of Finance has looked at your scoring model and feels that tax considerations should be included in the model with a weight of 15. In addition, the VP has scored the locations on tax considerations as follows: A-3, B-2, and C-1. How does this affect your recommendation?
5. Nina has been asked to lead a team that has been tasked with finding a new location for a boutique con-cept her company would like to test. The team has identified four candidate shopping centers to locate the new boutique in. Some cater to a higher class of clientele than others, some are in an indoor mall, some have a much greater volume than others, and, of course, rent varies considerably. Because of the nature of the boutique, the team has decided that the class of clientele is the most important consideration. Following this, the team considered expenses and rent as the next most important criterion— probably 90 percent as important as clientele. An indoor, temperature-controlled mall is a big help for stores such as the concept being considered where 70 per-cent of sales are from passersby slowly strolling and window shopping. Thus, the team rates this as about 95 percent as important as rent. Last, a higher volume of shoppers means more potential sales; thus the team rates this factor as 80 percent as important as rent.
As an aid in visualizing her location alternatives, the team has constructed the following table. A “good” is scored as 3, “fair” as 2, and “poor” as 1. Use a weighted score model to help Nina and her team come to a decision.
Location
1 2 3 4
Class of clientele Fair Good Poor GoodRent Good Fair Poor GoodIndoor mall Good Poor Good PoorVolume Good Fair Good Poor
6. Using a spreadsheet for Exercise 5, determine how Nina’s ability to negotiate a lower rent at location 3, thereby raising its ranking to “good,” will affect the overall rankings of the four locations.
EXERCISES
INCIDENT FOR DISCUSSION
Broken Welds
A manufacturer of mountain bicycles designed an auto-mated system for welding bike frames. For 3 years, the sys-tem worked nicely, handling about 1,000 frames per shift.
Production was scheduled for two shifts per day. The sys-tem was designed to weld the frame and then to check the quality of each weld. The welded frames were then trans-ported to another plant for assembly.
Mantel_c01.indd 28 9/6/2016 4:41:24 PM

InCIdent for dISCuSSIon • 29
Recently, a few of the frames had failed. Careful testing showed that a foreign substance in the welding rod pur-chased from an outside vendor possibly contributed to the failure. When checked, however, the rods conformed to the specifications given to the Purchasing Department and guaranteed by the vendor. The Chief Engineer ordered the Production Department’s Project Leader, Alison Passette, to create a project immediately to find out pre-cisely what was causing the failures and to find a way to solve the problem. This project was to take priority over all other projects in the department.
Alison was familiar with the Chief Engineer’s tendency to overreact to any glitches in the production process, so she decided to determine the impact of the proposed pro-
ject on all the other projects in the department. She also discussed the problem with Ken Kelsey, one of her welding experts, who felt sure he could solve the welding problems by determining what foreign substance, if any, caused the problem. He could then set up a system to detect the pres-ence of the substance and reweld the affected frames. Of course, he added, they would also have to change their specifications for the welding rod to eliminate the chemi-cal responsible for the failures.
Question: What information does Alison need to deter-mine the probable impact of Kelsey’s proposed project on the other projects in the department? Should her findings affect her decision about Kelsey’s project? How?
C A S EFriendly Assisted Living Facility—1
Friendly Medical Center, an urban, nonprofit, 450-bed rehabilitation hospital, began to see a significant decline in admissions. Friendly Medical Center’s mission focuses on inpatient and outpatient rehabilitation of the severely injured and catastrophically ill. While the patient census varied from month to month, it appeared to the Friendly Medical Center Board of Trustees that the inpatient popu-lation was slowly but steadily declining. The hospital’s market researchers reported that fewer people were being severely injured due to the popularity of seat belts and bicycle/motorcycle helmets. In order to get a handle on the future of the organization, the Board, and the CEO, Fred Splient M.D. called for a major strategic planning effort to take place.
In January 20X6, Friendly Medical Center held a plan-ning retreat to identify future opportunities. The outcome of the retreat was that the Medical Center needed to focus its efforts around two major strategic initiatives. The first, a short-run initiative, was to be more cost-effective in the delivery of inpatient care. The second, a long-run strategy, was to develop new programs and services that would capi-talize on the existing, highly competent rehabilitation therapy staff and Friendly Medical Center excellent repu-tation in the region.
At the time of the retreat, Fred Splient’s parents were living with him and his family. Fred was an active member of the “sandwich generation.” His parents were aging and developing many problems common to the geriatric popu-lace. Their increased medical needs were beginning to wear on Fred and his family. It crossed Fred’s mind that life might be more pleasant if the hospital Board approved an expansion of the Medical Center’s campus to include an assisted living facility.
In March 20X6, Fred had his Business Development team prepare a rough estimate of the potential return on the investment of an assisted living facility. He asked the team to identify different options for facility construction and the associated costs. The team also did a complete competitive analysis and examined the options for services to be offered based on Friendly Medical Center’s potential population base and catchment area. The Business Development team visited several facilities across the country. The team also interviewed companies that could oversee the design, building, and operation of the facility for Friendly Medical Center. The development team pro-duced a preliminary business plan based on the recom-mended structure for the facility, estimated capital expenditure needs, estimated income from operation of the facility, as well as projected revenues to other Medical Center programs resulting from the facility’s population.
The plan was presented at the May 20X6 meeting of the Board of Trustees. Fred Splient and his team intro-duced the Board to the concept of opening an assisted liv-ing facility on Friendly Medical Center’s campus. The facility would be set up as a for-profit subsidiary of the Medical Center so that it could generate a profit and not be subjected to the strict guidelines of the hospital’s accrediting agencies. As a subsidiary organization, how-ever, the Board would still have control.
The chosen facility design was a freestanding apartment-like facility with a sheltered connection to the Hospital for access to the kitchen and hospital services. The facility would have 100 units with 15 to 30 of the units classified as “heavy-assisted” and built to code to house the physically and medically disabled. The rest of the units would be “light-assisted,” larger apartments. The population would be approximately 110 to 150 residents, with most being single occupants rather than couples.
Mantel_c01.indd 29 9/6/2016 4:41:24 PM

30 • Chapter 1 / the World of projeCt ManageMent
The light-assisted apartments could hold residents who required only minor medical and social interventions. The residents of the heavy-assisted section would have more medical needs and would require assistance getting around. The Business Development team recommended this type of programming model, because many assisted living facili-ties were erected across the country, but few had a medical focus and offered the types of services that Friendly Medical Center could offer—physical and occupational therapy programs and behavior management programs to name a few.
The Board was assured that the facility would meet the strategic initiative of a growing business. The business plan projected an immediate increase in the number of referrals to the outpatient therapy programs. Another pro-jected deliverable of the project was to enable Friendly Medical Center to strengthen its focus on reimbursable preventive and wellness programs for the healthier geriat-ric population. The project’s longer-term goal was to increase the census in the hospital’s inpatient units by having a location where people could age in place until they were in need of hospitalization, and then such a facil-ity would be right next door.
Depending on the exact size of the apartments, their equipment, and the actual ratio of heavy- to light-assisted units, Fred estimated that the entire project would cost between $8,500,000 and $11,000,000 for the facility con-struction. That estimate included the cost of land, furnish-ings, and a sheltered connection to the hospital. When up and running, it was estimated that the net income would range between $9,000 and $12,000 per unit per year. The team estimated the net cash flow for the entire project to be around $1,500,000 per year.
Fred requested the Board to approve the concept and allow his team to prepare a pro forma plan to the Board for approval. The plan would include a recommended design for both heavy- and light-assisted apartments. It would also include all costs of land, construction, furnishings, and staffing. Income estimates would be included and would be conservatively biased. A timetable would also be included.
The Board conducted several executive sessions, and by the middle of May voted to approve the concept. They approved the architectural-construction-management firm recommended by the team, and they requested Splient to proceed with developing a complete project plan. The Board appointed two Board members to sit on Fred’s planning group.
In June, Dr. Splient gathered his executive team together and presented the project mission, and scope. He reported that the board had approved a small budget to finance the planning process. The Board also stipulated that construction could not begin until after the November 20X6 city elections because two of the Board Members were running in that election, one for a city council seat and one as a county commissioner. The Board also stated that they would like a plan that would allow the facility to open by July 20X7, as research has shown that many adult children find the summer the easiest time to assist their parents in finding an alternative to independent living arrangements. The CEO and executive team were now confident that they were ready to launch the project to plan, build, and open an assisted living facility at Friendly Medical Center.
QUESTIONS
1. Identify as well as you can the three iron triangle constraints for this project: cost, time, and scope.
2. Identify the expected benefits of this project for Friendly Medical Center.
3. Comment on the strategic initiatives resulting from the Board’s major strategic planning retreat. Would you consider this a productive retreat?
4. What “project selection” procedure was used here? How common do you think this is? How wise do you think it is?
C A S EHandstar Inc.
Handstar Inc. was created a little over 4 years ago by two college roommates to develop apps for smartphones.
It has since grown to ten employees with annual sales approaching $1.5 million. Handstar’s original product was an expense report app that allowed users to record expenses on their smartphone and then export their expenses into a
Mantel_c01.indd 30 9/6/2016 4:41:24 PM

queStIonS • 31
spreadsheet that then created an expense report in one of five standard formats. Based on the success of its first product, Handstar subsequently developed three addi-tional apps: an app for tracking and measuring the perfor-mance of investment portfolios, a calendar app, and an email app.
The two founders of Handstar have recently become concerned about the competitiveness of the firm’s offer-ings, particularly since none of them has been updated since their initial launch. Therefore, they asked the direc-tors of product development and marketing to work together and prepare a list of potential projects for updat-ing Handstar’s current offerings as well as to develop ideas for additional apps. The directors were also asked to esti-mate the development costs of the various projects, prod-uct revenues, and the likelihood that Handstar could retain or obtain a leadership position for the given app. Also, with the increasing popularity of mobile computing, the founders asked the directors to evaluate the extent to which the products made use of the Web.
The product development and marketing directors identified three projects related to updating Handstar’s existing products. The first project would integrate Handstar’s current calendar app with its email app. Integrating these two apps into a single app would provide a number of benefits to users such as allowing them to automatically enter the dates of meetings into the calen-dar based on the content of an email message. The direc-tors estimated that this project would require 1,250 hours of software development time. Revenues in the first year of the product’s launch were estimated to be $750,000. However, because the directors expected that a large per-centage of the users would likely upgrade to this new prod-uct soon after its introduction, they projected that annual sales would decline by 10 percent annually in subsequent years. The directors speculated that Handstar was moder-ately likely to obtain a leadership position in email/calen-dar apps if this project were undertaken and felt this app made moderate use of the Web.
The second project related to updating the expense report app. The directors estimated that this project would require 400 hours of development time. Sales were estimated to be $250,000 in the first year and to increase 5 percent annually in subsequent years. The directors spec-ulated that completing this project would almost certainly
maintain Handstar’s leadership position in the expense report category, although it made little use of the Web.
The last product enhancement project related to enhancing the existing portfolio tracking app. This pro-ject would require 750 hours of development time and would generate first-year sales of $500,000. Sales were pro-jected to increase 5 percent annually in subsequent years. The directors felt this project would have a high probabil-ity of maintaining Handstar’s leadership position in this category and the product would make moderate use of the Web.
The directors also identified three opportunities for new products. One project was the development of a spreadsheet app that could share files with spreadsheet programs written for PCs. Developing this app would require 2,500 hours of development time. First-year sales were estimated to be $1,000,000 with an annual growth rate of 10 percent. While this app did not make use of the Web, the directors felt that Handstar had a moderate chance of obtaining a leadership position in this prod-uct category.
The second new product opportunity identified was an app for browsing the Web. Developing this app would require 1,875 development hours. First-year sales were estimated to be $2,500,000 with an annual growth rate of 15 percent. Although this app made extensive use of the Web, the directors felt that there was a very low probabil-ity that Handstar could obtain a leadership position in this product category.
The final product opportunity identified was a trip planner app. This product would require 6,250 hours of development time. First-year sales were projected to be $1,300,000 with an annual growth rate of 5 percent. Like the Web browser app, the directors felt that there was a low probability that Handstar could obtain a leadership position in this category, although the program would make extensive use of the Web.
In evaluating the projects, the founders believed it was reasonable to assume each product had a 3-year life. They also felt that a discount rate of 12 percent fairly reflected the company’s cost of capital. An analysis of payroll records indicated that the cost of software developers is $52 per hour including salary and fringe benefits. Currently there are four software developers on staff, and each works 2,500 hours per year.
QUESTIONS
1. Which projects would you recommend Handstar pur-sue based on the NPV approach?
2. Assume the founders weigh a project’s NPV twice as much as both obtaining/retaining a leadership posi-tion and making use of the Web. Use the weighted
factor scoring method to rank these projects. Which projects would you recommend Handstar pursue?
3. In your opinion is hiring an additional software development engineer justified?
Mantel_c01.indd 31 9/6/2016 4:41:24 PM

32 • Chapter 1 / the World of projeCt ManageMent
BIBLIOGRAPHY
Adams, J. R., and S. E. Barndt. “Behavioral Implications of the Project Life Cycle.” In D. I. Cleland, and W. R. King, eds., Project Management Handbook. New York: Van Nostrand Reinhold, 1983.Boznak, R. G. “Management of Projects: A Giant Step Beyond Project Management.” PM Network, January 1996.Dalkey, N.C. The Delphi Method: An Experimental Study of Group Opinion (RM-5888-PR) Santa Monica, CA: The Rand Corporation, June 1969.Englund, R. L., and R. J. Graham. “From Experience: Linking Projects to Strategy.” Journal of Product Innovation Management, Vol. 16, No. 1, 1999.Fisher, R., and W. Ury. Getting to Yes. Harmondsworth, Middlesex, G. B.: Penguin Books, 1983. (This is a classic book on win-win negotiations, in addition to being good reading.)Gale, S. F. “The Great Unknown.” PM Network, May 2008a.Gale, S. F. “In the Know.” PM Network, July 2008b.Goldratt, E. M. Critical Chain. Great Barrington, MA: North River, 1997.Green, S. G. “Top Management Support of R&D Projects: A Strategic Leadership Perspective.” IEEE Transactions on Engineering Management, August 1995. (What Prof. Green has to say about the role of a project sponsor in support of R&D projects applies equally well to all sorts of projects.)Hatfield, M. “Danger Ahead.” PM Network, March, 2008.Hayes, R., and W. J. Abernathy. “Managing Our Way to Economic Decline.” Harvard Business Review, July–August 1980. (An excellent, persuasive, and timeless blast at those who focus their business decisions solely on short-run profits.)Helin, A. F., and W. E. Souder. “Experimental Test of a Q-Sort Procedure for Prioritizing R&D Projects.” IEEE Transactions on Engineering Management, November 1974.Hildebrand, C. “In Flux.” PM Network, December 2008.Jandt, F. E. Win-Win Negotiating. New York: John Wiley, 1987.Kaplan, R. S. “Must CIM Be Justified by Faith Alone?” Harvard Business Review, March–April 1986.Kloppenborg, T. J., and S. J. Mantel, Jr. “Trade-offs on Projects: They May Not Be What You Think.” Project Management Journal, March 1990.Levine, H. A. “Enterprise Project Management: What Do Users Need? What Can They Have?” PM Network, July 1998.
Longman, A., D. Sandahl, and W. Speir. “Preventing Project Proliferation.” PM Network, July 1999.Meredith, J. R., and S. J. Mantel, Jr. Project Management: A Managerial Approach, 8th ed., New York: John Wiley, 2012.Morgan, M., R. E. Levitt, and W. Malek. Executing Your Strategy: How to Break it Down and Get it Done. Boston: Harvard Business Review Press, 2007.Moyer, R. C., J. R. McGuigan, and W. J. Kretlow. Contemporary Financial Management, 10th ed., Cincinnati: South-Western, 2008.Pennypacker, J. S., and K. P. Grant. “Project Manage-ment Maturity: An Industry Benchmark.” Project Man-agement Journal, March 2003. (This article, based on a survey of 123 firms, utilizes a two-dimensional framework to assess organizational project delivery capability. Organizations can use the results of the study to bench-mark their level of project management maturity.)Project Management Institute Standards Committee. A Guide to the Project Management Body of Knowledge PMBOK® Guide, 5th ed., Newtown Square, PA: Project Management Institute, 2013. (A must own, and read, by every project manager.)Raiffa, H. The Art and Science of Negotiation. Cambridge: Belknap/Harvard Press, 1982. [Like Fisher and Ury (1983), this is a classic on the subject of win-win negotiation. Probably the most influential book in its field, and justly so.]Sharpe, P., and T. Keelin. “How SmithKline Beecham Makes Better Resource-Allocation Decisions.” Harvard Business Review, March–April 1998. (An excellent process for selecting projects as well as for constructing a project portfolio. The ability to implement the process depends on a fairly sophisticated senior management team.)Sheffi, Y. The Resilient Enterprise, Cambridge, MA: The MIT Press, 2005.Wheatly, M. “Beyond the Numbers.” PM Network, August 2009.Wheelwright, S. C., and K. B. Clark. “Creating Project Plans to Focus Product Development.” Harvard Business Review, March–April 1992.Zwikael, O., and J. Smyrk. “Project Governance: Balancing Control and Trust in Dealing with Risk.” International Journal of Project Management, No. 3, 2015.
Mantel_c01.indd 32 9/6/2016 4:41:24 PM