The Volatility of Rupiah Exchange Rate Impact on Main ...
18
Citation: Handoyo, Rossanto Dwi, Agustin Dwi Prihandika Sari, Kabiru Hannafi Ibrahim, and Tamat Sarmidi. 2022. The Volatility of Rupiah Exchange Rate Impact on Main Commodity Exports to the OIC Member States. Economies 10: 78. https://doi.org/10.3390/ economies10040078 Academic Editor: Adolfo Maza Received: 17 February 2022 Accepted: 22 March 2022 Published: 25 March 2022 Publisher’s Note: MDPI stays neutral with regard to jurisdictional claims in published maps and institutional affil- iations. Copyright: © 2022 by the authors. Licensee MDPI, Basel, Switzerland. This article is an open access article distributed under the terms and conditions of the Creative Commons Attribution (CC BY) license (https:// creativecommons.org/licenses/by/ 4.0/). economies Article The Volatility of Rupiah Exchange Rate Impact on Main Commodity Exports to the OIC Member States Rossanto Dwi Handoyo 1, * , Agustin Dwi Prihandika Sari 1 , Kabiru Hannafi Ibrahim 2 and Tamat Sarmidi 3 1 Department of Economics, Faculty of Economics and Business, Universitas Airlangga, Surabaya 60286, Indonesia; [email protected] 2 Department of Economics, Faculty of Social and Management Sciences, Federal University, Birnin Kebbi 860101, Nigeria; kabiru.hannafi@fubk.edu.ng 3 Department of Economics, Faculty of Economics and Management, Universiti Kebangsaan Malaysia, Bangi 43600, Selangor, Malaysia; [email protected] * Correspondence: [email protected] Abstract: This study analysed the impact of the volatility of the rupiah exchange rate on four main commodities exported from Indonesia to six member countries of the Organisation of the Islamic Cooperation (OIC) (Saudi Arabia, Malaysia, Pakistan, United Arab Emirates, Turkey, and Bangladesh). The study employed monthly data spanning from January 2007 to December 2019 and the EGARCH method to obtain exchange rate volatility, while the ARDL method was used to model both the short-run and long-run impact of exchange rate and its volatility on exports. In the short term, findings revealed that exchange rate volatility has a significant negative effect on five main commodity exports to OIC countries, whereas, in the long-term, volatility of the exchange rate negatively affects twelve main commodity exports to OIC countries. Our results further imply that most of Indonesia’s exporters to six OIC Member countries are risk-averse. Keywords: rupiah exchange rate volatility; main export commodities; EGARCH; ARDL model; Indonesia; OIC member countries 1. Introduction Foreign trade is inseparable from the exchange rate, which plays an important role as a reference when conducting trade transactions for both exporters and importers. Ever since the emergence of the floating exchange rate system in 1973, foreign currencies’ face value has kept on changing every day. Policymakers and researchers attempted to evaluate whether the volatility of the exchange rate has a strong influence on the trade of goods and services. Both groups believe that uncertainty in the exchange rate as indicated by its volatility has an impact on the flows of foreign transactions. Previous work has found both positive, negative, and no significant impacts from the occurrence of the exchange rate volatility on trade flows. It is worth noting that, if there is a surge in the exchange rate volatility and traders ignore the value for future trade transactions, it will increase the risk of exchange rate losses, which cause a decline in exports (Hooper and Kohlhagen 1978). If the traders’ profits decrease when exchange rate volatility occurs, companies will increase sales and production to replace declining profits, therefore it will increase the exports (Sercu and Vanhulle 1992). Again, when there exists no impact from the occurrence of exchange rate volatility, the relationship cannot be determined (Triplett and Thaver 2017). Toward the beginning of the 1990s, the Organisation of the Islamic Cooperation (OIC) countries opened their economies by embarking on trade liberalization reform to promote interregional trade, easing factor movement, preferential trade agreements (PTAs) among the member countries. This has resulted in the removal of trade barriers, especially quantitative restrictions among the members of the trading bloc. Before the 1970s, most countries in the world—including a large number of OIC countries—pegged their exchange Economies 2022, 10, 78. https://doi.org/10.3390/economies10040078 https://www.mdpi.com/journal/economies
-
Upload
khangminh22 -
Category
Documents
-
view
3 -
download
0
Transcript of The Volatility of Rupiah Exchange Rate Impact on Main ...

�����������������
Citation: Handoyo, Rossanto Dwi,
Agustin Dwi Prihandika Sari, Kabiru
Hannafi Ibrahim, and Tamat Sarmidi.
2022. The Volatility of Rupiah
Exchange Rate Impact on Main
Commodity Exports to the OIC
Member States. Economies 10: 78.
https://doi.org/10.3390/
economies10040078
Academic Editor: Adolfo Maza
Received: 17 February 2022
Accepted: 22 March 2022
Published: 25 March 2022
Publisher’s Note: MDPI stays neutral
with regard to jurisdictional claims in
published maps and institutional affil-
iations.
Copyright: © 2022 by the authors.
Licensee MDPI, Basel, Switzerland.
This article is an open access article
distributed under the terms and
conditions of the Creative Commons
Attribution (CC BY) license (https://
creativecommons.org/licenses/by/
4.0/).
economies
Article
The Volatility of Rupiah Exchange Rate Impact on MainCommodity Exports to the OIC Member StatesRossanto Dwi Handoyo 1,* , Agustin Dwi Prihandika Sari 1 , Kabiru Hannafi Ibrahim 2 and Tamat Sarmidi 3
1 Department of Economics, Faculty of Economics and Business, Universitas Airlangga,Surabaya 60286, Indonesia; [email protected]
2 Department of Economics, Faculty of Social and Management Sciences, Federal University,Birnin Kebbi 860101, Nigeria; [email protected]
3 Department of Economics, Faculty of Economics and Management, Universiti Kebangsaan Malaysia,Bangi 43600, Selangor, Malaysia; [email protected]
* Correspondence: [email protected]
Abstract: This study analysed the impact of the volatility of the rupiah exchange rate on fourmain commodities exported from Indonesia to six member countries of the Organisation of theIslamic Cooperation (OIC) (Saudi Arabia, Malaysia, Pakistan, United Arab Emirates, Turkey, andBangladesh). The study employed monthly data spanning from January 2007 to December 2019and the EGARCH method to obtain exchange rate volatility, while the ARDL method was used tomodel both the short-run and long-run impact of exchange rate and its volatility on exports. In theshort term, findings revealed that exchange rate volatility has a significant negative effect on fivemain commodity exports to OIC countries, whereas, in the long-term, volatility of the exchange ratenegatively affects twelve main commodity exports to OIC countries. Our results further imply thatmost of Indonesia’s exporters to six OIC Member countries are risk-averse.
Keywords: rupiah exchange rate volatility; main export commodities; EGARCH; ARDL model;Indonesia; OIC member countries
1. Introduction
Foreign trade is inseparable from the exchange rate, which plays an important roleas a reference when conducting trade transactions for both exporters and importers. Eversince the emergence of the floating exchange rate system in 1973, foreign currencies’ facevalue has kept on changing every day. Policymakers and researchers attempted to evaluatewhether the volatility of the exchange rate has a strong influence on the trade of goodsand services. Both groups believe that uncertainty in the exchange rate as indicated byits volatility has an impact on the flows of foreign transactions. Previous work has foundboth positive, negative, and no significant impacts from the occurrence of the exchangerate volatility on trade flows. It is worth noting that, if there is a surge in the exchange ratevolatility and traders ignore the value for future trade transactions, it will increase the riskof exchange rate losses, which cause a decline in exports (Hooper and Kohlhagen 1978). Ifthe traders’ profits decrease when exchange rate volatility occurs, companies will increasesales and production to replace declining profits, therefore it will increase the exports (Sercuand Vanhulle 1992). Again, when there exists no impact from the occurrence of exchangerate volatility, the relationship cannot be determined (Triplett and Thaver 2017).
Toward the beginning of the 1990s, the Organisation of the Islamic Cooperation(OIC) countries opened their economies by embarking on trade liberalization reform topromote interregional trade, easing factor movement, preferential trade agreements (PTAs)among the member countries. This has resulted in the removal of trade barriers, especiallyquantitative restrictions among the members of the trading bloc. Before the 1970s, mostcountries in the world—including a large number of OIC countries—pegged their exchange
Economies 2022, 10, 78. https://doi.org/10.3390/economies10040078 https://www.mdpi.com/journal/economies

Economies 2022, 10, 78 2 of 18
rates against a single currency (the US Dollar, which was worth a fixed amount of gold).Pegging the exchange rate to a single currency has helped reduce the risks associatedwith the exchange rate, the possible cost of the large foreign transactions, and speculation(OIC Outlook Series 2012; Poon and Hooy 2013). This is because the regime choice hasa considerable impact on trade, macroeconomic environment, the balance of payment,inflation, and capital flows (OIC Outlook Series 2012). Most OIC countries are emergingeconomies that faced the risks of capital movement than many other developing countriesthat adopt flexible exchange rate systems (Poon and Hooy 2013). After the collapse of thefixed exchange rate, which lasted for twenty-five years (1946–1971), countries start adoptingflexible exchange rate regimes. Since its inception, there were no single OIC membercountry with exchange rate arrangements. This is because most OIC countries adopted“other conventional fixed peg arrangements” (OIC Outlook Series 2012). According toOIC Outlook Series (2012), 32 OIC member States peg their exchange rates to a differentcurrency; 12 of these countries peg to the Euro, 16 pegs to the US Dollar, and 4 to compositecurrency. Therefore, OIC member countries operate under different exchange rate regimes.While a large number of empirical studies have resurfaced since the emergence of thefloating exchange rate, most of these studies have focused on the analysis of the nexusbetween exchange rate volatility on trade flows.
A new empirical study by Vo et al. (2019) divulged an adverse influence of exchangerate volatility on Vietnam’s exports. Yunusa (2020) also confirmed an adverse effect ofexchange rate volatility on oil exports from Nigeria to Canada, Italy, Brazil, and France.Sugiharti et al. (2020) have reported an adverse effect of exchange rates volatility on severalcommodities. From these results, it is well indicated that traders attempted to be risk-aversewhen the volatility of the exchange rate occurs. Furthermore, there exist few studies thatreported a positive effect of the exchange rates volatility. Among these studies are Yunusa(2020), which evaluated the export performance of crude oil commodity exports fromNigeria to the UK, the United States, and Spain and found a positive impact.
Studies that focus on OIC member countries are limited. Poon and Hooy (2013) usedpanel estimates and assessed the influence of exchange rates volatility on trade in 30 OICmember nations over the period 1995–2008. Their finding indicates a negative significantinfluence of exchange rates volatility on aggregate import and export. Asteriou et al. (2016)studied the impact of the volatility of exchange rate on trade performance in MINT membercountries and three OIC member countries. Their empirical strategy shows a significantshort-term effect of the volatility of exchange rate on trade in Indonesia and Mexico, whilethe long-term impact is only observed in the case of Turkey.
The main rationale behind the conduct of this study is to analyse the effect of exchangerate volatility on the main commodity exports supply from Indonesia to the six OICmember countries. The choice of Indonesia and the six OIC member States is based onthe fact that Indonesia is the country with the highest Muslim population, and moreimportantly, OIC member countries have dominant Muslim populations. Indonesia sharessimilar characteristics with OIC countries in terms of economies, political, social, andcultural characteristics, among others. Indonesia has a huge potential to export to OICmember countries because OIC member countries have chased their aim toward improvingcommercial and economic cooperation to advance economic relations and harmonizationand encounter global challenges together (Alpay et al. 2011). Nowadays, the marketshare of Indonesia’s exports to the OIC Member States has remained significant, with thehighest export share going to OIC member countries. As a member of OIC, Malaysia aloneaccounts for 41% of Indonesia’s total exports. Pakistan and Bangladesh held the secondand third positions in demanding Indonesia’s export supply as 9% of Indonesia’s export goto these countries. While 7% of Indonesia’s export goes to Saudi Arabia and the UnitedArab Emirates, followed by Turkey and Egypt, which account for about 5% of Indonesia’sexport supply, the remaining OIC member countries account for less than 2% of Indonesia’sexports. With this fact, the six OIC member States that were chosen in the analysis of thisstudy account for about 64% of Indonesia’s export supply to the world. Therefore, with

Economies 2022, 10, 78 3 of 18
more than half of Indonesia’s exports going to these six countries, these countries must haveconstituted an economic value and meaningful to Indonesia’s economy. In this case, ananalysis of the impact of exchange rate volatility on Indonesia’s exports to these countriesmust not be ignored. This is because any external shocks associated with the volatility ofexchange may negatively affect Indonesia’s exports to these countries. However, there is aneed to have a clear understanding of the effect of exchange rate volatility on exports tothese countries and offer policy recommendations for sustainable exports to these countries.
Although studies have investigated the links between exchange rate volatility andaggregate trade flow in the context of Indonesia, there is little emphasis on the analysis ofsuch nexus for disaggregated trade flow, more especially of Indonesia’s exports to Malaysia,Pakistan, Saudi Arabia, United Arab Emirates, Bangladesh, and Turkey, which accounts formore than half of Indonesia’s exports. With this, therefore, the study further aims to utilizea two-digit Harmonized System (HS) export data of the main commodities exported fromIndonesia to OIC member countries and analyse the influence of exchange rate volatilityon their exports to the selected countries.
Based on previous studies, it is imperative to note that there is a scarceness of empiricalstudies that centre on the effect of exchange rates volatility on commodity exports fromIndonesia to the OIC countries. Hence, this study aims to bridge this gap in the existingliterature by analysing both the short- and long-term effect of the volatility of exchange rateon exports of four key commodities from Indonesia to six-member countries of the OICsuch as Malaysia, Pakistan, Saudi Arabia, United Arab Emirates, Bangladesh, and Turkeyfor the period January 2007 to December 2019.
The remaining parts of this study are structured as follows: Section 2 presents theliterature review and overview of some relevant variables. Section 3 presents the dataand methodology adopted to achieve the stated objectives. Section 4 explains the researchfindings and Section 5 concludes the study and offered policy recommendations.
2. Literature Review2.1. Exchange Rate and Exports
The rate of exchange between countries is the value of a currency against anothercurrency. Currency exchange rates can be divided into two, i.e., nominal and real exchangerates, and all can change over time. The changes are depreciation or appreciation. When anappreciation occurs in a country’s currency, domestic manufactured goods become costlierabroad and foreign manufactured goods become cheaper in domestic markets. Meanwhile,when depreciation occurs, domestic manufactured goods become inexpensive abroad andforeign manufactured goods in domestic countries become pricier (Mishkin 2016, p. 424).
Therefore, the exchange rate is one of the main determinants of trade flows. The sizeof a countries’ exports is also caused by several factors, including the domestic price of theexport destination country and the exchange rate between countries. When the exchangerate depreciates, the depreciation will make local products cheaper to stimulate exportactivities. In addition, the depreciation of the exchange rate makes foreign products costlier,thus making a country reduce its trading activities (Krugman et al. 2018, p. 424). This isfurther supported by Sugiharti et al. (2020), who explained that a country’s exports willdecrease due to the depreciating exchange rate of its partners.
2.2. Marshall-Lerner Condition
The depreciation of a country’s real exchange rate can increase its current account.However, this depends on the response of exports and imports to changes in real exchangerates. Therefore, the Marshall–Lerner condition simply states that the depreciation of thereal exchange rate will increase the current account if the volume of exports and importsis sufficiently elastic to the real exchange rate (Krugman et al. 2018, p. 460). Marshall–Lerner conditions can indicate stable or unstable foreign exchange market conditions. Thiscondition may indicate a stable foreign exchange market if, and only if, the summation ofabsolute exports and imports price elasticity is greater than one and vice versa. Changes

Economies 2022, 10, 78 4 of 18
in the real exchange rate will leave the current account unaffected if the total elasticity isexactly one, in absolute terms (Salvatore 2014, p. 516).
2.3. J-Curve Phenomenon
The phenomenon related to the exchange rate depreciation with the current account isdescribed by the J-Curve (Krugman et al. 2018, p. 448). Exchange rate depreciation willinitially cause a decrease in the current account. This happened because most of the importand export orders were carried out in the previous few months. Where consumers arenot aware of changes in relative prices quickly. In the months following a depreciation,the volume of imports and exports can replicate the purchasing decisions concerning theprevious rate of exchange. The depreciation impact is that exports will increase because theprice of domestic goods is cheaper. Therefore, on the production side, export producersmust increase production. Thus, after some time (i.e., in the long-term), depreciation of theexchange rate will increase export activity.
2.4. Volatility of Exchange Rate and Exports
In a market-oriented exchange system, policy changes might lead to instability inthe exchange rate. The volatility of the exchange rate can be regarded as an overreachingphenomenon. An overreaching exchange rate occurs when its temporary response toa disturbance in market essentials is higher than its long-run response. Therefore, inthis case, a disproportionately short-run exchange rates impact can be caused by marketfundamentals. The phenomenon of foreign exchange rate spikes up is vital as it explainsthe reason for an intense depreciation or appreciation of exchange rates from day to day(Carbaugh 2015, p. 410).
Depending on traders’ level of risk tolerance, exchange rate volatility might assert apositive or negative impact on trade. According to De Grauwe (1988), the consequence ofincreased risks can be looked at as the income and substitution effect. The former causes acompany that avoids risk (risk-averse) to reduce export activity because the anticipatedmarginal utility of export earnings decreases, while for the latter, it causes the risk-takingcompany to increase export and to avoid a massive decline in the company’s earnings.Sercu and Vanhulle (1992) mentioned that the increment of volatility will increase the valueof exporting companies, by increasing sales and production to compensate for decliningprofits, thereby encouraging increased exports. Kroner and Lastrapes (1993) argued thatthe company can raise its viable activity because the market will worsen in the upcomingperiod due to unexpected exchange rate variations. Therefore, the complete control oftraders that are risk-taker or risk-averse will govern the eventual effect of exchange rateinstability on trade (Bahmani-Oskooee and Aftab 2017; Choudhry and Hassan 2015; Thuyand Thuy 2019).
2.5. Previous Study
Available empirical studies have observed the effects of exchange rate volatility oneconomic activities and exports, but there exists a contradictory view about such nexus.For instance, Senadza and Diaba (2018) report a positive and significant nexus among theexchange rate volatility and economic activities in eleven African countries for the period1993–2014. Yunusa (2020) also examined the influence of volatility on Nigeria’s crude oilexport to Spain, the United Kingdom, and the United States for the period January 2006 toDecember 2019. His empirical results show a positive effect on exports to these countries.Sugiharti et al. (2020) also observed a similar finding in several commodities for Indonesia’sexports to its trading partners.
Studies by Senadza and Diaba (2018) and Hooy and Baharumshah (2015) report anegative nexus between exports and exchange rate volatility. Poon and Hooy (2013) alsoconfirmed a negative effect of the volatility of the exchange rate on exports in 30 OICmembers. While applying monthly data to the Chinese exports to Japan, Nishimuraand Hirayama (2013) found that volatility of exchange rate negatively affects exports

Economies 2022, 10, 78 5 of 18
for the period 2002–2011. Hall et al. (2010) also found a negative effect in the case ofemerging and developing countries’ exports over the period 1980Q1–2005Q4. In the caseof Vietnam’s exports to 26 major trading partners, Vo et al. (2019) observed a negativelong-term influence of volatility of exchange rate on the performance of export over theperiod 2000–2015. Findings discovered that the volatility of the exchange rate asserts anegative and significant effect on export performance in the long run. For Nigeria’s oilexports to Canada, Italy, Brazil, and France, Yunusa (2020) observed the same negativeeffect of exchange rate volatility on exports. In the case of non-oil and gas sector exportsfor the period 1986–2014, Akanbi et al. (2017) found volatility’s negative effect on exports.Sugiharti et al. (2020) also found similar results in several primary commodity exports fromIndonesia to its main trading partners. On export performance in the ASEAN-5 region(Thailand, Malaysia, Singapore, Indonesia, and the Philippines) Upadhyaya et al. (2020)revealed a negative influence of exchange rate volatility on exports.
A study by Nishimura and Hirayama (2013) observed no significant influence ofvolatility of exchange rate on exports. Vo et al. (2019) also found a similar result in severalcommodity sectors. Bahmani-Oskooee et al. (2021), Bahmani-Oskooee and Arize (2020),and Bahmani-Oskooee and Aftab (2017) analysed the asymmetric effect of volatility onexport. Their results show that the asymmetric approach was more influential compared tothe symmetric approach. Sugiharti et al. (2020) report that exchange rate volatility affectsIndonesia’s exports performance using both symmetrical and asymmetrical approaches.
There exist several methods of measuring the volatility of the exchange rate. Forinstance, to obtain the volatility value, Hall et al. (2010), Bahmani-Oskooee and Aftab (2017),Upadhyaya et al. (2020), Bahmani-Oskooee and Arize (2020), Sugiharti et al. (2020), Vo et al.(2019), Yunusa (2020), and Bahmani-Oskooee et al. (2021) used Autoregressive-Conditional-Heteroskedasticity (ARCH) familiarized by Engle (1982) or Generalized ARCH (GARCH)which was developed from the ARCH model by (Bollerslev 1986). In addition, Nishimuraand Hirayama (2013) used standard deviation and Exponential GARCH (EGARCH) toestimate the volatility of the exchange rate. The EGARCH method is an extended versionof the GARCH model introduced by (Nelson 1991). Hooy and Baharumshah (2015) usedthe EGARCH method and estimated the volatility of exchange rate which can concurrentlyaccount for asymmetric volatility and the influence of good and bad news on the currencyexchange market. Good news means that information will assert a positive influence onincreasing the value of volatility, for instance, an unexpected appreciation in the currencyvalue will increase volatility, while bad news means that information will have a negativeimpact, for example, an unexpected depreciation in currency values will increase volatility(Nishimura and Hirayama 2013). In addition, Akanbi et al. (2017) used the thresholdGARCH (TGARCH) method, which is introduced by (Glosten et al. 1993).
Additionally, there were various methods used by previous studies to measure theinfluence of exchange rate volatility on exports. For instance, Hall et al. (2010) usedthe moment conditions for the dynamic Generalized Method of Moments (GMM) andthe estimate of the Time-Varying-Coefficient (TVC). Poon and Hooy (2013) used panelregression and estimates the volatility influence on exports in 30 OIC member countries.Senadza and Diaba (2018) used a Pooled Mean Group (PMG) from a dynamic heterogeneouspanel. Upadhyaya et al. (2020) used a fixed effect estimator in ASEAN 5 countries’ panel.Vo et al. (2019) and Akanbi et al. (2017) used the Error Correction Model (ECM). Hooyand Baharumshah (2015), Yunusa (2020), and Nishimura and Hirayama (2013) used theAutoregressive Distributed Lag (ARDL) method to estimate time-series data. Besides usingthe ARDL method Bahmani-Oskooee and Aftab (2017), Bahmani-Oskooee et al. (2021),Bahmani-Oskooee and Arize (2020), and Sugiharti et al. (2020) used Nonlinear ARDL(NARDL) introduced by Shin et al. (2014) which includes the decomposition of negative(−) and positive (+) partial sums of the volatility of exchange rate.

Economies 2022, 10, 78 6 of 18
3. Data and Method3.1. Model
Following previous studies, this study adopted the EGARCH model, as proposed byNelson (1991). Since exchange rates in the real term are recognized to be serially correlated.Therefore, there is a need to first determine the ARMA model for the rate of change. Thenthe model of EGARCH (p, q) can be presented as:
∆Yt = α + β1 AR (p) + β2MA(q) + et (1)
lnα2t = α0 + α1
∣∣∣∣ et−1
σt−1
∣∣∣∣+ · · ·+ αp
∣∣∣∣ et−p
σt−p
∣∣∣∣+∅pet−p
σt−p+ λ1hσ2
t−1 + · · ·+ λqhσ2t−q (2)
Equation (1) displays the conditional mean and is defined as the AutoregressiveMoving Average (ARMA) model. Here, Y is the currency rate of exchange; ∆ representthe first difference; p refers to the best lags number required in the Autoregressive (AR)model; q is the best lags number required in the Moving Average (MA) model; AR isAutoregressive; MA is a moving average; et is an error term.
In Equation (2), lnα2t is the conditional variance equation and is defined as the
EGARCH (p, q) model; α, λ are parameter coefficient;∣∣∣ et−1
σt−1
∣∣∣ is magnitude effect; et−pσt−p
is sign effect that asymmetry effect can be captured if the value is not equal to zero (∅).The ARDL model, as proposed by Pesaran et al. (2001) is used to obtain the short and
long-run nexus. The ARDL has an advantage over other estimation techniques becausethe method allows for the determination of variables’ relationship at the level form andirrespective of whether the included explanatory variables are pure of I(0). The benefitof the ARDL model approach is that it can be applied to test the nexus among model’svariables in their original form (i.e., in levels), which is appropriate unrelatedly to whetherthe fundamental regressors are of order I(0) (i.e., stationary) or order I(1) (i.e., first differencestationary).
The short-term ARDL model is formulated as follows:
∆lnExt =n1
∑i=1
β1i ∆lnExt−i +n2
∑i=0
β2i ∆lnVolt−i +n3
∑i=0
β3i ∆lnRERt−i + δECTt−1 + εt (3)
The long-term ARDL model is formulated as follows:
∆lnExt =n1
∑i=1
β1i ∆lnExt−i +n2
∑i=0
β2i ∆lnVolt−i +n3
∑i=0
β3i ∆lnRERt−i + σ1lnExt−1 + σ2lnVolt−1 + σ3lnRERt−1 + µt (4)
Equations (3) and (4) show the ARDL model used in this study, where ∆ indicatesvariable at the first difference; Ex is export; β is short-term parameter coefficient; Vol isexchange rate volatility; RER is real exchange rate; ECT error correction term; n1, n2, n3 arelag order; ln is natural logarithmic; σ is long term parameter; and εt and µt are the errorterms.
3.2. The Data
The present study used the data sourced from the international trade centre andthe international financial statistics (see Table A1 in the Appendix A). The data comprisetime series monthly data covering the period 2007:M1–2019:M12. The exchange ratesused in the present study are real term exchange rates of Indonesian Rupiah against theMalaysian Ringgit, Pakistan Rupee, United Arab Emirates Dirham, Saudi Riyal, TurkishLira, and Bangladeshi Taka. The real exchange rates were calculated based on a commonprocedure that takes into account both the domestic prices and foreign prices of tradingpartners. Therefore, the real exchange rates in this regard depend on Indonesia’s Rupiahnominal exchange rates, Indonesia’s domestic prices, and foreign prices. The use of real
Economies 2022, 10, 78 7 of 18
exchange rate over nominal exchange rate in this study is more prominent. This is becauseit shows not only how much can be traded for a unit of Indonesian Rupiah but also showshow much goods and services in Indonesia can be traded for goods and services in theexports destination countries. Additionally, we used the real exchange rate because thereal exchange rate has been widely used in many empirical studies. While projectingthe conditional variances, which are a proxy of volatility, the present study applied theEGARCH method because of its ability to reveal leptokurtosis in the data set and higherconditional moments. Exports used in this study are exports of four main commoditiesexported from Indonesia to six OIC member countries based on the two-digit HarmonizedSystem (HS). The exports data are measured in monetary terms. However, to account forthe current flow of export and exchange rate fluctuations, nominal exports data were usedfor the analysis of this study.
4. Empirical Findings4.1. Variables Descriptive Statistics
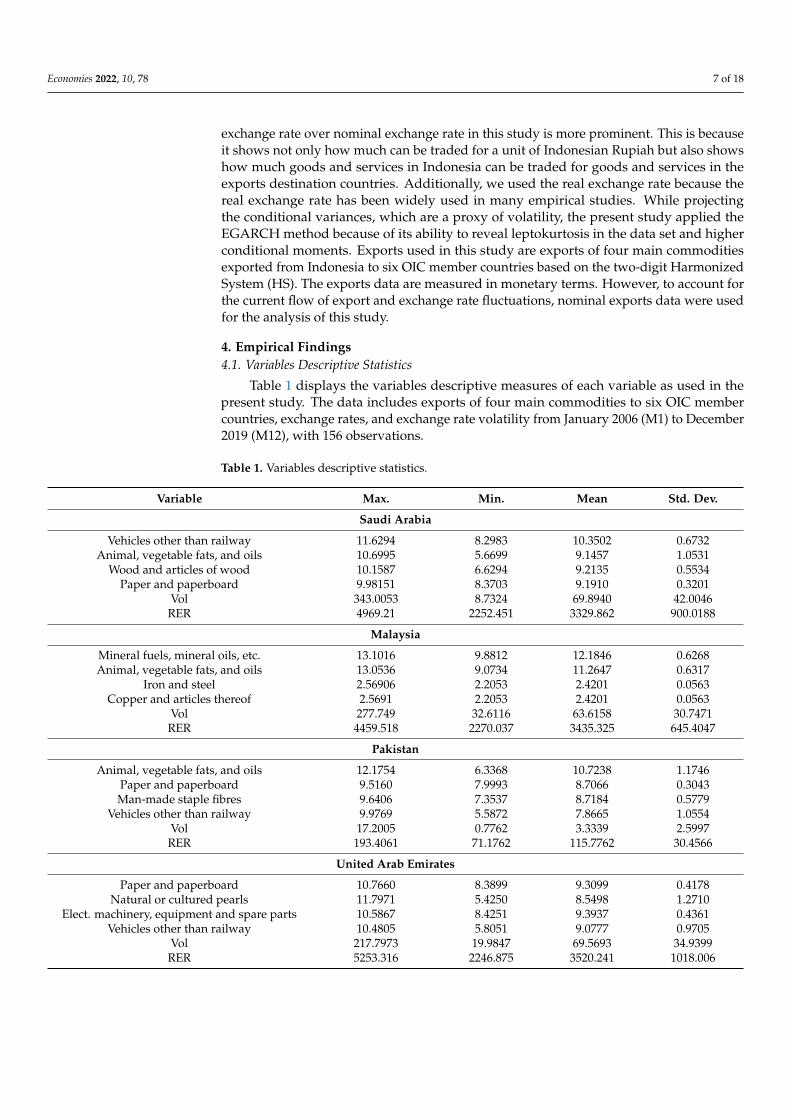
Table 1 displays the variables descriptive measures of each variable as used in thepresent study. The data includes exports of four main commodities to six OIC membercountries, exchange rates, and exchange rate volatility from January 2006 (M1) to December2019 (M12), with 156 observations.
Table 1. Variables descriptive statistics.
Variable Max. Min. Mean Std. Dev.
Saudi Arabia
Vehicles other than railway 11.6294 8.2983 10.3502 0.6732Animal, vegetable fats, and oils 10.6995 5.6699 9.1457 1.0531
Wood and articles of wood 10.1587 6.6294 9.2135 0.5534Paper and paperboard 9.98151 8.3703 9.1910 0.3201
Vol 343.0053 8.7324 69.8940 42.0046RER 4969.21 2252.451 3329.862 900.0188
Malaysia
Mineral fuels, mineral oils, etc. 13.1016 9.8812 12.1846 0.6268Animal, vegetable fats, and oils 13.0536 9.0734 11.2647 0.6317
Iron and steel 2.56906 2.2053 2.4201 0.0563Copper and articles thereof 2.5691 2.2053 2.4201 0.0563
Vol 277.749 32.6116 63.6158 30.7471RER 4459.518 2270.037 3435.325 645.4047
Pakistan
Animal, vegetable fats, and oils 12.1754 6.3368 10.7238 1.1746Paper and paperboard 9.5160 7.9993 8.7066 0.3043Man-made staple fibres 9.6406 7.3537 8.7184 0.5779
Vehicles other than railway 9.9769 5.5872 7.8665 1.0554Vol 17.2005 0.7762 3.3339 2.5997RER 193.4061 71.1762 115.7762 30.4566
United Arab Emirates
Paper and paperboard 10.7660 8.3899 9.3099 0.4178Natural or cultured pearls 11.7971 5.4250 8.5498 1.2710
Elect. machinery, equipment and spare parts 10.5867 8.4251 9.3937 0.4361Vehicles other than railway 10.4805 5.8051 9.0777 0.9705
Vol 217.7973 19.9847 69.5693 34.9399RER 5253.316 2246.875 3520.241 1018.006

Economies 2022, 10, 78 8 of 18
Table 1. Cont.
Variable Max. Min. Mean Std. Dev.
Turkey
Animal, vegetable fats, and oils 10.9847 3.37367 8.9102 1.3399Rubber and articles thereof 10.5072 7.62950 9.3734 0.4505
Man-made filaments 10.5954 8.3064 9.6022 0.4905Man-made staple fibres 10.5458 8.4994 9.9533 0.3382
Vol 535.478 43.4599 149.9039 81.4011RER 8460.006 1485.002 4896.653 1861.939
Bangladesh
Animal, vegetable fats, and oils 12.0062 8.1056 10.7856 0.6391Paper and paperboard 8.7994 6.8211 7.8511 0.3681
Cotton 9.0777 6.8550 8.0011 0.428601Man-made staple fibres 9.7455 7.1724 8.5807 0.6235
Vol 11.3977 1.2691 3.2948 1.4155RER 183.5992 100.7474 138.2074 17.2203
Source: Authors’ computation using Eviews 12. Note: The descriptions of the commodities were given in Table A2of the Appendix A.
4.2. Estimated Results
The ARDL test was carried out after obtaining the exchange rate volatility of theselected EGARCH model (see Appendix A Table A3). The test was carried out to obtain theshort-term and long-term influence of the real exchange rate and the volatility of the realexchange rate on main commodities exported to six OIC countries.
Table 2 displays the short-term ARDL estimate for the effect of the exchange ratein real terms on four main commodity exports from Indonesia to six OIC countries. Foreach country, only valid models with negative and significant ECT values are reported inTable 2. An estimate for a commodity is only reported if the estimate is valid in which ECTis statistically significant and negative. The result revealed exchange rate to have possesseda positive effect in the short term on Indonesian exports to Saudi Arabia (HS48), Malaysia(HS74), Pakistan (HS48), United Arab Emirates (HS87), Turkey (HS40), and Bangladesh(HS15, HS48, and HS55). In addition, the exchange rate asserts a positive and negativeinfluence on different lags in Malaysia (HS72). The exchange rate also asserts a significantadverse influence in the short term in the United Arab Emirates (HS48 and HS85).
Table 2. Estimated short-run impact of real exchange rate on Indonesia’s main exports to OIC countries.
Saudi Arabia
Code Exported commodities ∆lnRERt ∆lnRERt−1 ∆lnRERt−2 ∆lnRERt−3 ∆lnRERt−4
HS48 Paper andand paperboard 1.61(1.82) *
Malaysia
Code Exported commodities ∆lnRERt ∆lnRERt−1 ∆lnRERt−2 ∆lnRERt−3 ∆lnRERt−4
HS72 Iron andand steel −4.68(−1.76) *
2.94(0.93)
4.77(1.69) *
HS74 Copper and articles thereof −1.03(−0.68)
6.17(3.31) ***
Pakistan
Code Exported commodities ∆lnRERt ∆lnRERt−1 ∆lnRERt−2 ∆lnRERt−3 ∆lnRERt−4
HS48 Paper andand paperboard −0.24(−0.33)
−0.51(−0.67)
0.19(0.26)
2.36(3.24) ***

Economies 2022, 10, 78 9 of 18
Table 2. Cont.
United Arab Emirates
Code Exported commodities ∆lnRERt ∆lnRERt−1 ∆lnRERt−2 ∆lnRERt−3 ∆lnRERt−4
HS87 Vehicles other than railway 3.80(1.98) **
5.19(1.96) **
HS48 Paper and paperboard −1.61(−1.80) *
0.04(0.89)
−2.70(−2.87) ***
HS85 Electrical machinery,equipment andand spare parts
−0.44(−0.56)
−0.89(−1.06)
−1.84(−2.27) **
Turkey
Code Exported commodities ∆lnRERt ∆lnRERt−1 ∆lnRERt−2 ∆lnRERt−3 ∆lnRERt−4
HS40 Rubber andand articles thereof 1.17(2.52) **
Bangladesh
Code Exported commodities ∆lnRERt ∆lnRERt−1 ∆lnRERt−2 ∆lnRERt−3 ∆lnRERt−4
HS15 Animal, vegetable fats,andand oils
2.04(1.08)
3.88(1.94) *
HS48 Paper andand paperboard −1.54(−1.61)
3.43(3.03) ***
HS55 Man-made staple fibres 0.36(0.46)
2.78(2.93) ***
0.72(0.80)
2.59(3.07) ***
Source: Authors’ computation using Eviews 12. Note: The t-statistics were in brackets; *** indicates p-value < 0.01,** indicates p-value < 0.05, * indicates p-value < 0.1.
Table 3 illustrates the short-term ARDL estimate for the exchange rate volatility onexports. The finding indicates that the exchange rate volatility asserts a significant negativeeffect on Indonesia’s main exports to Saudi Arabia (HS48), Bangladesh (HS48 and HS55).Moreover, volatility possessed both increasing and decreasing impacts on different lags inSaudi Arabia (HS44) and United Arab Emirates (HS87). It is worth noting that in Table 3,only an estimate of four countries was reported. For Malaysia and Turkey, we could notfind a valid estimate for all the selected main commodities exported from Indonesia tothese countries; this is because ECTs for the whole commodities’ estimate were not negativeand is statistically insignificant.
Table 4 displays the long-term ARDL estimate. The real exchange rate asserts a sig-nificant and positive influence in Saudi Arabia (HS87), United Arab Emirates (HS71 andHS87), Bangladesh (HS15 and HS55). The real exchange rate also asserts a significant nega-tive impact on main commodity export to Saudi Arabia (HS48), Malaysia (HS74), UnitedArab Emirates (HS85), Turkey (HS54), and Bangladesh (HS48). In addition, exchange ratevolatility asserts a negative influence on exports to Saudi Arabia (HS87), Malaysia (HS15,HS27, HS74), United Arab Emirates (HS87), Turkey (HS15 and HS54), Bangladesh (HS15and HS55). Furthermore, the volatility of the real exchange rate positively affects exports toSaudi Arabia (HS44), United Arab Emirates (HS85), and Bangladesh (HS48).
Table 5 displays the estimated results of the ARDL diagnostic test. Findings from theECMt−1 test showed a significant negative value at the 5% level in all models. The coeffi-cient value of ECMt−1 indicates the adjustment process towards the long-run equilibrium.The largest ECMt−1 coefficient value is shown in Bangladesh on commodity HS15, whichis 0.98, meaning that the speed towards long-term equilibrium is 1.02 months (1/0.98).The Lagrange Multiplier (LM) test shows that there is one model that has autocorrela-tion problems, namely the HS48 commodity from Pakistan. The findings from the whitetest indicate that six models reject the H0 (null hypothesis), which means that there is aheteroskedasticity problem in commodities such as HS48 from Saudi Arabia, HS27 fromMalaysia, HS15 from Pakistan, HS87 from the United Arab Emirates, and commodities

Economies 2022, 10, 78 10 of 18
HS15 and HS55 from Turkey. This problem was resolved by applying corrected robuststandard error.
Table 3. Estimated short-run impact of real exchange rate volatility on Indonesia’s main exports toOIC countries.
Saudi Arabia
Code Exported commodities ∆lnVolt ∆lnVolt−1 ∆lnVolt−2 ∆lnVolt−3 ∆lnVolt−4
HS44 Wood andand articles of wood −0.32(−0.3.0) ***
9.52(0.00)
−0.14(−0.1.33)
0.20(1.90) *
HS48 Paper andand paperboard −0.15(−2.01) **
−0.25(−3.24) ***
Pakistan
Code Exported commodities ∆lnVolt ∆lnVolt−1 ∆lnVolt−2 ∆lnVolt−3 ∆lnVolt−4
HS48 Paper andand paperboard 0.11(1.12)
United Arab Emirates
Code Exported commodities ∆lnVolt ∆lnVolt−1 ∆lnVolt−2 ∆lnVolt−3 ∆lnVolt−4
HS87 Vehicles other than railway −0.53(−2.00) **
−0.17(−0.74)
0.36(1.87) *
Bangladesh
Code Exported commodities ∆lnVolt ∆lnVolt−1 ∆lnVolt−2 ∆lnVolt−3 ∆lnVolt−4
HS48 Paper andand paperboard −0.21(−1.47)
−0.43(−2.85) ***
−0.25(−1.85) *
−0.19(−1.64)
HS55 Man-made staple fibres −0.52(−4.4) ***
−0.29(−2.56) **
Source: Authors’ computation using Eviews 12. Note: The t-statistics were in brackets; *** indicates p-value < 0.01,** indicates p-value < 0.05, * indicates p-value < 0.1.
Table 4. The estimated long-run impact of the exchange rate and its volatility on Indonesia’s mainexports to OIC countries.
Saudi Arabia
Code Exported Commodities Constant lnRER lnVol
HS15 Animal, vegetable fats, andand oils 2.50(13.75) ***
1.22(0.60)
0.74(1.03)
HS44 Wood and articles of wood 3.94(4.42) ***
0.95(1.46)
3.94(1.96) *
HS48 Paper and paperboard 12.20(7.41) ***
−0.41(−1.70) *
0.07(0.72)
HS87 Vehicles other than railway 0.70(0.12)
1.57(1.88) *
−0.74(−1.98) **
Malaysia
Code Exported commodities Constant lnRER lnVol
HS15 Animal, vegetable fats, and oils 17.39(3.35) ***
−0.63(−0.98)
−0.014(−3.12) ***
HS27 Mineral fuels, mineral oils, etc. 9.76(1.25)
0.40(0.42)
−0.01(−1.99) **
HS72 Iron and steel −2.26(−0.14)
1.39(0.74)
−0.00(−0.23)
HS74 Copper and articles thereof 17.41(8.19) ***
−0.77(−2.95) ***
−0.008(−4.42) ***

Economies 2022, 10, 78 11 of 18
Table 4. Cont.
Pakistan
Code Exported commodities Constant lnRER lnVol
HS15 Animal, vegetable fats, and oils 21.95(1.63)
−2.22(−0.75)
−0.62(−0.75)
HS48 Paper and paperboard 9.10(7.91) ***
−0.04(−0.19)
−0.12(−1.31)
HS55 Man-made staple fibres 13.77(5.09) ***
−0.99(−1.64)
−0.28(−1.28)
HS87 Vehicles other than railway −20.50(−0.56)
6.60(0.80)
−2.24(−0.90)
United Arab Emirates
Code Exported commodities Constant lnRER lnVol
HS71 Natural or cultured pearls −13.53(−1.85) *
2.47(2.36) **
0.48(0.76)
HS87 Vehicles other than railway −5.08(−0.84)
2.49(2.68) ***
−1.52(−2.20) **
HS48 Paper and paperboard 14.14(3.97) ***
−0.62(−1.17)
0.10(0.27)
HS85 Electrical machinery and equipment and parts thereof 19.85(20.16) ***
−1.38(−9.57) ***
0.19(2.10) **
Turkey
Code Exported commodities Constant lnRER lnVol
HS55 Man-made staple fibres 12.54(2.63) ***
−0.04(−0.06)
−0.68(−1.07)
HS15 Animal, vegetable fats, andand oils 9.19(3.55) ***
0.47(1.27)
−0.78(−2.02) **
HS40 Rubber and articles thereof 6.47(1.70) *
0.74(1.40)
−0.61(−1.28)
HS54 Man-made filaments 13.87(14.14) ***
−0.28(−2.15) **
−0.30(−2.29) **
Bangladesh
Code Exported commodities Constant lnRER lnVol
HS15 Animal, vegetable fats, andand oils 4.37(1.64)
1.51(2.63) ***
−0.90(−4.35) ***
HS48 Paper and paperboard 18.26(4.33) ***
−2.28(−2.47) **
0.74(2.09) **
HS52 Cotton 2.59(0.38)
1.24(0.85)
−0.61(−1.21)
HS55 Man-made staple fibres 13.42(−0.97)
5.06(1.67) *
−2.51(1.67) *
Source: Authors’ computation using Eviews 12. Note: The t-statistics were in brackets; *** indicates p-value < 0.01,** indicates p-value < 0.05, * indicates p-value < 0.1.

Economies 2022, 10, 78 12 of 18
Table 5. ARDL Diagnostic Test Results.
Country Exported Commodities ECMt−1 LM White
Saudi Arabia
Animal, vegetable fats, and oils −0.16(−2.68) *** 0.86 1.32
Wood and articles of wood −0.26(−3.95) *** 1.56 1.19
Paper and paperboard −0.51(−6.52) *** 0.05 3.05 **
Vehicles other than railway −0.18(−4.09) *** 0.22 0.96
Malaysia
Animal, vegetable fats, and oils −0.28(−5.24) *** 0.42 1.01
Mineral fuels, mineral oils, etc. −0.14(−4.17) *** 0.77 4.08 **
Iron and steel −0.16(−2.57) ** 0.04 1.06
Copper and articles thereof −0.64(−7.26) *** 0.28 0.77
Pakistan
Animal, vegetable fats, and oils −0.11(−2.39) ** 1.38 1.53 *
Paper and paperboard −0.45(−5.78) *** 2.95 * 0.61
Man-made staple fibres −0.17(−3.79) *** 0.83 1.11
Vehicles other than railway −0.04(−2.25) ** 0.52 1.12
United Arab Emirates
Paper and paperboard −0.17(−3.10) *** 0.08 1.02
Natural or cultured pearls −0.27(−3.50) *** 0.40 1.00
Electrical machinery, equipment andand spare parts −0.56(−7.61) *** 1.48 1.54
Vehicles other than railway −0.22(−4.75) *** 0.11 2.34 **
Turkey
Animal, vegetable fats, and oils −0.36(−3.86) *** 1.56 1.92 **
Rubber and articles thereof −0.12(−3.46) *** 0.02 0.02
Man-made filaments −0.90(−2.37) ** 1.90 0.80
Man-made staple fibres −0.27(−4.44) *** 0.06 3.89 **
Bangladesh
Animal, vegetable fats, and oils −0.98(−12.60) *** 1.42 1.06
Paper and paperboard −0.36(−4.18) *** 1.27 0.70
Man-made staple fibres −0.16(−2.83) *** 0.49 0.56
Cotton −0.08(−2.70) *** 1.80 1.17
Source: Authors’ computation using Eviews 12. Note: Specifically, for ECMt−1 the t-statistics were in brackets; ***indicates p-value < 0.01, ** indicates p-value < 0.05, * indicates p-value < 0.1.
4.3. The Influence of Real Exchange Rate on Exports
Both in the short-term and long-term, the exchange rate asserts a significant positiveinfluence on main commodity exports. In the short term, the result from this study indicatesthat the exchange rate asserts a significant positive impact on main commodity exports;HS48 to Pakistan, HS74 to Malaysia, HS87 to the United Arab Emirates, HS40 to Turkey,HS15, HS48, and HS55 to Bangladesh. This means that a 1% rise in the exchange rate willincrease commodity exports to Malaysia by 6.17% HS74 i.e., copper and its processed goods,(see Table 2), while in the long-term, the exchange rate asserts a significant positive influenceon commodity exports; HS87 to Saudi Arabia, HS71 and HS87 to the United Arab Emirates,and HS15 and HS55 to Bangladesh. The finding shows that a 1% increase in exchange rate

Economies 2022, 10, 78 13 of 18
increases the export of HS15 commodities (animal/vegetable oil) to Bangladesh by 1.51%(see Table 4).
These results are consistent with the result of Thuy and Thuy’s (2019) study, whichproves that when the Vietnamese Dong’s rate of exchange depreciates against the USDollar, exports will increase. This finding has been further supported by Vo et al. (2019)for Vietnam’s exports to America and Europe area. A study by Hooy et al. (2015) alsosupports these results which discovered that Renminbi exchange rate depreciation has apositive and significant influence on ASEAN’s aggregate exports to China. According to theexisting theory, when the exchange rate rises (depreciation occurs), the price of domesticgoods becomes cheaper so that sales for exports will increase. In the long run, due toincreased consumer demand, export producers must increase production so that exchangerate depreciation will increase export activity (Krugman et al. 2018).
The J-Curve phenomenon occurs in commodity HS72 for Malaysia, which has anegative coefficient in the initial lag and positive in the next lag. Although there wereno examples that confirmed the J-Curve phenomenon in the short-term and long-term,HS72 exports to Malaysia could describe that exports initially declined after depreciation(price effect of depreciation), then exports increased in the long run following depreciation(volume effect), which is consistent with Cao-Alvira (2014).
Contrary to existing theory, in the short-term, commodity exports such as; HS72to Malaysia, HS48 and HS85 to the United Arab Emirates, and HS48 to Bangladesh arenegatively affected by a rise in the exchange rate. Meanwhile, in the long term, commodityexports of HS48 to Saudi Arabia, HS74 to Malaysia, HS85 to the United Arab Emirates,HS54 to Turkey, and HS48 to Bangladesh showed significant negative results when there isan upsurge in the rate of exchange. This means that in the long term, with a 1% increasein the exchange rate, the export of commodity HS85 (electrical equipment) to the UnitedArab Emirates will decrease by 1.38% (see Table 4). Sugiharti et al. (2020) found that thedepreciation in the Rupiah exchange rate against China’s Renminbi also tends to deteriorateexports of seven out of eleven commodities from Indonesia. They further observed thepossibility that the real exchange rate combined with relative changes in prices could leadto an adverse impact. Moreover, the difference in the depreciation of exchange rate impacton exports can be caused by two factors, which are the destination of export commodityand the type of export commodity (Vo et al. 2019).
4.4. The Influence of Exchange Rate Volatility on Exports
Findings indicate that five commodities are influenced by exchange rate volatility inthe short term. First, exchange rate volatility asserts a negative influence on export whichhas been observed in three commodities. These commodities are HS48 commodity exportsto Saudi Arabia and HS48 and HS55 to Bangladesh. The finding shows that a 1% rise inthe volatility of the exchange rate will decrease the commodity exports of HS48 (paperand cardboard) to Saudi Arabia by 0.25% (see Table 3). These findings are supported byUpadhyaya et al. (2020) findings, which proves that exchange rate volatility asserts anadverse effect on export in the ASEAN-5 region. These findings indicate that traders tendto act as risk-averse.
Other findings for the two commodities show that in the short term, the volatilitywill have an adverse and positive impact on different lags. These include exports of HS44commodities (wood and wood-processed goods) to Saudi Arabia and HS87 (vehicles otherthan railway) to the United Arab Emirates. These results according to Bahmani-Oskooeeand Aftab (2017) occur because of the attitude of traders who are risk-takers and risk-aversein exporting commodities to several partners.
The positive and negative impact of volatility, in the long run, appeared in ninecommodities. Volatility asserts an increasing impact on the export of HS44 to Saudi Arabia,HS85 to the United Arab Emirates, and HS48 to Bangladesh in the long run. For instance,the findings revealed that a 1% rise in the volatility of the exchange rate will rise theexport of commodity HS48, (paper and cardboard) to Bangladesh by 0.74% (see Table 4).

Economies 2022, 10, 78 14 of 18
These results were in line with Yunusa (2020), which proved the export performance ofcrude oil commodities from Nigeria to Spain, the United States, and the United Kingdom.This indicates that traders tend to act as risk-takers. Bahmani-Oskooee and Arize (2020)described that the positive effect of exchange rate volatility depends on the attitude ofrisk-takers in trading more for today to cover possible losses in the future. Moreover, inthe long run, volatility asserts an adverse impact on six commodities, such as exports ofcommodities; HS87 to Saudi Arabia, HS15, HS27, and HS74 to Malaysia, HS87 to the UnitedArab Emirates, HS15 and HS54 to Turkey, HS15 and HS55 to Bangladesh. For instance, thefinding indicates that, when the volatility increased by 1%, the export of HS87 commodities(vehicles other than railway) to the United Arab Emirates would decrease by 1.52% (seeTable 4). These results were consistent with Senadza and Diaba (2018), who observed thatthe volatility assets an adverse influence on exports for 11 African countries, Hooy andBaharumshah (2015) for Singapre and Indonesia, and Sugiharti et al. (2020) for Indonesia.
The volatility of the exchange rate tends to negatively influence exports of severalcommodities in the five OIC member countries in both the short term and the long term.This indicates that traders tend to avoid risk (risk-averse), they will hold back on carryingout high-risk exports to minimize the possibility of trade losses. Qian and Varangis (1994)in their study observed these cases in developing countries as the payment method ininternational trading in foreign currencies tend to have a high dollarization rate, thereforethe effect of volatility is significant on economic activity. Additionally, in developingeconomies, such as Indonesia, the derivatives market is still less developed, in which casethe hedging is not only inadequate but also expensive. Another probable description forthe long-term adverse effect of volatility is that the greater the risk, the greater the optionvalue, which leads to the cost increment to ensure impending profits, which in the end itreduces the bulk of market transactions.
Meanwhile, the effect that occurs in the long term is shown in nine commodities. Sixcommodities have a negative coefficient, which are Saudi Arabia (HS87), Malaysia (HS15,HS27, HS74), Turkey (HS15, HS54), Bangladesh (HS15 and HS55), and one commodity hasa positive coefficient for Bangladesh (HS48). These empirical findings are in line with Voet al. (2019), who found that volatility increases the export of transportation equipmentfrom Vietnam to three continents (Asia, America, and Europe).
In Pakistan and certain commodities, volatility has no significant influence on exports,both in the short term and long-term. Risk-averse and risk-takers tend to continue exportirrespective of the volatility. Hall et al. (2010) have argued that an unregulated capitalmarket may decrease the influence of the fluctuation in the exchange rate on exports.
5. Conclusions and Policy Implication
This study analysed the short and long-term influence of the real exchange rate andits volatility on Indonesia’s exports of four main commodities to six OIC countries forthe period 2007:M1–2019:M12. Findings indicate that the real exchange rate asserts asignificant influence on eleven commodities in the short term and ten commodities in thelong term. Other findings demonstrate that volatility asserts a significant influence on fivecommodities in the short-run and twelve commodities in the long run.
The exchange rate asserts an increasing impact on Indonesian exports to Saudi Arabia(HS48), Malaysia (HS74), Pakistan (HS48), United Arab Emirates (HS87), Turkey (HS40),and Bangladesh (HS15, HS48, and HS55) in the short term. In addition, the exchange rateasserts a positive and negative influence on different lags in Malaysia (HS72). The findingshows that in the short term, the exchange rate has a decreasing impact on exports to theUnited Arab Emirates (HS48 and HS85), whereas, in the long term, the exchange rate hasan increasing impact on exports to Saudi Arabia (HS87), United Arab Emirates (HS71 andHS87), Bangladesh (HS15 and HS55). Moreover, the exchange rate has a decreasing impacton exports to Saudi Arabia (HS48), Malaysia (HS74), United Arab Emirates (HS85), Turkey(HS54), and Bangladesh (HS48).

Economies 2022, 10, 78 15 of 18
In the short term, the volatility asserts a decreasing impact on Indonesia’s exportsto Saudi Arabia (HS48), Bangladesh (HS48 and HS55). Furthermore, the volatility hasdemonstrated negative and positive impacts on different lags in Saudi Arabia (HS44) andUnited Arab Emirates (HS87). In the long term, volatility possessed a negative influence onexport to Saudi Arabia (HS87), Malaysia (HS15, HS27, HS74), United Arab Emirates (HS87),Turkey (HS15 and HS54), Bangladesh (HS15 and HS55). In addition, in the long-term, thevolatility also asserts an increasing impact on exports to Saudi Arabia (HS44), United ArabEmirates (HS85), and Bangladesh (HS48).
The volatility of the real exchange rate tends to have a more adverse influence onseveral commodities exported to OIC member countries. Therefore, we recommend theneed for government to always maintain a stable and competitive Rupiah exchange rateand implement appropriate fiscal and monetary policies. Exporters may be able to takea more risk-taking attitude so that domestic commodities are not less competitive withother countries by meeting the needs of goods consumed by OIC member countries whenvolatility is high. In addition, governments can assist investors and traders in orientedexports industries to invest in industrial sectors that would gain from the volatility. If theadverse impact of volatility on exports volume is related to high volatility and the positiveinfluence is connected to low volatility, then the influence of volatility on exports volume isnon-linear. Therefore, this study can be extended to a non-linear model.
The major limitation of this study is that it focuses mainly on the analysis of thevolatility of the Rupiah exchange rate impact on four major commodities exported tosix OIC countries. On this note, the study only controls for the exchange rate, exchangerate volatility, and the dynamic adjustments of the exchange rate as the determinants ofthe main commodity exports to selected OIC countries. With this, therefore, future workshould consider incorporating other determinants of exports to OIC countries especiallymacroeconomic determinants of countries’ exports. Therefore, future studies should explorethe influence of volatility of the Rupiah exchange rate on not only main commoditiesexported to six OIC member countries but many more commodities exported to a largernumber of OIC countries.
Author Contributions: Conceptualization, R.D.H.; Formal analysis, R.D.H., A.D.P.S. and K.H.I.;Funding acquisition, R.D.H.; Investigation, A.D.P.S.; Methodology, R.D.H. and A.D.P.S.; Projectadministration, T.S.; Resources, T.S.; Software, A.D.P.S. and T.S.; Supervision, R.D.H. and T.S.;Validation, A.D.P.S. and K.H.I.; Writing—original draft, K.H.I.; Writing—review & editing, K.H.I. Allauthors have read and agreed to the published version of the manuscript.
Funding: This research received no external funding.
Institutional Review Board Statement: Not applicable.
Informed Consent Statement: Not applicable.
Data Availability Statement: Available on request.
Conflicts of Interest: The authors declare no conflict of interest.
Appendix A
Table A1. Variable Source.
Variable Data Type Data Source
Export Secondary International Trade Centre
Nominal Exchange Rate Secondary International financial Statistic
Consumer Price Index Secondary International financial Statistic

Economies 2022, 10, 78 16 of 18
Table A2. Commodity Descriptions.
HS15 Animal, vegetable fats, and oils
HS27 Mineral fuels, mineral oils, etc.
HS40 Rubber and articles thereof
HS44 Wood and articles of wood
HS48 Paper and paperboard
HS52 Cotton
HS54 Man-made filaments
HS55 Man-made staple fibres
HS72 Iron and steel
HS71 Natural or cultured pearls
HS74 Copper and articles thereof
HS85 Electrical machinery, equipment, and spareparts
HS87 Vehicles other than railway
Table A3. EGARCH Estimation Result.
RER RER IDR/SAR RER IDR/MYR RER IDR/PKR RER IDR/AED RER IDR/TRY RER IDR/BDT
AR(1) 0.763 ***(0.068)
0.361 ***(0.070)
−0.418 **(0.198) - - -
AR(2) - - - - - −0.051(0.082)
MA(1) −0.439 ***(0.112) - 0.710 ***
(0.142)0.258 ***(0.102)
0.231 ***(0.063)
0.334 ***(0.094)
C 38.737 ***(9.387)
16.270 ***(6.628)
−0.397 **(0.204)
18.701 ***(5.765)
−35.61 ***(9.475)
0.030(0.277)
C(3) - 1.124 *(0.682) - 1.492 ***
(0.458)0.174
(0.171)
C(4) 0.722 ***(0.182) - −0.424 ***
(0.086)0.544 ***(0.111)
0.698 ***(0.087)
0.033(0.089)
C(5) 0.351 *(0.212)
0.550 ***(0.120)
0.592 ***(0.115)
0.338 ***(0.087)
0.398 ***(0.148)
0.505 ***(0.136)
C(6) −0.430 **(0.223)
0.810 ***(0.087)
0.049(0.071)
0.770 ***(0.060)
−0.139 ***(0.029)
−0.387(0.272)
C(7) 0.472 ***(0.069) - 0.984 ***
(0.026) - −0.050 *(0.029)
−0.010(0.224)
C(8) 0.925 ***(0.018) - - - 0.936 ***
(1.66)0.194 ***(0.062)
C(9) - - - - - 0.945 ***(0.400)
(p, q) (2, 1) (1, 1) (1, 1) (1, 1) (2, 2) (3, 2)
ARCH-LM Test(p-value) 0.135 0.802 0.640 0.185 0.714 0.066
Sign-Bias Test(p-value) 0.213 0.687 0.851 0.606 0.526 0.489

Economies 2022, 10, 78 17 of 18
Table A3. Cont.
RER RER IDR/SAR RER IDR/MYR RER IDR/PKR RER IDR/AED RER IDR/TRY RER IDR/BDT
Negative-BiasTest (p-value) 0.867 0.510 0.241 0.554 0.196 0.438
Positive-BiasTest (p-value) 0.182 0.723 0.697 0.875 0.579 0.248
Joint-Bias Test(p-value) 0.535 0.745 0.4129 0.935 0.536 0.564
Source: authors’ computation using Eviews 12. Note: std. errors were in brackets; *** indicates p < 0.01, **indicates p < 0.05, * indicates p < 0.1.
ReferencesAkanbi, Sa’ad Babatunde, Halimah Adedayo Alaghe, Hammed Agboola Yusuf, and Musibau Hammed Oluwaseyi. 2017. Exchange
Rate Volatility and Non-oil Exports in Nigeria: An Empirical Investigation. Journal of Emerging Economies & Islamic Research 5:5–15. [CrossRef]
Alpay, Savas, Murat Atlamaz, and Esat Bakimli. 2011. Trade among OIC Countries: Limits of Islamic Solidarity. Insight Turkey 13:145–70.
Asteriou, Dimitrios, Kaan Masatci, and Keith Pılbeam. 2016. Exchange rate volatility and international trade: International evidencefrom the MINT countries. Economic Modelling 58: 133–40. [CrossRef]
Bahmani-Oskooee, Mohsen, and Augustine C. Arize. 2020. On the Asymmetric Effects of Exchange Rate Volatility on Trade Flows:Evidence from Africa. Emerging Markets Finance and Trade 56: 913–39. [CrossRef]
Bahmani-Oskooee, Mohsen, and Muhammad Aftab. 2017. On the asymmetric effects of exchange rate volatility on trade flows: Newevidence from US-Malaysia trade at the industry level. Economic Modelling 63: 86–103. [CrossRef]
Bahmani-Oskooee, Mohsen, Toan Luu Duc Huynh, and Muhammad Ali Nasir. 2021. On the asymmetric effects of exchange-ratevolatility on trade flows: Evidence from US–UK Commodity Trade. Scottish Journal of Political Economy 68: 51–102. [CrossRef]
Bollerslev, Tim. 1986. Generalized autoregressive conditional heteroskedasticity. Journal of Econometrics 31: 307–27. [CrossRef]Cao-Alvira, José J. 2014. Real Exchange Rate Volatility on the Short- and Long-Run Trade Dynamics in Colombia. International Trade
Journal 28: 45–64. [CrossRef]Carbaugh, Robert J. 2015. International Economics, 16th ed. Boston: Cengage Learning.Choudhry, Taufiq, and Syed S. Hassan. 2015. Exchange rate volatility and UK imports from developing countries: The effect of the
global financial crisis. Journal of International Financial Markets, Institutions and Money 39: 89–101. [CrossRef]De Grauwe, Paul. 1988. Exchange Rate Variability and the Slowdown in Growth of International Trade. Staff Papers International
Monetary Fund 35: 63–84. [CrossRef]Engle, Robert F. 1982. Autoregressive Conditional Heteroscedasticity with Estimates of the Variance of United Kingdom Inflation.
Econometrica 50: 987. [CrossRef]Glosten, Lawrence R., Ravi Jagannathan, and David E. Runkle. 1993. On the Relation between the Expected Value and the Volatility of
the Nominal Excess Return on Stocks. The Journal of Finance 48: 1779–801. [CrossRef]Hall, Stephen, George Hondroyiannis, P. A. V. B. Swamy, George Tavlas, and Michael Ulan. 2010. Exchange-rate volatility and export
performance: Do emerging market economies resemble industrial countries or other developing countries? Economic Modelling27: 1514–21. [CrossRef]
Hooper, Peter, and Steven W. Kohlhagen. 1978. The effect of exchange rate uncertainty on the prices and volume of international trade.Journal of International Economics 8: 483–511. [CrossRef]
Hooy, Chee-Wooi, and Ahmad Zubaidi Baharumshah. 2015. Impact of exchange rate volatility on trade: Empirical evidence for theEast Asian economies. Malaysian Journal of Economic Studies 52: 75–95.
Hooy, Chee-Wooi, Law Siong-Hook, and Chan Tze-Haw. 2015. The impact of the Renminbi real exchange rate on ASEAN disaggregatedexports to China. Economic Modelling 47: 253–59. [CrossRef]
Kroner, Kenneth F., and William D. Lastrapes. 1993. The impact of exchange rate volatility on international trade: Reduced formestimates using the GARCH-in-mean model. Journal of International Money and Finance 12: 298–318. [CrossRef]
Krugman, Paul R., Maurice Obstfeld, and Mack Melitz. 2018. International Finance: Theory and Policy, 11th ed. Upper Saddle River:Pearson Education, Inc.
Mishkin, Frederic S. 2016. The Economics of Money, Banking and Financial Markets, 11th ed. Upper Saddle River: Pearson Education, Inc.Nelson, Daniel B. 1991. Conditional Heteroskedasticity in Asset Returns: A New Approach. Journal Econometrica Society 59: 347–70.
Available online: http://www.jstor.org/stable/2938260 (accessed on 12 December 2020).Nishimura, Yusaku, and Kenjiro Hirayama. 2013. Does exchange rate volatility deter Japan-China trade? Evidence from pre and
post-exchange rate reform in China. Japan and the World Economy 25–26: 90–101. [CrossRef]

Economies 2022, 10, 78 18 of 18
OIC Outlook Series. 2012. Exchange Rate Regime in the OIC Member Countries. A Publication of the Statistical, Economic and SocialResearch and Training Centre for Islamic Countries (SESRIC). Available online: https://sesricdiag.blob.core.windows.net/sesric-site-blob/files/article/445.pdf (accessed on 9 February 2021).
Pesaran, M. Hashem, Yongcheol Shin, and Richard J. Smith. 2001. Bounds testing approaches to the analysis of level relationships.Journal of Applied Econometrics 16: 289–326. [CrossRef]
Poon, Wai-Ching, and Chee-Wooi Hooy. 2013. Exchange-Rate Volatility, Exchange-Rate Regime, and Trade in OIC Countries. Journal ofAsia-Pacific Business 14: 182–201. [CrossRef]
Qian, Ying, and Panos Varangis. 1994. Does exchange rate volatility hinder export growth? Empirical Economics 19: 371–96. [CrossRef]Salvatore, Dominick. 2014. Managerial Economics in a Global Economy, 8th ed. Oxford: Oxford University Press.Senadza, Bernardin, and Desmond Delali Diaba. 2018. Effect of exchange rate volatility on trade in Sub-Saharan Africa. Journal of
African Trade 4: 20. [CrossRef]Sercu, Piet, and Cynthia Vanhulle. 1992. Exchange rate volatility, international trade, and the value of exporting firms. Journal of
Banking and Finance 16: 155–82. [CrossRef]Shin, Yongcheol, Byungchul Yu, and Matthew Greenwood-Nimmo. 2014. Festschrift in Honor of Peter Schmidt. In Festschrift in Honor
of Peter Schmidt. New York: Springer. [CrossRef]Sugiharti, Lilik, Miguel Angel Esquivias, and Bekti Setyorani. 2020. The impact of exchange rate volatility on Indonesia’s top exports
to the five main export markets. Heliyon 6: e03141. [CrossRef] [PubMed]Thuy, Vinh Nguyen Thi, and Duong Trinh Thi Thuy. 2019. The Impact of Exchange Rate Volatility on Exports in Vietnam: A Bounds
Testing Approach. Journal of Risk and Financial Management 12: 6. [CrossRef]Triplett, Russell E., and Ranjini L. Thaver. 2017. Volatility and Trade: The Case of South Africa’s Exports to China. Journal of Developing
Areas 51: 273–85. [CrossRef]Upadhyaya, Kamal P., Dharmendra Dhakal, and Franklin G. Mixon Jr. 2020. Exchange Rate Volatility and Exports: Some New
Estimates from the ASEAN-5. Journal of Developing Areas 54: 65–73. [CrossRef]Vo, Duc Hong, Anh The Vo, and Zhaoyong Zhang. 2019. Exchange Rate Volatility and Disaggregated Manufacturing Exports: Evidence
from an Emerging Country. Journal of Risk and Financial Management 12: 12. [CrossRef]Yunusa, Lateef Adewale. 2020. Exchange rate volatility and Nigeria crude oil export market. Scientific African 9: e00538. [CrossRef]