A box holds 240 eggs. The probability that ... - Winwood Maths
Patricia K. BrownAlaska Fisheries Science Center. National Marine Fisheries Service, NOM7600 Sand Point Way NE, Seattle, Washington 98 I J5
Lewis S. InczeBigelow Laboratory for Ocean SciencesWest Boothbay Harbor; Maine 04575
Arthur W. Kendall Jr.Alaska Fisheries Science Center; National Marine Fisheries Service, NOM7600 Sand Point Way NE, Seattle, Washington 981 J5
Peter B. OrtnerShailer R. CummingsAtlantic Oceanographic and Meteorological Laboratory430 1 Rickenbacker Causeway, Miami, Florida 33 I 49
fishes, particularly larvae ofmarinefishes, and attempted to identifycommon patterns and underlyingcausal mechanisms. They concludedthat changes in depth distributionof larvae, while possibly under endogenous control, seem to be mediated by a number of environmentalfactors. While light and gravitydominate, other factors such as hydrography, food, tidal currents, andturbulence may also be important(Neilson and Perry, 1990; Loughand Potter, 1993>. Planktonic larvaeoffishes are found generally at shallower depths at night than duringthe day (Kendall and Naplin, 1981>although the opposite pattern alsooccurs (Boehlert et aI., 1985;Yamashita et aI., 1985; Sogard etaI., 1987). In some species inconsistent patterns have been found amongstudies, possibly indicating the confounding effects ofseveral biotic and
The vertical distributions and movements ofplanktonic organisms mustbe studied to understand theirpopulation dynamics. Often individual populations undergo verticalmigrations and inhabit differentadvective and thermal regimes ona daily cycle (e.g. Hardy, 1936;Enright, 1977>. The entire planktonic community may migrate similarly, or different organisms may cooccur on a diel cycle. The reasonsfor diel vertical migrations of ichthyoplankton may be related tofeeding-digestion cycles, enhancedpredator avoidance, or directedtransport (Norcross and Shaw,1984; Lampert, 1989).
Planktonic eggs of most marinefishes occur in the upper water column, although there are exceptions(Ahlstrom, 1959; Coombs et al., 1981).Neilson and Perry (1990) reviewedliterature on vertical migration in
The vertical distribution of eggs andlarvae of walleye pollock,Theragra chalcogramma, inShelikof Strait, Gulf of Alaska *
Abstract.-The vertical distribution of walleye pollock eggs andlarvae in Shelikof Strait, Gulf ofAlaska, was investigated by usingdata from 36 Multiple OpeningClosing Net and EnvironmentalSensing System (MOCNESS) towstaken in April and May, 1986-88.Most eggs were found below 150 mto near bottom (-300 m) but progressively shallower later in theseason. Eggs in middle stages ofdevelopment were found at shallower depths than were younger orolder eggs. The vertical distribution of eggs was positively relatedto observed differences in seawater temperature but showed no relationship to density. Larvae hatchat incubation depth and quicklyrise to the upper 50 m of the watercolumn where they remain duringlarval development. Larger larvae(-7-10 mm standard length [SL]Jundergo limited diel vertical migration within the upper 50 m. Theyare deepest during the day, shallowest at dusk, slightly deeper atnight, and even deeper at dawn.Their mean depths of occurrencewere between 21 and 37 m at alltimes. At these depths, prey (copepod nauplii) generally were at densities sufficient for larval pollockgrowth as determined in laboratorystudies. Pronounced thermoclinesand pycnoclines were present inthe part ofthe water column inhabited by the larvae in late May. Larvae appear to remain below theupper mixed layer during periodsof increased turbulence. but atdepths during daytime where lightwas sufficient for feeding andwhere prey densities were adequate.
Manuscript accepted 31 January 1994.Fishery Bulletin 92:540-554 (1994).
540
* Contribution 0177 of the Fisheries-Oceanography Coordinated Investigations.
Kendall et al.: Vertical distribution of eggs and larvae of Theragra chalcogramma 541
abiotic factors (Sclafani et al., 1993). Vertical migrations in ichthyoplankton usually take place within theupper water column and may be correlated with thevertical distribution of larval fish prey (Munk et al.,1989; Pritchett and Haldorson, 1989). In some speciesthe vertical extent of diel migrations increases as larvae grow (Ellertson et al., 1981;Yamashitaet al., 1985l.
In early April a large population of walleye pollock, Theragra chalcogramma, spawns in a restrictedregion ofShelikofStrait, GulfofAlaska. The resultingplanktonic eggs and larvae can be found. often in largepatches, through April and May. Recruitment variation ofthis population has been examined, particularlythose factors affecting interannual fluctuations in eggand larval mortality (Schumacher and Kendall, 1991).
Previous studies of the vertical distribution ofwalleye pollock eggs and larvae in Shelikof Straithave relied upon unmonitored discrete depth sampling (Kendall et aI., 1987; Kendall and Kim, 1989).They have suggested that eggs occur generally below 150 m, and systematically change depth duringtheir -14-day incubation. Most larvae in these studies were found in the upper water column betweenabout 10 and 50 m, but they migrated vertically. Theyseemed to congregate near the upper part of thisrange around sunrise and sunset, were situatedsomewhat deeper during midday, and were distributed more uniformly at night. A similar pattern forlarval walleye pollock has been observed in otherparts of the North Pacific <Kamba, 1977; Pritchettand Haldorson, 1989; Walline1).
The present study describes the vertical distribution of walleye pollock eggs and larvae in relation tochanging environmental factors, measured on several dates in Shelikof Strait. This study is based onthe analysis of 36 MOCNESS tows (Multiple Opening-Closing Net and Environmental Sensing System;Weibe et aI., 1976) made over a period ofthree years.We examine ontogenetic changes in vertical distribution of eggs and larvae, and relate observed patterns to estimated ambient light and to measured temperature, salinity, and seawater density. Effects ofvertical distribution of larval prey and changes in mixedlayer depth due to wind events are also considered.
Materials and methodsMOCNESS tows were made from the NOAA shipMiller Freeman during spring 1986, 1987, and 1988,in areas where high abundance ofeggs or larvae were
I Walline, PD. 1981. Hatching dates ofwalleye pollock (Theragrachalcogramma) and vertical distribution of ichthyoplanktonfrom the eastern Bering Sea, June-July 1979. NWAFC Processed Rep. 81-05. Northwest and Alaska Fish. Cent., NMFS,NOAA, Seattle. WA 98115-0070, 22 p.
expected (Kendall and Picquelle, 1990) and had beendetected by exploratory sampling. Details ofsamplingduring these cruises are contained in Incze et al.(1987), Proctor (1989), and Lawrence et al. (1991).Some of the tows reported here (8-11 May 1986, series four) were also used in a study ofthe response ofzooplankton to the passage of a storm (Incze et aI.,1990). On each MOCNESS tow. seven or eight netswere deployed. The nets were towed obliquely at 0.81.0 mlsecond through selected depth intervals andopened and closed in sequence. Net depth, flowmeterreadings, temperature, and salinity (1987 and 1988)were displayed in real-time and digitally recorded.The nets had a nominal mouth area of 1 m2• Volumesfiltered per tow ranged from 34 to 980 m3 (mean=167m3). Net mesh was 0.153, 0.333, or 0.505 mm, depending on the size range of the larvae expected as well asother sampling objectives.
Depth intervals were based on previous studiesindicating that the eggs occurred primarily below150 m and the larvae primarily in the upper 50 m(Kendall et aI., 1987; Kendall and Kim, 1989). Earlyin the season when eggs were predominant, we focussed on the lower water column (>150 m), whichwas subdivided into 20-m sampling strata. Later inthe season, we subdivided the upper water column«90 m) into 15-m sampling strata.
Samples were fixed in 4-5% formalin and shippedto the Polish Plankton Sorting Center in Szczecin,Poland, where fish eggs and larvae were separated,and walleye pollock eggs and larvae were identifiedand counted. Stage of development of eggs was determined in each tow taken early in the season according to Blood et al. (1994). When more than 100eggs were present in a sample, a subsample of 100was staged. The egg stage data then were compressedinto six stage groups as in Kendall and Kim (1989).Standard length (SL) (to 0.1 mm) ofthe larvae in eachsample was measured. A subsample of 50 larvae wasmeasured when more than 50 larvae were presentin a sample. Catches of eggs and larvae per depthinterval are reported as numbers per 1,000 m3 ofwater based on volume filtered as determined fromdigital flowmeter records and net-frame angle. Meanand standard deviations (SD) ofnumbers per 1,000 m3
for each tow were computed from the weighted average ofthe numbers per 1,000 m3 from each net withinthe tow, by using the length of the depth interval foreach net as the weight. Estimation of egg and larvalmean depth, larval mean length, and their standarddeviations is based on cluster sampling where eachtow represents a cluster, each net subsamples eggsand larvae from the cluster, and each egg or larva isan element within the cluster (Equations 8.1 and 8.2in Scheaffer et aI., 1986). The observation associated
542
with each egg or larva, used to estimate mean depth,is the depth of the net where it was collected. Additionally, observations oflengths oflarvae in each netwere used to estimate mean lengths. Gaussian statistics, including analysis of variance (ANOVA) andanalysis of covariance (ANCOVA), were used to compare mean depths ofeggs and larvae and stages ofeggs,and lengths oflarvae with various environmental variables: time of day, temperature, salinity, and depth.
Temperature and salinity data from vertical Seabird conductivity, temperature, and depth (CTD)casts made in conjunction with the MOCNESS towsin 1986 were processed at the Pacific Marine Environmental Laboratory, Seattle. CTD data were collected with Seabird sensors on the MOCNESS in1987 and 1988 and were processed at the AtlanticOceanographic and Meteorological Laboratory, Miami. CTD data were available at 1-m depth intervals. In comparing temperature and density (expressed as crt) with depths of occurrence of eggs andlarvae among tows, the mean and standard deviation of temperature and density were calculatedwithin the depth interval of +/- one standard deviation of the mean depth of eggs or larvae. Egg meandepth weighted by abundance was regressed on temperature. Meteorological data from the Kodiak airport for the sampling periods in April and May 1986,1987, and 1988 were used to model hourly irradiance at depth in the area by using an attenuationcoefficient of0.16 (a mean value of33 measurements[SD=0.103] made aboard ship in Shelikof Strait between 3 and 23 May 19912).
2 Davis. R. AFSC. Personal commun., April 1992.
Fishery Bulletin 92(3). 1994
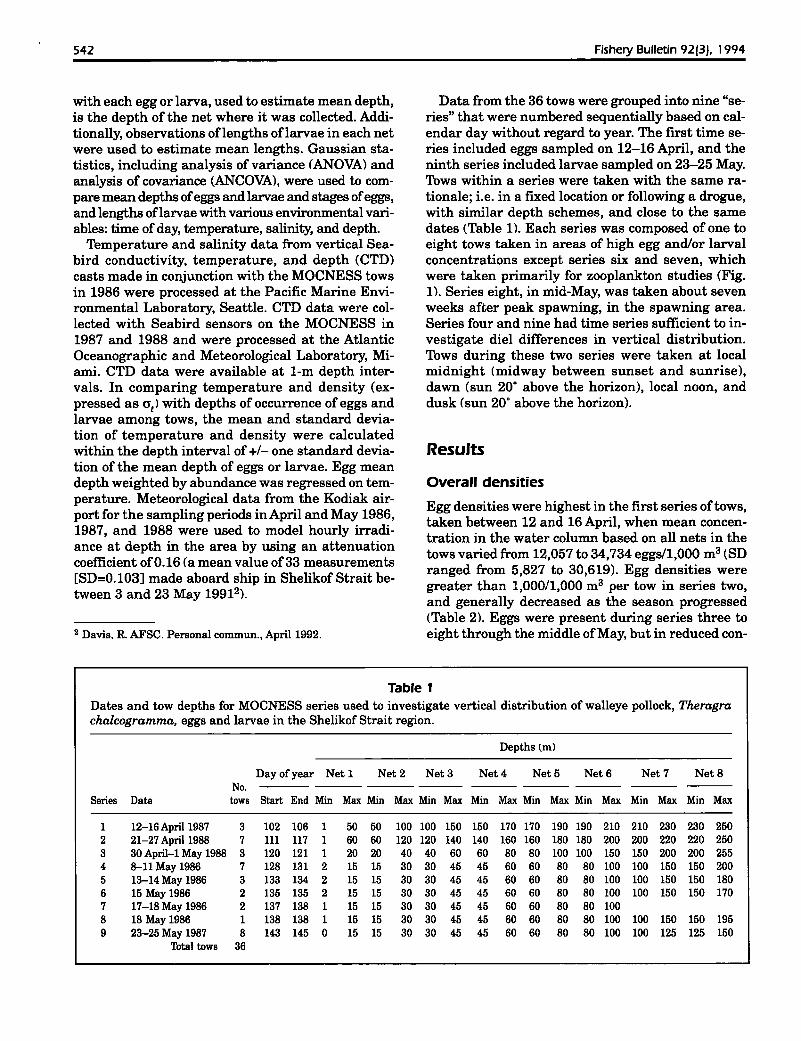
Data from the 36 tows were grouped into nine "series" that were numbered sequentially based on calendar day without regard to year. The first time series included eggs sampled on 12-16 April, and theninth series included larvae sampled on 23-25 May.Tows within a series were taken with the same rationale; i.e. in a fixed location or following a drogue,with similar depth schemes, and close to the samedates (Table 1), Each series was composed of one toeight tows taken in areas of high egg and/or larvalconcentrations except series six and seven, whichwere taken primarily for zooplankton studies (Fig.1). Series eight, in mid-May, was taken about sevenweeks after peak spawning, in the spawning area.Series four and nine had time series sufficient to investigate diel differences in vertical distribution.Tows during these two series were taken at localmidnight (midway between sunset and sunrise),dawn (sun 20· above the horizon), local noon, anddusk (sun 20· above the horizon).
Results
Overall densities
Egg densities were highest in the first series oftows,taken between 12 and 16 April, when mean concentration in the water column based on all nets in thetows varied from 12,057 to 34,734 eggs/1,000 m3 (SDranged from 5,827 to 30,619). Egg densities weregreater than 1,000/1,000 m3 ptlr tow in series two,and generally decreased as the season progressed<Table 2), Eggs were present during series three toeight through the middle ofMay, but in reduced con-
Table IDates and tow depths for MOCNESS series used to investigate vertical distribution of walleye pollock, Theragrachalcogramma, eggs and larvae in the Shelikof Strait region.
Depths {m)
Day of year Net 1 Net 2 Net 3 Net 4 Net 5 Net 6 Net 7 Net 8No.
Series Date tows Start End Min Max Min Max Min Max Min Max Min Max Min Max Min Max Min Max
1 12-16 April 1987 3 102 106 1 50 50 100 100 150 150 170 170 190 190 210 210 230 230 2502 21-27 April 1988 7 111 117 1 60 60 120 120 140 140 160 160 180 180 200 200 220 220 2503 30 April-1 May 1988 3 120 121 1 20 20 40 40 60 60 80 80 100 100 150 150 200 200 2554 8-11 May 1986 7 128 131 2 15 15 30 30 45 45 60 60 80 80 100 100 150 150 2005 13-14 May 1986 3 133 134 2 15 15 30 30 45 45 60 60 80 80 100 100 150 150 1806 15 May 1986 2 135 135 2 15 15 30 30 45 45 60 60 80 80 100 100 150 150 1707 17-18 May 1986 2 137 138 1 15 15 30 30 45 45 60 60 80 80 1008 18 May 1986 1 138 138 1 15 15 30 30 45 45 60 60 80 80 100 100 150 150 1959 23-25 May 1987 8 143 145 0 15 15 30 30 45 45 60 60 80 80 100 100 125 125 150
Total tows 36
Kendall et al.: Vertical distribution of eggs and larvae of Theragra chalcogramma 543
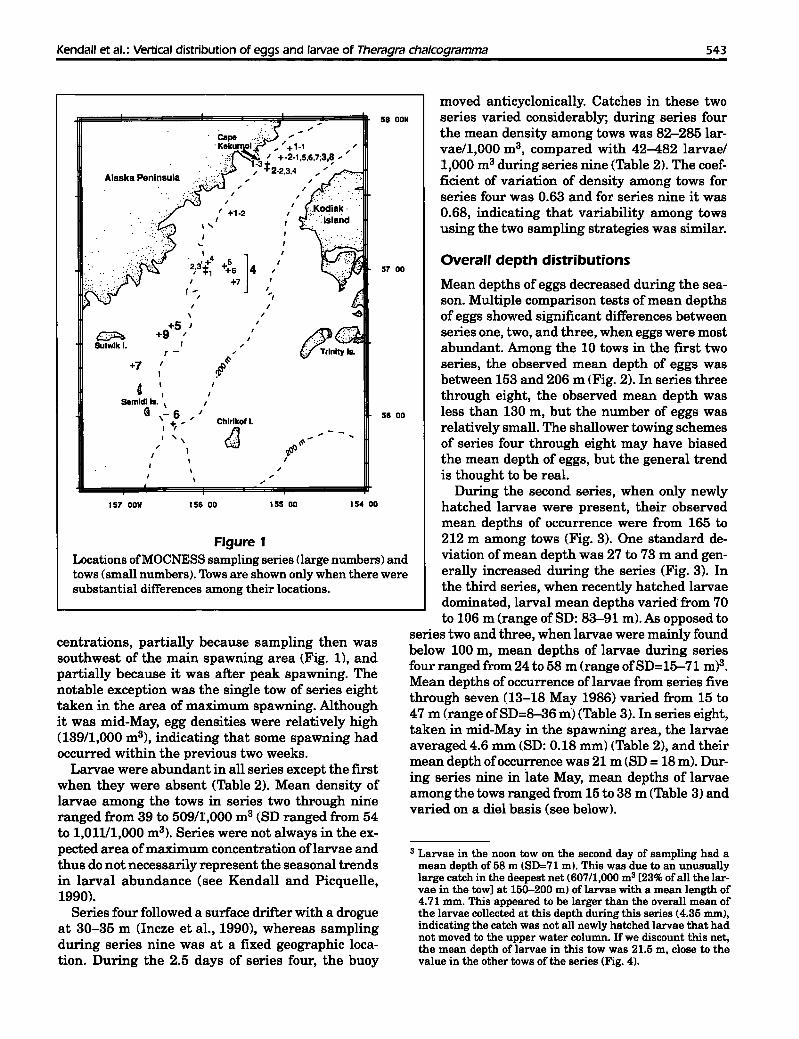
Figure 1Locations ofMOCNESS sampling series <large numbers) andtows (small numbers). Thws are shown only when there weresubstantial differences among their locations.
centrations, partially because sampling then wassouthwest of the main spawning area (Fig. 1), andpartially because it was after peak spawning. Thenotable exception was the single tow of series eighttaken in the area of maximum spawning. Althoughit was mid-May, egg densities were relatively high(139/1,000 mS), indicating that some spawning hadoccurred within the previous two weeks.
Larvae were abundant in all series except the firstwhen they were absent (Table 2). Mean density oflarvae among the tows in series two through nineranged from 39 to 50911,000 mS (SD ranged from 54to 1,011/1,000 mS). Series were not always in the expected area ofmaximum concentration oflarvae andthus do not necessarily represent the seasonal trendsin larval abundance (see Kendall and Picquelle,1990).
Series four followed a surface drifter with a drogueat 30-35 m (Incze et aI., 1990), whereas samplingduring series nine was at a fixed geographic location. During the 2.5 days of series four, the buoy
moved anticyclonically. Catches in these twoseries varied considerably; during series fourthe mean density among tows was 82-285 larvae/1,000 m3, compared with 42-482 larvael1,000 m3during series nine (Table 2). The coefficient of variation of density among tows forseries four was 0.63 and for series nine it was0.68, indicating that variability among towsusing the two sampling strategies was similar.
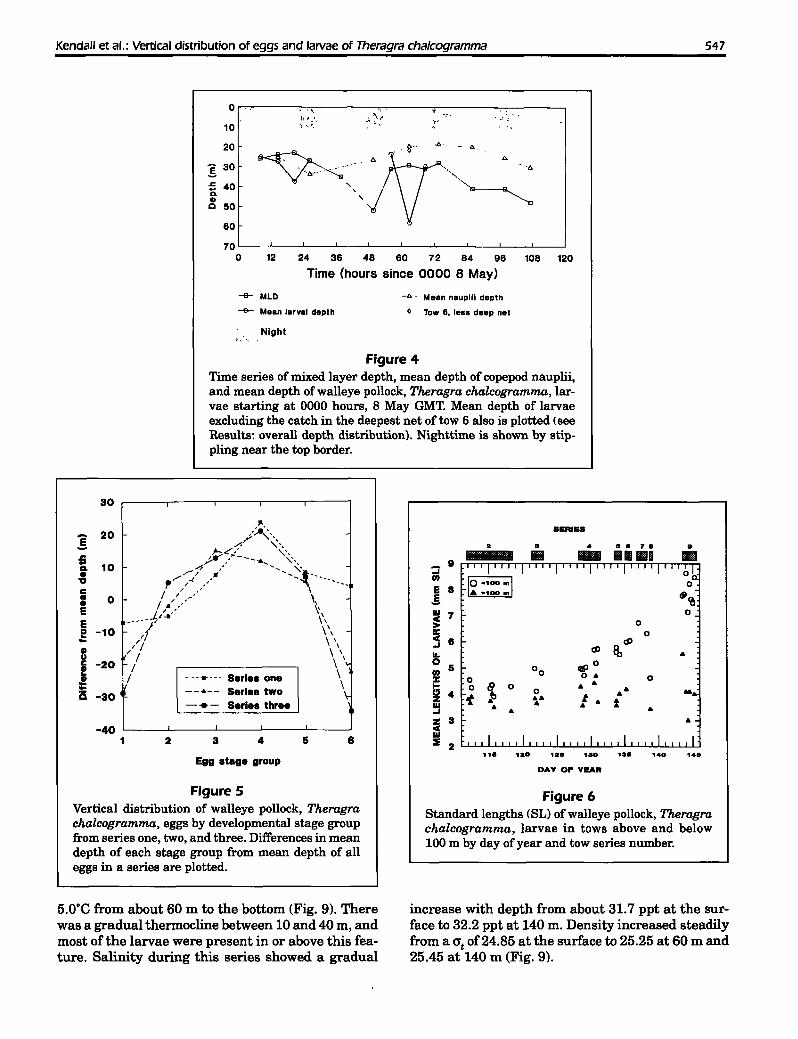
3 Larvae in the noon tow on the second day of sampling had amean depth of 58 m (SD=71 mI. This was due to an unusuallylarge catch in the deepest net (607/1,000 m3 [23% of all the larvae in the tow] at 150-200 ml oflarvae with a mean length of4.71 mm. This appeared to be larger than the overall mean ofthe larvae collected at this depth during this series (4.35 mm),indicating the catch was not all newly hatched larvae that hadnot moved to the upper water column. Ifwe discount this net,the mean depth of larvae in this tow was 21.5 m, close to thevalue in the other tows of the series (Fig. 4).
Overall depth distributions
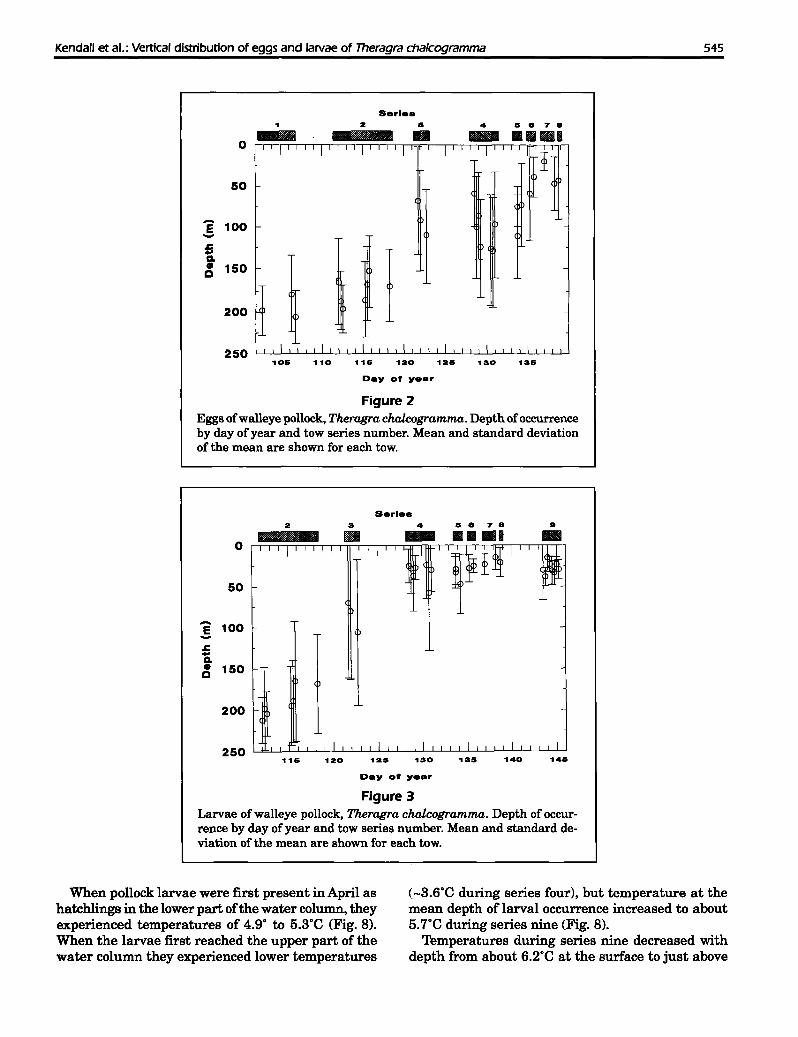
Mean depths of eggs decreased during the season. Multiple comparison tests of mean depthsof eggs showed significant differences betweenseries one, two, and three, when eggs were mostabundant. Among the 10 tows in the first twoseries, the observed mean depth of eggs wasbetween 153 and 206 m (Fig. 2). In series threethrough eight, the observed mean depth wasless than 130 m, but the number of eggs wasrelatively small. The shallower towing schemesof series four through eight may have biasedthe mean depth of eggs, but the general trendis thought to be real.
During the second series, when only newlyhatched larvae were present, their observedmean depths of occurrence were from 165 to212 m among tows (Fig. 3). One standard deviation of mean depth was 27 to 73 m and generally increased during the series (Fig. 3). Inthe third series, when recently hatched larvaedominated, larval mean depths varied· from 70to 106 m(range ofSD: 83-91 m).As opposed to
series two and three, when larvae were mainly foundbelow 100 m, mean depths of larvae during seriesfour ranged from 24 to 58 m (range ofSD=15-71 m)3.Mean depths of occurrence oflarvae from series fivethrough seven (13-18 May 1986) varied from 15 to47 m (range ofSD=8-36 m) (Table 3). In series eight,taken in mid-May in the spawning area, the larvaeaveraged 4.6 mm (SD: 0.18 mm) (Table 2), and theirmean depth ofoccurrence was 21 m (SD = 18 m). During series nine in late May, mean depths of larvaeamong the tows ranged from 15 to 38 m (Table 3) andvaried on a diel basis (see below).
56 00
57 00
58 DON
154 00
~-- ....
,,, ..,::.
I
I
I
I
II
II
155 00
+';6 ]4+7 I
I
"I
II
I
I
Chlrlkof I.
~
. . . - '. Cepe .,,:', :. --
.KekurlJ..Ol.i" ,'+1-' , ,. ,( ~ , +-2·1,5.6.7;3,8,. ;3 :j:2-2,3,4 '
I
I
I +1.2I,....
I
II
II
156 00
\,\
\
.'+42;3:1:,I
I --II
\
+5 I+9 I,
r -I+7
I,,
I
« \,SBmldlls. \
Q ,- 6I+"~
I .... \
157 DOW
Alaska Peninsula
~Sutwik I.
544 Fishery Bulletin 92(31. 1994
Changes in depth distribution with three (Table 3). Stage groups one and six were sig-ontogeny nificantly deeper than stage groups three, four, and
There was considerable variation in the mean depths five; stage group two was intermediate in depth (Fig.
of occurrence and in the abundance of eggs of differ- 5) (ANOVA, multiple comparisons test P<0.05).
ent stages among the 13 tows of series one, two, and Almost all of the larvae collected deeper than 100m throughout the study were <5
Table 2mm, while the length of larvae inthe upper part of the water column
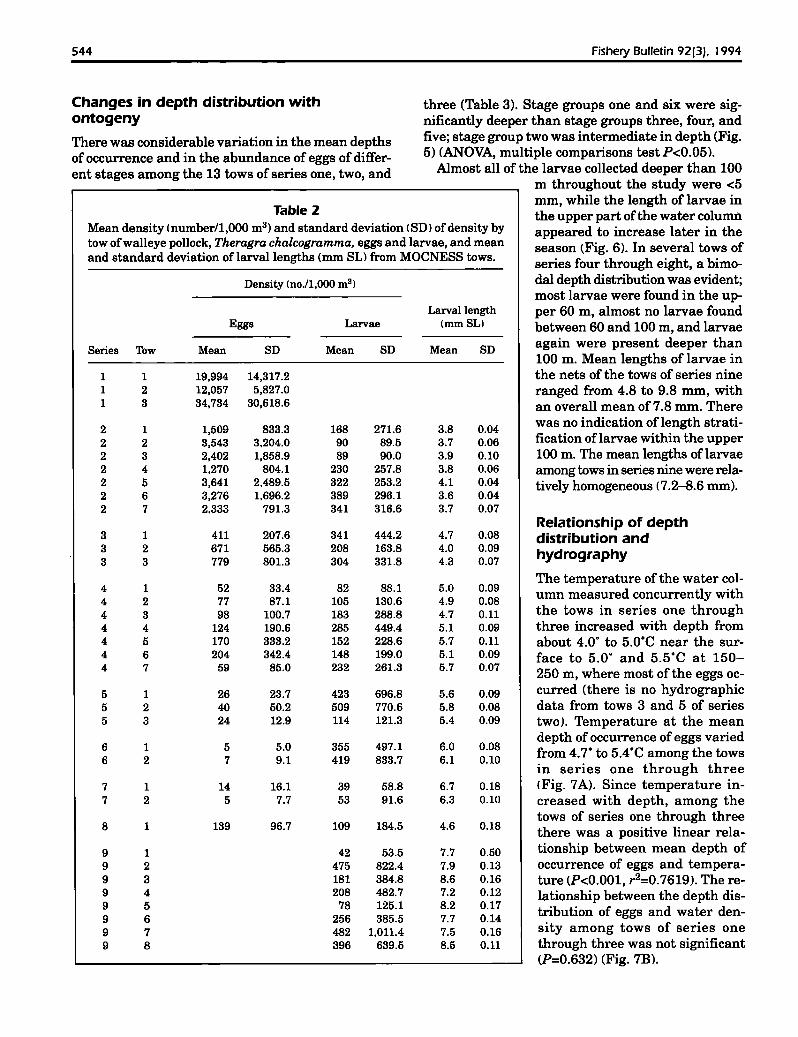
Mean density (number/I,OOO mS) and standard deviation (SD) ofdensity by appeared to increase later in thetow ofwalleye pollock, Theragra chalcogramma, eggs and larvae, and mean season lFig. 6). In several tows ofand standard deviation of larval lengths (mm SL) from MOCNESS tows. series four through eight, a bimo-
Density (no./1.000 mS) dal depth distribution was evident;most larvae were found in the up-
Larval length per 60 m, almost no larvae foundEggs Larvae (mmSLI between 60 and 100 m, and larvae
Series Tow Mean SD Mean SD Mean SD again were present deeper than100 m. Mean lengths of larvae in
1 1 19.994 14,317.2 the nets of the tows of series nine1 2 12,057 5,827.0 ranged from 4.8 to 9.8 mm, with1 3 34,734 30,618.6 an overall mean of7.8 mm. There
2 1 1,509 833.3 168 271.6 3.8 0.04was no indication oflength strati-
2 2 3,543 3.204.0 90 89.5 3.7 0.06 fication oflarvae within the upper2 3 2,402 1,858.9 89 90.0 3.9 0.10 100 m. The mean lengths oflarvae2 4 1.270 804.1 230 257.8 3.8 0.06 among tows in series nine were rela-2 5 3,641 2.489.5 322 253.2 4.1 0.04 tively homogeneous (7.2-8.6 mm).2 6 3,276 1.696.2 389 296.1 3.6 0.042 7 2.333 791.3 341 316.6 3.7 0.07
Relationship of depth3 1 411 207.6 341 444.2 4.7 0.08 distribution and3 2 671 565.3 208 163.8 4.0 0.09 hydrography3 3 779 801.3 304 331.8 4.3 0.07
4 1 52 33.4 82 88.1 5.0 0.09The temperature of the water col-
4 2 77 87.1 105 130.6 4.9 0.08umn measured concurrently with
4 3 98 100.7 183 288.8 4.7 0.11 the tows in series one through4 4 124 190.6 285 449.4 5.1 0.09 three increased with depth from4 5 170 333.2 152 228.6 5.7 0.11 about 4.0· to 5.0·C near the sur-4 6 204 342.4 148 199.0 5.1 0.09 face to 5.0· and 5.5·C at 150-4 7 59 85.0 232 261.3 5.7 0.07 250 m, where most of the eggs oc-
5 1 26 23.7 423 696.8 5.6 0.09 curred (there is no hydrographic5 2 40 50.2 509 770.6 5.8 0.08 data from tows 3 and 5 of series5 3 24 12.9 114 121.3 5.4 0.09 two). Temperature at the mean
6 1 5 5.0 355 497.1 6.0 0.08depth of occurrence of eggs varied
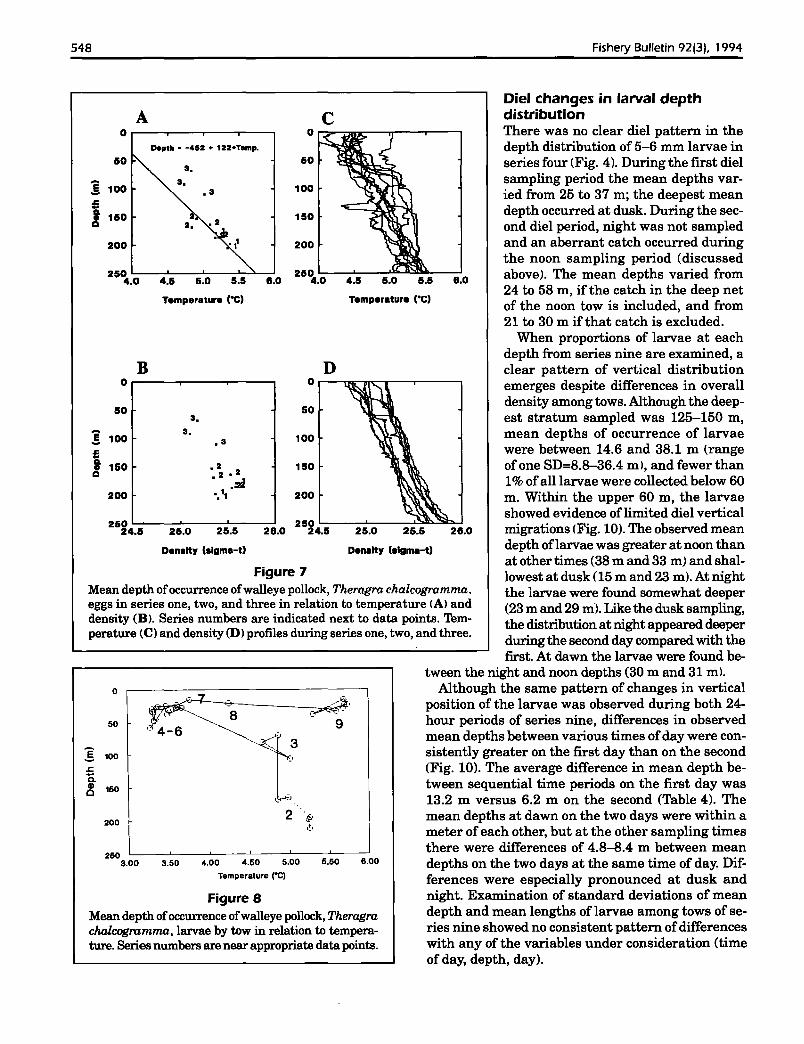
6 2 7 9.1 419 833.7 6.1 0.10from 4.7" to 5.4·C among the towsin series one through three
7 1 14 16.1 39 58.8 6.7 0.18 (Fig.7A). Since temperature in-7 2 5 7.7 53 91.6 6.3 0.10 creased with depth, among the
8 1 139 96.7 109 184.5 4.6 0.18tows of series one through threethere was a positive linear rela-
9 1 42 53.5 7.7 0.50 tionship between mean depth of9 2 475 822.4 7.9 0.13 occurrence of eggs and tempera-9 3 181 384.8 8.6 0.16 ture lP<O.OOl, r2=0.7619). The re-9 4 208 482.7 7.2 0.12 lationship between the depth dis-9 5 78 125.1 8.2 0.17 tribution of eggs and water den-9 6 256 385.5 7.7 0.149 7 482 1.011.4 7.5 0.16 sity among tows of series one9 8 396 639.5 8.5 0.11 through three was not significant
lP=0.632) (Fig. 7B).
Kendall et al.: Vertical distribution of eggs and larvae of Theragra chalcogramma 545
I
4 IS IS 7 8
IIIIIIiIi1III III IIIIU
Serle.2 a•1-o II I I I
50
I I·
f
i 100......5a.~ 150
200
250105 110 115 120
I·125
. I .1S0 1as
Day of year
Figure 2Eggs ofwalleye pollock, Theragra chalcogramma. Depth ofoccurrenceby day of year and tow series number. Mean and standard deviationof the mean are shown for each tow.
Serlea
o
50
roo t I& 150 l t
200 1250
115
Day of y.ar
Figure 3Larvae of walleye pollock, Theragra chalcogramma. Depth of occurrence by day of year and tow series number. Mean and standard deviation of the mean are shown for each tow.
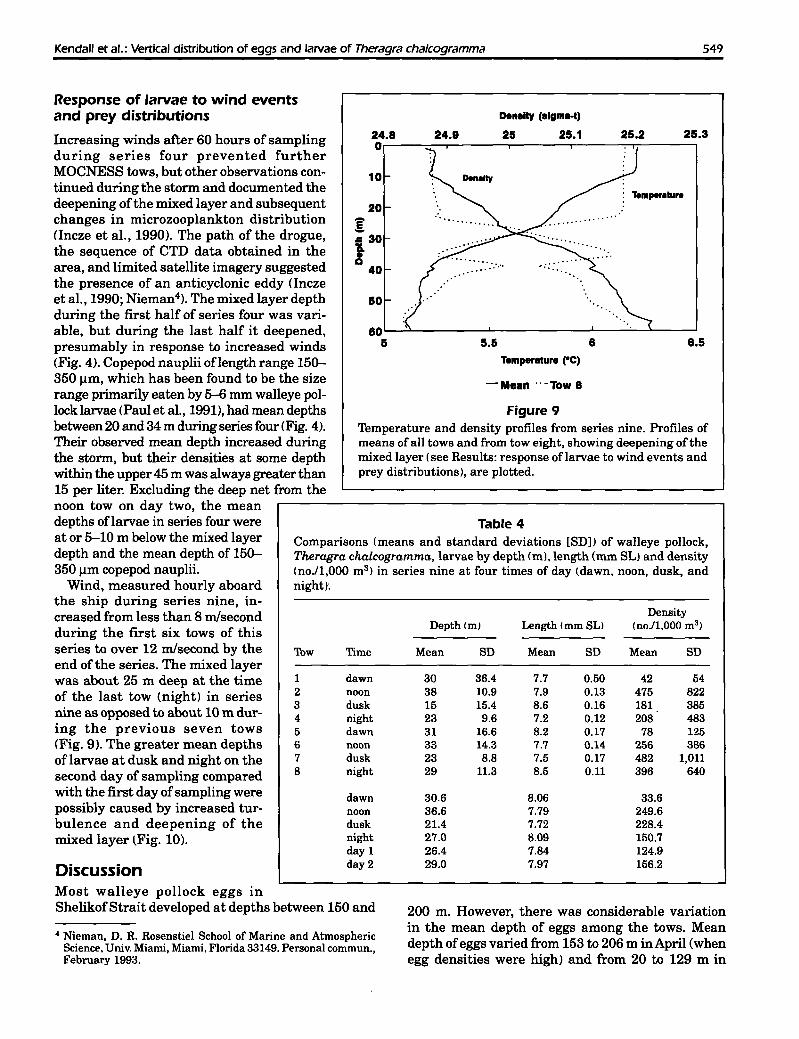
When pollock larvae were first present in April ashatchlings in the lower part ofthe water column, theyexperienced temperatures of 4.9° to 5.3°C (Fig. 8).When the larvae first reached the upper part of thewater column they experienced lower temperatures
(_3.6°C during series four), but temperature at themean depth of larval occurrence increased to about5.7°C during series nine (Fig. 8).
Temperatures during series nine decreased withdepth from about 6.2°C at the surface to just above

546 Fishery Bulletin 92(31. 1994
Table 3Means and standard deviations (SD) ofdepths ofwalleye pollock, Theragra chalcogramma, eggs (total and by stagegroup) and larvae from MOCNESS tows.
Eggs by stage group
'Ibtal eggs Group 1 Group 2 Group 3 Group 4 Group 5 Group 6 Larvae
Series Tow Mean SD Mean SD Mean SD Mean SD Mean SD Mean SD Mean SD Mean SD
1 1 198 29.9 209 19.4 207 23.9 194 30.0 182 44.7 173 47.6 197 25.9
1 2 179 44.8 180 31.0 174 45.6 174 51.9 183 51.2 196 51.7 200 44.9
1 3 206 32.1 214 19.2 207 27.4 196 44.0 168 54.2 195 41.0 156 41.2
2 1 164 50.5 161 33.2 158 48.5 156 59.6 155 54.1 158 45.7 199 42.3 212 27.9
2 2 187 33.9 179 22.4 182 27.6 193 35.1 191 36.1 184 36.5 200 35.4 198 49.8
2 3 196 28.9 196 16.9 189 24.1 191 34.7 198 31.1 199 30.1 203 30.1 204 26.6
2 4 186 44.1 177 21.9 181 25.3 163 52.0 140 65.1 177 49.2 210 33.5 195 47.6
2 5 167 43.0 206 14.2 167 36.2 143 28.8 127 38.8 144 39.4 193 34.0 189 49.5
2 6 153 42.0 193 23.2 158 47.1 145 37.3 146 37.4 143 39.7 187 40.6 165 72.7
2 7 169 42.0 184 24.9 167 31.1 159 32.6 166 49.8 159 40.1 186 46.7 168 59.7
3 1 68 65.5 144 54.6 95 66.9 54 73.3 37 40.0 56 43.6 101 no 70 91.1
3 2 92 60.9 133 33.4 68 52.4 84 67.8 76 46.9 92 49.1 77 67.7 80 82.7
3 3 110 55.7 84 68.8 129 56.1 94 65.5 90 47.6 102 44.8 130 51.7 106 88.9
4 1 59 40.4 25 20.5
4 2 100 61.7 28 30.1
4 3 86 52.7 37 48.3
4 4 124 57.9 27 14.5
4 5 126 65.6 24 40.9
4 6 129 65.2 58 70.5
4 7 97 64.2 30 25.7
5 1 75 24.7 29 18.6
5 2 111 50.4 33 19.0
5 3 73 50.6 47 36.2
6 1 59 57.6 28 16.5
6 2 39 24.3 25 8.0
7 1 20 11.2 23 12.3
7 2 47 32.7 15 14.8
8 1 43 47.2 21 17.7
9 1 30 36.4
9 2 38 10.9
9 3 15 15.4
9 4 23 9.6
9 5 31 16.6
9 6 33 14.3
9 7 23 8.8
9 8 29 11.3
Kendall et al.: Vertical distribution of eggs and larvae of Theragra chalcogramma 547
o ..
10
20
] 30
:5 40Cl.II)
C 50
60
. .: ~
~ ..JV.....~ ... ·6··._ 6 .. 6
V.6.-..~-_·- '."b,
", ,.~
~ $ ~ ~ " ~ ~ ~ ~
Time (hours since 0000 8 May)12
70 L-__..L-_-L_---'-__---'__.l-_-'-_---'--_----I.__L-_
o
--e- MLD
-Eo- Mean larval depth
-6· Mean nauplii depth
~ Tow B, leaa deep net
Night:"."..
Figure 4Time series of mixed layer depth, mean depth of copepod nauplii,and mean depth of walleye pollock, Theragra chalcogramma, larvae starting at 0000 hours, 8 May GMT. Mean depth of larvaeexcluding the catch in the deepest net of tow 6 also is plotted (seeResults: overall depth distribution). Nighttime is shown by stippling near the top border.
."..~
"",? ~"~<'.:' ".
';-----.' --- .., -':',4,' ...... ""
//, rI -- }--." ,..(... -'\ -- .. -./ " ..- ,
/, ..- ,
;" .' \,..L.-a' \'----j' ,
'7 \"// \\, / \ '\ \
/ - --.--- Serle. one \--""-- Serle. two- .. - Serle. three
SERIES
IU 7~ 0II: 0oC 8
EbcP-'
IL.cP ..
05 lIIP
O
!0
0 o .. 00 ..l; 0 $ 0
0.. ....
Z 4 if .... ! .... ..~ .. .... ..Z 3oCIU:::i 2
a
::i 9 ~~~"'TTT"T~JJ~..-r--r-J~rnE 8.§
65432
30
! 20
.I:..10a.•"c::• 0•E
Ee -10...•1,1c:: -20!•...6 -30
-401
Egg .tage group1,. ,aD ,all 130 ,as
DAY OF YEAR
'''0 , ..a
Figure 5Vertical distribution of walleye pollock, Theragrachalcogramma, eggs by developmental stage groupfrom series one, two, and three. Differences in meandepth of each stage group from mean depth of alleggs in a series are plotted.
Figure 6Standard lengths (SL) of walleye pollock, Theragrachalcogramma, larvae in tows above and below100 m by day of year and tow series number.
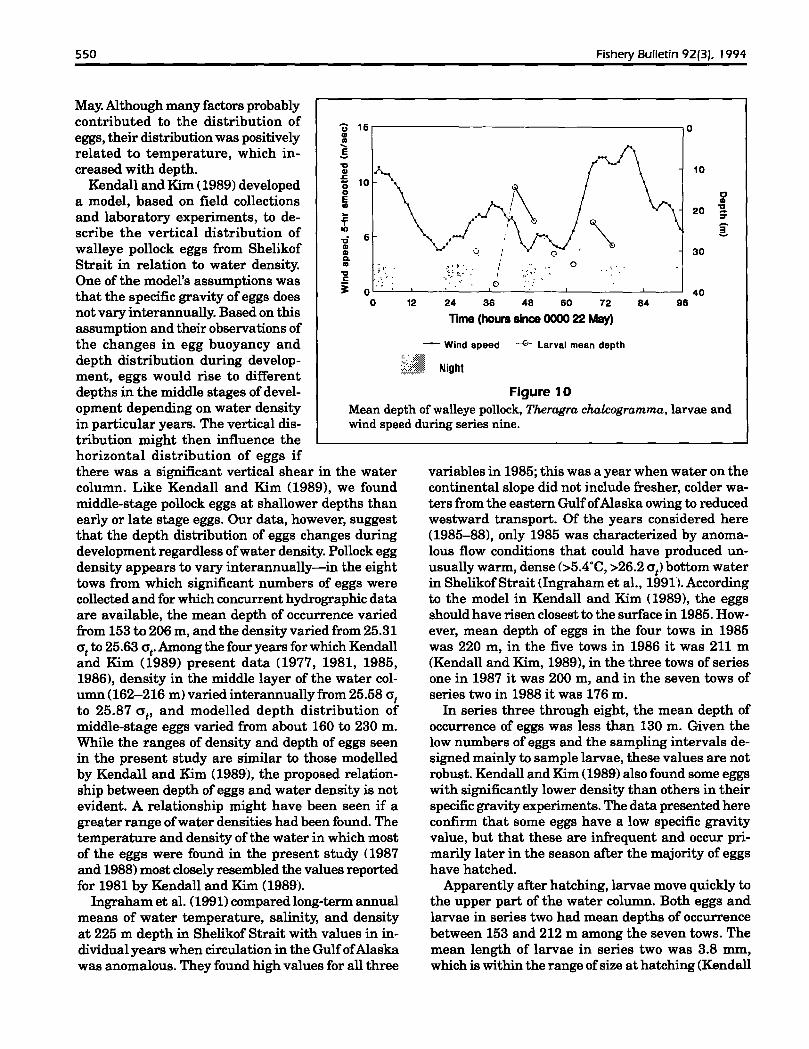
5.0·C from about 60 m to the bottom (Fig. 9). Therewas a gradual thermocline between 10 and 40 m, andmost of the larvae were present in or above this feature. Salinity during this series showed a gradual
increase with depth from about 31.7 ppt at the surface to 32.2 ppt at 140 m. Density increased steadilyfrom a 0t of 24.85 at the surface to 25.25 at 60 m and25.45 at 140 m (Fig. 9).
548 Fishery Bulletin 92131. 1994
Figure 7Mean depth ofoccurrence ofwalleye pollock, Theragra. chalcogramma.eggs in series one, two, and three in relation to temperature IAI anddensity (B). Series numbers are indicated next to data points. Temperature (C) and density (DIprofiles during series one, two, and three.
28.0
Diel changes in larval depthdistributionThere was no clear diel pattern in thedepth distribution of 5-6 mm larvae inseries four (Fig. 4). During the first dielsampling period the mean depths varied from 25 to 37 m; the deepest meandepth occurred at dusk. During the second diel period, night was not sampledand an aberrant catch occurred duringthe noon sampling period (discussedabove). The mean depths varied from24 to 58 m, if the catch in the deep netof the noon tow is included, and from21 to 30 m if that catch is excluded.
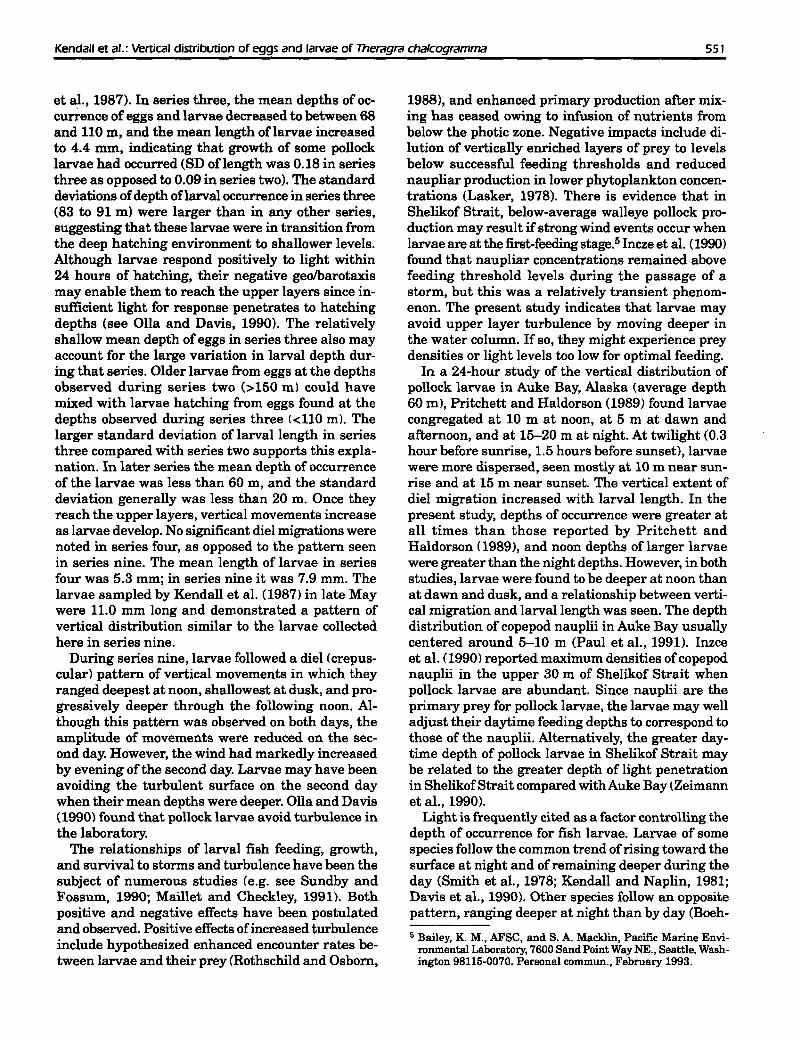
When proportions of larvae at eachdepth from series nine are examined, aclear pattern of vertical distributionemerges despite differences in overalldensity among tows. Although the deepest stratum sampled was 125-150 m,mean depths of occurrence of larvaewere between 14.6 and 38.1 m (rangeof one 80=8.8-36.4 m I, and fewer than1% ofall larvae were collected below 60m. Within the upper 60 m, the larvaeshowed evidence oflimited diel verticalmigrations (Fig. 10). The observed meandepth oflarvae was greater at noon thanat other times (38 m and 33 m) and shallowest at dusk (15 m and 23 m). At nightthe larvae were found somewhat deeper(23 m and 29 m). Like the dusk sampling,the distribution at night appeared deeperduring the second day compared with thefirst. At dawn the larvae were found be
tween the night and noon depths (30 m and 31 m).Although the same pattern of changes in vertical
position of the larvae was observed during both 24hour periods of series nine, differences in observedmean depths between various times ofday were consistently greater on the first day than on the second(Fig. 10). The average difference in mean depth between sequential time periods on the first day was13.2 m versus 6.2 m on the second (Table 4). Themean depths at dawn on the two days were within ameter of each other, but at the other sampling timesthere were differences of 4.8--8.4 m between meandepths on the two days at the same time of day. Differences were especially pronounced at dusk andnight. Examination of standard deviations of meandepth and mean lengths of larvae among tows of series nine showed no consistent pattern ofdifferenceswith any of the variables under consideration (timeof day, depth, day).
6.00
Temperature ("C)
Density (algma-t)
5.50
co
50
200
250 L-_....L...-_-Il!~>DoIa_-.J
4.0 4.5 5.0 5.5 8.0
150
100
8.0
D0
50
100
150
200
25028.0 24.5 25.0 25.5
5.5
4.00 4.50 5.00
Temperature reI
.3
5.0
Temperature ("C)
3.50
Depth· -452 + 122oTemp.
A
50
2503.00
B0
503.
! 1003.
.3.c:..a.
150 • ~ .2ea . :S200 '.".260
24.5 25.0 25.5
Density (slgma-t)
! 100.c:i.
150ea
200
2504.0 4.5
Figure 8Mean depth ofoccurrence ofwalleye pollock, Theragrachalcogramma. larvae by tow in relation to temperature. Series numbers are near appropriate data points.
Kendall et al.: Vertical distribution of eggs and larvae of Theragra chalcogramma 549
Table 4Comparisons (means and standard deviations [SD]) of walleye pollock,Theragra chalcogramma, larvae by depth (m),length (mm SL) and density(no./1,OOO m3 ) in series nine at four times of day (dawn. noon, dusk, andnight):
6.5
25.3
Temper.ture
25.2
6
.:
Temperature rC)
Density (slgmB·t)
25 25.1
":'"
-Mean "-Tow 8
5.5
24.9
200 m. However, there was considerable variationin the mean depth of eggs among the tows. Meandepth ofeggs varied from 153 to 206 m inApril (whenegg densities were high) and from 20 to 129 m in
24.80.------:-----,.-------,------.----.,.......-----,
50
601.-......:l-----...J.------.........-........;.---''------'5
10
Figure 9Temperature and density profiles from series nine. Profiles ofmeans of all tows and from tow eight, showing deepening of themixed layer (see Results: response oflarvae to wind events andprey distributions), are plotted.
DensityDepthCm) Length (mm SLl Cno./l,OOO m3)
Time Mean SD Mean SD Mean SD
dawn 30 36.4 7.7 0.50 42 54noon 38 10.9 7.9 0.13 475 822dusk 15 15.4 8.6 0.16 181 385night 23 9.6 7.2 0.12 208 483dawn 31 16.6 8.2 0.17 78 125noon 33 14.3 7.7 0.14 256 386dusk 23 8.8 7.5 0.17 482 1,011night 29 11.3 8.5 0.11 396 640
dawn 30.6 8.06 33.6noon 36.6 7.79 249.6dusk 21.4 7.72 228.4night 27.0 8.09 150.7day 1 26.4 7.84 124.9day 2 29.0 7.97 156.2
12345678
Tow
4 Nieman, D. R. Rosenstiel School of Marine and AtmosphericScience. Univ. Miami, Miami. Florida 33149. Personal commun.,February 1993.
DiscussionMost walleye pollock eggs inShelikofStrait developed at depths between 150 and
Response of larvae to wind eventsand prey distributions
Increasing winds after 60 hours of samplingduring series four prevented furtherMOCNESS tows, but other observations continued during the storm and documented thedeepening ofthe mixed layer and subsequentchanges in microzooplankton distribution(Incze et aI., 1990). The path of the drogue,the sequence of CTD data obtained in thearea, and limited satellite imagery suggestedthe presence of an anticyclonic eddy (Inczeet aI., 1990; Nieman4). The mixed layer depthduring the first half of series four was variable. but during the last half it deepened.presumably in response to increased winds(Fig. 4). Copepod nauplii oflength range 150350 Jlm, which has been found to be the sizerange primarily eaten by 5-6 mm walleye pollock larvae (Paul et aI., 1991), had mean depthsbetween 20 and 34 m during series four (Fig. 4).Their observed mean depth increased duringthe storm, but their densities at some depthwithin the upper 45 m was always greater than15 per liter. Excluding the deep net from thenoon tow on day two, the mean ,------------------------------,depths of larvae in series four wereat or 5-10 m below the mixed layerdepth and the mean depth of 150350 Jlm copepod nauplii.
Wind. measured hourly aboardthe ship during series nine, increased from less than 8 mlsecondduring the first six tows of thisseries to over 12 mlsecond by theend of the series. The mixed layerwas about 25 m deep at the timeof the last tow (night) in seriesnine as opposed to about 10 m during the previous seven tows(Fig. 9). The greater mean depthsof larvae at dusk and night on thesecond day of sampling comparedwith the first day ofsampling werepossibly caused by increased turbulence and deepening of themixed layer (Fig. 10).
550 Fishery Bulletin 92(3). 1994
10
CII
20 ~
[30
409684
o
-{,- Larval mean depth
24 36 48 60 72
Time (hours since 0000 22 May)
variables in 1985; this was a year when water on thecontinental slope did not include fresher, colder waters from the eastern GulfofAlaska owing to reducedwestward transport. Of the years considered here(1985-88), only 1985 was characterized by anomalous flow conditions that could have produced unusually warm, dense (>5.4°C, >26.2 0t) bottom waterin ShelikofStrait (Ingraham et aI., 1991">. Accordingto the model in Kendall and Kim (1989), the eggsshould have risen closest to the surface in 1985. However, mean depth of eggs in the four tows in 1985was 220 m, in the five tows in 1986 it was 211 m(Kendall and Kim, 1989), in the three tows of seriesone in 1987 it was 200 m, and in the seven tows ofseries two in 1988 it was 176 m.
In series three through eight, the mean depth ofoccurrence of eggs was less than 130 m. Given thelow numbers of eggs and the sampling intervals designed mainly to sample larvae, these values are notrobust. Kendall and Kim (1989) also found some eggswith significantly lower density than others in theirspecific gravity experiments, The data presented hereconfirm that some eggs have a low specific gravityvalue, but that these are infrequent and occur primarily later in the season after the majority of eggshave hatched.
Apparently after hatching, larvae move quickly tothe upper part of the water column. Both eggs andlarvae in series two had mean depths of occurrencebetween 153 and 212 m among the seven tows. Themean length of larvae in series two was 3.8 mm,which is within the range ofsize at hatching (Kendall
12
- Wind speed
kI Night
Figure 10Mean depth of walleye pollock, Theragra chalcogramma. larvae andwind speed during series nine.
"'0Gl~
"0oEI)..f10
'ti 5GlGla... .y:'. l"C .:~} .':::.- I :," ••i 0 L.''_'"·--'-·_.L-._--=--__......C_:,_----'-__.L- .L-_--'
o
U 15r------------------------.OIII)....!
May. Although many factors probablycontributed to the distribution ofeggs, their distribution was positivelyrelated to temperature, which increased with depth.
Kendall and Kim (1989) developeda model, based on field collectionsand laboratory experiments, to describe the vertical distribution ofwalleye pollock eggs from ShelikofStrait in relation to water density.One of the model's assumptions wasthat the specific gravity ofeggs doesnot vary interannually. Based on thisassumption and their observations ofthe changes in egg buoyancy anddepth distribution during develop-ment, eggs would rise to differentdepths in the middle stages ofdevelopment depending on water densityin particular years. The vertical distribution might then influence thehorizontal distribution of eggs ifthere was a significant vertical shear in the watercolumn. Like Kendall and Kim (1989), we foundmiddle-stage pollock eggs at shallower depths thanearly or late stage eggs. Our data, however, suggestthat the depth distribution of eggs changes duringdevelopment regardless ofwater density. Pollock eggdensity appears to vary interannually-in the eighttows from which significant numbers of eggs werecollected and for which concurrent hydrographic dataare available, the mean depth of occurrence variedfrom 153 to 206 m, and the density varied from 25.310t to 25.63 0t' Among the four years for which Kendalland Kim (1989) present data (1977, 1981, 1985,1986), density in the middle layer of the water column (162-216 m) varied interannually from 25.58 Of
to 25.87 crt' and modelled depth distribution ofmiddle-stage eggs varied from about 160 to 230 m.While the ranges of density and depth of eggs seenin the present study are similar to those modelledby Kendall and Kim (1989), the proposed relationship between depth of eggs and water density is notevident. A relationship might have been seen if agreater range ofwater densities had been found. Thetemperature and density ofthe water in which mostof the eggs were found in the present study (1987and 1988) most closely resembled the values reportedfor 1981 by Kendall and Kim (1989).
Ingraham et al. (1991) compared long-term annualmeans of water temperature, salinity, and densityat 225 m depth in Shelikof Strait with values in individual years when circulation in the GulfofAlaskawas anomalous. They found high values for all three
Kendall et al.: Vertical distribution of eggs and larvae of Theragra chalcogramma 551
et aI., 1987). In series three, the mean depths of occurrence of eggs and larvae decreased to between 68and 110 m, and the mean length oflarvae increasedto 4.4 mm, indicating that growth of some pollocklarvae had occurred (SD oflength was 0.18 in seriesthree as opposed to 0.09 in series two). The standarddeviations ofdepth oflarval occurrence in series three(83 to 91 m) were larger than in any other series,suggesting that these larvae were in transition fromthe deep hatching environment to shallower levels.Although larvae respond positively to light within24 hours of hatching, their negative geolbarotaxismay enable them to reach the upper layers since insufficient light for response penetrates to hatchingdepths (see Olla and Davis, 1990). The relativelyshallow mean depth of eggs in series three also mayaccount for the large variation in larval depth during that series. Older larvae from eggs at the depthsobserved during series two (>150 m) could havemixed with larvae hatching from eggs found at thedepths observed during series three «110 m). Thelarger standard deviation of larval length in seriesthree compared with series two supports this explanation. In later series the mean depth of occurrenceof the larvae was less than 60 m, and the standarddeviation generally was less than 20 m. Once theyreach the upper layers, vertical movements increaseas larvae develop. No significant diel migrations werenoted in series four, as opposed to the pattern seenin series nine. The mean length of larvae in seriesfour was 5.3 mm; in series nine it was 7.9 mm. Thelarvae sampled by Kendall et a1. (1987) in late Maywere 11.0 mm long and demonstrated a pattern ofvertical distribution similar to the larvae collectedhere in series nine.
During series nine, larvae followed a diel (crepuscular) pattern of vertical movements in which theyranged deepest at noon, shallowest at dusk, and progressively deeper through the following noon. Although this pattern was observed on both days, theamplitude of movements were reduced on the second day. However, the wind had markedly increasedby evening of the second day. Larvae may have beenavoiding the turbulent surface on the second daywhen their mean depths were deeper. Olla and Davis(1990) found that pollock larvae avoid turbulence inthe laboratory.
The relationships of larval fish feeding, growth,and survival to storms and turbulence have been thesubject of numerous studies (e.g. see Sundby andFossum, 1990; Maillet and Checkley, 1991). Bothpositive and negative effects have been postulatedand observed. Positive effects ofincreased turbulenceinclude hypothesized enhanced encounter rates between larvae and their prey (Rothschild and Osborn,
1988), and enhanced primary production after mixing has ceased owing to infusion of nutrients frombelow the photic zone. Negative impacts include dilution of vertically enriched layers of prey to levelsbelow successful feeding thresholds and reducednaupliar production in lower phytoplankton concentrations (Lasker, 1978). There is evidence that inShelikof Strait, below-average walleye pollock production may result if strong wind events occur whenlarvae are at the first-feeding stage.5 Incze et a1. (1990)found that naupliar concentrations remained abovefeeding threshold levels during the passage of astorm, but this was a relatively transient phenomenon. The present study indicates that larvae mayavoid upper layer turbulence by moving deeper inthe water column. If so, they might experience preydensities or light levels too low for optimal feeding.
In a 24-hour study of the vertical distribution ofpollock larvae in Auke Bay, Alaska (average depth60 ml, Pritchett and Haldorson (1989) found larvaecongregated at 10 m at noon, at 5 m at dawn andafternoon, and at 15-20 m at night. At twilight (0.3hour before sunrise, 1.5 hours before sunset), larvaewere more dispersed, seen mostly at 10 m near sunrise and at 15 m near sunset. The vertical extent ofdiel migration increased with larval length. In thepresent study, depths of occurrence were greater atall times than those reported by Pritchett andHaldorson (1989), and noon depths oflarger larvaewere greater than the night depths. However, in bothstudies, larvae were found to be deeper at noon thanat dawn and dusk, and a relationship between vertical migration and larval length was seen. The depthdistribution of copepod nauplii in Auke Bay usuallycentered around 5-10 m (Paul et aI., 1991). Inzceet a1. (1990) reported maximum densities ofcopepodnauplii in the upper 30 m of Shelikof Strait whenpollock larvae are abundant. Since nauplii are theprimary prey for pollock larvae, the larvae may welladjust their daytime feeding depths to correspond tothose of the nauplii. Alternatively, the greater daytime depth of pollock larvae in Shelikof Strait maybe related to the greater depth of light penetrationin ShelikofStrait compared with Auke Bay (Zeimannet aI., 1990).
Light is frequently cited as a factor controlling thedepth of occurrence for fish larvae. Larvae of somespecies follow the common trend ofrising toward thesurface at night and of remaining deeper during theday (Smith et aI., 1978; Kendall and Naplin, 1981;Davis et al., 1990). Other species follow an oppositepattern, ranging deeper at night than by day (Boeh-
\; Bailey, K. M., AFSC, and S. A. Macklin, Pacific Marine Environmental Laboratory, 7600 Sand Point Way NE., Seattle. Washington 98115-0070. Personal commun., February 1993.
552 Fishery Bulletin 92(3). 1994
Many people, mainly from the AFSC, helpedcollect and process the samples and data uponwhich this paper is based. We thank themall, particularly those who endured the harshconditions of Shelikof Strait during thecruises there. David Nieman rendered hisexpert help in operating the MOCNESS onseveral cruises. Allen Macklin (PMEL) isthanked for obtaining and analyzing meteorological data presented here. Richard Davis(AFSC) graciously let us use irradiance withdepth data obtained by his modelling efforts.An earlier draft of the manuscript was helpedimmeasurably by reviews of many of the researchers involved in the FOCI (FisheriesOceanography Coordinated Investigations)program: Kevin Bailey, Jim Schumacher, JeffNapp, Ric Brodeur, Bori Olla, Gary Stauffer,and Susan Picquelle (whom also aided in statistical analyses). Ian Perry (Canada, Department of Fisheries and Oceans) also provideda very helpful review of the manuscript.
Acknowledgments
bers, demonstrating negative geotaxis or barotaxis,or both. Light levels between 0.01 and 10 Jlmol'm-2's-1
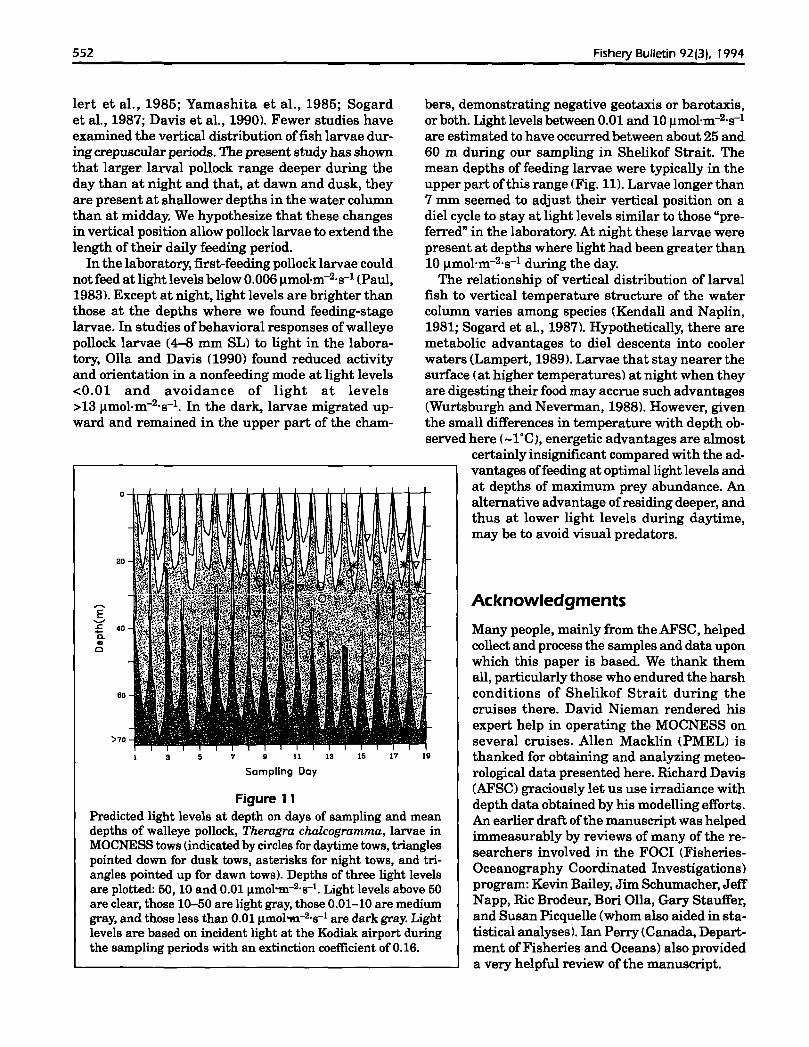
are estimated to have occurred between about 25 and60 m during our sampling in Shelikof Strait. Themean depths of feeding larvae were typically in theupper part ofthis range (Fig. 11). Larvae longer than7 mm seemed to adjust their vertical position on adiel cycle to stay at light levels similar to those "preferred" in the laboratory. At night these larvae werepresent at depths where light had been greater than10 Jlmol'm-2's-1 during the day.
The relationship of vertical distribution of larvalfish to vertical temperature structure of the watercolumn varies among species (Kendall and Naplin,1981; Sogard et al., 1987). Hypothetically, there aremetabolic advantages to diel descents into coolerwaters (Lampert, 1989). Larvae that stay nearer thesurface (at higher temperatures) at night when theyare digesting their food may accrue such advantages(Wurtsburgh and Neverman, 1988). However, giventhe small differences in temperature with depth observed here (-l"C), energetic advantages are almost
certainly insignificant compared with the advantages offeeding at optimal light levels andat depths of maximum prey abundance. Analternative advantage ofresiding deeper, andthus at lower light levels during daytime,may be to avoid visual predators.
20
,.....E........r:. 40a.Gl
0
80
>70
3 7 9 11 13 15 17 19
Sampling Day
Figure 11Predicted light levels at depth on days of sampling and meandepths of walleye pollock, Theragra chalcogramma, larvae inMOCNESS tows (indicated by circles for daytime tows, trianglespointed down for dusk tows, asterisks for night tows, and triangles pointed up for dawn tows). Depths of three light levelsare plotted: 50, 10 and 0.01Ilmol"m-2·s-1. Light levels above 50are clear, those 10-50 are light gray, those 0.01-10 are mediumgray, and those less than 0.01Ilmol"ftl-2·s-1 are dark gray. Lightlevels are based on incident light at the Kodiak airport duringthe sampling periods with an extinction coefficient of 0.16.
lert et al., 1985; Yamashita et al., 1985; Sogardet al., 1987; Davis et al., 1990). Fewer studies haveexamined the vertical distribution offish larvae during crepuscular periods. The present study has shownthat larger larval pollock range deeper during theday than at night and that, at dawn and dusk, theyare present at shallower depths in the water columnthan at midday. We hypothesize that these changesin vertical position allow pollock larvae to extend thelength of their daily feeding period.
In the laboratory, first-feeding pollock larvae couldnot feed at light levels below 0.006 Jlmol'm-2's-1 (Paul,1983"1. Except at night, light levels are brighter thanthose at the depths where we found feeding-stagelarvae. In studies ofbehavioral responses of walleyepollock larvae (4-8 mm SL) to light in the laboratory, Olla and Davis (1990) found reduced activityand orientation in a nonfeeding mode at light levels<0.01 and avoidance of light at levels>13 Jlmol·m-2·s-1. In the dark, larvae migrated upward and remained in the upper part of the cham-
Kendall et al.: Vertical distribution of eggs and larvae of Theragra chalcogramma 553
Literature citedAhlstrom, E. H.
1959. Vertical distribution of pelagic fish eggs andlarvae off California and Baja California. Fish.Bull. 60:107-146.
Blood, D. B., A. C. Matarese, and M. M. Yoklavich.1994. Embryonic development of walleye pollock,
Theragra chaLcogramma, from ShelikofStrait, GulfofAlaska. Fish. Bull. 92:207-222.
Boehlert, G. W., D. M. Gadomski, and B. C. Mundy.1985. Vertical distribution ofichthyoplankton offthe
Oregon Coast in spring and summer months.Fish. Bull. 83:611-621.
Coombs, S. H., R. K. Pipe, and C. E. Mitchell.1981. The vertical distribution of eggs and larvae
of blue whiting (Micromesistius poutassou) andmackerel (Scomber scombrus) in the eastern NorthAtlantic and North Sea. Rapp. P.-v. Raun. Cons.into Explor. Mer 178:188-195.
Davis, T. L. 0., G. P. Jenkins, and J. W. Young.1990. Diel patterns of vertical distribution in lar
vae of southern bluefin Thunnus maccoyii andother tuna in the East Indian Ocean. Mar. Ecol.Prog. Ser. 59:63-74.
Ellertson, B., P. Solemdal, S. Sundby, S. Tilseth, T.Westgard, and V. Oiestad.
1981. Feeding and vertical distribution of cod larvaein relation to availability of prey organisms. Rapp.P.-v. Heun. Cons. into Explor. Mer 178:317-319.
Enright, J. T.1977. Diurnal vertical migration: adaptive significance
and timing. Part 1: Selective advantage: a metabolicmodel. Limnol. Ocean. 22:856-872.
Hardy, A. C.1936. Plankton ecology and the hypothesis of ani
mal exclusion. Proc. Linn. Soc. Lond. 148:64-70.Ingraham, W. J., Jr., R. K. Reed, J. D. Schumacher,
and S. A. Macklin.1991. Circulation variability in the Gulf of Alaska.
EOS, Trans. Am. Geophys. Soc. 74:257-264.Incze, L. S., J. Gray, J. D. Schumacher, A. W.
Kendall Jr., K. M. Bailey, and S. A. Macklin.1987. Fisheries-Oceanography Coordinated Inves
tigations <FOCI> field operations-1986. NOAAData Report ERL PMEL-20, 64 p.
Incze, L. S., P. B. Ortner, and J. D. Schumacher.1990. Microzooplankton, vertical mixing and advec
tion in a larval fish patch. J. Plankton Res.12:365-379.
Kamba,M.1977. Feeding habits and vertical distribution of
walleye pollock, Theragra chaLcogramma (Pallas),in early life stage in Uchiura Bay, Hokkaido. Res.Inst. N. Pac. Fish., Hokkaido Univ., Spec. Vol., p.175-197.
Kendall, A. W., Jr., and N. A. Naplin.1981. Diel-depth distribution of summer ichthy
oplankton in the Middle Atlantic Bight. Fish.Bull. 79:705-726.
Kendall, A. W., Jr., and S. Kim.1989. Buoyancy of walleye pollock (Theragra
chaLcogramma) eggs in relation to water properties and movement in Shelikof Strait, Gulf ofAlaska. In R. J. Beamish and G. A. McFarlane(eds.), Effects of ocean variability on recruitment,and an evaluation of parameters used in stock assessment models, p. 169-180. Can. Spec. Publ.Fish. Aquat. Sci. 108.
Kendall, A. W., Jr., and S. J. Picquelle.1990. Egg and larval distributions of walleye pol
lock Theragra chaLcogramma in Shelikof Strait,Gulf ofAlaska. Fish Bull. 88:133-154.
Kendall, A. W., Jr., M. E. Clarke, M. M. Yoklavich,and G. W. Boehlert.
1987. Distribution, feeding, and growth oflarval walleye pollock, Theragra chaLcogramma, from ShelikofStrait, Gulf ofAlaska. Fish. Bull. 85:499-521.
Lampert, W. H.1989. The adaptive significance of diel vertical mi
gration of zooplankton. Funct. Ecol. 3:21-27.Lasker, R.
1978. The relation between oceanographic conditions and larval anchovy food in the CaliforniaCurrent: identification of factors contributing torecruitment failure. Rapp. P.-v. Raun. Cons. Int.Explor. Mer 173:212-230.
Lawrence, L.A., J. Gray, and J. D. Schumacher.1991. Fisheries-Oceanography Coordinated Inves
tigations field operations-1987. NOAA DataRep. ERL PMEL-28. 61 p.
Lough, R. G., and D. C. Potter.1993. Vertical distribution patterns and diel migra
tions of larval and juvenile haddock MeLanogrammus aegLefinus and Atlantic cod Gadusmorhua on Georges Bank. Fish Bull. 91:281-303.
Maillet, G. L., and D. M. Checkley Jr.1991. Storm-related variation in growth rate of
otoliths of larval Atlantic menhaden Brevoortiatyrannus: a time series analysis of biological andphysical variables and implications for larva growthand mortality. Mar. Ecol. Prog. Ser. 79:1-16.
Munk, P., T. Kiorboe, and V. Christensen.1989. Vertical distribution of herring, CLupea
harengus, larvae in relation to light and preydistribution. Environ. BioI. Fish. 26:87-96.
Neilson, J. D., and R. I. Perry.1990. Diel vertical migrations of marine fishes: an
obligate or facultative process? Adv. Mar. BioI.26:115-168.
Norcross, B. L., and R. F. Shaw.1984. Oceanic and estuarine transport of fish eggs
and larvae: a review. Trans. Am. Fish. Soc.113:153-165.
Olla, B. L., and M. W. Davis.1990. Effects of physical factors on the vertical dis
tribution oflarval walleye pollock Theragra chaLcogramma under controlled laboratory conditions.Mar. Ecol. Prog. Ser. 63:105-112.
554
Paul,A. J.1983. Light, temperature, nauplii concentrations,
and prey capture by first feeding pollock larvae,Theragra chalcogramma. Mar. Ecol. Prog. Ser.13:175-179.
Paul, A. J., K. O. Coyle, and L. Haldorson.1991. Interannual variations in copepod nauplii
prey oflarval fish in anAlaskan Bay. ICES J. Mar.Sci. 48:157-165.
Pritchett, M., and L. Haldorson.1989. Depth distribution and vertical migration of
larval walleye pollock (Theragra chalcogramma). In Proceedings of the internationalsymposium on the biology and management ofwalleye pollock; 14-16 November 1988,Anchorage,AK, p. 173-183. Alaska Sea Grant Rep. 89-1,Univ. Alaska, Fairbanks.
Proctor, P. D.1989. Fisheries-Oceanography Coordinated Inves
tigations-field operations 1988. NOAA DataReport ERL PMEL-25, 69 p.
Rothschild, B. J., and T. R. Osborn.1988. Small-scale turbulence and plankton contact
rates. J. Plankton Res. 10:465--474.Scheaffer, R. L., W. Mendenhall, and L. Ott.
1986. Elementary survey sampling. DuxburyPress, Boston, MA, 324 p.
Schumacher, J. D., and A. W. Kendall Jr.1991. Some interactions between young walleye
pollock and their environment in the western GulfofAlaska. CalCOFI Rep. 32:22--40.
Sclafani, M., C. T. Taggart, and K. R. Thompson.1993. Condition, buoyancy and the distribution of
larval fish: implications for vertical migration andretention. J. Plankton Res. 15:413--435.
Fishery Bulletin 92131. 1994
Smith, W. G., J. D. Sibunka, and A Wells.1978. Diel movements oflarval yellowtail flounder,
Limanda ferruginea, determined from discretedepth sampling. Fish. Bull. 76:167-178.
Sogard, S. M., D. E. Hoss, and J. J. Govoni.1987. Density and depth distribution oflarval Gulf
menhaden, Brevoortia patronus, Atlantic croaker,Micropogonias undulatus, and spot, Leiostomusxanthurus, in the northern Gulf of Mexico. Fish.Bull. 85:601-609.
Sundby, S., and P. Fossum.1990. Feeding conditions of Arcto-Norwegian cod
larvae compared with the Rothschild-Osborn theoryon small-scale turbulence and plankton contactrates. J. Plankton Res. 12:1153-1162.
Weibe, P. D., K. H. Burt, S. H. Boyd, andA. W. Morton.
1976. A multiple opening/closing net and environmental sensing system for zooplankton. J. Mar.Res. 34:313-326.
Wurtsburgh, W. A, and D. Neverman.1988. Post-feeding thermotaxis and daily vertical
migration in a larval fish. Nature 333:846-848.Yamashita, Y., D. Kitagawa, and T. Aoyama.
1985. Diel vertical migration and feeding rhythmof the larvae of the Japanese sand-eel Ammodytespersonatus. Bull. Japan. Soc. Sci. Fish. 51:1-5.
Zeiman, D. A, L. D. Conquest, K. W. FultonBennett, and P. K. Bienfange.
1990. Interannual variability in the physical environment of Auke Bay, Alaska. In D. A. Ziemannand K. W. Fulton-Bennett (eds.l, APPRISE-interannual variability and-fisheries recruitment, p. 99128. The Oceanic Institute, Honolulu, HI.
Copyright © 2022 FDOKUMEN