Cortical activity in vertebrate eggs I: The activation waves
Journal of Great Lakes Research 36 (2010) 328–337
Contents lists available at ScienceDirect
Journal of Great Lakes Research
j ourna l homepage: www.e lsev ie r.com/ locate / jg l r
Density, production, and survival of walleye (Sander vitreus) eggs in the MuskegonRiver, Michigan
Lori N. Ivan a,b,⁎, Edward S. Rutherford b,c, Catherine Riseng d, Jeffrey A. Tyler e
a Department of Forestry and Natural Resources, Purdue University, 195 Marsteller Street, West Lafayette, IN 47907-2061, USAb Institute for Fisheries Research, School of Natural Resources and Environment, University of Michigan, 212 Museum Annex Bldg, 1109 N. University St Ann Arbor, MI 48109-1084, USAc NOAA Great Lakes Environmental Research Laboratory, 4840 S. State Rd, Ann Arbor, MI 48108-9719, USAd School of Natural Resources, University of Michigan, 440 Church Street, Ann Arbor, MI 48109-1040, USAe Fisheries Projections, 307 Old Mountain Rd, Farmington, CT 06032, USA
⁎ Corresponding author. Department of Forestry anUniversity, 195 Marsteller Street, West Lafayette, IN, US
E-mail addresses: [email protected] (L.N. Ivan), ed.r(E.S. Rutherford).
0380-1330/$ – see front matter © 2010 Elsevier B.V. Adoi:10.1016/j.jglr.2010.02.010
a b s t r a c t
a r t i c l e i n f oArticle history:Received 10 July 2009Accepted 11 February 2010
Communicated by John Janssen
Index words:SpawningWalleyeEgg survivalMuskegon RiverGreat Lakes
Walleye (Sander vitreus) is an important sport fish in the Great Lakes that is experiencing low reproductivesuccess after severe population declines starting in the late 1940s. In the Muskegon River, Michigan, naturalreproduction of walleyes remains low and is largely supplemented by stocking. To determine factorsinfluencing walleye reproductive success in the Muskegon River, we estimated walleye egg survival using insitu egg incubators covered with nitex screening (2003–2004) and estimated density and survival offertilized eggs caught on furnace filter traps across different substrate types (2005–2006). We comparedphysical habitat suitability for walleye eggs under high and low flow scenarios. Density of walleye eggs washighest in regions of gravel/cobble substrates. Egg survival was higher in egg incubators (24–49.5%) than onfurnace filter traps (2.0%), suggesting predation is an important source of walleye egg mortality in theMuskegon River. Cold water temperatures that extended developmental stage durations may also be animportant source of egg mortality. The dynamic habitat suitability model predicted low suitability for eggsdue to poor temperature and velocity conditions. Despite low egg survival rates, 40 million to 1 billion eggswere estimated to hatch. The low natural reproduction of walleyes in the Muskegon River is likely due to acombination of low walleye egg survival and failure of walleye larvae to reach their nursery grounds inMuskegon Lake.
d Natural Resources, [email protected]
ll rights reserved.
© 2010 Elsevier B.V. All rights reserved.
Introduction
Walleye (Sander vitreus) is an ecologically and economicallyimportant adfluvial fish species in the Great Lakes. The MuskegonRiver is the second-largest tributary to Lake Michigan and historicallysupported a large population of walleyes, with an estimated 140,100adult spawners in the mid-1950s (Schneider and Leach, 1979; O'Neal,1997). However, by the 1960s walleye populations dwindledthroughout the Great Lakes and dropped to roughly 6000 individualsin the Muskegon River. Overfishing, alewife (Alosa pseudoharengus)predation on larvae, sea lamprey (Petromyzon marinus) predation onadults, and alterations in spawning and nursery habitat and waterquality affecting egg and larvae survival all may have contributed tothis decline.
In the past decade, walleye populations across the Great Lakeshave recovered, largely due to supplemental stocking programs. Thecurrent population of an estimated 38,000 spawning walleye in the
Muskegon River (Hanchin et al., 2007) is still well below historiclevels and is maintained almost entirely through stocking. Naturalreproduction of walleyes in the Muskegon River remains low, despiteevidence in other Great Lakes tributaries of successful naturalreproduction (e.g., Fielder et al., 2007). Recent studies on theMuskegon River revealed that approximately 10% of capturedjuveniles in the fall were naturally spawned fish (personal commu-nication, D. Jude and S. Hensler, University of Michigan).
Factors affecting low natural reproduction of walleyes in theMuskegon River likely occur sometime between spawning and thejuvenile stage. Walleye adults migrate up the Muskegon River in lateMarch, and spawn in early April over a 22-km stretch of river belowCroton Dam (completed in 1907; Fig. 1). Survival rates are high forwalleye eggs collected for rearing in a hatchery, and juveniles stockedinMuskegon Lake survive well (O'Neal, 1997). Walleyes are broadcastspawners, and release their eggs over river substrates (Colby et al.,1979). Spawned eggs may settle in unfavorable substrates (sand,muck, and clay) where they may be buried by sand or mud (Johnson,1961). Although walleye eggs are resistant to fluctuating watertemperatures (Schneider et al., 2002), colder water temperatures asobserved in the Muskegon River increase incubation times (Koenstand Smith, 1976), thereby increasing the likelihood of predation or
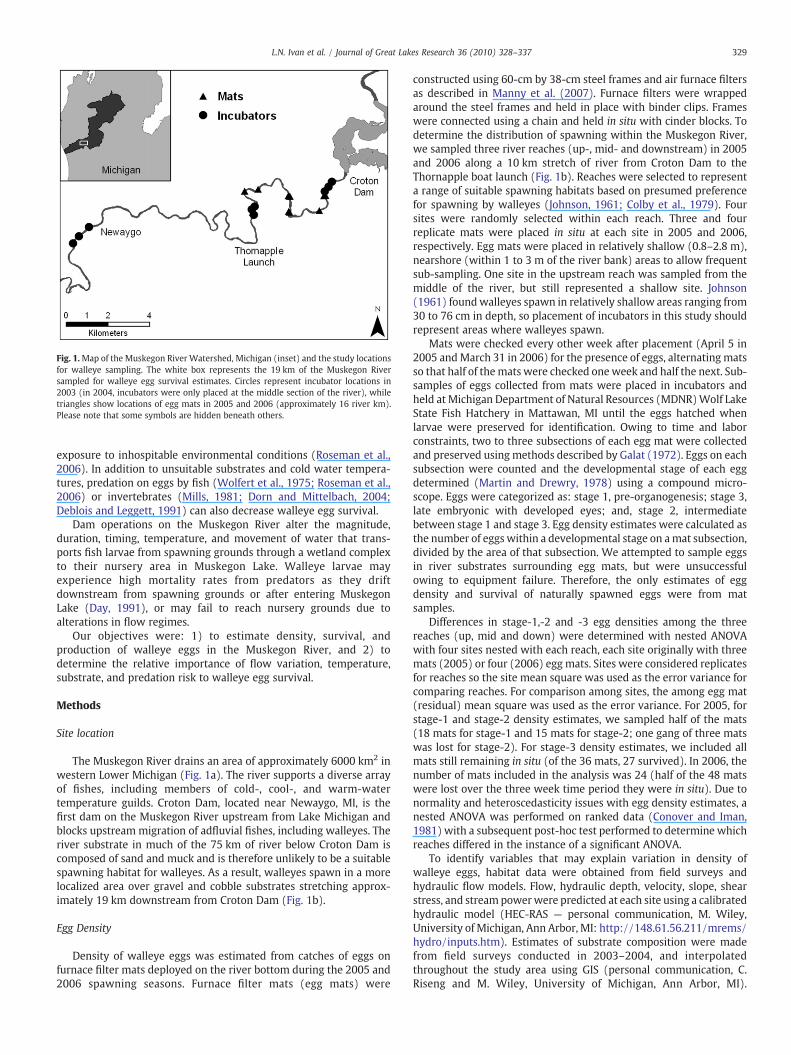
Fig. 1.Map of the Muskegon River Watershed, Michigan (inset) and the study locationsfor walleye sampling. The white box represents the 19 km of the Muskegon Riversampled for walleye egg survival estimates. Circles represent incubator locations in2003 (in 2004, incubators were only placed at the middle section of the river), whiletriangles show locations of egg mats in 2005 and 2006 (approximately 16 river km).Please note that some symbols are hidden beneath others.
329L.N. Ivan et al. / Journal of Great Lakes Research 36 (2010) 328–337
exposure to inhospitable environmental conditions (Roseman et al.,2006). In addition to unsuitable substrates and cold water tempera-tures, predation on eggs by fish (Wolfert et al., 1975; Roseman et al.,2006) or invertebrates (Mills, 1981; Dorn and Mittelbach, 2004;Deblois and Leggett, 1991) can also decrease walleye egg survival.
Dam operations on the Muskegon River alter the magnitude,duration, timing, temperature, and movement of water that trans-ports fish larvae from spawning grounds through a wetland complexto their nursery area in Muskegon Lake. Walleye larvae mayexperience high mortality rates from predators as they driftdownstream from spawning grounds or after entering MuskegonLake (Day, 1991), or may fail to reach nursery grounds due toalterations in flow regimes.
Our objectives were: 1) to estimate density, survival, andproduction of walleye eggs in the Muskegon River, and 2) todetermine the relative importance of flow variation, temperature,substrate, and predation risk to walleye egg survival.
Methods
Site location
The Muskegon River drains an area of approximately 6000 km2 inwestern Lower Michigan (Fig. 1a). The river supports a diverse arrayof fishes, including members of cold-, cool-, and warm-watertemperature guilds. Croton Dam, located near Newaygo, MI, is thefirst dam on the Muskegon River upstream from Lake Michigan andblocks upstream migration of adfluvial fishes, including walleyes. Theriver substrate in much of the 75 km of river below Croton Dam iscomposed of sand and muck and is therefore unlikely to be a suitablespawning habitat for walleyes. As a result, walleyes spawn in a morelocalized area over gravel and cobble substrates stretching approx-imately 19 km downstream from Croton Dam (Fig. 1b).
Egg Density
Density of walleye eggs was estimated from catches of eggs onfurnace filter mats deployed on the river bottom during the 2005 and2006 spawning seasons. Furnace filter mats (egg mats) were
constructed using 60-cm by 38-cm steel frames and air furnace filtersas described in Manny et al. (2007). Furnace filters were wrappedaround the steel frames and held in place with binder clips. Frameswere connected using a chain and held in situ with cinder blocks. Todetermine the distribution of spawning within the Muskegon River,we sampled three river reaches (up-, mid- and downstream) in 2005and 2006 along a 10 km stretch of river from Croton Dam to theThornapple boat launch (Fig. 1b). Reaches were selected to representa range of suitable spawning habitats based on presumed preferencefor spawning by walleyes (Johnson, 1961; Colby et al., 1979). Foursites were randomly selected within each reach. Three and fourreplicate mats were placed in situ at each site in 2005 and 2006,respectively. Egg mats were placed in relatively shallow (0.8–2.8 m),nearshore (within 1 to 3 m of the river bank) areas to allow frequentsub-sampling. One site in the upstream reach was sampled from themiddle of the river, but still represented a shallow site. Johnson(1961) foundwalleyes spawn in relatively shallow areas ranging from30 to 76 cm in depth, so placement of incubators in this study shouldrepresent areas where walleyes spawn.
Mats were checked every other week after placement (April 5 in2005 andMarch 31 in 2006) for the presence of eggs, alternating matsso that half of themats were checked one week and half the next. Sub-samples of eggs collected from mats were placed in incubators andheld at Michigan Department of Natural Resources (MDNR)Wolf LakeState Fish Hatchery in Mattawan, MI until the eggs hatched whenlarvae were preserved for identification. Owing to time and laborconstraints, two to three subsections of each egg mat were collectedand preserved usingmethods described by Galat (1972). Eggs on eachsubsection were counted and the developmental stage of each eggdetermined (Martin and Drewry, 1978) using a compound micro-scope. Eggs were categorized as: stage 1, pre-organogenesis; stage 3,late embryonic with developed eyes; and, stage 2, intermediatebetween stage 1 and stage 3. Egg density estimates were calculated asthe number of eggs within a developmental stage on amat subsection,divided by the area of that subsection. We attempted to sample eggsin river substrates surrounding egg mats, but were unsuccessfulowing to equipment failure. Therefore, the only estimates of eggdensity and survival of naturally spawned eggs were from matsamples.
Differences in stage-1,-2 and -3 egg densities among the threereaches (up, mid and down) were determined with nested ANOVAwith four sites nested with each reach, each site originally with threemats (2005) or four (2006) egg mats. Sites were considered replicatesfor reaches so the site mean square was used as the error variance forcomparing reaches. For comparison among sites, the among egg mat(residual) mean square was used as the error variance. For 2005, forstage-1 and stage-2 density estimates, we sampled half of the mats(18 mats for stage-1 and 15 mats for stage-2; one gang of three matswas lost for stage-2). For stage-3 density estimates, we included allmats still remaining in situ (of the 36 mats, 27 survived). In 2006, thenumber of mats included in the analysis was 24 (half of the 48 matswere lost over the three week time period they were in situ). Due tonormality and heteroscedasticity issues with egg density estimates, anested ANOVA was performed on ranked data (Conover and Iman,1981) with a subsequent post-hoc test performed to determine whichreaches differed in the instance of a significant ANOVA.
To identify variables that may explain variation in density ofwalleye eggs, habitat data were obtained from field surveys andhydraulic flow models. Flow, hydraulic depth, velocity, slope, shearstress, and stream powerwere predicted at each site using a calibratedhydraulic model (HEC-RAS — personal communication, M. Wiley,University of Michigan, Ann Arbor, MI: http://148.61.56.211/mrems/hydro/inputs.htm). Estimates of substrate composition were madefrom field surveys conducted in 2003–2004, and interpolatedthroughout the study area using GIS (personal communication, C.Riseng and M. Wiley, University of Michigan, Ann Arbor, MI).
Table 1Estimation of total egg production by walleye in the Muskegon River in 2003–2006. Tocalculate the total number of eggs produced by spawning walleye in the MuskegonRiver, we used previous estimates of population size (37,851 spawning fish), anestimate of the female portion of the spawning population (38%) and length–frequencydata (Hanchin et al., 2007). To determine the total number of eggs deposited by theentire population, we used size-related fecundity estimates from Eschmeyer (1948).Fecundity estimates were assigned to female size as: b48.3 cm females have 91,897eggs, b58.4 cm females have 220,589 eggs, b66 cm females have 264,373 eggs, andN66 cm females have 366,244 eggs.
Length(cm)
#/Lthcategory
#Fish/Lth categoryfor population
#Female/Lthcategory
#Eggs deposited byfemales (10,000s)
33 1 8 3 2.8535.6 7 57 22 20.038.1 11 90 34 3.1440.6 35 286 109 9.9843.2 48 392 149 1.3745.7 46 376 143 1.3148.3 86 702 267 2.4550.8 272 2221 844 7.7653.3 512 4181 1589 1.4655.9 708 5782 2197 2.0258.4 616 5030 1912 4.2261 565 4614 1753 4.6463.5 511 4173 1586 4.1966 436 3561 1353 4.9668.6 308 2515 956 3.5071.1 243 1984 754 2.7673.7 146 1192 453 1.6676.2 69 564 214 7.8478.7 15 123 47 1.70
330 L.N. Ivan et al. / Journal of Great Lakes Research 36 (2010) 328–337
Spearman correlation tests were run to identify habitat variables thatwere significantly related to egg density.
Egg survival
Twomethods were used to estimate survival of walleye eggs in theMuskegon River. First, in 2003 and 2004 fertilized eggs were placed insitu in covered incubator chambers to estimate survival of eggsexposed to changes in water quality and flow. Second, in 2005 and2006 survival was estimated from changes in density over time ofnaturally spawned eggs collected on egg mats (see above) placed inthe spawning area below Croton Dam.
Egg survival in incubator chambersPlexiglas egg incubators were constructed as described in Manny
et al. (1989). Each chamber consisted of three Plexiglas pieces boltedtogether, with 50 holes drilled into each piece. The holes were 12 mmin diameter and 9 mm in depth with a 5 mm distance between eachhole. Fertilized eggs were placed within the wells of the middlePlexiglas piece, and covered with the top and bottom pieces contain-ing nitex mesh screening (2-mm in 2003, 0.5-mm in 2004 to accountfor possible invertebrate predation in 2003). This designwas desirableas it did not inhibit water flow through the incubator and protectedeggs from abrasion and predation.
Walleye eggs were obtained fromMDNR personnel, who collectedeggs from adult spawners below Croton Damduring peak spawning inlate March or early April. Eggs were fertilized and allowed to water-harden before being placed into incubator wells. In 2003, incubatorswere placed at three reaches (reaches differed from those of egg matsand represented a larger potential spawning area) along the riverwhere walleye spawning occurred (Fig. 1b). Within each reach,incubators were placed in three different substrate types based onsubstrate composition (gravel/cobble, gravel/sand, and sand) aswalleye egg survival is known to vary among substrate types(Johnson, 1961). Replicate (n=3) incubators were placed withineach substrate type, for a total of 27 incubators placed in situ. To serveas controls, two additional incubators were placed in situ near CrotonDam, suspended in water off the river bottom, while anotherincubatorwas placed in a tank at theWolf Lake Hatchery inMattawan,MI. In 2003, due to high water levels, three incubators (one from eachsubstrate type) were lost from two of the reaches leading to anunbalanced design. As with egg mats, incubators were placed inrelatively shallow habitat near the edges of the river. In 2004, 12incubators were placed at only one reach (mid) in gravel, gravel/sand,and sandy substrate types, with two incubators left at the MDNRWolfLake State Fish Hatchery to serve as controls.
To estimate egg survival, incubators were left in situ until just priorto hatch, which was estimated based on accumulated thermal units(ATUs) calculated from a US Geological Survey stream temperaturegage, and an egg development–temperature relationship by Koenstand Smith (1976). Incubators were removed just prior to hatch andegg status was recorded.
Differences in egg survival rates among reaches and substratetypes were tested using a two-way ANOVA in 2003. In 2004, as eggincubators were deployed at only one location, survival was analyzedusing a one-way ANOVA. To compare survival estimates between2003 and 2004, we used only the survival estimates from incubatorslocated at the middle reach for 2003 and all data from the same reachfor 2004 and a subsequent t-test was performed. Data weretransformed with an arcsine square root function to meet assump-tions of normality.
As with density estimates, egg survival was related to habitatvariables obtained from HEC-RAS and GIS models. Spearmancorrelation tests were conducted to determine if relationships existedbetween observed egg survival and habitat variables (includingpercent large substrates (gravel, cobble, and boulder), average
velocity, hydraulic depth, slope, flow, stream power, and shear stress)for 2003 only as data was limited in 2004. All statistical tests wereconducted using SPSS version 11.5.
Egg survival on egg matsSurvival of walleye eggs on egg mats was estimated from egg
density on mats (Ds, #/m2 of stage 2 (2003) or stage 3 (2004) eggs),the area of habitat available for spawning (A, m2), and the initialnumber of eggs deposited (N0) as
Segg = DsTA=N0: ð1Þ
Viable spawning area was determined using a GIS map of habitat(personal communication, M. Wiley, University of Michigan, AnnArbor, MI) for the portion of river included in this study, orapproximately 10 km of river. We assumed that the viable spawningarea (A) included river habitat with at least 25% gravel. Survivalestimates were calculated for each section of river (upper, mid, andlower) assuming all eggs from spawning fishes were deposited ineach reach to obtain a range of survival estimates. The initial numberof eggs (N0) was calculated using the estimated number of walleyefemales in the spawning run (Hanchin et al., 2007), walleye length–frequency data from previous studies of theMuskegon River (Hanchinet al., 2007), a walleye length-based fecundity relationship fromEschmeyer (1948), and an assumed fertilization rate of 70%, a valuewithin the range of fertility estimates of walleye spawning on reefs inWestern Lake Erie (Roseman et al., 1996; see Table 1 for more detailson initial number of egg calculations).
Comparison among yearsEgg survival estimates and number of fish larvae expected to hatch
were qualitatively compared among years and methods. First, eggsurvival rate was standardized for all years for the period fromspawning to just prior to hatch. In 2003 and 2004, survival rates wereestimated directly from changes in numbers of live eggs surviving inincubators from spawning to just prior to hatch. In 2005 and 2006, eggsurvival rates were calculated using Eq. (1). These survival rates were
331L.N. Ivan et al. / Journal of Great Lakes Research 36 (2010) 328–337
expressed in terms of instantaneous daily mortality rate (Z, whereSegg=exp−Z⁎d) and number of days (d) from spawning to averagedensity of stage-2 or stage-3 eggs. The egg development period fromdeposition through hatch in both incubators and egg mats wascalculated using a temperature-development time relationshipreported by Rose et al. (1999), and known temperatures measuredat Croton Dam by a USGS gage. To standardize survival estimatesamong years, we used the equation
S = e−ZTt ð2Þ
where S is the standardized survival based on estimated dailyinstantaneous mortality rate (Z) and the total developmental time(t, days). Second, to determine the number of walleye larvae expectedto hatch in each year, the estimated number of fertilized walleye eggs(N0) was multiplied by the standardized egg survival rate.
Egg production
Two methods were used to calculate the initial number of eggsdeposited. First, egg productionwas estimated fromnumbers ofwalleyespawners, their length–frequency distributions, and size-based relativefecundities. Second, egg production was back-calculated from the 2005stage-1 egg density (De) estimates, using viable spawning area in theriver (A), the estimate of daily mortality rate (Zd−1) from stage-1through stage-3, and number of days from spawning to stage-1 (tsp) as
N0 = DeTA= exp−ZTtsp� �
: ð3Þ
Dynamic physical habitat model of walleye weighted usable area
We compared the results of our empirical study to estimates ofavailable suitable habitat based on weighted usable area (WUA)analysis to evaluate the relative importance of physical habitat factorsin influencing habitat suitability for walleye eggs. The WUA analysisperformed here differs from that done in most cases because wecompute WUA for the river segments analyzed on a very fine spatialgrid that changes on a daily basis, thus providing a greater spatial andtemporal resolution to the analysis. We refer to our analysis as thedynamic weighted usable area (DWUA).
Physical model of the riverFor our DWUA analysis we selected an approximately 40 km
section of the Muskegon River immediately downstream of CrotonDam. The river section was further divided into four segments forhydrological analysis using the HEC-RAS model. The HEC-RAS modelitself divided each segment into cells for hydrological analysis andproduced the spatial resolution used for the DWUA analysis (Table 2).From the HEC-RAS model outputs we used the depth (m) and water
Table 2Dimensions of the river segments included in the DWUA analysis. We report thenumber of cross sections and width of cells in each cross section and not the number ofcells in each cross section. The number of cells per cross section changes on a daily basisin the HEC-RAS model based on river depth. RS = river segment, MRCSL = mean rivercross section length (m), VRCSL = variance river cross section length, TLS = totallength of segment (m), #CS = number of cross sections in a segment, MW = meanwidth (m) of cells in a river segment, MeW = median width (m) of cells in a riversegment.
RS MRCSL VRCSL TLS #CS MW MeW
18.1 41.0 128.7 3363 82 4.0 1.6918.2 25.4 23.5 12,985 510 4.0 1.8518.3 24.4 11.4 5689 233 4.1 1.6918.4 27.6 9.7 18,043 653 6.6 1.95
velocity (m/s) of the water in each cell of the river segment in outDWUA estimation.
For substrate in the river, we used data collected by colleagues (M.Wiley and C. Riseng, University of Michigan) that were entered into aGIS model of the river. The distribution and relative % composition ofsubstrate in the lower river was estimated andmapped through visualsurveys of the entire river corridor from Croton Dam to the mouth ofthe river. Field surveys were conducted using a depth finder, anunderwater camera, and field maps, and were corroborated usingsample data of benthic substrates. Percent composition of substratesize and type within local habitats were then digitized into a GISframework. We then paired the substrate data to the HEC-RAS grid ofthe river segments so that each cell of the river model included waterdepth, water velocity and substrate characteristics that could be usedto determine cell-by-cell habitat preferences for walleye. Watertemperature for the DWUA analysis came from a temperature model(personal communication, M. Wiley and S. Cheng, University ofMichigan, Ann Arbor, MI). This model estimates stream temperaturesbased on air temperature, upstreamwater temperature, groundwaterinputs, and estimates of heat exchange, andwas specifically calibratedfor the Muskegon River. In this analysis we assumed that watertemperature was uniform among all cells in the river section.
For the DWUA analysis we computed walleye egg preferences forhabitat in each cell based on habitat suitability indices (HSI)developed by the US Fish and Wildlife Service for walleye eggs. HSIsuse known information on habitat preferences for a particularspecies-lifestage combination, and information on environmentalvariables (depth, velocity, temperature, and substrate), to predict theamount of suitable habitat available in an aquatic environment forthat life stage (USFWS, 1980). Preference values range from 0.0 to 1.0for each characteristic. To compute the WUA for a cell we multipliedthe preference value (p) assigned for each environmental character-istic in the cell times the area of the cell:
WUA = Pwater depthT Pwater velocityT PsubstrateT Ptemperature
� �Tarea: ð4Þ
The DWUA analysis computes the WUA value for each cell forevery day during the egg stage (April 1–30; Days 92–120). We thenreported the average total WUA during this time period, which is thesum of theWUA values in all of the cells in the river segment averagedamong the days of the period, as well as the average suitability of theMuskegon River for walleye egg rearing.
Results
Egg density
Results from the egg mat study revealed strong, localizedspawning of walleyes within the Muskegon River, with most walleyesspawning within 1–2 km of Croton Dam (Table 3), an area with a highpercentage of cobble/gravel substrates. Furthermore, walleyesspawned over a relatively short period of time, with most spawningoccurring in the first two weeks in April as evidenced by the smalloverlap of eggs of different developmental stages on mats (Table 3).
Egg densities varied among years, reaches, and egg developmentstage. In 2005, stage-1 egg densities averaged 739.3 m−2 (95% C.I.=123.3–4435.3 m−2). Average stage-2 egg density was 361.0 m−2 (95%C. I.=34.6–3766.1 m−2), while stage-3 egg density averaged 16.7 m−2
(95% C.I.=4.4–63.1 m−2; Table 3). The variance to mean ratios of eggdensitieswere 78,380, 30,147, and 2804 for stage-1, 2 and3, respectively,suggesting highly patchy egg distributions. In 2006, the average stage-3eggdensitywas173.3 m−2 (95%C.I.=26.8–1121.0 m−2), approximately10 times greater than values from 2005, and also patchily distributed(Var/mean=24,657).
Table 3Estimated density of walleye eggs (no./m2) in 2005 and 2006 in the Muskegon River bydevelopmental stage (1, 2, 3) and area of river (downstream, midstream, upstream) onsampling dates in April 2005 and 2006. See Methods for definition of developmentalstages.
Year/day
Downstream Midstream Upstream
Egg stage Egg stage Egg stage
1 2 3 1 2 3 1 2 3
200512 Apr 780 0 0 170 0 0 71,907 0 020 Apr 0 125 0 1161 12,646 0 0 23,976 028 Apr 0 0 427 0 0 1878 0 0 23685 May 0 0 0 0 0 66 0 0 285
200620 Apr 0 0 937 0 0 12,287 0 0 6393
332 L.N. Ivan et al. / Journal of Great Lakes Research 36 (2010) 328–337
The nested ANOVA for stage-1 (April 12) walleye egg densities in2005, as measured on 18 mats, differed significantly among the threereaches (Table 3; F (2,3)=35.3, p=0.008) but did not vary significantlyamong siteswithin a reach (F (3,12)=0.46, p=0.7). Egg densitiesweregreater at the upstream reach than at the down- (Tukey test, p=0.004)or midstream reaches (Tukey test, pb0.001). However, there was nodetectable difference in stage-2 (F (2,2)=0.402, p=0.7; one df for theamong sites mean square (used as the error mean square) was lost dueto three lost mats at one site (15 of 18mats survived)). Nor was there adetectable difference for stage-3 (F (2,6)=0.391, p=0.7; three df forthe among sites mean square (used as the error mean square) was lostdue to three lost mats at each of three sites (27 of 36 mats survived)).Densities were significantly different among sites within reaches forboth stage-2 (F (2,10)=9.74, p=0.004) and stage-3 (F (6,18)=3.96,p=0.011) eggs.
In 2006 a total of 24 mats (of the original 48) were lost (two matswere lost from each of four sites and four mats lost from each of foursites). While densities were greatest at the midstream reach, nosignificant differences between reaches were detected (F (2,5)=2.75,p=0.16) on the 24 mats sampled. However, egg densities did varysignificantly among sites within reaches (F (5, 16)=3.747, p=0.019).
Correlations between habitat characteristics and walleye eggdensity varied between years. In 2005, stage-1 egg density waspositively correlated with large substrates (gravel, cobble, andboulder, Table 4). Stage-2 and stage-3 egg densities were notsignificantly correlated with any habitat hydrologic variables. In2006, stage-3 egg density was negatively correlated with dischargeand positively correlated with large substrates (Table 5). Egg matslocated upstream near Croton Dam were placed in substrates with ahigh percentage of gravel, while egg mats located downstream (withthe exception of egg mat 1) were placed in mostly sand substrates.Velocity, shear stress, and % composition of large substrates weregreatest at sites in the upstream reach, while stream power wasgreatest downstream (Table 6).
Table 4Spearman correlations between walleye egg densities (stage-1, #m−2) and hydrologic variabL. sub. (large substrates), Sl (slope), Flow (m3/s), Vel. (velocity, m/s), De (depth, m), Sh. (sh30 and 33 mats were included in the analysis. It should be noted that 1 false positive is exp
Var. S1 L. sub. Sl. Flow
L. sub. 0.498 (0.003)Sl. 0.086 0.109Flow 0.274 0.107 0.671 (b0.001)Vel. 0.353 0.258 0.855 (b0.001) 0.89 (De. 0.339 0.101 0.252 0.829 (Sh. 0.241 0.063 0.745 (b0.001) 0.988 (Po. 0.241 0.031 0.769 (b0.001) 0.976 (
Egg survival
Incubator studiesEgg survival varied more between years than among substrate
types. In 2003, there was no significant difference in egg survivalamong reaches (F (2,12)=1.703, p=0.2), substrate types (F (2,12)=2.764, p=0.1), or the interaction between reach and substrate(F (4,12)=2.204, p=0.1) for the 21 incubators sampled. Egg survivalin all incubators ranged from 2 to 42%, with an average of 24.3% (95%C. I.=19.3–30.0%). In 2004, there was a significant difference in eggsurvival among substrate types (Fig. 2; F (2, 9)=6.278, p=0.02) forthe 12 incubators sampled. Incubators placed in sand substrates hadhigher survival than incubators in gravel (Tukey test, p=0.019)while there were no significant differences between egg survival inincubators placed in gravel/sand substrates and egg survival inincubators placed in gravel or sand substrates (pN0.05). Consideringonly data from the middle reach sampled in both years, egg survivalwas higher (t (19)=−4.482, pb0.001) in 2004 than in 2003. In2004, egg survival ranged from 14 to 72%, and averaged 49.5% (95%C.I.=40.2–58.8%) as compared to 23.3% (95% C.I.=18.3–28.7%) in2003.
Survival of eggs in incubators suspended off the river bottom orplaced in controlled hatchery conditions was similar to, or higher thanegg survival in incubators placed on the river bottom. In 2003, eggsurvival in incubators suspended off the river bottom below CrotonDam (avg. S=31%) was similar to survival (avg.=24.3%.) inincubators on the river bottom, while egg survival in an incubatorunder controlled temperatures and flow conditions at Wolf Lake StateFish Hatchery was higher still (S=54%). In 2004, survival of eggs atWolf Lake Hatchery in 2004 was higher (avg.=68.5%) than on theMuskegon River bottom (avg.=49.5%). The average temperature atWolf Lake State Fish Hatchery was 11 °C in both years, several degreeswarmer than the average temperatures experienced by walleye eggsin the Muskegon River in either year (2003 avg. temperature=5.4 °C;2004 avg. temperature=7.8 °C; Table 7).
No significant correlations were observed between survival andhabitat variables in 2003 (Table 8). The highest percent gravel wasfound in the up- and midstream reaches (Table 9) where velocity,shear, and power were also high.
Egg mat surveysEgg survival estimates were higher in 2005 than in 2006 and
varied depending on the assumed number of female spawners and thereach in the river where eggs were assumed to be deposited. In 2005,egg survival averaged 6.8% (range=b0.1 to 18.4%), and was highestin the upper river where more females are assumed to spawn basedon density estimates frommats. In 2006, survival patterns of egg matswere similar to 2005 but were lower (range S=0.3 to 4.9%, averageS=3.2%), which is not unexpected due to the differences in egg stagessampled from mats (stage-2 in 2005 versus stage-3 in 2006).
les from 2005 egg mat studies. Variables are as follows: S1 (stage-1 egg density, #m−2),ear stress), and Po. (power). p-values are shown in parentheses when pb0.05. Betweenected due to the number of comparisons made (28 comparisons).
Vel. De. Sh.
b0.001)b0.001) 0.549 (0.002)b0.001) 0.915 (b0.001) 0.78 (b0.001)b0.001) 0.939 (b0.001) 0.707 (0.001) 0.988 (b0.001)
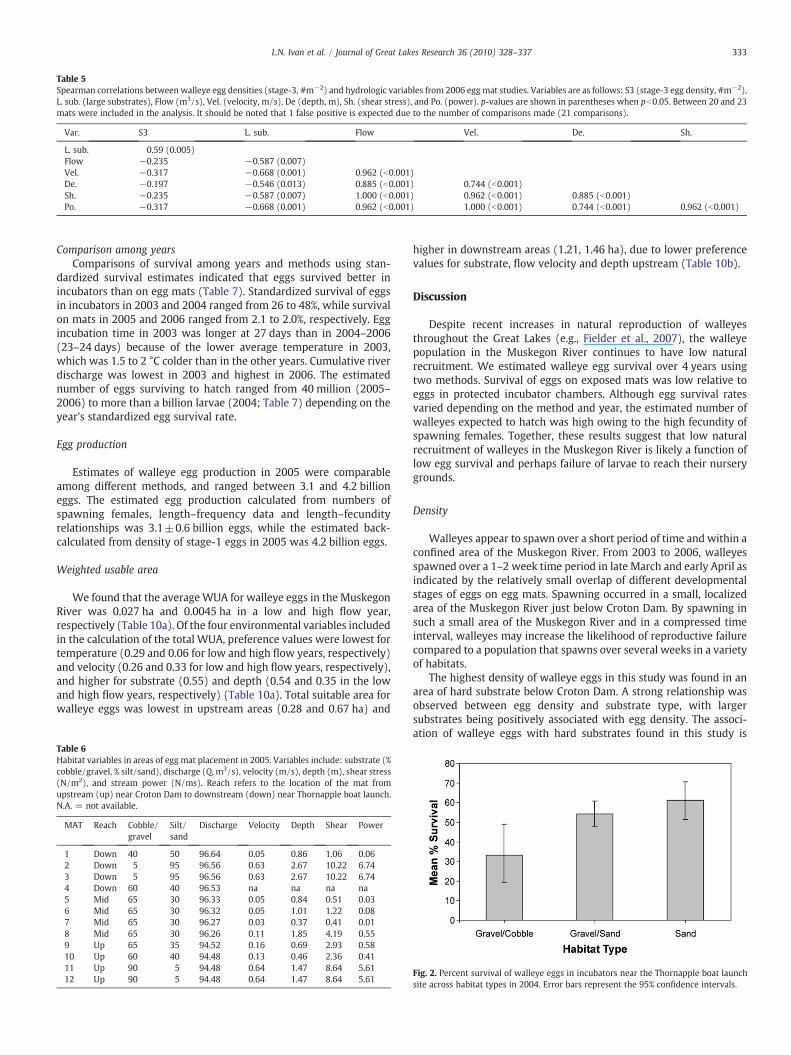
Table 5Spearman correlations between walleye egg densities (stage-3, #m−2) and hydrologic variables from 2006 egg mat studies. Variables are as follows: S3 (stage-3 egg density, #m−2),L. sub. (large substrates), Flow (m3/s), Vel. (velocity, m/s), De (depth, m), Sh. (shear stress), and Po. (power). p-values are shown in parentheses when pb0.05. Between 20 and 23mats were included in the analysis. It should be noted that 1 false positive is expected due to the number of comparisons made (21 comparisons).
Var. S3 L. sub. Flow Vel. De. Sh.
L. sub. 0.59 (0.005)Flow −0.235 −0.587 (0.007)Vel. −0.317 −0.668 (0.001) 0.962 (b0.001)De. −0.197 −0.546 (0.013) 0.885 (b0.001) 0.744 (b0.001)Sh. −0.235 −0.587 (0.007) 1.000 (b0.001) 0.962 (b0.001) 0.885 (b0.001)Po. −0.317 −0.668 (0.001) 0.962 (b0.001) 1.000 (b0.001) 0.744 (b0.001) 0.962 (b0.001)
333L.N. Ivan et al. / Journal of Great Lakes Research 36 (2010) 328–337
Comparison among yearsComparisons of survival among years and methods using stan-
dardized survival estimates indicated that eggs survived better inincubators than on egg mats (Table 7). Standardized survival of eggsin incubators in 2003 and 2004 ranged from 26 to 48%, while survivalon mats in 2005 and 2006 ranged from 2.1 to 2.0%, respectively. Eggincubation time in 2003 was longer at 27 days than in 2004–2006(23–24 days) because of the lower average temperature in 2003,which was 1.5 to 2 °C colder than in the other years. Cumulative riverdischarge was lowest in 2003 and highest in 2006. The estimatednumber of eggs surviving to hatch ranged from 40 million (2005–2006) to more than a billion larvae (2004; Table 7) depending on theyear's standardized egg survival rate.
Egg production
Estimates of walleye egg production in 2005 were comparableamong different methods, and ranged between 3.1 and 4.2 billioneggs. The estimated egg production calculated from numbers ofspawning females, length–frequency data and length–fecundityrelationships was 3.1±0.6 billion eggs, while the estimated back-calculated from density of stage-1 eggs in 2005 was 4.2 billion eggs.
Weighted usable area
We found that the averageWUA for walleye eggs in the MuskegonRiver was 0.027 ha and 0.0045 ha in a low and high flow year,respectively (Table 10a). Of the four environmental variables includedin the calculation of the total WUA, preference values were lowest fortemperature (0.29 and 0.06 for low and high flow years, respectively)and velocity (0.26 and 0.33 for low and high flow years, respectively),and higher for substrate (0.55) and depth (0.54 and 0.35 in the lowand high flow years, respectively) (Table 10a). Total suitable area forwalleye eggs was lowest in upstream areas (0.28 and 0.67 ha) and
Table 6Habitat variables in areas of egg mat placement in 2005. Variables include: substrate (%cobble/gravel, % silt/sand), discharge (Q, m3/s), velocity (m/s), depth (m), shear stress(N/m2), and stream power (N/ms). Reach refers to the location of the mat fromupstream (up) near Croton Dam to downstream (down) near Thornapple boat launch.N.A. = not available.
MAT Reach Cobble/gravel
Silt/sand
Discharge Velocity Depth Shear Power
1 Down 40 50 96.64 0.05 0.86 1.06 0.062 Down 5 95 96.56 0.63 2.67 10.22 6.743 Down 5 95 96.56 0.63 2.67 10.22 6.744 Down 60 40 96.53 na na na na5 Mid 65 30 96.33 0.05 0.84 0.51 0.036 Mid 65 30 96.32 0.05 1.01 1.22 0.087 Mid 65 30 96.27 0.03 0.37 0.41 0.018 Mid 65 30 96.26 0.11 1.85 4.19 0.559 Up 65 35 94.52 0.16 0.69 2.93 0.5810 Up 60 40 94.48 0.13 0.46 2.36 0.4111 Up 90 5 94.48 0.64 1.47 8.64 5.6112 Up 90 5 94.48 0.64 1.47 8.64 5.61
higher in downstream areas (1.21, 1.46 ha), due to lower preferencevalues for substrate, flow velocity and depth upstream (Table 10b).
Discussion
Despite recent increases in natural reproduction of walleyesthroughout the Great Lakes (e.g., Fielder et al., 2007), the walleyepopulation in the Muskegon River continues to have low naturalrecruitment. We estimated walleye egg survival over 4 years usingtwo methods. Survival of eggs on exposed mats was low relative toeggs in protected incubator chambers. Although egg survival ratesvaried depending on the method and year, the estimated number ofwalleyes expected to hatch was high owing to the high fecundity ofspawning females. Together, these results suggest that low naturalrecruitment of walleyes in the Muskegon River is likely a function oflow egg survival and perhaps failure of larvae to reach their nurserygrounds.
Density
Walleyes appear to spawn over a short period of time and within aconfined area of the Muskegon River. From 2003 to 2006, walleyesspawned over a 1–2 week time period in late March and early April asindicated by the relatively small overlap of different developmentalstages of eggs on egg mats. Spawning occurred in a small, localizedarea of the Muskegon River just below Croton Dam. By spawning insuch a small area of the Muskegon River and in a compressed timeinterval, walleyes may increase the likelihood of reproductive failurecompared to a population that spawns over several weeks in a varietyof habitats.
The highest density of walleye eggs in this study was found in anarea of hard substrate below Croton Dam. A strong relationship wasobserved between egg density and substrate type, with largersubstrates being positively associated with egg density. The associ-ation of walleye eggs with hard substrates found in this study is
Fig. 2. Percent survival of walleye eggs in incubators near the Thornapple boat launchsite across habitat types in 2004. Error bars represent the 95% confidence intervals.
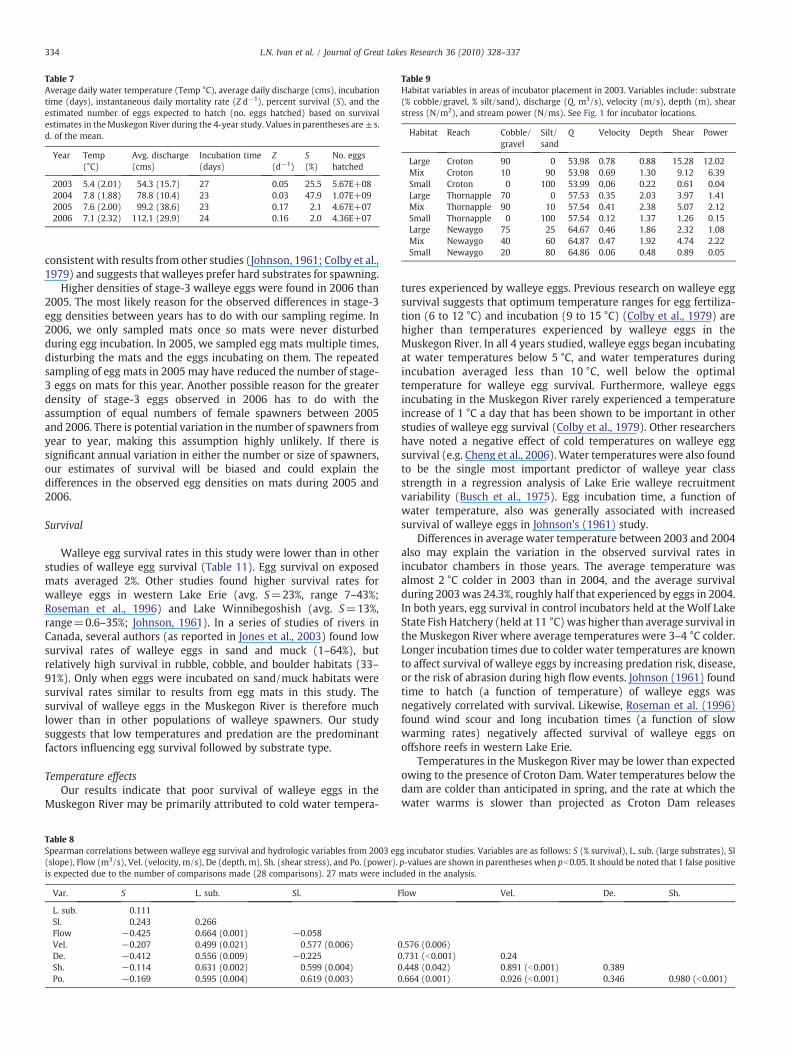
Table 7Average daily water temperature (Temp °C), average daily discharge (cms), incubationtime (days), instantaneous daily mortality rate (Z d−1), percent survival (S), and theestimated number of eggs expected to hatch (no. eggs hatched) based on survivalestimates in theMuskegon River during the 4-year study. Values in parentheses are±s.d. of the mean.
Year Temp(°C)
Avg. discharge(cms)
Incubation time(days)
Z(d−1)
S(%)
No. eggshatched
2003 5.4 (2.01) 54.3 (15.7) 27 0.05 25.5 5.67E+082004 7.8 (1.88) 78.8 (10.4) 23 0.03 47.9 1.07E+092005 7.6 (2.00) 99.2 (38.6) 23 0.17 2.1 4.67E+072006 7.1 (2.32) 112.1 (29.9) 24 0.16 2.0 4.36E+07
Table 9Habitat variables in areas of incubator placement in 2003. Variables include: substrate(% cobble/gravel, % silt/sand), discharge (Q, m3/s), velocity (m/s), depth (m), shearstress (N/m2), and stream power (N/ms). See Fig. 1 for incubator locations.
Habitat Reach Cobble/gravel
Silt/sand
Q Velocity Depth Shear Power
Large Croton 90 0 53.98 0.78 0.88 15.28 12.02Mix Croton 10 90 53.98 0.69 1.30 9.12 6.39Small Croton 0 100 53.99 0.06 0.22 0.61 0.04Large Thornapple 70 0 57.53 0.35 2.03 3.97 1.41Mix Thornapple 90 10 57.54 0.41 2.38 5.07 2.12Small Thornapple 0 100 57.54 0.12 1.37 1.26 0.15Large Newaygo 75 25 64.67 0.46 1.86 2.32 1.08Mix Newaygo 40 60 64.87 0.47 1.92 4.74 2.22Small Newaygo 20 80 64.86 0.06 0.48 0.89 0.05
334 L.N. Ivan et al. / Journal of Great Lakes Research 36 (2010) 328–337
consistent with results from other studies (Johnson, 1961; Colby et al.,1979) and suggests that walleyes prefer hard substrates for spawning.
Higher densities of stage-3 walleye eggs were found in 2006 than2005. The most likely reason for the observed differences in stage-3egg densities between years has to do with our sampling regime. In2006, we only sampled mats once so mats were never disturbedduring egg incubation. In 2005, we sampled egg mats multiple times,disturbing the mats and the eggs incubating on them. The repeatedsampling of egg mats in 2005 may have reduced the number of stage-3 eggs on mats for this year. Another possible reason for the greaterdensity of stage-3 eggs observed in 2006 has to do with theassumption of equal numbers of female spawners between 2005and 2006. There is potential variation in the number of spawners fromyear to year, making this assumption highly unlikely. If there issignificant annual variation in either the number or size of spawners,our estimates of survival will be biased and could explain thedifferences in the observed egg densities on mats during 2005 and2006.
Survival
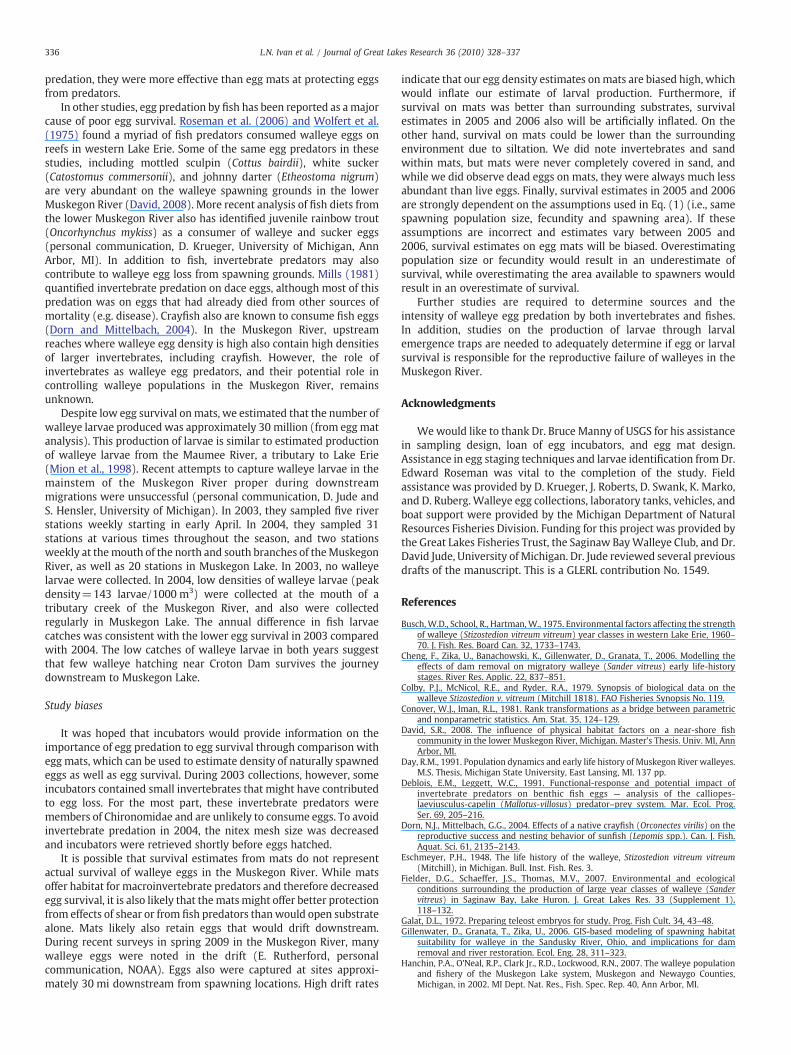
Walleye egg survival rates in this study were lower than in otherstudies of walleye egg survival (Table 11). Egg survival on exposedmats averaged 2%. Other studies found higher survival rates forwalleye eggs in western Lake Erie (avg. S=23%, range 7–43%;Roseman et al., 1996) and Lake Winnibegoshish (avg. S=13%,range=0.6–35%; Johnson, 1961). In a series of studies of rivers inCanada, several authors (as reported in Jones et al., 2003) found lowsurvival rates of walleye eggs in sand and muck (1–64%), butrelatively high survival in rubble, cobble, and boulder habitats (33–91%). Only when eggs were incubated on sand/muck habitats weresurvival rates similar to results from egg mats in this study. Thesurvival of walleye eggs in the Muskegon River is therefore muchlower than in other populations of walleye spawners. Our studysuggests that low temperatures and predation are the predominantfactors influencing egg survival followed by substrate type.
Temperature effectsOur results indicate that poor survival of walleye eggs in the
Muskegon River may be primarily attributed to cold water tempera-
Table 8Spearman correlations between walleye egg survival and hydrologic variables from 2003 eg(slope), Flow (m3/s), Vel. (velocity, m/s), De (depth, m), Sh. (shear stress), and Po. (power).is expected due to the number of comparisons made (28 comparisons). 27 mats were inclu
Var. S L. sub. Sl. F
L. sub. 0.111Sl. 0.243 0.266Flow −0.425 0.664 (0.001) −0.058Vel. −0.207 0.499 (0.021) 0.577 (0.006) 0De. −0.412 0.556 (0.009) −0.225 0Sh. −0.114 0.631 (0.002) 0.599 (0.004) 0Po. −0.169 0.595 (0.004) 0.619 (0.003) 0
tures experienced by walleye eggs. Previous research on walleye eggsurvival suggests that optimum temperature ranges for egg fertiliza-tion (6 to 12 °C) and incubation (9 to 15 °C) (Colby et al., 1979) arehigher than temperatures experienced by walleye eggs in theMuskegon River. In all 4 years studied, walleye eggs began incubatingat water temperatures below 5 °C, and water temperatures duringincubation averaged less than 10 °C, well below the optimaltemperature for walleye egg survival. Furthermore, walleye eggsincubating in the Muskegon River rarely experienced a temperatureincrease of 1 °C a day that has been shown to be important in otherstudies of walleye egg survival (Colby et al., 1979). Other researchershave noted a negative effect of cold temperatures on walleye eggsurvival (e.g. Cheng et al., 2006). Water temperatures were also foundto be the single most important predictor of walleye year classstrength in a regression analysis of Lake Erie walleye recruitmentvariability (Busch et al., 1975). Egg incubation time, a function ofwater temperature, also was generally associated with increasedsurvival of walleye eggs in Johnson's (1961) study.
Differences in average water temperature between 2003 and 2004also may explain the variation in the observed survival rates inincubator chambers in those years. The average temperature wasalmost 2 °C colder in 2003 than in 2004, and the average survivalduring 2003 was 24.3%, roughly half that experienced by eggs in 2004.In both years, egg survival in control incubators held at the Wolf LakeState Fish Hatchery (held at 11 °C) was higher than average survival inthe Muskegon River where average temperatures were 3–4 °C colder.Longer incubation times due to colder water temperatures are knownto affect survival of walleye eggs by increasing predation risk, disease,or the risk of abrasion during high flow events. Johnson (1961) foundtime to hatch (a function of temperature) of walleye eggs wasnegatively correlated with survival. Likewise, Roseman et al. (1996)found wind scour and long incubation times (a function of slowwarming rates) negatively affected survival of walleye eggs onoffshore reefs in western Lake Erie.
Temperatures in the Muskegon River may be lower than expectedowing to the presence of Croton Dam. Water temperatures below thedam are colder than anticipated in spring, and the rate at which thewater warms is slower than projected as Croton Dam releases
g incubator studies. Variables are as follows: S (% survival), L. sub. (large substrates), Slp-values are shown in parentheses when pb0.05. It should be noted that 1 false positiveded in the analysis.
low Vel. De. Sh.
.576 (0.006)
.731 (b0.001) 0.24
.448 (0.042) 0.891 (b0.001) 0.389
.664 (0.001) 0.926 (b0.001) 0.346 0.980 (b0.001)
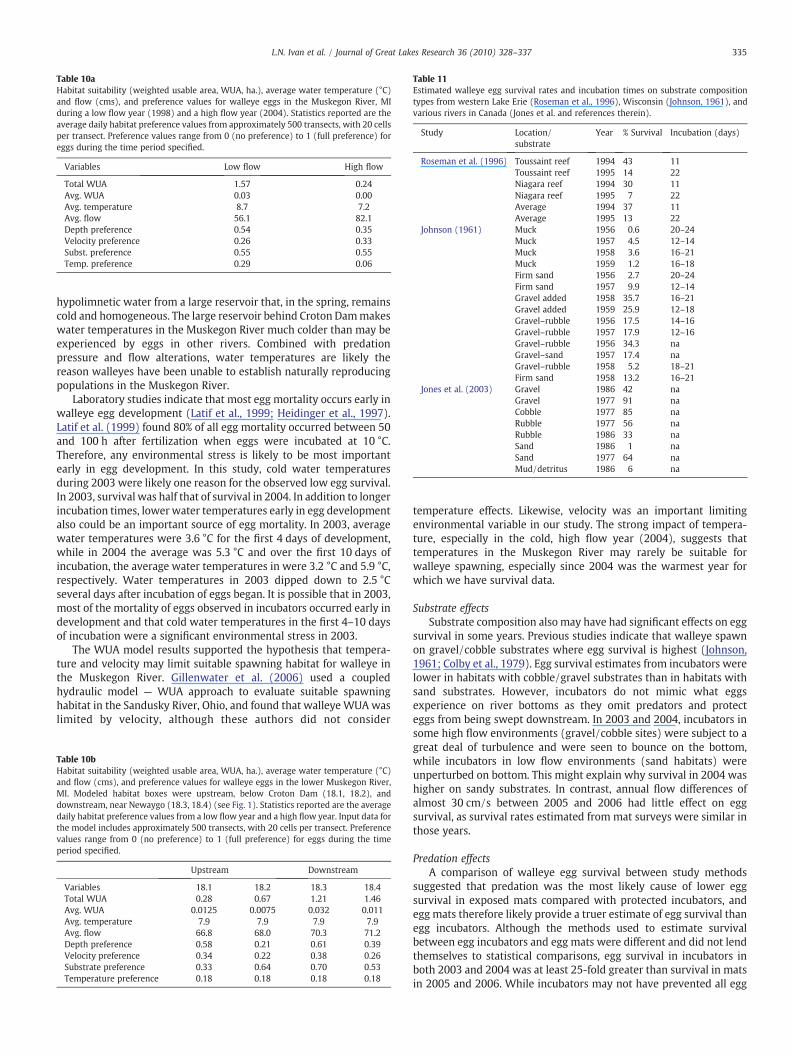
Table 10aHabitat suitability (weighted usable area, WUA, ha.), average water temperature (°C)and flow (cms), and preference values for walleye eggs in the Muskegon River, MIduring a low flow year (1998) and a high flow year (2004). Statistics reported are theaverage daily habitat preference values from approximately 500 transects, with 20 cellsper transect. Preference values range from 0 (no preference) to 1 (full preference) foreggs during the time period specified.
Variables Low flow High flow
Total WUA 1.57 0.24Avg. WUA 0.03 0.00Avg. temperature 8.7 7.2Avg. flow 56.1 82.1Depth preference 0.54 0.35Velocity preference 0.26 0.33Subst. preference 0.55 0.55Temp. preference 0.29 0.06
Table 11Estimated walleye egg survival rates and incubation times on substrate compositiontypes from western Lake Erie (Roseman et al., 1996), Wisconsin (Johnson, 1961), andvarious rivers in Canada (Jones et al. and references therein).
Study Location/substrate
Year % Survival Incubation (days)
Roseman et al. (1996) Toussaint reef 1994 43 11Toussaint reef 1995 14 22Niagara reef 1994 30 11Niagara reef 1995 7 22Average 1994 37 11Average 1995 13 22
Johnson (1961) Muck 1956 0.6 20–24Muck 1957 4.5 12–14Muck 1958 3.6 16–21Muck 1959 1.2 16–18Firm sand 1956 2.7 20–24Firm sand 1957 9.9 12–14Gravel added 1958 35.7 16–21Gravel added 1959 25.9 12–18Gravel–rubble 1956 17.5 14–16Gravel–rubble 1957 17.9 12–16Gravel–rubble 1956 34.3 naGravel–sand 1957 17.4 naGravel–rubble 1958 5.2 18–21Firm sand 1958 13.2 16–21
Jones et al. (2003) Gravel 1986 42 naGravel 1977 91 naCobble 1977 85 naRubble 1977 56 naRubble 1986 33 naSand 1986 1 naSand 1977 64 naMud/detritus 1986 6 na
335L.N. Ivan et al. / Journal of Great Lakes Research 36 (2010) 328–337
hypolimnetic water from a large reservoir that, in the spring, remainscold and homogeneous. The large reservoir behind Croton Dammakeswater temperatures in the Muskegon River much colder than may beexperienced by eggs in other rivers. Combined with predationpressure and flow alterations, water temperatures are likely thereason walleyes have been unable to establish naturally reproducingpopulations in the Muskegon River.
Laboratory studies indicate that most egg mortality occurs early inwalleye egg development (Latif et al., 1999; Heidinger et al., 1997).Latif et al. (1999) found 80% of all egg mortality occurred between 50and 100 h after fertilization when eggs were incubated at 10 °C.Therefore, any environmental stress is likely to be most importantearly in egg development. In this study, cold water temperaturesduring 2003 were likely one reason for the observed low egg survival.In 2003, survival was half that of survival in 2004. In addition to longerincubation times, lower water temperatures early in egg developmentalso could be an important source of egg mortality. In 2003, averagewater temperatures were 3.6 °C for the first 4 days of development,while in 2004 the average was 5.3 °C and over the first 10 days ofincubation, the average water temperatures in were 3.2 °C and 5.9 °C,respectively. Water temperatures in 2003 dipped down to 2.5 °Cseveral days after incubation of eggs began. It is possible that in 2003,most of the mortality of eggs observed in incubators occurred early indevelopment and that cold water temperatures in the first 4–10 daysof incubation were a significant environmental stress in 2003.
The WUA model results supported the hypothesis that tempera-ture and velocity may limit suitable spawning habitat for walleye inthe Muskegon River. Gillenwater et al. (2006) used a coupledhydraulic model — WUA approach to evaluate suitable spawninghabitat in the Sandusky River, Ohio, and found that walleye WUA waslimited by velocity, although these authors did not consider
Table 10bHabitat suitability (weighted usable area, WUA, ha.), average water temperature (°C)and flow (cms), and preference values for walleye eggs in the lower Muskegon River,MI. Modeled habitat boxes were upstream, below Croton Dam (18.1, 18.2), anddownstream, near Newaygo (18.3, 18.4) (see Fig. 1). Statistics reported are the averagedaily habitat preference values from a low flow year and a high flow year. Input data forthe model includes approximately 500 transects, with 20 cells per transect. Preferencevalues range from 0 (no preference) to 1 (full preference) for eggs during the timeperiod specified.
Upstream Downstream
Variables 18.1 18.2 18.3 18.4Total WUA 0.28 0.67 1.21 1.46Avg. WUA 0.0125 0.0075 0.032 0.011Avg. temperature 7.9 7.9 7.9 7.9Avg. flow 66.8 68.0 70.3 71.2Depth preference 0.58 0.21 0.61 0.39Velocity preference 0.34 0.22 0.38 0.26Substrate preference 0.33 0.64 0.70 0.53Temperature preference 0.18 0.18 0.18 0.18
temperature effects. Likewise, velocity was an important limitingenvironmental variable in our study. The strong impact of tempera-ture, especially in the cold, high flow year (2004), suggests thattemperatures in the Muskegon River may rarely be suitable forwalleye spawning, especially since 2004 was the warmest year forwhich we have survival data.
Substrate effectsSubstrate composition also may have had significant effects on egg
survival in some years. Previous studies indicate that walleye spawnon gravel/cobble substrates where egg survival is highest (Johnson,1961; Colby et al., 1979). Egg survival estimates from incubators werelower in habitats with cobble/gravel substrates than in habitats withsand substrates. However, incubators do not mimic what eggsexperience on river bottoms as they omit predators and protecteggs from being swept downstream. In 2003 and 2004, incubators insome high flow environments (gravel/cobble sites) were subject to agreat deal of turbulence and were seen to bounce on the bottom,while incubators in low flow environments (sand habitats) wereunperturbed on bottom. This might explain why survival in 2004 washigher on sandy substrates. In contrast, annual flow differences ofalmost 30 cm/s between 2005 and 2006 had little effect on eggsurvival, as survival rates estimated from mat surveys were similar inthose years.
Predation effectsA comparison of walleye egg survival between study methods
suggested that predation was the most likely cause of lower eggsurvival in exposed mats compared with protected incubators, andegg mats therefore likely provide a truer estimate of egg survival thanegg incubators. Although the methods used to estimate survivalbetween egg incubators and egg mats were different and did not lendthemselves to statistical comparisons, egg survival in incubators inboth 2003 and 2004 was at least 25-fold greater than survival in matsin 2005 and 2006. While incubators may not have prevented all egg
336 L.N. Ivan et al. / Journal of Great Lakes Research 36 (2010) 328–337
predation, they were more effective than egg mats at protecting eggsfrom predators.
In other studies, egg predation by fish has been reported as amajorcause of poor egg survival. Roseman et al. (2006) and Wolfert et al.(1975) found a myriad of fish predators consumed walleye eggs onreefs in western Lake Erie. Some of the same egg predators in thesestudies, including mottled sculpin (Cottus bairdii), white sucker(Catostomus commersonii), and johnny darter (Etheostoma nigrum)are very abundant on the walleye spawning grounds in the lowerMuskegon River (David, 2008). More recent analysis of fish diets fromthe lower Muskegon River also has identified juvenile rainbow trout(Oncorhynchus mykiss) as a consumer of walleye and sucker eggs(personal communication, D. Krueger, University of Michigan, AnnArbor, MI). In addition to fish, invertebrate predators may alsocontribute to walleye egg loss from spawning grounds. Mills (1981)quantified invertebrate predation on dace eggs, although most of thispredation was on eggs that had already died from other sources ofmortality (e.g. disease). Crayfish also are known to consume fish eggs(Dorn and Mittelbach, 2004). In the Muskegon River, upstreamreaches where walleye egg density is high also contain high densitiesof larger invertebrates, including crayfish. However, the role ofinvertebrates as walleye egg predators, and their potential role incontrolling walleye populations in the Muskegon River, remainsunknown.
Despite low egg survival onmats, we estimated that the number ofwalleye larvae produced was approximately 30 million (from eggmatanalysis). This production of larvae is similar to estimated productionof walleye larvae from the Maumee River, a tributary to Lake Erie(Mion et al., 1998). Recent attempts to capture walleye larvae in themainstem of the Muskegon River proper during downstreammigrations were unsuccessful (personal communication, D. Jude andS. Hensler, University of Michigan). In 2003, they sampled five riverstations weekly starting in early April. In 2004, they sampled 31stations at various times throughout the season, and two stationsweekly at themouth of the north and south branches of theMuskegonRiver, as well as 20 stations in Muskegon Lake. In 2003, no walleyelarvae were collected. In 2004, low densities of walleye larvae (peakdensity=143 larvae/1000 m3) were collected at the mouth of atributary creek of the Muskegon River, and also were collectedregularly in Muskegon Lake. The annual difference in fish larvaecatches was consistent with the lower egg survival in 2003 comparedwith 2004. The low catches of walleye larvae in both years suggestthat few walleye hatching near Croton Dam survives the journeydownstream to Muskegon Lake.
Study biases
It was hoped that incubators would provide information on theimportance of egg predation to egg survival through comparison withegg mats, which can be used to estimate density of naturally spawnedeggs as well as egg survival. During 2003 collections, however, someincubators contained small invertebrates that might have contributedto egg loss. For the most part, these invertebrate predators weremembers of Chironomidae and are unlikely to consume eggs. To avoidinvertebrate predation in 2004, the nitex mesh size was decreasedand incubators were retrieved shortly before eggs hatched.
It is possible that survival estimates from mats do not representactual survival of walleye eggs in the Muskegon River. While matsoffer habitat for macroinvertebrate predators and therefore decreasedegg survival, it is also likely that thematsmight offer better protectionfrom effects of shear or from fish predators thanwould open substratealone. Mats likely also retain eggs that would drift downstream.During recent surveys in spring 2009 in the Muskegon River, manywalleye eggs were noted in the drift (E. Rutherford, personalcommunication, NOAA). Eggs also were captured at sites approxi-mately 30 mi downstream from spawning locations. High drift rates
indicate that our egg density estimates onmats are biased high, whichwould inflate our estimate of larval production. Furthermore, ifsurvival on mats was better than surrounding substrates, survivalestimates in 2005 and 2006 also will be artificially inflated. On theother hand, survival on mats could be lower than the surroundingenvironment due to siltation. We did note invertebrates and sandwithin mats, but mats were never completely covered in sand, andwhile we did observe dead eggs on mats, they were always much lessabundant than live eggs. Finally, survival estimates in 2005 and 2006are strongly dependent on the assumptions used in Eq. (1) (i.e., samespawning population size, fecundity and spawning area). If theseassumptions are incorrect and estimates vary between 2005 and2006, survival estimates on egg mats will be biased. Overestimatingpopulation size or fecundity would result in an underestimate ofsurvival, while overestimating the area available to spawners wouldresult in an overestimate of survival.
Further studies are required to determine sources and theintensity of walleye egg predation by both invertebrates and fishes.In addition, studies on the production of larvae through larvalemergence traps are needed to adequately determine if egg or larvalsurvival is responsible for the reproductive failure of walleyes in theMuskegon River.
Acknowledgments
Wewould like to thank Dr. Bruce Manny of USGS for his assistancein sampling design, loan of egg incubators, and egg mat design.Assistance in egg staging techniques and larvae identification from Dr.Edward Roseman was vital to the completion of the study. Fieldassistance was provided by D. Krueger, J. Roberts, D. Swank, K. Marko,and D. Ruberg. Walleye egg collections, laboratory tanks, vehicles, andboat support were provided by the Michigan Department of NaturalResources Fisheries Division. Funding for this project was provided bythe Great Lakes Fisheries Trust, the Saginaw BayWalleye Club, and Dr.David Jude, University of Michigan. Dr. Jude reviewed several previousdrafts of the manuscript. This is a GLERL contribution No. 1549.
References
Busch,W.D., School, R., Hartman,W., 1975. Environmental factors affecting the strengthof walleye (Stizostedion vitreum vitreum) year classes in western Lake Erie, 1960–70. J. Fish. Res. Board Can. 32, 1733–1743.
Cheng, F., Zika, U., Banachowski, K., Gillenwater, D., Granata, T., 2006. Modelling theeffects of dam removal on migratory walleye (Sander vitreus) early life-historystages. River Res. Applic. 22, 837–851.
Colby, P.J., McNicol, R.E., and Ryder, R.A., 1979. Synopsis of biological data on thewalleye Stizostedion v. vitreum (Mitchill 1818). FAO Fisheries Synopsis No. 119.
Conover, W.J., Iman, R.L., 1981. Rank transformations as a bridge between parametricand nonparametric statistics. Am. Stat. 35, 124–129.
David, S.R., 2008. The influence of physical habitat factors on a near-shore fishcommunity in the lower Muskegon River, Michigan. Master's Thesis. Univ. MI, AnnArbor, MI.
Day, R.M., 1991. Population dynamics and early life history of Muskegon River walleyes.M.S. Thesis, Michigan State University, East Lansing, MI. 137 pp.
Deblois, E.M., Leggett, W.C., 1991. Functional-response and potential impact ofinvertebrate predators on benthic fish eggs — analysis of the calliopes-laeviusculus-capelin (Mallotus-villosus) predator–prey system. Mar. Ecol. Prog.Ser. 69, 205–216.
Dorn, N.J., Mittelbach, G.G., 2004. Effects of a native crayfish (Orconectes virilis) on thereproductive success and nesting behavior of sunfish (Lepomis spp.). Can. J. Fish.Aquat. Sci. 61, 2135–2143.
Eschmeyer, P.H., 1948. The life history of the walleye, Stizostedion vitreum vitreum(Mitchill), in Michigan. Bull. Inst. Fish. Res. 3.
Fielder, D.G., Schaeffer, J.S., Thomas, M.V., 2007. Environmental and ecologicalconditions surrounding the production of large year classes of walleye (Sandervitreus) in Saginaw Bay, Lake Huron. J. Great Lakes Res. 33 (Supplement 1),118–132.
Galat, D.L., 1972. Preparing teleost embryos for study. Prog. Fish Cult. 34, 43–48.Gillenwater, D., Granata, T., Zika, U., 2006. GIS-based modeling of spawning habitat
suitability for walleye in the Sandusky River, Ohio, and implications for damremoval and river restoration. Ecol. Eng. 28, 311–323.
Hanchin, P.A., O'Neal, R.P., Clark Jr., R.D., Lockwood, R.N., 2007. The walleye populationand fishery of the Muskegon Lake system, Muskegon and Newaygo Counties,Michigan, in 2002. MI Dept. Nat. Res., Fish. Spec. Rep. 40, Ann Arbor, MI.

337L.N. Ivan et al. / Journal of Great Lakes Research 36 (2010) 328–337
Heidinger, R.C., Brooks, R.C., Leitner, D., Soderstrom, I., 1997. Prediction of walleye eggand embryo survival at two stages of development. Prog. Fish Cult. 59, 64–67.
Johnson, F.H., 1961. Walleye egg survival during incubation on several types of bottomin LakeWinnibigoshish, Minnesota, and connecting waters. Trans. Am. Fish. Soc. 90,312–322.
Jones, M.L., Netto, J.K., Stockwell, J.D., Mion, J.B., 2003. Does the value of newlyaccessible spawning habitat for walleye (Stizostedion vitreum) depend on itslocation relative to nursery habitats? Can. J. Fish. Aquat. Sci. 60, 1527–1538.
Koenst, W.M., Smith Jr., L.L., 1976. Thermal requirements of early life-history stages ofwalleye, Stizostedion-vitreum-vitreum, and sauger, Stizostedion canadense. J. Fish.Res. Board Can. 33, 1130–1138.
Latif, M.A., Bodaly, R.A., Johnston, T.A., Fudge, R.J.P., 1999. Critical stage in developingwalleye eggs. N. Am. J. Aquat. 61, 34–37.
Manny, B.A., Jude, D.J., Eshenroder, R.L., 1989. Field test of a bioassay procedure forassessinghabitat quality onfish spawninggrounds. Trans.Am. Fish. Soc. 118, 175–182.
Manny, B.A., Kennedy, G.W., Allan, J.D., French, J.R.P., 2007. First evidence of eggdeposition by walleye (Sander vitreus) in the Detroit River. J. Great Lakes Res. 33(2), 512–516.
Martin, F.D. andDrewry, G.E., 1978. Development offishes of theMID-Atlantic Bight. U.S.Dept. Interior. USFWS. Vol. VI. FWS/OBS-78/12.
Mills, C.A., 1981. Egg population dynamics of naturally spawning dace, Leuciscusleuciscus (L.). Environ. Biol. Fish. 6, 151–158.
Mion, J.P., Stein, R.A., Marschall, E.A., 1998. River discharge drives survival of larvalwalleye. Ecol. Appl. 1, 88–103.
O'Neal, R.P., 1997. Muskegon RiverWatershed assessment. MI. Dept. Nat. Res., Fish. Div.,Spec. Rep. 19, Ann Arbor, Michigan.
Rose, K.A., Rutherford, E.S., McDermot, D.S., Forney, J.L., Mills, E.L., 1999. Individual-based model of yellow perch and walleye populations in Oneida Lake. Ecol.Monogr. 69, 127–154.
Roseman, E.F., Taylor, W.W., Hayes, D.B., Haas, R.C., Knight, R.L., Paxton, K.O., 1996.Walleye egg deposition and survival on reefs in western Lake Erie (USA). Ann. Zool.Fennici 33, 341–351.
Roseman, E.F., Taylor, W.W., Hayes, D.B., Jones, A.L., Francis, J.T., 2006. Predationon walleye eggs by fish on reefs in Western Lake Erie. J. Great Lakes Res. 32,415–423.
Schneider, J.C., Leach, J.H., 1979. Walleye (Stizostedion vitreum vitreum) stocks in theGreat Lakes, 1800–1975: fluctuations and possible causes. Great Lakes FisheryCommission, Tech. Rep. 31, Ann Arbor, MI.
Schneider, J.C., Copeland, J., Wolgamood, M., 2002. Tolerance of incubating walleye eggsto temperature fluctuation. N. Am. J. Aquac. 64, 75–78.
USFWS (US Fish Wildlife Service), 1980. Habitat as a basis for environmentalassessment. USFWS. Report 101 ESM, Fort Collins, CO.
Wolfert, D.R., Busch, W.N., Baker, C.T., 1975. Predation by fish on walleye eggs on aspawning reef in western Lake Erie. Ohio J. Sci. 75, 109–125.
Copyright © 2022 FDOKUMEN