How Migrants Get There: Migratory Performance and Orientation
MODELLING THE EFFECTS OF DAM REMOVAL ON MIGRATORY WALLEYE(SANDER VITREUS) EARLY LIFE-HISTORY STAGES
FANG CHENG,a,b ULRIKE ZIKA,a KEITH BANACHOWSKI,a,c DANIEL GILLENWATERa,b
and TIM GRANATAa*a Department of Civil and Environmental Engineering and Geodetic Science, Ohio State University, 470 Hitchcock Hall, 2070 Neil Avenue,
Columbus, OH 43210, USAb Environmental Science Graduate Program, Ohio State University, Columbus, OH 43210, USA
c Ohio Department of Natural Resources, Division of Dam Safety, 2045 Morse Rd., Columbus, OH 43229, USA
ABSTRACT
Many dams in the USA have outlived their intended purpose and an increasing number are being considered for removal. Yet,quantitative studies of the potential physical, biological and ecological responses are needed to assess dam removal decisions. Inthis paper, the responses of migratory walleye (Sander vitreus) to increased spawning habitat availability as a result of damremoval was studied by comparing scenarios with and without a high-head dam in the Sandusky River (Ohio), a major tributaryto Lake Erie. A conceptual, ecological model was proposed to define the relationship between hydrodynamics and walleyespawning, egg hatching, larval drift and survival. A mathematical, ecological model of the early life-history stages was thendeveloped and coupled with time series of depth and velocity predictions over the spawning grounds from a 1-D hydrodynamicmodel. Model simulations were run for 1984–1993 for both thewith- and without-dam scenarios to assess the potential benefit ofdam removal. The simulation results demonstrated that velocity, depth and water temperature are major factors influencing adultwalleye spawning success. Without the dam, 10 times the amount of spawning habitat would be available for walleye to spawn.This increase in spawning habitat area resulted in up to five times the total egg deposition and seven times the larval output to thenursing grounds, based on the assumption that 5% of the walleye population of Lake Erie migrated up the Sandusky River tospawn. We concluded that the spawning habitat in the current condition (with the dam) is limiting and additional spawninghabitat upstream could significantly increase the number of larval walleye drifting to Lake Erie. The model sensitivity analysisshowed that the number of walleye migrating up the river in spring is the dominant factor for larval recruitment to the lake.Copyright # 2006 John Wiley & Sons, Ltd.
key words: dam removal; river restoration; ecological model; Sander vitreus
INTRODUCTION
The USA to date has more than 75 000 dams, modifying over 20% of river flows in North America (Graf, 1999).
Most dams in the USA were built between 1900 and 1949, and the primary purposes of dam construction were
hydroelectric power generation, flood control, irrigation, water supply, recreation and fire protection. Many dams
achieved their intended purposes by boosting economic growth in the past. However, their benefits are realized with
changes in the national economy, and now many dams are in disrepair and not serving their original intent.
Rehabilitation of obsolete dams is questionable and until 1995, the Federal Energy Regulatory Commission was
faced with the decision of relicensing 230 dams on 59 river basins (Shuman, 1995).
Over the past decade, more attention has been paid to the effects of dams on fisheries and aquatic ecosystems in
general (Wunderlich et al., 1994; Ligon et al., 1995). Many river ecologists claim that dams have negative impacts
by breaking river longitudinal connectivity, blocking fish migration and changing downstream flow, water quality
and habitat characteristics (Ward and Stanford, 1979; Winston et al., 1991; Ligon et al., 1995; Kanehl et al., 1997;
Benstead et al., 1999; Bednarek, 2001). Consequently, dam construction and operation cause dramatic declines in
numerous game and non-game fishes, and reduce species biodiversity (Kanehl et al., 1997; Ponton et al., 2000).
RIVER RESEARCH AND APPLICATIONS
River Res. Applic. 22: 837–851 (2006)
Published online 29 August 2006 in Wiley InterScience(www.interscience.wiley.com). DOI: 10.1002/rra.939
*Correspondence to: T. Granata, Department of Civil and Environmental Engineering and Geodetic Science, Ohio State University, 470Hitchcock Hall, 2070 Neil Avenue, Columbus, OH 43210, USA. E-mail: [email protected]
Copyright # 2006 John Wiley & Sons, Ltd.
Received 12 June 2005
Revised 15 December 2005
Accepted 2 January 2006
This is one of the major reasons why dam removal is suggested as the best alternative to dam rehabilitation and
relicensing.
After the passage of the 1992 Elwha River Ecosystem and Fisheries Restoration Act, which requires a detailed
analysis of dam retention and removal, dam removal received much more attention (Wunderlich et al., 1994).
However, the effects of dam removal on river ecosystems has not yet been studied extensively (Shuman, 1995) and
dam removal projects are still considered ongoing experiments with uncertain outcomes (Kareiva et al., 2000;
Grant, 2001). Furthermore, previous analyses of the effects of dam removal were mostly focused on qualitative
analyses of the alteration of river ecosystems, fish diversity and water quality. Two exceptions are Kanehl et al.
(1997) and Doyle et al. (2003), which quantitatively assessed changes in habitat and fish community and river
channel geomorphology respectively. With increasing numbers of dams being considered for removal, more
quantitative studies of the potential physical, biological and ecological responses are needed. Numerical models
simulating the potential changes associated with dam removal, could estimate the timing and magnitude of those
responses prior to removal.
The Instream Flow Incremental Methodology (IFIM) framework has been widely used in North America as a
decision support system to solve problems related to riverine habitat (Bovee et al., 1998). The Physical Habitat
Simulation (PHABSIM) model within the IFIM framework couples hydraulic and biological models to evaluate
habitat availability. PHABSIM has been criticized (Reviewed by Gore and Nestler, 1988; Lamouroux et al., 1998;
Kondolf et al., 2000), however, it is still a useful tool if its limitations are recognized. The PHABSIM model only
evaluates a given life stage of fish and does not integrate different life stages, movement of fish or spatial
heterogeneity (Jager et al., 1997). In addition, PHABSIM is only suitable for situations where physical factors
(velocity, depth and substrates) constrain fish populations, while it is not proper for conditions where populations
are limited by water quality and temperature (Spence and Hickley, 2000). Over the past two decades, PHABSIM
has proven suitable to quantify biological effects of fish habitat to different discharge regimes (Kondolf et al.,
2000). Leclerc et al. (1996) improved the PHABSIM model by considering the change of discharge with time.
In this paper, we use the concept of Habitat Suitability Indices (HSI) in PHABSIM to evaluate spawning
habitat suitability for walleye (Sander vitreus). Habitat suitability is calculated based on the depth and velocity
output of a 1-dimensional hydrodynamic model (Mike 11) on specific spawning substrate. Recently, a model
estimating walleye spawning and the effects of drifting distance on recruitment was developed by Jones et al.
(2003). They concluded that the process of walleye larval drift is controlled by temperature and discharge. In
our model, we combine the strengths of Jones’s model on estimating the impacts of temperature on early life
stages of walleye and the strengths of the PHABSIM model on spawning habitat suitability. This ecological
model simulates the river stages of migratory walleye: adult walleye migration, spawning, egg incubation, egg
hatching and larval walleye drift for two scenarios, with and without the presence of a dam. By comparing larval
fish populations from the two scenarios, we can better understand the consequences of dam removal and provide
advice for decision-making.
Study area and species
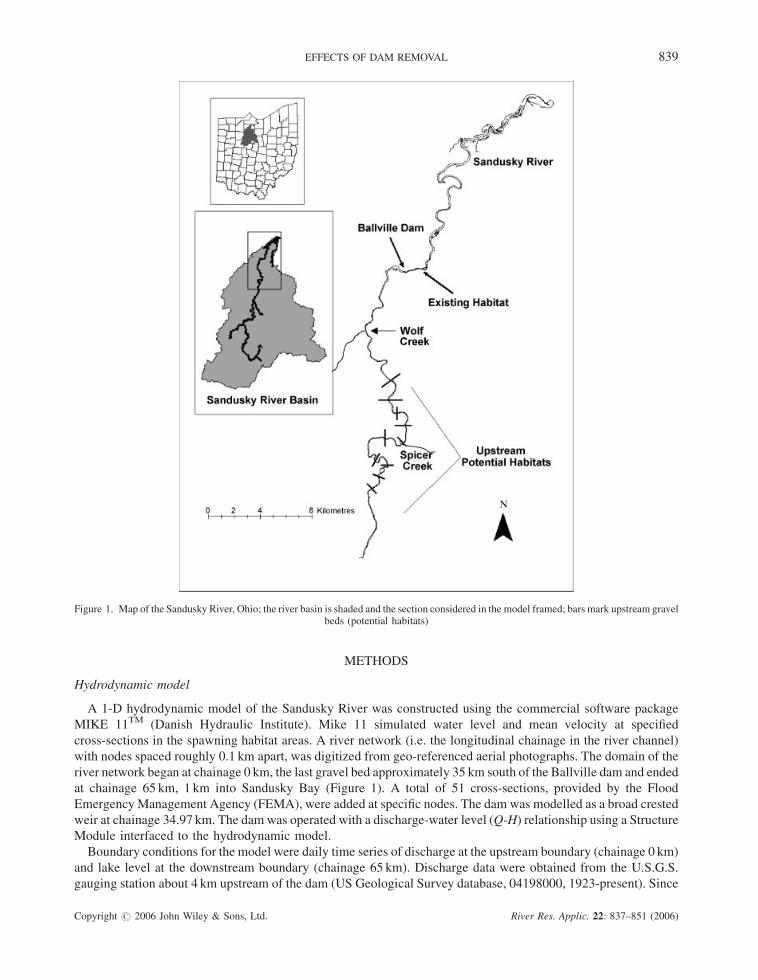
The Sandusky River, Ohio, is 190 km long and flows northeast into Lake Erie at Sandusky Bay (Figure 1). The
river basin is about 3.2� 103 km2, and 83.2% is dominated by agricultural land use. The Ballville Dam, 10.5m high
and 120mwide, is located 29 km upstream of the river mouth with an impoundment of 3.5 km. It was constructed in
1911 for generating hydroelectric power, but was converted into a water supply reservoir for the city of Fremont,
OH, in 1959. In 1980, the US Army Corps of Engineers classified the Ballville Dam as a high-hazard potential
because a sudden failure of the dam may cause an uncontrolled discharge.
Walleye (Sander vitreus) is the principle commercial and sport fish species of Lake Erie (Leach and Nepszy,
1976). There are three major spawning areas in Western Lake Erie: mid-lake reefs and the Maumee and Sandusky
Rivers. With the Ballville Dam blocking walleye migration upstream in the Sandusky, the only available spawning
habitat is a 64� 103m2 area that is roughly 1.5 km downstream of the dam (Figure 1). Up to 35 km upstream of the
dam, the area of potential spawning habitat totals to 654.3� 103m2, which is approximately 10 times greater than
the existing downstream habitat (Figure 1).
Copyright # 2006 John Wiley & Sons, Ltd. River Res. Applic. 22: 837–851 (2006)
838 F. CHENG ET AL.
METHODS
Hydrodynamic model
A 1-D hydrodynamic model of the Sandusky River was constructed using the commercial software package
MIKE 11TM (Danish Hydraulic Institute). Mike 11 simulated water level and mean velocity at specified
cross-sections in the spawning habitat areas. A river network (i.e. the longitudinal chainage in the river channel)
with nodes spaced roughly 0.1 km apart, was digitized from geo-referenced aerial photographs. The domain of the
river network began at chainage 0 km, the last gravel bed approximately 35 km south of the Ballville dam and ended
at chainage 65 km, 1 km into Sandusky Bay (Figure 1). A total of 51 cross-sections, provided by the Flood
Emergency Management Agency (FEMA), were added at specific nodes. The dam was modelled as a broad crested
weir at chainage 34.97 km. The damwas operated with a discharge-water level (Q-H) relationship using a Structure
Module interfaced to the hydrodynamic model.
Boundary conditions for the model were daily time series of discharge at the upstream boundary (chainage 0 km)
and lake level at the downstream boundary (chainage 65 km). Discharge data were obtained from the U.S.G.S.
gauging station about 4 km upstream of the dam (US Geological Survey database, 04198000, 1923-present). Since
Figure 1. Map of the Sandusky River, Ohio; the river basin is shaded and the section considered in the model framed; bars mark upstream gravelbeds (potential habitats)
Copyright # 2006 John Wiley & Sons, Ltd. River Res. Applic. 22: 837–851 (2006)
EFFECTS OF DAM REMOVAL 839
the gauging station was not located at the upstream boundary, flow was adjusted by subtracting inflows from two
tributaries (Wolf Creek and Spicer Creek, Figure 1) between the gravel bed farthest upstream (0 km) and the
gauging station, assuming dischargewas linear proportional to the drainage area of the tributaries. Daily water level
data in Sandusky Bay were from CO-Ops National Water Level Observation Network (NWLON) database. The
lake level was justified because the depth in the Sandusky Bay, an embayment of Lake Erie, was dominated by
changes in lake level and affected river stage up to 5 km from the dam. Initial conditions for the model were based
on a 30-year simulation starting in 1957. Time series from 1957 to 1983 were used to calibrate the model with the
dam, with errors in water levels of less than 5%. Velocity and water level over habitat areas were simulated from
January 13, 1989 to September 30, 1993 for one scenario with the dam and one where the dam was removed,
without modifying the bathymetry of the cross sections.
Conceptual ecological model
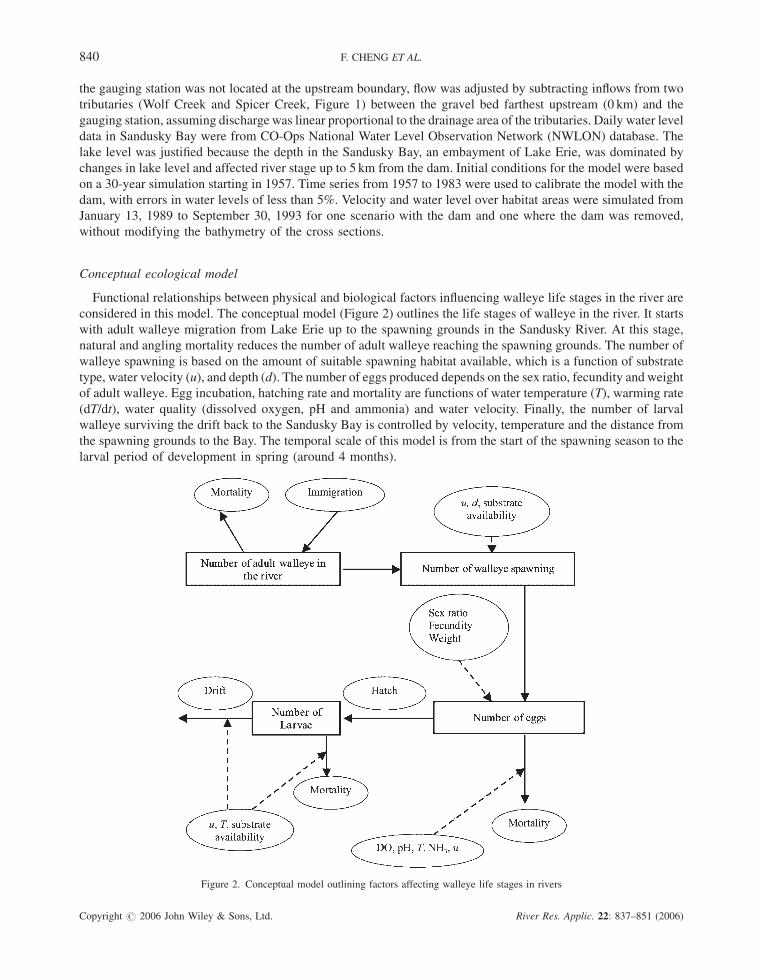
Functional relationships between physical and biological factors influencing walleye life stages in the river are
considered in this model. The conceptual model (Figure 2) outlines the life stages of walleye in the river. It starts
with adult walleye migration from Lake Erie up to the spawning grounds in the Sandusky River. At this stage,
natural and angling mortality reduces the number of adult walleye reaching the spawning grounds. The number of
walleye spawning is based on the amount of suitable spawning habitat available, which is a function of substrate
type, water velocity (u), and depth (d). The number of eggs produced depends on the sex ratio, fecundity and weight
of adult walleye. Egg incubation, hatching rate and mortality are functions of water temperature (T), warming rate
(dT/dt), water quality (dissolved oxygen, pH and ammonia) and water velocity. Finally, the number of larval
walleye surviving the drift back to the Sandusky Bay is controlled by velocity, temperature and the distance from
the spawning grounds to the Bay. The temporal scale of this model is from the start of the spawning season to the
larval period of development in spring (around 4 months).
Figure 2. Conceptual model outlining factors affecting walleye life stages in rivers
Copyright # 2006 John Wiley & Sons, Ltd. River Res. Applic. 22: 837–851 (2006)
840 F. CHENG ET AL.
Ecological model
The ecological model simulating the effects of dam removal on walleye spawning and larval walleye early life-
history stages was developed with MATLABTM (v. 6.5). Based on the conceptual model, the relationships of
hydrological conditions and life-stages of walleye in the river were represented. All the parameters are based on
daily data. The detailed descriptions of the model is given below:
Adult walleye migration. Estimates of walleye abundance in Lake Erie from 1984 to 1993 were obtained from
the Ohio Department of Natural Resources (ODNR) (1998). The number of adult walleye migrating into the
Sandusky River each year is assumed to be 5% of the total adult walleye population in the previous year in the
Western Basin of Lake Erie. Angling mortality was not considered since it was calculated to be less than 4% of
the total number of adults migrating up the river (mean angling harvest from 1975 to 1998 in the Sandusky River
was 6876 fish/season, ODNR, 1998). The daily number of migrating walleye, N, is assumed to be normally
distributed throughout the spawning season with N (m,s), where m¼ s (Pþ1), s¼ (m�1)/3.08 (99.5% confidence
interval). The spawning season is determined as the number of days (P) in spring when water temperature is
between 3.38C and 118C, suitable for walleye to spawn (Jaworska et al., 1997; Paragamian, 1989).
Adult walleye natural mortality. The instantaneous mortality per day (InsMortality) is converted from the
annual mortality (Hannon and Ruth, 1997),
InsMortality ¼ 1� explnðAnnualMortalityÞ � dt
DT
� �(1)
where DT¼ 365 days, dt¼ 1 day, and the annual mortality rate is 0.505 year�1 for walleye in the Sandusky River
(Ohio Department of Natural Resources (ODNR), 1998, 1999).
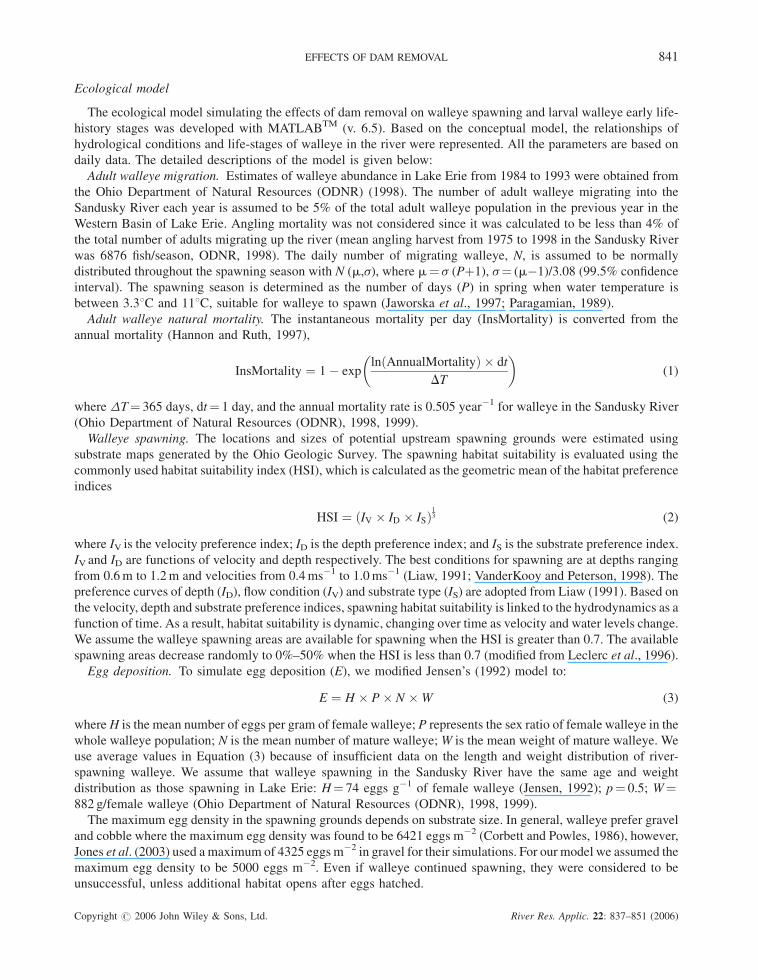
Walleye spawning. The locations and sizes of potential upstream spawning grounds were estimated using
substrate maps generated by the Ohio Geologic Survey. The spawning habitat suitability is evaluated using the
commonly used habitat suitability index (HSI), which is calculated as the geometric mean of the habitat preference
indices
HSI ¼ ðIV � ID � ISÞ13 (2)
where IV is the velocity preference index; ID is the depth preference index; and IS is the substrate preference index.
IV and ID are functions of velocity and depth respectively. The best conditions for spawning are at depths ranging
from 0.6m to 1.2m and velocities from 0.4ms�1 to 1.0ms�1 (Liaw, 1991; VanderKooy and Peterson, 1998). The
preference curves of depth (ID), flow condition (IV) and substrate type (IS) are adopted from Liaw (1991). Based on
the velocity, depth and substrate preference indices, spawning habitat suitability is linked to the hydrodynamics as a
function of time. As a result, habitat suitability is dynamic, changing over time as velocity and water levels change.
We assume the walleye spawning areas are available for spawning when the HSI is greater than 0.7. The available
spawning areas decrease randomly to 0%–50% when the HSI is less than 0.7 (modified from Leclerc et al., 1996).
Egg deposition. To simulate egg deposition (E), we modified Jensen’s (1992) model to:
E ¼ H � P� N �W (3)
where H is the mean number of eggs per gram of female walleye; P represents the sex ratio of female walleye in the
whole walleye population; N is the mean number of mature walleye;W is the mean weight of mature walleye. We
use average values in Equation (3) because of insufficient data on the length and weight distribution of river-
spawning walleye. We assume that walleye spawning in the Sandusky River have the same age and weight
distribution as those spawning in Lake Erie: H¼ 74 eggs g�1 of female walleye (Jensen, 1992); p¼ 0.5; W¼882 g/female walleye (Ohio Department of Natural Resources (ODNR), 1998, 1999).
The maximum egg density in the spawning grounds depends on substrate size. In general, walleye prefer gravel
and cobble where the maximum egg density was found to be 6421 eggs m�2 (Corbett and Powles, 1986), however,
Jones et al. (2003) used amaximum of 4325 eggsm�2 in gravel for their simulations. For our model we assumed the
maximum egg density to be 5000 eggs m�2. Even if walleye continued spawning, they were considered to be
unsuccessful, unless additional habitat opens after eggs hatched.
Copyright # 2006 John Wiley & Sons, Ltd. River Res. Applic. 22: 837–851 (2006)
EFFECTS OF DAM REMOVAL 841
Egg mortality and hatching. Egg survival is a function of water velocity, dissolved oxygen (D.O.), water
temperature and warming rate (e.g. Peterman and Bradford, 1987; Auer and Auer, 1990; Roseman et al., 1996;
Jaworska et al., 1997), and the duration of egg incubation is a function of temperature (e.g. McElman and Balon,
1979). In our model, walleye eggs start to hatch when they have accumulated 102 thermal units (TU) (McElman
and Balon, 1979), calculated as:
TU ¼Xnx¼1
TðxÞ (4)
where T(x) is the water temperature at day x in 8C, and n is the number of days until TU� 102. If D.O. is less than
6mgL�1 (Auer and Auer, 1990), water velocity is greater than 1.5ms�1, or the warming rate is less than 18C d�1
(Roseman et al., 1996), egg mortality is randomly selected from 95% to 100%. Otherwise, the mortality is set to a
conservative estimate of 95% based on data from Roseman et al. (1996).
Larval mortality. Natural larval walleye mortality is set to 0.2 d�1 for pH< 9.8 (Jaworska et al., 1997). In the
Sandusky River, no pH values higher than 9.0 have been reported (US Geological Survey database), therefore, pH
does not appear to affect natural larval walleye mortality in the Sandusky River. Another component of larval
mortality occurs during larval drift to Lake Erie. In the Sandusky River, mean velocities greater than 0.3ms�1
reduce walleye survival presumably as a result of turbulence (Mion et al., 1998). Additionally, it was reported that
longer distances between the spawning grounds and the lake may increase mortality as a result of starvation (Iguchi
and Mizuno, 1999). If the mean river velocity is less than 0.3ms�1, transport could potentially be slower than yolk
absorption, causing fry to die. We again use thermal units to calculate larval drift mortality (Equation (4). In this
case, n is the number of days of larval drift, which is calculated as distance to the Sandusky Bay divided by mean
velocity. It is hypothesized that the yolk is completely consumed when larvae accumulated 100–128 TU (Krise and
Meade, 1986). Combined advection transport, TU and drifting mortality of an individual larva give three possible
outcomes. If the accumulated TU< 100, the drift survival rate is randomly selected from 0 to 0.7 (Jones et al.,
2003). If 100�TU� 128, the survival rate is randomly selected from 0 to 0.2 (Jones et al., 2003). If the
accumulated TU> 128, larvae absorbed all the yolk before reaching the Lake. In this case, the survival rate is
considered to be zero.
Ecological model set-up. All the parameters and variables discussed above were parameterized in the ecological
model using MATLABTM (v. 6.5). The spatial scale of the ecological model encompasses 29 km upstream of the
Bay (35 km north of the last upstream gravel bed) with the dam, and 64 km without the dam (from the beginning of
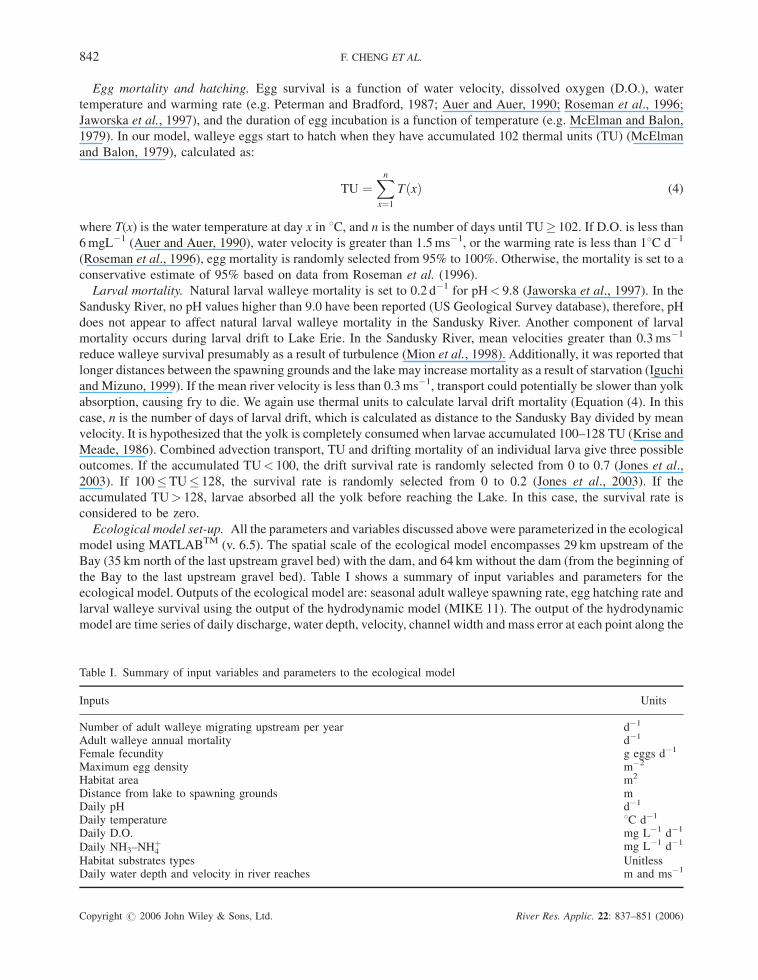
the Bay to the last upstream gravel bed). Table I shows a summary of input variables and parameters for the
ecological model. Outputs of the ecological model are: seasonal adult walleye spawning rate, egg hatching rate and
larval walleye survival using the output of the hydrodynamic model (MIKE 11). The output of the hydrodynamic
model are time series of daily discharge, water depth, velocity, channel width and mass error at each point along the
Table I. Summary of input variables and parameters to the ecological model
Inputs Units
Number of adult walleye migrating upstream per year d�1
Adult walleye annual mortality d�1
Female fecundity g eggs d�1
Maximum egg density m�2
Habitat area m2
Distance from lake to spawning grounds mDaily pH d�1
Daily temperature 8C d�1
Daily D.O. mg L�1 d�1
Daily NH3–NHþ4
mg L�1 d�1
Habitat substrates types UnitlessDaily water depth and velocity in river reaches m and ms�1
Copyright # 2006 John Wiley & Sons, Ltd. River Res. Applic. 22: 837–851 (2006)
842 F. CHENG ET AL.
river. A water quality sub-module in MIKE 11 was used to calculate the spatial distribution of daily pH,
temperature, D.O. and ammonia, NH3–NHþ4 for all cross-sections. Since walleye spawning and larval drift occur
during the spring season (February through May), the ecological model was run every spring from 1984 through
1993 based on data availability.
Both the hydrodynamic and ecological models were run for two scenarios: with and without the dam. For both
scenarios, we ran the model 20 times each year. Mean values and standard deviations were calculated for each year
and plotted. For the scenario without the dam, we made a conservative assumption that the downstream spawning
habitat had been destroyed by sediment transported from the reservoir. To estimate the effects of dam removal, the
prediction from the scenario without the dam was compared with the prediction from the scenario with the dam
using analysis of variance (ANOVA). Because data were generated from computer simulations, there are no limits
to error degrees of freedom. Therefore, we used marginal sums of squares (Type III) to estimate the effects of dam
removal and environmental conditions since they are not dependent on sample size. p-values are not determined
since they depend on sample size, that is the number of simulations. To determine the dominant parameters in the
model, a sensitivity analysis was run on adult weight of walleye, maximum egg density in spawning grounds and
the numbers of adults migrating.
RESULTS
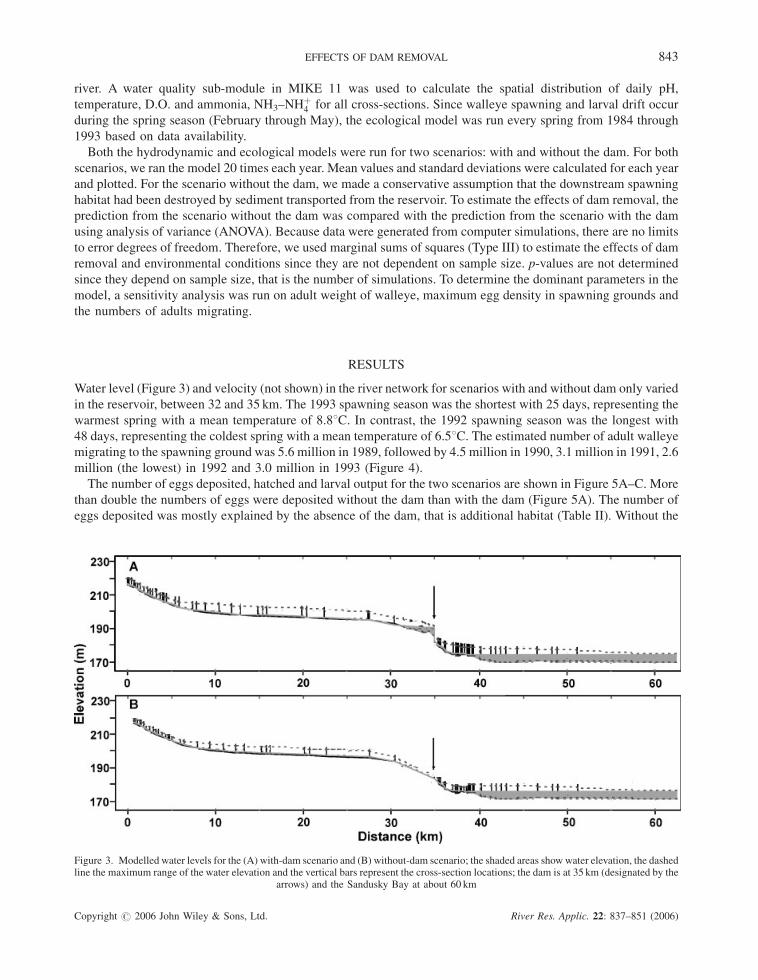
Water level (Figure 3) and velocity (not shown) in the river network for scenarios with and without dam only varied
in the reservoir, between 32 and 35 km. The 1993 spawning season was the shortest with 25 days, representing the
warmest spring with a mean temperature of 8.88C. In contrast, the 1992 spawning season was the longest with
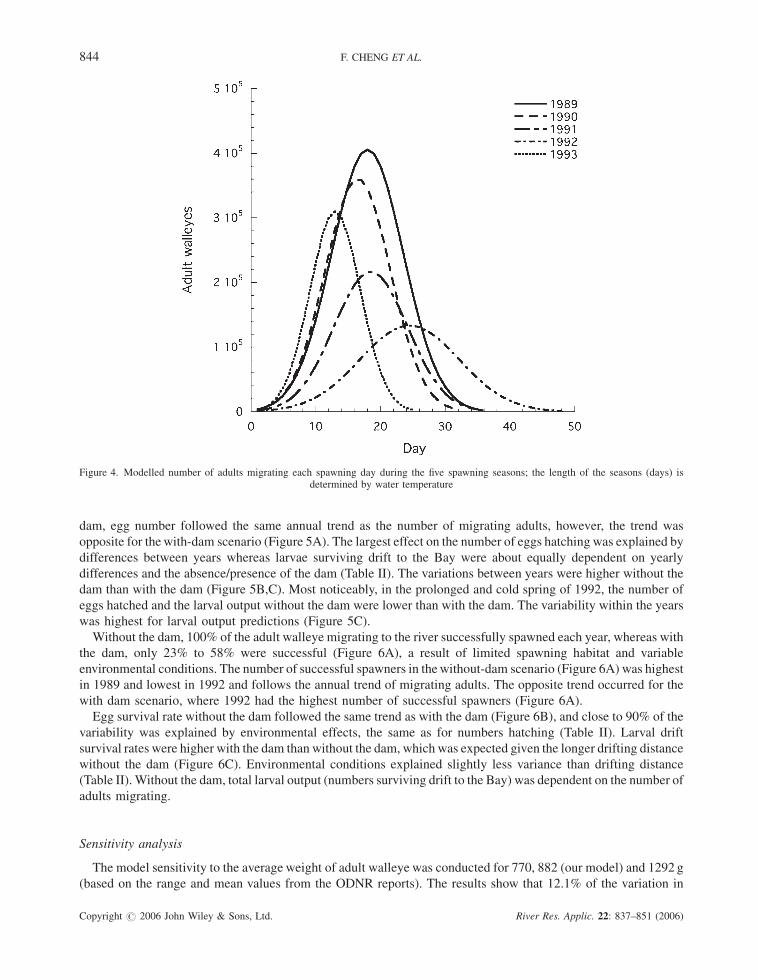
48 days, representing the coldest spring with a mean temperature of 6.58C. The estimated number of adult walleye
migrating to the spawning ground was 5.6 million in 1989, followed by 4.5 million in 1990, 3.1 million in 1991, 2.6
million (the lowest) in 1992 and 3.0 million in 1993 (Figure 4).
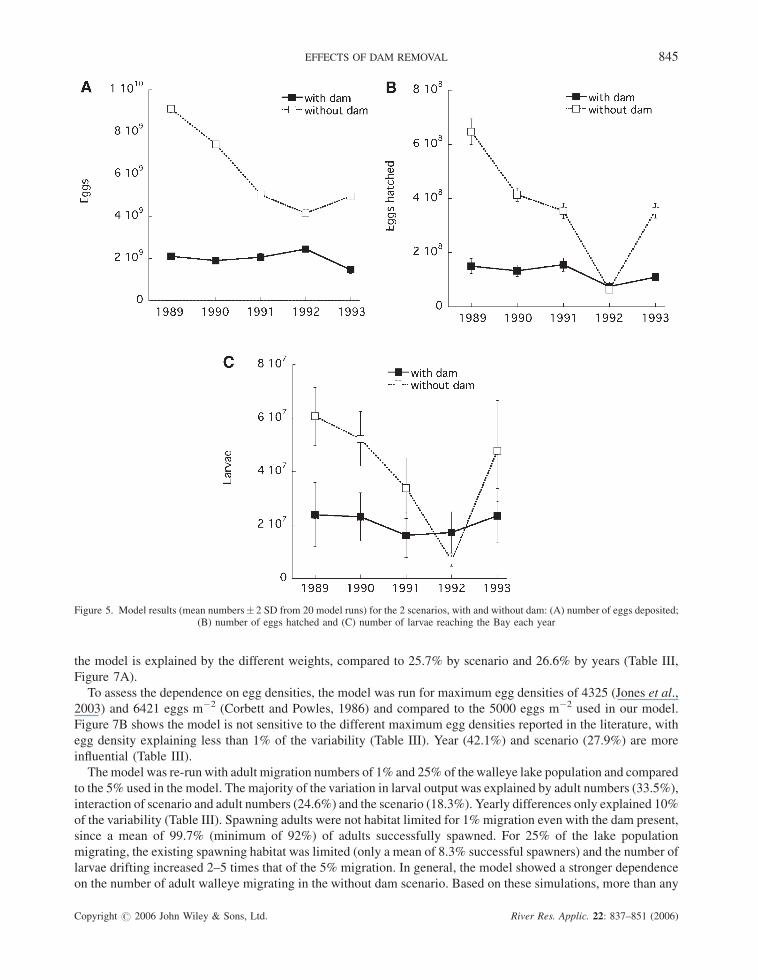
The number of eggs deposited, hatched and larval output for the two scenarios are shown in Figure 5A–C. More
than double the numbers of eggs were deposited without the dam than with the dam (Figure 5A). The number of
eggs deposited was mostly explained by the absence of the dam, that is additional habitat (Table II). Without the
Figure 3. Modelled water levels for the (A) with-dam scenario and (B) without-dam scenario; the shaded areas show water elevation, the dashedline the maximum range of the water elevation and the vertical bars represent the cross-section locations; the dam is at 35 km (designated by the
arrows) and the Sandusky Bay at about 60 km
Copyright # 2006 John Wiley & Sons, Ltd. River Res. Applic. 22: 837–851 (2006)
EFFECTS OF DAM REMOVAL 843
dam, egg number followed the same annual trend as the number of migrating adults, however, the trend was
opposite for thewith-dam scenario (Figure 5A). The largest effect on the number of eggs hatching was explained by
differences between years whereas larvae surviving drift to the Bay were about equally dependent on yearly
differences and the absence/presence of the dam (Table II). The variations between years were higher without the
dam than with the dam (Figure 5B,C). Most noticeably, in the prolonged and cold spring of 1992, the number of
eggs hatched and the larval output without the dam were lower than with the dam. The variability within the years
was highest for larval output predictions (Figure 5C).
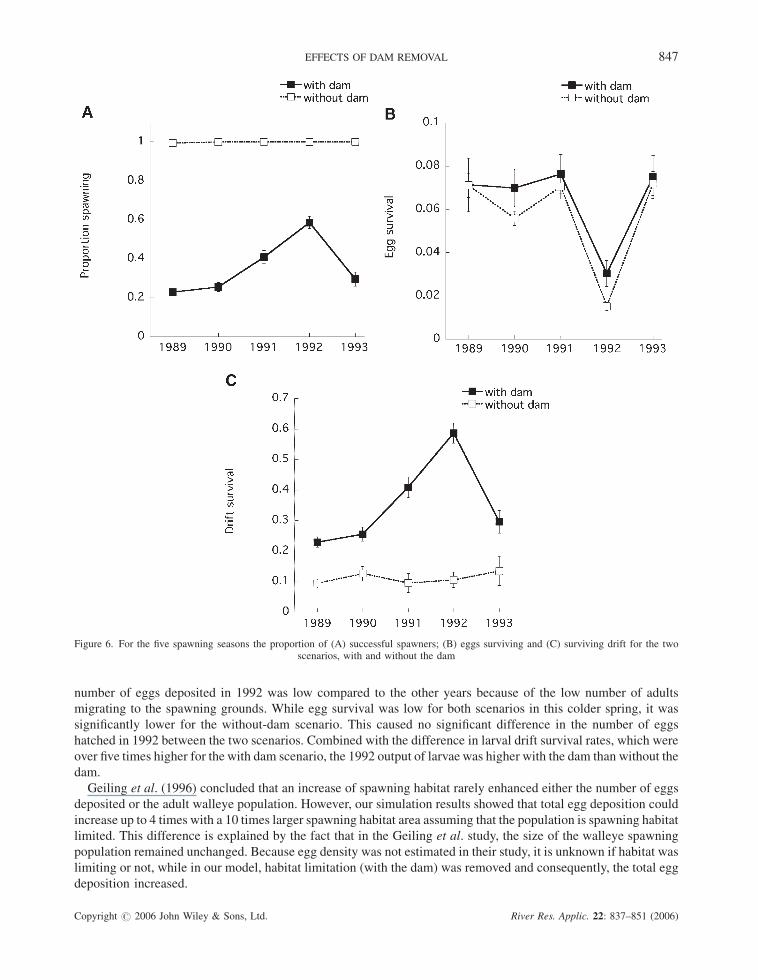
Without the dam, 100% of the adult walleye migrating to the river successfully spawned each year, whereas with
the dam, only 23% to 58% were successful (Figure 6A), a result of limited spawning habitat and variable
environmental conditions. The number of successful spawners in thewithout-dam scenario (Figure 6A) was highest
in 1989 and lowest in 1992 and follows the annual trend of migrating adults. The opposite trend occurred for the
with dam scenario, where 1992 had the highest number of successful spawners (Figure 6A).
Egg survival rate without the dam followed the same trend as with the dam (Figure 6B), and close to 90% of the
variability was explained by environmental effects, the same as for numbers hatching (Table II). Larval drift
survival rates were higher with the dam than without the dam, which was expected given the longer drifting distance
without the dam (Figure 6C). Environmental conditions explained slightly less variance than drifting distance
(Table II). Without the dam, total larval output (numbers surviving drift to the Bay) was dependent on the number of
adults migrating.
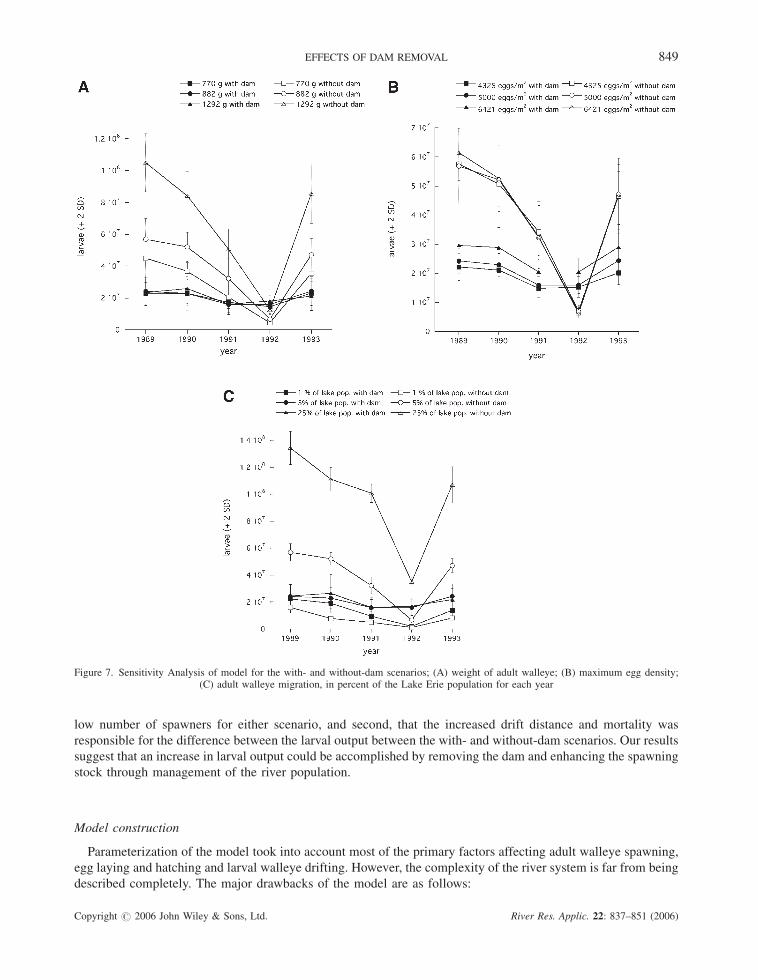
Sensitivity analysis
The model sensitivity to the average weight of adult walleye was conducted for 770, 882 (our model) and 1292 g
(based on the range and mean values from the ODNR reports). The results show that 12.1% of the variation in
Figure 4. Modelled number of adults migrating each spawning day during the five spawning seasons; the length of the seasons (days) isdetermined by water temperature
Copyright # 2006 John Wiley & Sons, Ltd. River Res. Applic. 22: 837–851 (2006)
844 F. CHENG ET AL.
the model is explained by the different weights, compared to 25.7% by scenario and 26.6% by years (Table III,
Figure 7A).
To assess the dependence on egg densities, the model was run for maximum egg densities of 4325 (Jones et al.,
2003) and 6421 eggs m�2 (Corbett and Powles, 1986) and compared to the 5000 eggs m�2 used in our model.
Figure 7B shows the model is not sensitive to the different maximum egg densities reported in the literature, with
egg density explaining less than 1% of the variability (Table III). Year (42.1%) and scenario (27.9%) are more
influential (Table III).
Themodel was re-run with adult migration numbers of 1% and 25% of thewalleye lake population and compared
to the 5% used in the model. The majority of the variation in larval output was explained by adult numbers (33.5%),
interaction of scenario and adult numbers (24.6%) and the scenario (18.3%). Yearly differences only explained 10%
of the variability (Table III). Spawning adults were not habitat limited for 1% migration even with the dam present,
since a mean of 99.7% (minimum of 92%) of adults successfully spawned. For 25% of the lake population
migrating, the existing spawning habitat was limited (only a mean of 8.3% successful spawners) and the number of
larvae drifting increased 2–5 times that of the 5% migration. In general, the model showed a stronger dependence
on the number of adult walleye migrating in the without dam scenario. Based on these simulations, more than any
Figure 5. Model results (mean numbers� 2 SD from 20 model runs) for the 2 scenarios, with and without dam: (A) number of eggs deposited;(B) number of eggs hatched and (C) number of larvae reaching the Bay each year
Copyright # 2006 John Wiley & Sons, Ltd. River Res. Applic. 22: 837–851 (2006)
EFFECTS OF DAM REMOVAL 845
other parameter, the number of adult walleye migrating needs to be known for this model to accurately predict
larval output.
DISCUSSION
The model predicts an overall of three times the larval output without the dam than with dam (maximum> 7�).
This increased output resulted from the larger area of spawning habitat reachable without the dam. With the dam,
spawning habitat was limited and maximum egg densities were always reached. Without the dam, all fish spawned
and other factors (e.g. temperature, velocity and depth) influenced the simulation result more than egg density since
substrate saturation was never reached. The number of eggs deposited was directly dependent on the number of
adults migrating. With the dam, not all adults were able to spawn since the dam limited their access to upstream
spawning grounds (i.e. habitat limitation). This was true for all years, but 1992, when it was reversed.
For the with dam scenario, the variability between years was lower than for the without dam scenario for all
parameters (eggs deposited, eggs hatched and larvae surviving drift). We hypothesize this variability reflects the
heterogeneity of the upstream habitat (i.e. large differences in velocity and depth over the various spawning
grounds) while downstream only one relatively homogenous habitat area is left for spawning.
With the dam, the peak in egg numbers in 1992 was a result of the longer, colder spawning season, which allowed
60% of the adults to spawn. In contrast, without the dam, 100% of the adults spawned, as in all other years, but the
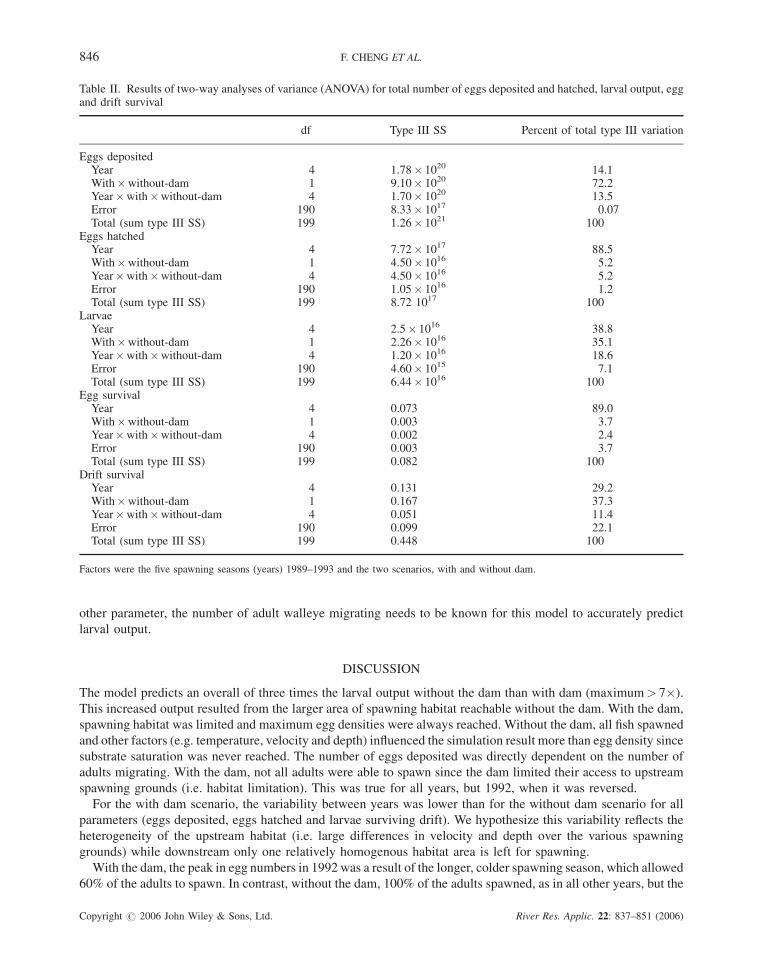
Table II. Results of two-way analyses of variance (ANOVA) for total number of eggs deposited and hatched, larval output, eggand drift survival
df Type III SS Percent of total type III variation
Eggs depositedYear 4 1.78� 1020 14.1With�without-dam 1 9.10� 1020 72.2Year�with�without-dam 4 1.70� 1020 13.5Error 190 8.33� 1017 0.07Total (sum type III SS) 199 1.26� 1021 100
Eggs hatchedYear 4 7.72� 1017 88.5With�without-dam 1 4.50� 1016 5.2Year�with�without-dam 4 4.50� 1016 5.2Error 190 1.05� 1016 1.2Total (sum type III SS) 199 8.72 1017 100
LarvaeYear 4 2.5� 1016 38.8With�without-dam 1 2.26� 1016 35.1Year�with�without-dam 4 1.20� 1016 18.6Error 190 4.60� 1015 7.1Total (sum type III SS) 199 6.44� 1016 100
Egg survivalYear 4 0.073 89.0With�without-dam 1 0.003 3.7Year�with�without-dam 4 0.002 2.4Error 190 0.003 3.7Total (sum type III SS) 199 0.082 100
Drift survivalYear 4 0.131 29.2With�without-dam 1 0.167 37.3Year�with�without-dam 4 0.051 11.4Error 190 0.099 22.1Total (sum type III SS) 199 0.448 100
Factors were the five spawning seasons (years) 1989–1993 and the two scenarios, with and without dam.
Copyright # 2006 John Wiley & Sons, Ltd. River Res. Applic. 22: 837–851 (2006)
846 F. CHENG ET AL.
number of eggs deposited in 1992 was low compared to the other years because of the low number of adults
migrating to the spawning grounds. While egg survival was low for both scenarios in this colder spring, it was
significantly lower for the without-dam scenario. This caused no significant difference in the number of eggs
hatched in 1992 between the two scenarios. Combined with the difference in larval drift survival rates, which were
over five times higher for the with dam scenario, the 1992 output of larvae was higher with the dam than without the
dam.
Geiling et al. (1996) concluded that an increase of spawning habitat rarely enhanced either the number of eggs
deposited or the adult walleye population. However, our simulation results showed that total egg deposition could
increase up to 4 times with a 10 times larger spawning habitat area assuming that the population is spawning habitat
limited. This difference is explained by the fact that in the Geiling et al. study, the size of the walleye spawning
population remained unchanged. Because egg density was not estimated in their study, it is unknown if habitat was
limiting or not, while in our model, habitat limitation (with the dam) was removed and consequently, the total egg
deposition increased.
Figure 6. For the five spawning seasons the proportion of (A) successful spawners; (B) eggs surviving and (C) surviving drift for the twoscenarios, with and without the dam
Copyright # 2006 John Wiley & Sons, Ltd. River Res. Applic. 22: 837–851 (2006)
EFFECTS OF DAM REMOVAL 847
In a model of the same river system, Jones et al. (2003) also assumed that substrate availability was limited by the
dam. However, without the dam they saturated all upstream substrate with eggs in order to estimate a maximum
benefit of additional habitat for larval output. They found a decrease in drift survival for larvae with increasing
distance from the spawning grounds to the river mouth. Our model predicts the same results since the longer transit
times out of the river system translated in lower survival. Jones et al. (2003) however, predicted that larval output
would be eight times greater without the dam than with the dam, while our results predict a mean of three times
more larvae. This discrepancy is likely because they included less preferred substrate type with adjusted survival
rates (e.g. sand, mud-detritus) while we only considered gravel beds as suitable spawning substrate. Additionally,
Jones et al. had pre-determined egg densities in spawning habitat while we used dynamic HSI to estimate egg
deposition. Thus, our results are more conservative. Replenishment of eggs did not occur without the dam (i.e. non-
limiting habitat) because all adults left the spawning ground after depositing their eggs. With the dam however,
adults waited to spawn and could replenish eggs as substrate opened when eggs died. If adults in the with-dam
scenario spawned, regardless of whether the habitat supports additional eggs, and then left the spawning grounds,
egg (and larval) outputs would be even lower.
Our model was sensitive to the number of adults spawning. With 25% and 5% of the lake population spawning,
the increase in larval outputs for the without-dam relative to the with-dam scenarios suggests that habitat limitation
was eliminated in the absence of the dam. However, with 1% of the lake population spawning there were lower
larval outputs than all of the with-dam results. This indicates that first, spawning habitat was not limited for such a
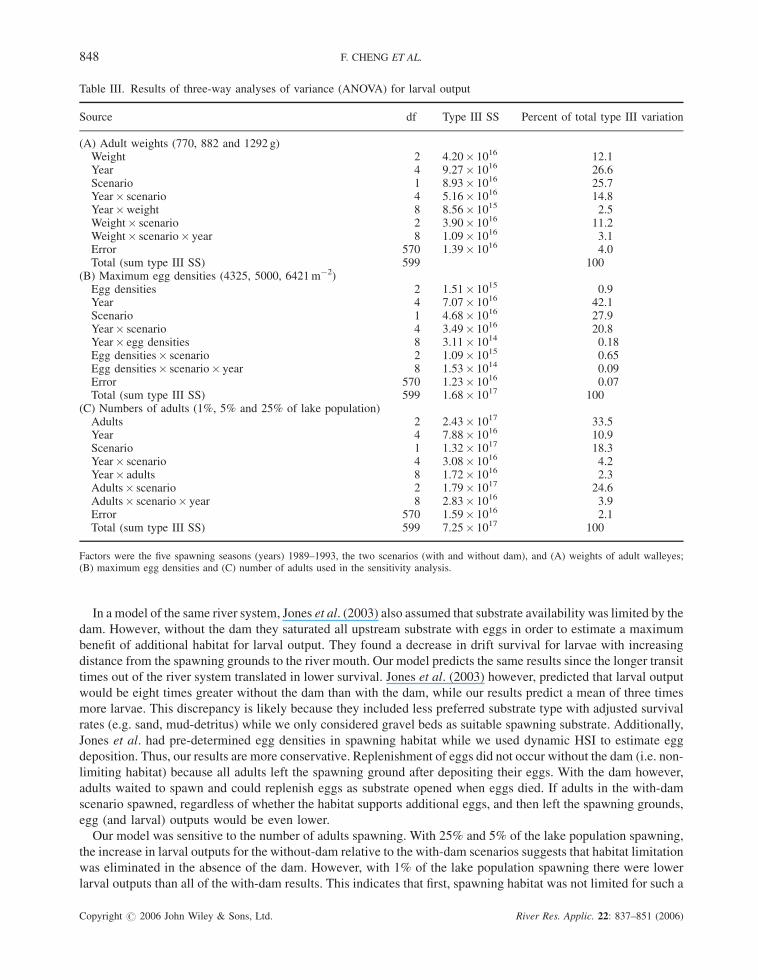
Table III. Results of three-way analyses of variance (ANOVA) for larval output
Source df Type III SS Percent of total type III variation
(A) Adult weights (770, 882 and 1292 g)Weight 2 4.20� 1016 12.1Year 4 9.27� 1016 26.6Scenario 1 8.93� 1016 25.7Year� scenario 4 5.16� 1016 14.8Year�weight 8 8.56� 1015 2.5Weight� scenario 2 3.90� 1016 11.2Weight� scenario� year 8 1.09� 1016 3.1Error 570 1.39� 1016 4.0Total (sum type III SS) 599 100
(B) Maximum egg densities (4325, 5000, 6421m�2)Egg densities 2 1.51� 1015 0.9Year 4 7.07� 1016 42.1Scenario 1 4.68� 1016 27.9Year� scenario 4 3.49� 1016 20.8Year� egg densities 8 3.11� 1014 0.18Egg densities� scenario 2 1.09� 1015 0.65Egg densities� scenario� year 8 1.53� 1014 0.09Error 570 1.23� 1016 0.07Total (sum type III SS) 599 1.68� 1017 100
(C) Numbers of adults (1%, 5% and 25% of lake population)Adults 2 2.43� 1017 33.5Year 4 7.88� 1016 10.9Scenario 1 1.32� 1017 18.3Year� scenario 4 3.08� 1016 4.2Year� adults 8 1.72� 1016 2.3Adults� scenario 2 1.79� 1017 24.6Adults� scenario� year 8 2.83� 1016 3.9Error 570 1.59� 1016 2.1Total (sum type III SS) 599 7.25� 1017 100
Factors were the five spawning seasons (years) 1989–1993, the two scenarios (with and without dam), and (A) weights of adult walleyes;(B) maximum egg densities and (C) number of adults used in the sensitivity analysis.
Copyright # 2006 John Wiley & Sons, Ltd. River Res. Applic. 22: 837–851 (2006)
848 F. CHENG ET AL.
low number of spawners for either scenario, and second, that the increased drift distance and mortality was
responsible for the difference between the larval output between the with- and without-dam scenarios. Our results
suggest that an increase in larval output could be accomplished by removing the dam and enhancing the spawning
stock through management of the river population.
Model construction
Parameterization of the model took into account most of the primary factors affecting adult walleye spawning,
egg laying and hatching and larval walleye drifting. However, the complexity of the river system is far from being
described completely. The major drawbacks of the model are as follows:
Figure 7. Sensitivity Analysis of model for the with- and without-dam scenarios; (A) weight of adult walleye; (B) maximum egg density;(C) adult walleye migration, in percent of the Lake Erie population for each year
Copyright # 2006 John Wiley & Sons, Ltd. River Res. Applic. 22: 837–851 (2006)
EFFECTS OF DAM REMOVAL 849
The number of adult walleyemigrating into the river was estimated based on Lake Erie fish harvest since no other
data were available. Therefore, the model compares the larval walleye population with and without the dam rather
than predicting the exact population. If new information on walleye migration were collected, the model could
provide details on site-specific walleye spawning and larval walleye drifting.
The model could be improved by refining the relationship between spawning habitat suitability and spawning
rate for a better estimate of the number of eggs produced, which would result in a better simulation of larval walleye
production. Larval walleye growth and feeding are not considered in this model because of insufficient data. The
average value of the natural larval mortality was evaluated using water pH and ammonia (NH3–NHþ4 ), however,
since few data exist on water quality in the reservoir sediments, we only considered the effects of water quality in
the water column, rather than the effects of re-suspended toxins. Finally, for the without-dam scenario, it was
assumed that sediment transported from the reservoir would destroy spawning substrate downstream of the dam
over the 5-year period of the simulations. This assumption has been supported by the work of Evans et al. (2002),
who suggest that, for daily average flows, the fine sediments in the reservoir require years to be dispersed to the
Lake. By quantifying toxins in the sediment behind the dam and constructing a water quality sub-model linked to a
sediment transport module, our model could provide the details of changes in both downstream water quality and
downstream substrate level.
CONCLUSIONS
The removal of the Ballville dam and consequently the access of additional spawning habitat for walleye upstream,
could significantly increase the larval output to Lake Erie, providing spawning habitat is limiting. Unfortunately,
the number of adults spawning in the river is unknown, although the model predicts that this is the dominant
parameter for larval output. The combination of dam removal and management actions could further enhance the
river fishery.
ACKNOWLEDGEMENTS
We thank Constance Livchak, Scudder Mackey and RyanMurphy from the Ohio Department of Natural Resources,
Division of Geological Survey for providing the substrate maps. We also thank Elizabeth Marschall for statistical
advice and Andrew Gascho-Landis for comments on the manuscript. This project was funded by the US Geologic
Survey and the Ohio State University Water Resources Center.
REFERENCES
Auer MT, Auer NA. 1990. Chemical suitability of substrates for walleye egg development in the lower Fox river, Wisconsin. Transactions of the
American Fisheries Society 119: 871–876.
Bednarek AT. 2001. Undamming rivers: A review of the ecological impacts of dam removal. Environmental Management 27: 803–814.
Benstead JP, March JG, Pringle CM, Scatena FN. 1999. Effects of a low-head dam and water abstraction on migratory tropical stream biota.
Ecological Applications 4: 656–668.
Bovee KD, Lamb BL, Bartholow JM, Stalnaker CB, Taylor J, Henriksen J. 1998. Stream habitat analysis using the instream flow incremental
methodology. U.S. Geologic Survey, Biological Resources Division Information and Technology Report USGS/BRD-1998-0004. viii þ131 pp.
Corbett BW, Powles PM. 1986. Spawning and larval drift of sympatric walleyes and white suckers in an Ontario stream. Transactions of the
American Fisheries Society 115: 41–46.
Doyle MW, Stanley EH, Harbor JM. 2003. Channel adjustments following two dam removals in Wisconsin. Water Resources Research 39(1),
1011, doi:10.1029/2002WR001714.
Evans JE, Levine NS, Roberts SJ, Gottgens JF, Newman DM. 2002. Assessment using GIS and sediment routing of the proposed removal of
Ballville Dam, Sandusky River, Ohio. Journal of the American Water Resources Association 38: 1549–1565.
Geiling WD, Kelso JRM, Iwachewski E. 1996. Benefits from incremental additions to walleye spawning habitat in the Current River, with
reference to habitat modification as a walleye management tool in Ontario. Canadian Journal of Fisheries and Aquatic Sciences 53(Suppl. 1):
79–87.
Gore J, Nestler J. 1988. Instream flow studies in perspective. Regulated Rivers: Research and Management 2: 93–101.
Copyright # 2006 John Wiley & Sons, Ltd. River Res. Applic. 22: 837–851 (2006)
850 F. CHENG ET AL.
Graf WL. 1999. Dam nation: a geographic census of American dams and their large-scale hydrologic impacts. Water Resources Research 35:
1305–1311.
Grant G. 2001. Dam removal: panacea or Pandora for rivers? Hydrological Processes 15: 1531–1532.
Hannon BM, Ruth M. 1997. Modeling Dynamic Biological Systems. Springer: New York.
Iguchi K, Mizuno N. 1999. Early starvation limits survival in amphidromous fishes. Journal of Fish Biology 54: 705–712.
Jager HI, Cardwell HE, Sale MJ, Beverlhimer MS, Coutant CC, VanWinkel W. 1997. Modelling the linkages between flow management and
salmon recruitment in streams. Ecological Modelling 103: 171–191.
Jaworska JS, Rose KA, Barnthouse W. 1997. General response patterns of fish populations to stress: an evaluation using an individual-based
simulation model. Journal of Aquatic Ecosystem Stress and Recovery 6: 15–31.
Jensen AL. 1992. Relation between mortality of young walleye (Stizostedion vitreum) and recruitment with different forms of compensation.
Environmental Pollution 76: 177–181.
Jones ML, Netto JK, Stockwell JD, Mion JB. 2003. Does the value of newly accessible spawning habitat for walleye (Stizostedion vitreum)
depend on its location relative to nursery habitats? Canadian Journal of Fisheries and Aquatic Sciences 60: 1527–1538.
Kanehl PD, Lyons J, Nelson JE. 1997. Changes in the habitat and fish community of the Milwaukee River, Wisconsin, following removal of the
Woolen Mills Dam. North American Journal of Fisheries Management 17: 387–400.
Kareiva P, Marvier M, McClure M. 2000. Recovery and management options for spring/summer Chinook salmon in the Columbia River basin.
Science 290: 977–979.
Kondolf GM, Larsen EW, Williams JG. 2000. Measuring and modeling the hydraulic environment of assessing instream flows. North American
Journal of Fisheries Management 20(4): 1016–1028.
Krise WF, Meade JW. 1986. Review of the intensive culture of walleye fry. Progressive Fish Culturist 48: 81–89.
Lamouroux N, Capra H, PouillyM. 1998. Predicting habitat suitability for lotic fish: linking statistical hydraulic models with multivariate habitat
use models. Regulated Rivers: Research and Management 14: 1–12.
Leach JH, Nepszy SJ. 1976. The fish communities of Lake Erie. Journal of the Fisheries Research Board of Canada 33: 622–638.
Leclerc M, Boudreau P, Bechara JA, Belzile L. 1996. Numerical method for modelling spawning habitat dynamics of landlocked salmon, Salmo
Salar. Regulated Rivers: Research and Management 12: 273–285.
LiawWK. 1991. Habitat suitability criteria for walleye spawning and egg incubation in Saskatchewan. Fisheries Technical Report 91(1): 22–24.
Ligon FK, Dietrich WE, Thrush WJ. 1995. Downstream ecological effects of dams. BioScience 45: 183–192.
McElman JF, Balon EK. 1979. Early ontogeny of walleye, Stizostedion vitreum, with steps of salutatory development. Environmental Biology of
Fishes 4: 309–348.
Mion JB, Stein RA, Marschall EA. 1998. River discharge drives survival of larval walleye. Ecological Applications 8: 88–103.
Ohio Department of Natural Resources (ODNR). 1998. Ohio’s Lake Erie Fisheries: pp 35–45.
Ohio Department of Natural Resources (ODNR). 1999. Ohio’s Lake Erie Fisheries: pp 59.
Paragamian VL. 1989. Seasonal habitat use by walleye in a warmwater river system, as determined by radiotelemetry.North American Journal of
Fisheries Management 9: 392–401.
Peterman RM, Bradford MJ. 1987. Statistical power of trends in fish abundance. Canadian Journal of Fisheries and Aquatic Sciences 44: 1879–
1899.
Ponton D, Merigoux S, Copp GH. 2000. Impacts of a dam in the neotropics: what can be learned from young-of-the-year fish assemblages in
tributaries of the River Sinnamary (French Guiana, South America) Aquatic Conservation: Marine and Freshwater Ecosystems 10: 25–51.
Roseman EF, TaylorWW, Hayes DB, Haas RC, Knight RL, Paxton KO. 1996.Walleye egg deposition and survival on reefs inWestern Lake Erie
(USA). Annales Zoologici Fennici 33: 341–351.
Shuman JR. 1995. Environmental considerations for assessing dam removal alternatives for river restoration. Regulated Rivers: Research and
Management 11(3-4): 249–261.
Spence R, Hickley P. 2000. The use of PHABSIM in the management of water resources and fisheries in England and Wales. Ecological
Engineering 16: 153–158.
US Geological Survey database: http://www.usgs.gov.
VanderKooy SJ, Peterson MS. 1998. Critical current speeds for young gulf coast walleyes. Transactions of the American Fisheries Society 127:
137–140.
Ward JV, Stanford JA. 1979. The Ecology of Regulated Streams. Plenum Press: New York.
Winston MR, Taylor CM. 1991. Upstream extirpation of four minnow species due to damming of a prairie stream. Transactions of the American
Fisheries Society 120: 98–105.
Wunderlich RC, Winter BD, Meyer JH. 1994. Restoration of the Elwha River Ecosystem. Fisheries 19(8): 11–20.
Copyright # 2006 John Wiley & Sons, Ltd. River Res. Applic. 22: 837–851 (2006)
EFFECTS OF DAM REMOVAL 851
Copyright © 2022 FDOKUMEN