Red, White, and Blue Eggs as Models of Porphyrin and Heme Metabolism
19
RED, WHITE, AND BLUE EGGS AS MODELS OF PORPHYRIN AND HEME METABOLISM* Samuel Schwartz, Betty D. Stephenson, Durriya H. Sarkar, and Miguel R. Bracho Department of Medicine College of Medical Sciences University of Minnesota Minneapolis, Minnesota 55 455 In a recent general notice sent to participants in this conference our chairman, Dr. Adler, appended a personal postscript: “Dear Sam, 1 want to officially encourage you to open with a poem. . . .” So, in humble obedience, and with much trepidation, I invite you to join with me in words that paraphrase another “red, white, and blue” song? many of us knew as youngsters. Ode to Red, White, and Blue Eggs There are many breeds of multicolored hens; They lay eggs of every hue. Their uteri filled with pyrrolic pens Paint the shells red, white, and blue! So ask not “what came first, chick’n or egg?” Nor “what can either one d o for you?” Seek life’s mystery of porph’rin and bile pigment, It is bound up in the red, white, and blue! A fascinating discussion of “The Races of Domestic Fowl” appeared almost one-half century ago in the National Geographic magazine. Among the numerous paintings shown are those of three breeds of hens that we have included in our studies because they illustrate the diversity of shell pigment- ation: (1) the Rhode Island Red hen, which lays red-brown eggs; (2) the White Leghorn hen (called “the greatest egg-laying machine in the poultry world”), which lays white eggs; and (3) the less well known Araucana hen, which lays eggs that range in color from deep blue to light green.$ It is clear that color of egg shells is determined by a mixture of pigments. In an extensive study undertaken about 100 years ago, Sorby3 extracted shell * This investigation was supported in part by United States Public Health Service Grants AM-12466 and AM-02096 from the Institute of Arthritis, Metabolism, and Digestive Diseases, and by a Public Health Service Research Career Award (GM-14086) from the National Institute of General Medical Sciences to Samuel Schwartz. t With apologies to M. H. Howliston, author of “Our Flag.” $ This South American hen is most common in Chile, and derives its name from the Arauco (or Araucania) district of that country. According to Finsterbusch2 in 193 1, these “fowl . . . produce about 94 per cent of all the eggs that are sent to market in Chile.” Its origin(s) are uncertain, although some believe it antedated the arrival of the Spaniards and the introduction of European chickens by Cortez. The many types of Araucana hens available today result from innumerable hybrid crossmatches. 570
-
Upload
independent -
Category
Documents
-
view
3 -
download
0
Transcript of Red, White, and Blue Eggs as Models of Porphyrin and Heme Metabolism
RED, WHITE, AND BLUE EGGS AS MODELS OF PORPHYRIN AND HEME METABOLISM*
Samuel Schwartz, Betty D. Stephenson, Durriya H. Sarkar, and Miguel R. Bracho
Department o f Medicine College of Medical Sciences
University of Minnesota Minneapolis, Minnesota 55 455
In a recent general notice sent t o participants in this conference our chairman, Dr. Adler, appended a personal postscript: “Dear Sam, 1 want to officially encourage you to open with a poem. . . .” So, in humble obedience, and with much trepidation, I invite you to join with me in words that paraphrase another “red, white, and blue” song? many of us knew as youngsters.
Ode to Red, White, and Blue Eggs
There are many breeds of multicolored hens; They lay eggs of every hue. Their uteri filled with pyrrolic pens Paint the shells red, white, and blue!
So ask not “what came first, chick’n or egg?” Nor “what can either one d o f o r you?” Seek life’s mystery of porph’rin and bile pigment, I t is bound up in the red, white, and blue!
A fascinating discussion of “The Races of Domestic Fowl” appeared almost one-half century ago in the National Geographic magazine. Among the numerous paintings shown are those of three breeds of hens that we have included in our studies because they illustrate the diversity of shell pigment- ation: ( 1 ) the Rhode Island Red hen, which lays red-brown eggs; (2) the White Leghorn hen (called “the greatest egg-laying machine in the poultry world”), which lays white eggs; and (3) the less well known Araucana hen, which lays eggs that range in color from deep blue t o light green.$
It is clear that color of egg shells is determined by a mixture of pigments. In an extensive study undertaken about 100 years ago, Sorby3 extracted shell
* This investigation was supported in part by United States Public Health Service Grants AM-12466 and AM-02096 from the Institute of Arthritis, Metabolism, and Digestive Diseases, and by a Public Health Service Research Career Award (GM-14086) from the National Institute of General Medical Sciences to Samuel Schwartz.
t With apologies to M. H. Howliston, author of “Our Flag.” $ This South American hen is most common in Chile, and derives its name from the
Arauco (or Araucania) district of that country. According to Finsterbusch2 in 193 1, these “fowl . . . produce about 94 per cent of all the eggs that are sent to market in Chile.” Its origin(s) are uncertain, although some believe it antedated the arrival of the Spaniards and the introduction of European chickens by Cortez. The many types of Araucana hens available today result from innumerable hybrid crossmatches.
570
Schwartz et al. : Egg Models of Porphyrin 57 1
pigments from many avian species and subjected the extracts t o careful spectroscopic analysis. He defined properties of seven distinct pigments. The major pigment, obtained from red t o brown eggs, was named “oorhodeine.” Its spectroscopic properties in acid and neutral solution were clearly those now ascribed t o protoporphyrin. He also noted the similarity of these spectra t o those of “cruentine” (now termed “hematoporphyrin”), prepared by Thudicum by treatment of blood with sulfuric acid. Two blue-green pigments, with properties of (“verdin-type”) bile pigments were termed “oocyan” and “banded oocyan.” Properties of other yellow and orange pigments were also described.
Fischer and K0g1495 crystallized the red egg shell pigment, named it “ooporphyrin,” and later established its identity with the hemoglobin por- phyrin, protoporphyrin. Of more than 20 species studied, shells of all but one showed a t least trace amounts of this porphyrin.
My scientific introduction t o the field of egg shell pigments came in the mid-1950s from Dr. Norman Helbacka, then a graduate student in Poultry Science. His thesis problem6-S dealt largely with so-called “meat spots” found sometimes in eggs, and especially with their variable red-brown color. Working with him, I learned a t least three things: (1) The pigment of “meat spots” was not hemoglobin or some derivative, as was then generally believed; it was protoporphyrin, with trace amounts of coproporphyrin. (2) The content of porphyrin in these “spots”, as expected from earlier report^,^ correlated well with the amount of red-brown pigment in the egg shell and in the uterus of the laying hen. Colored photographs taken by Helbacka under near-ultraviolet light’ showed a brilliant red fluorescence limited to the uterine portion of the oviduct and to a few scattered “meat spots.” (3) A recently introduced coccidiostat,§ Nicarbazin (Merck),”- ’ * markedly reduced the intensity of red fluorescence in the “meat spots” of brown egg-layers just as it changed the shell color from red-brown t o white within three to four days7 After Nicarbazin feeding was discontinued, the normal shell fluorescence and red-brown color returned within about four days.
These effects of Nicarbazin were of special interest t o us because of rapidly expanding studies then on the use of so-called “porphyrinogenic” chemicals such as Sedormidm), allylisopropylacetamide (AIA), or 3,5-dicarbethoxy-l,4-dihydro- collidine (DDC) t o induce experimental porphyria. The mechanism of Nicar- bazin’s action was (and apparently still is) unknown. Its apparent inhibition of porphyrin synthesis in the uterus, however, suggested the intriguing possibility that under appropriate conditions it might also counteract the stimulation of porphyrin synthesis by porphyrinogenic agents or even by the factors respon- sible for the human porphyrias. This would seem t o be unlikely, however, because of the marked tissue specificity exhibited by porphyrinogenic com- pounds. If Nicarbazip showed similar specificity, it would not likely affect the liver or bone marrow as it does the uterus, Polin supported this latter view in 1959,’* showing that Nicarbazin feeding did not prevent elevation of erythrocyte coprc- or protoporphyrin levels in the regenerative phase following bleeding. Neither did i t affect the formation of porphyrin from 6-aminolevulinic acid (ALA) incubated with homogenates of uterus or of other portions of the hen’s oviduct or intestine. Other antagonisms, however, were still possible.
5 Coccidiosis infection is a major source of disease in chickens. The mechanism of action of Nicarbazin on the coccidia is unknown. Its possible effect on porphyrin or heme synthesis in this organism has apparently not been studied.
572 Annals New York Academy of Sciences
Despite its interest, this problem was set aside while we developed a broader perspective of hens and eggs, and of their possible implications for the study of porphyrins, hemes, and bile pigments. Some of this additional background information will be considered briefly.
Some pertinent facts on the anatomy and physiology of egg laying have been summarized recently by Taylor.l3l1 Eggs are layed during daylight hours on an approximately 24 hour cycle. Stimulated by onset of darkness, pituitary hormones are released which result in ovulation six t o eight hours later. From the single ovary, the egg (yolk) passes through successive portions of the oviduct: ( 1 ) the infundibulum, where fertilization may take place; (2) the magnum, where albumen is added over a period of about four hours; (3) the isthmus, where the two membranes are formed; and (4) the uterus. The egg is enlarged by entry of water and salts through the membrane during the approximately first five hours in the uterus, while calcification takes place during the following 15 t o 16 hours. (During this time, approximately 10% of the total body calcium is deposited in the shell.) Another membrane, the cuticle, is deposited around the egg shortly before i t is layed.
With the above information in mind, we may summarize some special features of and advantages to the study of porphyrins and bile pigments in hens, as follows:
1. Egg laying: The short time intervals in the cycles of egg laying and the ready accessibility of the eggs make this a potentially valuable model for studies on the regulation of porphyrin biosynthesis by steroid hormones (or other agents), as discussed in recent reports.’ 6 , 1 It is recognized, however, that the many cyclic phenomena associated with egg laying d o not necessarily indicate corresponding cycles in biosynthesis of pyrrole compounds. Although accumula- tion of bile pigment (“uteroverdin”) has been reported in dog uteri,’8,19 fowl seem t o be somewhat unique in the abundance of porphyrin and/or bile pigment, separately or together, in this organ. Regulation at various levels of porphyrin, heme, and bile pigment synthesis is obviously involved. The additional value of chick embryo studies need not be emphasized here.
2. The presence of the cloaca, a common excretory tract, greatly simplifies collection of excreta. Analysis of this relatively solid pool defines total excretory values of pigments. When these are labelled isotopically, the total excretory pattern thus obtained has rarely been achieved in other animal studies.
3. The nucleated circulating erythrocytes present normally in fowl may pose special problems. The relatively short survival time of these cells (about 25 days20) must also be considered.
Our current studies have aimed especially at obtaining answers t o the following types of questions in each of the breeds of hen studied:
1. What are the normal levels of (a) porphyrin content in tissues, including red cells, liver, kidney, uterus, and egg shells, and of (b) daily porphyrin excretion?
2. In the same tissues, what are the normal levels of porphyrin-synthesizing enzymes including (initially) ALA synthetase, ALA dehydratase, and heme syn thetase?
II This review deals especially with the egg shell and calcium metabolism. I t does not mention porphyrins or bile pigments. More extensive discussions of endocrine control and other aspects of egg laying are presented elsewhere.14,15
Schwartz et al. : Egg Models of Porphyrin 573
3. How are the above levels of porphyrin and enzymes affected by porphyrinogenic agents including AIA and DDC, and how are they modified by Nicarbazin, given alone or in conjunction with porphyrinogenic agents? 4. Following simultaneous administration of ALA-3H and glycine-' 4C, will
isotopic analysis of isolated pigments help interpret biosynthetic abnormalities in erythropoietic and nonerythropoietic tissues of treated hens (or in similarly treated human or other animal subjects)? This question was especially relevant because of radically new interpretations of isotope data proposed recently.2 , 2 2
5. How d o endocrine and related factors influence formation and deposition of shell pigments?
Studies in each of these areas are still in progress and will be reported with varying degrees of completeness. Studies of endocrine control of porphyrin biosynthesis in the oviduct have not yet begun.
MATERIALS AND METHODS
Hens
Sixty-two hens have been studied t o date. These include 19 White Leghorns (white eggs), 18 Rhode Island Reds plus 16 Silver Linked (brown eggs), and 6 Araucanas plus 4 hybrids from Rhode Island Red: Araucana breeding (blue- green eggs). They were housed individually and fed an all mash breeder (AMB) diet free of antibiotics, coccidiostat, or other drugs. Total excreta from each hen were pooled in consecutive t w o t o five day periods. Blood was generally obtained from a wing vein.
Compounds Administered
NicarbazinfT was well mixed with the food to yield a concentration of 0.015 t o 0.02% in the different studies. It was fed ad lib. With an estimated average daily food intake of 100 t o 125 g, the daily dose of Nicarbazin would be roughly 40 mg. (In the initial studies, a suspension of Nicarbazin, 150 mg/ml, was injected subcutaneously or intramusculary in the vehicle described below).
AIA (Hoffmann-La Roche, Inc., Nutley, N.J.) and DDC (Eastman Organic Chemicals, Rochester, N.Y.) were suspended in a 4: 1 : s mixture of propylene glycol, 95% alcohol, and H 2 0 (added in the order given). Each of these fairly stable suspensions contained 75 mg of compound per ml.
Lead acetate (Pb-acetate.3H20, Baker) was dissolved in H 2 0 a t a concentra- tion of 47.1 mg compound (30 mg Pb) per ml. Phenylhydrazine-HC1 was dissolved in saline solution. It was brought to pH about 4.5 by addition of NaOH.
ll This material is a complex of two chemicals, 4,4'dinitrocarbanilide (DNC) and 2-hydroxy4,6dimethylpyrimidine (HDP). Given individually, DNC is the more active of the two. The effects of these materials and of a number of related compounds on egg shell pigmentation have been described by Polin, Basso, and O'Neill.Z3
574 Annals New York Academy of Sciences
These compounds were given daily for periods of 10- 13 days. G l y ~ i n e - 2 ~ ~ C (New England Nuclear, 24 pg per pCi) and ALA 2,33H
(7mCi/pmol) were dissolved in saline solution. A total of 10.36 x lo6 dpm of 3H and 7.34 x l o 6 dpm of 14C in two ml were injected subcutaneously in a single dose in each of 12 Silver Linked hens.
A naly tica 1 Methods
Analysis and Isolation of Porphyrins and Bile Pigments
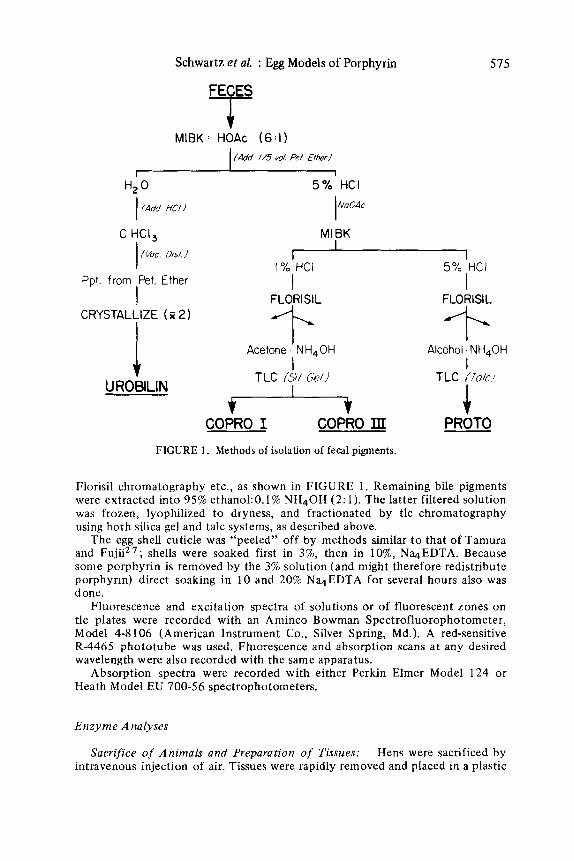
The new methods used will be reported in detail elsewhere. The general features, summarized in FIGURE 1, have been used in both hen and human22 studies.
The preliminary extraction and separation of copro- and protoporphyrin fractions from red blood cells, tissues, and excreta followed our usual p r ~ c e d u r e , ’ ~ except that fecal extraction employed methyl isobutyl ketone (MIBK) rather than ethyl acetate.** Total porphyrin concentration was determined fluorimetrically in the first HCl extract. For isomer, isotope, and other special analyses, this HC1 was neutralized with an excess of sodium acetate and the porphyrins were recycled through MIBK for preliminary separation of copro- and protoporphyrin. Following adsorbtion from 5% HCI on a Florisil@ column, greater purification and more complete separation of 2-carboxyl from 4-carboxyl compounds were achieved b y successive elution with a 1 : 12 mixture of acetone:O. 1% N H 4 0 H and of a 2: 1 mixture of ethano1:O. 1% HN40H after prior washing with 0.1% HC1, 10% acetic acid:95% ethanol (3: l ) , HzO, and 1% NH40H. (This N H 4 0 H removes uroporphyrin and other pigments.) Eluates were frozen, lyophilized to a small volume and applied as 1 to 1 4 cm streaks t o plates of either silica gel25 or of talcz6 for purification of coproporphyrins I and I11 and of protoporphyrin. For large samples, it was necessary to dissolve the dried eluates from Florisil in 95% ethanol: 1% NH40H (4: I), refilter, and concentrate again prior t o thin-layer chromatography (tlc). The latter solvent mixture was also preferred for elution of porphyrins from the tlc plates. (Note: All solutions that contained NH40H also had 2 pg per ml of Na4EDTA to inhibit formation of metal complexes.)
The above complete fractionation emphasized again the limitations imposed by defining porphyrins as “coproporphyrin” and “protoporphyrin” after the solvent extractions, and even after the Florisil column chromatography. Several additional minor porphyrin bands are seen in the silica gel plate, while eight or more intense bands regularly accompany the protoporphyrin on the talc plate. Isotopic analysis has included the individually separated bands that appear just above and below the protoporphyrin.
(The isolations of urobilin from hens, shown in FIGURE 1, are currently in progress and will not be considered further here).
Egg shell porphyrins were extracted by 20% HC1 from the HIO-washed shells. Total porphyrin was assayed fluorimetrically. Further purification was by
** Porphyrins extracted from ethyl acetate by HC1 undergo significant partial esterification, leading to a number of confusing porphyrin zones on subsequent paper or thin-layer chromatography. (Details to be described elsewhere.)
Schwartz et al. : Egg Models of Porphyrin
T MIBK: HOAc (6~1)
I /Add I15 vol. Pel Erk r l
575
I
H2O I (Add HCI J
5 % HCI INoOAc
C HCI, MI BK
/VOC. D1st.l I I I
I % HCI 5% HCI I Ppt. from ,Pet. Ether
I CRYSTALLIZE ( i i 2)
I FLORl Sl L + I Acetone ‘NH,OH Alcohol NH4OH
TLC /s// Ge/l I
COPRO I COPRO III PROTO
FIGURE 1. Methods of isolation of fecal pigments.
Florisil chromatography etc., as shown in FIGURE 1. Remaining bile pigments were extracted into 95% ethanol:O.l% NH40H (2: 1). The latter filtered solution was frozen, lyophilized t o dryness, and fractionated by tlc chromatography using both silica gel and talc systems, as described above.
The egg shell cuticle was “peeled” off by methods similar t o that of Tamura and FujiiZ7; shells were soaked first in 3%, then in lo%, Na4EDTA. Because some porphyrin is removed by the 3% solution (and might therefore redistribute porphyrin) direct soaking in 10 and 20% Na4EDTA for several hours also was done.
Fluorescence and excitation spectra of solutions or of fluorescent zones on tlc plates were recorded with an Aminco Bowman Spectrofluorophotometer, Model 4-8 106 (American Instrument Co., Silver Spring, Md.). A red-sensitive R-4465 phototube was used. Fluorescence and absorption scans a t any desired wavelength were also recorded with the same apparatus.
Absorption spectra were recorded with either Perkin Elmer Model 124 or Heath Model EU 700-56 spectrophotometers.
Enzyme Analyses
Sacrifice of Animals and Preparation o f Tissues: Hens were sacrificed by intravenous injection of air. Tissues were rapidly removed and placed in a plastic
576 Annals New York Academy of Sciences
bag immersed in ice water. Total weight was determined, and two samples weighing approximately 1 and 2 g, respectively, were rapidly frozen. Homogeniz- ation of the 1-g sample (and lysis of the freshly drawn whole blood) were carried out within one t o two hours after sacrifice for assay of heme synthetase and ALA dehydratase activities as described below. The 2-g samples remained frozen at -13’C (usually for one day) before analysis of ALA synthetase.
Details of the modified method used will be reported elsewhere. Approximately 1 g of tissue was homogenized with 6 volumes of 0.2% Triton X-100. Aliquots were added t o 5 volumes of a Tris buffer solution (36.3 mg/ml, pH 7.8). T o 1 ml of this diluted sample were added 0.5 ml each of freshly prepared (a) reduced glutathione (7.37 mg per ml in HzO), (b) FeS04 (0.133 mg FeS04.7H20 per ml H 2 0 ) , and (c) mesoporphyrin ( 2 0 p g of ammonium salt dissolved per ml of Tris buffer for liver and uterus, and 40 pg per ml for kidney homogenates, respectively). Less dilution was used for whole blood; 0.2 ml were added to 0.5 ml of cold 0.2% Triton X-100. After five minutes, 0.8 ml of Tris buffer and 0.5 ml of the aforementioned three solutions were added. The total sample in 2 t o 3 ml was placed in an 8 ml stoppered “Vacutainer” tube. A needle passed through the rubber stopper led through a two-way stopcock t o either water suction or t o a N 2 tank (0.01% 0 2 ) . This permitted alternate degassing and, N2-flushing for a total of five times. At “0” time, and after incubation a t 37 C for 3 0 minutes and one hour, the enzyme reaction was stopped by addition of 3 ml of 5% HCl containing 0.01% Cetramide (hexadecyltrimethylammonium bromide). Samples were diluted further with 5% HCl:O.Ol% Cetramide for direct fluorimetric analysis. Diluted tissue solutions were completely clear and essentially colorless. Red cell homogenates, however, were first centrifuged in most cases after addition of acid-washed Celite. Results were calculated as the decrease in pg (or pmol) of mesoporphyrin per gram of tissue (or ml of red blood cells calculated from the hematocrit value) per hour of incubation.
A L A Dehydrutuse. The method used was essentially that described by Burch and Siegel.28 An aliquot of the same Triton X-100 homogenate used for the heme synttetase assay was added t o the buffered ALA substrate and incubated a t 37 C for one hour. The enzyme reaction was stopped by addition of 10% trichloracetic acid (tca) containing 0.25% N-ethylmaleimide. The amount of porphobilinogen (PBG) formed in duplicate samples was determined from the color of the PBG aldehyde formed by adding modified Ehrlich’s reagent t o an equal volume of tca filtrate.
The aforementioned t w o analyses, with n o purification of substrate (meso- porphyrin) or of product (PBG) required, permit one individual t o complete both in a t least ten tissues per day.
A L A Synthetase. The general method used was that of Marver and associates.29 T w o grams of tissue were homogenized with three volumes (6 ml) of Naz EDTA-Tris buffer, pH 7.4 ( 18.6 mg Na2 EDTA plus 12 1.1 mg Tris in l 0 0 m l of 0.9% NaC1). Three volumes of “incubation solution” were added. (The latter solution contained 1 .O g glycine, 0.5 g Na2EDTA, 1.21 g Tris, 6.6 mg pyridoxal phosphate, and HCl t o bring to pH 7.2 in a total volume of 100 ml.) Eigoht- to 10-ml portions in 50 ml Ehrlenmeyer flasks were incubated in air a t 37 C. Flasks were shaken gently 80 times per minute. Reactions were stopped a t 0, 60, or 120 minutes by addition of 1 /4 volume of 25% tca.
Further treatment involved one to all four of the following procedures: After bringing t o pH 6.0, ALA pyrrole was formed by heating with acetyl acetone at 75OC for 40-50 minutes. The colored aldehyde was formed by addition of modified Ehrlich’s reagent, either directly or after further purification on a
Heme Synthetuse.
Schwartz et al. : Egg Models of Porphyrin 577
Dowex 1 X-8 resin.30 ALA was purified on a Dowex 50 X-8 column prior t o preparation of ALA pyrrole with acetyl acetone.31 This pyrrole, again, was either treated directly with modified Ehrlich’s reagent for analysis, o r was purified further on a Dowex 1 X-8 column before adding Ehrlich’s reagent. In addition t o the usual spectrophotometric analysis a t 555 nm, complete spectra were recorded from about 450 t o 650 nm for several dozen samples. These showed that purest (but still imperfect) spectra were obtained by heating gently with acetyl acetone.
Despite considerable effort, results with all four of these methods were very discouraging. Their insensitivity and poor reproducibility made it impossible t o draw significant conclusions, especially as regards any possible lowering by Nicarbazin of this already very low enzyme activity. Discussion of this enzyme system will therefore be postponed until data are available from a more sensitive isotopic method. t t
Isotope Studies
Isolation and quantitative analysis of excreted coproporphyrins I and 111 and of protoporphyrin have been completed, bu t 3H and I 4 C analyses are still in progress. These isotope studies will therefore not be considered further a t this time, except t o note that isotopic labelling in these hens was quite different from that seen in human subjects.
Presentation of Data
Values given in the tables for the various treatment groups are for tissue samples obtained on the day of sacrifice (after 1 0 t o 13 days’ treatment) or for other samples obtained after treatment for a week or more.
All enzyme data presented are based on averages of two or more values for each hen. Values are omitted from the tables where duplicates showed unsatisfactory agreement. Many of the control red cell, egg shell, and excreta data are also averages of two or more samples.
RESULTS
Porp h yrin Con ten t
Eggs (Table 1 A )
Largest amounts of porphyrin (average, 71 pg/g) were found in shells of Rhode Island Red hens. With an average shell weight of 4 to 5 g, one shell thus had about half as much porphyrin as was excreted daily by these hens. No
tt Note added in proof Since submission of this paper, we learned that A. Poland and E. Glover also found that the method of Marver et al. is not applicable to chicken tissues. (1973. 2,3,7,8-Tetrachlorodibenzo-p-dioxin: A potent inducer of S-aminolevulinic acid synthetase. Science 179: 476-477.)
578 Annals New York Academy of Sciences
significant difference was found in porphyrin content of shells from Araucana and “hybrid” hens (average, 16 pg/g).
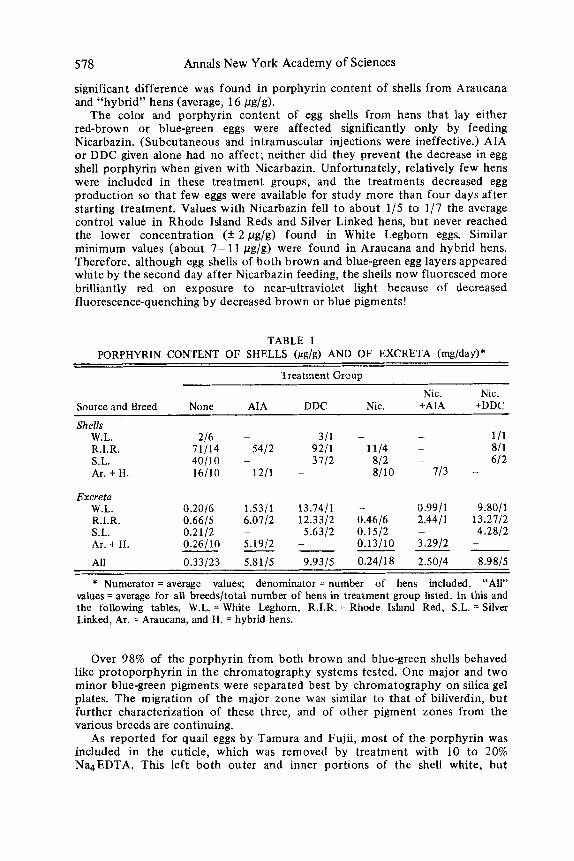
The color and porphyrin content of egg shells from hens that lay either red-brown or blue-green eggs were affected significantly only by feeding Nicarbazin. (Subcutaneous and intramuscular injections were ineffective.) AIA or DDC given alone had no affect; neither did they prevent the decrease in egg shell porphyrin when given with Nicarbazin. Unfortunately, relatively few hens were included in these treatment groups, and the treatments decreased egg production so that few eggs were available for study more than four days after starting treatment. Values with Nicarbazin fell to about 1/5 to 1/7 the average control value in Rhode Island Reds and Silver Linked hens, but never reached the lower concentration (i: 2pg/g) found in White Leghorn eggs. Similar minimum values (about 7- 11 pg/g) were found in Araucana and hybrid hens. Therefore, although egg shells of both brown and blue-green egg layers appeared white by the second day after Nicarbazin feeding, the shells now fluoresced more brilliantly red on exposure to near-ultraviolet light because of decreased fluorescence-quenching by decreased brown or blue pigments!
TABLE 1 PORPHYRIN CONTENT OF SHELLS (pg/g) AND OF EXCRETA (mg/day)*
Treatment Group
Nic. Nic. Source and Breed None AIA DDC Nic. +AIA +DDC
Shells W.L. 216 - 311 - - 1/1 R.I.R. 11/14 5412 9211 1114 - 811 S.L. 40110 - 3112 812 - 612 Ar. + H. 16/10 1211 - 8/10 113 -
Excreta W.L. 0.20/6 1.5311 13.7411 - 0.9911 9.8011 R.I.R. 0.6615 6.0712 12.3312 0.4616 2.4411 13.2112 S.L. 0.2112 - 5.6312 0.1512 - 4.28/2 Ar. + H. All 0.33123 5.8115 9.9315 0.24/18 2.5014 8.9815
* Numerator = average values; denominator = number of hens included. “All” values = average for all breedsltotal number of hens in treatment group listed. In this and the following tables, W.L. = White Leghorn, R.I.R. = Rhode Island Red, S.L. = Silver Linked, Ar. = Araucana, and H. = hybrid hens.
0.26110 5.1912 - 0.13110 3.2912 - - - - - - -
Over 98% of the porphyrin from both brown and blue-green shells behaved like protoporphyrin in the chromatography systems tested. One major and two minor blue-green pigments were separated best by chromatography on silica gel plates. The migration of the major zone was similar to that of biliverdin, but further characterization of these three, and of other pigment zones from the various breeds are continuing.
As reported for quail eggs by Tamura and Fujii, most of the porphyrin was included in the cuticle, which was removed by treatment with 10 to 20% Na4EDTA. This left both outer and inner portions of the shell white, but
Schwartz et al. : Egg Models of Porphyrin 579
intensely red-fluorescing. In contrast, similar treatment of blue-green eggs removed brown but only a minor portion of blue pigment by the cuticle. Following its removal, the inner part of the shell appeared deeper blue than the outer portion.
Excreta (Table I B )
By both solvent extraction and Florisil and tlc chromatography, the large majority of excreted porphyrin behaved like (2-carboxyl) protoporphyrin. Average daily content in untreated Rhode Island Reds was two t o three times higher than in the other breeds studied. In individual samples, elevated values appeared to be associated with the finding of numerous small chunks of mucus-like, highly fluorescing material in the feces. These appeared t o be similar t o those seen in the oviducts of these birds.
In the three breeds on whom results are available, Nicarbazin feeding was associated with a moderate decline in per diem values. DDC injection was followed by the greatest increases, averaging in a!l groups 9.9 mg per day compared to average control values of 0.3 mg per day. Somewhat lesser increases (average 5.8 mg/day) followed injection of AIA. Nicarbazin feeding did not significantly alter results with DDC, but values tended t o be lower with Nicarbazin plus AIA than with AIA alone in the few hens thus treated.
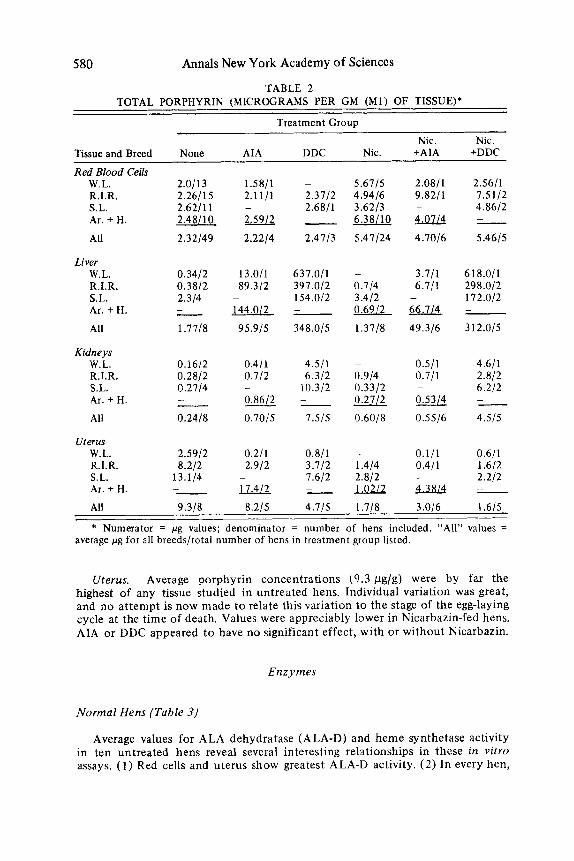
Tissues (Table 2 )
Small numbers of hens are included to date in some of the treatment groups. In such groups, results shown are t o be considered of preliminary value only.
Red Blood Cells. Feeding Nicarbazin resulted in a two t o four-fold increase in concentration of red cell porphyrin (almost all protoporphyrin), in contrast t o the decreased egg and fecal values. Average values in 49 untreated hens from all five breeds rose from 2.3 pg/ml t o an average of 5.5 pg/ml in 24 treated hens. This increase did not appear to be affected by simultaneous administration of AIA or of DDC. AIA or DDC given alone also had n o significant effect on red cell porphyrin values.
In the 10 Araucana and hybrid hens, average red cell porphyrin had risen to 4.27 pg/ml on the sixth day of Nicarbazin treatment and continued to increase t o the 6.38 pg/g value shown for day 13. O n discontinuing treatment, values generally fell about half way to normal after one week.
Hemoglobin and hematocrit values tended t o fall slightly during treatment with Nicarbazin, with some hens showing falls of 25% or more. Porphyrin concentration increased even without significant changes in these values. No ancillary studies of iron metabolism were made.
Greatest increases, t o over 600 pg/g, were found in hens treated with DDC. Lesser increases followed injection of AIA. Nicarbazin given alone appeared t o have n o effect. As in the case of fecal values, Nicarbazin given with AIA (but no t with DDC) seemed to be associated with some lowering of liver porphyrin concentration (average 49 vs. 96 pg/g).
An unexpected but consistent result was the finding of elevated renal porphyrin concentration in DDC-treated hens. The latter values averaged 7.5 pg/g compared t o a control average of 0.24 pg/g.
Liver.
Kidneys.
580 Annals New York Academy of Sciences
TABLE 2 TOTAL PORPHYRIN (MICROGRAMS PER GM ( M l ) OF TISSUE)*
Treatment Group
Nic. Nic. Tissue and Breed None AIA DDC Nic. +AIA +DDC
Red Blood Cells W.L. R.I.R. S.L. Ar. + H.
All
Liver W.L. R.I.R. S.L. Ar. + H.
All
Kidneys W.L. R.I.R. S.L. Ar. + H. All
Uterus W.L. R.I.R. S.L. Ar. + H.
2.011 3 2.26115 2.6211 1 2.48110
2.32149
0.3412 0.3812 2.314
1.7118
- -
0.1612 0.2812 0.2114
0.2418
- -
2.5912 8.212
13.114 - -
1.5811 - 5.6115 2.1111 2.3112 4.9416 - 2.6811 3.6213 u - 6.3 81 10
2.2214 2.4113 5.41124
13.011 631.011 -
89.312 397.012 0.714 - 154.012 3.412 144.0/2 - 0.6912
95.915 348.015 1.3118
0.411 4.511 ~
0.112 6.312 0.914 - 10.312 0.3312 0.86/2_ --
0.70/5 1.515 0.6018
0.211 0.811 -
2.912 3.712 1.414 - 1.612 2.812 17.4/2 - -La212
2.0811 2.5611 9.8211 7.5112 - 4.8612
4.7016 5.4615 m -
3.711 618.011 6.711 298.012 - 172.012
49.316 312.015
66.114 -
0.511 4.611 0.711 2.812 - 6.212
0.5516 4.515
--
0.111 0.611 0.411 1.612 - 2.212 e 1 & 1 4 -
All 9.318 8.215 4.115 1.718 3.016 1.615
* Numerator = pg values; denominator = number of hens included. “All” values = average pg for all breedsltotal number of hens in treatment group listed.
Uterus. Average porphyrin concentrations (9.3 pg/g) were by far the highest of any tissue studied in untreated hens. Individual variation was great, and no attempt is now made to relate this variation to the stage of the egg-laying cycle at the time of death. Values were appreciably lower in Nicarbazin-fed hens. AIA or DDC appeared t o have no significant effect, with or without Nicarbazin.
Enzymes
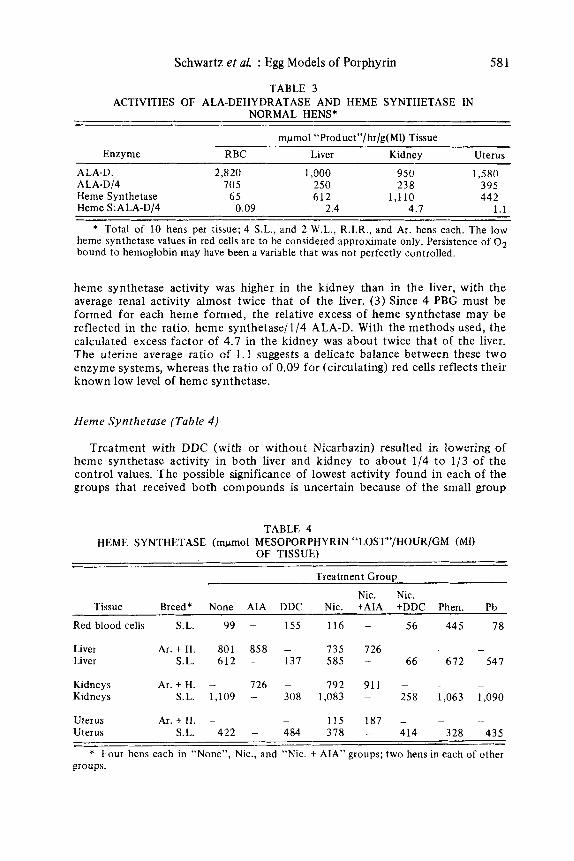
Normal Hens (Table 3)
Average values for ALA dehydratase (ALA-D) and heme synthetase activity in ten untreated hens reveal several interesting relationships in these in v i f r o assays. ( I ) Red cells and uterus show greatest ALA-D activity. ( 2 ) In every hen,
Schwartz ef al. : Egg Models of Porphyrin 58 1
TABLE 3
NORMAL HENS* ACTIVITIES OF ALA-DEHYDRATASE AND HEME SYNTHETASE IN
mpmol “Product”/hr/g(Ml) Tissue
Enzyme RBC Liver Kidney Uterus ALA-D. 2.8 20 1,000 950 1,580 ALA-D/4 705 250 238 395 Heme Synthetase 6 5 612 1,110 442 Heme S:ALA-D/4 0.09 2.4 4.7 1.1
* Total of 10 hens per tissue; 4 S.L., and 2 W.L., R.I.R., and Ar. hens each. The low heme synthetase values in red cells are to be considered approximate only. Persistence of O2 bound to hemoglobin may have been a variable that was not perfectly controlled.
heme synthetase activity was higher in the kidney than in the liver, with the average renal activity almost twice that of the liver. (3 ) Since 4 PBG must be formed for each heme formed, the relative excess of heme synthetase may be reflected in the ratio, heme synthetase/l/4 ALA-D. With the methods used, the calculated excess factor of 4.7 in the kidney was about twice that of the liver. The uterine average ratio of 1 .1 suggests a delicate balance between these t w o enzyme systems, whereas the ratio of 0.09 for (circulating) red cells reflects their known low level of heme synthetase.
Heme Synthetase (Table 4 )
Treatment with DDC (with or without Nicarbazin) resulted in lowering of heme synthetase activity in both liver and kidney t o about 1/4 t o 1/3 of the control values. The possible significance of lowest activity found in each of the groups that received both compounds is uncertain because of the small group
TABLE 4 HEME SYNTHETASE (mpmol MESOPORPHYRIN “LOST”/HOUR/GM (Ml)
OF TISSUE)
Treatment Group
Nic. Nic. Tissue Breed* None AIA DDC Nic. +AIA +DDC Phen. Pb
Red blood cells S.L. 99 - 155 116 - 5 6 445 7 8
Liver A r . + H . 801 858 - 735 726 - - - Liver S.L. 612 - 137 585 - 66 672 547
Kidneys Ar.+ H. - 726 - 792 911 - Kidneys S.L. 1,109 - 308 1,083 - 258 1,063 1,090
Uterus Ar. + H. - - - - 115 187 - Uterus S.L. 422 - 484 378 - 414 328 435
.~ -
* Four hens each in “None”, Nic., and “Nic. + AIA” groups; two hens in each of other groups.
582 Annals New York Academy of Sciences
sizes. DDC did not appear to affect this enzyme in the uterus or red cells. Contrary to expectations, values were not decreased significantly in any of the tissues tested from Pb-treated hens. The elevated value of this (mitochondrial) enzyme in red cells of phenylhydrazine-treated hens is expected from their elevated reticulocyte counts. Activity of this enzyme was not affected by treatment with Nicarbazin or with AIA given separately or together. (Note: Post-treatment enzyme studies were not done in Rhode Island Reds or in White Leghorn hens).
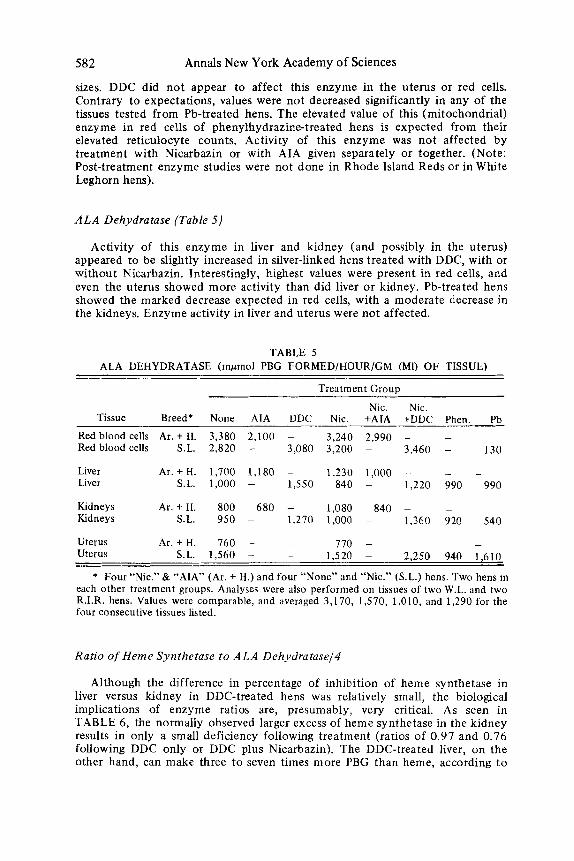
ALA Dehydratase (Table 5)
Activity of this enzyme in liver and kidney (and possibly in the uterus) appeared to be slightly increased in silver-linked hens treated with DDC, with or without Nicarbazin. Interestingly, highest values were present in red cells, and even the uterus showed more activity than did liver or kidney. Pb-treated hens showed the marked decrease expected in red cells, with a moderate decrease in the kidneys. Enzyme activity in liver and uterus were not affected.
TABLE 5 ALA DEHYDRATASE (mpmol PBG FORMED/HOUR/GM (Ml) O F TISSUE)
Treatment GIOUD
Nic. Nic. Tissue Breed* None AIA DDC Nic. +AIA +DDC Phen. Pb
Red blood cells Ar. + H. 3,380 2,100 - 3,240 2,990 - - -
Liver Ar .+H. 1,700 1,180 - 1,230 1,000 - - -
Kidneys A r . + H. 800 680 - 1,080 840 ~ -~
Uterus Ar.+ H. 760 - - 770 - -
Red blood cells S.L. 2,820 - 3,080 3,200 - 3,460 - 130
S.L. 1,000 - 1,550 840 - 1,220 990 990 Liver
S.L. 950 - 1,270 1,000 - 1,360 920 540 Kidneys
- -
Uterus S.L. 1,560 - - 1,520 ~ 2,250 940 1,610
* Four “Nic.” & “AIA” (Ar . + H.) and four “None” and “Nic.” (S.L.) hens. Two hens in each other treatment groups. Analyses were also performed on tissues of two W.L. and two R.I.R. hens. Values were comparable, and averaged 3,170, 1,570, 1,010, and 1,290 for the four consecutive tissues listed.
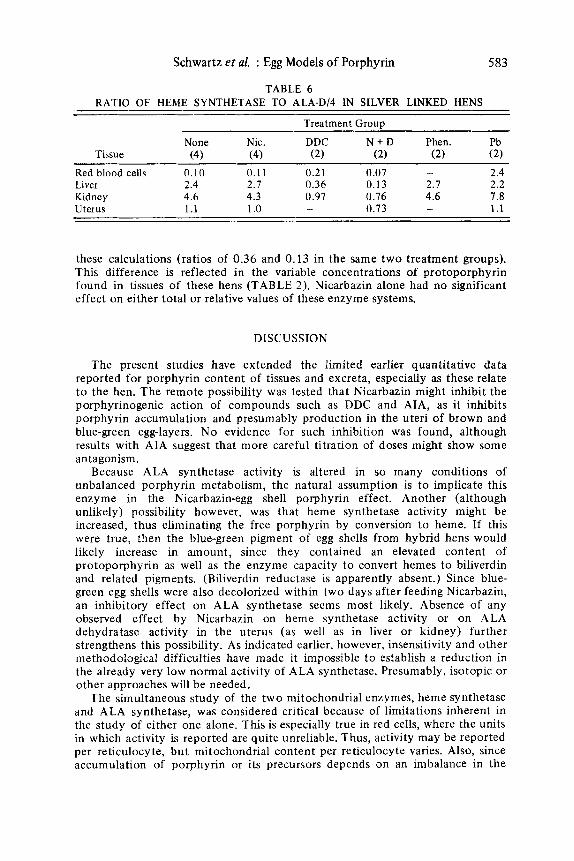
Ratio of Heme Synthetase to A L A Dehydrataselrl
Although the difference in percentage of inhibition of heme synthetase in liver versus kidney in DDC-treated hens was relatively small, the biological implications of enzyme ratios are, presumably, very critical. As seen in TABLE 6, the normally observed larger excess of heme synthetase in the kidney results in only a small deficiency following treatment (ratios of 0.97 and 0.76 following DDC only or DDC plus Nicarbazin). The DDC-treated liver, on the other hand, can make three to seven times more PBG than heme, according t o
Schwartz et al. : Egg Models of Porphyrin 583
TABLE 6 RATIO OF HEME SYNTHETASE TO ALA-D/4 IN SILVER LINKED HENS
Treatment Grouu
None Nic. DDC N + D Phen. Pb Tissue (4 1 (4) (2) (2) (2) (2)
Red blood cells 0.10 0.1 1 0.21 0.07 - 2.4 Liver 2.4 2.7 0.36 0.13 2.7 2.2 Kidney 4.6 4.3 0.97 0.76 4.6 7.8 Uterus 1.1 1 .o - 0.73 - 1.1
these calculations (ratios of 0.36 and 0.13 in the same t w o treatment groups). This difference is reflected in the variable concentrations of protoporphyrin found in tissues of these hens (TABLE 2 ) . Nicarbazin alone had no significant effect on either total or relative values of these enzyme systems.
DISCUSSION
The present studies have extended the limited earlier quantitative data reported for porphyrin content of tissues and excreta, especially as these relate t o the hen. The remote possibility was tested that Nicarbazin might inhibit the porphyrinogenic action of compounds such as DDC and AIA, as it inhibits porphyrin accumulation and presumably production in the uteri of brown and blue-green egg-layers. No evidence for such inhibition was found, although results with AIA suggest that more careful titration of doses might show some antagonism.
Because ALA synthetase activity is altered in so many conditions of unbalanced porphyrin metabolism, the natural assumption is t o implicate this enzyme in the Nicarbazin-egg shell porphyrin effect. Another (although unlikely) possibility however, was that heme synthetase activity might be increased, thus eliminating the free porphyrin by conversion t o heme. If this were true, then the blue-green pigment of egg shells from hybrid hens would likely increase in amount, since they contained an elevated content of protoporphyrin as well as the enzyme capacity t o convert hemes t o biliverdin and related pigments. (Biliverdin reductase is apparently absent.) Since blue- green egg shells were also decolorized within two days after feeding Nicarbazin, an inhibitory effect on ALA synthetase seems most likely. Absence of any observed effect by Nicarbazin on heme synthetase activity or on ALA dehydratase activity in the uterus (as well as in liver or kidney) further strengthens this possibility. As indicated earlier, however, insensitivity and other methodological difficulties have made it impossible t o establish a reduction in the already very low normal activity of ALA synthetase. Presumably, isotopic or other approaches will be needed.
The simultaneous study of the two mitochondrial enzymes, heme synthetase and ALA synthetase, was considered critical because of limitations inherent in the study of either one alone. This is especially true in red cells, where the units in which activity is reported are quite unreliable. Thus, activity may be reported per reticulocyte, bu t mitochondrial content per reticulocyte varies. Also, since accumulation of porphyrin or its precursors depends on an imbalance in the
584 Annals New York Academy of Sciences
relative activities of enzymes in the biosynthetic chain and not on their absolute amounts, the relative activity of heme synthetasejA LA synthetase should be of special significance. In the absence of ALA synthetase data, the ratio of heme synthetase t o ALA dehydratase has been calculated.
These calculated ratios (if confirmed by larger series) could help interpret several phenomena: (1) Porphyrin content normally increases in the order kidney-liver-uterus. This is the same order in which the calculated excess of heme synthetase was found t o diminish. (2) Although DDC porphyria is considered to be “hepatic” in type, the present studies suggest that the heme synthetase inhibition in the kidney is not much different from that in the liver. The kidney, however, is protected by its normally larger excess of heme synthetase.
The porphyrinogenic effect of DDC was first reported by Solomon and Figge.32 Total porphyrin content of livers from mice fed this compound for ten days increased to an average of 1134 pg/g. About 90% was protoporphyrin. (Control values were not reported.) O n exposure t o near-ultraviolet light, the kidneys showed red fluorescence only after treatment for seven days or more. DeMatteis and Prior33 analyzed liver, kidneys, and marrow from two rabbits fed DDC. Average protoporphyrin values for these three tissues were 440, 1.2, and 0.01 pg/g. (Control values for these tissues, cited from another laboratory, were 0.1 -0.5, 0.02-0.07, and “nil”-0.24, respectively.) Granick and Urata34 found increased activity of ALA synthetase in liver mitochondria of DDC-treated guinea pigs.
Decreased concentrations of catalase and of hepatic P-4.50 cytochromes following treatment with various porphyrinogenic compounds, including DDC, have been reported by several investigators. DeMatteis and Gibbs3 have summarized some of these studies, and also noted decreased activity of heme synthetase in liver mitochondria of rats treated with DDC. They suggested that “inhibition of the conversion of protoporphyrin into haem may not only explain the very marked accumulation of protoporphyrin in the liver, which is characteristic for this type of hepatic porphyria . . . , but may also represent the primary lesion responsible for the stimulation of 5-aminolevulinate synthetase and the overproduction of porphyrins.” (For a variety of reasons, we had also proposed36 earlier that a primary defect a t the heme level led to secondary defects at the level of ALA synthetase.)
The liver enzyme studies reported here also indicate the importance of the heme synthetase defect as the cause of elevated protoporphyrin levels in the liver, with a lesser effect in the kidney.
The consistently higher levels of renal than hepatic heme synthetase must have great significance for many phenomena in which oxygen tension and oxidative metabolism are important. These might include shock, renal hyper- tension, erythropoietin production, and the like. Earlier studies3’ had shown that approximately four times as much heme is synthesized per gram by the kidney from injected ALA-I4C than by the liver of normal dogs. Israels3* also showed greater incorporation of 14C from ALA into kidney heme than into liver heme in in vitro incubations of tissue homogenates.
There are relatively few reports on experimental porphyria in fowl. Goldberg and R i m i n g t ~ n ~ ~ fed AIA to two Rhode Island Red hens and found increased porphyrin in liver and excreta. Nothing was said about egg shells. Vos and colleague^^^^^ found that polychlorinated biphenyls (PCB) produced a “hepatic” porphyria when fed t o Japanese quail. ALA synthetase activity in
Schwartz et al. : Egg Models of Porphyrin 585
hepatic mitochondria was increased up t o 20-fold, along with much evidence for increased hepatic protein synthesis. Excretion of coproporphyrin was increased more than that of protoporphyrin. The finding of kidney fluorescence suggested increased renal porphyrin content. Vos and coworkers42 also reported a hepatic type of porphyria in Japanese quail fed hexachlorobenzene. Excretion of copro- and protoporphyrin increased equally. Renal fluorescence was noted, along with an increase of so-called “ceroid” pigment. N o quantitative data were given.
Tamura and Fujii have discussed and shell2’ pigments in Japanese quail as well as in Rhode Island Red and White Leghorn hens. Results were reported only in terms of relative visual intensity of color and of fluorescence a t various stages of egg development. The major portion of shell pigment was found in the cuticle. Small pigment granules (containing porphyrin) were present in the apical ciliated cells of the uterine mucosal epithelium along with larger PAS (periodic acid-Schiff)-positive granules. The abundance of both types of granules increased progressively until the time of cuticle deposition. Their numbers then rapidly declined. These authors concluded that the large granules contribute to the organic matrix of the cuticle, with most of the cuticular porphyrin coming a t the same time from the pigment granules. Mucin-containing basal cells of the uterine epithe!ium were believed related t o the earlier stages of shell formation.
Apparently, little is known about the nature of pigment granules and their relation t o porphyrin biosynthesis. Tamura and Fujii’s finding that their appearance and disappearance is cyclic is of special interest in relation t o possible hormonal or other regulatory mechanisms.
P 0 0 l e ~ ~ examined shell pigments in eggs obtained from Japanese quail a t hourly intervals prior t o predicted egg-laying. Green color in the “inner” shell was seen first, followed during the three hours before expected egg-laying by increasingly intense brown pigment in the uterus and outer egg shell.
Yamada4’ has recently compared the properties of ALA dehydratases isolated from liver and from uterus of the Japanese quail. Uterine activity of this enzyme increased about 2 to 3-fold just prior to pigmentation. Induction of this enzyme by 17b-estradiol in immature quail was also found.
Kennedy and V e v e r ~ ~ ~ have recently reported pigment studies of Araucana egg shells. Absorption spectra of three green t o blue-green fractions were shown. One was very similar to that of biliverdin. One of the subfractions appeared t o be a zinc complex of biliverdin. A fourth (pink) fraction had the properties of protoporphyrin. This report also contains an especially valuable review of the early literature dealing with egg shell pigments.
Kennedy and Vevers proposed that the egg shell protoporphyrin may be derived from red cells, having diffused from these cells t o be concentrated by the glandular epithelium of the oviduct. Its deposition in the shell is also associated, they suggest, with calcium deposition. This proposal, however, would appear t o be inconsistent with the findings reported herein, where red cell protoporphyrin levels increased considerably following Nicarbazin feeding at the same time that uterine and egg shell porphyrin diminished markedly. It might, of course, be contended that these findings could be associated with inhibited release of red cell porphyrin by Nicarbazin. ALA synthetase and/or isotopic studies might be required t o clarify this point.
The special uses of chick embryos for development of experimental p ~ r p h y r i a ~ ~ or for in vitro study of porphyrinogenic agent^^^^^' are beyond the scope of this report.

586 Annals New York Academy of Sciences
SUMMARY
It has been shown that Nicarbazin does not significantly inhibit the porphyrinogenic action of AIA or of DDC, even though it diminishes markedly the uterine and egg shell porphyrin content. This is presumably because of tissue-specific effects of these compounds, in which Nicarbazin affects porphyrin metabolism in hen erythrocytes and uteri, in contrast t o the primary hepatic and renal action of DDC and the hepatic action of AIA. Heme synthetase activity was greater in the kidney than in the liver in all untreated hens studied. This normal renal excess of heme synthetase, it is suggested, protects the kidney from DDC toxicity, compared t o the liver. The quantitative data presented here on porphyrin content of erythrocytes, livers, kidneys, uteri, and excreta in untreated and treated hens will be supplemented by studies t o be described elsewhere on incorporation of ALA-3H and glycine-’ 4C in excreted porphyrins in the variously treated hens. It is hoped that these and further studies of ALA synthetase activity will help clarify a t least some of “life’s mystery of porphyrin and bile pigment [which] is bound up in the red, white, and blue.”
ACKNOWLEDGEMENTS
We acknowledge the assistance of Harold Freyholtz and Page R. Edmondson, Department of Medicine, University of Minnesota, in the preparation of this manuscript. We are also grateful t o Dr. 0. H. Siegmund, Merck Sharp and Dohme Research Laboratories, Rahway, New Jersey, for providing much information and a generous supply of Nicarbazin for these studies; t o Drs. B. Pomeroy, R. Shoffner, M. Hamre, and J. Otis, Department of Poultry Science, University of Minnesota, for assistance in procuring hens and facilities and for much helpful advice; and t o Mr. Duane Urch, Owatonna, Minnesota, for supplying us with Araucana hens.
REFERENCES
1. JULL, M. A. 1927. The races of domestic fowl. National Geographic 51: 379-450. 2. FINSTERBUSCH, C. A. 1931. The Araucano, the blue-egged fowl of Chile. Feathered
3. SORBY. H. C. 1875. On the colourina matters of the shell of bird’s eggs. Proc. Zool. World 28: 263-264.
- _ _ Soc. (J. Zool.): 351-365.
4 . FISCHER. H. & F. KOGL. 1923. Zur Kenntnis der natiirlichen Poruhyrine (IV). - . Uber das Ooporphyrin. Z. PhysioL Chem. 131: 241-261.
5. FISCHER, H. & F. KOGL. 1924. Zur Kenntnis der natiirlichen Porphyrine (IX). Uber Ooporphyrin aus Kiebitzeierschalen und seine Beziehungen zum Blutfarbstoff. Z. Physiol. Chem. 138; 262-275.
6 . HELBACKA, N. V. L. 1956. Studies on Blood and Meat Spots in the Hen’s Egg. Ph.D. thesis, University of Minnesota.
7. HELBACKA, N. V. L. & M. H. SWANSON. 1958. Studies on blood and meat spots in the hen’s egg. 1. The fluorescent property of meat spots. Poultry Sc i . 37:
8. HELBACKA, N. V. L. & M. H. SWANSON. 1958. Studies on blood and meat spots in the hen’s egg. 2. Some chemical and histological characteristics of blood and meat spots. Poultry Sci. 37: 877-885.
9. JEFFREY, F. P. 1945. Blood and meat spots in chicken eggs. Poultry Sci. 24:
871-876.
363-374,
Schwartz et al. : Egg Models of Porphyrin 587
10. Technical Bulletin. 1955. Nicarbazin: An anticoccidial agent for chickens. Merck and Co., Inc. Rahway, N.J.
11. CUCKLER, A. C., C. M. MALANGA, A. J. BASSO & R. C. O’NEILL. 1955. Antiparasitic activity of substituted carbanilide complexes. Science 122 244 -245.
12. POLIN, D. 1959. Porphyrin formation by tissues from laying hens fed Nicarbazin. Proc. SOC. Exp. Biol. Med. 1 0 0 695-698.
13. TAYLOR, T. G. 1970. How an eggshell is made. Sci. Amer. 222: 89-94. 14. ROMANOFF, A. L. & A. J. ROMANOFI:. 1949. The Avian Egg. Wiley & Sons, Inc.
New York, N.Y. 15. BELL, D. J. & B. M. FREEMAN, Eds. 1971. Physiology and Biochemistry of the
Domestic Fowl, Vol. 3. Academic Press Inc. New York, N.Y. 16. KAPPAS, A. & S. GRANICK. 1968. Steroid induction of porphyrin synthesis in liver
culture. 11. The effects of heme, uridine diphosphate glucuronic acid, and inhibitors of nucleic acid and protein synthesis on the induction process. J. Biol. Chem. 243: 346-351.
17. KAPPAS, A., H. L. BRADLOW, P. N. GILLETTE & T. F. GALLAGHER. 1972. Studies in porphyria. I. A defect in the reductive transformation of natural steroid hormones in the hereditary liver disease, acute intermittent porphyria. J. Exp. Med. 136: 1043-1053.
18. LEMBERG, R. & J. BARCROFT. 1932. Uteroverdin, the green pigment of the dog’s placenta. Proc. Roy. SOC. Ser. B. 110 362-372.
19. DRABKIN, D. L. 1970. The hemophagous organ of the placenta and in vitro studies of endogenous carbon monoxide production. Ann. N.Y. Acad. Sci. 174: 49-63.
20. BRACE, K. C. & P. D. ALTLAND. 1956. Life span of the duck and chicken erythrocyte as determined with 14C. Proc. SOC. Exp. Biol. Med. 92: 615-617.
21. SCHWARTZ, S., J. A. JOHNSON, R. D. STEPHENSON, A. S. ANDERSON, P. R. EDMONDSON, & R. M. FUSARO. 1971. Erythropoietic defects in protopor- phyria: A study of factors involved in labelling porphyrins and bile pigments from ALA-3H and glycine-14C. J. Lab. Clin. Med. 78: 411-434.
22. SCHWARTZ, S. et al. 1974. Isotopic studies of porphyrin and heme metabolism: Bonanzas and pitfalls. Ann. N.Y. Acad. Sci. 241: 360-379.
23. POLIN. D., A. J. BASSO & R. C. O’NEILL. 1959. Some compounds in the carbinilide series preventing shell porphyrin deposition. Poultry Sci. 38: 282-284.
24. SCHWARTZ, S., M. H. BERG, I. BOSSENMAIER & H. DINSMORE. 1960. Determination of porphyrins in biological materials. In Methods of Biochemical Analysis. D. Glick, Ed. Vol. 8: 221-293. Interscience Publishers. New York, N.Y.
25. JENSEN, J. 1963. Separation of the coproporphyrin isomers I and I11 by thin-layer chromatography. J. Chromatogr. 10: 236-238.
26. BELCHER, R. V., S. G. SMITH, R. MAHLER & J. CAMPBELL. 1970. The separation of free dicarboxylic acid porphyrins using thin layer and paper chromatogaphy. J. Chromatog. 53: 279-284.
27. TAMURA, T. & S. FUJII. 1967. Comparative observations on the distribution of fluorescent pigments (porphyrins) in the egg-coverings of chickens and quail. J. Fac. Fish. Anim. H u b . Hiroshima Univ. 7: 35-41.
28. BURCH, H. B. & A. L. SIEGEL. 1971. Improved method for measurement of delta-aminolevulinic acid dehydratase activity of human erythrocytes. Clin. Chem.
29. MARVER, H. S., D. P. TSCHUDY, M. G. PERLROTH & A. COLLINS. 1966. 8-Aminolevulinic acid synthetase. I. Studies in liver homogenates. J. Biol. Chem.
30. MARVER, H. S., D. P. TSCHUDY, M. G. PERLROTH, A. COLLINS & G. HUNTER, Jr. 1966. The determination of aminoketones in biological fluids. Anal. Biochem.
31. MAUZERALL, D. & S. GRANICK. 1956. The occurrence and determination of 8-aminolevulinic acid and porphobilinogen in urine. J. Biol. Chem. 21% 435-446.
17: 1038-1041.
241: 2803-2809.
14: 53-60.
588 Annals New York Academy of Sciences
32. SOLOMON, H. S. & F. H. J . FIGGE. 1959. Disturbance in porphyrin metabolism caused b y feeding diethyl 1,4-dihydro-2,4,6-trimethylpyridine-3,5-dicarboxylate. Proc. SOC. Exp. Biol. Med. 100. 583-586.
33. DE MA'ITEIS, F. & B. E. PRIOR. 1962. Experimental hepatic porphyria caused by feeding 3,5-diethoxycarbonyl-l,4-dihydro2,4,6-trimethylpyridine. Biochem. J.
34. GRANICK, S. & G. URATA. 1963. Increase in activity of 6-aminolevulinic acid synthetase in liver mitochondria induced by feeding of 3,5-dicarbethoxy-1,4- dihydrocollidine. J. Biol. Chem. 238: 821 -827.
35. DE MATTEIS, F. & A. GIBBS. 1972. Stimulation of liver 5-aminolevulinate synthetase by drugs and its relevance t o drug-induced accumulation of cytochrome P450. Biochem. J. 126: 1149-1160.
36. SCHWARTZ, S. 1962. In Les Maladies Du Metabolisme Des Porphyrines, (discussion): 290-291. Presses Universitaires de France. Paris, France.
37. SCHWARTZ, S. & R. CARDINAL. 1967. Non-hemoglobin heme intermediates in the biosynthesis of bile pigments. Medicine 46: 73-81.
38. ISRAELS, L. 1972. Inhibition of heme synthesis in the kidney by organic mercurials. Biochem. Pharmacol. 21: 434-435.
39. GOLDBERG, A. & C. RIMINGTON. 1955. Experimentally produced porphyria in animals. Proc. Roy. SOC., Ser. B. 143: 257-280.
40. VOS, J . G. & J. H. KOEMAN. 1970. Comparative toxicologic study with polychlor- inated biphenyls in chickens with special reference to porphyria, edema formation, liver necrosis, and tissue residues. Toxicol. Appl. Pharmacol. 17:
41. VOS, J . G., J. J. T. W. A. STRIK. C. W. M. VAN HOLSTgYN & J. H. PENNINGS. 1971. Polychlorinated biphenyls as inducers of hepatic porphyria in Japanese quail, with special reference to 6-aminolevulinic acid synthetase activity, fluorescence, and residues in the liver. Toxicol. Appl. Pharmacol. 20: 232-240.
42. VOS, J . G., H. 1.. VAN DER MASS, A. MUSCH & E. RAM. 1971. Toxicity of hexachlorobenzene in Japanese quail with special reference to porphyria, liver damage, reproduction, and tissue residues. Toxicol. Appl. Pharmacol. 1 8 944-95 7.
43. TAMURA, T., S. FUJII, H. KUNISAKI & M. YAMANE. 1965. Histological observations on the quail oviduct; with reference to pigment (porphyrin) in the uterus. J. Fac. Fish. Anim. Husb. Hiroshima Univ. 6: 37-57.
44. TAMURA, T., & S. FUJII. 1966. Histological observations on the quail oviduct; on the secretions in the mucous epithelium of the uterus. J. Fac. Fish. Anim. Husb. Hiroshima Univ. 6: 357-371.
45. TAMURA, T. & S. FUJII. 1967. Comparative observations on the distribution of fluorescent pigments (porphyrins) in the chicken and quail uteri, I . Fac. Fish. Anim. Husb., Hiroshima Univ. 7: 43-49.
46. POOLE, H. K. 1965. Spectrophotometric identification of superficial pigment deposition in the Japanese quail. Proc. Soc. Exp. Biol. Med. 119: 547-551.
47. YAMADA, M. 1972. 6-aminolevulinic acid dehydratases from shell, gland and liver of Japanese quail, Coturnis coturnix japonica. I . Purification, properties, and hormonal induction. Biochim. Biophys. Acta. 279: 535-543.
48. KENNEDY, G. Y. & H. G. VEVERS. 1973. Eggshell pigments of the Araucana fowl. Comp. Biochem. Physiol. 448: 11 -25.
49. TALMAN, E. L., J . D. CASE, R. A. NEVE, R. F. LABBE & R. A. ALDRICH. 1955. Porphyrin metabolism. 1. Experimental porphyria in chick embryos. J . Biol. Chem. 212: 663-675.
50. RACZ, W. J. & G. S. MARKS. 1969. Drug-induced porphyrin biosynthesis. 11. Simple procedure for screening drugs for porphyria-inducing activity. Biochem. Pharmacol. 18: 2009-201 8.
51. GRANICK, S. 1966. The induction in vifro of the synthesis of 6-aminolevulinic acid synthetase in chemical porphyria: A response to certain drugs, sex hormones, and foreign chemicals. J . Biol. Chem. 241: 1359-1375.
83: 1-8.
656-668.