Recent Vertebrate and Invertebrate Burrows in Lowland and ...
Upload
independentCategory
view
4download
0
J. theor. Biol. (1987) 124, 377-404
Cortical Activity in Vertebrate Eggs I: The Activation Waves
ANGELA CHEER, t JEAN-PAuL VINCENT,~ RICHARD NUCCITELLI§ AND GEORGE OSTER¶
t Department of Mathematics, University of California, Davis CA 95616; ~; Department of Biophysics, University of California, Berkeley, CA 94720;
§ Department of Zoology, University of California, Davis CA 95616; ¶ Departments of Biophysics and Entomology, University of California,
Berkeley CA 94720, U.S.A.
(Received 4 May 1985, and in revised form 14 July 1986)
We present a physical model for the propagation of chemical and mechanical waves on the surface of vertebrate eggs. As a first step we analyzed the propagation of the calcium wave observed to sweep over the surface of the Medaka egg (Gilkey et al., 1978). It has been assumed that this wave is driven by a mechanism of calcium- stimulated-calcium-release. By formulating this hypothesis mathematially we can use the observed wavefront data to obtain a map of cortical reactivity. This map indicates a gradient of reactivity along the egg: highest in the animal hemisphere and tapering off towards the vegetal hemisphere. The cortex of Xenopus eggs is also capable of propagating a calcium wave (Busa & Nuccitelli, 1985). At about the same time a wave of expansion followed by a wave of contraction sweeps across the egg surface (Takeichi et al., 1984). We have proposed a mechanism for this wave pair based on the physical chemistry of actomyosin gels. The calcium wave activates solation factors which sever some of the actin chains which leads to an osmotic swelling of the gel. Calcium also activates the contractile machinery of the actomyosin system which causes the gel to contract. The contraction lags the swelling because of the nature of the kinetics: solation and swelling is a more rapid process than contraction. By writing the equations for gel expansion and contraction we can mimic the mechanical and chemical wave propagation by a computer simulation. If the model is correct this provides a method for using the waves as a diagnostic of the mechanochemical properties of the egg cortex.
1. Introduction
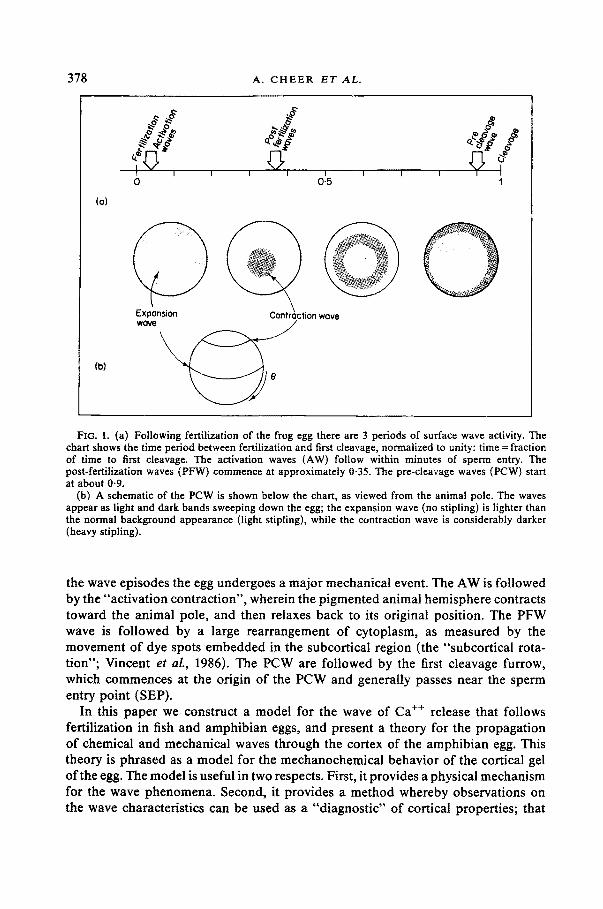
During the period before first cleavage the cortex of amphibian eggs, and possibly other vertebrate eggs, is swept by three periods of wave activity (Fig. l(a)) (Hara et al., 1979; Sawai, 1982; Yoneda et al., 1982; Takeichi & Kubota, 1984). The first wave episode immediately follows fertilization, and is called the activation wave (AW). The second wave episode takes place between 0.35 and 0-4 of the time of first cleavage, and is called the post-fertilization wave. The third wave episode occurs at about 0.9; these waves have been called surface contraction waves, but we shall call them pre-cleavage waves (PCW).
Each of these waves can be visually observed as a progressive change in the appearance of the egg surface. For example, Fig. l(b) shows the appearance of the PCW, a wave of expansion followed by a wave of contraction. Following each of
377 0022-5193/87/040377+28 $03.00/0 © 1987 Academic Press Inc. (London) Ltd
378 A . C H E E R E T A L .
(a)
.
N' I I I I I I I I I 0 0-5 1
Expansion Con raction wave
(b) wove
O
FIG. 1. (a) Following fertilization of the frog egg there are 3 periods of surface wave activity. The chart shows the time period between fertilization and first cleavage, normalized to unity: time = fraction of time to first cleavage. The activation waves (AW) follow within minutes of sperm entry. The post-fertilization waves (PFW) commence at approximately 0-35. The pre-cleavage waves (PCW) start at about 0.9.
(b) A schematic of the PCW is shown below the chart, as viewed from the animal pole. The waves appear as light and dark bands sweeping down the egg; the expansion wave (no stipling) is lighter than the normal background appearance (light stipling), while the contraction wave is considerably darker (heavy stipling).
the wave episodes the egg undergoes a ma jo r mechanica l event. The A W is fol lowed by the "ac t iva t ion cont rac t ion" , wherein the p igmented animal hemisphere contracts toward the animal pole, and then relaxes back to its original posit ion. The P F W wave is fo l lowed by a large rear rangement o f cytoplasm, as measured by the movemen t o f dye spots embedded in the subcort ical region (the "subcor t ical rota- t ion"; Vincent et al., 1986). The PCW are fol lowed by the first cleavage furrow, which commences at the origin o f the P C W and general ly passes near the sperm entry po in t (SEP).
In this pape r we construct a model for the wave o f Ca ++ release that follows fertilization in fish and amphib ian eggs, and present a theory for the p ropaga t ion o f chemical and mechanica l waves th rough the cortex o f the amphib ian egg. This theory is phrased as a mode l for the mechanochemica l behavior o f the cortical gel o f the egg. The model is useful in two respects. First, it provides a physical mechan i sm for the wave phenomena . Second, it provides a me thod whereby observat ions on the wave characterist ics can be used as a "d iagnos t ic" o f cortical propert ies; that

C O R T I C A L A C T I V I T Y I N V E R T E B R A T E E G G S 379
is, the waves can provide a "map" of the mechanochemical characteristics of the c o r t e x .
The paper is organized as follows. In Section 2 we describe the wave of calcium that sweeps the egg cortex of the teleost fish Medaka, and construct a model for this process which we later apply to the amphibian egg. In Section 3 we describe the surface waves observed in amphibian eggs. In Section 4 we discuss some physical chemical properties of actomyosin gels which we use in Section 5 to construct a model for mechanochemical wave propagation in amphibian eggs. We show how these waves can be used as a diagnostic of the egg's cortical properties.
The model we use as the basis of our theory of cortical waves is based on the physical chemistry of actomyosin gels (cf. Oster & Odell, 1984; Oster, 1984; Odell, 1984). This theory is essentially mathematical, as is the model itself. However, we have tried to describe the essential physics qualitatively and heuristically in the text, and have relegated the mathematical development to the Appendix.
2. Calcium Waves in Medaka Eggs
The most conspicuous example of wave propagation in eggs studied to date are the calcium waves that sweep over the egg of the teleost fish, Medaka, shortly after fertilization. These waves have been observed and recorded using the luminescent properties of aequorin (Gilkey et al., 1978); Fig. 2 shows how the front of the wave advances over the surface of the egg.
AP
VP
FIG. 2. The calcium wave in Medaka. This is a digitization of the data from Gilkey et al. showing the progression o f the calcium wavefront as it passes over the surface of the egg, beginning at the animal pole (AP). The wavefronts are spaced 10 seconds apart. Note that the wave slows down in the vegetal hemisphere, which indicates that the cortex is not a uniform medium. AP = animal pole, VP = vegetal pole.
The wavefronts shown in Fig. 2 are spaced at 10 second intervals, and the waves propagate at an average velocity of 12.5 txm/sec at 26°C, although this is quite temperature sensitive. Since the wavefronts appear more closely spaced in the vegetal hemisphere, it is clear that the wave must be slowing down there. However, a simple geometric argument shows that, if the properties of the yolk cytoplasmic layer were uniform, the wave should slow down in the animal hemisphere and speed up in the vegetal hemisphere.

3 8 0 A. C H E E R E T A L .
Intuitively, this can be seen by imagining a sphere covered uniformly with dry grass. If a fire is lit at the north pole, the firefront will spread along latitude lines toward the south pole. However, in the northern hemisphere the firefront is expand- ing (latitude circles increase in circumference as 0 increases from 0 to ~r/2 = 90°). Thus the firefront is retarded in the northern hemisphere since it must increase its periphery as it advances. Conversely, the periphery of the firefront contracts in the southern hemisphere, and so the wave speed will increase. If the wave speed is to slow down in the vegetal hemisphere, as observed in the Medaka egg, the "flamma- bility" of the grass must decrease with increasing latitude (e.g. the grass gets wetter). Thus the properties of the cytoplasm involved in wave propagation are graded from animal to vegetal hemisphere. The mathematical reasoning which makes the above argument precise is given in Appendix A. The calcium wave can propagate, though somewhat more slowly, in calcium-free media, which demonstrates that the wave mechanism can run on internal calcium sources.
Associated with the wave of increased free calcium is a ring-shaped wave of increased membrane permeability which passes over the egg following activation (Nuccitelli, 1977). The vibrating probe has been used to map this current wave; these measurements indicate that current begins to enter the SEP of Medaka about 30 seconds after fertilization and precedes vesicle fusion by 15 seconds, as does the calcium wave (Nuccitelli, in prep.). Thus the spatial and temporal characteristics of the current wave can be used as an indicator of the free calcium wave.
The wave of cortical granule exocytosis lags the calcium wave by 5-15 seconds, and shows a similar deceleration after crossing the equator (Gilkey, et al., 1978). In ionophore-activated eggs, several waves can be initiated, and from their pattern of propagation it is clear that a region where the wave has already passed is refractory to subsequent wave propagation for some time period.
(A) A MODEL FOR CALCIUM WAVE PROPAGATION
The kinetics of calcium release and resequestration are complex, and all of the steps involved have not yet been characterized. However, it is not difficult to construct a model of the overall process. We focus our attention on a small volume element of cytoplasm AV, and denote the concentration of calcium by c(O, t), where 0 is the polar angle on the sphere (i.e. the latitude line located at an angle of 0 degrees, measured from the animal pole. Whatever the details, the concentration of free calcium must obey the following mass balance equation
[Rate of change of free calcium in A V] = [Net rate c diffuses into and out of AV]
+ [Release rate of sequestered c inside A V] -[Resequestration rate of c inside A V]. (1)
In Appendix A (cf. equation (9)) this word equation is translated into mathematics; the parameters involved in this equation are the diffusion constant for calcium, and the kinetic constants for release and resequestration. Here we have included in the resequestration term the rate of extrusion through the plasma membrane.

CORTICAL ACTIVITY IN VERTEBRATE EGGS 381
In o r d e r to use equa t ion (1) to descr ibe the ca lc ium waves we mus t find a way o f desc r ib ing the kinet ics o f release and reseques t ra t ion .
(B) THE KINETICS OF CALCIUM RELEASE AND RESEQUESTRATION
There are two processes invo lved in the ca lc ium kinet ics : re lease and reseques t ra t ion . (a) C a l c i u m release. We shal l a s sume tha t the re lease o f ca lc ium f rom mem-
b r anous seques te r ing sites involves a c a l c ium-s t imu la t ed -ca l c ium- re l ea se ( C S C R ) G i lkey et al., 1978). Tha t is, the t r igger for ca l c ium release is a t h r e sho ld concen t ra t ion , c*, o f ca lc ium. The m o l e c u l a r mechan i sm unde r ly ing this p h e n o m e n o n is unc lear , bu t we can cons t ruc t a p h e n o m e n o l o g i c a l desc r ip t ion as fol lows.
The C S C R amoun t s to a m e m b r a n e pe rmeab i l i t y tha t increases with ca lc ium; that is, the efflux o f ca lc ium f rom the seques te r ing sites is au toca ta ly t ic . This means that the re lease rate must rise s igmoida l ly as shown in Fig. 3(a).
~ d catalytic ase rote
t Leak
Calcium stimulated calcium release
Free calcium
( ( / /
cAMP
FIG. 3. (a) The calcium kinetics for calcium stimulated calcium release (CSCR). The total rise in cytosolic calcium, dc/dt, is the difference between the autocatalytic release rate from the calcium sequestering organelle, A(c), and the resequestering rate, r.
(b) The CSCR mechanism. Calcium is sequestered in membranous vesicles (presumably cortical endoplasmic reticulum, CER). Free calcium stimulates an autocatalytic release of calcium which is resequestered by a cAMP dependent pump.

382 A. C H E E R E T A L .
(b) Resequestration. A wave of calcium release will produce a wavefront which advances over the egg surface; however, without resequestration the calcium level would remain at its high (micromolar) level. The simplest way to model the resequestration kinetics is to assume a first order membrane pump
[Resequestration rate] = [pump rate] x [calcium concentration]. (2)
This is shown as the straight line in Fig. 3(a). If the release and resequestration curves in Fig. 3(a) are added together the result is an S-shaped curve giving the total rate of change of c, dc /d t , versus c. The S-shaped curve has two stable equilibria separated by a firing threshold at c2 = c*: concentrations of c below c* will fall to c~, while concentrations above c* will rise to c3. Thus autocatalytic release and simple first order resequestration can produce bistable ("on or off") kinetics; however, it can be shown that such kinetics cannot produce a calcium with a finite width, and so we must add another ingredient to the model.
The additional ingredient required is provided by the nature of the resequestering pumps which appear to require cAMP for their operation (Fig. 3(b)) (Suematsu et al., 1984). Moreover, cAMP is produced by adenylate cyclase whose activity is stimulated by calcium via calmodulin. If we denote the concentration of cAMP by a(O, t), the simplest elaboration on equation (2) is to allow the resequestration rate, r, to depend linearly on a
[Resequestration rate] = [Pump rate] x [calcium concentration] x [cAMP concentration]. (3)
Thus the slope of the resequestration curve in Fig. 3(a) varies according to the cAMP concentration.
With this modification, we write the simplest possible scheme for the dynamics of cAMP
da ~ - = [Calcium dependent production of cAMP by adenylate cyclase from ATP]
- [loss of cAMP]
(cf. equation (15) in the Appendix) where the loss of cAMP includes the rate of degradation by phosphodiesterase, which is also calmodulin-dependent, and the consumption rate of cAMP by other reactions.
The calcium kinetics can now produce the "triggerable" kinetics that allows the propagation of Ca ++ "pulse" waves: a small perturbation in calcium concentration is buffered back to the equilibrium level, ~, but a perturbation larger than a threshold concentration, c*, results in a large excursion before returning to the low equilibrium concentration (cf. Fig. 4). The analogy between the calcium pulse kinetics (sometimes called "calcium stimulated calcium release") and the Fitzhugh-Nagumo model for nerve excitation is apparent (cf. Appendix A).
Our basic balance equation (1) for calcium concentration can now be written as Oc - - = (Diffusion) + (Autocatalytic release) Ot
- ( c A M P dependent resequestration). (4)

C O R T I C A L A C T I V I T Y I N V E R T E B R A T E E G G S 383
C'
Time
FIG. 4. A cytosolic concentration of calcium below a critical value, c*, does not trigger the release cascade. Concentrat ions above c* initiate a relase-resequester cycle which results in a pulse o f free calcium.
The concentration of cAMP is governed by the following equation:
Oa - - = (Production by calcium activated adenylate cyclase) Ot
-(breakdown by phosphodiesterase) -(loss to other reactions, including the calcium pump). (5)
This set of coupled equations describes our model for chemical wave propagation (cf. equations (16) and (17) in the Appendix). They appear to contain as free parameters the rate constants for release and resequestration of calcium and the manufacture and utilization of cAMP. The radius of the egg and the diffusion constant for calcium are presumed known. However, we show in Appendix A that, when the equations are reduced to nondimensional form, the number of parameters reduces effectively to 2, which control the overall rates of diffusion and reaction of calcium.
The equations (4) and (5) can be used to model the calcium wave in Medaka. The solid lines in Fig. 5(a) shows the wavefront as it sweeps from animal to vegetal pole over a sphere of uniform characteristics. As in the experiment shown in Fig. 2, the wave fronts are shown at 10 second intervals. It is clear that the computed pattern of wave fronts does not match those in Fig. 2. In particular, the velocity of the computed wave does not decrease in the vegetal hemisphere as the experiments show.
At this point the value of the model can be appreciated, for by varying the overall release and resequestration parameters we can use the experimental wavefront loci to obtain a "map" of the cortical reactivity of the Medaka egg.
As one might expect, the model predicts that the speed of the wave is controlled by the release rate of calcium and the firing threshold, and the width of the wave is controlled by the resquestration rate. The dashed line in Fig. 5(a) shows a fit of the model equations to the observed wave fronts. Figure 5(b) shows the longitudinal profile of cortical reactivity required to achieve this fit. In Fig. 5(c) these waves are shown in profile.
It is clear that the Medaka egg is much more kinetically active in the animal hemisphere than in the vegetal. This gradient in chemical activity is in accord with

384 A. C H E E R E T A L .
(a) Animal pole
At =lOsec
Vegetal pole
Uniform egg Non uniform egg . . . . . . . . . .
Angle 8
t=lO 50 t
c)
O*
20 30 40
An( le 8
120
180"
FIG. 5. (a) A comparison o f the calcium wave on a an egg whose cortical properties are uniform (solid line) vs propagat ion on an egg whose cortical nonuniformity is as shown in 5c (dashed line). Compare this with Fig. 2: the wave slows down in the vegetal hemisphere rather than speeding up, as it should on a uniform egg.
(b) The model allows us to factor out the effect of the spherical geometry on the wavespeed. Thus we can construct a map of cortical reactivity required to fit the computed wave speed to the observed wave fronts. This is plotted as the variation in the parameter ratio P/r (permeability of Ca ++ compart- ment / resequest ra t ion rate). The particular function used here is the quadratic f ( q ) = kt[(zr - 0) / I r ]2+ k2, where k 1 and k2 are constant factors.
(c) A profile o f the wavefronts propagating over the surface of the egg with nonuni form cortical reactivity. The unequal spacing of the wavefronts reflects both the spherical geometry and the cortical inhomogeneity. The ordinate is the calcium concentration normalized to its max imum value.

C O R T I C A L A C T I V I T Y I N V E R T E B R A T E E G G S 385
other properties generally observed in eggs, as we shall discuss below. More impor- tantly, the model provides us a method for investigating the kinetic properties of the cortex in vivo. We shall extend this method to investigate the surface contraction waves in amphibian eggs.
Note that the model only allows us to map the overall release and resequestration kinetics. A more detailed modeling of these processes is required if we are to understand the mechanism of this release and resequestration. For example, the overall release rate in the cortical cytogel can be broken up into separate contributions from the sequestering compartment--which we define as the density of membraneous "vesicles"--and from the membrane properties of those vesicles as follows
Autocatalytic release rate
( Area ~( # vesicles ~ ( # channels~(conductivity~ =A(c) = \ ~ / \ u n i t v~u-m~e-~cortex/\ unit area ] \ ~ "]" (6)
It is widely assumed that the calcium sequestering organelle is the cortical endoplas- mic reticulum (CER) (Charbonneau & Grey, 1984). If the density and the pore conductance is the same for all CER, then the variability in A(c) arises from the difference in amount of sequestering material between animal and vegetal hemi- spheres. Thus the map of cortical reactivity in Fig. 5(b) probably reflects the gradient in Ca ++ sequestering sites (e.g. density of subcortical membranous material) in the egg. A possibly related observation is the animal-vegetal gradient in the degree of junctional contacts between cortical endoplasmic reticulum and the plasma mem- brane observed by Charbonneau & Grey (1984) in Xenopus. They feel that this gradient is primarily due to a gradient in the distribution of cortical endoplasmic reticulum (Grey, pers. commun.).
3. Mechanical and Chemical Waves in Amphibian Eggs
The frog egg also exhibits a wave of Ca ++ release that begins at the sperm entry point about 1 minute after the rise of the fertilization potential and spreads over the egg with a velocity of 10 ~m/sec (Busa & Nuccitelli, 1985). However, the rate of Ca ++ resequestration is much slower in the frog, resulting in a wider region with increased Ca ++. While the wave of free Ca ++ is over within 3 minutes in the Medaka egg, 14 min has passed before the cytoplasmic Ca ++ returns to prefertilization levels at the vegetal pole of the frog egg. These frog egg measurements were made with Ca++-sensitive microelectrodes inserted at least 100 g.m below the plasma membrane, so they indicate a subcortical Ca ++ wave that probably reflects a cortical Ca ++ wave. The timing of this Ca ++ wave coincides with a wave of chloride ion efflux, detected with the vibrating probe (Kline & Nuccitelti, 1985). It is likely that Ca÷÷-sensitive chloride channels are opened by an increase in the local free calcium concentration.
(A) THE ACTIVATION WAVES IN XENOPUS
The calcium wave and current wave is followed by the wave of cortical granule exocytosis within 15 seconds, and 1.5 minutes after the ionic wave, a mechanical

3 8 6 A. C H E E R E T A L .
wave follows. Takeichi & Kubota (1984) measured local expansion and contraction by marking the egg surface with carbon particles and measuring their relative positions over time (Fig. 6; Fig. 3 in Takeichi & Kubota, 1984). They observe a light and dark wave pair--which they interpret as an expansion and contraction wave, respectively---originating at the pricking point. However, it is not clear from their figure that any expansion takes place in front of the contraction wave at points close to the pricking point (segments p-1 and 1-2 in Fig. 6).
1-0
E
8 0.5
E 0
.•J ' d ' 1 (Qi
5 Time offer pricking (rnin)
t ' ' ' 6-7 F"'--~ " v - 5_61 ~v..~"-- _ ' " ' ~
g 3-4
~ 2-~ I-2
p-1
0
v
O - - - I
- 50*/. 0 - - - 1
5 Time after pricking (rain)
FIG. 6. Surface deformat ions due to the propagation o f the activation waves in Xenopus eggs (from Takeichi & Kubota, 1984). Particles were placed on the surface o f the egg and their displacements recorded photographical ly as the waves passed over the surface o f the egg. In the left panel the distances (in mm) between individual particles and the pricking point are plotted over time. The right panel plots the relative distance between adjacent particles over time; i.e. (distance at t ime t - distance at t ime to)/distance at t ime t o.
(B) THE PRECLEAVAGE WAVES
In the period just prior to the first cleavage (about 0-85-0.9), waves of cortical deformation sweep over the surface of the egg. Hara (1971) first observed these waves, and called them "surface contraction waves" (SCW). These waves always occur in pairs, and originate in the animal pole region at the site where the cleavage furrow will start to form. Similar waves are observed just prior to cleavage in the following three or four cell cycles, and if the restraining vitelline envelope is removed from the egg, each of these waves produce large deformations of the egg shape (Kirschner et aL, 1980; Hara et aL, 1977).
We shall call these waves "pre-cleavage waves" (PCW), since it has been shown recently that the first surface wave (SCW-1) is in fact a wave of expansion, while the second wave (SCW-2) is a true contraction wave. This was established for the

C O R T I C A L A C T I V I T Y I N V E R T E B R A T E E G G S 387
eggs of Cynops pyrrhogaster and Xenopus laevis by Yoneda et aL (1982) and by Sawai (1982). They detected local expansion and contraction by marking the surface with carbon particles and filming the eggs in time lapse.
From those films one can measure the distance between adjacent particles a function of time and position. This was done by Yoneda et al. (1982) for colchicine injected Xenopus eggs so that the deformations due to the cleavage furrow would not complicate the measurements (Fig. 7).
0 -
5 0 -
E
,~ 6 0 - E
I - -
9 0 -
1 2 0 -
I r n m
: I i"l .... ~ ~'"1
FIG. 7. Relative distances between adjacent particles as the pre-cleavage waves pass over the surface of a colchicine injected egg of Cynops. Here, this is expressed as (distance at time t)/(distance at time to) (from Yoneda et al., 1982). The dotted lines refer to the first surface contraction wave (SCW)I and the solid lines to SCW2.
Figure 7 (Fig. 8 from Yoneda et aL, 1982) shows that SCW-1 consists of an expansion by 10-20% in linear dimension, while SCW-2 represents a contraction to about 70-80% of the most expanded state. Notice how the wave grows sharper as it progresses away from the initiation center. Here, in distinction from the activation wave, it is clear that even very close to the origination site of the wave the first event that takes place is an expansion.
The PCW's propagate at an average velocity of about 1 t~m/sec in Xenopus eggs (Yoneda et al., 1982) and in axolotl eggs (Hara, 1971), and 0-5-0-8 i~m/sec in the eggs of Cynops pyrrhogaster (Yoneda et aL, 1982; Sawai, 1982).
Each of the cortical wavesDactivation, post-fertilization and pre-cleavage--are followed by major morphogenetic movements: the activation contraction, subcortical rotation and cleavage furrow, respectively. While the significance of the activation contraction is uncertain, the other two play a critical role in subsequent development. These events are clearly mechanical in nature, and some insight may be gained into how they are brought about by understanding the surface waves themselves. There- fore, we have constructed a physical model for how the surface waves are propagated

388 A. CHEER E T AL.
across the egg cortex, and in the next sec t ion we descr ibe tha t mode l in qual i ta t ive language; the ma thema t i ca l desc r ip t ion is given in the A p p e n d i x .
4. The Mechanochemistry of Cortical Cytogel
In this sec t ion we briefly review some phys ica l chemica l p rope r t i e s o f ac tomyos in gels; a more comple t e d i scuss ion can be f o u n d in Oster & Ode l l (1984) and Oster (1984).
(A) THE EXPANSION OF GELS: SWELLING PRESSURE
A gel is a ne twork o f c ross l inked p o l y m e r fibers. W h e n a gel is p l aced in a solvent ba th it will swell by i m b i b i n g the solvent . This comes a b o u t because o f the difference in o smot i c pressure , PO, be tween the so lvent a n d the gel; tha t is a so lvent mo lecu le expe r i ences a chemica l po ten t i a l d rop in go ing f rom the so lvent ba th in to the p o l y m e r env i ronment . F igure 8 shows a gel in con tac t with a so lvent ba th t h rough a po rous pis ton. The pressure that mus t be a p p l i e d to the p i s ton to p reven t the gel f rom swel l ing is ca l led the swel l ing pressure , PS.
The o p p o s i n g force which prevents the gel f rom e x p a n d i n g indef in i te ly is the e las t ic i ty o f the gel. This e las t ic i ty arises f rom the the rmal m o t i o n o f the fibers,
T L
Porous PS = PO + PE p~ston
/ Solvent
IIII IIILIIIII ! HIIIIIIIIIIIIII
I
Network (0) chain
P
1 1
Rubber bands (b)
FIG. 8. The swelling pressure of a gel, Ps, is the sum of the (positive/expansive) osmotic pressure, Po, and the (negative/contractive) elastic pressure, PE.
(a) A porous piston allows solvent to flow down its chemical potential gradient and swell the gel in the piston. The elasticity of the network chains arrests the swelling at the point where the elastic stress equals the osmotic pressure.
(b) A physical analog of the gel swelling situation, l f a piston and cylinder is filled with a gas it tends to expand the volume of the cylinder. The expansion can be countered by stretching a collection of elastic fibers. The gas pressure is analogous to the gel osmotic pressure and the elastic forces of the rubber bands mimic the gel elastic pressure. The pressure, P, required to keep the piston stationary is the difference between the gas pressure and the elastic forces. P is zero when the two internal forces balance.

C O R T I C A L A C T I V I T Y I N V E R T E B R A T E E G G S 389
which causes them to writhe about in various configurations (elastic forces due to deformation of molecular bonds arise only at very large strains). These configurations are shorter in end-to-end distance than a fully extended fiber, and so a contractile force is generated. Thus the swelling pressure, PS, is the sum of the osmotic pressure, PO, which tends to expand the gel and the elastic stress (or elastic pressure), PE, which restrains it:
PS = PO+ PE (7)
Note that PE is a negative quantity since it tends to shrink the gel column. Figure 8(b) shows a mechanical analogy: the osmotic pressure is analogous to the pressure of a gas (indeed, van't Hoti 's law for osmotic pressure has exactly the form of the ideal gas law), and the elastic springs are analogous to the fiber elasticity.
(B) THE SOLATION OF CYTOGEL
Cytogel contains proteins which can sever polymer chains
In all cytogel systems that have been examined one finds proteins which can bind to actin fibers and, under the proper conditions, sever them. These are called solation factors, and examples are gelsolin in amoebae, and fragmin in Physarum. They are called solation factors because they break up the network structure of the gel, which results in a precipitous drop in the measured viscosity of the gel. A "sol" is simply a gel whose crosslinked structure has been disrupted.
In any polymer system the network exists as an equilibrium between the sol and gel states: gel ~ sol, where the term "sol" here refers to all non-network components, including monomers and network fragments. In a cytogel, this equilibrium is quite complex; however, it has been demonstrated that it is regulated by the concentration of calcium ions. This regulation is achieved via a number of pathways; however, for our purposes we focus only on the property that the activity of the solation factors is regulated by calcium.
As calcium concentration in the cytoplasm rises to the micromolar level the solation factors bind calcium and sever the actin fibers. Subsequently, they may remain bound to the "barbed" end of the actin polymer (as defined by heavy meromyosin decoration) until calcium levels fall once again, whereupon they lose their bound calcium, and come free from the polymer ends.
Solation causes an increase in swelling pressure
The addition of calcium to an actin gel decreases the concentration of crosslinks in the gel network by the action of the solation proteins. This means that the elastic pressure of the gel must fall, for only those polymer segments which are crosslinked can contribute to the elastic forces (the thermal motions of the polymer segment with one free end shown in Fig. 8(a) cannot exert any force on the network). Since the swelling pressure is the sum of the osmotic and elastic pressures, solation causes PS to increase, and so the gel will swell when solated. This is shown in Fig. 9: the graph of PS vs strain rises as the number of polymer chains falls (here we use the chemist's terminology: a chain is a polymer segment crosslinked at both ends).

390
8
A~ C H E E R ET AL.
Decreasing chain
, ~ ~
FIG. 9. A plot of swelling pressure vs strain (X)(or volume = length x cross-sectional area). When network chains are severed by solating factors the swelling pressure increases and the gel expands to a higher volume. This is analogous to cutting one of the rubber bands in the analog system (Fig. 7b); the piston will expand until a new equilibrium is reached, whereupon the external pressure, P = Peas + P~LASrtC will vanish.
The expansion wave is a wave o f solation
We have now a physical mechanism for the expansion wave that forms the first of the activation waves (AW). We postulate that a wave of calcium release raises the cytoplasmic concentration of calcium transiently to a level sufficient to activate the solation factors. These sever some of the network chains, causing an increase in the local swelling pressure, and a concommitant osmotic swelling of the gel.
We should point out that another interpretation of the expansion wave is possible: it may simply consist of a passive stretching by the advancing contraction wave. Our simulations show that this passive stretching is not sufficient, and the data is better represented if there is a slight osmotic expansion. We shall return to this point below.
While a calcium wave accompanies the activation contraction waves, no such calcium wave has been observed to precede the precleavage waves. Therefore, these arguments may not apply to those waves.
(C) THE CONTRACTION OF CYTOGEL
The contraction wave lags the solation wave
Following the expansion wave is a wave of cortical contraction (see Figs 6 and 7). We postulate that this wave is generated by tractions arising from the actomyosin cortical gel. The reason why the contraction wave lags the solation-expansion wave requires explanation, however.
Figure 10 shows the major steps in the chemical pathways leading to solation and contraction. The solation pathway simply involves calcium binding to the solation proteins which then sever the actin fibers. However, the contraction sequence--which is described fully in the figure caption--is considerably longer.

C O R T I C A L A C T I V I T Y I N V E R T E B R A T E E G G S 391
~ - . . . . . . . ~ SOLATION
t \ x ~ _ ICS ~ ~ ~- CM,w ~ MLCI~]
.PD ® Ac tA P 1 / ' t
CALCIUM REGULATION CONTRACTION
® FIG. 10. Schematic showing the major chemical steps involved in the solation and contraction kinetics.
Sequestered calcium (CS)--usually complexed with calsequestrin--is released autocatalytically from membranous sites, Free calcium (c) follows three pathways.
(I) Resequestration. The free calcium is resequestered by membranous pumps which require cAMP (a) and hence ATP via the adenylate cyclase (AC) reaction, cAMP, in turn is produced by adenlylate cyclase and degraded by phosphodiesterase (PD), each of which requires calmodulin/calcium, cAMP is utilized in other pathways as well.
(II) Solation. Free calcium binds to solating factors (SF) rendering them active (SF*) which then sever the actin filaments (SOLATION).
(III) Contraction. Free calcium binds to calmodulin (CM) inducing a conformational change to its active form (CM*); cal modulim binds up to 4 calcium ions, each inducing a conformational change. The activated calmodulin binds to the myosin light chain kinase (MLCK) inducing it to its active form (MLCK*), which then phosphorylate the myosin light chains )M*). Phosphorylation may also facilitate myosin subunits to assemble to thick filament-like structures. Also, actin subunits (A) (fragments and monomers, perhaps complexed with profilin) assemble to filamentous actin strands (AF) and bind to the activated myosin to form "contractile units": segments of counter-oriented actin fibers crosslinked by activated myosin chains. These contractile units shorten to produce the traction stresses in the gel (CONTRACTION).
Therefore , we expec t tha t d e v e l o p m e n t o f t ens ion in the ac tomys in ne twork will take c o n s i d e r a b l y longer than the t ime to sola te the ne twork .
This lag be tween ca lc ium release and t ens ion d e v e l o p m e n t is also obse rved in the p l a s m o d i a l osc i l la t ions in Physa rum (Oster & Odel l , 1984), and is p r o b a b l y
charac te r i s t i c o f non-musc le ac tomyos in systems.
5. A Mechanochemical Model for Cortical Waves
W e have a rgued tha t a re lease o f ca lc ium in the cor t ica l a c tomyos in gel ini t ia tes the fo l lowing cycle o f events. Fi rs t the gel so la tes as the ca lc ium act iva tes the so la t ion prote ins . The d i s r u p t e d ne twork upse ts the equ i l i b r ium be tween the gel osmot ic pressure a n d its e las t ic p ressure , l ead ing to swell ing. The swel l ing takes p lace ra the r quickly , be ing l imi ted on ly by the v iscous d rag o f the ne twork fibers t h rough the fluid c o m p o n e n t o f the cy top lasm. This so la t ion p r o b a b l y involves bu t a smal l pe rcen tage o f the ne twork chains , and so the gel is on ly pa r t i a l ly d i s rup ted . Fo l l owing so la t ion , the ne twork c o m m e n c e s to con t rac t as the act ive t rac t ion due to the

392 A . C H E E R E T A L .
actomyosin activity increases. As more contractile units are recruited the active contraction begins to dominate the osmotic pressure and the cortex commences to contract. The active contraction of the actomyosin fibers tags behind the solation- expansion step because the kinetics of phosphorylation is a longer kinetic sequence than solation. When calcium levels fall again below the micromolar level the network reanneals. Thus the wave of calcium release triggers a solation-expansion wave, followed by an active contraction wave.
In the Appendix we show how the solation-contraction cycle can be expressed mathematically. Here we sketch the content of those equations heuristically.
In order to describe the movements of the egg cortex we must write an equation for the displacement of points on the surface of the egg: as the wave passes, the tangential displacement at time t of a point initially at a latitude 0 is expressed as v(O, t). The equation for v(O, t) has the form
(frictional drag between network fibers and cytoplasm) 0v Ot
= (Elastic pressure + osmotic pressure + active traction) (8)
(see equation (28) in Appendix B, where an equivalent expression for the normal displacement is also given.) In order to solve these equations, expressions must be written for the elastic and osmotic pressures as well as the active traction and frictional drag. The form of these quantities as a function of strain and calcium concentration are given in the Appendix.
Equations (4) and (5) for the calcium wave are solved simultaneously with equation (8) describing the mechanical balance of forces in the cortex. A typical result is shown in Fig. 11, which is a snapshot of the wavefront at a particular
004
0 03
0 0 2 o
001
E ooo
- 0 01
- 0,02
~: - o,o~ ~3
-004
Time = 6 0 seconds
Contraction Expansion
A \ \ / \ _ . _ .
.- " - ' - - .-- k . . / '
- - - - T a n g e n t i a l
\ / - - . - - N o r m a l
\ /
\ , 6 ~ ~ = , , , , t 0"25 0"50 075 100 ~-25 1 50 1-75 200 225 250 275
0 (rodions)
FIG. 11. The mechanochemical waves on the surface of the egg as computed from the model. The figure shows a snapshot , at a fixed instant of t ime (t -- 1 minute) of the tangential and normal displacements along a meridian of the egg. As the free calcium concentration rises the gel solates, which leads to an osmotic swelling of the gel followed by a contraction as the actomyosin filaments of the gel shorten.

CORTICAL ACTIVITY IN VERTEBRATE EGGS 393
instant , showing the profi les o f the d i sp lacemen t s , v and w. Note that , in this s imula t ion o f the frog e g g - - i n a cco rdance with the expe r imen ta l d a t a - - t h e wave length o f the ca lc ium wave is much la rger than in M e d a k a , be ing a p p r o x i m a t e l y 12 t imes the d i a m e t e r o f the egg. Therefore , beca use the mechan ica l waves are o f much shor t e r wavelength , the ne twork does not comple t e ly regel unt i l the con t rac t ion wave has pa s sed (recall tha t so la t ion involves sever ing less than 10% of the fibers). F igures 12(a) and (b) are s imula t ions o f the relat ive tangent ia l d i sp l a c e me n t o f ne ighbor ing po in ts on the egg surface, c o r r e s p o n d i n g to Fig. 6 ( f rom Takeich i & K u b o t a , who m e a s u r e d on ly the tangent ia l c o m p o n e n t o f d i sp lacemen t ) .
t 2 0
0 60
0 O0
(o)
1
I I ] J I I 1 I
3-4
2-3
I-2
p4
0 100 ZOO 0
(b)
5 0 %
i i J I i i l i i
100 200
Time in seconds
FIG. 12. Figures 12(a) and 12(b) are simulations from our model corresponding to the experimental results described in Figs 6(a) and (b) respectively.
(a) Simulation of the tangential displacement of points located at regular intervals (0.3 radians = 17 °) from the pricking point along a particular meridian. Displacement is expressed in radians, each curve represents the displacement of a given point relative to the fixed pricking point (marked 0).
(b) Computed relative distances between adjacent particles expressed as (distance at time t)/(distance at time to) - 1. Curve p-1 shows the relative distance between the pricking point and point 1 of Fig. 12(a).
The model used for these simulations treats only situations with axial symmetry. Thus the prick point is always at the animal pole in the simulations. In the experiments of Takeichi & Kubota, the eggs were pricked at points midway between the animal pole and the equator. Thus, by viewing the eggs from the animal hemisphere, they were able to track displacements up to approximately 90 degrees from the pricking point. In the simulations here we can track points only to 70 degrees from the animal pole. Thus there are fewer curves in Fig. 12 than in Fig. 6.

394 A . C H E E R E T A L .
Note that the contraction ring which spreads outward from the SEP (or activation site) will stretch the neighboring regions of the egg. Thus local measurements of surface movements will detect a passive expansion of the cortex before the contrac- tion wave passes, and a similar passive stretching after the wavefront passes. The experiments of Takeichi & Kubota do not distinguish between this stretching and the dilation of the surface due to osmotic swelling. Our calculations suggest that the passive stretching is not sufficient to account for the observed surface waves, and we suggest that solation-expansion accounts for most of the tangential displace- ment that precedes the contraction wave.
The simulations in Fig. 12 do not exactly reproduce the situation measured by Takeichi and Kubota. They did not initiate the wave at the animal pole, but offset by about 30 degrees. Simulating this situation would require a 2-dimensional model, since the cortex is not homogeneous. This is a sizeable computation, and so for this study we modeled the situation where the wave is initiated at the animal pole. Since this lies on a symmetry axis for the system, the calculations are considerably simplified. Thus Fig. 12 cannot be compared exactly to Fig. 6, but the qualitative similarities are evident. A full 3-dimensional simulation is currently underway and will be reported elsewhere.
(A) THE MECHANICAL WAVES CAN ALSO BE USED AS A CORTICAL DIAGNOSTIC
Just as the calcium wavefronts in Medaka could be used to deduce the overall kinetics of release and resequestration, likewise can the observed waves of expansion and contraction be used to determine the overall rate constants for solation and contraction, and how they vary with latitude, 0. That is, knowing the measured speed, width and angular separation of the expansion and contraction waves enables us to compute the overall parameters controlling solation and contraction rates.
(B) T H E P F A N D PC W A V E S M A Y A L S O BE G E N E R A T E D BY A S I M I L A R M E C H A N I S M
As we discussed above, there are, besides the AW, two other significant periods of mechanical activity in the egg cortex prior to first cleavage. It appears likely that the same physical mechanisms of solation-expansion and active contraction may play a role in these movements. However, other mechanisms may be at work as well. Consider the PCW's first. The waves of expansion and contraction that constitute the PCW's are not preceded by any detectible calcium wave. One possibil- ity is that the same actomyosin dependent mechanism described for the AW is activated by another ion. Whether this involves an alternate phosphorylation path- way, or simply a different trigger for a previously phosphorylated actomyosin gel, is not known. It is worth mentioning, however, that Begg (pets. comm.) and Schatten (1981) have observed contraction waves in activated sea urchin eggs which follow a calcium and pH wave. This reinforces the notion that the pathway we have discussed in this paper may not be the only route to cortical contraction.
The situation concerning the PFW's is even less clear. No precise description of the surface movements associated with the PFW's is available. However, it has been

C O R T I C A L A C T I V I T Y I N V E R T E B R A T E E G G S 395
suggested that the PFW's are a surface response to the growing spermaster (Kirshner et al., 1980; Ubbels et al., 1983). Still, the subcortical motions that follow the PFW's remain paradoxical. We are pursuing a mechanochemical analysis of these move- ments and will report our results in a subsequent publication.
(C) C O N T R A C T I O N W A V E S I N O T H E R D E V E L O P I N G S Y S T E M S
Finally, we mention that contraction waves may be a common phenomenon in many developing systems. An obvious example is the actomysin contraction waves in the ectoplasm of Physarurn plasmodia which drive the shuttle streaming of the endoplasm (Oster & Odell, 1984). In other systems, the developmental significance of these waves may not be so apparent; however, their ubiquity suggests some functional role. For example, a wave of contraction may drive epiboly in teleost eggs such as Fundulus (Trinkaus, 1984, p. 405; Keller & Trinkaus, 1984). Also Stern & Goodwin (1977), and Robertson (1979) have observed contraction wave sweeping over chick neural plate.
One possibility that we find intriguing is that calcium-contraction waves may provide a mechanism for recruiting actin to a given region. Consider what happens during a wave of solation and regelation. The calcium wave activates the solation factors which sever many actin polymer fibers. Later, when the calcium levels fall and the equilibrium is shifted more toward reassembly, the fibers begin to repolymer- ize. Because of thermal motion, it is quite unlikely that a growing fiber will reanneal with its corresponding free end. Rather it will grow and eventually crosslink with some other fiber segment. Therefore, a reannealed gel will likely contain more chains and be more highly crosslinked than before solation. Thus the passage of a calcium wave leaves the regelled network stronger than it was.previously. The passage of several calcium waves may produce a cortex that is sufficiently strong to carry out a morphogenetic process that it previously was not mechanically strong enough to perform (e.g. cleavage, neurulation, gastrulation).
6. Discussion
In the first part of this paper we formulated a theory for the propagation of calcium waves through the cortex of a spherical egg. By fitting the observed wave- fronts in Medaka to the model equations we could derive a map of the cortical reactivity; that is, the net calcium release and sequestering activity of the cortical endoplasmic reticulum (CER). We did not, however, address the question of the initiation of the wave.
Frog eggs cannot be prick-activated in calcium free medium. When prick-activated, it is likely that extracellular calcium rushes into the wound, raising the intracellular calcium concentration locally to a level high enough to initiate calcium-stimulated calcium release. The minimum external calcium concentration for prick activation is probably a measure of this threshold level. This is a parameter of the model that can be measured experimentally.

396 A. C H E E R E T A L .
In nature, the calcium wave is initiated by sperm entry. In this situation there is a delay between actual sperm entry and the start of the wave. It is possible that sperm entry triggers the release of inositol triphosphate (IP3) from the egg plasma membrane. IP3 is known to trigger calcium release from the endoplasmic reticulum in other systems (cf. Berddge & Irvine, 1984) and Busa et al. (1985) have found that IP3 releases Ca ++ from a cortical store in the frog egg. This would provide a mechanism for increasing the calcium concentration above threshold in the vicinity of the SEP.
Our model for the wave propagation is based on the mechanism of calcium stimulated calcium release. The molecular mechanism for this phenomenon is not known, although IP3 may possibly be involved in the autocatalytic feedback loop. The average wave velocity is nearly the same in both Medaka and frog eggs. A calcium wave which propagates at a similar velocity has been recently observed upon activation of starfish oocytes (Eisen & Reynolds, 1984). Interestingly, in both Medaka and frog eggs, the instantaneous wave speed decreases as the wave approaches the vegetal pole. As we have discussed earlier, if the cortical properties were uniform, the geometry of the system dictates exactly the opposite: the wave should slow down in the animal hemisphere and speed up in the vegetal hemisphere. Therefore, in order to account for the experimental observations one must conclude that the cortical properties are not uniform: the animal hemisphere is more kinetically active than the vegetal hemisphere. This difference in calcium kinetics, which controls the wave velocity, depends on differences in release rate and firing threshold for calcium. The release rate depends on, amongst other things, the density of calcium sequestering organelles. The map of cortical reactivity in Fig. 5 is thus proportional to the density of calcium storing organelles.
The shape of the calcium wave ditters dramatically amongst the three species where it was observed. In Medaka eggs, the wavelength is short, so that a band of luminescence about one-fifth the diameter of the egg traverses the egg. In frog eggs, the length of the calcium wave is much larger than an egg diameter; thus for a time the entire cortex resides in an elevated calcium state. In starfish eggs, the trailing edge of the wave cannot be seen; the wave of calcium covers progressively the entire egg, and later the calcium concentration appears to decrease uniformly over the surface. In the context of the theory we have presented, these differences in wave shape are accounted for by differences in the net resequestration rate of the cortical calcium organelles. The resequestration mechanism comprises a number of proces- ses; however, the model lumps them all into one rate-limiting kinetic step. In principle, this net resequestration rate parameter can be determined from measure- ments on the decrease in luminescence. It might be possible to measure the resequestration rates using in vitro cortical preparations.
One possible explanation for the wave pattern in starfish eggs is that those eggs may have only weak resequestration capacity, and the observed decay of lumines- cence is due to diffusion into the interior of the egg. We have formulated our model only for the egg cortex, and have neglected this inward dittusion--a good model for Medaka which consists essentially of a peripheral cytoplasmic layer--but perhaps less realistic for frog eggs. There is no difficulty in generalizing the model to include

CORTICAL ACTIVITY IN VERTEBRATE EGGS 397
inward diffusion of calcium. This may be a worthwhile calculation for the following reason. If prior to fertilization most of the egg's calcium is concentrated in the cortical region, then the surface wave will trigger a massive redistribution of calcium in the egg's interior volume as the cortical release diffuses inward and is resequestered. This redistribution of sequestered calcium will be highly nonuniform, and if subsequent episodes of calcium release play a role in the egg's development, its spatial pattern could be important. For example, the cortex appears to be richer in sequestering sites (cortical endoplasmic reticulum [CER]); (cf. Charbonneau & Grey, 1984) than the deeper cytoplasm. Therefore, it is possible that the cortex is much richer in calcium than the rest of the egg prior to fertilization. However, once released from the CER the free calcium can diffuse not only in the cortex, but into the interior of the egg as well. If there are some resequestering sites in the interior, then the cortical calcium wave will accomplish a redistribution of the calcium throughout the volume of the egg. Therefore, the amount of calcium sequestered in the cortex will be significantly lower following the passage of the wave than it was previously. A subsequent release of calcium will not propagate as fast as the first wave, and indeed may not be able to propagate at all, because--as shown in the Appendix-- the speed of the calcium wave depends on the amount of sequestered calcium.
We shall investigate this phenomenon more fully in a subsequent publication; here we simply note the possibility that the activation contraction which follows the activation wave may be a secondary contraction wave whose wavelength is much longer than the AW, and which "stalls" due to to the lowered cortical calcium content. Finally, a release of this redistributed cortical calcium in the egg's interior may play a role in triggering other events important to subsequent development.
In the second part of the paper we modeled the successive waves of expansion and contraction that sweep over the cortex of the frog egg following activation. Our view is that the expansion wave results from an osmotic swelling of the cortical gel triggered by the increase of calcium concentration, which partially solates the actin gel. Alternatively, the expansion wave advancing ahead of the contraction wave may also be due in part to passive stretching of the cortex by the contraction band. This cannot be the case for the pre-cleavage waves because the very first movement observed at the wave's origin is an expansion, not a contraction (Yoneda et al., 1982). The events accompanying the activation wave are not so clear cut. Takeichi et al. reported that a "light wave"-- implying an expansion wave--is the first event they observe at the prick point. However, this claim appears to contradict their data (Fig. 6 of this paper) where it appears that no noticeable expansion takes place at the prick point. Nevertheless, our simulations describe the observed movements best if we include some osmotic expansion in the wave dynamics. This inclusion is based on the known properties of actomyosin gels. Furthermore, the temporal relationship between expansion and contraction is consistent with the known kinetics of actomyosin gels in other systems.
The most obvious experimental test of our hypothesis would be to record the expansion and contraction accompanying the activation waves in media of different osmolarity. The wave amplitude, but not its speed, should be directly affected.
398 A. C H E E R E T AL.
C o n t r a c t i o n w a v e s a re a fa i r ly c o m m o n p h e n o m e n a in d e v e l o p i n g sys tems , bu t to
o u r k n o w l e d g e t he r e a re f ew ins t ances o f e x p a n s i o n w a v e s tha t h a v e b e e n r e p o r t e d .
O n e s u c h i n s t a n c e is the pa i r o f p r e c l e a v a g e w a v e s m e n t i o n e d a b o v e . D e s p i t e the
s t r ik ing a n a l o g y b e t w e e n the e x p a n s i o n - c o n t r a c t i o n w a v e s f o l l o w i n g a c t i v a t i o n a n d
p r e c e d i n g c l e a v a g e , t hese two p h e n o m e n a m a y no t be c o n t r o l l e d by the s a m e
m e c h a n i s m . W h i l e a c a l c i u m w a v e is k n o w n to a c c o m p a n y the a c t i v a t i o n w a v e s in
f rog eggs , no such w a v e has b e e n seen to p r e c e d e the p r e - c l e a v a g e waves . P e r h a p s
a n o t h e r t r i gge r w a v e (e.g. p H ) m i g h t be c o n t r o l l i n g m e c h a n i c a l ac t iv i ty o f the c o r t e x
at tha t t i m e ( B e g g e t al., 1982 a n d pets . c o m m u n . ) .
F ina l ly , we are t e m p t e d to s p e c u l a t e tha t c o n t r a c t i o n w a v e s m a y p l a y a ro le in
o t h e r d e v e l o p m e n t a l p roces se s . F o r e x a m p l e , a c o n t r a c t i o n w a v e m a y d r ive t he
p ro ce s s o f e p i b o l y in t e l eos t eggs (T r inkaus , 1984, p. 405). Seve ra l w o r k e r s h a v e
o b s e r v e d c o n t r a c t i o n w a v e s p r o p a g a t i n g o v e r t he s u r f a c e o f c h i c k e m b r y o s (S te rn
& G o o d w i n , 1977; R o b e r t s o n , 1979), a l t h o u g h the ro le t he se w a v e s m i g h t p l a y in
n o r m a l d e v e l o p m e n t r e m a i n s mys t e r i ous .
R E F E R E N C E S
BEGG, D. A., REBHUN, L. I. & HYATT, H. (1982). Structural organization of actin in the sea urchin egg cortex: Microvillar elongation in the absence of actin filament bundle formation. J. Cell. Biol. 93, 24.
BERRIDGE, M. J. & IRVINE, R. F. (1984). Inositol triphosphate, a novel second messenger in cellular signal transduction. Nature 312(22), 315.
BUSA, W. B., FERGUSON, J. E., JOSEPH, S. K., WILLIAMSON, J. R. & NUCCITELLI, R. (1985). Activation of frog Xenopus laevis eggs by inositol triphosphate. I. Characterization of Ca ++ release from intracel- lular stores. J. Cell Biol. 101, 677.
BUSA, W. B. & NUCCITELLI, R. (1985). An elevated free cystolic calcium wave follows fertilization in eggs of the frog. Xenopus laeois. J. Cell Biol. 100, 1325.
CHARBONNEAU, M. & GREY, R. (1984). The onset of activation responsiveness during maturation coincides with the formation of the cortical endoplasmic reticulum in oocytes of Xenopus laeois. Devl. BioL 11)2, 90.
EISEN, A. & REYNOLDS, G. T. (1984). Calcium transients during early development in single starfish (Asterias forbesi) oocytes. J. Cell. Biol. 99, 1878.
GILKEY, J. C., JAFFE, L. F., RIDGEWAY, E. B. & REYNOLDS, G. T. (1978). A free calcium wave traverses the activating egg of Oryzias latipes. J. Cell Biol. 76, 448.
HARA, K. (1971). Cinematographic observation of "surface contraction waves" (SCW) during the early cleavage of Axolotl eggs. Wilhelm Roux's Arch. 167, 183.
HARA, K. & TYDEMAN, P. (1979). Cinematographic observation of an "activation wave" (AW) on the locally inseminated egg of Xenopus laevis. Wilhelm Roux's Arch. 186, 91.
HARA, K., TYDEMAN, P. & KIRSHNER, M. (1980). A cytoplasmic clock with the same period as the division cycle in Xenopus eggs. Proc. natn. Acad. Sci. U.S.A. 77, 462.
HARA, K., TYDEMAN, P. & HENGST, R. T. M. (1977). Cinematographic observation of"post fertilization waves" (PFW) on the zygote of Xenopus laeois. Wilhelm Roux's Arch. 181, 189.
KELLER, R. & TRINKAUS, J. (1982). Cell rearrangement in a tightly joined epithelial layer during Fundulus epiboly. J. Cell Biol. 95, 325a.
KIRSCHNER, M., GERHART, J. C., HARA, K. & UBBELS, G. A. (1980). Initiation of the cell cycle and establishment of bilateral symmetry in Xenopus eggs. In: The cell surface: mediator of developmental processes. (Subtelny, S. & Wessels, N. K. eds) pp. 187-215.
KLINE, D. & NUCCITELLI, R. (1985). The wave of activation current in the Xenopus egg. Devl. Biol. 111, 471.
NUCCITELLI, R. (1977). A study of the extracellular electrical currents and membrane potential changes generated by the Medaka egg during activation. J. Cell Biol. 75, 23a.
ODELL, G. (1984). Plasmodial oscillation in Physarum. J. Embryol. exp. Morphol. 83. OSTER, G. (1984). On the crawling of cells. J. Embryol. Exp. Morph. 83 (Suppl), 329.

C O R T I C A L ACTIVITY IN VERTEBRATE EGGS 399
OSTER, G. & ODELL, G. (1984). The mechanics of cytogels. I: Plasmodial oscillations in Physarum. Cell Motil. (in press).
PERELSON, A. S. ~. SEGEL, L. E. (1978). A singular perturbation approach to diffusion reaction equations containing a point source, with application to the hemolytic plaque assay. J. math. Biol. 6, 75.
ROBERTSON, A. (1979). Waves propagated during vertebrate development: observations and comments. J. Embryol. exp. Morph. 50, 155.
SAWAI, T. (1982). Wave like propagation of stretching and shrinkage in the surface of the newt's egg before first cleavage, k exp. Zool. 222, 59.
SCHATTEN, G. (1981). Sperm incorporation, the pronuclear migrations, and their relation to the establishment of the first embryonic axis: time lapse video microscopy of the movements during fertilization of the sea urchin, Lytechinus variegatus. Devt. Biol. 86, 426.
STERN, C. & GOODWIN, B. (19~/7). Waves and periodic events during primitive streak formation in the chick. J. Embryol. exp. Morph. 41, 15.
SUEMATSU, E., HIRATA, M. t~ KAR1YAMA, H. (1984). Effects of cAMP and cGMP-dependent protein kinases and calmodulin on calcium uptake by highly purified sarcolemmal vesicles of vascular smooth muscle. Biochim. biophys. Acta 773, 83.
TAKEICHI, T. & KUaOTA, H. Y. (1984). Structural basis of the activation wave in the egg of Xenopus laevis, k Embryot. exp. Morph. 81, 1.
TIMOSHENKO, S. ~,L WOINOWSKY-KRIEGER, S. (1959). Theory' of Plates and Shells. (2dn edn) New York: McGraw-Hill.
TRINKAUS, J. P. (1984). Cells into organs. The forces that shape the embryo. Englewood Cliffs, N.J.: Prentice-Hall.
UBBELS, G. A., HARA, K., KOSTER, C. K. & KIRSHNER, M. (1983). Evidence for a functional role of the cytoskeleton in determination of the dorsoventral axis in Xenopus laevis eggs. J. Embroil. exp. Morph. 77, 15.
VINCENT, J. P., OSTER, G. (~ GERHART, J. Kinematics of grey crescent formation in Xenopus eggs: Mapping the movement of subcortical cytoplasm relative to the egg surface. Devl. Biol. 113, 44.
YONEDA, M., KOBAYAKAWA, Y., KUBOTA, H. Y. & SAKAI, M. (1982). Surface contraction waves in amphibian eggs. J. Cell Sci. 54, 35.
APPENDICES
In these appendices we translate the word equations given in the text into mathematical form. Our treatment follows closely that of Oster (1984) and Oster & Odell (1984). These papers discuss models for actomyosin gels in various other biological settings.
(A) Chemical Waves on a Sphere
(A.1) DIFFUSION AND REACTION ON A SPHERE: THE MEDAKA WAVES
The equation for diffusion with chemical reaction has the form
Oc = DV2c + F(c) (9) Ot
where c is a vector of chemical concentrations, D is a matrix of diffusion constants (cm2/sec) and F(c) is the rate of reaction. If equation (1) is written on the surface of a sphere of radius R, the Laplacian has the form
V2 1 [ 0 2 O 0 (10)
where 0 is the polar angle. Here we shall restrict ourselves to waves which are
400 A. C H E E R E T A L .
azimuthally symmetrical, so that c= c(O, t). Thus the mathematical form of (1) describing the diffusion and reaction of calcium on the Medaka egg looks like
oc / D \ r O % . . a t 1 - -= / - -~ / /7~2 + cot (0)--7_/+ F(c, a) (11) at \ R /La0 aoj
where D is the diffusion constant for calcium, R is the egg radius, and F(c, a) is the kinetics for release of calcium from--and resequestration to--membranous vesicles. We model the release/resequestration kinetics as
F(c, a ) = , 4 ( c ) + L - 7(c, a) (12)
where ,~(c) is the autocatalytic release rate, ~(c, a) is the resequestration rate, which is dependent on cAMP, a(O, t), as we discuss below, and L is a small leakage term. A(c) has the sigmoidally increasing shape shown in Fig. 3(a).
The resequestration rate is modeled as
~(c, a) = rac (13)
where r is the rate constant, as shown in Fig. 3(a), and a(O, t) is the concentration of cAMP.
The kinetic equation governing c is obtained by substituting (13) into (12) and substituting F(c, a) into (11); the resulting curve, d c / d t = F(c, a) , is S-shaped, as shown in Fig. 3(a).
The important qualitative feature of the calcium kinetics is that it is "excitable": a perturbation in c that is less than the threshold value, c*= c2, dies out to the lower equilibrium, cl, but a perturbation above c* makes a large excursion before returning to cl, as shown in Fig. 4.
For computational ease we shall model the nullcline F(a , c ) = 0 by a cubic polynomial, which has the same qualitative behavior as the curve shown in Fig. 3(a)
F(c, . ) = A( c - c~ ) ( c - c2)(c3 - c) (14)
where A is the amplitude parameter governing the release rate (i.e. the permeability of the sequestration compartment), c2 is the firing threshold, and c3 is the amount of sequestered calcium.
Since we are modeling a spherical surface whose calcium kinetics is not uniform, the amplitude parameter, A, must be a function of position: A = A ( O ) = Af(O) , where f (O) describes the variation of the release amplitude with latitude.
The cAMP equation is given by the balance equation:
d a / d t = [Calcium dependent production of cAMP by adenylate cyclase from ATP] - [loss of cAMP]
= klc - k2ac - rac - kaa (15)
where kl is the rate a is produced from ATP, k2 the rate of degradation by phosphodiesterase, which is also calmodulin-dependent, and k3 is the loss rate of cAMP to other reactions.

C O R T I C A L A C T I V I T Y I N V E R T E B R A T E E G G S
Thus the equations governing the calcium dynamics are:
Oc [ D\[O2c Oc] -~t=~-~)L-~+cot ( O)-~ + A(c -c l ) ( c - c2 ) ( c3 -c ) - rac
Oa - - = ktc - [ c ( k 2 + r) + k3]a. ot
401
(16)
(17)
The parameters in the model are D, A, c~, c2, k~, k2, k3, r. Of these, D ( = 10 -5 cm2/sec) and cl ( ~ 10 -7 molar) are presumed known. (Note that we must use the diffusion coefficient for calcium in free solution, not the effective D ( = 10 -8 cm2/sec) in cytoplasm; otherwise equation (16) would double count the sequestering reaction; cf. Perelson & Segel, 1978.) By nondimensionalizing the equations we shall reduce the parameter count still further.
(A.2) N O N D I M E N S I O N A L FORM OF THE CALCIUM EQUATIONS
We normalize the spatial dimensions by R, the radius of the egg (= 1 mm), and the concentrations, c(O, t) and a(O, t) by their maximum values, c3 and aM. The time scale can be governed by the diffusion or the kinetics, and to retain generality we employ a time scale, T, to be selected according to the process of interest. Thus we define
t c a t' = - - c ' = - - , a ' = . (18)
T' c3 aM
Substituting into (16) and (17), we obtain the dimensionless equations
ac' ( o)r 0clrs - - = + c o t ( 0 ) _ _ + 0)(c'c3- c,)(c'c3- c2)(c3-c'c3)-ra'aMc'c3 Ot' ~ I_00 O0_l Ca
(19)
Oa' - - - - ( T/ aM)[klCMC'-(k2+ r)a' aMc3c'- kaaMa']. (20) Ot
The boundary conditions are
Ot I e=o, ,=o = 0 ,
aa'[ =0, at I o=o,t=o
c'(O, t =0 ) = c o n s t = 0 , 0 > 0
a'(0, t = 0) = const = 0, 0 > 0.
(21)
(22)
(A.3) AN APPROXIMATE EXPRESSION FOR THE WAVE SPEED
One can derive an approximate expression which shows how the speed of the calcium wave depends on the various physical effects (J. Keener, pers. comm.). To

402 A. C H E E R E T A L .
do this we need only examine the wave front, and so we can ignore the cAMP kinetics. The graph of d c / d t vs. c can be approximated by the cubic equation (14)
F(c) = K ( c - c , ) ( c - c2)(c3 - c) (23)
where the roots of F(c), ci, i = 1, 2, 3 are, respectively, the initial cytosolic calcium concentration, the trigger concentration, and the maximum cytosolic calcium level. Thus the wave equation on the line ~1 has the form
D 02~c,+ K(c, - c)(c - c2)(c3- c). (24) a__c=
Ot dx"
For this equation, it can be shown that the wavespeed is given by
v = (DK/2)[c~ + c3-2c2]. (25)
Thus when the trigger concentration, c2, falls below the average of c~ and c3 the wavespeed becomes negative. Physically, this means that the wave will no longer propagate down the egg,but will "stall". This state of affairs may exist after the passage of the first wave, for the level of resequestered ca lc ium--and thus the value of c3--will be lower than before the wave, since some of the calcium has been diffused into the interior of the egg and resequestered there. The so-called "activation contraction" may be a stalled echo wave: if the wavelength is on the order of the egg diameter, such a wave would appear as a contraction of the animal hemisphere.
(A.4) CHEMICAL WAVES ON THE SURFACE OF A UNIFORM SPHERE SLOW DOWN IN THE NORTHERN HEMISPHERE AND SPEED UP IN THE SOUTHERN HEMISPHERE
This is a purely geometrical effect of the spherical domain. The "convective" term (cot O)(ac/O0) arises from expressing the Laplacian in spherical coordinates. Note that we are considering a sphere of constant radius and azimuthally symmetric waves, so that the polar angle, 0, is the only coordinate variable.
Now cot 0 is positive in the animal hemisphere (0 < ¢r/2) and negative in the vegetal hemisphere (0 > 7r/2), and it multiplies the slope of the calcium concentra- tion, (Oc/O0). At the front of the wave, (Oc/O0)< 0. Therefore, at the wavefront the term (cot O)(Oc/O0) is negative for 0 < ~'/2 and positive for 0 > 7r/2. This means that in the animal hemisphere the diffusion term is reduced by an apparent convec- tion, and increased in the vegetal hemisphere. This makes intuitive sense, for the perimeter o f the wavefront is increasing when 0 < 7r/2 and decreasing thereafter.
(B) Mechanochemical Waves on a Sphere
(B.1) THE FORCE BALANCE EQUATIONS ON THE SURFACE OF A SPHERICAL EGG
In this appendix we sketch the equations which govern the propagat ion of the expansion and contraction waves on the spherical egg surface. A more detailed discussion will be presented in Cheer et al. (in prep.).

CORTICAL ACTIVITY IN VERTEBRATE EGGS 403
We shall employ the following notation (see, for example, Chapter 14 of Timoshenko & Woinowsky-Krieger, 1959):
4~ = azimuthal angle (longitude).
0 = equatorial angle (latitude).
ro =
/ 9 =
W~-
4 =
No=
radius of the sphere,
r sin ~b = axial radius.
tangential displacement of a point p = (r, ~b, 0).
normal displacement of a point p = (r, ~b, 0).
azimuthal stress (force/azimuthal length)
equatorial (hoop) stress (force/unit equatorial length).
We assume that no external forces act on the surface, and that the waves will be radially symmetric (so that shear stresses are negligible). The equations of mechanical equilibrium for a spherical shell are (cf. Timoshenko & Woinowsky-Krieger, 1959):
In the th direction:
In the normal direction:
a -5-7(N~ro)- Ner cos (tb) = 0. (26) oq~
No ro + Nor sin ( ch ) = O. (27)
If we assume that the viscous force acting on a shell element can be modeled by a term proportional to the velocity of the element, then equation of motion for the tangential component of displacement can be written
av oN~, /x-~7 = r sin ¢ 0¢" + r cos 4a(N~ - No) (28)
where/x is the viscosity of the cytoplasm. Strictly speaking,/z is not a constant, but decreases as the gel volume fraction decreases. However, we shall ignore this complication here. Similarly, the equation of motion for the normal displacement becomes
Ow / z ~ = r sin ~b[ N,~ + Ne + rP( V)] (29)
Ot
where P (V) is the internal hydrostatic pressure in the shell. Since the fluid contents of the egg are virtually incompressible, this term allows us to impose a nearly constant volume constraint on the egg.
404 A. C H E E R E T A L .
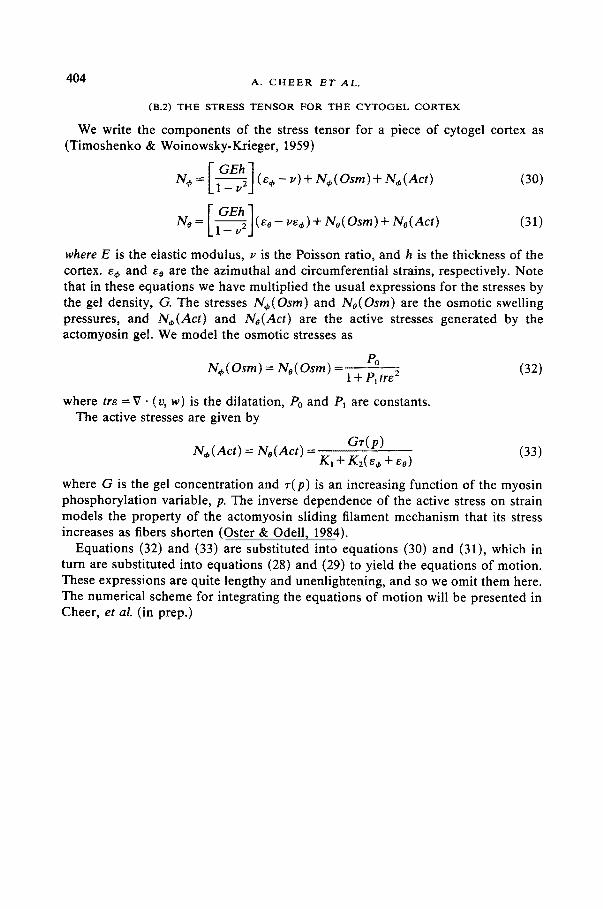
(B.2) THE STRESS TENSOR FOR THE CYTOGEL CORTEX
We write the components of the stress tensor for a piece of cytogel cortex as (Timoshenko & Woinowsky-Krieger, 1959)
r 1 N,~ -- L 1--Z-JJ (~* - ~') + N , ( O s m ) + N~,(Act) (30)
r GEh -I No = L I_--_-T~J (co- ve•)+ No(Osm)+ No(Act) (31)
where E is the elastic modulus, ~, is the Poisson ratio, and h is the thickness of the cortex, e~ and eo are the azimuthal and circumferential strains, respectively. Note that in these equations we have multiplied the usual expressions for the stresses by the gel density, G. The stresses N~,(Osm) and No(Osm) are the osmotic swelling pressures, and N,(Act ) and No(Act) are the active stresses generated by the actomyosin gel. We model the osmotic stresses as
Po N6(Osm) = No(Osm) 1+ Pltre2 (32)
where tre= V • (v, w) is the dilatation, Po and Pj are constants. The active stresses are given by
Gr(p) N~(Act) = No(Act) = (33)
Kl + K2(e 4, + Co)
where G is the gel concentration and ~'(p) is an increasing function of the myosin phosphorylation variable, p. The inverse dependence of the active stress on strain models the property of the actomyosin sliding filament mechanism that its stress increases as fibers shorten (Oster & Odell, 1984).
Equations (32) and (33) are substituted into equations (30) and (31), which in turn are substituted into equations (28) and (29) to yield the equations of motion. These expressions are quite lengthy and unenlightening, and so we omit them here. The numerical scheme for integrating the equations of motion will be presented in Cheer, et al. (in prep.)
Copyright © 2022 FDOKUMEN