Vertebrate ecology in caatinga: A. Distribution of wildlife in ...
74
Vertebrate ecology in caatinga: A. Distribution of wildlife in relation to water. B. Diet of pumas (Puma concolor) and relative abundance of felids. Frank Wolff A Thesis Submitted to the Graduate School at the University of Missouri-St. Louis in Partial Fulfillment of the Requirements for the Degree of Masters of Science in Biology July, 2001 Advisory Committee Date John G. Blake, Ph. D. Bette A. Loiselle, Ph. D. Stanton H. Braude, Ph. D.
-
Upload
khangminh22 -
Category
Documents
-
view
1 -
download
0
Transcript of Vertebrate ecology in caatinga: A. Distribution of wildlife in ...

Vertebrate ecology in caatinga: A. Distribution of wildlife in relation to water.
B. Diet of pumas (Puma concolor) and relative abundance of felids.
Frank Wolff
A Thesis Submitted to the Graduate School at the University of Missouri-St. Louis in
Partial Fulfillment of the Requirements for the Degree of Masters of Science in Biology
July, 2001
Advisory Committee Date John G. Blake, Ph. D. Bette A. Loiselle, Ph. D. Stanton H. Braude, Ph. D.

ACKNOWLEDGMENTS
I am thankful to my advisor, Dr. John Blake, for all his help, suggestions, and
support throughout this project. I want to thank Dr. Bette Loiselle, for her help as a
committee member and for helping me to get in contact with Dr. Peter Crawshaw in
Brazil. Dr. Crawshaw, the director of the Center for Predator Conservation in Brazil
(CENAP) helped me to get the necessary permits to work in Brazil and I would like to
express my gratitude for all his help and inspiration. I also wish to thank Dr. Stan Braude
for his suggestions as a member of my committee.
This project relied on the collaboration of many people in the field. The person
who made it all possible was Sr. Fransico “Chico” Reynaldo. His innate knowledge of the
forest, quick thinking and machete skills made him the keystone member of my field
crew. I would also like to thank Andrea, Elinete, Breno, Eduardo, Daniel and Julião, for
their help in the field. I am deeply grateful to all the people working at the Fundação
Museu do Homem Americano for their assistance throughout my stay in São Raimundo;
in particular, I would like to thank Rosa Takalo and Dr. Niède Guidon. Their dedication
to preserve the natural beauty and archeological treasures of Serra da Capivara National
Park are exemplary. Finally, I would like to thank Luciana Griz for the incredible time
we spent together in Brazil and for her warm support throughout frustrating times of rain
and mechanical failure of all sorts.
This project was funded by the Wildlife Conservation Society, the International
Center for Tropical Ecology at the University of Missouri-St. Louis, Fuji Film, and the
Fundação Museu do Homem Americano.
i

ABSTRACT
Caatinga is a seasonally dry forest in northeastern Brazil. Despite the strong
seasonality of rainfall, the fauna of caatinga is characteristic of mesic biomes and shows
no special physiological adaptations for coping with water limitation. Overall, the fauna
of caatinga is poor in endemics and species richness is lower than in other systems. This
study has two major objectives. First, I describe the seasonal distribution of common
medium- and large-sized vertebrates in relation to water sources. Second, I analyze the
feeding ecology of a large, widespread predator in caatinga. This study was conducted
from October 1999 until August 2000 in Serra da Capivara National Park. The first part
of this study describes the seasonal distribution of tegu lizards (Tupinambis teguixin),
rusty-margined guans (Penelope superciliaris), seriemas (Cariama cristata), crab-eating
foxes (Cerdocyon thous), pumas (Puma concolor), gray brocket deer (Mazama
gouazoubira), white-collared peccaries (Tayassu tajacu) and agoutis (Dasyprocta
prymnolopha) based on observational data. During the dry season, foxes and seriemas
moved from the dry plateau of the park to valleys where water holes are present. Other
species showed seasonal site fidelity and were observed mostly at lower (deer) or higher
(agouti) elevations. With the exception of pumas and agoutis, all species showed close
association with available water sources, at least during the dry season. The year-round
availability of water at lower elevations and overall differences in vegetation along the
elevational gradient influenced the distribution of species are discussed. The second part
of this study analyzes the diet of pumas in relation to the relative abundance and biomass
of prey. The relative abundance of felids in caatinga is compared with other neotropical
systems. Relative abundance of prey and felids were estimated using remote cameras.
ii

Puma diets were described following analysis of scats. Nine-banded armadillos (Dasypus
novemcinctus) accounted for 70 % of prey items and 69 % of the biomass consumed.
Pumas preyed on armadillos and lesser anteaters (Tamandua tetradactyla) more than
expected based on their relative abundance. Pumas selected against large prey, such as
peccaries and deer, and took agoutis and skunks (Conepatus semistriatus) in proportion
to their relative abundance and biomass. Pumas do not act as energy maximizers, but
rather as number maximizers, taking prey on encounter. Habitat structure is suggested as
an explanation for the observed prey selectivity, although competition with jaguars and
differences in prey vulnerability could also play a role. Pumas and oncillas (Leopardus
tigrina) are more abundant than jaguars (Panthera onca) and ocelots (L. pardalis) in this
system. Greater abundance of pumas than jaguars is explained by the scarcity of large
prey in this system, which favors the smaller puma. Low abundance of ocelots could be
due to low density of small mammals in caatinga and competition with pumas for
medium-sized prey.
iii

LIST OF TABLES AND FIGURES Figure 1.1. Serra da Capivara National Park: A: Location in Brazil, B: Elevational
gradient, census network, and distribution of water holes. ……………………...29
Figure 1.2. Monthly precipitation (mm) recorded in Serra da Capivara NP during the
study period (October 1999-August 2000). ……………………………………..30
Figure 1.3. Seasonal elevational distribution of seriemas, guans, foxes and pumas in
Serra da Capivara NP (October 1999-August 2000). …………………………...31
Figure 1.4. Seasonal elevational distribution of agoutis, deer, peccaries and tegu lizards
in Serra da Capivara NP (October 1999-August 2000). ………………………...32
Figure 1.5. Percentage of animals sightings within 500 m intervals from the nearest
water hole during the wet and dry season in Serra da Capivara NP (October 1999-August 2000). …………………………………………………………….……...33
Figure 1.6. Comparative illustration of area of potential habitat identified according to
the three water requirement models (one species per model is shown)……….....34
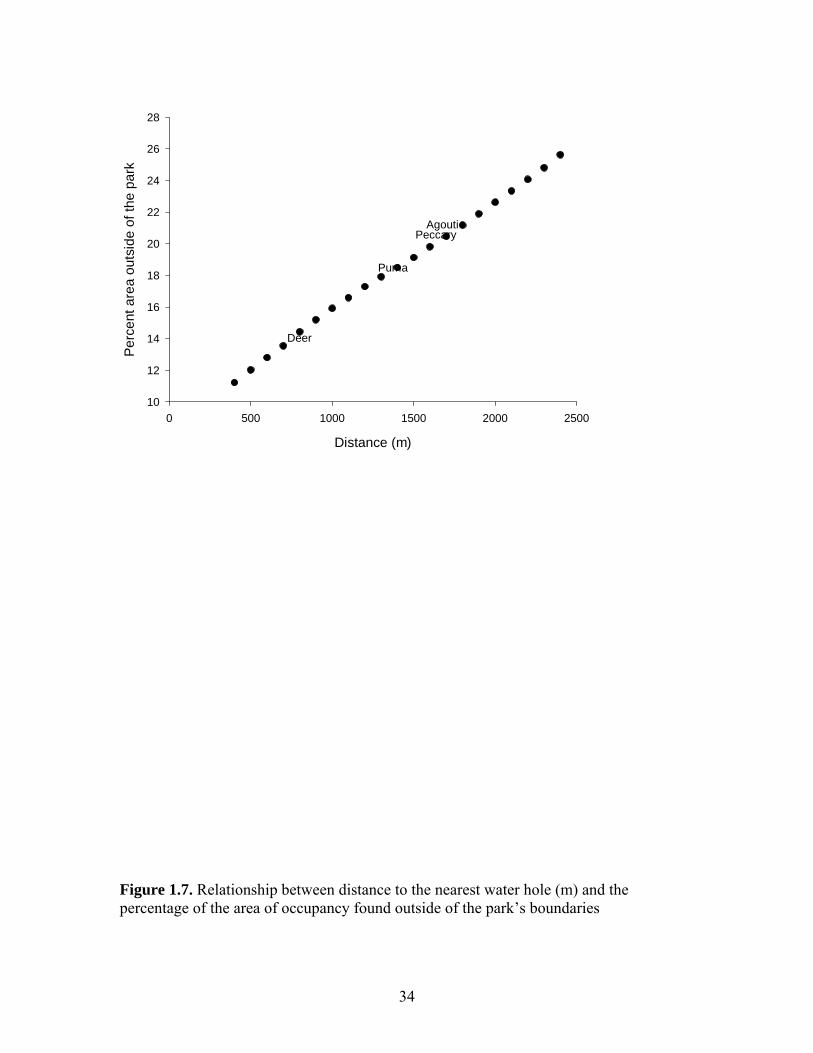
Figure 1.7. Relationship between distance to the nearest water hole (m) and the percentage of the area of occupancy found outside of the park’s boundaries. ….35
Figure 2.1. Relative abundance and relative biomass of puma prey in Serra da Capivara
NP, based on remote camera data. ………………………………………………66
Figure 2.2. Prey size distribution of terrestrial mammals (> 1 kg) from the Amazon,
caatinga, cerrado, pantanal, and chaco. Data were obtained from Fonseca et al. (1996), and Miserendino et al. (1998). Mammal assemblages were divided into two categories: < 15, and >15 kg. Jaguars, pumas, and maned wolves (Chrysocyon brachyurus) were not included. …………………………………...67
Table 1.1.: Number of observations of focal species during the wet and dry season in
Serra da Capivara NP (October 1999 – August 2000). Observations for peccaries and pumas include direct observations and track records. ………………………24
iv

Table 1.2.: Relationship between the elevational distribution of focal species between the wet and dry season and between seasons and expected. Expected values are based on the elevational distribution of computer-generated points along the census network in Serra da Capivara NP. (Spearman rank correlation coefficients (rs) and P values are given). ……………………………………………………………...25
Table 1.3.: Mean distance (m) and S.E. of animal locations to nearest water hole in the
wet and dry season, and both seasons combined. Mean distance (m) to the nearest water hole of computer-generated points along the census network was 1323 ± 44 (S.E.). ……………………………………………………………………………26
Table 1.4.: Combined mean distance (m) of animal locations to the ith (1 < i ≤ 10) water
hole between seasons in Serra da Capivara NP (October1999 – August 2000). The expected combined mean distance to the ith water hole of computer generated points along the census network was 2981 ± S.E. 20 …………………….……27
Table 1.5.: Area of occupancy (ha) of different species according to different water
requirement scenarios. Species are shown by increasing area of occupancy. …..28
Table 2.1.: List of prey taxa identified in puma scats, number of each prey type found in total (Ni), frequency of occurrence of prey expressed as a percentage of the total number of scats (FOi), and percent of occurrence of prey expressed as a percentage of the total number of food items identified (POi). (Grass is excluded in the calculation of PO)…………………………………………………..……..60
Table 2.2.: Mean weight of mammalian prey (Wi), percentage of occurrence of prey
(POi), frequency of occurrence of prey (FOi), correction factor (CFi) developed by Ackerman et al. (1984), and relative biomass of prey consumed (RBCi) by pumas in Serra da Capivara NP. ………………………………………………………...61
Table 2.3.: Relative abundance of mammalian prey of puma in Serra da Capivara NP.
Total number of photographs (Ni), relative abundance expressed as the percentage of the total number of photographs (RAi), body weight (Wi), Total estimated weight (TEWi), and Relative Biomass of Prey in the Environment (PBPEi) are given. ……………………………………………………………………………62
Table 2.4.: Observed (FOiobs)and expected (FOiexp) frequencies of occurrence of prey and
Bonferroni confidence intervals (95%). FOiexp are given based on relative biomass and relative abundance of prey in the environment. ………………………….…63
v

Table 2.5.: Minimum (Nmax) and maximum (Nmin) numbers of individual cats detected per species, minimum (RAmin) and maximum (RAmax) estimates of relative abundance and number of sites where species were detected. …………………..62
Table 2.6.: Percentage of occurrence POi) and relative biomass of small, medium and
large prey consumed by pumas (RBCi) in Jalisco, Mexico (Nunez et al. 2000), chaco, Paraguay (Taber et al. 1997), the llanos, Venezuela (Maxit 2001) and caatinga, Brazil (this study). Standardized niche breadth (Bsta) and mean weight of vertebrate prey (MWVP) are also given………………………………………....64
vi

TABLE OF CONTENTS
ACKNOWLEDGMENTS…………………………………………………………………i
ABSTRACT………………………………………………………………………...…….ii
LIST OF TABLES AND FIGURES……………………………………………………..iv
CHAPTER I. SPATIAL DISTRIBUTION OF COMMON MEDIUM- AND
LARGE-SIZED VERTEBRATES IN RELATION TO AVAILABLE WATER
RESOURCES IN SERRA DA CAPIVARA NATIONAL PARK
INTRODUCTION………………………………………………………………………...1
STUDY SITE……………………………………………………………………………...5
METHODS………………………………………………………………………………..7
Data collection…………………………………………………………………….7
GIS and statistical analysis………….…………………………………………….7
RESULTS………………………………………………………………………………….
12
Elevational distribution…………………………………………………………..12
Distance to the nearest water source……………………………………………..13
Density of water holes………………………...…………………………………13
Modeling of animal distributions………………………………………………...14
DISCUSSION……………………………………………………………………………15
LITERATURE CITED…………………………………………………………………..20
vii

CHAPTER II. FEEDING ECOLOGY OF PUMAS (PUMA CONCOLOR) IN
CAATINGA AND THE IMPORTANCE OF PREY AVAILABILITY IN
DETERMINING RELATIVE ABUNDANCE OF NEOTROPICAL CATS
INTRODUCTION………………………………………………………………….……36
STUDY SITE…………………………………………………………………………….40
METHODS………………………………………………………………………………41
Scat collection and analysis……………………………………………………...41
Relative abundance of felids and their prey……………………………………...43
Prey selectivity…………………………………………………………………...45
RESULTS………………………………………………………………………………..46
Puma diet………………………………………………………………………...46
Relative abundance of prey and prey selectivity………………………………...47
Relative abundance of felids……………………………………………………..47
DISCUSSION……………………………………………………………………………48
LITERATURE CITED…………………………………………………………………..55
viii

CHAPTER I
SPATIAL DISTRIBUTION OF COMMON MEDIUM- AND LARGE-
SIZED VERTEBRATES IN RELATION TO AVAILABLE WATER
RESOURCES IN SERRA DA CAPIVARA NATIONAL PARK
INTRODUCTION
Availability of water largely determines the distribution and abundance of animals
in arid and semi-arid environments and as a consequence, distribution and quality of
water are factors that influence carrying capacities of protected areas in such
environments (Thrash et al., 1995). Water availability depends on rainfall, which varies
greatly among and within years in arid and semi-arid environments, with most of the
annual precipitation falling within only a few months each year (Mares, 1999).
Variability of rainfall not only directly influences availability of water on a landscape
scale but also has strong impacts on the availability of animal food resources and
microclimatic conditions (Frankie et al., 1974; Bullock and Solis-Magallanes, 1990;
James et al., 1999; Griz and Machado, 2001).
Water is available to animals from three different sources including free water (i.e.,
streams, lakes, puddles, water holes), preformed water (i.e., water contained in food), and
oxidative or metabolic water (i.e., water produced as a product of the oxidation of organic
compounds containing hydrogen). Highly seasonal patterns of rainfall directly determine
the water levels of water holes and rivers (i.e., free water), and cause seasonal changes in
1

the availability of food, which, in return, leads to changes in the availability of preformed
water in the form of fruit pulp and fresh leaf material. In tropical dry forests, in particular,
fleshy fruits are available nearly exclusively during the wet season (Griz and Machado,
2001) and water content of grasses and leaves decreases dramatically during the dry
season and disappears altogether over large areas as most shrubs and trees shed their
leaves and as the herbaceous layer that covers the forest floor during the wet season
disappears (Bullock et al., 1995).
Water requirements and the availability of preformed water vary substantially among
species and are strongly influenced by basal metabolic rates, diet, body size, and activity
patterns (Robbins, 1993). In general, water requirements are highest for herbivores,
intermediate for omnivores, and lowest for carnivores and granivores. Water
requirements also increase with decreasing body size, because increasing metabolic rates
per unit of weight and higher surface/volume ratios increase water loss through
evaporation. Evaporation is also higher for diurnally active species because of higher
ambient temperatures during daytime. The intake of preformed water varies substantially
with diet, being highest for animal tissue and fruit (up to 70 %) and lowest for dry seeds
(2 – 3 %). These differences in water content of food indirectly influence the dependence
of animals on free water.
Animals may persist in water-limited environments by concentrating in areas with
relatively constant supplies of water, by producing resistant life forms to overcome
periods of water limitation, through dormancy, by seasonal resource tracking and
movements, or because of a high degree of tolerance of low-water conditions, through
behavioral and physiological adaptations ( Robbins, 1993; Schmidt-Nielson, 1997;
2

Valenzuela and Ceballos, 2000). Although physiological adaptations to extreme water
deprivation have been documented in a variety of taxa restricted to dry environments,
many other, more widespread species, exclusively rely on behavioral strategies to avoid
dehydration (Schmidt-Nielsen, 1997; Bothma, 1998). For example, seasonal movements
from and to areas with high abundance of free water are a commonly observed behavioral
strategy of medium- to large-sized vertebrates for overcoming water limitation during the
dry season (Western, 1975; Rautenstrauch and Krausman, 1989; Thrash et al., 1995).
Behavioral adaptations to water limitation are expected to be particularly
prevalent for animals in caatinga, a seasonally dry deciduous forest, situated in the
northeast of Brazil (Sampaio, 1995). The fauna of caatinga is very poor in endemics
(Vanzolini, 1976; Fonseca et al., 1999) and is characteristic of mesic environments,
showing no physiological adaptation for water conservation (Mares et al., 1985). In the
absence of physiological adaptations to aridity, rodents and bats, for example, continue to
inhabit caatinga by persisting in mesic enclaves during droughts, recolonizing dry scrub
forests during moist portions of the year (Mares et al., 1985).
Serra da Capivara National Park, the largest protected area of caatinga and the
study site of this project, has no rivers and free water is available only at very unevenly
distributed small water holes situated in valleys and canyons (Figure 1.1.), leaving
extensive areas at higher elevations with virtually no free water (FUMDHAM, 1998). As
a consequence of the spatial distribution of free water in Serra da Capivara NP, animals
are expected to either engage in seasonal movements along the elevational gradient or be
resident in areas with high or low availability of water, depending on their water
requirements and mobility.
3

The ecology of vertebrates, as well as invertebrates, in caatinga is very poorly
understood and many large animals have been extirpated over vast areas due to habitat
alteration and hunting (Sampaio, 1995). The persistence of many species will depend on
sound management practices in protected areas, which requires a better understanding of
animal water requirements, likely the major limiting factor of animal distribution in this
system (Mares et al. 1985). The overall goal of this study is to describe the distributional
patterns of the most common medium to large vertebrate species in relation to water
sources in caatinga. The focal species of this study are tegu lizards (Tupinambis teguixin),
rusty-margined guans (Penelope superciliaris), seriemas (Cariama cristata), crab-eating
foxes (Cerdocyon thous), pumas (Puma concolor), gray brocket deer (Mazama
gouazoubira), white-collared peccaries (Tayassu tajacu), and agoutis (Dasyprocta
prymnolopha).
Seasonal changes in distance to the nearest waterhole are often considered an
indication of seasonal movements in relation to water availability (Western, 1975;
Rautenstrauch and Krausman, 1989; Thrash et al., 1995). This distance measure does not,
however, account for overall water availability to animals and ignores the local influence
of water holes, other than the one closest to each animal location, on the distribution of
species. In this paper, I will compare mean distance to the nearest and to the ten closest
water holes between seasons. I will interpret mean distance to the nearest water hole as an
approximation of how far animals are able to venture from any single water source,
whereas the mean distance to the ten closest water holes will be viewed as an index of
water density.
4

Specifically, the objectives of this study are: 1) to compare the distribution of
animal locations between wet and dry seasons along the elevational gradient of the park;
2) to make a seasonal comparison of the distribution of animals in relation to the nearest
water hole; 3) to determine if animals tend to be found in areas with different densities of
water holes among seasons; and, 4) to extrapolate observed patterns of animal
distribution in relation to water from an intensive study area to the entire park, using
different water requirement models, to predict areas of occupancy by different species.
STUDY SITE
Serra da Capivara National Park (SCNP) covers approximately 130,000 ha in the
southeast of the state of Piaui, Brazil (approx. 8°30-8°50’ S and 42°20-42°50’ W; Figure
1.1.) within the semi-arid caatinga biome. Annual rainfall in caatinga may vary from
close to zero to as much as ten times the long-term annual average and deviation from the
normal rainfall may be higher than 55 %. Usually, 20% of the annual rainfall occurs on a
single day and 60% in a single month (de Andrade Lima, 1981; Sampaio, 1995). Most
rain falls between September and March. Average annual rainfall is 644 mm, with a 50-
year maximum of 1,131 mm and minimum of 250 mm (Emperaire, 1984). Mean annual
temperature is 27.6° C. SCNP is the largest caatinga preserve and likely represents the
last area in the entire ecosystem where jaguars (Panthera onca), giant anteaters
(Myrmecophaga tridactyla), and white-lipped peccaries (Tayassu pecari) co-occur
(Olmos, 1992; FUMDHAM, 1998).
Eight vegetation types have been described in SCNP (Emperaire, 1984). Most of
the park, including the central plateau, is covered by old-growth, species-rich, arboreal-
5

arbustive (i.e., shrubby) vegetation (6-10 m tall). Other vegetation types range from
mesic 30-m tall, semi-deciduous forests located in canyons to bushy formations rich in
cacti and bromeliads that occupy rocky areas (Olmos, 1992). Areas previously occupied
by human settlements are covered by secondary vegetation, predominantly composed of
Croton sp. and Senna fannesiana. Secondary caatinga vegetation is found mainly at
intermediate elevations around 480 – 520 m.
Topographically, the park is composed of a main plateau, which is bounded by
cliffs, 50 to 200 m high, and dissected by valleys and canyons, mostly near the
boundaries of the park. The elevational gradient in the park ranges from 280 m to more
than 600 m above sea level (Figure 1.1.). The central plateau lies between 520 and 600 m.
Soils on the plateau are mainly yellow-red latosols, whereas in the canyons, soils are
mainly composed of white sand. Extensive areas of shallow soils and exposed rock can
be found along the borders of the plateau. My study area covered ~ 300 km2 (23 % of the
park) along the eastern border of the park, following a northeast - southwest roadway and
its branches (Figure 1.1).
There is no permanent watercourse in the park. Free water is found in natural and
manmade water holes and ponds distributed unevenly throughout the park (Figure 1.1.).
During the wet season, water temporarily accumulates in shallow rocky depressions and
puddles, which evaporate within a few days without rain. Water holes in the study area
form four distinct aggregates of approximately 10 water holes each (Figure 1.1.). Rainfall
is the major source of water, although several natural water holes benefit from a
continuous supply of water through infiltration. I do not know the amount, quality, and
persistence of water within water holes. However, just a few of those water holes that I
6

visited regularly dried out during the dry season. Those that did dry out were artificially
supplemented by the park’s management shortly thereafter.
METHODS
Data collection
Data were collected from October 1999 until August 2000. Seasons were defined
based on precipitation data collected during this study. November through April are
referred to as wet, whereas October and May through August are dry (Figure 1.2.). Data
on animal locations in both seasons are based on direct observations and tracks, recorded
while driving or on foot. Observations and track records were made on 108 days during
the wet season and 90 during the dry season. I used 55.8 km of roads and trails for animal
observations; 10.7 km were covered on foot and 45.1 km by car. I entered the park
usually shortly before or after sunrise and used either the Serra Vermelha or BR20 access
(Figure 1.1.). I drove at low speed (± 25 km/h), usually from one entrance to the other but
I occasionally used the same gate for entering and leaving the park. I did not drive
continuously from one entrance to the other but made frequent stops to conduct
observations on foot. I used a GPS unit (Garmin-GPS 12) to record UTM coordinates,
date and time of observations for all animals or tracks encountered.
GIS and statistical analyses
Elevational data and general GIS layers, such as locations of water holes, park
boundaries, and the road and trail system within the park were obtained through the
Fundação Museu do Homem Americano (FUMDHAM). I had at my disposition a
7

database of 256 water holes distributed within and around the park. All calculations of
distance of animal locations to water sources were made in relation to the 43 water holes
within my study site (Figure 1.1.). I used ArcView 3.1 and several public-domain scripts
and extensions available at http://gis.esri.com/arcscripts/scripts.cfm (ESRI, Redland, CA)
to produce tables relating animal locations with geographic features such as elevation,
and distance to water sources.
Due to the dense vegetation of caatinga, observations of animals are mostly
limited to trails and roads. Restriction to roads can bias observational data towards
species that commonly use roads as traveling routes (Wolff , unpublished data), and may
also creates a bias in the geographic information attributed to these observations. Indeed,
values for distance to the nearest water hole or elevation are constrained by where roads
are found, which is rarely representative of the overall landscape. To account for such
biases, I compared all observed results on elevational distribution and mean distance to
water holes to the geographic attributes of a set of computer-generated regularly spaced
points along roads and trails used for animal censuses. For this comparison, I created a
total of 579 points separated by 100 m along the census network, “using the route hatch
1.1.” extension for ArcView 3.1 (see web site address above).
All variables were tested for normality (Shapiro-Wilk test) and equality of
variances (Barlett’s test) before statistical analyses. Variables that did not meet these
assumptions were analyzed with appropriate non-parametric tests. All statistical tests are
described in Zar (1999).
8

Elevational distribution The available elevational gradient of the park was
subdivided in six belts of 40 m each. Thus, I expressed elevational distribution as the
number of observations per species and season per 40 m elevational belt. I used a
Spearman rank correlation for comparing observed frequency distributions of animal
sightings at different elevations with expected values derived from the distribution of
computer-generated points. The same statistical procedure was used when comparing
observed frequency distributions of animal sightings at different elevations across
seasons with the elevational distribution of water holes in the study area. Sample size for
all correlations was six, i.e., the number of elevational belts. Significant positive
correlation between the observed and expected elevational distributions indicates close to
random distribution along the elevational gradient. Correlation between observed and
expected should be weaker during the dry season, when the distribution of animals is
most likely to be influenced by the availability of water at particular elevations. Strong
significant positive correlation between the elevational distribution during the wet and the
dry season is an indication of little or no changes in distribution between seasons,
whereas no correlation or a negative correlation are indicative of seasonal movements.
Distance to water: Distance to water (xij) was calculated for the ten closest water
holes (1< i ≤ 10) for each animal location (j), using the “Nearest Feature v.3.3” extension.
Subsequently, mean distance to the ith water hole (Σx1j/ny, Σ2j/ny,…, Σx10j/ny) and the
overall mean distance to the 10 closest water holes (Σxij/ny) were calculated for each
species (y) for both seasons. Mean distance was calculated for the 10 closest water holes
because water holes within the study area were found in four distinct aggregates of
approximately 10 water holes each (Figure 1.1.). To compare the mean distance to water
9

for animal locations between seasons and across species, I used a Kruskall-Wallis test.
Multiple comparisons of mean distance to water were made using a non-parametric
multiple comparisons test with unequal sample sizes (Zar, 1999). The mean distance of
water holes and computer-generated points to the park’s border were compared using a
Mann Whitney U test.
Modeling of animal distribution: Water requirements and mobility vary among
focal species and, consequently, animals are expected to perceive the distribution of
water holes (i.e., density) in their surroundings at different scales. The extrapolation of
potential habitat for different species from the intensive study site to the entire park was
based on the spatial attributes of a set of evenly spaced points that covered the park and a
5 km buffer zone. This point file was created using a set of straight vertical lines,
separated by 100 m (extension: Grmake2) that covered the park and the 5 km buffer zone.
I then used the “route hatch 1.1” extension (see above) to create a total of 330,180 points,
separated by 100 m, along these lines. The distance from any of these points to the ith (1<
i ≤10) nearest water hole (using all 256 mapped water holes) was calculated using the
Nearest Feature V.3.3 extension.
Models were based on observed mean distances to the 10 nearest water holes (xi)
within the intensive study area. For each species, I identified all computer-generated
points within the area of the park and the 5-km buffer that satisfied the conditions of
mean distance to the ith water hole assigned by the models described below. The area of
potential habitat was calculated by summing the area covered by all points.
Model 1. Animals are found exclusively within x1 m of the nearest water hole,
independently of all other water holes. This scenario describes the movements and
10

distribution of water-dependent species, whose home range is centered around a single
water hole.
Model 2. Animals are found in areas that are within x1 OR x2, ….,OR x10 m from
the ith water hole (1 < i ≤10). This least-restrictive scenario describes the distribution and
movement pattern of a water-independent species that occasionally drinks when water is
available.
Model 3. Animals are found in areas that are within x1m of the nearest water hole
AND within x2 OR x3, …., OR x10 m or the ith water hole. This model is similar to the
first one, in that species need to be in the vicinity of water at all times but their home
ranges exceed the immediate vicinity of a single water hole and need to comprise more
than one water hole.
11

RESULTS
Elevational distribution
Overall, I obtained 165 animal locations during the dry and 229 during the wet
season (Table 1.1.). Seriemas, pumas, and guans were recorded more frequently during
the dry season. Tegu lizards showed the largest difference between seasons, with 95 % of
all records made during the wet season.
The elevational distributions of foxes, peccaries, guans, deer and tegu lizards were
significantly correlated with the elevational distribution of computer-generated points
(i.e., points along census network) during the wet season (Figure 1.3., Figure 1.4., Table
1.2.) indicating that their distribution was not different from random. The guan was the
only species showing significant correlation with expected during the dry season (Table
1.2.).
Observed patterns of elevational distribution between wet and dry season were
significantly correlated for guans and deer. Lack of correlation between seasons for all
other species, suggest seasonal differences in distribution. The distributions of seriemas
(dry season: r = 0.986, p < 0.001) and deer (dry season: r = 0.985, p < 0.001; wet season:
r = 0.896, p = 0.016) were significantly correlated with the distribution of water holes
along the elevational gradient of the study site. No seasonal analysis of the elevational
distribution of tegu lizards was attempted because of the limited number of observations
during the dry season (Table 1.1.). Both foxes and seriemas show clear evidence of a
downward movement during the dry season, when they were observed particularly more
than expected between 440 and 480 m (Figure 1.3.).
12

Distance to nearest water source
There was no significant difference in either season between observed and
expected mean distance to the nearest water hole for all species combined (dry season:
1389 m ± 86 (S.E.); wet season: 1282 m ± 64 (S.E.); expected: 1323 m ± 44; Kruskall-
Wallis χ2 = 0.455, df = 2, p = 0.792). Nevertheless, significant differences among
species within and between seasons and between species and expected values existed
(Kruskall-Wallis χ2 = 57.8, df = 16, p < 0.001). Agoutis occur farther than expected from
water holes during the dry season and were found farther from the nearest water hole than
any other species, except for peccaries, during both wet and dry seasons. Despite the lack
of significant seasonal differences in distance to the nearest water hole, species could be
classified in three groups, based on their observed distribution in relation to the nearest
water hole (Figure 1.5., Table 1.3.): 1. Species with more than 75 % of observations
within 1500 m of the closest water hole during both seasons (tegu, seriema, deer); 2.
Species with more than 75 % of observations within 1500 m of the nearest water hole
during the dry season and less than 75 % of observations within 1500 m during the wet
season (fox, guan); 3. Species with less than 50 % of observations within 1500 m of the
closest water hole during both seasons (agouti).
Density of water holes
Mean distance to the 10 nearest water holes was different from expected during
the dry season for all species combined (dry season: 3158 ± 39 (S.E.); wet season: 3060 ±
31 (S.E.); expected: 2981 ± 20 (S.E.); Kruskall-Wallis χ2 = 14.5, df = 2, p = 0.001).
13

Mean distance to the 10 closest water holes differed among species, between seasons
(Kruskall-Wallis χ2 = 353.95, df = 16, p < 0.001) (Table 1.4.). Agoutis were found in
areas with fewer water holes than any other species in both seasons. During the wet
season, guans occupied areas with fewer water holes than did pumas, tegu lizards, and
seriemas. During the wet season tegu lizards and deer were found in areas with more
water holes than expected; guans were found in areas with fewer water holes than
expected during the wet season. Seriemas were found in areas with more, and agoutis in
areas with fewer water holes than expected during both seasons. No significant
differences in mean distance to the 10 nearest water holes between seasons could be
detected for any of the species.
Modeling of animal distributions
Models differ in terms of total area of potential habitat they define, and in the degree
of fragmentation of identified areas (i.e., the number of distinct patches) within the park
(Table 1.5., Figure 1.6.). Independent of the model, total area of potential habitat
increases and the degree of fragmentation decreases with increasing mean distance from
water. Model 3 (water-dependent species with large home ranges, including deer, foxes,
seriemas) provides the smallest area of distribution, and an intermediate level of
fragmentation. Model 1 (water-dependent species with small home ranges, including tegu
lizards) produced the highest degree of fragmentation and the second largest overall area.
Finally, Model 2 (species less dependent on water with large home ranges, including
pumas, peccaries, agoutis and guans) produces the largest overall area and the lowest
degree of fragmentation.
14

The mean distance of water holes from the park’s border is significantly smaller than
expected based on computer-generated points (water holes: 2,973.4 m ± 356.7 (S.E.);
random points: 4,591.2 m ± 153 (S.E); Mann Whitney U = 3,025, P < 0.001), indicating
that the distribution of water holes is significantly biased towards the park’s edge. The
percentage of area of occupancy situated outside of the park’s boundaries increases with
mean distance form the nearest water hole, varying between approximately 15 % for tegu
lizards to more than 20 % for agoutis (Figure 1.7.).
DISCUSSION
Roads and trails in the park are, for the most part, ancient manmade pathways that
connect different water holes in the region, which limits the access of people to areas rich
in water (FUMDHAM, 1997). As a consequence, large areas of the park (i.e., areas
without water) are relatively inaccessible, which limited my ability to observe large-scale
movements between water-poor and water-rich areas. The distribution of water in the
study site also affects the applicability of the models used for extrapolating species’
distributions to the entire park. For species found at greater than expected distances from
water, such as pumas, agoutis and peccaries, extrapolations likely underestimate their
overall distribution. However, species found at closer than expected distances from water,
such as tegu lizards, deer and foxes are very likely to be spatially restricted and, thus,
extrapolations to other areas may be justified.
Despite the spatial limitations of the study area, distribution of focal species along
the elevational gradient did appear to be influenced by the availability of water. All
species, with the exception of pumas and agoutis, showed a close association with
15

available water sources at least during the dry season. Agoutis showed the most
distinctive distributional pattern of all species, being observed most frequently at high
elevations far away from water. Crab-eating foxes and seriemas seem to undergo
seasonal movements to lower elevations. Guans also seemed to expand their range to
lower elevations during the dry season, abandoning areas above 600 m. Other species
showed seasonal site fidelity and were observed mostly at lower (deer) or higher (agouti)
elevations. Although peccaries appeared to be restricted to intermediate elevations during
the dry season, documentation of seasonal movements of wide ranging species, such as
peccaries and pumas would require sampling over a much greater area.
Whether the distribution of species is driven by the availability of water or other
factors such as differences in vegetation and food availability along the elevational
gradient remains unclear and requires direct monitoring of animal movements and
visitation at water holes (Vaughan and Weis, 1999). Nevertheless, results of this study
suggest that deer, seriemas and tegu lizards are restricted to areas close to water holes.
Related species are dependent on free water at least during periods of water shortage. For
example, guans (Penelope albipennis) and deer (Odocoileus hemonius) have been
reported to drink frequently and to move to areas where water still remains during the
driest part of the year (del Hoyo, 1994; Boroski and Mossman, 1996, 1998;
Rautenstrauch and Krausman, 1989; Sanchez-Rojas and Gallina, 2000). Tegu lizards,
because of their exclusively diurnal activity pattern, which exposes them to higher
ambient temperatures and risk of increased water loss, need to derive a significant portion
of water from sources other than food (Green et al., 1997), which may explain their close
association with free water in Serra da Capivara NP. Increased water loss during the dry
16

season seems to be incompatible with sustained activity of tegu lizards in caatinga, as
they go into dormancy during the driest part of the year.
The dependency of frugivores on free water is likely to be affected by seasonal
changes in fruit production. Fleshy fruits, rich in preformed water, are produced nearly
exclusively during the wet season in caatinga (Griz and Machado, 2001). Species feeding
on fleshy fruit may either switch to food poor in preformed water, which increases their
requirements for free water, or move to canyons at lower elevations during the dry season
where fleshy fruit are still available (Emperaire, 1984; Coimbra-Filho and de Gusmao
Camara, 1996). Peccaries in dry forests feed mostly on nutritious and succulent fruits and
leaves during the wet season and switch to low quality tubers and roots in the dry season
(McCoy et al., 1990; Martinez-Romero and Mandujano, 1995; Mandujano, 1999). When
succulent plants are readily available, peccaries can meet their water requirements
exclusively through preformed water (Minnamon, 1962 in Sowls, 1997). The relative
scarcity of fruit in Serra da Capivara NP, coupled with a low intake of preformed water
during the dry season, may make peccaries in caatinga more dependent on free water than
in other systems, and may explain their closer association with water when fruit is scarce.
Seasonal changes in diet that are related to fruit avalability may also increase the
water requirements of crab-eating foxes during the dry season. During the wet season,
foxes feed extensively on fleshy fruit such as Ziziphus joazeiro and Spondias tuberosa (L.
Griz, unpub. data), which are found at high densities within a few areas of the park. Thus,
not only do they feed on food that is rich in preformed water, but their energy
expenditure may be less due to the local abundance of fruit in relatively small patches.
Dry season diets are mainly composed of animal food, which although rich in preformed
17

water, also contains much protein. The metabolism of protein produces nitrogenous
waste, excreted as urea in urine, which requires water as a solvent (Robbins, 1993).
Agoutis mainly feed on fruit pulp during the fruiting peak and switch to seeds when fruit
production is low (Griz, unpublished data, Henry, 1999). Scatter hoarding provides them
with sufficient supplies of seeds for periods of low fruit production. Thus, agoutis, as
opposed to guans, may not need to move from the plateau to mesic canyons. Exactly how
agoutis cope with low water availability remains unclear but may involve physiological
adaptations for water conservation and reabsorbtion and/or behavioral strategies (see
Morton and MacMillan, 1982).
Differences in vegetation along the elevational gradient are likely to be another
major factor determining the distribution of species described here. The central valley of
my study site was used as agricultural land before the creation of the park. As a result,
most of the vegetation found at intermediate elevations is composed of secondary
vegetation dominated by Croton sp. and Senna fannesiana. These legumes produce small
seeds commonly consumed by deer. Large seeded species such as Manihot sp. and
Dioclea, which are consumed by agoutis and peccaries (Olmos, 1993a) are found nearly
exclusively at higher elevations, characterized by primary or old-growth forest. Thus, the
distribution of deer and agouti may at least in part be related to the availability of
preferred food resources at different elevations.
Modeling has shown that water-dependent species with large home ranges have
the smallest amount of suitable area available to them. As a result of the clumped
distribution of water holes along the border of the park, the same species are exposed to
increased mortality conditions related to human activity along boundaries of protected
18

areas (Woodroffe and Ginsberg, 1998). Water close to the park boundaries also attracts
livestock and feral pets (e.g., cows, goats, horses, dogs), which negatively impact native
species through predation, competition for water, and possible transmission of diseases.
As a consequence, further artificial water holes should be constructed towards the interior
of the park, if there were a need for more water developments. Whether more water
developments are needed remains unclear, although this study has shown that several
species may benefit from such initiatives in the short run. A pilot study on the use of
water holes by wildlife species proved that species such as deer, puma, foxes, oncillas
(Leopardus tigrina), opossums (Didelphis marsupialis) and numerous birds including
rare species such as King Vultures (Sarcoramphus papa) regularly drink at water holes in
Serra da Capivara NP. Increased water availability would not create the same problems of
overgrazing, soil compactation and consequent stalling of regeneration process observed
in many parts of Africa and Australia (Morton, 1990; Parker and Witkowski, 1999;
Owen-Smith, 1996), because biomass of browsers and grazers is comparatively low. In
the long run, however, increased water availability will benefit local wildlife populations
only if water is clearly the main limiting factor (Robbins, 1993).
19

LITERATURE CITED
Boroski, B.B., and A.S. Mossman. 1996. Distribution of mule deer in relation to water sources in northern California. Journal of Wildlife Management 60:770-776.
Boroski, B.B., and A.S. Mossman. 1998. Water use patterns of mule deer (Odocoileus hemonius) and the effect of human disturbance. Journal of Arid Environments 38:561-569.
Bullock, S.H., and J.A. Solis-Magallanes. 1990. Phenology of canopy trees of a tropical deciduous forest in Mexico. Biotropica 22:22-35.
Coimbra-Filho, A.F., and I. de Gusmao Camara. 1996. Os limites originais do bioma Mata Atlantica no regioa do nordeste do Brasil FBCN.
de Andrade Lima, D. 1981. The caatinga dominium. Revista Brasileira de Botanica 4:149-153.
del Hoyo, J. 1994. Cracidae, in J. del Hoyo, et al., eds. Handbook of the birds of the world. New world vultures to guineafowl, Vol. 2. Lynx edition, Barcelona.
Eddy, T.A. 1961. Food and feeding patterns of the collared peccary in southern Arizona. Journal of Wildlife Management 25:248-257.
Eisenberg, J.F., and K.H. Redford. 1999. Mammals of the neotropics: The Central Neotropics Ecuador, Peru, Bolivia, Brazil Vol.3. The Universoty of Chicago Press, Chicago.
Emperaire, L. 1984. A regiao da Serra da Capivara (Sudeste do Piaui) e sua vegetação. Brasil Florestal 60:5-21.
Fonseca, G.A.B., G. Herrman, and Y.L.R. Leite. 1999. Macrogeography of Brazilian Mammals, pp.549-563, In J. F. Eisenberg and K. H. Redford, (eds.) The Central Neotropics Ecuador, Peru, Bolivia, Brazil, Vol. 3. The University of Chicago Press, Chicago.
Frankie, G.W., H.G. Baker, and P.A. Opler. 1974. Comparative phenological studies of trees in tropical wet and dry forests in the lowlands of Costa Rica. Journal of Ecology 62:881-919.
FUMDHAM. 1998. Parque Nacional Serra da Capivara Piaui Brasil Alinea Publicaçoes Editora, Teresina, Brazil.
Green, B., E. Herrera, D. King, and N. Mooney. 1997. Water and energy use in a free-living tropical, carnivorous lizard, Tupinambis teguixin. Copeia 1997:200-203.
Griz, L.M.S., and I.C.S. Machado. 2001. Fruiting phenology and seed dispersal syndromes in caatinga, a tropical dry forest in the northeast of Brazil. Journal of Tropical Ecology 17:303-321.
Henry, O. 1999. Frugivory and the importance of seeds in the diet of the orange-rumped agouti (Dasyprocta leporina) in French Guiana. Journal of Tropical Ecology 15:291-300.
20

James, C.D., J. Landsberg, and S.R. Morton. 1995. Ecological functioning in arid Australia and research to assist conservation of biodiversity. Pacific Conservation Biology 2:126-142.
James, C.D., J. Landsberg, and S.R. Morton. 1999. Provision of watering points in the Australian arid zone: a review of effects on biota. Journal of Arid Environments 41:87-121.
Kie, J.G., V.C. Bleich, A.L. Medina, J.D. Yoakum, and J.W. Thomas. 1996. Managing rangelands for wildlife, p. 663-688, in T. A. Bookhout, (ed.) Research and management techniques for wildlife and habitats, 5 ed. The Wildlife Society, Bethesda.
King, D., B. Green, and E. Herrera. 1994. Thermoregulation in a large teiid lizard, Tupinambis teguixin, in Venezuela. Copeia 1994:806-808.
Maehr, D.S. 1997. The Florida Panther Life and death of a vanishing carnivore. Island Press, Washington.
Mandujano, S. 1999. Variation in herd size of collared peccaries in a Mexican tropical forest. Southwestern Naturalist 44:199-204.
Mares, M.A., M.R. Willig, and T.E. Lacher jr. 1985. The Brazilian caatinga in South American zoogeography: tropical mammals in a dry region. Journal of Biogeography 12:57-69.
Martinez-Romero, L.E., and S. Mandujano. 1995. Eating habits of the collared peccary (Pecari tajacu) in a tropical dry forest of Jalisco, Mexico. Acta Zoologica Mexicana Nueva Serie 0:1-20.
McCoy, M.B., C.S. Vaughan, M.A. Rodrigues, and K. Kitchen. 1990. Seasonal movements, activity and diet of the collared peccary (Tayassu tajacu) in Costa Rican dry forests. Vida Silvestre Neotropical 2:6-20.
Minnamon, P.S. 1962. The home range of the collared peccary, Pecari tajacu (Mearns), in he Tuscon Mountains, Master's thesis, University of Arizona, Tucson.
Morton, S.R. 1990. The impact of European settlement on the vertebrate animals of arid Australia: a conceptual model. Proceedings of the Ecological Society of Australia 16:201-213.
Morton, S.R., and R.E. MacMillan. 1982. Seeds as resources of preformed water for desert dwelling granivores. Journal of Arid Environments 5:61-67.
Olmos, F. 1992. Serra Da Capivara National Park and the conservation of northeastern Brazil's caatinga. Oryx 26:142-146.
Olmos, F. 1993a. Diet of sympatric Brazilian caatinga peccaries. Journal of Tropical Ecology 9:255-258.
Owen-Smith, N. 1996. Ecological guidlines for waterpoints in extensive protected areas. South African Journal of Wildlife Research 26:107-112.
21

Parker, A.H., and E.T.F. Witkowski. 1999. Long-term impacts of abundant perennial water provision for game on herbaceous vegetation in a semi-arid African savanna woodland. Journal of Arid Environments 41:309-321.
Rautenstrauch, K.R., and P.R. Krausman. 1989. Influence of water availability and rainfall on movements of Desert Mule Deer. Journal of Mammalogy 70:197-201.
Robbins, C.T. 1993. Wildlife feeding and nutrition. 2 ed. Academic Press, San Diego.
Sampaio, E. 1995. Overview of the Brazilian caatinga, In S. H. Bullock, H. Mooney and E. Medina, (eds.) Seasonnaly dry tropical forests. Cambridge University Press, Cambridge.
Sanchez-Rojas, G., and S. Gallina. 2000. Mule deer (Odocoileus hemionus) density in a landscape element of the Chihuahuan Desert, Mexico. Journal of Arid Environments. 44:357-368.
Schmidt-Nielsen, K. 1997. Animal physiology, adaptation, and environment. 5 ed. Cambridge University Press, Cambridge.
Sowls, L.K. 1997. Javelinas and other peccaries. Their biology, management and use Texas A+M University Press, College Station.
Sunquist, M.E., F. Sunquist, and D.E. Daneke. 1989. Ecological separation in a Venezuelan carnivore community, p. 197-232, in K. H. Redford and J. F. Eisenberg, (eds.) Advances in Neotropical mammalogy. Sandhill Crane Press, Gainesville.
Thrash, I., G.K. Theron, and J.D.P. Bothma. 1995. Dry season herbivore densities around drinking troughs in the Kruger National Park. Journal of Arid Environments 29:213-219.
Valenzuela, D., and G. Ceballos. 2000. Habitat selection, home range, and activity of the white-nosed coati (Nasua narica) in a Mexican tropical dry forest. Journal of Mammalogy 81:810-819.
Vanzolini, P.E. 1976. On the lizards of a cerrado-caatinga conatct: evolutionary and zoogeographical implications (Sauria). Pap. Avul. Zool. (Sao Paulo) 19:111-119.
Vaughan, C., and K. Weis. 1999. Neotropical dry forest wildlife water hole use and management. Revista de Biologia Tropical 47:1039-1044.
Verlinden, A. 1997. Human settlements and wildlife distribution in the southern Kalahari of Botswana. Biological Conservation 82:129-136.
Western, D. 1975. Water availability and its influence on the structure and dynamics of a savannah large mammal community. East African Wildlife Journal 13:265-286.
Willig, M.R., and M.A. Mares. 1989. Mammals of the caatinga: an updated list and summary of recent research. Revista Brasileira de Biologia 49:361-367.
Woodroffe, R., and J.R. Ginsberg. 1998. Edge effects and the extinction of populations inside protected areas. Science 280: 2126-2128.
Zar, J.H, 1999. Biostatistical Analysis. Fourth edition. Prentice Hall, Upper Saddle River
22

Table 1.1. Number of observations of focal species during the wet and dry season in Serra da Capivara NP (October 1999 – August 2000). Observations for peccaries and pumas include direct observations and track records.
Species Family Season Common name Scientific name Dry Wet Tegu Tupinambis teguixin Teidae 4 70 Rusty-margined guan Penelope superciliaris Cracidae 31 29 Red-legged seriema Cariama cristata Cariamidae 20 13 Crab-eating fox Cerdocyon thous Canidae 18 25 Puma Puma concolor Felidae 41 18 Agouti Dasyprocta punctata Dasyproctidae 25 28 Gray brocket deer Mazama gouazoubira Cervidae 14 20 Collared peccary Tayassu tajacu Tayassuidae 12 26
23

Table 1.2. Relationship between the elevational distribution of focal species between the wet and dry season and between seasons and expected. Expected values are based on the elevational distribution of computer-generated points along the census network in Serra da Capivara NP. (Spearman rank correlation coefficients (rs) and P values are given)
Wet-Dry Dry-Expected Wet-Expected Species rs P rs P rs P 1. Species showing evidence of seasonal movements along the elevational gradient
Seriema 0.516 0.29 0.714 0.11 0.395 0.43 Fox 0.185 0.72 0.152 0.77 0.986 0.00 Puma 0.478 0.34 0.771 0.07 0.478 0.34 Peccary 0.216 0.68 0.213 0.69 0.986 0.00 Agouti 0.309 0.55 0.290 0.58 0.725 0.10 2. Species showing no evidence of seasonal movements along the elevational gradient Tegu 0.886 0.02 Guan 0.812 0.05 0.886 0.02 0.844 0.04 Deer 0.955 0.00 0.795 0.06 0.883 0.02
24

Table 1.3. Mean distance (m) and S.E. of animal locations to nearest water hole in the wet and dry season, and both seasons combined. Mean distance (m) to the nearest water hole of computer-generated points along the census network was 1323 ± 44 (S.E.)
Species Dry season Wet season Seasons combined
X S.E. X S.E. X S.E. Puma 1356 138 1162 171 1297 109 Peccary 1586 282 1612 264 1618 167 1. Species with more than 75 % of observations within 1500 m of the closest water hole during both seasons
Tegu* 964 79 Seriema 1114 118 1026 154 1080 92 Deer 945 200 906 159 922 123 2. Species with more than 75 % of observations within 1500 m of the nearest water hole during the dry season and less than 75 % of observations within 1500 m during the wet season Guan 1269 251 1631 209 1444 164 Fox 1042 211 1328 199 1208 146 3. Species with less than 75 % of observations within 1500 m of the closest water hole during both seasons Agouti 2349 260 2029 214 2180 166 * Tegus are included in group 1. because they most likely go into dormancy during the dry season within the same area they occupied during the wet season
25
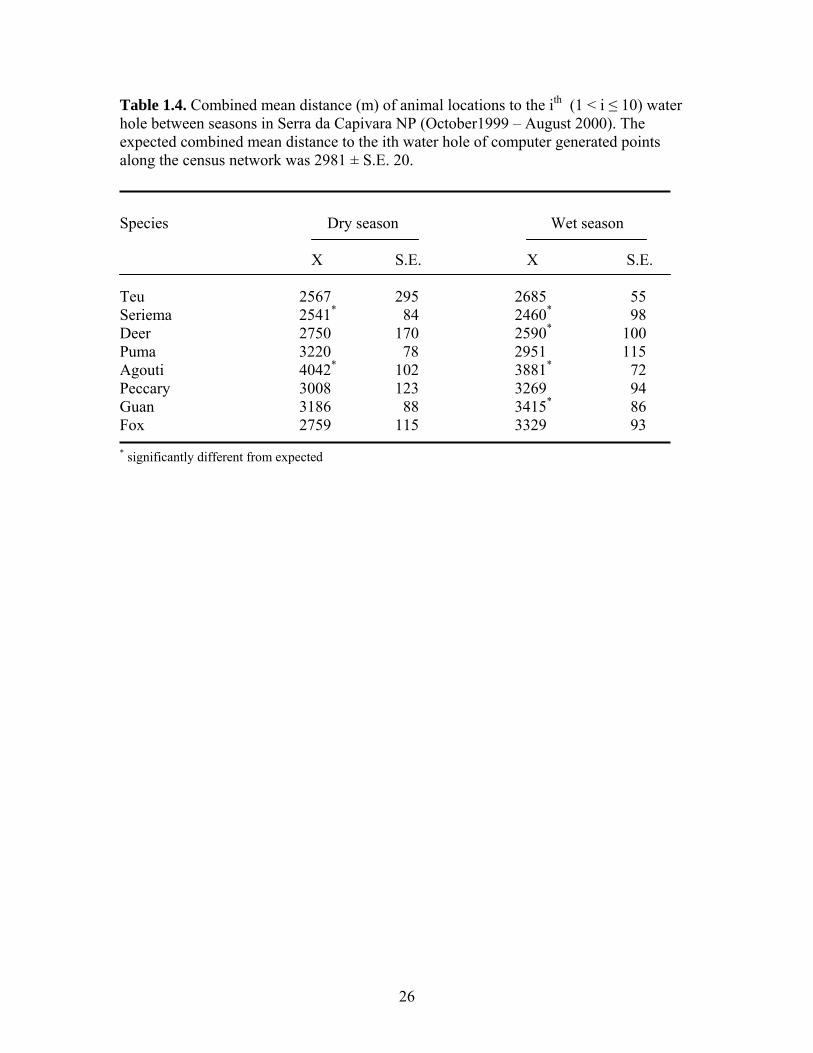
Table 1.4. Combined mean distance (m) of animal locations to the ith (1 < i ≤ 10) water hole between seasons in Serra da Capivara NP (October1999 – August 2000). The expected combined mean distance to the ith water hole of computer generated points along the census network was 2981 ± S.E. 20.
Species Dry season Wet season X S.E. X S.E. Teu 2567 295 2685 55 Seriema 2541* 84 2460* 98 Deer 2750 170 2590* 100 Puma 3220 78 2951 115 Agouti 4042* 102 3881* 72 Peccary 3008 123 3269 94 Guan 3186 88 3415* 86 Fox 2759 115 3329 93 * significantly different from expected
26

Table 1.5. Area of potential habitat (ha) of different species according to different water requirement scenarios.
Dry season Wet season Scenario 1 2 3 1 2 3 Tegu 13,531 Deer 13,170 12,764 Fox 15,505 22,132 Seriema 16,463 14,647 Guan 63,148 66,860 Puma 65,887 58,402 Peccary 60,362 67,104 Agouti 82,922 77,416
27

Figure 2.1. Serra da Capivara National Park: A: Location in Brazil, B: Elevational gradient, census network, and distribution of water holes.
28

Sep-99
Oct-99
Nov-99
Dec-99
Jan-0
0
Feb-0
0
Mar-00
Apr-00
May-00
Jun-0
0Ju
l-00
Aug-00
Prec
ipita
tion
(mm
)
0
10
20
30
40
50
60
70
80
Wet
sea
son
Dry
sea
son
(2)
Dry
sea
son
(1)
Figure 1.2. Monthly precipitation (mm) recorded in Serra da Capivara NP during the study period (October 1999-August 2000)
29

400-440 440-480 480-520 520-560 560-600 > 6000
2
4
6
8
400-440 440-480 480-520 520-560 560-600 > 6000
1
2
3
4
5
6
7ObservedExpected
Seriema
400-440 440-480 480-520 520-560 560-600 > 6000
1
2
3
4
5
6
7
8
400-440 440-480 480-520 520-560 560-600 > 6000
2
4
6
8
10
Fox
400-440 440-480 480-520 520-560 560-600 > 600
Num
ber o
f rec
ords
0
2
4
6
8
10
400-440 440-480 480-520 520-560 560-600 > 6000
2
4
6
8
10
12
Guan
400-440 440-480 480-520 520-560 560-600 > 6000
2
4
6
8
10
12
14
16
Elevation (m)
400-440 440-480 480-520 520-560 560-600 > 6000
1
2
3
4
5
6
Puma
Wet season Dry season
Figure 1.3. Seasonal elevational distribution of seriemas, guans, foxes and pumas in Serra da Capivara NP (October 1999-August 2000)
30

4 0 0 -4 4 0 4 4 0 -4 8 0 4 8 0 -5 2 0 5 2 0 -5 6 0 5 6 0 -6 0 0 > 6 0 00
2
4
6
8
1 0
1 2
1 4
1 6
1 8
4 0 0 -4 4 0 4 4 0 -4 8 0 4 8 0 -5 2 0 5 2 0 -5 6 0 5 6 0 -6 0 0 > 6 0 00
2
4
6
8
1 0
1 2
O bservedExpec ted
A gouti
4 0 0 -4 4 0 4 4 0 -4 8 0 4 8 0 -5 2 0 5 2 0 -5 6 0 5 6 0 -6 0 0 > 6 0 0
Num
ber o
f rec
ords
0
2
4
6
8
4 0 0 -4 4 0 4 4 0 -4 8 0 4 8 0 -5 2 0 5 2 0 -5 6 0 5 6 0 -6 0 0 > 6 0 00
2
4
6
8
1 0
1 2
D eer
4 0 0 -4 4 0 4 4 0 -4 8 0 4 8 0 -5 2 0 5 2 0 -5 6 0 5 6 0 -6 0 0 > 6 0 00
2
4
6
8
40 0 -44 0 4 40 -4 8 0 4 8 0 -5 2 0 52 0 -56 0 5 6 0-6 0 0 > 6 0 00
2
4
6
8
1 0
P eccary
E leva tion (m )
4 0 0 -4 4 0 44 0 -4 80 4 8 0-5 2 0 5 2 0 -5 6 0 5 60 -6 00 > 6 0 00
5
10
15
20
25
30
35
T egu
W et S eason D ry season
Figure 1.4. Seasonal elevational distribution of agoutis, deer, peccaries and tegu lizards in Serra da Capivara NP (October 1999-August 2000)
31

Seriem a
< 500
500-1000
1000-1500
1500-2000
2000-2500
2500-3000
3000-3500
3500-4000
4000-4500
0
5
10
15
20
25
30
35
40
Dry seasonW et season
G uan
< 500
500-1000
1000-1500
1500-2000
2000-2500
2500-3000
3000-3500
3500-4000
4000-4500
0
10
20
30
40
Fox
< 500
500-1000
1000-1500
1500-2000
2000-2500
2500-3000
3000-3500
3500-4000
4000-4500
Per
cent
age
0
10
20
30
40
50
Pum a
< 500
500-1000
1000-1500
1500-2000
2000-2500
2500-3000
3000-3500
3500-4000
4000-4500
0
5
10
15
20
25
30
35
40
Agouti
< 500
500-1000
1000-1500
1500-2000
2000-2500
2500-3000
3000-3500
3500-4000
4000-4500
0
10
20
30
40
50
Deer
< 500
500-1000
1000-1500
1500-2000
2000-2500
2500-3000
3000-3500
3500-4000
4000-4500
0
5
10
15
20
25
30
35
40
Peccary
< 500
500-1000
1000-1500
1500-2000
2000-2500
2500-3000
3000-3500
3500-4000
4000-4500
0
5
10
15
20
25
30
35
40
Tegu
Distance (m)
< 500
500-1000
1000-1500
1500-2000
2000-2500
2500-3000
3000-3500
3500-4000
4000-4500
0
10
20
30
40
50
60
Figure 1.5. Percentage of animals sightings within 500 m intervals from the nearest water hole during the wet and dry season in Serra da Capivara NP (October 1999-August 2000)
32

Figure 1.6. Comparative illustration of area of potential habitat identified according to the three water requirement models (one species per model is shown)
33
Distance (m)
0 500 1000 1500 2000 2500
Perc
ent a
rea
outs
ide
of th
e pa
rk
10
12
14
16
18
20
22
24
26
28
Deer
Puma
AgoutiPeccary
Figure 1.7. Relationship between distance to the nearest water hole (m) and the percentage of the area of occupancy found outside of the park’s boundaries
34

CHAPTER II
FEEDING ECOLOGY OF PUMAS (PUMA CONCOLOR) IN
CAATINGA AND THE IMPORTANCE OF PREY AVAILABILITY
IN DETERMINING RELATIVE ABUNDANCE OF NEOTROPICAL
CATS
INTRODUCTION
The puma (Puma concolor) is the most widely distributed mammal species (apart
from humans) in the western hemisphere, ranging from southwest Canada to the southern
tip of Argentina (IUCN, 1996). It occurs in habitats as diverse as arid deserts, tropical
rainforests and cold coniferous forests, from sea level up to 5,800 m in the Andes
(Eisenberg and Redford, 1999). The species composition and characteristics of prey (i.e.,
abundance, distribution, size, defenses), vegetation, climatic conditions and the presence
and abundance of other large carnivores and potential competitors vary considerably
across the puma’s geographic range. Each of these factors and any combination thereof
may represent ecological constraints that can directly and indirectly affect the feeding
ecology and abundance of pumas (Sunquist and Sunquist, 1989).
Whereas competition is often the ultimate force regulating relative abundance of
sympatric predators (Seidensticker, 1976; Sunquist and Sunquist, 1989; Creel and Creel,
1996; Durant, 1998), it is strongly influenced by the availability of prey (Karanth and
35

Nichols, 1998; Karanth and Sunquist, 2000). Interspecific competition may be reduced by
selection of different prey species (Karanth and Sunquist, 1995, 2000), selection of
different prey size (Gittleman, 1985), selection of different habitats (Fedriani et al., 1999)
or spatial avoidance (Durant 1998). Differences in prey selection among sympatric
predators may occur because of differences in hunting strategies (Kruuk, 1972; Schaller,
1972) or because of differences in body size of predators that have similar morphologies
and hunting strategies (Rosenzweig, 1966).
In temperate systems, pumas co-occur with wolves (Canis lupus), grizzly bears
(Ursus arctos), and coyotes (C. latrans), with which they share a common prey base
primarily composed of ungulates. Differences in hunting strategies suggest that prey
selection should differ among these species (Kruuk, 1972; Schaller, 1972), but empirical
evidence of such differences is still lacking (Kunkel et al., 1999). In the Neotropics,
pumas, ocelots (Leopardus pardalis) and jaguars (Panthera onca) are sympatric over the
most of the jaguar’s range. In general, jaguars (49.0 – 99.5 kg) are larger than pumas
(26.0 – 52.8 kg), although male pumas reach the same body weight as female jaguars.
Ocelots are less than one-third the weight of a puma (8.9- 11.2 kg)1. Several small felids
co-occur with these three larger cats throughout their common distributional range.
Differences in body size among species suggest that their coexistence may be mediated
by prey-size segregation. Indeed, although dietary overlap between jaguars and pumas is
high, pumas tend to take relatively smaller prey than jaguars, at least in most places
(Schaller and Crawshaw, 1980; Emmons, 1987; Taber et al., 1997). Ocelots prey mainly
1 (weight ranges represent the maximum and minimum mean weight recorded from different localities in the neotropics, see de Oliveira, 1994)
36

on species weighing less than 1 kg and show little dietary overlap with both large cats
(Emmons, 1987; Crawshaw, 1995).
Studies of tigers (Panthera tigris) and leopards (P. pardus) have shown that their
coexistence and relative abundance is governed primarily by the availability and relative
abundance of prey of different size classes (Karanth and Nichols, 1998; Karanth and
Sunquist, 2000). Based on these studies, the following predictions were developed to
explain the relative abundance of two different-sized felids in forested areas (Karanth and
Nichols, 1998; Karanth and Sunquist, 2000): 1.) High densities of both cats are expected
in areas with abundant large and medium-sized prey because diet segregation by prey
size is possible. 2.) The density of the smaller species is expected to decline in areas with
low densities of large prey because the larger cats switch to medium-sized prey, resulting
in increased competition between species. 3.) The density of the larger species is
expected to decline and that of the smaller one to increase in areas where both large- and
medium-sized prey are scarce because smaller cats are able to better survive on smaller
prey.
Differences in taxonomic composition and body-weight distribution of mammal
assemblages throughout the Neotropics (Fonseca et al., 1999) suggest that substantial
geographic variation in competitive interactions and relative abundance among
neotropical felids should be expected. Considerable geographic variation in diet of
jaguars and pumas substantiate this suggestion (see Rabinowitz and Nottinham, 1986;
Taber et al, 1997; Nunez at. al, 2000; Crawshaw and Quigley, 2001 in press). When
competition with jaguars is low (i.e., because of low density of large- and medium-sized
prey; prediction 3), pumas are expected to be more abundant. In return, this may increase
37

interspecific competition between pumas and ocelots, leading to lower densities of the
latter. Low densities of ocelots, on the other hand, may lead to high densities of small
cats, suggesting that relative abundance of pumas and jaguars may indirectly control the
relative abundance of smaller cats (see Terborgh, 1988).
In the absence of competition with jaguars (i.e., low density of medium- and large-
sized prey) prey selection by pumas is expected to be influenced mainly by the relative
size distribution and abundance of prey. Theory predicts that when prey density is low,
pumas are expected to select prey in accordance with their relative abundance in the
environment (i.e., number maximizer) and not show a preference for larger, more
energetically profitable prey (i.e., energy maximizers) (Griffith, 1975).
In this paper, I describe the diet of pumas in relation to prey availability in caatinga,
a dry forest in northeastern Brazil that is characterized by low abundances of small
mammals and the absence of several large mammals found in other systems (Streihlein,
1982, Sampaio, 1995; Fonseca et al., 1999). I then estimate the relative abundance of
pumas, jaguars, ocelots and small felids in this particular system and discuss how prey
availability may influence the relative abundance of felids in the neotropics. The
importance of abundance of water and relative differences in body size among
neotropical ecosystems is also discussed. This study is among the first to provide
simultaneous data on relative abundance of neotropical felids and their major prey
species from a single site. My predictions are that pumas should be more abundant than
jaguars because of low species richness and abundance of prey and that ocelots should be
rare because of low densities of small mammals and increased competition with pumas
for medium prey. Small cats are expected to be more abundant than ocelots because of
38

reduced competition by the latter and the greater ability of small cats to rely on small
lizards as an alternative prey to small mammals. Pumas are expected to act as number
maximizers, taking their prey in accordance to relative abundance in the environment,
rather than their relative biomass.
STUDY SITE
This study was conducted at Serra da Capivara National Park (SCNP), which
covers approximately 130,000 ha in the southeast of the state of Piaui, Brazil (approx.
8°30’ - 8°50’ S and 42° 20’ - 42°50’ W) (FUMDHAM, 1998). It is the largest caatinga
preserve and likely represents the last area in the entire caatinga ecosystem where
jaguars, giant anteaters (Myrmecophaga tridactyla), and white-lipped peccaries (Tayassu
pecari) co-occur (Olmos, 1992; FUMDHAM, 1998). Caatinga is characterized by a semi-
arid climate. Annual rainfall in SCNP is extremely variable and unpredictable both in
total amount of rain as well as timing throughout the year (de Andrade Lima, 1981;
Emperaire, 1984; Sampaio, 1995). In SCNP, most rain falls between September and
March. Average annual rainfall is 644 mm, with a 50-year maximum of 1,131 mm and
minimum of 250 mm (Emperaire, 1984). Mean annual temperature is 27.6° C.
Eight vegetation types have been described in SCNP (Emperaire, 1984). Most of
the park is covered by a species-rich, arboreal-arbustive (i.e., shrubby) vegetation (6-10
m tall). Other vegetation types range from mesic 30 m tall semi-deciduous forests located
in canyons to bushy formations, rich in cacti and bromeliads that occupy rocky areas
(Olmos, 1992).
39

METHODS
Scat collection and analysis
The diet of pumas was described following analysis of scats collected in SCNP
between October 1999 and July 2000. All signs (e.g., tracks, scrapes, odor) useful for
subsequent identification of the species producing the scat were recorded for each
collection. Scats were collected opportunistically throughout the park but most sampling
effort was allocated to trails and roads used for prey censuses (see chapter 1). Because I
frequented these trails on a regular basis, scats were collected ‘as they were produced’,
which increased the likelihood of finding associated tracks or other sign that allowed in
situ identification of the species depositing the scats in most cases. When in situ
identification was impossible, scats were searched for carnivore hair, which are ingested
during autogrooming. Hairs were compared to a reference collection of hair samples of
all carnivores that occur in the park. Scats which could not be identified to species were
not included in analyses.
Scats were air-dried following collection. Dry scats were broken up under running
water and remains were separated by thorough washing through a sieve with a mesh size
of 0.5 mm. Macroscopic remains retained by the sieve were separated, dried in the sun
and examined under a stereoscope. Remains of vertebrates were identified to species if
possible. Identification of macroscopic remains was done using a reference collection of
vertebrate hair, teeth, bones, dermal scutes (armadillos), claws, and scales (reptiles).
The mean weight of vertebrate prey (MWVP) was calculated by summing the
products of the number of individual prey found in scats by their natural-log-transformed
weight, divided by the total number of prey (Iriarte et al., 1990). The standardized food
40

niche-breadth (Bsta) was calculated following Colwell and Futuyma (1971): Bsta = (Bobs -
Bmin)/(Bmax – Bmin), where Bobs is the observed niche breadth (i.e., Bobs = 1/Σ p2i, where pi
is the relative occurrence of prey taxon i in the diet), Bmin is the minimum niche breadth
(= 1), and Bmax is the maximum possible niche breadth (the number of prey taxa taken).
This standardized measure (Bsta) has been used in other studies of puma diets (Iriarte et
al., 1990; Taber et al., 1997).
Dietary composition was described as the frequency of occurrence of different
food items, expressed as the percentage of the total number of scats (FOi) and the
percentage of occurrence, expressed as the percentage of the total number of occurrences
of all food items (POi) in the diet. Percent biomass or prey consumed (PBCi) was
calculated using a correction factor (Y = 1.98 + 0.035 X) developed by (Ackerman et al.,
1984), which accounts for prey size and differences in the amount of prey remains found
in scats due to differences in prey body size, where Y is the weight of food consumed per
scat and X is the weight of the live prey. This correction factor reduces the likelihood of
overestimating the relative importance of small prey in a predator’s diet.
Pumas need, on average, 2 to 2.5 kg of meat each day (Nunez 2000) and
references therein), which converts to 730 – 913 kg of meat annually. To convert data on
biomass consumed into estimates of numbers of individuals killed, I multiplied minimum
and maximum estimates of meat consumed each year by the percentage of biomass
consumed for each prey species. This amount was then divided by the body weight of the
prey item, except for large prey, such as deer and peccaries, which are rarely consumed in
their entirety. For large prey, I followed Nunez et al., (2000) and assumed that large cats
eat an average of 8.5 kg of meat from a large kill.
41

Relative abundance of felids and their prey
The relative abundance of jaguars, pumas, ocelots and medium to large prey of
puma was evaluated based on remote camera data. I used CamTrakkerTM remote cameras,
triggered by an infrared motion and heat detector. All cameras where fitted with an AGC
(Automatic Gain Control) unit, maintaining detector sensitivity at high ambient
temperatures (Camtrak South, Inc., Watkinsville, GA). Six cameras were placed along six
permanent transects and remained continuously activated for the whole study period.
Cameras were fixed to trees at a height of approximately 40 cm from the ground and with
a minimal distance from the trail center of 1.5 m. The position of cameras was changed
along each transect weekly, to reduce repeated recordings of single individuals that
frequently use a particular area. Camera locations along transects were chosen based on
the presence of suitable trees on which to fix cameras. Date and time were automatically
recorded for each photograph. An additional three cameras were used only part of the
time and were frequently moved among strategic points (i.e., areas where cat sign was
observed, water holes) within the park. In total, cameras were placed at 10 different sites
(counting each transects as one site). Camera stations were not baited, with the intention
to limit detection biases due to species-specific preferences of bait and to reduce
behavioral changes of animals. Remote cameras remained activated for a total of 2,064
camera nights.
Availability of mammalian prey found in puma diets is expressed both in terms of
relative abundance (RA) and percent biomass of prey in the environment (PBPE = RAi *
Wi / Σ (RAi * Wi), where Wi is the weight of prey species i). Relative abundance was
42

expressed as the percentage of photographs per species of the total number of
photographs of all species combined. Relative abundance of prey and felids were
calculated separately.
I also calculated minimum and maximum values of relative abundance estimates
of felids based on estimates of different individuals per species detected. Spotted cats
were identified by coat patterns, which are highly variable among individuals. Pumas
were distinguished based on size, sex, natural earmarks, black coloration on fore- and
hind legs, and scars. Maximum values of individuals were calculated by adding the
number of identifiable individuals and those not identified across all transects. Minimum
number of individuals was calculated by considering all non-identifiable individuals per
transect as one and adding this number to the number of identified individuals.
Prey selectivity
I used a Chi-square test (Zar 1999) to compare sample counts of scats containing
each prey to expected numbers of scats containing that prey in the environment. Expected
numbers of scats containing each prey were calculated based both on observed relative
abundance and relative biomass of prey in the environment. Significant differences
indicate non-random, selective predation; Bonferroni confidence intervals were used to
evaluate selection for or against prey species (Byers et al. 1984).
Expected numbers of scats containing each prey were calculated following
Karanth and Sunquist (1995): If ri is the number of individuals killed of species i, λi the
number of scats produced from one kill of species i (λi = X / Y, see formula given in
Ackerman et al. 1984), and rt is the total number of prey killed, then pi = ri / rt is the
43

proportion of the ith species in all kills and si = rt * pi * λi is the number of scats
containing the ith prey species in the environment. The proportion of scats containing
species i is f = si/ Σ si = (rt * pi * λi) / Σ (rt * pi * λi) = (pi * λi / Σ pi * λi).
If a predator takes available prey in proportion to their relative abundance, pi =
RAi (where RAi is the relative abundance of species i). If predation occurs in accordance
with relative biomass of prey, pi = RBPEi (where RBPEi is the relative biomass of species
i). Thus, the expected proportion of scats containing species i can be obtained by fi =
(RAi * λi) / (ΣRAi * λi) or fi = (RBPEi * λi) / (Σ RBPEi * λi).
RESULTS
Puma diet
Most scats disappeared rapidly during the rainy season as a result of runoff and
the abundance of beetles (Scarabidae) and termites, which either carry off, or establish
colonies around, fresh scats. Thus, my sample size for the wet season was low, which
precluded seasonal comparison of puma diets. Of 88 felid scats collected, 65 scats were
identified as originating from pumas. A total of 11 different types of food items were
identified in puma scats (Table 2.1.). The average number of food items per scat was
1.32. Mammals accounted for 78.9 % of all food items, followed by grass (13.3 %) and
reptiles (7.8 %). The standardized food niche breadth of pumas was 0.03 and the MWVP
was 5.08 kg. Overall, 90.1 % of mammalian prey and 88.0 % of mammal biomass
consumed by pumas were of medium-sized species (body weight 1 to 15 kg); large
mammals (body weight >15 kg) represented 9.9 % of all prey items and 12.0 % of
biomass consumed (Table 2.2.). Armadillos (Dasypus sp.) represented 70.4 % of all
44

mammalian prey and 68.6 % of mammal biomass consumed. Dasypus novemcinctus, the
nine-banded armadillo, represented 96 % of armadillo remains detected in puma scats.
Armadillo remains could not be determined to the species level in two scats.
When converting relative biomass consumed per prey to numbers of individuals
killed per year, a puma may kill 139 – 174 armadillos, 16 – 20 anteaters, 15 – 19 agoutis,
7 – 9 peccaries, 3 – 4 deer, and 3 – 4 skunks.
Relative abundance of prey and prey selectivity
Armadillos and peccaries accounted for 58.9 % of photographs of mammalian
prey found in puma scats, followed by anteaters (15.1%). Peccaries represented 50 % of
total biomass, followed by armadillos (17.2 %), and deer (15.3 %) (Table 2.3.).
Pumas took prey non-randomly, both in terms of their relative abundance (χ2 =
59.62, df = 5, p < 0.001) and relative biomass in the environment (χ2 = 117.26, df = 5, p <
0.001). Pumas preyed selectively on armadillos in terms of relative abundance and their
relative biomass. Anteaters were taken more than expected based on their biomass but
were taken in accordance with their relative abundance (see Table 2.4.). Deer and
peccaries were taken less than expected both in terms of their relative abundance and
biomass. Agoutis and skunks were killed in proportion to their relative abundance and
biomass.
Relative abundance of felids
Pumas accounted for approximately 59 % of all cats photographed. Oncillas
(Leopardus tigrina) accounted for 30 % of photographs, whereas jaguars and ocelots
45
represented approximately 8 % and 3 %, respectively. Ranking in relative abundance of
felids did not change when minimum estimates of individuals were compared (Table
2.5.). However, oncillas were more abundant than pumas based on maximum estimated
number of individuals detected. Pumas were detected at 8 out 10 camera sites, followed
by oncillas, jaguars and ocelots (Table 2.5.). Pumas were detected at 3 out of4 sites where
jaguars were recorded. At 80 % of sites where oncillas were detected, large cats were also
present. Ocelots were detected in an area frequented by all species. Pumas and oncillas
were the only species detected at 2 sites. Jaguars were the only felid detected at one site.
DISCUSSION
Puma diet vs. prey availability. The nine-banded armadillo represented nearly 70
% of the mammalian biomass consumed by pumas and accounted for the fact that
medium-sized prey made up nearly 90 % of its diet (biomass). High predation on
armadillos also explains why diet breadth of pumas in Serra da Capivara NP was much
smaller than in other sites in the neotropics (Table 2.6.). Similar reliance by pumas on
medium-sized prey has been observed only in southern Chile, where pumas fed to a large
extent on introduced hare (Lepus capensis) (Iriarte et al., 1990). Large mammals,
accounted for less than 15 % of the biomass consumed by pumas in Serra da Capivara
NP. This is in stark contrast with results from chaco (Taber at al. 1997), Jalisco (Nunez et
al., 2000) and the llanos (Scogamillo, 2001) where large mammals accounted for more
than half the biomass in puma diets. No small mammals were detected in puma scats
from Serra da Capivara NP. In Jalisco and the llanos, small mammals contributed only
marginally to the overall biomass in puma diets but were important in chaco (Table 2.6.).
46

Relative abundance and size distribution of prey likely explain the overall dietary
habits of pumas in Serra da Capivara NP. There are only five species of large mammals
reported from Serra da Capivara NP, and although there are no data on density, direct
observations, track records and remote camera data suggest that their abundance is low.
White-lipped peccaries and red brocket deer (Mazama americana) are extremely rare or
absent from the study site. No observations of Giant anteaters had been made since 1994
(N. Guidon, FUMDHAM, personal communication) and they were detected only twice
during this study. Gray brocket deer are restricted year round to areas with permanent
water sources, which are rare and distributed very unevenly throughout the park. Thus,
deer may be locally abundant but total population size in the park is probably small
(Chapter 1). The most abundant large mammal in this site is the collared peccary.
Capybaras, a common prey species of pumas in other ecosystems (Scognamillo, 2001),
are absent from Serra da Capivara NP, although they are found along major rivers
throughout caatinga. The absence of small mammals from puma scats likely reflects their
particularly low overall abundance in caatinga (Streilein, 1982; pers. obs.). Rock cavies
(Kerodon rupestris), a small mammal that reaches relatively high densities in mesic
canyons, largely escape puma predation by using rock shelters in steep cliffs and by
foraging in trees. Thus, overall, both small and large mammals are rare in Serra da
Capivara NP, which by itself could explain the high predation by pumas on medium-
sized prey.
Prey selection. Despite this general concordance of puma food habits with prey
availability, the prediction that pumas should take their prey in relation to their
availability, i.e., act as number maximizers, was not supported. Pumas preyed more than
47

expected on armadillos and anteaters and less than expected on large prey. Armadillos
and anteaters may be particularly vulnerable to predation by pumas because of slow
speed and, for armadillos, because of their noisy foraging behavior, which may increase
their detectability (see Maehr et al., 1990). Other medium-sized prey that are less
vulnerable (i.e., agoutis and skunks) were taken in proportion to their availability in the
environment. Pumas preyed on large prey species such as deer and peccaries less than
expected, which suggests that pumas do not act as energy maximizers. This was expected
in an area of low density and low species richness of large, energetically profitable
species. However, low representation of large prey in the diet of pumas may also be due
to interspecific dominance by jaguars (Iriarte et al, 1990), despite their apparent low
abundance, by lowering encounter rates of pumas with large prey and forcing pumas to
rely mainly on smaller prey. Clearly, data on jaguar feeding habits in this site are needed
to evaluate this hypothesis. Conversely, pumas may be hunting in a number-maximizing
fashion, attacking prey on encounter, but differential vulnerability may lead to higher
representation of some species. Differences in vulnerability to puma predation may be
related to habitat structure, as hypothesized by Iriarte et al. (1990), who stated that closed
habitat structure makes large prey less vulnerable to predation by large cats. However,
vulnerability of prey may also be due to intrinsic characteristics of prey, such as
defensive bahavior, aggressiveness (Maxit 2001) or their capacity to detect predators.
Influence of prey base on relative abundance of felids in the neotropics.
Caatinga has the poorest assemblage of terrestrial mammals (> 1 kg) among major South
American ecosystems (Figure 2.2.). Caatinga, and Serra da Capivara NP in particular, is
poor in large mammals (5 species), half the number of species found in cerrado (10) or
48

chaco (11). Caatinga has the fewest Artiodactyla (4) and lagomorphs, important food
items of large cats in the chaco (Taber et al., 1997) are absent from Serra da Capivara NP.
Tapirs (Tapirus terrestris), the largest native prey of large cats in the Neotropics, are also
absent from caatinga. Overall, Amazonia, with 43 species, has the most species-rich
assemblage of terrestrial mammals, followed by Atlantic forests (41), cerrado (40), chaco
(37), pantanal (34), and caatinga (22) (Fonseca et al., 1996; Miserendino et al., 1998).
Although lowland evergreen forests have the most terrestrial mammals, they have
fewer large mammals than do more open deciduous systems such as cerrado, pantanal or
chaco. In addition, overall density of large mammals is generally higher in the latter
ecosystems, particularly when large rodents (i.e., capybaras) and livestock are included
(Robinson and Bennett, 2000; Leeuwenberg and Robinson, 2000). Domestic stock occurs
at densities 10 times higher than native ungulates and represent a major food source of
large cats in the pantanal and llanos (Eisenberg, 1980; Schaller, 1983; Hoogesteijn et al.,
1993). Based on the high densities of both native and domestic ungulates, open savannas
and seasonally flooded plains provide a greater opportunity for prey size segregation
between both large cats. Thus, one may expect to find little difference in relative
abundance of pumas and jaguars in these systems (prediction 1), assuming that human
predation on both species is equal or absent (see Crawshaw and Quigley, in press). High
habitat heterogeneity of floodplains further promotes the coexistence of large cats, by
allowing different patch use and fine-scale habitat selection by pumas (Scognamillo
2001). In wet lowland forests, where large prey species are found at lower densities,
jaguars are expected to be more abundant than pumas.
49

Evidence for changes in relative abundance of pumas and jaguars with changes in
the availability of prey has recently been provided from Central American lowland
forests (Carrillo et al., 2000), where a 4-year decline in abundance of white-lipped and
collared peccaries was accompanied by a reversal in relative abundance of jaguars and
pumas, with pumas becoming relatively more abundant as peccary numbers declined.
Thus, a decline in large mammals alone, without a concurrent decline in medium prey is
sufficient to negatively affect the abundance of jaguars. This is because natural prey
density is lower and the size range of natural prey is smaller in the neotropics than in
African savannas or deciduous forests in India (Robinson and Bennett, 2000; Karanth and
Sunquist, 1992), providing fewer opportunities for prey-size segregation among jaguars
and pumas. In fact, large prey of jaguars and pumas would be considered medium-sized
prey of leopards and tigers. Thus, because available prey are relatively less abundant and
smaller in the neotropics than in other systems, jaguars may be more vulnerable than
other large cats to hunting or natural declines of prey.
As expected, caatinga, with low species richness and low abundance of both large
and small prey favors higher abundance of pumas and small cats and lower abundance of
jaguars and ocelots. Pumas are smaller than jaguars, have lower energetic needs, and
wean their young earlier (Nowak, 1999), which are all factors that are likely to make
pumas more successful than jaguars under the conditions such as those presented in Serra
da Capivara NP. To what extend the relative abundance of ocelots is affected by pumas
remains unclear however. Similarly, it is not known to what extend the relative
abundance of small cats is affected by the abundance of ocelots. Interspecific competition
among ocelots and small cats is likely to be less intense than among the larger cats
50

because they feed on a larger variety of taxa, including birds, reptiles, small mammals,
and invertebrates, which are less likely to be limiting. Thus, overall relative abundance of
small cats will depend on the availability of alternative prey to small mammals if these
are found at low abundance or if competition for small mammals with ocelots is high. In
Serra da Capivara NP, oncillas feed extensively on small lizards (Cnemidophorus sp.
Tropidurus sp.) (Olmos, 1993) and because of their smaller body size they may be better
able to subsist on these small prey than ocelots.
Other factors influencing felid abundance. Relative abundance of jaguars in
wet environments may depend to some extent on aquatic, allochthonous food subsidies
(Rose and Polis, 1998), such as caiman and chelonians (Troeng, 2000) or even cetaceans
(Defler, 1994). These prey are thought to be available mainly to jaguars, whose massive
head structure allows them to feed on these prey (Hoogesteijn and Mondolfi, 1996).
Elevated densities due to allochthonous input from aquatic systems have been observed
for other large carnivores, such as polar bears (Ursus maririmus), lions (Panthera leo) or
brown hyenas (Hyaena brunnea) (Rose and Polis, 1998 and references therein). The
availability of aquatic food subsidies may indeed be important for jaguars and may
contribute to their lower relative abundance in dry forests (see this study, Nunez et al.,
2000). Spatial segregation related to water availability on a local scale, with jaguars using
more mesic habitats along rivers and pumas being found in drier areas provides further
evidence for this hypothesis (Schaller and Crawshaw, 1980; Emmons, 1987; Crawshaw
and Quigley, 1991). Finally, pumas may be more abundant than jaguars because they are
better adapted to dry environments (de Oliveira, 1994), although there is no direct
evidence to support this.
51

Relative abundance of felids may also be affected by changes in relative
differences in body size. Throughout their geographic range, pumas tend to be smaller
where they co-occur with jaguars (Iriarte et al., 1990; Gay and Best, 1996), although
adult male pumas weigh as much as a small female jaguar. Within the Neotropics, pumas
tend to be larger in dry biomes (Gay and Best, 1996), whereas jaguars reach their largest
size in open floodplains (Hoogesteijn and Mondolfi, 1996). Thus one may expect relative
size differences between jaguars and pumas to be lowest in dry biomes, alleviating the
competitive inferiority of pumas.
Despite differences in prey availability and climatic conditions among different
ecosystems, one should be cautious about making interferences about observed relative
abundance of felids without taking into consideration current or past hunting of cats.
Jaguars, and spotted cats in general tend to suffer from greater mortality rates through
hunting than pumas (Crawshaw and Quigley, 2001 in press), which by itself may explain
their low abundance in many places. Today hunting of cats is either very rare or has
completely stopped in Serra da Capivara NP and interviews with former hunters revealed
that pumas were always more common than jaguars in the area. Thus, despite past
exploitation of cats it seems reasonable to believe that current relative abundance of
felids is due to prey availability, which in return may be influenced by hunting pressure.
Recent improvements in anti-poaching patrols in Serra da Capivara NP have allowed
several game species, including armadillos and peccaries, to increase. The high
reproductive rate of armadillos may have allowed this species to bounce back more
quickly than others, but if this trend continues, other large prey species may also increase
in abundance and prey size-distribution and relative abundance of prey may change in the
52

future. Thus, current relative abundance of jaguars and pumas may change as prey
populations build up to natural levels.
Conclusion. This study has shown that pumas are more abundant than jaguars in
a dry environment that has no rivers and a low abundance of small and large mammals.
Pumas relied nearly exclusively on medium-sized prey that are characterized by
relatively poor escape capabilities. Small cats were more abundant than ocelots and relied
on locally abundant small lizards as their staple prey. Lower density, lower species
richness and smaller size range of mammalian prey in the Neotropics suggest that over-
harvesting of prey may be particularly detrimental to both jaguars and ocelots and that
pumas and smaller cats could be expected to be more resilient to hunting pressure. If
hunting levels are maintained at low levels in Serra da capivara NP, continuous
monitoring of felids and their prey will certainly provide new and exiting insights into the
ecology of neotropical felid assemblages.
53

LITERATURE CITED Ackerman, B.B., F.G. Lindzey, and T.P. Hemker. 1984. Cougar food habits in southern
Utah. Journal of Wildlife Management 48:147-155.
Byers, C. R., R. K Steinhorst,. and P. R. Krausman. 1984. Clarification of a technique for analysis of utilization-availability data. Journal of Wildlife Management 48: 1050-1053.
Carrillo, E., G. Wong, and A.D. Cuaron. 2000. Monitoring mammal populations in Costa Rican protected areas under different hunting restrictions. Conservation Biology 14:1580-1591.
Colwell, R.K., and D.J. Futuyma. 1971. On the measurement of niche breath and overlap. Ecology 52:567-576.
Crawshaw, P.G. ., Jr., and H.B. Quigley. (in press) Jaguar and puma feeding habits. in El jaguar en el neuvo millenio. Una evaluacion de su estado, deteccion de prioridades y recommendationes para la conservations de los jaguares en America. R.A. Medellin, C. Chetkiewicz,, A. Rabinowitz, K. H. Redford, J. G. Robinson, and A. Taber. (eds). Mexico D.F, Universidad Nacional Autonoma de Mexico.
Crawshaw, P.G., Jr. 1995. Comparative ecology of ocelot (Felis pardalis) and jaguar (Panthera onca) in a protected subtropical forest in Brazil and Argentina. Ph. D., University of Florida, Gainsville.
Crawshaw, P.G., Jr., and H.B. Quigley. 1991. Jaguar spacing activity and habitat use in seasonally flooded environment in Brazil. Journal of Zoology 223: 357-370.
Creel, S.R., and N.M. Creel. 1996. Limitation of African wild dogs by competition with larger carnivores. Conservation Biology 10:526-538.
de Andrade Lima, D. 1981. The caatinga dominium. Revista Brasileira de Botanica 4:149-153.
de Oliveira, T.G. 1994. Neotropical cats ecology and conservation EDUFMA, Sao Luis, Brazil.
Defler, T.R. 1994. Jaguars eat dolphins too. Trianea 5:415-416.
Durant, S.M. 1998. Competition refuges and coexistence: An example from Serengeti carnivores. Journal of Animal Ecology 67:370-386.
Eisenberg, J.F. 1980. The density and biomass of tropical mammals, pp. 34-55, in M. E. Soulé and B. A. Wilcox, (eds.) Conservation biology: an ecological perspective. Sinauer Associates, Sunderland.
Eisenberg, J.F., and K.H. Redford. 1999. Mammals of the Neotropics: The Central Neotropics Ecuador, Peru, Bolivia, Brazil. Vol 3.The University of Chicago Press, Chicago.
Emmons, L.H. 1987. Comparative feeding ecology of felids in a neotropical rainforest. Behavioral Ecology & Sociobiology 20:271-284.
54

Emperaire, L. 1984. A região da Serra da Capivara (Sudeste do Piaui) e sua vegetação. Brasil Florestal 60:5-21.
Fedriani, J. M., F. Palomares, and M. Delibes. 1999. Niche relations among three sympatric Meditarranean carnivores. Oecologia 121: 138-148.
Fonseca, G.A.B., G. Herrman, and Y.L.R. Leite. 1999. Macrogeography of Brazilian Mammals, pp. 549-563, in J. F. Eisenberg and K. H. Redford, eds. The Central Neotropics: Ecuador, Peru, Bolivia, Brazil. Vol. 3. The University of Chicago Press, Chicago.
FUMDHAM. 1998. Parque Nacional Serra da Capivara, Piaui, Brasil. Alinea Publicaçoes Editora, Teresina, Brazil.
Gay, S.W., and T.L. Best. 1996. Relationships between abiotic variables and geographic variation in skulls of pumas (Puma concolor: Mammalia, Felidae) in North and South America. Zoological Journal of the Linnean Society 117:259-282.
Gittleman, J. L. 1985. Carnivore body size: ecological and taxonomical correlates. Oecologia 67: 540-554.
Griffith, D. 1975. Prey availability and the food of predators. Ecology 56:1209-1214.
Hoogesteijn, R., A. Hoogesteijn, and E. Mondolfi. 1993. Jaguar predation and conservation: cattle mortality caused by felines on three ranches in the Venezuelan Llanos, pp. 391-407, in N. Dunstone and M. L. Gorman, (eds.) Mammals as Predators. Zool. Soc. London Symposia, 65.
Hoogesteijn, R., and E. Mondolfi. 1996. Body mass and skull measurements in four jaguar populations and observations on their prey base. Bulletin of the Florida Museum of Natural History 39:195-219.
Iriarte, J.A., W.L. Franklin, W.E. Johnson, and K.H. Redford. 1990. Biogeographic variation of food habits and body size of the America puma. Oecologia 85:185-190.
IUCN. 1996. Wild Cats. IUCN, Gland.
Karanth, K.U., and M.E. Sunquist. 1992. Population structure, density and biomass of large herbivores in the tropical forests of Nagarahole. Indian Journal of Tropical Ecology 8:21-35.
Karanth, K.U., and J.D. Nichols. 1998. Estimation of tiger densities in India using photographic captures and recaptures. Ecology 79:2852-2862.
Karanth, K.U., and M.E. Sunquist. 2000. Behavioural correlates of predation by tiger (Panthera tigris), leopard (Panthera pardus) and dhole (Cuon alpinus) in Nagarahole, India. Journal of Zoology (London) 250:255-265.
Kruuk, H. 1972. The spotted hyena. A study of predation and social behavior. The University of Chicago Press, Chicago.
Kunkel, K.E., T.K. Ruth, D.H. Pletscher, and M.G. Hornocker. 1999. Winter prey selection by wolves and cougars in and near Glacier National Park, Montana. Journal of Wildlife Management 63:901-910.
55

Leeuwenberg, F.J., and J.G. Robinson. 2000. Traditional management of hunting in a Xavante community in Central Brazil: the search for sustainability, pp. 375 - 394 In J. G. Robinson and E. L. Bennett, (eds.) Hunting for sustainability in tropical forests. The Columbia University Press, New York.
Maehr, D.S., R.C. Belden, E.D. Land, and L. Wilkins. 1990. Food habits of panthers in Southwest Florida. Journal of Wildlife Management 54:420-423.
Mares, M.A, 1999. Encyclopedia of deserts. University of Oklahoma Press, Norman, Oklahoma
Maxit, I. E. 2001. Prey use by sympatric puma and jaguar in the Venezuelan llanos. Master's Thesis. Department of Wildlife Ecology and Conservation, Uinversity of Florida, Gainesville, pp. 45.
Miserendino, R.S., E. Cuéllar and A. Noss. 1998. Diversidad de los mamíferos en el Izozog y el Área Natural de Manejo Integrado Kaa-Iya del Gran Chaco, Santa Cruz, Bolivia. Ecología en Bolivia 31:17-31.
Nowak, R.M. 1999. Walker's mammals of the world. 6 ed. The John Hopkins University Press, Baltimore.
Nunez, R., B. Miller, and F. Lindzey. 2000. Food habits of jaguars and pumas in Jalisco, Mexico. Journal of Zoology (London) 252:373-379.
Olmos, F. 1992. Serra da Capivara National Park and the conservation of northeastern Brazil's caatinga. Oryx 26:142-146.
Olmos, F. 1993. Notes on the food habits of Brazilian caatinga carnivores. Mammalia 57:126-130.
Robinson, J.G., and E.L. Bennett. 2000. Carrying capacity limits to sustainable hunting in tropical forests, pp. 13-30, in J. G. Robinson and E. L. Bennett, (eds.) Hunting for sustainability in tropical forests. Columbia University Press, New York.
Rose, M.D., and G.A. Polis. 1998. The distribution and abundance of coyotes: the effects of allochtonous food subsidies from the sea. Ecology 79:998-1007.
Rosenzweig, M.L. 1966. Community structure in sympatric carnivores. Journal of Mammalogy 47:602-612.
Sampaio, E. 1995. Overview of the Brazilian caatinga, in S. H. Bullock, H. Mooney and E. Medina, (eds.) Seasonnaly dry tropical forests. Cambridge University Press, Cambridge.
Schaller, G.B. 1972. The Serengeti Lion. A study of predator-prey relations. The University of Chicago Press, Chicago.
Schaller, G.B. 1983. Mammals and their biomass on a Brazilian ranch. Archivos de Zoologia 31:1-36.
Schaller, G.B., and P.G. Crawshaw, Jr. 1980. Movement patterns of jaguar (Panthera onca). Biotropica 12:161-168.
56

Scognamillo, D. G. 2001. Ecological separation between jaguar and puma in a mosaic landscape in the Venezuelan llanos. Master's Thesis. Department of Wildlife Ecology and Conservation, Uinversity of Florida. Gainesville, pp. 49.
Seidensticker, J. 1976. On the ecological separation between tigers and leopards. Biotropica 8:225-234.
Streilein, K.E. 1982. The ecology of small mammals in the semiarid Brazilian caatinga: 3. Reproductive biology and population ecology. Annals of the Carnegie Museum 51:251-269.
Sunquist, M.E., and F. Sunquist. 1989. Ecological constraints on predation by large felids, p. 283-301, In J. L. Gittleman, ed. Carnivore behavior, ecology and evolution, Vol. 1. Chapman and Hall, London.
Taber, A.B., A.J. Novaro, N. Neris, and F.H. Colman. 1997. The food habits of sympatric jaguar and puma in the Paraguayan chaco. Biotropica 29:204-213.
Terborgh, J. 1988. The big things that run the world. A sequel to E. O. Wilson. Conservation Biology 2:402-403.
Troeng, S. 2000. Predation of green (Chelonia mydas) and leatherback (Dermochelys coriacea) turtles by jaguars (Panthera onca) at Tortuguero National Park, Costa Rica. Chelonian Conservation & Biology 3:751-753.
Zar, J. E. 1999. Biostatistical Analysis. 4th edition. Simon and Schuster, Upper Saddle River, New Jersey.
57

Table 2.1.: List of prey taxa identified in puma scats, number of each prey type found in total (Ni), frequency of occurrence of prey expressed as a percentage of the total number of scats (FOi), and percent of occurrence of prey as expressed as a percentage of the total number of food items identified (POi). (Grass is excluded in the calculation of PO)
Species Ni FOi POi D. novemcinctus 48 73.8 61.5 Grass 12 18.5 T. tetradactyla 8 12.3 10.3 D. prymnolpha 5 7.7 6.4 T. tajacu 5 7.7 6.4 Lizard 3 4.6 3.8 M. gouazoubira 2 3.1 2.6 Dasypus sp. 2 3.1 2.6 Snake 2 3.1 2.6 T. hispidus 2 3.1 2.6 C. semistriatus 1 1.5 1.3 TOTAL 89 100 100
58

Table 3.2.: Mean weight of mammalian prey (Wi), percentage of occurrence of prey (POi), frequency of occurence of prey (FOi), correction factor (CFi) developed by Ackerman et al. (1984), and relative biomass of prey consumed (RBCi) by pumas in Serra da Capivara NP.
Taxon Wi POi FOi CFi
a RBCi
b
Total Large Prey 9.9 12.0 M. gouazoubira 16.3 2.8 3.1 2.53 3.3 T. tajacu 19.6 7.0 7.7 2.65 8.7 Total Medium Prey 90.1 88.0 D. novemcinctus 3.6 70.4 76.9 2.09 68.6 D. prymnolopha 3.2 7.0 7.7 2.07 6.8 T. tetradactyla 5.1 11.3 12.3 2.14 11.2 C. semistriatus 3.5 1.4 1.5 2.08 1.4
a CFi = 1.98 + 0.035 Wi
b RBCi = (FOi * CFi) / Σ (FOi * CFi)
59

Table 2.3.: Relative abundance of mammalian prey of puma in Serra da Capivara NP. Total number of photographs (Ni), relative abundance expressed as the percentage of the total number of photographs (RAi), body weight (Wi), Total Estimated Weight (TEWi), and Relative Biomass of Prey in the Environment (RBPEi) are given. Species Ni RAi Wi TEWi RBPEi D. novemcinctus 56 38.4 3.6 201.6 17.2 T. tajacu* 30 20.5 19.6 588.0 50.2 T. tetradactyla 22 15.1 5.1 112.6 9.6 D. prymnolopha 14 9.6 3.2 44.8 3.8 C. semistriatus 13 8.9 3.5 45.5 3.9 M. gouazoubira 11 7.5 16.3 179.3 15.3 Total 1,171.8
* The number of photographs of peccaries was adjusted by the mean group size (3.03) obtained from direct observation.
60

Table 2.4.: Observed (FOiobs)and expected (FOiexp) frequencies of occurence of prey and Bonferroni confidence intervals (95%). FOiexp are given based on relative biomass and relative abundance of prey in the environment.
FOiexp FOiexp (relative (relative abundance) biomass) FOiobs Lower limit Upper limit M. gouazoubira 0.146 (-) 0.205 (-) 0.031 -0.023 0.085 T. tajacu 0.457 (-) 0.688 (-) 0.077 -0.006 0.160 D. novemcinctus 0.199 (+) 0.031 (+) 0.077 0.637 0.901 D. prymnolopha 0.045 (0) 0.011 (0) 0.077 -0.006 0.160 T. tetradactyla 0.108 (0) 0.017 (+) 0.123 0.020 0.226 C. semistriatus 0.045 (0) 0.048 (0) 0.015 -0.023 0.054 (+) = species is selected for, (-) = species is selected against, (0) = species taken in proportion with availability
61

Table 2.5.: Minimum (Nmax) and maximum (Nmin) numbers of individual cats detected per species, minimum (RAmin) and maximum (RAmax) estimates of relative abundance and number of sites where species were detected.
Species Nmin Nmax RAmin (%) RAmax (%) Sites Puma 14 9 39 44 8 Jaguar 3 5 13 16 4 Ocelot 1 2 4 6 1 Oncilla 11 10 44 34 5
62

Table 2.6.: Percentage of occurrence POi) and relative biomass of small, medium and large prey consumed by pumas (RBCi) in Jalisco, Mexico (Nunez et al 2000), chaco, Paraguay (Taber et al. 1997), the llanos, Venezuela (Maxit 2001) and caatinga, Brazil (this study). Standardized niche breadth (Bsta) and mean weight of vertebrate prey (MWVP) are also given.
Jalisco Chaco Llanos Caatinga POi RBCi POi RBC POi RBCi POi RBCi
Small 22 2 44 13 17 1
Medium 14 17 25 34 33 28 90 88
Large 42 75 24 51 50 70 10 12 Bsta 0.38 0.68 0.6 0.03 MWVP 12.70 0.78 8.36 5.08
63

M. g
ouaz
oubir
a
T. tajac
u
D. nov
emcin
ctus
D. prym
nolph
a
T. tetra
dacty
la
C. sem
istrat
us
Per
cent
age
0
10
20
30
40
50
Relative abundanceRelative biomass
Figure 2.1. Relative abundance and relative biomass of puma prey in Serra da Capivara NP, based on remote camera data.
64

Amazon
ia
Atlanti
c Fore
st
Cerrad
oCha
co
Pantan
al
Caatin
ga
Num
ber o
f spe
cies
0
5
10
15
20
25
30
35
40 < 15 kg> 15 kg
Figure 2.2. Prey size distribution of terrestrial mammals (> 1 kg) from the Amazon, caatinga, cerrado, pantanal, and chaco. Data were obtained from Fonseca et al (1996), and Miserendino et al. (1998). Mammal assemblages were divided into two categories: < 15 kg and >15 kg. Jaguars, pumas, and maned wolves (Chrysocyon brachyurus) were not included.
65