Political Activism -in Pollock G. and Ellison M. (2014) 'Measuring Participation', European...
431
MYPLACE August 2014 MYPLACE: FP7-266831 www.fp7-myplace.eu Deliverable 4.6 Europe wide thematic report Page 1 of 431 ____________________________________ ____________________________________ MYPLACE (Memory, Youth, Political Legacy And Civic Engagement) Grant agreement no.: FP7-266831 WP4: Measuring Participation Deliverable 4.6: Europe-wide thematic report Editors Mark Ellison, Gary Pollock Version Final v5.1 Date 12 th August 2014 Work Package WP4: Measuring Participation Deliverable 4.6: Europe wide thematic report Dissemination level PU: Public WP Leaders MMU, CRRC Deliverable Date June 2014 Document history Version Date Comments Modified by V5.0 7 th August 2014 Final draft version ME V5.1 12 th August Final version for submission GP
Transcript of Political Activism -in Pollock G. and Ellison M. (2014) 'Measuring Participation', European...
MYPLACE August 2014
MYPLACE: FP7-266831 www.fp7-myplace.eu Deliverable 4.6 Europe wide thematic report Page 1 of 431
____________________________________
____________________________________
MYPLACE (Memory, Youth, Political Legacy And Civic Engagement)
Grant agreement no.: FP7-266831
WP4: Measuring Participation
Deliverable 4.6: Europe-wide thematic report
Editors Mark Ellison, Gary Pollock Version Final v5.1 Date 12th August 2014 Work Package WP4: Measuring Participation Deliverable 4.6: Europe wide thematic report Dissemination level PU: Public WP Leaders MMU, CRRC Deliverable Date June 2014 Document history Version Date Comments Modified by V5.0 7th August 2014 Final draft version ME V5.1 12th August Final version for submission GP
MYPLACE August 2014
MYPLACE: FP7-266831 www.fp7-myplace.eu Deliverable 4.6 Europe wide thematic report Page 2 of 431
Contents:
Page:
Authors and Acknowledgements 3
Chapter 1: Key findings 6
Chapter 2: Introduction 12
Chapter 3: Survey Design and Methodology 14
Chapter 4: Political Interest 48
Chapter 5: Attitudes and Trust 97
Chapter 6: Political Activism 127
Chapter 7: Civic Engagement 164
Chapter 8: Effective Political Action 178
Chapter 9: Citizenship 207
Chapter 10: Social Networks, Gender and Sexuality 251
Chapter 11: Religion 277
Chapter 12: Attitudes Towards Minority Groups 293
Chapter 13: Democracy 331
Chapter 14: History and Memory 365
Chapter 15: European Issues 388
Chapter 16: Summary 404
Appendix A: Guidance Document 428
MYPLACE August 2014
MYPLACE: FP7-266831 www.fp7-myplace.eu Deliverable 4.6 Europe wide thematic report Page 3 of 431
Authors and Acknowledgments
Chapter 1: Key Findings
Authors: Mark Ellison and Gary Pollock
Chapter 2: Introduction
Authors: Mark Ellison and Gary Pollock
Chapter 3: Survey Design and Methodology
Authors: Tina Zurabishvili, Tamuna Khoshtaria, Koba Turmanidze and Bret Barrowman
(Caucasus Research Resource Centers, Georgia)
Chapter 4: Political Interest
Authors: Marti Taru and Ladislav Machacek
We would like to thank Inta Mierina for her help with multilevel regression and Mark Ellison
for feedback and help with formatting.
Chapter 5: Attitudes and Trust
Authors: Renata Franc and Vanja Međugorac
We would like to thank the young people at Peščenica and Podsljeme in Zagreb who
participated in survey.
Chapter 6: Political Activism
Authors: Roger Soler i Martí and Mariona Ferrer-Fons (Universitat Pompeu Fabra,
Barcelona) and Augusta Correia, Nuno de Almeida Alves and David Cairns (CIES-IUL/ISCTE-
IUL, Lisboa)
We would like to thank;
Portugal: fieldwork contractor: TNS
UPF: fieldwork contractor: GESOP and the councils of Vic and Sant Cugat
Chapter 7: Civic Engagement
Authors: Vesa Puuronen, Kari Saari, Samuli Neuvonen and Niko Eskelinen (Universty of
Oulu, and University of Eastern Finland, Finland) and Klaus Levinsen, (University of Southern
Denmark)
Chapter 8 Effective Political Action
Authors: Tina Zurabishvili, Tamuna Khoshtaria, Koba Turmanidze and Bret Barrowman
(Caucasus Research Resource Centers, Georgia)
MYPLACE August 2014
MYPLACE: FP7-266831 www.fp7-myplace.eu Deliverable 4.6 Europe wide thematic report Page 4 of 431
Chapter 9: Citizenship
Authors: Olga Elkina, Head of Marketing and Social Research, Natalia Goncharova, Deputy
Director, Scientific Research Center "Region", Senior Lecturer, Ulyanovsk State University
and Yana Krupets, Deputy Director, Centre for Youth Studies, Higher School of Economics, St
Petersburg.
The authors would like to thank: Olga Echevskaya (Novosibirsk State University, Russia),
Inta Mierina (Daugavpils University, Latvia), Tinatin Zurabishvili (Caucasus Research
Resource Centers program, Georgia), Gary Pollock (Manchester Metropolitan University,
United Kingdom), Hilary Pilkington (Manchester University, United Kingdom), Daria Krivonos
(Centre for Youth Studies, Saint-Petersburg University Higher School of Economics, Russia),
Dmitry Omelchenko (Centre for Youth Studies, Saint-Petersburg University Higher School of
Economics, Russia), Rowenna Baldwin (Manchester Metropolitan University, United
Kingdom)
We would also like to thank our respondents and our interviewers.
Chapter 10: Social Networks, Gender and Sexuality
Authors: Britta Busse, Alexandra Hashem-Wangler, Jochen Tholen (University of Bremen)
We would like to thank the Public Statistical Office of the state of Bremen for the careful
and professional execution of the WP4 fieldwork and the excellent cooperation.
Chapter 11: Religion
Authors : Irini Chiotaki-Poulou, Alexandra Koronaiou and Alexandros Sakellariou.
We would like to thank Emmanouella Kostopoulou, Project Leader of the subcontracting
company for her valuable help during the survey.
Chapter 12: Attitudes towards Minority Groups
Author: Inta Mierina is a lead researcher in the Daugavpils University, Latvia
We are grateful to the Institute of Philosophy and Sociology, University of Latvia, particularly
Ilze Koroļeva and Aleksandrs Aleksandrovs, for their help with preparation of the survey and
data collection in Latvia.
Chapter 13: Understandings of Democracy
Authors: Mark Ellison, Haridhan Goswami and Gary Pollock (Manchester Metropolitan
University)
We would like to thank Fieldwork Supervisor Marius Guderjan, the Herbert Museum,
Coventry and the young people of Coventry and Nuneaton who participated in the survey.
MYPLACE August 2014
MYPLACE: FP7-266831 www.fp7-myplace.eu Deliverable 4.6 Europe wide thematic report Page 5 of 431
Chapter 14: History and Memory
Authors: Istvan Muranyi, Zoltan Berenyi
We would like to thank István Vas (Adviser, Mayor's Office Ózd) and Balázs Kanczler
(Sociologist, Sopron) for their assistance in the survey work.
Chapter 15: European Issues
Authors: Mark Ellison and Gary Pollock, with extracts from various chapters.
General Acknowledgement
We would like to thank the young people across Europe who participated in this study, all
the fieldworkers and the various public, private and voluntary organisations who supported
the fieldwork. We hope to have done justice to the collective efforts of so many people in
our analyses. Without funding under the EU’s Framework 7 programme none of this work
would have been possible.
MYPLACE August 2014
MYPLACE: FP7-266831 www.fp7-myplace.eu Deliverable 4.6 Europe wide thematic report Page 6 of 431
1.0 Key Findings
These key findings are based on the the responses of almost 17,000 young people, aged 16-
25 in 30 locations across 14 countries in Europe who took part in the MYPLACE survey
(Workpackage 4: Measuring Participation).
The case study design, using two contrasting locations per country (four in Germany), allows
comparison both within and between countries. The findings detailed in this report
demonstrate that employing this methodology reveals that there are geographical patterns
which vary according to the subject of the analysis. It is often the case that country specific
similarities between locations are accompanied by significant between country
differentiation. However, this should not be regarded as evidence of a ‘national average’ as
our research locations are not selected to represent each nation and while any association
between the country specific findings reported here and nationally representative results
may be noted, this is not an intended feature of our research design. Indeed, there are
many instances of significant within country differences between the research locations
making it possible to identify greater similarities between locations in different countries.
An illustrative example of this concerns respondents’ views of the importance of language
competence to being a citizen of a given country. On this question, respondents in Tartu
(Estonia) are the most likey to say that ‘to speak the national language’ is important (96%)
while those in the Narva area, the other Estonian location but located in the east of the
country close to the border with Russia and with a high proportion of ethnic Russians, are
much less likely to say that it is important (54%). Similar differences also occur in Latvia,
with 84% of respondents in the Agenskalns district of Riga saying it is important as opposed
to 48% in the Forstate & Jaunbuve, districts of Daugavpils, a city close to the Russian border
also with a high proportion of ethnic Russians. The next highest within country variance on
this question is in Hungary where 92% of respondents in Ozd, a town close to the border
with Slovakia, state that national language competence is important for citizenship
contrasting with 81% of respondents in Sopron which is close to the Austrian border.
Interest in Politics
Across all locations, more young people reported that they are ‘not interested’ (58%) rather
than are ‘interested’ in politics (42%). The levels of interest were differentiated at the
country and wider regional level; young people were more likely to be interested in politics
in eastern Germany, Greece and Spain, but less likely in Croatia, Latvia, Finland and Estonia.
Employment, housing and the environment are the three issues that are of greatest interest
for these young people. The European Union, immigration and LGBT rights, in contrast,
scored lowest in terms of the level of political interest.
MYPLACE August 2014
MYPLACE: FP7-266831 www.fp7-myplace.eu Deliverable 4.6 Europe wide thematic report Page 7 of 431
Television and the Internet are the two modes of information used most by young people to
obtain information about politics and public affairs.
Attitudes and Trust
Young people feel very much detached from politicians and tend to have a negative view of
them. Only 22% of our respondents agree with the statement: ‘politicians are interested in
young people like me’ whereas 60% agree with the statement ‘politicians are corrupt’ and
69% agree with the statement ‘the rich have too much influence in politics’. When
examined regionally, a majority of the Danish respondents actually agree that politicians are
interested in them whereas over 80% of our Greek respondents disagree.
On a 0 to 10 scale, young people tend not to trust the Prime Minister with an average value
of 4.3, parliament (4.5) and political parties (3.8) in their countries although the findings also
reveal country and regionally based patterns. The least trusting responses were
characteristic for young people from Greece, Croatia, Spain and Hungary, whereas Finland,
Georgia, Denmark, eastern and western Germany have levels of trust at the midpoint of the
scale.
Political Activism
Of those young people eligible to vote in national elections, 71% actually did at the last
opportunity and 17% made a conscious decision not to vote. The remaining 11% reported
that they would have voted but were unable to. Locations with voting levels in excess of
80% are; Podsljeme, both Danish locations, Kuopio (Finland), both eastern German
locations, Agenskalns (Latvia) and Vic (Spain). By far the lowest level of voting was in
Nuneaton (UK) where only 39% of eligible voters chose to do so, with 43% of eligible voters
deliberately choosing to stay away from the polls.
More than half of respondents (59%) state that they do not feel close to any political party.
There are large variations in the level of political activism across our locations. The global
level of non-electoral participation (an index based on 20 different political activities)
showed large differences between the 30 locations in the study. As an example, both
locations in Hungary represent a level of participation 25 times lower than some locations in
eastern Germany or Spain.
In locations that have experienced a greater impact of the current financial crisis, young
people participate less in global terms but tend to participate more through protest actions.
MYPLACE August 2014
MYPLACE: FP7-266831 www.fp7-myplace.eu Deliverable 4.6 Europe wide thematic report Page 8 of 431
Civic Engagement
Young people have extremely low levels of civic engagement. A composite index of eleven
civic and political organisations1 shows the overall average to be 0.3 on an eleven-point
scale ranging from 0 (no engagement) to 11 (high engagement). There is considerable
variation in civic engagement across locations and countries . Young people from the Nordic
countries (Denmark and Finland), have the highest levels of membership of civic and
political organisations, while young people from Mediterranean (Portugal, Spain and
Greece) and post-socialist countries (Hungary, Slovakia, Georgia and Latvia) have the lowest
levels.
Effective Political Action
On a 0 to 10 scale, voting in elections received the highest mean score for effectiveness of
political action (6.9), followed by gaining publicity through media exposure (5.9) and being
active in a political party (5.4). Participating in violent and illegal protest activities are
universally regarded as the least effective with scores of 2.9 and 3.5 respectively.
Young people in locations in Georgia tend to rate the range of non-violent and violent
political actions as relatively effective, while young people in Russia, Hungary, Croatia and
Slovakia tend to be relatively pessimistic about the effectiveness of political action.
Citizenship
Those who are most proud of their citizenship status2 are the young people from locations
in Georgia, Finland, Denmark and the UK with levels of pride around 90%. Approximately
60% of the young people from Vic and Sant Cugat (both locations are in Catalonia) state that
they are not proud of their citizenship. Other locations where levels of pride in citizenship
were less than 70% are: the Narva area (Estonia), Bremen (western Germany) Jena and
Rostock (both in eastern Germany), and Forstate & Jaunbuve (Latvia).
1 The organisations included in the index are: ‘political parties or youth sections of political parties’; ‘religious or church organisations or religious youth organisations’; ‘trade unions or youth organisations of trade unions’; ‘national or local youth parliaments’; ‘environmental organisations’; ‘animal welfare groups’; ‘peace organisations’; ‘human rights organisations’; ‘national or cultural organisations (for instance diaspora or ethnic minority organisations)’; ‘women’s organisations’ ; and ‘anti-globalisation organisations or movements’ 2 Our analysis is sensitive to nuances across our research locations where nationality, ethnicity and citizenship
have specific local connotations. The large ethnically Russian population in the Narva area in Estonia as well as
the Forstate and Jaunbuve districts in Latvia are particularly important in this respect. In addition, Coventry in
the UK is particularly ethnically diverse. Our analysis therefore uses a measure of ‘identity’ based on citizen,
nationality and ethnic status.
MYPLACE August 2014
MYPLACE: FP7-266831 www.fp7-myplace.eu Deliverable 4.6 Europe wide thematic report Page 9 of 431
Respondents from locations in Greece, Croatia , Slovakia and Portugal tend to support
limiting the import of foreign products in order to protect the national economy. In
contrast, locations in Denmark as well as eastern and western Germany tend not to support
this policy. The idea that the ‘country should follow its own interests even if this leads to
conflicts with other nations’, is supported by the majority of respondents in locations in
Georgia, Greece, Hungary and Portugal.
Social networks, gender relationships and sexuality
Levels of trust in people were highest in locations in Finland, western Germany and
Portugal, while Greek, Russian, Slovakian and Georgian locations had the lowest mean
values for trust in people.
In terms of attitudes towards women and homosexuality in society, Denmark, Finland, Spain
and Germany tend to have the most egalitarian responses. The least egalitarian views were
expressed in locations in Georgia, Greece, Slovakia, Latvia and Russia.
Women`s access to abortion is supported most strongly in locations in eastern Germany,
Spain and Estonia. Young people in locations in Russia, Greece and Georgia are the most
likely to believe that women should not have access to abortion.
Religion
Levels of religiosity are high in a cluster of locations including Georgia, Greece, Croatia and
Russia. Locations in eastern Germany, Spain and Denmark, on the other hand, are among
those showing the lowest levels of religiosity.
Locations in Georgia and Greece have higher levels of agreement to the statement that
‘there is only one true religion’, as opposed to eastern Germany that uniformly has the
lowest levels of agreement. Locations in Spain, Greece and western Germany tend to agree
that religious leaders should have no influence on government decisions.
Attitudes towards minority groups
Young people in Western European locations, especially eastern Germany, are least likely to
have negative views towards different minority groups and to advocate limiting the access
of migrants to a range of resources. Young people in post-socialist locations, along with
Greece, tend to express more negative views and are more likely to be exclusionist towards
migrants.
MYPLACE August 2014
MYPLACE: FP7-266831 www.fp7-myplace.eu Deliverable 4.6 Europe wide thematic report Page 10 of 431
Young people in locations in Greece are much more likely than others to have xenophobic
attitudes, whereas eastern and western German locations are clustered at the bottom of
the xenophobia scale.
Locations in Hungary, Russia and Georgia are at the top of the welfare chauvinism and
exclusion scale; in these locations young people favour limiting access by migrants to a
range of resources.
Democracy
Young people’s satisfaction with democracy in their country tends to be around the middle
of a 0-10 scale across all locations although a number of clear clusters emerge. Locations in
Denmark, Finland, eastern and western Germany have higher average levels of satisfaction
with democracy whereas mediterranean countries including Greece, Spain and Portugal
have lower average levels.
When asked about the desirability of different types of political systems, respondents from
locations in Denmark and eastern Germany tend to have more positive views towards
democratic political systems, whereas, locations in Russia, Latvia and Slovakia tend to be
less positive.
Young people in locations in Georgia, Croatia, the UK and Portugal tend to have more
positive attitudes towards non-democratic political systems3. Locations in Germany
(western and eastern), Finland and Spain are more likely to be negative.
History and Memory
Young people are interested in recent history, with 29% stating that they are very interested
and 56% a little interested. Interest in recent history was highest in locations in Greece,
Georgia, and Germany (eastern and western).
The reported importance of different historical events shows that respondents consider
World War II (85%) and membership in the European Union (84%) to be ranked highest
from their countries’ perspectives among the listed events and periods. The NY terrorist
attacks of September 9th 2011 (41%) and the Holocaust (52%) are less likely to be seen as
important. There is, however, massive location variance in these figures, for example the
importance of the holocaust varies from a low of 18% in Lieksa/Nurmes (Finland) to 91% in
Jena (eastern Germany). Locations where the importance of the holocaust is greater than
60% are: Nuneaton and Coventry (both in the UK), Vyborg (Russia), Sopron (Hungary),
Rostock, Jena, Bremerhaven and Bremen, i.e. all four German locations.
3 Attitude to ‘Having a strong leader who is not constrained by parliament’ and ‘Having the army rule’.
MYPLACE August 2014
MYPLACE: FP7-266831 www.fp7-myplace.eu Deliverable 4.6 Europe wide thematic report Page 11 of 431
European Issues
Interest in the European Union is high in Mediterranean locations (Portugal, Spain and
Greece) and locations in Germany (eastern and western). The highest scores, however, are
from both Georgian locations, the only ones to score averages higher than 7 on a 0-10 scale
where the overall average is 5.5. The lowest scores are from Lieksa and Nurmes (Finland)
with 4.1, Nuneaton (UK), with 4.2, and both Russian locations which each have a score of
4.0.
When asked about whether or not membership of the EU benefits their country, 49%
agreed with this statement4. The majority of respondents agree that EU membership
benefits their country in all four German locations and in both Spanish ones. However,
young people in Greece, Hungary and Rimavska Sobota (Slovakia) are far more lkely to
disagree.
On a 0 to 10 scale the average level of trust in the European Commission is 5.2, higher than
average trust in national parliaments at 4.5. The highest average levels of trust in the EC are
in both Georgian locations, Telavi (6.6) and Kutaisi (6.1) as well as the Finnish location of
Kuopio (6.3). The lowest average levels of trust were reported in both Greek locations, New
Philadelphia (3.7) and Argyroupouli (3.5) as well as the Russian location of Kupchino (4.3).
4This question was not asked in Russia or Georgia. A modified version was asked in Croatia where EU
membership was expected to be granted in July 2013.
MYPLACE August 2014
MYPLACE: FP7-266831 www.fp7-myplace.eu Deliverable 4.6 Europe wide thematic report Page 12 of 431
2.0 Introduction
This report is based upon the data analysis from a representative sample of young people
(16,935 questionnaires achieved) in the 30 MYPLACE research locations in 14 countries
across Europe.
2.1 Aims
The aim of the MYPLACE survey and this report in particular, is to present a general Europe
wide thematic analysis of young people’s views, attitudes and behaviour towards a range of
social and political issues. These attitudes and behaviours are analysed across the 30
research locations in 14 countries across Europe. The findings are arranged under the
following themes: political interest, political participation, citizenship, social networks,
gender and sexuality, religion, minority groups, understanding of democracy, history and
memory and European issues.
2.2 Purpose and scope of this report
This report is the final MYPLACE Work Package 4 deliverable and forms one of a series of
reports and papers from the survey component of the MYPLACE project. It is a key
deliverable for the European Commission and is a source document for future publications.
This report is aimed at a range of audiences including the European Commission, national
youth groups including the MYPLACE Youth Policy Advisory Groups (YPAGs), the academic
community and the young people who have participated in the survey.
The scope of this report is limited to the analysis of the 30 research locations and key socio-
demographics of the respondents. Each themed chapter is structured in the same way, and
contains the following sub-sections:
A review of substantive literature on the theme.
A brief summary of the fifteen individual country specific analyses, which were
produced as ‘Deliverable 4.5: A series of country specific analyses which highlight
local historical and cultural factors and which contrast the two locations sampled’.

MYPLACE August 2014
MYPLACE: FP7-266831 www.fp7-myplace.eu Deliverable 4.6 Europe wide thematic report Page 13 of 431
Comparative analysis of each of the 30 research locations on each question. When
there were good theoretical grounds to combine individual questionnaire questions
or items, factor analysis/Cronbach Alpha and further tests of robustness were used
to ensure these variables were suitable. Otherwise, individual questions or items
were analysed separately. Data are presented as a series of graphs with
supplementary analysis.
A multivariate analysis using one or more Multi-level models (MLM) (or in the case of
chapter 14 a multiple regression model). A multi-level model is favoured due to the
nested structure of the dataset, with locations within countries.
A summary of key findings from the chapter.
MYPLACE August 2014
MYPLACE: FP7-266831 www.fp7-myplace.eu Deliverable 4.6 Europe wide thematic report Page 14 of 431
3.0 Survey Design and Methodology
3.1 Questionnaire content
The final MYPLACE source questionnaire (in English) is presented in deliverable D4.1. The
questions cover the following topics: Political interest, political participation and civic
engagement (Section I); Social networks, gender relationships and sexuality (Section II);
Religion (Section III); Attitudes towards minority groups (Section IV); Understanding of
democracy, violence and human rights (Section V); History and memory (Section VI); and
Respondent’s socio-demographic profile (Section VII).
In order to ensure comparability between data collected by the MYPLACE partners, the
process of translation of the questionnaire has mainly used the ASQ (Ask the Same
Question) model. This allowed the data to be pooled for a trans-European analysis.
However, ASQ is not a direct translation. Unlike direct translations, ASQ does not ignore
cultural and linguistic nuances. Translation Tracking Forms (TTF) were used by all MYPLACE
partners, except the UK, to detail all issues in the wording of questions, instructions and
answer options, and to propose ways of solving these issues.
In respect to some questions, national variation was applied. For instance, level of political
knowledge was measured in questions 28_1 through 28_3 using a ‘functional equivalence’
approach, given that the aim of these questions was to measure political knowledge within
a national context, in order to produce a scale which differentiated levels of respondents’
knowledge.
In addition to Q28, national variation was required in the following questions:
Q7_3, where respondents’ trust towards the head of government was measured.
There are minor differences in how the question was worded by the national teams
(most partners asked about the Prime Minister, while several partners asked about
the President), but in all cases the question was asked about the top political figure
in the country. Hence, the answers have been aggregated in the merged data set
into a single variable irrespective of exactly how the question was worded.
In Q8 and Q11 participation in national and local elections was measured. The last
national and local elections were named by each partner.
In Q9, Q12 and Q15 respondents were asked to name the political party they voted
for (Q9, Q12) or felt closest to (Q15). Each partner provided a list of political parties
that participated in the corresponding elections (national or local).
MYPLACE August 2014
MYPLACE: FP7-266831 www.fp7-myplace.eu Deliverable 4.6 Europe wide thematic report Page 15 of 431
Q18_16 was an optional question about membership/participation in activities of an
‘other’ organisation (in addition to 15 organisations specified in earlier questions).
Only eastern German and western German teams used the opportunity to ask about
additional (16th and 17th) organisations, “youth fire brigade” (Q18_16) and “youth
club” (Q18_17).
Q23 was asked only to the respondents who were not citizens of the country where
the interview was conducted. Eleven partners used this variable: Croatia, Denmark,
Estonia, Greece, Hungary, Latvia, Portugal, Russia, Slovakia, Georgia, and the UK.
Q26_5 (assessment of the role of EU membership) was not asked in countries which
were not members of the European Union (Georgia and Russia).
In Q40_7 and Q40_8 the partners generated country-specific statements to measure
attitudes towards national and/or religious minority groups in their countries. In
accordance with the decision made during the MYPLACE project meeting in
Smolenice in May 2013, these country-specific variables were dropped from the
merged data set, but will be used for national-level analysis as appropriate.
Q51_9 (assessment of the importance of EU membership for the history of the
country) was only asked in EU member countries.
In questions Q51_10 through Q51_12 the partners had the opportunity to ask about
the importance of country-specific event(s) for the history of their country. In
accordance with the decision made during the MYPLACE project meeting in
Smolenice, these country-specific variables were dropped from the merged data set,
but will be used for national-level analysis as appropriate.
In Q58 (respondent’s ethnic group) ethnic groups relevant for each of the partner
countries were named.
In Q59 (respondent’s religion) religious groups relevant for each of the partner
countries were named.
Q60, Q73 and Q77 measured the highest level of education received by the
respondent, the respondent’s father, and the respondent’s mother respectively. The
answer options provided in the local language questionnaires represented
educational qualifications relevant for the partner countries.
The Croatian questionnaire had the following additional country-specific questions:
- Four additional statements measuring national identification:
o P26_6CRO “I believe Croatian policies are almost always morally correct”; o P26_7CRO “If I criticize Croatia, I do so out of love for my country”; o P26_8CRO “I support Croatia’s leaders even if I disagree with their actions”; o P26_9CRO “People should work hard to move this country in a positive direction”. Answer options were on a 5-point Likert scale.
- Q53_CRO “On which side was your family mainly during WWII?”

MYPLACE August 2014
MYPLACE: FP7-266831 www.fp7-myplace.eu Deliverable 4.6 Europe wide thematic report Page 16 of 431
with the following answer options:
o On the side of the Antifascists and Partisans, o On the side of the Croatian Home Guard, o On the side of Ustasha, o On some other side WRITE _____________, o On several different sides, o On none of the sides, o Do not know, o Refuse to answer.
- Q83 “During the Homeland war, …
P83_1. … were you or your family displaced (were forced to leave your home and
move to another part of the country)?
P83_2. … did you or your family have greater material losses?
P83_3. … did you or your family lose a family member?
P83_4. … did you or your family lose a close friend or neighbour(s)?”
Answer options included No, Yes, Do not know, Refuse to answer.
All these additional national variance questions were approved by the coordination team at
Manchester Metropolitan University and CRRC-Georgia with regard to their content and
their position in the questionnaire.
Additional questions and modifications to the eastern German questionnaire included:
In Q25, ‘Being a citizen of this country’ was changed to ‘being German.’
Q83 and Q83a, Place and Bundesland of birth were added to the questionnaire.
Three additional country specific questions were added in Greece, at the end of the
questionnaire, asking about respondents' feelings regarding their future life in Greece;
whether they have considered the possibility of moving abroad; and if so – for what reason.
3.2 Research locations
Each MYPLACE partner selected two contrasting locations to conduct the WP4 survey. The
D3.1 report provides detailed information about the rationale for the selection of survey
locations, which is summarized below.
Croatia
In Croatia, the WP4 survey was conducted in two districts of Zagreb: Podsljeme and
Peščenica. Zagreb is divided into 17 ‘city districts’. Podsljeme and Peščenica were selected
MYPLACE August 2014
MYPLACE: FP7-266831 www.fp7-myplace.eu Deliverable 4.6 Europe wide thematic report Page 17 of 431
as contrasting survey locations that are not adjacent and are very different in socio‐
economic as well as demographic terms. While Podsljeme is a rather quiet, mostly
residential and, in economic terms, prosperous area, Peščenica can be described as a
‘troubled’ part of the city. It is a poorer city district, mostly (but not exclusively) industrial,
and – at least to some extent – more ethnically mixed.
Several key factors were taken into account while selecting these locations. Firstly, based on
the available literature and empirical data on young people’s political and social
participation in Croatia, as well as the potential and propensity for radical ideas, it was
concluded that the most important factors influencing young people’s receptivity to radical
political agendas in Croatia were: (1) community segregation/cohesion (especially the
degree of contact with immigrants, ethnic and religious minorities); and (2) socio-economic
inequalities (including levels of education and unemployment, but also socio-economic
issues related to the 1991‐95 Homeland War, war veterans and war refugees). Secondly,
given the fact that different parts of the country had very different historical experiences, it
was decided that selecting two locations geographically remote from one another could
present a problem, as it would be difficult to make a meaningful comparison due to the
different issues of their historical past. While some regions were completely devastated
during The Homeland War of 1991‐5, others were left almost intact. Selecting two locations
within the same city would help to avoid this problem. Thirdly, considering that the WP4
survey required a sample representative for the youth living in each of the selected
locations (and, therefore, a robust sample frame), it was concluded that this information
would be most easily available for administrative units (e.g. ‘city districts’ or
‘municipalities’).
Denmark
In Denmark, the WP4 survey was conducted in the city of Odense. Odense has a population
of 170,327 which makes it the third largest city in Denmark and the main city of the island of
Funen. The fieldwork was conducted in Odense Centre and Odense East, which are two
relatively different parts of the city. Population of Odense Centre is socially mixed, though
with a preponderance of residents belonging to the middle class. Odense East is an area
which includes the suburb Vollsmose, a ghetto-like area with a high proportion of residents
with immigrant background. This area was a modern housing development project from the
1970s, and has about 10,000 inhabitants on its two square kilometres. Since the 1990s, this
area has become known throughout Denmark, due to a relatively high crime-rate and the
large density of people of foreign descent.
Estonia
MYPLACE August 2014
MYPLACE: FP7-266831 www.fp7-myplace.eu Deliverable 4.6 Europe wide thematic report Page 18 of 431
Selection of research sites in Estonia was guided by (1) the potential for understanding
youth socio-political (extremist) activism, and (2) ability to demonstrate a considerable
contrast between the locations in terms of the socio-economic characteristics and the
ethnic-cultural composition of the population.
In Estonia, the WP4 survey was conducted in two regions: Ida-Virumaa county in north-
eastern Estonia and Tartu county, in central-eastern Estonia. In Ida-Virumaa county,
interviews were carried out in three towns: Narva (66% of the sample of this location),
Sillamäe (8%) and Kohtla-Järve (26%). These settlements are populated largely by Russians
living in the socio-economic periphery, partly supporting anti-Estonian and pro-Soviet ideas.
A high percentage of this population is elderly.
In the central-eastern region, the survey was carried out in Tartu (81%) and in neighbouring
parishes. Population of Tartu is Estonian. They live in a large settlement, in a central
location, and are characterized by quite nationalistic ideas. This population has a high
percentage of young people.
Finland
The WP4 survey was conducted in eastern Finland, in the city of Kuopio (the city centre and
nearby areas of Niirala, Haapaniemi and Rönö) and the region of Pielinen Karelia (towns of
Lieksa and Nurmes). These fieldwork sites were selected on the basis of four criteria we
were looking for: (1) urban versus rural environment, (2) socio-economic differences
between the local population, (3) level of ethnic conflicts in the recent past, and (4) level of
support for the populist political party, The Finns.
Kuopio is the ninth largest city and an urban provincial centre in Finland. Every fifth person
living in the selected four areas is young (aged 15-24). In Kuopio, especially in the chosen
areas of the city, educational and income levels are higher than on average in the country.
The city has a relatively stable economy as it is a regional centre with quite a large and
attractive university, other institutions of higher education, industries, commercial, financial
and cultural services. However, the unemployment level in the whole Kuopio area is slightly
higher than the national average. Ethnically, the city is relatively homogeneous and the
number of ethnic conflicts (reported by the police) is low. In the selected areas of Kuopio,
the support for The Finns in the 2011 Parliamentary Election was relatively low.
Nurmes and Lieksa are relatively small towns in eastern Finland. These towns have 7000
(Nurmes) and 10 000 (Lieksa) inhabitants and are surrounded by large sparsely populated
rural areas. The proportion of young people is low compared to Kuopio. The share of young
people (aged 15-24) in the population of both towns is around 10%. In Nurmes and Lieksa
the population has relatively low education and income, and the unemployment level is
MYPLACE August 2014
MYPLACE: FP7-266831 www.fp7-myplace.eu Deliverable 4.6 Europe wide thematic report Page 19 of 431
twice as high (or even more) as the average in the country. The towns are located in a
declining socio-economic area with decreasing economic activity and ageing population. The
future prospects of young people living in this area are limited because of a lack of higher
and even vocational education and employment opportunities.
Both towns are relatively homogeneous in terms of ethnicity of their population. However,
Lieksa has received some hundreds of asylum seekers, who have gotten residence permits
during the last four years. Immigrants (mainly from Somalia) have caused suspicion and
conflicts in this relatively small and closed community, which has a history of ethnic tensions
starting from the late 1950s (expulsion of the Roma in 1956). In Nurmes and Lieksa, the level
of support for The Finns is relatively high at nearly 25% of the voters, which is above the
national average (19 percent).
Georgia
The survey locations in Georgia were Kutaisi (more specifically, Kakhianuri district of the
city), situated in the western part of the country, and the town of Telavi, situated in the
east. The distance between Kutaisi and Telavi is approximately 300 km.
Kutaisi is the capital of the Imereti region, the second largest city in Georgia (with 194.7
thousand inhabitants according to the latest data of the National Statistics Office of
Georgia), and one of the biggest industrial cities of the country. The National Parliament of
Georgia moved to Kutaisi in October 2012, when the MYPLACE survey fieldwork was
conducted. It was expected that this would lead to important changes in the life of the city,
since more attention would have been paid to its infrastructure, more social and cultural
events would have been organized, and potentially, there would have been more job
opportunities as well. The ‘supply side’ of all types of political movements, including, of
course, the radical ones, was also expected to significantly increase, and try to influence the
local population (although it was already rather high in Kutaisi even before the Parliament
moved there).
Telavi, on the other hand, is the capital of the Kakheti region and a much smaller town with
a population of less than 30 thousand inhabitants. Traditionally, political life is significantly
less active in Telavi (compared to the situation in Kutaisi); hence, the ‘supply’ factor in
radical politics is less prominent. Other important differences are observed from the point
of view of infrastructure and living standards. Employment opportunities are more limited,
as are the sources of information about current events (including local sources of
information).
The eastern and western parts of Georgia are traditionally characterized by different styles
and rhythms of life, as well as by differences in the dominant attitudes of the population
towards major events and/or social and political institutions. The population of Imereti is, in
MYPLACE August 2014
MYPLACE: FP7-266831 www.fp7-myplace.eu Deliverable 4.6 Europe wide thematic report Page 20 of 431
general, believed to be rather active, while the population of Kakheti is considered to be
more passive. Both desk research and expert interviews conducted in terms of WP1 and
WP3 suggested the same. Hence, different level of engagement of young people were
expected to be documented in these two locations.
Eastern Germany
In eastern Germany, the WP4 survey was conducted in Jena in Thuringia and Rostock in
Mecklenburg-Vorpommern (MV), both parts of the former German Democratic Republic.
Jena is the second largest city in Thuringia with slightly over 100 thousand inhabitants
(105,463). It is comprised of a large number of young people and students. The historic
Friedrich-Schiller University and the Fachhochschule host together about 25 thousand
students. It is therefore not surprising that in 2010, the age group 15-25 made up 13.4
percent of the city’s population (Statistische Ämter des Bundes und der Länder, 2012). Over
the last decade, the foreign population in Jena has grown to a share of 6.5 per cent in 2011,
which is almost twice as high as in Rostock (Thüringer Landesamt für Statistik).
After reunification of Germany, Jena developed into a prosperous site for specialised
industries, including the optical, chemical, pharmaceutical and medical industries
(Wirtschaftsförderungsgesellschaft Jena mbH, 2013). The unemployment rate is lower than
in the rest of Thuringia, in eastern Germany, and even in western Germany.
Jena has a reputation for being a heartland for right-wing extremism. The Festival of the
People, the largest right-wing extremist event in Europe, took place in Jena between 2005
and 2007. Core members of the right-wing terror cell Nationalsozialistischer Undergrund
(NSU) originally came from Jena and were part of the Sektion Jena of the Thüringer
Heimatschutz, a radical right-wing group, during the 1990s (Kynast, 2005; Zander, 2005).
With slightly over 200 thousand inhabitants (202,734), Rostock is the only major city in MV,
which has a predominantly rural character. Whilst the countryside in MV is acutely affected
by population loss, an ageing society and a low share of the foreign population, Rostock was
able to reverse shrinkage and experience moderate population growth (Scholz et al., 2010).
Because of its educational offerings, including a historic university with 15,000 students,
research institutes and related businesses, Rostock has been able to attract a young
population. In 2010, Rostock comprised a higher proportion of young people (12.4 per cent)
than the German average (11.1 per cent) (Statistische Ämter des Bundes und der Länder,
2012).
MYPLACE August 2014
MYPLACE: FP7-266831 www.fp7-myplace.eu Deliverable 4.6 Europe wide thematic report Page 21 of 431
In contrast to Jena, Rostock has faced economic decline since the German reunification. Like
Jena, Rostock has been stigmatised as a stronghold for right-wing extremism. Twenty years
ago, in the summer of 1992, a group of 100 people attacked the Zentrale Aufnahmestelle für
Asylbewerber (ZAST), an asylum for Vietnamese guest workers in Rostock-Lichtenhagen
(Prenzel, 2012).
Western Germany
In western Germany, the WP4 survey was conducted in Bremen wards and Bremerhaven
wards. The selection of locations was driven by the basic interest of the MYPLACE project to
learn more about young people’s involvement in radical, extreme or populist movements.
Drawing from the WP1 summary and German reports, as well as the knowledge of local
factors potentially not captured in the broader literature, it has been concluded that the
two most important criteria for being influenced by radical movements in Germany were:
(1) Community segregation/integration and (2) Socio-economic inequalities (‘deprivation’).
Based on this, the western German team agreed on the following composition of the
localities:
1) Bremen wards: Alte Neustadt, Altstadt, Arbergen, Arsten, Aumund-Hammersbeck,
Barkhof, Borgfeld, Buntentor, Bürgerpark, Burg-Grambke, Ellener Feld, Ellenerbrok-
Schevemoor, Farge, Fesenfeld, Findorff-Bürgerweide, Gartenstadt Süd, Gartenstadt Vahr,
Gete, Grolland, Habenhausen, Hastedt, Horn, Huckelriede, Hulsberg, Kattenesch, Lehe,
Lehersterdeich, Lesum, Mahndorf, Neuenland, Neu-Schwachhausen, Neustadt,
Oberneuland, Osterholz, Ostertor, Peterswerder, Rablinghausen, Radio Bremen,
Regensburger Str., Rekum, Riensberg, Rönnebeck, Schönebeck, Schwachhausen,
Sebaldsbrück, Seehausen, St. Magnus, Steintor, Südvorstadt, Vegesack, Weidedamm.
2) Bremerhaven wards: Königsheide, Fehrmoor, Leherheide-West, Speckenbüttel,
Eckernfeld, Twischkamp, Goethestraße, Klushof, Schierholz, Buschkämpen, Mitte-Süd,
Mitte-Nord, Geestemünde-Nord, Geestendorf, Geestemünde-Süd, Bürgerpark, Grünhöfe,
Schiffdorferdamm, Surheide, Dreibergen, Jedutenberg.
Greece
In Greece, the WP4 survey was conducted in two suburbs of Athens, Municipal Departments
of Argyroupoli and Nea Philadelphia. They were selected based on their population size
(around 30,000, i.e. realistic to cover during the fieldwork and, at the same time, large
enough to conduct the expected number of interviews) and their characteristics regarding
MYPLACE August 2014
MYPLACE: FP7-266831 www.fp7-myplace.eu Deliverable 4.6 Europe wide thematic report Page 22 of 431
community segregation/cohesion, socio-economic inequality, “supply” of radicalism,
political heritage and civic engagement.
Argyroupoli is situated in the relatively affluent south-eastern region of Athens and is
populated by representatives of middle and upper-middle classes. Although there are no
official data available regarding socio-economic inequality within and between the selected
areas, the existing information suggests higher income and standard of living in Argyroupoli
where real estate is significantly more expensive than in Philadelphia.
Argyroupoli has significant development potential due to the new metro station, which
opened to the public in the summer of 2013, and the neighbouring area of the former US
military air base, which is a public asset and is considered to be the largest urban waterfront
property in Europe. Politically, population of Argyroupoli is characterized by centrist-liberal
tradition.
Nea Philadelphia, on the other hand, is located in the poorer north-western part of the city
and has characteristics of a lower-middle and working class area. It includes
neighbourhoods that are vulnerable to social deprivation and exclusion such as a social-
housing district and parts of the refugees’ old neighbourhoods. The latter were populated
by Greek refugees who had been expelled from the Asia Minor coastline after the First
World War, following the Greek-Turkish war of 1919-1922, and the “Catastrophe of Smyrna”
in 1922. Philadelphia has a left-wing political tradition due to the working class origin of its
population.
According to 2001 census data, the vast majority of the population in both locations is of
Greek origin. Both locations exhibit similar voting patterns in national and local elections
which also follow the general voting pattern in Greece. However, in the context of the
current crisis, it is anticipated that radicalism will be present in both locations. In both
locations there are open assemblies and the residents have mobilized against austerity
measures. In Philadelphia, however, such activism seems to be more intense and there is an
anarchist occupation. In both locations there are citizens’ associations and clubs, while
during the crisis there has been an increase in participation in voluntary initiatives.
Hungary
In Hungary, the WP4 survey was conducted in Sopron and Ózd. Both towns are on the
border and far from the political, economic, and cultural centre, Budapest. However they
differ from each other in a number of respects.
MYPLACE August 2014
MYPLACE: FP7-266831 www.fp7-myplace.eu Deliverable 4.6 Europe wide thematic report Page 23 of 431
Sopron is located on the Hungarian-Austrian border and has 61,072 inhabitants (Hungarian
Central Statistical Office, 2011). Since Austria is a developed country, its vicinity offers more
advantages in trans-border relations (tourism, employment, trade). Sopron has historic civic
traditions. There are several secondary schools and university departments in Sopron. The
economic indicators of Győr-Moson-Sopron County are above the national average. The
average unemployment rate during 2011 was 4.6%. The average annual unemployment rate
is the third lowest in Hungary, just behind the capital and Pest County. The proportion of
Roma population in Győr-Moson-Sopron County was 2.7% in 2003.
Ózd is located near the Hungarian-Slovakian border and has 34,072 inhabitants (Hungarian
Central Statistical Office, 2011). Historic civic traditions are absent; it is a typical socialist
industrial town. There are only two secondary schools in Ózd. It has the third largest Roma
community in Hungary according to 2001 census data (according to some estimates, 37% of
the population is Roma). Unemployment, which has affected many since the fall of socialism
in this industrial and mining region, doubled between 2002 and 2009. A significant
proportion of the population is not highly educated. Earlier they worked as semi-skilled
workers, and they are currently long-term unemployed.
Latvia
In Latvia, the WP4 survey was conducted in urban areas of Riga and Daugavpils. Āgenskalns
apkaime was the area surveyed in Riga. In Daugavpils city, Forštate (Jaunā Forštate and Vecā
Forštate) and a part of the Jaunbūve district were used. The selected areas present
contrasting cases in terms of economic development, ethnic composition, and social
situation.
Āgenskalns is one of the 58 "apkaimes" (localities) in Riga, the capital of Latvia, and the most
economically developed region in the country. There are more jobs available, salaries are
significantly higher, and the overall economic situation is arguably the best in Latvia. There
are lots of opportunities for young people to get involved in different social, civic and
political activities. Riga, and Āgenskalns apkaime in particular (due to several university
branches located there), has quite diverse population, since it hosts a mix of people from
different regions that come to work or study there. Thus, people in Āgenskalns seem to be
more open, liberal, and tolerant to different ideas and cultural influences. The ethnic
proportions of Russians and Latvians are similar, yet Āgenskalns is seen as one of the
predominantly Latvian parts of the city. Āgenskalns has a number of schools and
kindergartens, a university branch, one of Riga’s largest hospitals, several churches and
museums, an old and lively market, one of the city’s largest parks; it is very well connected
to other districts and to the centre of the city. The number of inhabitants in Āgenskalns
district is 28,741 (Riga city municipality data, 2010).
MYPLACE August 2014
MYPLACE: FP7-266831 www.fp7-myplace.eu Deliverable 4.6 Europe wide thematic report Page 24 of 431
Daugavpils is located in the Latgale region. For a long time, this region was considered as
lagging behind others in terms of economic development, infrastructure, employment,
innovation, etc. The emigration rates from this region are very high, especially among the
youth. Latvians are quantitatively one of the smallest groups in this city, while 85% of the
population are ethnic minorities. The ethnic composition of the population and the
closeness of the city to Russia, in combination with economic struggles of the population,
provides fertile ground for the rise of radical ideas.
The areas selected in Daugavpils city are similar to each other, yet have their distinct history
and character. Jaunā Forštate, like the city itself, has mostly Russian population, and a
comparatively high number of young people live there. Transport connections to other parts
of the city have been relatively poor until recently, but the infrastructure is improving. There
are kindergartens, a school, a few churches (Russian Orthodox and Catholic), as well as a
cultural centre in this district.
Vecā Forštate is a small area neighbouring Jaunā Forštate. Due to its small size, in some
sources it is not even distinguished from the latter, but merged with Jaunā Forštate as
“Forštate”. Historically, Vecā Forštate is one of the oldest districts of Daugavpils, and the
19th century ancient wooden architecture has been partially preserved here. There are
significant numbers of Old Believers and pensioners among the locals, and very few young
people. Almost all buildings are private homes, and gardening is a popular occupation. The
local school was recently closed, yet the “Cultural Centre” is still functioning.
Jaunbūve began to develop in the second half of the 19th century thanks to the development
of the nearby railroad. Many and varied economic, social and spiritual activities are
concentrated there. A symbol of multiculturalism and mutual respect between different
groups of the local society is the “Church hill” where four churches of different
denominations stand right next to each other. Jaunbūve district is one of the largest districts
in Daugavpils, thus only a part of it was selected for the MYPLACE survey – the one
bordering Jaunā Forštate. The total population of the merged Forštate/Jaunbūve area was
28,680 inhabitants (Daugavpils municipality, 2011).
Portugal
In Portugal, the WP4 survey was conducted in Telheiras and Barreiro. The first site consists
of a recently built neighbourhood located in the north of Lisbon. Telheiras is clearly a
“middle class” neighbourhood, with professional population, with corresponding lifestyle
and consumption patterns. Despite being recently established, this neighbourhood has a
MYPLACE August 2014
MYPLACE: FP7-266831 www.fp7-myplace.eu Deliverable 4.6 Europe wide thematic report Page 25 of 431
relatively vibrant community life, stimulated by local institutions and associations. Electoral
behaviour is quite similar to the national average.
The second location, Barreiro, is a small city located on the south shore of the river Tagus
that has been undergoing a period of economic decline during the last few decades.
Barreiro was the location of a large industrial conglomerate, CUF – with 10,000 workers
living in factory villages in the 1960s (Almeida, 1993: 16). Barreiro was also the headquarters
of the Portuguese Railways maintenance workshops, and was called “Portuguese Barcelona”
during the dictatorship (ibid: 17). Barreiro’s population is positioned more towards the left
wing of the Portuguese political spectrum than that of Telheiras.
Due to sampling constraints, the two locations had to be enlarged, while maintaining
basically the same contrasting characteristics. The Telheiras location was enlarged to include
Lumiar, the civil parish where it is integrated, which is inhabited by 41,163 residents
(National Population Census 2011). Its population is relatively young (26% below the age of
25 years old, with 11% of these people aged between 15 and 24 years old. Barreiro, was
initially comprised of two civil parishes and then was enlarged to four (Barreiro, Lavradio,
Alto do Seixalinho e Verderena). These four parishes contain 52,157 inhabitants. Population
of this location is slightly older, with 22% being under the age of 25 years old and 9% (4,767
people) of its residents aged between 15 and 24 years old. The educational profiles of the
two populations are strikingly different: in Telheiras and Lumiar, 42% (17,218) have a
tertiary degree in contrast to Barreiro, where only 11% (5,567) have such qualification.
Portugal’s average is 17%.
Russia
In Russia, the WP4 survey was conducted in: 1) Kupchino – one of six municipal districts
included in the Frunzensky administrative district of St. Petersburg, and 2) Vyborg – a
municipal district which is located in the Leningrad oblast. The first is located within a city of
St. Petersburg, which is the centre of the north-western region of Russia, and the second
most important city in the country after Moscow, and the second is a smaller town in the
region bordering Finland.
Both sites are interesting historically, although they have different historical backgrounds
and represent different relationships to history – importance in Kupchino, ambivalence in
Vyborg. In both cases, migration issues and interethnic tension are important issues.
Kupchino is the unofficial name for the main area falling within the Frunzensky
administrative district of St. Petersburg. It is a typical suburb (“sleeping district”) with huge
Soviet housing blocks constructed in the 1960s-80s. The selected area – the municipal
MYPLACE August 2014
MYPLACE: FP7-266831 www.fp7-myplace.eu Deliverable 4.6 Europe wide thematic report Page 26 of 431
district with the name “Kupchino” (#73) is inhabited by 54,500 people, with 6,300 young
people among them. It is located in the centre of Kupchino. It experiences significant
problems with public transportation – the Kupchino district has only two underground
stations on the edges of its territory for 400,000 people living in the Frunzensky district. It is
physically separated from the rest of the city by two railways in the east and the west, as
well as an industrial “grey zone” in the north, separating the district from the city centre.
While Kupchino may not be objectively the most socially deprived district of St. Petersburg,
it suffers relatively significant deprivation because of the isolation caused by transportation
problems and the urban mythology surrounding the district (it is perceived as criminal and
marginalized). The neighbourhood is ethnically mixed and experiences a significant impact
due to immigration from the southern ex-Soviet republics who tend to concentrate here
because of relatively low apartment prices.
The second location is the town of Vyborg in the Leningrad oblast, which is a municipality
with 80,700 inhabitants (number of young people – 11 400). Vyborg is interesting because
of its specific history and heritage, on the one hand, and its economic and political situation,
on the other. The town became part of the Soviet Union in 1944. This medieval town and its
castle were built by the Swedes; it subsequently became the second largest town in Finland.
After 1944, the Finns were expelled and their homes occupied by new inhabitants. Today,
history is a complex issue here – the locals appear alienated from the medieval history of
the town, although a number of historical reconstruction clubs actively try to engage young
people in Vyborg.
Slovakia
In Slovakia, the WP4 survey was conducted in the town of Trnava and a district of Rimavská
Sobota. This selection of these locations was based on the assumption that the most
important factors for the growth of political extremism and radicalism are social and
economic deprivations of the regions and communities on the one hand, and the possibility
of potential ethnic conflicts on the other hand. The selected locations differ significantly in
these regards.
Trnava has a homogenous ethnic structure and a relatively low level of social and economic
deprivation. The location ranks among “strongly developing” areas with regard to its
economic situation. Factors conditioning this include its proximity to the capital and the PSA
Peugeot automobile factory. Several universities are located here, therefore, the
concentration of youth population is high.
On the other hand, the selected district of Rimavská Sobota is characterized by high ethnic
heterogeneity as well as by above-the-average level of social and economic deprivation.
MYPLACE August 2014
MYPLACE: FP7-266831 www.fp7-myplace.eu Deliverable 4.6 Europe wide thematic report Page 27 of 431
Several ethnic groups meet in this location – Slovaks, Hungarians, and Romany. The area
ranks among the poorest locations in the country (high unemployment and poverty rates,
social issues). Problems have accumulated there for several decades, and are mainly caused
by lack of economic opportunities.
Spain
In Spain, the WP4 survey was conducted in two locations in the autonomous community of
Catalonia: Vic and Sant Cugat. These locations have been selected based on the following
criteria:
(1) Presence and electoral success of Plataforma x Catalunya (a relatively new,
populist, right-wing and xenophobic political party. Its electoral support, for now,
is based in Catalonia);
(2) Socioeconomic deprivation and the impact of the current economic crisis;
(3) High immigration rates and the history of previous ethnic conflicts; and
(4) Presence of “The Indignant” (or 15-M) movement through local assemblies and
commissions.
Local 15-M (“The Indignant”) movement exists in both locations. The city councils have
developed active youth policies, and the main party is CiU (the center-right Catalan
nationalist political party, now governing Catalonia as well).
Vic has a population of about 40,000. In 2010, 25% of the inhabitants of Vic were
immigrants, compared to Catalonia’s overall 16%. A significant proportion of immigrants are
from Morocco and Sub-Saharan Africa. According to the labour union UGT, the foreign-born
citizens of Vic suffered a 43% unemployment rate, as compared to the average rate of
17.8% for Catalonia. Vic is the seat of a small university (Universitat de Vic) and has a
dynamic civil society.
Vic is governed by a coalition of CiU (its electoral support is 32%) and ERC (a center-left
secessionist party with 20% of the votes). Two more political parties are active in Vic and
demonstrate the radicalization in politics on both ends of the left-right spectrum: PxC and
the CUP. Each of these political parties has different party manifestos, action strategies and
discourses about immigrants. On the one hand, Plataforma per Catalunya (PxC) is a populist
right-wing party generally considered by academics, the mass media and public opinion as
extremist and xenophobic. PxC holds a firm stance on the control of immigration. Its leader,
Josep Anglada, was born in Vic, and the party has 5 seats in the town council of Vic, which is
the largest representation the party has in any local government.
At the opposite extreme, the Candidatura d'Unitat Popular (CUP), a leftist secessionist party
that promotes a more participatory democracy, has two representatives in the town
MYPLACE August 2014
MYPLACE: FP7-266831 www.fp7-myplace.eu Deliverable 4.6 Europe wide thematic report Page 28 of 431
council. Young people are over-represented in the CUP, enjoying a horizontal organisational
structure. CUP is not famous for anti-immigration discourse, but the very fact that it defends
self-determination of Catalonia might represent a basis to consider it as not being
sufficiently inclusive, and ignoring certain sectors of the population. In sum, Vic has a
greater propensity to be radicalized than other places in Catalonia.
Sant Cugat is an extremely affluent town to the north of Barcelona, with a high level of
investment from high-tech companies. Its central district, the most densely populated, has a
population of 56,000. Sant Cugat has a registered population of immigrants of only 14%, half
of which are Latinos, which is not characteristic for Catalonia. For linguistic and cultural
reasons, immigrants from Latin America integrate more easily than foreigners from other
countries outside Europe. In other words, there are no a priori reasons to suspect a high
propensity for radicalization in Sant Cugat. In the last regional elections, the electoral
support for PxC was only 0.58% (5.82% in Vic).The center-right Catalan nationalist party CiU
governs Sant Cugat with a majority in the town council.
UK
The two locations for the WP4 survey in the UK were Coventry and Nuneaton. These
locations are geographically close to one another, only 13 km apart, in a wider area
commonly known as The West Midlands.
In Coventry, parts of Foleshill and St. Michaels wards were surveyed. These areas extend
north-east from the city centre. This location represents an inner city with high density
housing and a variety of housing types. The majority of the dwellings consists of Victorian
terraced homes with a number of high rise flats. Foleshill and St. Michaels have large
student populations (who attend either Coventry University, part of which is within the
research location, or Warwick University) and a number of residence halls. These were
excluded from the sample. Both wards are ethnically mixed and are characterized by low
levels of radical political activity.
This location consists of 13 Lower Super Output Areas (LSOA), which are the smallest
administrative units geographically available. The total population for these areas was
25,451 (Census 2011), with 14,404 aged 15-24 years old. There were 9,092 households
within the research location.
The wards of Arbury, Camp Hill, Kingswood, Abbey, and part of Wem Brook were selected
for fieldwork in Nuneaton. These wards cover approximately half of Nuneaton in the north
and west of the town. This location is a Market Town, with mixed housing and is
predominately white British.
MYPLACE August 2014
MYPLACE: FP7-266831 www.fp7-myplace.eu Deliverable 4.6 Europe wide thematic report Page 29 of 431
The research location consists of 26 Lower Super Output Areas (LSOA). The total population
for these areas was 40,612 (Census 2011), with 7,064 aged 15-24 years old. There were
17,360 households within the research location. In a number of selected wards there has
already been significant radical right wing activity including the election of local councillors
for the Nuneaton and Bedworth Councils. Levels of deprivation varied across the research
location, with a number of LSOAs within the 10% most deprived and least deprived
nationally.
3.3 Ethics
While collecting data for the work packages 4 and 5, all partners were required to follow the
confidentiality procedures in line with laws on data protection.
Partners provided background information by distributing/sending information
letters/leaflets/brochures to the potential respondents prior to visiting their homes. This
way respondents could get information about the MYPLACE project in advance of fieldwork.
These letters often enclosed a telephone number, allowing time and opportunity for
potential respondents to seek further information, to ask additional questions or to refuse
an interview.
Before the interviews, all survey respondents were informed how the collected data will be
processes, stored and used and how their identity will be protected. Furthermore, they
were informed that they can withdraw from participating at any time or refuse to answer
any question they do not want to answer. It was made clear to all respondents that
participation in the survey was voluntary.
All respondents provided informed ‘verbal’ consent, after the researchers provided full
information about the project and made sure that the respondents understand that the
data they provide will be kept confidential and the names and addresses will be separated
from substantive data in both its computer and paper records. In addition, In order to
ensure data confidentiality, all field researchers/interviewers signed a confidentiality
statement. With their signature, each interviewer confirmed the protection of anonymity of
collected information.
Furthermore, each partner selected 60 respondents from the WP4 survey in order to
conduct further semi-structured interviews for WP5. As part of the survey, the interviewers
collected information on young people agreeing or refusing to take part in the follow-up
qualitative interview, by filling in specifically prepared contact forms. Nevertheless, it has
been ensured that identification of a specific individual in a dataset is not possible, as all
personal information has been removed from the dataset and each respondent was
MYPLACE August 2014
MYPLACE: FP7-266831 www.fp7-myplace.eu Deliverable 4.6 Europe wide thematic report Page 30 of 431
assigned a unique ID code. The sample of the respondents for the qualitative semi-
structured interviews was drawn from a list of those respondents who accepted to
participate and the qualitative interviews were carried out by other team of researchers.
Finally, some partners used incentives to encourage the survey participants to further
participate in the semi-structured interviews.
3.4 Sampling
Three basic sampling plans were developed for the partners, and each partner used the plan
best suited for their situation. In survey locations where reliable lists of individuals aged 16-
25 years old and their contact information were available, samples were drawn from these
lists (Sampling Plan 1). In survey locations where such lists were not available, but reliable
lists of households were accessible (for example, from post code address files, or electrical
grids), samples of households were drawn. When contact was made with a household
containing more than one member of the target age group, the respondent was selected
using the last (or next, in case of Latvia) birthday method (Sampling Plan 2). In survey
locations where neither reliable lists of individuals nor reliable lists of households were
available, households were selected using random route sampling, and individual household
members were selected using the last (or next, in case of Latvia) birthday method (Sampling
Plan 3).
Sampling from lists of individuals and Sampling from lists of households: The lists of
individuals, as well as the lists of households and the information contained in each varied
between countries. Most of the areas selected for the survey consisted of multiple smaller
units, such as administrative districts or voting precincts; some even consisted of multiple
small settlements. Where the lists of individuals included the subunit of residence, the
overall target sample size was allocated among subunits proportional to population size,
and samples were drawn separately from each unit. For those lists that did not contain
information about geographic subunits, a simple random sample of individuals or
households was made.
There was a wide variance in expected response rates across the survey locations; thus,
some partners have tried to minimize non-response by sending letters informing the target
respondent or his/her household about the survey prior to attempted contact; advertising
the survey in the local media; or offering small incentives.
In instances of sampling from lists of households, the households where no member of the
target population was present and, consequently, where no interviews could have been
conducted, were declared as ineligible households.
MYPLACE August 2014
MYPLACE: FP7-266831 www.fp7-myplace.eu Deliverable 4.6 Europe wide thematic report Page 31 of 431
Random route sampling of households: In cases where no lists of individuals or households
were available, households were selected using random route sampling, a method of
systematic sampling which approximates a simple random sample. Starting points of the
interviewers’ routes were determined. From these starting points, a prescribed walking
pattern was followed, with a given step size and starting household number. For example, if
the starting household number was three, and the step size was five, then the interview
started the route in the 3rd household on his/her route, and then every 5th household on
his/her route was targeted for interview.
Random walk methodology developed by CRRC-Georgia (and presented in D4.2 report) was
provided to all partners that were using Sampling Plan 3, but the walking patterns varied
between the survey locations, because some partners and/or their sub-contractors
conducted fieldwork applying their own protocols. In all such cases, the proposed random
walk protocols were reviewed by the work package coordinators, and, if necessary were
modified for the MYPLACE survey.
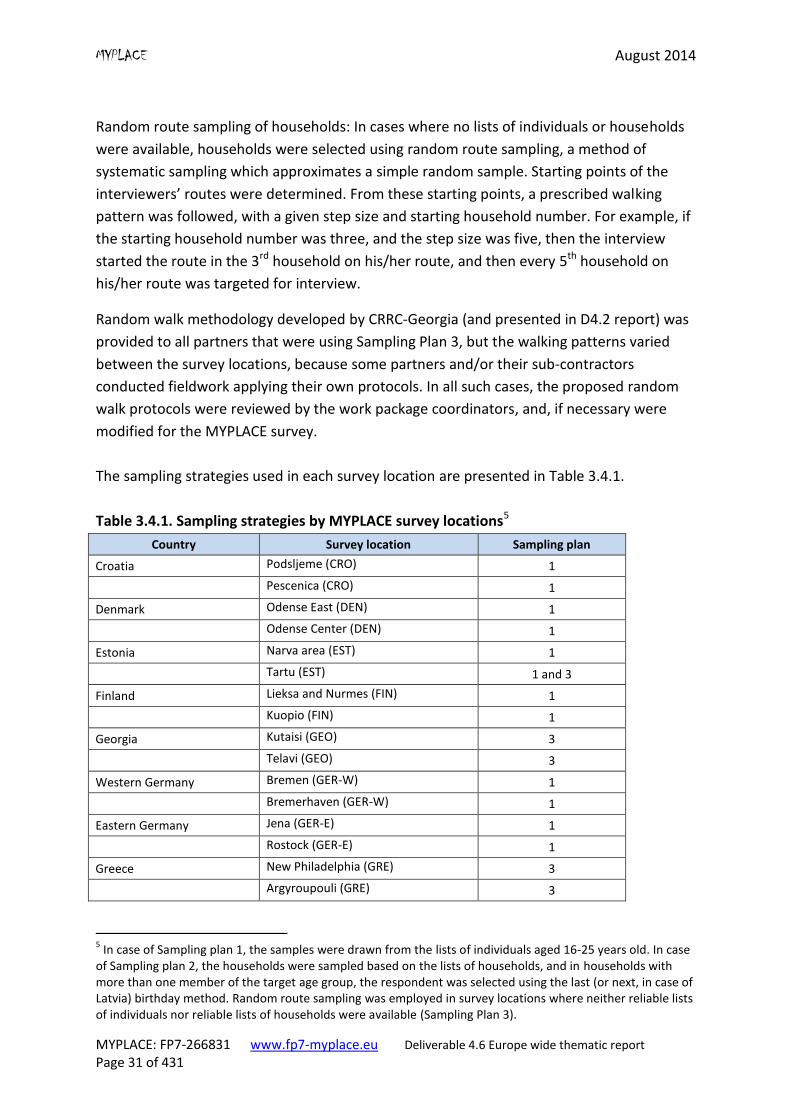
The sampling strategies used in each survey location are presented in Table 3.4.1.
Table 3.4.1. Sampling strategies by MYPLACE survey locations5
Country Survey location Sampling plan
Croatia Podsljeme (CRO) 1
Pescenica (CRO) 1
Denmark Odense East (DEN) 1
Odense Center (DEN) 1
Estonia Narva area (EST) 1
Tartu (EST) 1 and 3
Finland Lieksa and Nurmes (FIN) 1
Kuopio (FIN) 1
Georgia Kutaisi (GEO) 3
Telavi (GEO) 3
Western Germany Bremen (GER-W) 1
Bremerhaven (GER-W) 1
Eastern Germany Jena (GER-E) 1
Rostock (GER-E) 1
Greece New Philadelphia (GRE) 3
Argyroupouli (GRE) 3
5 In case of Sampling plan 1, the samples were drawn from the lists of individuals aged 16-25 years old. In case
of Sampling plan 2, the households were sampled based on the lists of households, and in households with more than one member of the target age group, the respondent was selected using the last (or next, in case of Latvia) birthday method. Random route sampling was employed in survey locations where neither reliable lists of individuals nor reliable lists of households were available (Sampling Plan 3).
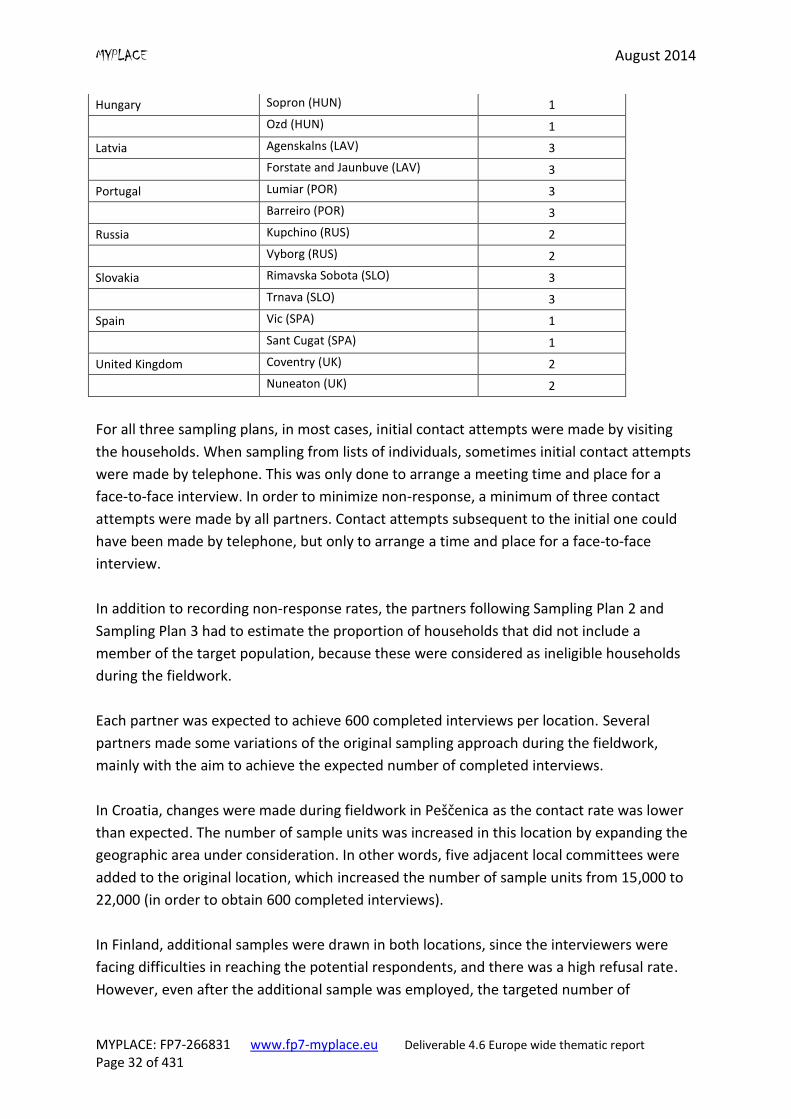
MYPLACE August 2014
MYPLACE: FP7-266831 www.fp7-myplace.eu Deliverable 4.6 Europe wide thematic report Page 32 of 431
Hungary Sopron (HUN) 1
Ozd (HUN) 1
Latvia Agenskalns (LAV) 3
Forstate and Jaunbuve (LAV) 3
Portugal Lumiar (POR) 3
Barreiro (POR) 3
Russia Kupchino (RUS) 2
Vyborg (RUS) 2
Slovakia Rimavska Sobota (SLO) 3
Trnava (SLO) 3
Spain Vic (SPA) 1
Sant Cugat (SPA) 1
United Kingdom Coventry (UK) 2
Nuneaton (UK) 2
For all three sampling plans, in most cases, initial contact attempts were made by visiting
the households. When sampling from lists of individuals, sometimes initial contact attempts
were made by telephone. This was only done to arrange a meeting time and place for a
face-to-face interview. In order to minimize non-response, a minimum of three contact
attempts were made by all partners. Contact attempts subsequent to the initial one could
have been made by telephone, but only to arrange a time and place for a face-to-face
interview.
In addition to recording non-response rates, the partners following Sampling Plan 2 and
Sampling Plan 3 had to estimate the proportion of households that did not include a
member of the target population, because these were considered as ineligible households
during the fieldwork.
Each partner was expected to achieve 600 completed interviews per location. Several
partners made some variations of the original sampling approach during the fieldwork,
mainly with the aim to achieve the expected number of completed interviews.
In Croatia, changes were made during fieldwork in Peščenica as the contact rate was lower
than expected. The number of sample units was increased in this location by expanding the
geographic area under consideration. In other words, five adjacent local committees were
added to the original location, which increased the number of sample units from 15,000 to
22,000 (in order to obtain 600 completed interviews).
In Finland, additional samples were drawn in both locations, since the interviewers were
facing difficulties in reaching the potential respondents, and there was a high refusal rate.
However, even after the additional sample was employed, the targeted number of
MYPLACE August 2014
MYPLACE: FP7-266831 www.fp7-myplace.eu Deliverable 4.6 Europe wide thematic report Page 33 of 431
interviews was not achieved, and finally the whole population of the target age group was
included in the sampling frame.
Some partners had to expand the areas of the selected locations because of low response
rates. For example, in Bremenhaven in western Germany, additional districts had to be
selected during the fieldwork in order to conduct more interviews. In Portugal, which used
the random walk sampling strategy, an extremely high rate of household ineligibility was
documented (no household members of the targeted age), as well as high refusal rates.
Both issues led to the decision to expand the initial borders of the field sites. In other cases,
partners had to reduce the original step size. The Greek team, which also used the random
walk sampling strategy, had to change the original sampling methodology by reducing the
step size, and interviewed all eligible persons in a household instead of only one member
per household.
In Latvia, every residential address in the selected locations was included in the sampling
frame. That is, interviewers searched for a young person of the targeted age in every
household in the areas of Āgenskalna apkaime in Riga and Forštate and Jaunbūve district in
Daugavpils. Accordingly, the survey covers all households in these areas, without exception.
In instances where there was more than one person aged 16-25 in the household, the
selection of the respondent was based on the nearest birthday method.
Two different sampling plans were used in Estonia. In Narva, Sillamäe and Kohtla-Järve,
random sampling based on the national population register was used. In Tartu, random
sampling was used at the beginning of the fieldwork. After 262 interviews were conducted
based on this sampling approach, the survey team switched to random route sampling and
the rest of the respondents were located using the latter method. To ensure 600 interviews,
parishes near Tartu were also included in the sampling frame.
Table 3.4.2 summarizes information about MYPLACE survey fieldwork in all locations.
Table 3.4.2. MYPLACE survey fieldwork
Country Survey locations N of
interviews Fieldwork dates
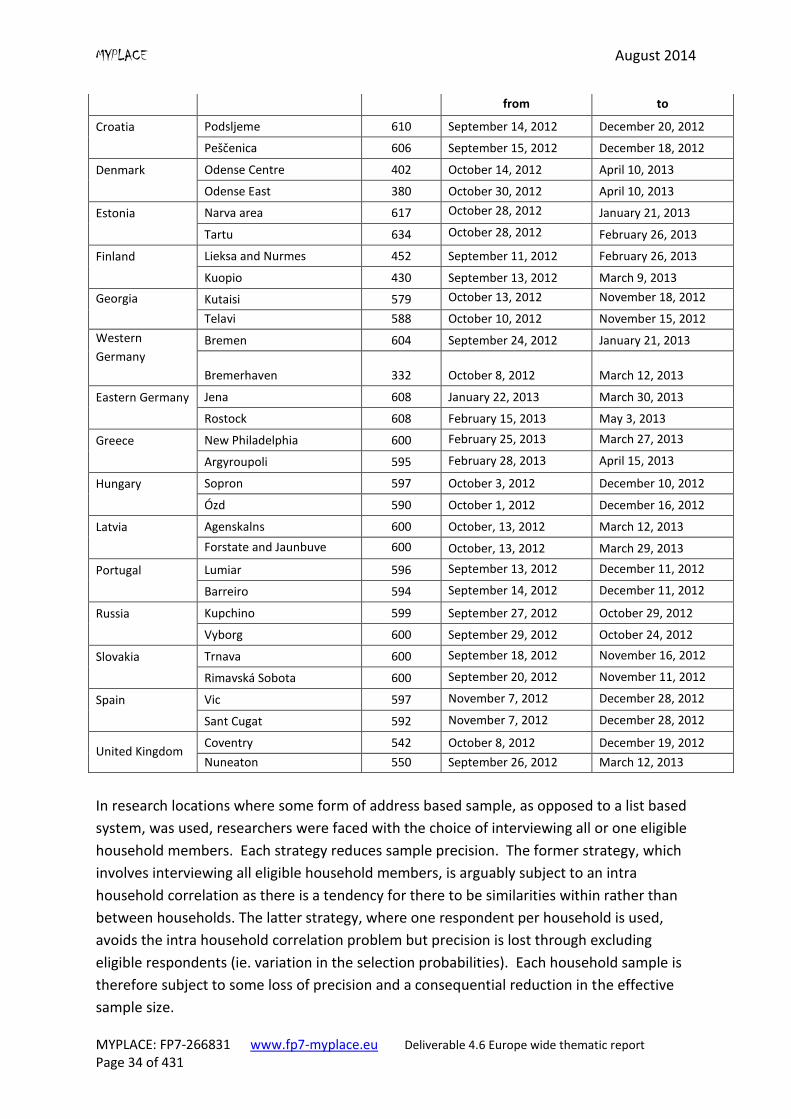
MYPLACE August 2014
MYPLACE: FP7-266831 www.fp7-myplace.eu Deliverable 4.6 Europe wide thematic report Page 34 of 431
from to
Croatia
Podsljeme 610 September 14, 2012 December 20, 2012
Peščenica 606 September 15, 2012 December 18, 2012
Denmark
Odense Centre 402 October 14, 2012 April 10, 2013
Odense East 380 October 30, 2012 April 10, 2013
Estonia
Narva area 617 October 28, 2012 January 21, 2013
Tartu 634 October 28, 2012 February 26, 2013
Finland
Lieksa and Nurmes 452 September 11, 2012 February 26, 2013
Kuopio 430 September 13, 2012 March 9, 2013
Georgia
Kutaisi 579 October 13, 2012 November 18, 2012
Telavi 588 October 10, 2012 November 15, 2012
Western
Germany
Bremen 604 September 24, 2012 January 21, 2013
Bremerhaven 332 October 8, 2012 March 12, 2013
Eastern Germany
Jena 608 January 22, 2013 March 30, 2013
Rostock 608 February 15, 2013 May 3, 2013
Greece
New Philadelphia 600 February 25, 2013 March 27, 2013
Argyroupoli 595 February 28, 2013 April 15, 2013
Hungary
Sopron 597 October 3, 2012 December 10, 2012
Ózd 590 October 1, 2012 December 16, 2012
Latvia
Agenskalns 600 October, 13, 2012 March 12, 2013
Forstate and Jaunbuve 600 October, 13, 2012 March 29, 2013
Portugal
Lumiar 596 September 13, 2012 December 11, 2012
Barreiro 594 September 14, 2012 December 11, 2012
Russia
Kupchino 599 September 27, 2012 October 29, 2012
Vyborg 600 September 29, 2012 October 24, 2012
Slovakia
Trnava 600 September 18, 2012 November 16, 2012
Rimavská Sobota 600 September 20, 2012 November 11, 2012
Spain
Vic 597 November 7, 2012 December 28, 2012
Sant Cugat 592 November 7, 2012 December 28, 2012
United Kingdom Coventry 542 October 8, 2012 December 19, 2012
Nuneaton 550 September 26, 2012 March 12, 2013
In research locations where some form of address based sample, as opposed to a list based
system, was used, researchers were faced with the choice of interviewing all or one eligible
household members. Each strategy reduces sample precision. The former strategy, which
involves interviewing all eligible household members, is arguably subject to an intra
household correlation as there is a tendency for there to be similarities within rather than
between households. The latter strategy, where one respondent per household is used,
avoids the intra household correlation problem but precision is lost through excluding
eligible respondents (ie. variation in the selection probabilities). Each household sample is
therefore subject to some loss of precision and a consequential reduction in the effective
sample size.
MYPLACE August 2014
MYPLACE: FP7-266831 www.fp7-myplace.eu Deliverable 4.6 Europe wide thematic report Page 35 of 431
3.5 Weighting
Most partners decided not to apply any weighting to their data, either because of the lack of
reliable local demographic data, or due to full coverage of the households in the survey
locations. The Croatian, Greek, Russian and Georgian teams could not obtain reliable
statistical data, and hence, chose not to apply any weighting to their data. The eastern
German team considered data weighting with regard to educational status and age,
however, due to the lack of adequate reference statistics weighting was not applied. The
western German team intended to compare the social distribution of Bremen and
Bremerhaven datasets to the 2011 census conducted in the selected wards. In case of big
variations from the census, they would have calculated weights to adjust representation of
specific demographic groups. However, since the Statistical Office of Bremen was not able
to deliver the necessary data for comparison, partners from western Germany conducted
data analysis without weighting.
Partners from Denmark also chose not to weight their data. They estimated that the
distribution of male and female respondents was fairly representative. However, there was
an issue of over-representation of well-educated young people, and under-representation
of young people with no education, and of young people representing ethnic and religious
minorities. Because no accurate information was available about the level of education by
age groups, and about the different ethnic groups, it was not possible to weight the data.
In Latvia, demographic data were only available at the city level, so there was no reliable
information available on the demographic characteristics of youth in the selected areas of
the cities. Taking into consideration the applied sampling strategy, the only design effect in
the case of the sample arose from the clustering of respondents within households, which
resulted in differing selection probabilities (i.e., young people living in households where
there was more than one young person aged 16-25 had a lower probability to be
interviewed). Although these probabilities could have been calculated, and adjusted for by
applying weights, unfortunately, no data on the composition of the households were
collected during the survey; therefore, the data were not weighted. Comparison of the
sample characteristics with demographic data provided by the Central Statistical Bureau of
Latvia on Riga and Daugavpils allowed for the conclusion that the age and gender
composition of the samples was similar to that observed in the respective cities. Thus, the
fact that no weights were applied in the WP4 data in Latvia should not compromise
representativeness of the results, or cause a notable bias in the distribution of answers.
MYPLACE August 2014
MYPLACE: FP7-266831 www.fp7-myplace.eu Deliverable 4.6 Europe wide thematic report Page 36 of 431
In Spain, weighting was not needed because socio-demographic characteristics of the
sample were quite similar to the entire 16 to 25 year old population in both locations.
Similarly, in the UK, an analysis was performed to make an informed decision about whether
weighting was appropriate for the UK set. Data from the 2011 census (at LSOA) were used
to compare both gender and ethnic distributions with the sample characteristics. Because
distributions were similar, it was decided that no demographic weighting of the data would
be undertaken.
Estonia, Slovakia and Hungary also have not weighted their datasets. Only two partners –
Finland and Portugal – weighted their data sets.
In Finland, the achieved sample was biased in regard to the gender and age of the
respondents. The gender bias was so moderate that it was not used as a basis for weighting;
this bias was also in line with most social science surveys, and attributed to the greater
reluctance of men to participate. The data were weighted to adjust the age distribution of
the respondents, since the youngest subgroup (16-17 year olds) was significantly
overrepresented in both Kuopio and Pielinen Karelia samples (see Table 3.3).
Finally, in Portugal the samples in both survey locations were somewhat skewed in terms of
age and gender. Both factors led to a significant risk of erroneous and misleading
interpretations of the data. Lumiar’s sample was composed of individuals much older than
expected and with a large gender imbalance (more women than men). In contrast, the
Barreiro sample was much younger than expected and also unbalanced in respect to gender
(more men than women). The execution of a one-sample Chi-square adherence test
(p<.0001) for each location. Led to the conclusion that the survey sample had significant
deviations and did not represent the target population.
To solve this problem, three different weights were created, one weight for the entire
sample and two – for each location.
3.6 Data processing and cleaning
Data entry
Some partners used PAPI during the fieldwork, and entered the data after fieldwork.
Students experienced in data entry were employed by the Croatian team and their
collaborator, the Institute of Social Sciences Ivo Pilar. In Finland, an initial quality check of
the completed questionnaires was performed during the data entry process. In some cases,
self-administered questionnaires were of poor quality (e.g. respondents had given a lot of
“don’t know” answers or had selected code “3” in every box in the questionnaire). The
poorest questionnaires were disqualified.
MYPLACE August 2014
MYPLACE: FP7-266831 www.fp7-myplace.eu Deliverable 4.6 Europe wide thematic report Page 37 of 431
CRRC-Georgia used CSPro software for data entry. In order to ensure the highest quality of the data, CRRC employed double blind data entry. After the comparison of the two data files, the CSPro data file was transferred into SPSS. The Greek team used CONVERSO software for data entry. In the case of CAPI interviews, the data entry stage was skipped. In the UK data, for example, in the majority of cases, data were captured using the CAPI MS Access Database. Data files were transferred by the fieldworker on a daily basis via a data upload to dropbox. The supervisor then checked for completeness of the files, and the national coordinator transferred the questionnaires to a master file, which was used for monitoring purposes. In the few cases (50) that the data were captured via a paper questionnaire, forms were collected and sent to MMU for data entry directly into the master CAPI file by an administrator. These were then randomly checked to ensure data quality.
Data cleaning
In cases of both PAPI and CAPI, data cleaning was performed by the partners. Data cleaning
protocol and a corresponding syntax file were developed by the MMU team which provided
guidance on how to deal with missing cases/answers, ensure logical consistency of each
respondent’s answers, etc. Incomplete questionnaires with a high number of missing
answers were to be deleted from the datasets according to the MMU protocol, along with
the questionnaires completed by respondents who were either younger than 16 years old or
older than 25 years old. The data cleaning process performed by the partners followed the
common procedure outlined in this protocol.
Two rounds of data cleaning were performed by the western German team. During the first
round, the datasets were checked for interviewer errors. Code “99” was used for missing
values. The same procedures (checking typing errors, ensuring uniformity and correct
labelling) were applied for interviewer questionnaires and contact sheets. Each respondent
was assigned a unique ID number. Afterwards, the Bremen MYPLACE team checked datasets
for consistency, defined missing values and ensured correct labelling. Following MMU
requirements, different codes and labels were used for different types of missing values.
Overall, the data cleaning process was not as necessary for CAPI fieldwork, since the data
entry software was originally designed around the questionnaire and contained validation,
hence, data cleaning was, to a large extent, integrated in the data collection process.
3.7. Data analysis
MYPLACE August 2014
MYPLACE: FP7-266831 www.fp7-myplace.eu Deliverable 4.6 Europe wide thematic report Page 38 of 431
The first stage of data analysis consisted of national level analysis following the data analysis
template developed by MMU, in order to ensure similar analytic approaches. Frequency
distributions of all answers were checked, and a number of scales and indices were
constructed from multi-item response questions. For univariate analysis, the partners have
computed percentage, mean, median, and/or standard deviation for the variables under
analysis. For bivariate analysis, assumptions for parametric tests were checked. If
assumptions were fulfilled, Pearson Correlation, T-test and ANOVA were used. When the
assumptions were not fulfilled, non-parametric tests of Mann-Whitney, and Kruskal-Wallis
tests were used. For the analysis of two categorical variables, a Chi-square test was used
followed by Cramer's V/Phi (for nominal level variables) and Gamma (for ordinal level
variables).
The results of national level analyses are presented in Deliverable 4.5: A series of country
specific analysis which highlight local historical and cultural factors and which contrast the
two regions sampled.6
Cross-country analysis focused on the major themes studied by the MYPLACE project. It was
the second stage of WP4 data analysis, and is presented in the current Deliverable 4.6
report. Exploratory factor analysis was used to examine factor structure of the scale
measuring a construct. Cronbach Alpha was then used to test the reliability of scales or sub-
scales. Cronbach Alpha value of 0.60 was considered as the minimum value required for a
reliable scale in the analysis. A guidance document detailing this process can be found in
Appendix A: Guidance Document (preparing combined data for the thematic report)
Cross-country analysis of the following main substantial topics was performed at this stage:
Interest in politics;
Attitudes and trust towards social and political institutions;
Respondents’ political activism and civic engagement;
Opinions about effective political action;
Citizenship;
Social networks, gender and sexuality;
Religion;
Attitudes towards minority groups;
Democracy;
History and memory;
European issues.
6 http://www.fp7-myplace.eu/documents/WP4D4-5overviewreportv1.pdf.
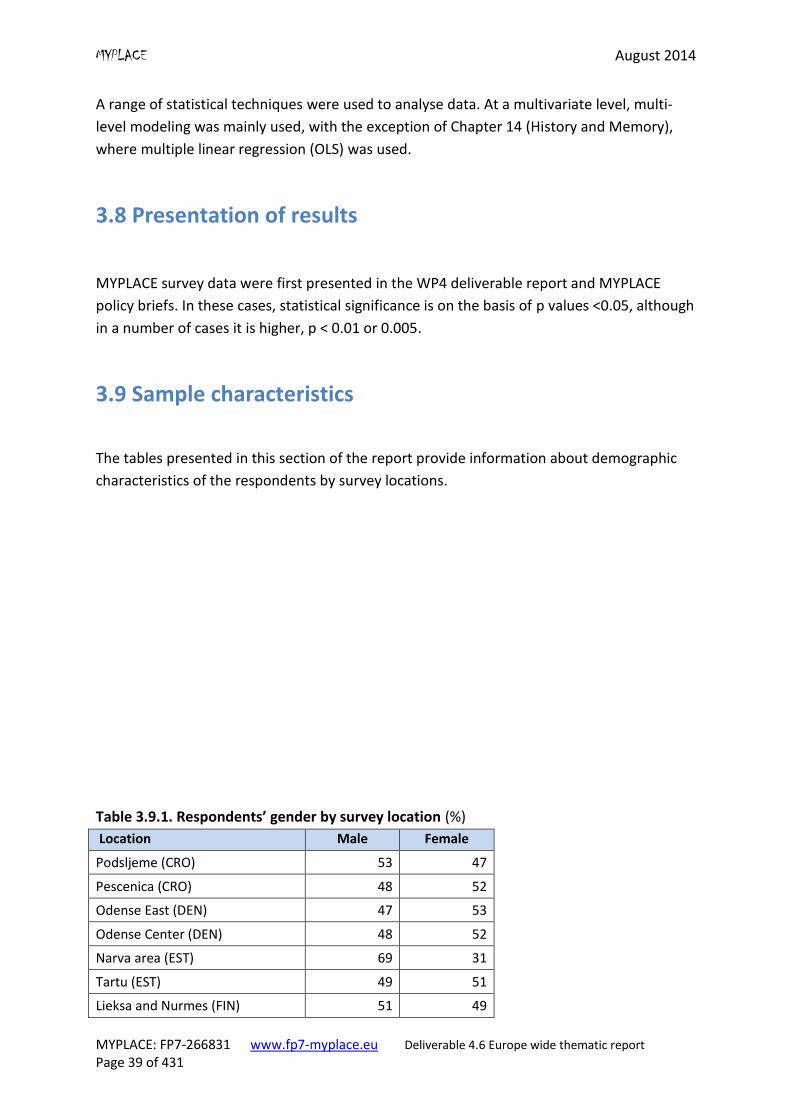
MYPLACE August 2014
MYPLACE: FP7-266831 www.fp7-myplace.eu Deliverable 4.6 Europe wide thematic report Page 39 of 431
A range of statistical techniques were used to analyse data. At a multivariate level, multi-
level modeling was mainly used, with the exception of Chapter 14 (History and Memory),
where multiple linear regression (OLS) was used.
3.8 Presentation of results
MYPLACE survey data were first presented in the WP4 deliverable report and MYPLACE
policy briefs. In these cases, statistical significance is on the basis of p values <0.05, although
in a number of cases it is higher, p < 0.01 or 0.005.
3.9 Sample characteristics
The tables presented in this section of the report provide information about demographic
characteristics of the respondents by survey locations.
Table 3.9.1. Respondents’ gender by survey location (%)
Location Male Female
Podsljeme (CRO) 53 47
Pescenica (CRO) 48 52
Odense East (DEN) 47 53
Odense Center (DEN) 48 52
Narva area (EST) 69 31
Tartu (EST) 49 51
Lieksa and Nurmes (FIN) 51 49
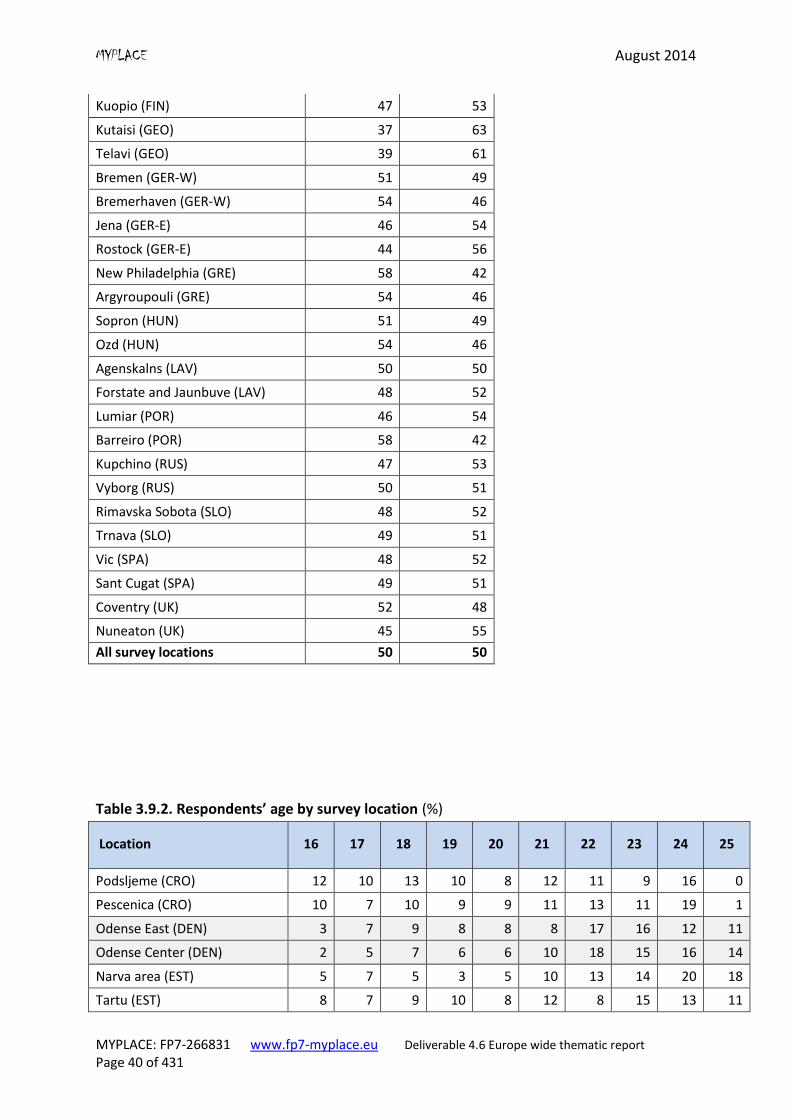
MYPLACE August 2014
MYPLACE: FP7-266831 www.fp7-myplace.eu Deliverable 4.6 Europe wide thematic report Page 40 of 431
Kuopio (FIN) 47 53
Kutaisi (GEO) 37 63
Telavi (GEO) 39 61
Bremen (GER-W) 51 49
Bremerhaven (GER-W) 54 46
Jena (GER-E) 46 54
Rostock (GER-E) 44 56
New Philadelphia (GRE) 58 42
Argyroupouli (GRE) 54 46
Sopron (HUN) 51 49
Ozd (HUN) 54 46
Agenskalns (LAV) 50 50
Forstate and Jaunbuve (LAV) 48 52
Lumiar (POR) 46 54
Barreiro (POR) 58 42
Kupchino (RUS) 47 53
Vyborg (RUS) 50 51
Rimavska Sobota (SLO) 48 52
Trnava (SLO) 49 51
Vic (SPA) 48 52
Sant Cugat (SPA) 49 51
Coventry (UK) 52 48
Nuneaton (UK) 45 55
All survey locations 50 50
Table 3.9.2. Respondents’ age by survey location (%)
Location 16 17 18 19 20 21 22 23 24 25
Podsljeme (CRO) 12 10 13 10 8 12 11 9 16 0
Pescenica (CRO) 10 7 10 9 9 11 13 11 19 1
Odense East (DEN) 3 7 9 8 8 8 17 16 12 11
Odense Center (DEN) 2 5 7 6 6 10 18 15 16 14
Narva area (EST) 5 7 5 3 5 10 13 14 20 18
Tartu (EST) 8 7 9 10 8 12 8 15 13 11
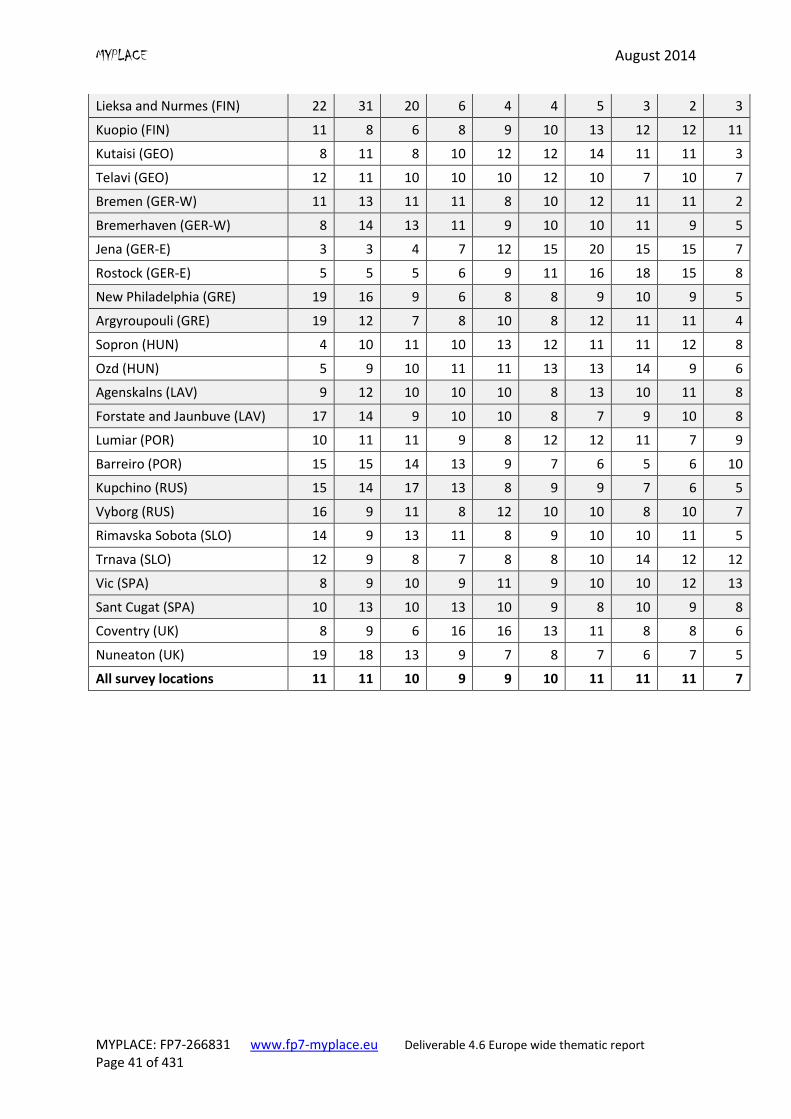
MYPLACE August 2014
MYPLACE: FP7-266831 www.fp7-myplace.eu Deliverable 4.6 Europe wide thematic report Page 41 of 431
Lieksa and Nurmes (FIN) 22 31 20 6 4 4 5 3 2 3
Kuopio (FIN) 11 8 6 8 9 10 13 12 12 11
Kutaisi (GEO) 8 11 8 10 12 12 14 11 11 3
Telavi (GEO) 12 11 10 10 10 12 10 7 10 7
Bremen (GER-W) 11 13 11 11 8 10 12 11 11 2
Bremerhaven (GER-W) 8 14 13 11 9 10 10 11 9 5
Jena (GER-E) 3 3 4 7 12 15 20 15 15 7
Rostock (GER-E) 5 5 5 6 9 11 16 18 15 8
New Philadelphia (GRE) 19 16 9 6 8 8 9 10 9 5
Argyroupouli (GRE) 19 12 7 8 10 8 12 11 11 4
Sopron (HUN) 4 10 11 10 13 12 11 11 12 8
Ozd (HUN) 5 9 10 11 11 13 13 14 9 6
Agenskalns (LAV) 9 12 10 10 10 8 13 10 11 8
Forstate and Jaunbuve (LAV) 17 14 9 10 10 8 7 9 10 8
Lumiar (POR) 10 11 11 9 8 12 12 11 7 9
Barreiro (POR) 15 15 14 13 9 7 6 5 6 10
Kupchino (RUS) 15 14 17 13 8 9 9 7 6 5
Vyborg (RUS) 16 9 11 8 12 10 10 8 10 7
Rimavska Sobota (SLO) 14 9 13 11 8 9 10 10 11 5
Trnava (SLO) 12 9 8 7 8 8 10 14 12 12
Vic (SPA) 8 9 10 9 11 9 10 10 12 13
Sant Cugat (SPA) 10 13 10 13 10 9 8 10 9 8
Coventry (UK) 8 9 6 16 16 13 11 8 8 6
Nuneaton (UK) 19 18 13 9 7 8 7 6 7 5
All survey locations 11 11 10 9 9 10 11 11 11 7
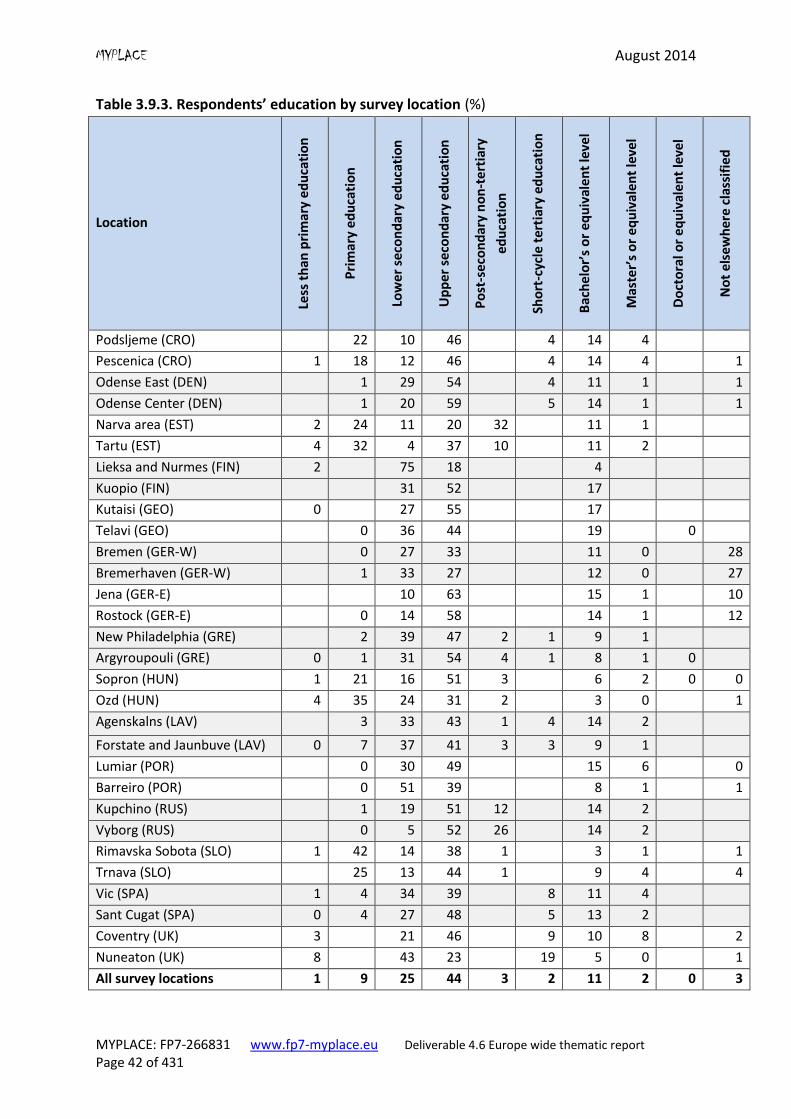
MYPLACE August 2014
MYPLACE: FP7-266831 www.fp7-myplace.eu Deliverable 4.6 Europe wide thematic report Page 42 of 431
Table 3.9.3. Respondents’ education by survey location (%)
Location
Less
th
an p
rim
ary
ed
uca
tio
n
Pri
mar
y e
du
cati
on
Low
er s
eco
nd
ary
ed
uca
tio
n
Up
per
sec
on
dar
y e
du
cati
on
Po
st-s
eco
nd
ary
no
n-t
ert
iary
edu
cati
on
Sho
rt-c
ycle
ter
tiar
y e
du
cati
on
Bac
hel
or’
s o
r eq
uiv
alen
t le
vel
Mas
ter’
s o
r e
qu
ival
ent
leve
l
Do
cto
ral o
r e
qu
ival
ent
leve
l
No
t el
sew
her
e cl
assi
fied
Podsljeme (CRO) 22 10 46 4 14 4
Pescenica (CRO) 1 18 12 46 4 14 4 1
Odense East (DEN) 1 29 54 4 11 1 1
Odense Center (DEN) 1 20 59 5 14 1 1
Narva area (EST) 2 24 11 20 32 11 1
Tartu (EST) 4 32 4 37 10 11 2
Lieksa and Nurmes (FIN) 2 75 18 4
Kuopio (FIN) 31 52 17
Kutaisi (GEO) 0 27 55 17
Telavi (GEO) 0 36 44 19 0
Bremen (GER-W) 0 27 33 11 0 28
Bremerhaven (GER-W) 1 33 27 12 0 27
Jena (GER-E) 10 63 15 1 10
Rostock (GER-E) 0 14 58 14 1 12
New Philadelphia (GRE) 2 39 47 2 1 9 1
Argyroupouli (GRE) 0 1 31 54 4 1 8 1 0
Sopron (HUN) 1 21 16 51 3 6 2 0 0
Ozd (HUN) 4 35 24 31 2 3 0 1
Agenskalns (LAV) 3 33 43 1 4 14 2
Forstate and Jaunbuve (LAV) 0 7 37 41 3 3 9 1
Lumiar (POR) 0 30 49 15 6 0
Barreiro (POR) 0 51 39 8 1 1
Kupchino (RUS) 1 19 51 12 14 2
Vyborg (RUS) 0 5 52 26 14 2
Rimavska Sobota (SLO) 1 42 14 38 1 3 1 1
Trnava (SLO) 25 13 44 1 9 4 4
Vic (SPA) 1 4 34 39 8 11 4
Sant Cugat (SPA) 0 4 27 48 5 13 2
Coventry (UK) 3 21 46 9 10 8 2
Nuneaton (UK) 8 43 23 19 5 0 1
All survey locations 1 9 25 44 3 2 11 2 0 3
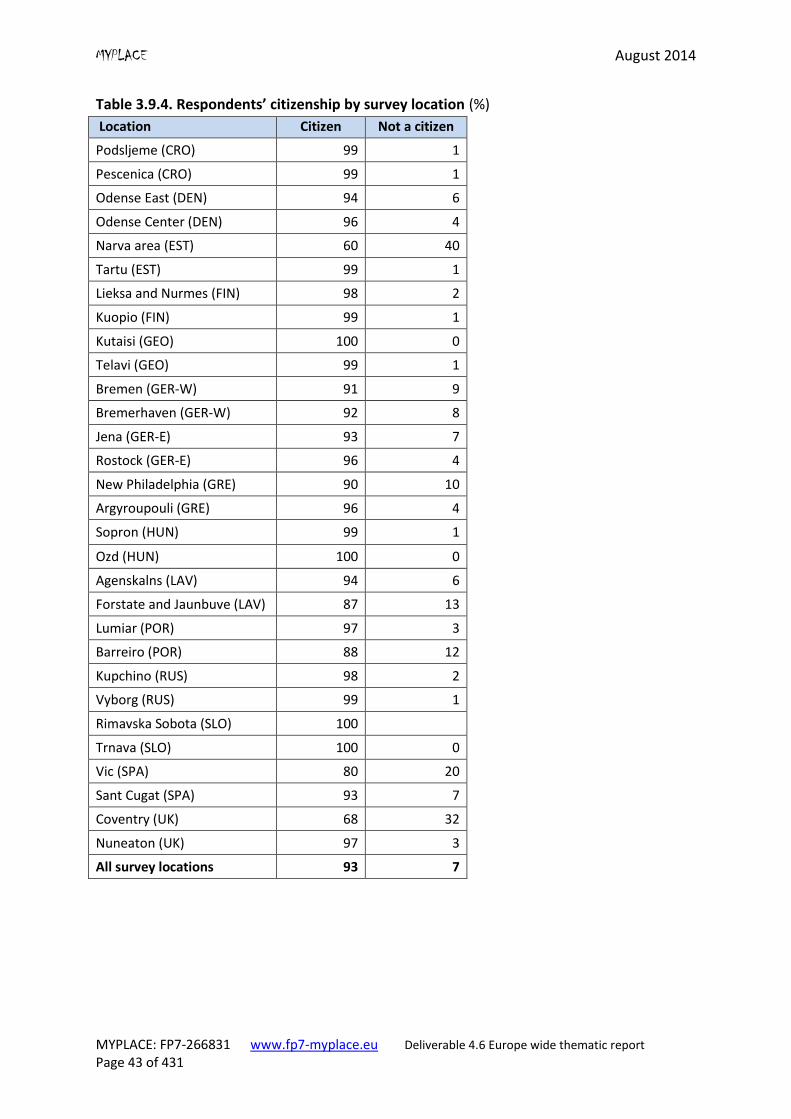
MYPLACE August 2014
MYPLACE: FP7-266831 www.fp7-myplace.eu Deliverable 4.6 Europe wide thematic report Page 43 of 431
Table 3.9.4. Respondents’ citizenship by survey location (%)
Location Citizen Not a citizen
Podsljeme (CRO) 99 1
Pescenica (CRO) 99 1
Odense East (DEN) 94 6
Odense Center (DEN) 96 4
Narva area (EST) 60 40
Tartu (EST) 99 1
Lieksa and Nurmes (FIN) 98 2
Kuopio (FIN) 99 1
Kutaisi (GEO) 100 0
Telavi (GEO) 99 1
Bremen (GER-W) 91 9
Bremerhaven (GER-W) 92 8
Jena (GER-E) 93 7
Rostock (GER-E) 96 4
New Philadelphia (GRE) 90 10
Argyroupouli (GRE) 96 4
Sopron (HUN) 99 1
Ozd (HUN) 100 0
Agenskalns (LAV) 94 6
Forstate and Jaunbuve (LAV) 87 13
Lumiar (POR) 97 3
Barreiro (POR) 88 12
Kupchino (RUS) 98 2
Vyborg (RUS) 99 1
Rimavska Sobota (SLO) 100
Trnava (SLO) 100 0
Vic (SPA) 80 20
Sant Cugat (SPA) 93 7
Coventry (UK) 68 32
Nuneaton (UK) 97 3
All survey locations 93 7
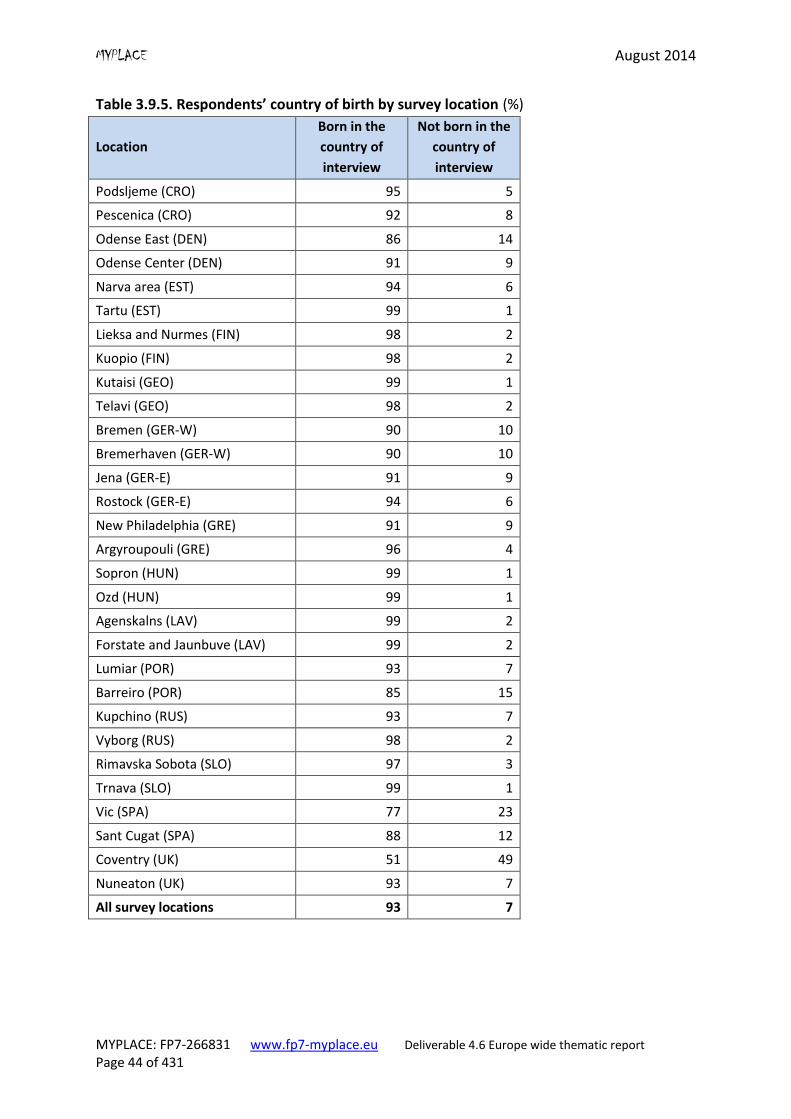
MYPLACE August 2014
MYPLACE: FP7-266831 www.fp7-myplace.eu Deliverable 4.6 Europe wide thematic report Page 44 of 431
Table 3.9.5. Respondents’ country of birth by survey location (%)
Location
Born in the
country of
interview
Not born in the
country of
interview
Podsljeme (CRO) 95 5
Pescenica (CRO) 92 8
Odense East (DEN) 86 14
Odense Center (DEN) 91 9
Narva area (EST) 94 6
Tartu (EST) 99 1
Lieksa and Nurmes (FIN) 98 2
Kuopio (FIN) 98 2
Kutaisi (GEO) 99 1
Telavi (GEO) 98 2
Bremen (GER-W) 90 10
Bremerhaven (GER-W) 90 10
Jena (GER-E) 91 9
Rostock (GER-E) 94 6
New Philadelphia (GRE) 91 9
Argyroupouli (GRE) 96 4
Sopron (HUN) 99 1
Ozd (HUN) 99 1
Agenskalns (LAV) 99 2
Forstate and Jaunbuve (LAV) 99 2
Lumiar (POR) 93 7
Barreiro (POR) 85 15
Kupchino (RUS) 93 7
Vyborg (RUS) 98 2
Rimavska Sobota (SLO) 97 3
Trnava (SLO) 99 1
Vic (SPA) 77 23
Sant Cugat (SPA) 88 12
Coventry (UK) 51 49
Nuneaton (UK) 93 7
All survey locations 93 7
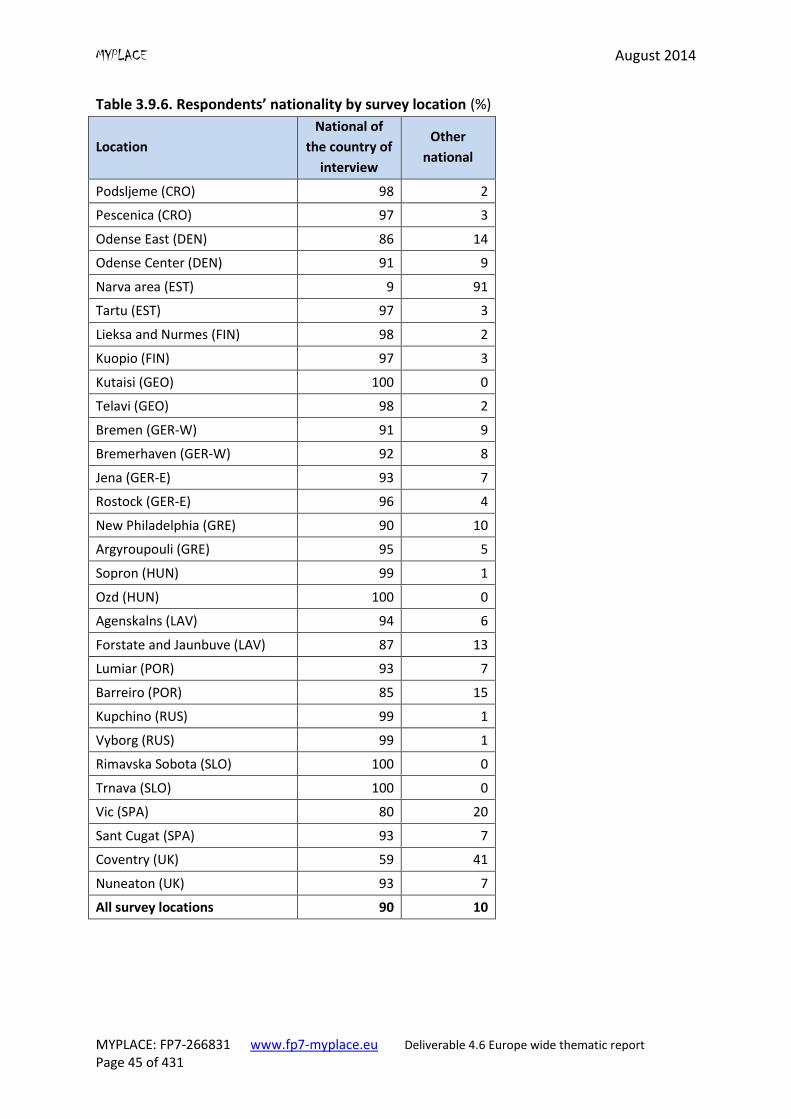
MYPLACE August 2014
MYPLACE: FP7-266831 www.fp7-myplace.eu Deliverable 4.6 Europe wide thematic report Page 45 of 431
Table 3.9.6. Respondents’ nationality by survey location (%)
Location
National of
the country of
interview
Other
national
Podsljeme (CRO) 98 2
Pescenica (CRO) 97 3
Odense East (DEN) 86 14
Odense Center (DEN) 91 9
Narva area (EST) 9 91
Tartu (EST) 97 3
Lieksa and Nurmes (FIN) 98 2
Kuopio (FIN) 97 3
Kutaisi (GEO) 100 0
Telavi (GEO) 98 2
Bremen (GER-W) 91 9
Bremerhaven (GER-W) 92 8
Jena (GER-E) 93 7
Rostock (GER-E) 96 4
New Philadelphia (GRE) 90 10
Argyroupouli (GRE) 95 5
Sopron (HUN) 99 1
Ozd (HUN) 100 0
Agenskalns (LAV) 94 6
Forstate and Jaunbuve (LAV) 87 13
Lumiar (POR) 93 7
Barreiro (POR) 85 15
Kupchino (RUS) 99 1
Vyborg (RUS) 99 1
Rimavska Sobota (SLO) 100 0
Trnava (SLO) 100 0
Vic (SPA) 80 20
Sant Cugat (SPA) 93 7
Coventry (UK) 59 41
Nuneaton (UK) 93 7
All survey locations 90 10
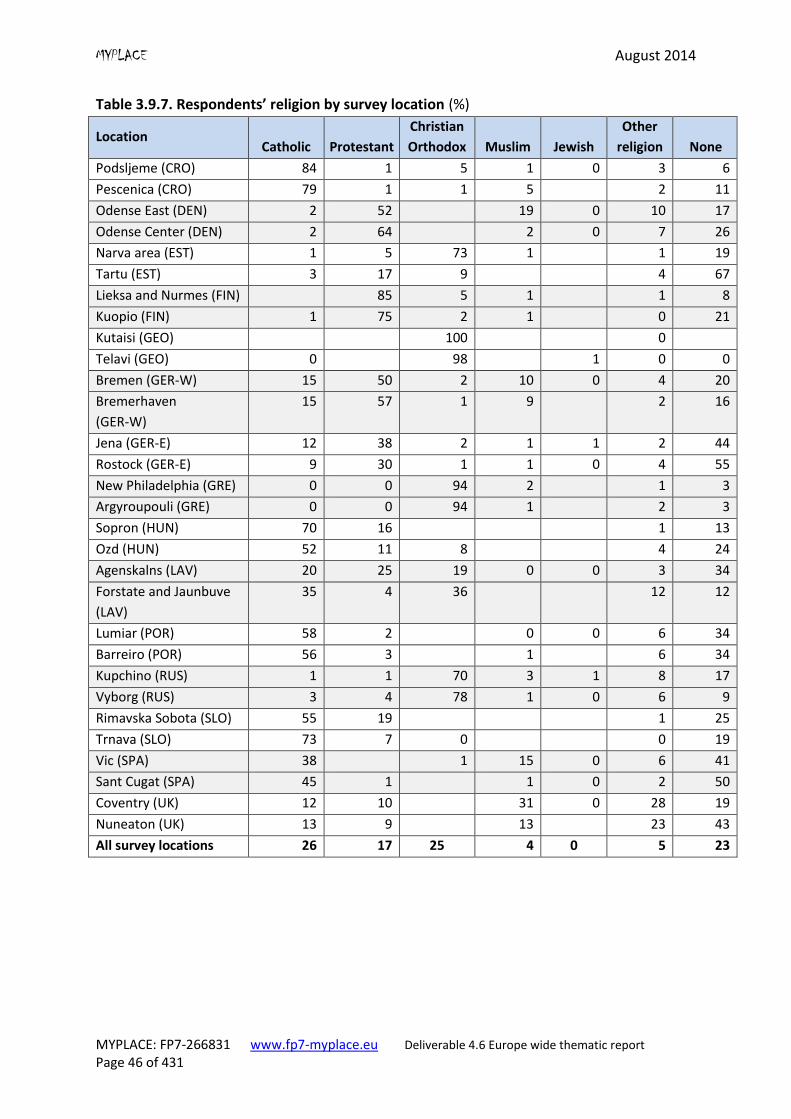
MYPLACE August 2014
MYPLACE: FP7-266831 www.fp7-myplace.eu Deliverable 4.6 Europe wide thematic report Page 46 of 431
Table 3.9.7. Respondents’ religion by survey location (%)
Location Catholic Protestant
Christian
Orthodox Muslim Jewish
Other
religion None
Podsljeme (CRO) 84 1 5 1 0 3 6
Pescenica (CRO) 79 1 1 5 2 11
Odense East (DEN) 2 52 19 0 10 17
Odense Center (DEN) 2 64 2 0 7 26
Narva area (EST) 1 5 73 1 1 19
Tartu (EST) 3 17 9 4 67
Lieksa and Nurmes (FIN) 85 5 1 1 8
Kuopio (FIN) 1 75 2 1 0 21
Kutaisi (GEO) 100 0
Telavi (GEO) 0 98 1 0 0
Bremen (GER-W) 15 50 2 10 0 4 20
Bremerhaven
(GER-W)
15 57 1 9
2 16
Jena (GER-E) 12 38 2 1 1 2 44
Rostock (GER-E) 9 30 1 1 0 4 55
New Philadelphia (GRE) 0 0 94 2 1 3
Argyroupouli (GRE) 0 0 94 1 2 3
Sopron (HUN) 70 16 1 13
Ozd (HUN) 52 11 8 4 24
Agenskalns (LAV) 20 25 19 0 0 3 34
Forstate and Jaunbuve
(LAV)
35 4 36
12 12
Lumiar (POR) 58 2 0 0 6 34
Barreiro (POR) 56 3 1 6 34
Kupchino (RUS) 1 1 70 3 1 8 17
Vyborg (RUS) 3 4 78 1 0 6 9
Rimavska Sobota (SLO) 55 19 1 25
Trnava (SLO) 73 7 0 0 19
Vic (SPA) 38 1 15 0 6 41
Sant Cugat (SPA) 45 1 1 0 2 50
Coventry (UK) 12 10 31 0 28 19
Nuneaton (UK) 13 9 13 23 43
All survey locations 26 17 25 4 0 5 23
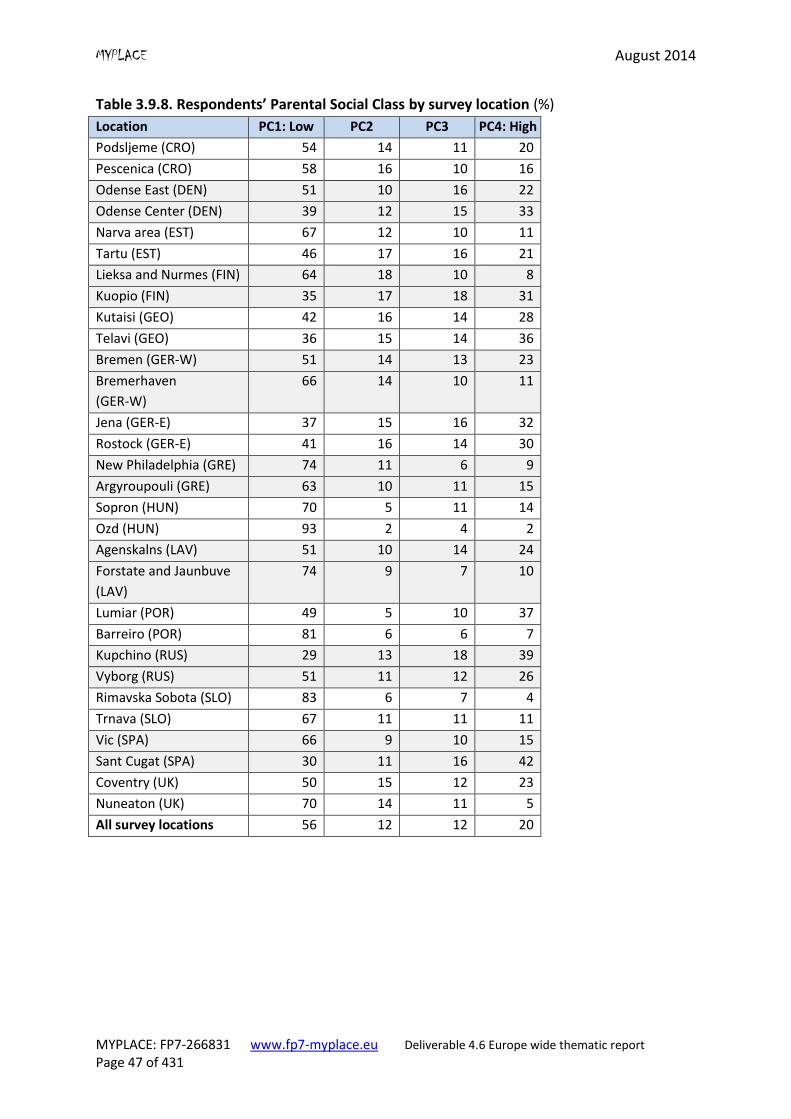
MYPLACE August 2014
MYPLACE: FP7-266831 www.fp7-myplace.eu Deliverable 4.6 Europe wide thematic report Page 47 of 431
Table 3.9.8. Respondents’ Parental Social Class by survey location (%)
Location PC1: Low PC2 PC3 PC4: High
Podsljeme (CRO) 54 14 11 20
Pescenica (CRO) 58 16 10 16
Odense East (DEN) 51 10 16 22
Odense Center (DEN) 39 12 15 33
Narva area (EST) 67 12 10 11
Tartu (EST) 46 17 16 21
Lieksa and Nurmes (FIN) 64 18 10 8
Kuopio (FIN) 35 17 18 31
Kutaisi (GEO) 42 16 14 28
Telavi (GEO) 36 15 14 36
Bremen (GER-W) 51 14 13 23
Bremerhaven
(GER-W)
66 14 10 11
Jena (GER-E) 37 15 16 32
Rostock (GER-E) 41 16 14 30
New Philadelphia (GRE) 74 11 6 9
Argyroupouli (GRE) 63 10 11 15
Sopron (HUN) 70 5 11 14
Ozd (HUN) 93 2 4 2
Agenskalns (LAV) 51 10 14 24
Forstate and Jaunbuve
(LAV)
74 9 7 10
Lumiar (POR) 49 5 10 37
Barreiro (POR) 81 6 6 7
Kupchino (RUS) 29 13 18 39
Vyborg (RUS) 51 11 12 26
Rimavska Sobota (SLO) 83 6 7 4
Trnava (SLO) 67 11 11 11
Vic (SPA) 66 9 10 15
Sant Cugat (SPA) 30 11 16 42
Coventry (UK) 50 15 12 23
Nuneaton (UK) 70 14 11 5
All survey locations 56 12 12 20
MYPLACE August 2014
MYPLACE: FP7-266831 www.fp7-myplace.eu Deliverable 4.6 Europe wide thematic report Page 48 of 431
Chapter 4: Political Interest
This chapter examines the variables describing political interest. Respondents’ political
interest was measured using a range of questions, including: specific questions on
respondents’ interest in geographical, political and administrative units in different distance
from the respondent’s place of residence; and interest in ten themes related to public
affairs, social issues and topics and politics in general.
An overview of survey results and summary of national reports
In general, the level of political interest of young people is not very high: 42%, or slightly less
than half, consider themselves interested in politics and 58% report that they are not very
interested or not at all interested in politics.
Across countries, interest in politics differs. The Croatian report termed youth interest “very
low” since 70% reported ‘not at all’ or ‘not very interested’ in politics. Likewise the Latvian
report reported similar percentages as did the Finnish report. In contrast other countries –
eastern Germany, Greece, Spain, the political interest of youth was considered to be rather
high. Most of reports mentioned that interest depended on the concrete theme, which
respondents assessed. When young people were asked about their interest in five different
types of administrative/political/geographical units, the overall political interest was higher
and there was variation across the types of units.
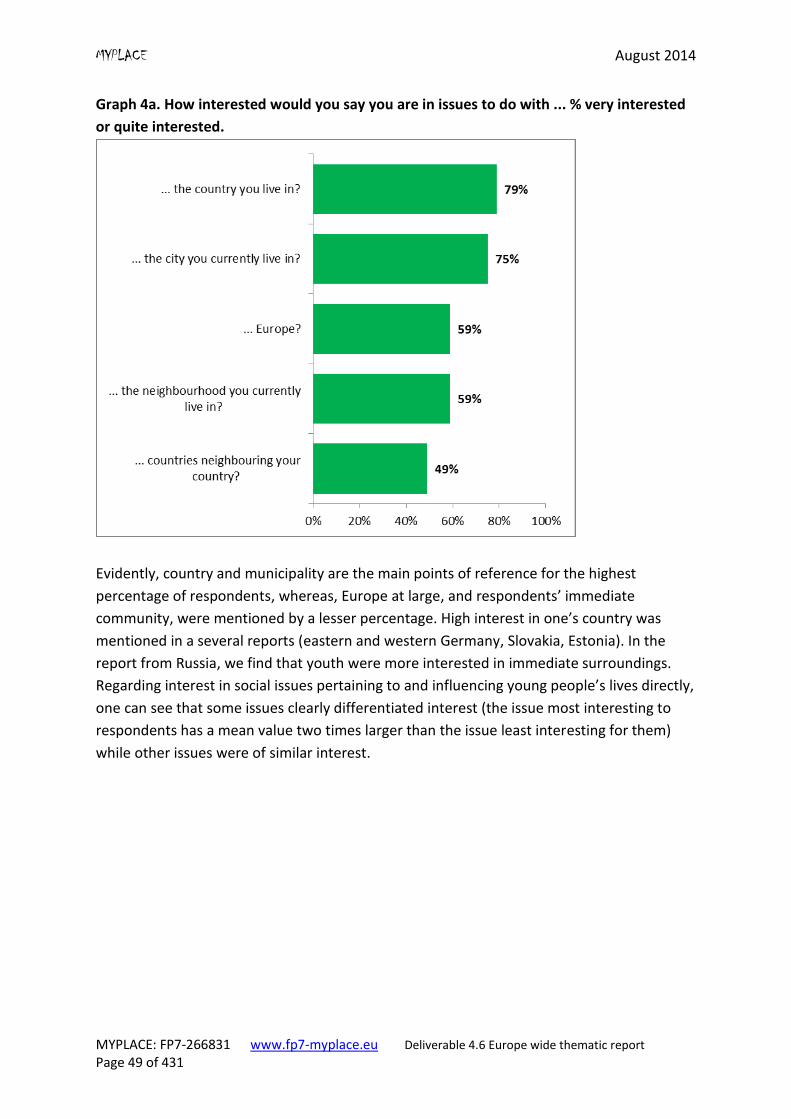
MYPLACE August 2014
MYPLACE: FP7-266831 www.fp7-myplace.eu Deliverable 4.6 Europe wide thematic report Page 49 of 431
Graph 4a. How interested would you say you are in issues to do with ... % very interested
or quite interested.
Evidently, country and municipality are the main points of reference for the highest
percentage of respondents, whereas, Europe at large, and respondents’ immediate
community, were mentioned by a lesser percentage. High interest in one’s country was
mentioned in a several reports (eastern and western Germany, Slovakia, Estonia). In the
report from Russia, we find that youth were more interested in immediate surroundings.
Regarding interest in social issues pertaining to and influencing young people’s lives directly,
one can see that some issues clearly differentiated interest (the issue most interesting to
respondents has a mean value two times larger than the issue least interesting for them)
while other issues were of similar interest.
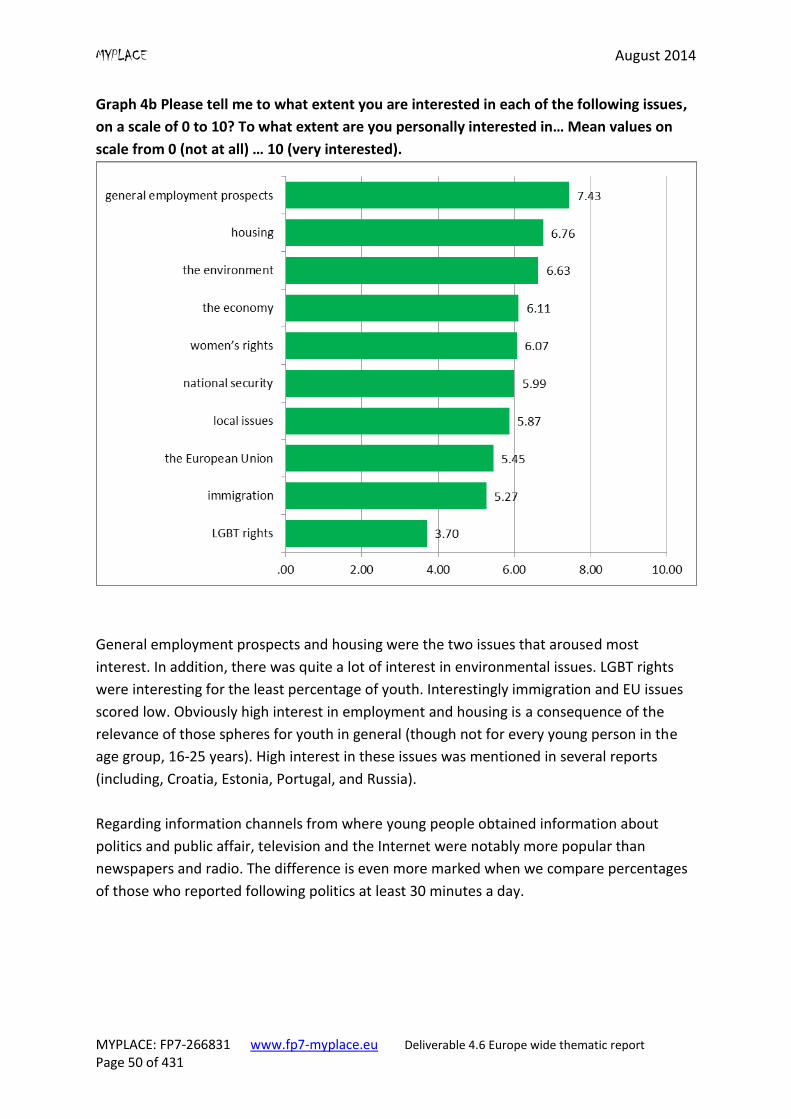
MYPLACE August 2014
MYPLACE: FP7-266831 www.fp7-myplace.eu Deliverable 4.6 Europe wide thematic report Page 50 of 431
Graph 4b Please tell me to what extent you are interested in each of the following issues,
on a scale of 0 to 10? To what extent are you personally interested in… Mean values on
scale from 0 (not at all) … 10 (very interested).
General employment prospects and housing were the two issues that aroused most
interest. In addition, there was quite a lot of interest in environmental issues. LGBT rights
were interesting for the least percentage of youth. Interestingly immigration and EU issues
scored low. Obviously high interest in employment and housing is a consequence of the
relevance of those spheres for youth in general (though not for every young person in the
age group, 16-25 years). High interest in these issues was mentioned in several reports
(including, Croatia, Estonia, Portugal, and Russia).
Regarding information channels from where young people obtained information about
politics and public affair, television and the Internet were notably more popular than
newspapers and radio. The difference is even more marked when we compare percentages
of those who reported following politics at least 30 minutes a day.
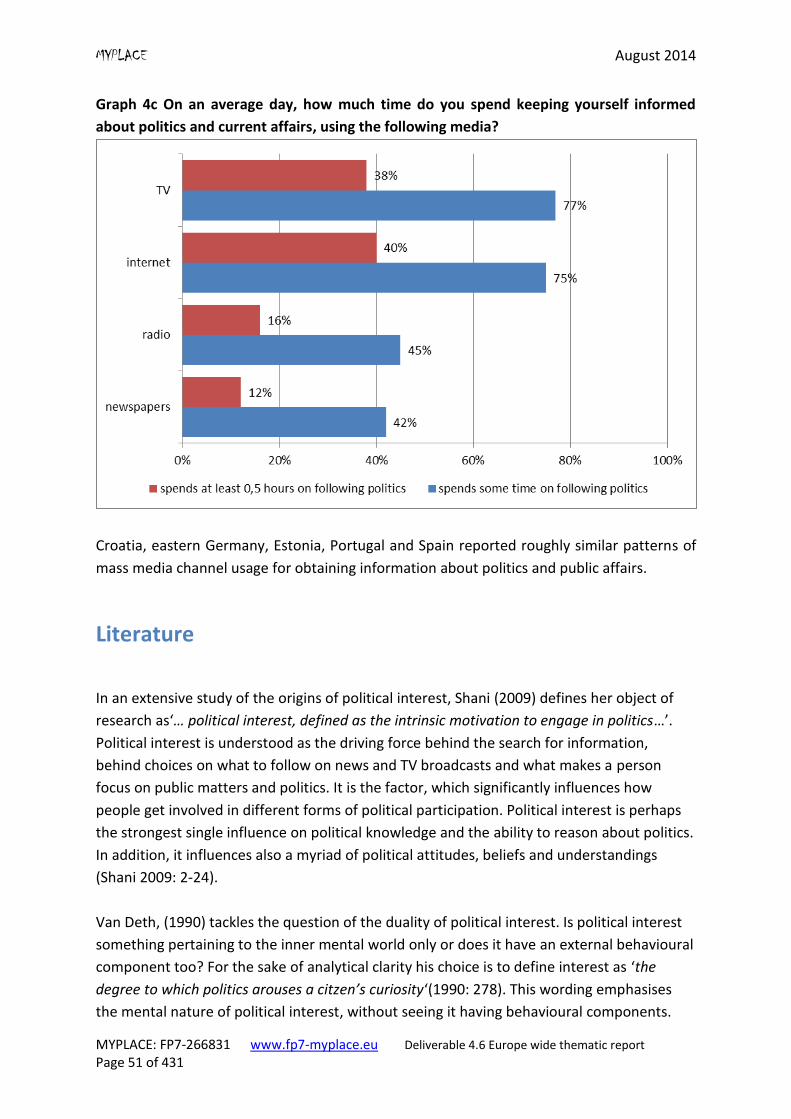
MYPLACE August 2014
MYPLACE: FP7-266831 www.fp7-myplace.eu Deliverable 4.6 Europe wide thematic report Page 51 of 431
Graph 4c On an average day, how much time do you spend keeping yourself informed
about politics and current affairs, using the following media?
Croatia, eastern Germany, Estonia, Portugal and Spain reported roughly similar patterns of
mass media channel usage for obtaining information about politics and public affairs.
Literature
In an extensive study of the origins of political interest, Shani (2009) defines her object of
research as‘… political interest, defined as the intrinsic motivation to engage in politics…’.
Political interest is understood as the driving force behind the search for information,
behind choices on what to follow on news and TV broadcasts and what makes a person
focus on public matters and politics. It is the factor, which significantly influences how
people get involved in different forms of political participation. Political interest is perhaps
the strongest single influence on political knowledge and the ability to reason about politics.
In addition, it influences also a myriad of political attitudes, beliefs and understandings
(Shani 2009: 2-24).
Van Deth, (1990) tackles the question of the duality of political interest. Is political interest
something pertaining to the inner mental world only or does it have an external behavioural
component too? For the sake of analytical clarity his choice is to define interest as ‘the
degree to which politics arouses a citzen’s curiosity‘(1990: 278). This wording emphasises
the mental nature of political interest, without seeing it having behavioural components.
MYPLACE August 2014
MYPLACE: FP7-266831 www.fp7-myplace.eu Deliverable 4.6 Europe wide thematic report Page 52 of 431
Holleque (2011) makes the distinction between interest as a mental state and actual
behaviour. For him, political interest is attention to politics. Attention to politics means
readiness to inform oneself, as well as readiness to participate. However, it is not a
behaviour itself, whether information seeking behaviour or political action. The argument
against seeing political interest as comprised of attitudes and behaviour maintains that all
types of behaviours are influenced by a range of factors and political interest, at best, is only
one factor among others, but it might be not present at all. In addition, Niemi, Craig and
Mattei (1991: 1410) have made a distinction between three aspects of psychological
involvement in politics when they talk about general interest in politics, namely discussing
politics and following politics on TV. Therefore, they too opt to define political interest as a
feature of a mind-set only, without behavioural aspects being present. Elsewhere too
political interest appears in the section devoted to studying political attitudes. It has been
measured using only one question, ‘How interested would you say you personally are in
politics?’ (Utter, 2011). Thus political interest is understood as a general predisposition of an
individual, not as a concrete form of behaviour. Syal (2012: 423) has made a distinction
between ‘general interest of citizens in public affairs, apart from times of actual elections‘
which is continuous and ‘political participation’, which refers to certain acts and activities in
connection with elections. Here too we see that behaviour and interest are considered two
different things.
Lange et al. (2013) differentiate between long-term and situational term interest in politics.
While the first refers to ‘relatively stable preferences to certain issues, which is paid certain
attention in the long-term‘, the other one is linked to a certain situation. It is possible that
long-term interest gets started from a situational interest. For them, interest represents also
the value orientations of individuals or the readiness to act in a certain manner. Thus it is a
mental quality, not a behaviour or action, even if it constitutes a precondition for
information seeking or a concrete act. Schmidt (2004: 14) defined political interest as
‘curiosity, relation, attention and vigilance to political issues‘ which conforms with the
understandings that political interest is rather a state of mind than action. Also Niedermayer
(2005) and Hadjar and Becker (2006) define interest in politics as a precondition for political
activities but not activities themselves.
Kuhn and Schmidt (2004: 75) distinguish between different spheres of interest:
1. Classic policies (e.g. policy of international organisations– NATO, UNO, EU, foreign policy, domestic policy, policy of parties, defence policy, economic policy),
2. Social policies (e.g. labour market policy, social policy, health policy, retirement pension policy),
3. New policies (e.g. policy towards third world countries, peace policy, environment protection policy)
4. Migration policies (e.g. immigration policy, integration policy). Kenski and Stroud (2012: 180-181) locate political interest among attitudes and political
identification, but operationalise it as activities, albeit activities which do not require very
big effort: including, how often people follow what is going on in government and public
MYPLACE August 2014
MYPLACE: FP7-266831 www.fp7-myplace.eu Deliverable 4.6 Europe wide thematic report Page 53 of 431
affairs, or how many days in the past week they had talked with family and friends about
politics. This was however differentiated from following specific political campaigns, such as
presidential elections, on traditional media channels (TV, newspapers, radio). Thus, here we
see that political interest is understood as a set of behaviours. Pritzker et al. (2012: 6-10)
have a different view on political interest. Their empirical approach is embedded in the
political participation approach and thus the index of political interest is constituted mainly
of activities, which in other studies, including MYPLACE, appear as forms of participation.
The only non-activism variable which is in the questionnaire is ‘volunteering in an election
campaign’.
Factors, which influence the level of political interest
In the political activism and political participation literature, political interest appears mostly
as an independent variable, as a factor, which influences other variables. The list of variables
that are used range from political knowledge, stability of attitudes to political action.
It has been found that the level of self-assessed and self-reported political interest is highly
stable over time, both in short- (a year) and long-term (decades) periods (Prior, 2010). This
finding has two important implications. First, an individual’s political interest remains
roughly the same throughout his or her life course (at least over several decades). However,
the age from which levels of political interest stay stable, probably is not clear. Second, only
the most unique events have the capability of influencing a person’s level of interest in
politics. For example, the Fall of the Berlin Wall / reunification of Germany, could only
increase interest in politics in the short term perspective.
In the long-term perspective, political interest seems to be a stable mental construct, ‘a kind
of unmovable mover‘. Its (initial) levels are set by parents and members of one’s family
during childhood and youth, through discussing public affairs, politics, community matters,
as well as through other experiences at home (see Shani, 2009; Verba, Schlozman and
Brady, 1995: 459; Tenscher and Scherer, 2012). Its levels can, vary significantly, depending
on the situation and its relevance to an individual. Among socio-economic variables, three
variables have been found to significantly influence the level of political interest: the level of
education; gender; and age. However, the explanatory power of these three variables is
rather weak (van Deth, 1990: 301-307).
Another variable that is strongly linked to the level of interest is ‘activism at school and in
NGOs’ (Verba et al.,1995: 434). Unfortunately, it is impossible to ascertain the causal
direction of influence or even be sure of what would be the accurate causal model. We
cannot be sure whether participation increases interest or is it vice versa; or might family
background, for example, influence both of them. Tenscher and Scherer (2012) report a
relationship between political knowledge and political interest, but it is impossible to
ascertain causality between these two, or which way does causal influence run. Schmid
(2004: 18,19) found that people characterised by ‘higher interest’ are capable of placing
MYPLACE August 2014
MYPLACE: FP7-266831 www.fp7-myplace.eu Deliverable 4.6 Europe wide thematic report Page 54 of 431
themselves on a left-right scale and on scales of political attitudes – in other words they are
characterised by a better understanding of politics, public affairs and politics. Nevertheless,
we do not know which comes first, political interest or capability to orient towards social
and political issues.
One interesting feature of political interest is the influence of political interest on
conventional political activities, especially voting and related activities, but not so in the
case of protest activities and other similar activities. While studies of conventional political
activism routinely report positive relationships between levels of political interest and
participation (Verba et al.,1995: 334-369), one large scale study of political protest hardly
even mentions political interest and does not consider it among key variables explaining
involvement in protest activities (Kaase and Marsh, 1979: 41-50; Kaase, 1990).
Summary and key issues for the MYPLACE analysis
This short review of political interest carries three clear issues relevant for the analysis of
political interest in the MYPLACE project. First, it is necessary to make a clear distinction
between mental predispositions – curiosity, interest, motivation or something else – and a
range of behaviours, which might be motivated, and initiated by this mental predisposition.
Our choice at this point is to concentrate on that mental predisposition only, and leave
information-seeking behaviour out. The rationale behind doing so is that the spectrum of
concepts and variables, which vary together with the level of political interest, is very wide.
It certainly is not limited to talking to others and/or following news about politics. Thus,
there is no particular reason to view political discussion and following mass media as
integral aspects of political interest. It would be more appropriate to view the latter as
aspects of political activism and information acquisition behaviours, not as political interest
even though they have close link to political interest. Second, political interest is not
internally structured around certain themes. There is no good reason to distinguish between
specific political interest in foreign relations, in employment or in minorities’ rights. Though
these, and also other themes probably are not addressed by the same individuals, it seems
that the motivation behind becoming and being interested in particular themes is largely the
same for all individuals. Third, in the search for the factors which influence the level of
political interest, the standard set of socio-demographic variables most probably is
sufficient. As well as socio-demograpchic predictors of political atttitudes there are also
other attitudinal and behavioural factors, which co-vary with the level of political interest,
but it is hard, if not impossible, to build an appropriate causal model, or to ascertain the
direction of causal flow, in such models. For instance, we cannot be sure whether political
interest influences organisational activism, or vice versa, or does a third factor (like parental
influence and family background) influence both of them.
MYPLACE August 2014
MYPLACE: FP7-266831 www.fp7-myplace.eu Deliverable 4.6 Europe wide thematic report Page 55 of 431
Items used to measure political interest
Based on the reasons explained in the theoretical section and due to the needs of data
analysis the questionnaire items on political interest were divided into two groups:
a) items measuring behavioural aspects and respondents’ assessments of their close relatives’ and friends’ interest in politics measuring
b) self-assessed level of political interest – items measuring non-behavioural that is purely mental aspects of political interest.
The selection of variables for data analysis is influenced also by additional conditions.
Question2 and 4 items ask about ‘political interest of and interaction with respondent’s
close friends and relatives’. Since not every respondent has each of the referred persons
present in the household, there is a lot of variation, which results from family composition
and not from political interest of the respondent. We do not account for variation, which is
caused by the household composition or friendship circles. Questions which contain
variation, which is not present in questions focusing on the self only, need be analysed
separately from the questions dealing with the self only.
For measuring mental aspects of political interest, questions from three items sets in the
questionnaire were chosen: Q1, Q2, Q5
Based on the results from the Factor and reliability analysis, it was decided to develop two
cumulative indices and to analyse three variables individually:
Index1: Interest in different geographical regions (Q1_1 … Q1_5),
Index2: Interest in a range of topics (Q5_3 … Q5_10),
4.1 Interest in areas (Q1)
Interest in areas include the following question and variables;
Q1 How interested would you say you are in issues to do with …
Q1_1 ... the neighbourhood you currently live in?
Q1_2... the city you currently live in?
Q1_3 ... the country you live in?
Q1_4 ... countries neighbouring /country/?
Q1_5 ... Europe?
Respondents could choose from ‘very interested’, ‘quite interested’, ‘not very interested’
and ‘not at all interested’
Exploratory factor analysis revealed the presence of an internal structure in the responses
when items in Q1 are examined. The reliability of the scale, consisting of items involved in
Factor 1, was high, the Cronbach alpha was 0.807. Across countries, the value varied from
0.596 in Denmark to 0.890 in Hungary.
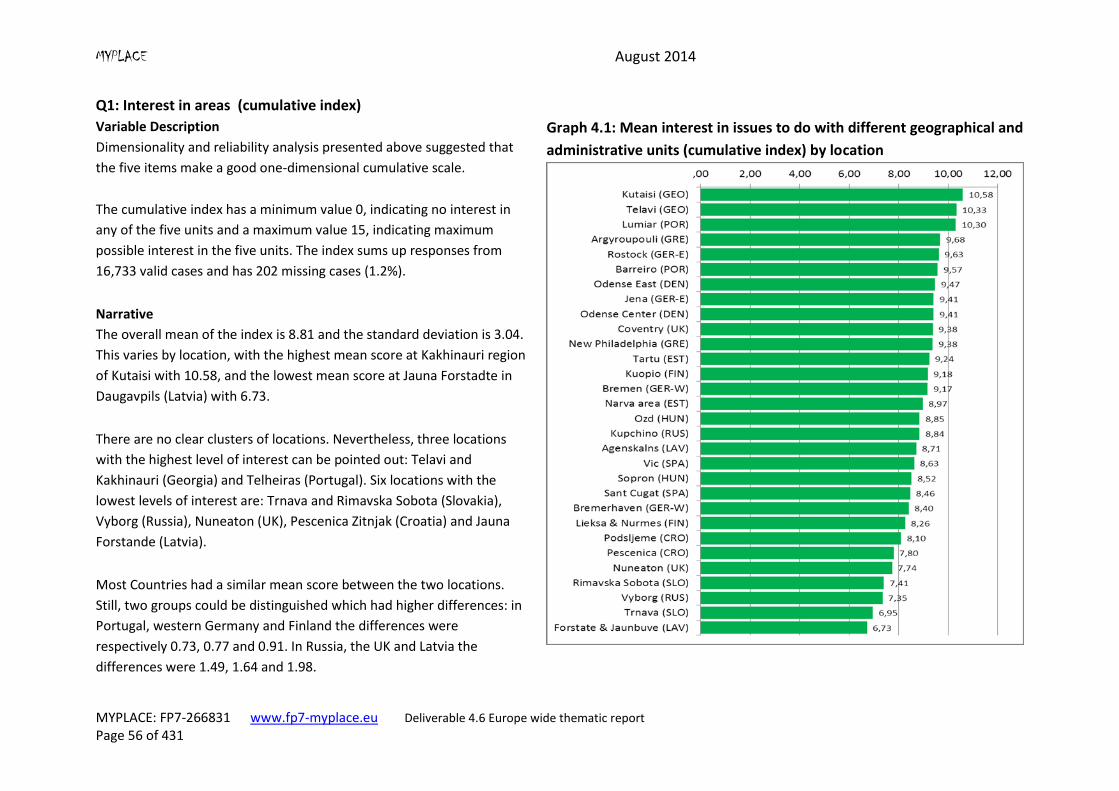
MYPLACE August 2014
MYPLACE: FP7-266831 www.fp7-myplace.eu Deliverable 4.6 Europe wide thematic report Page 56 of 431
Q1: Interest in areas (cumulative index)
Variable Description
Dimensionality and reliability analysis presented above suggested that
the five items make a good one-dimensional cumulative scale.
The cumulative index has a minimum value 0, indicating no interest in
any of the five units and a maximum value 15, indicating maximum
possible interest in the five units. The index sums up responses from
16,733 valid cases and has 202 missing cases (1.2%).
Graph 4.1: Mean interest in issues to do with different geographical and
administrative units (cumulative index) by location
Narrative
The overall mean of the index is 8.81 and the standard deviation is 3.04.
This varies by location, with the highest mean score at Kakhinauri region
of Kutaisi with 10.58, and the lowest mean score at Jauna Forstadte in
Daugavpils (Latvia) with 6.73.
There are no clear clusters of locations. Nevertheless, three locations
with the highest level of interest can be pointed out: Telavi and
Kakhinauri (Georgia) and Telheiras (Portugal). Six locations with the
lowest levels of interest are: Trnava and Rimavska Sobota (Slovakia),
Vyborg (Russia), Nuneaton (UK), Pescenica Zitnjak (Croatia) and Jauna
Forstande (Latvia).
Most Countries had a similar mean score between the two locations.
Still, two groups could be distinguished which had higher differences: in
Portugal, western Germany and Finland the differences were
respectively 0.73, 0.77 and 0.91. In Russia, the UK and Latvia the
differences were 1.49, 1.64 and 1.98.
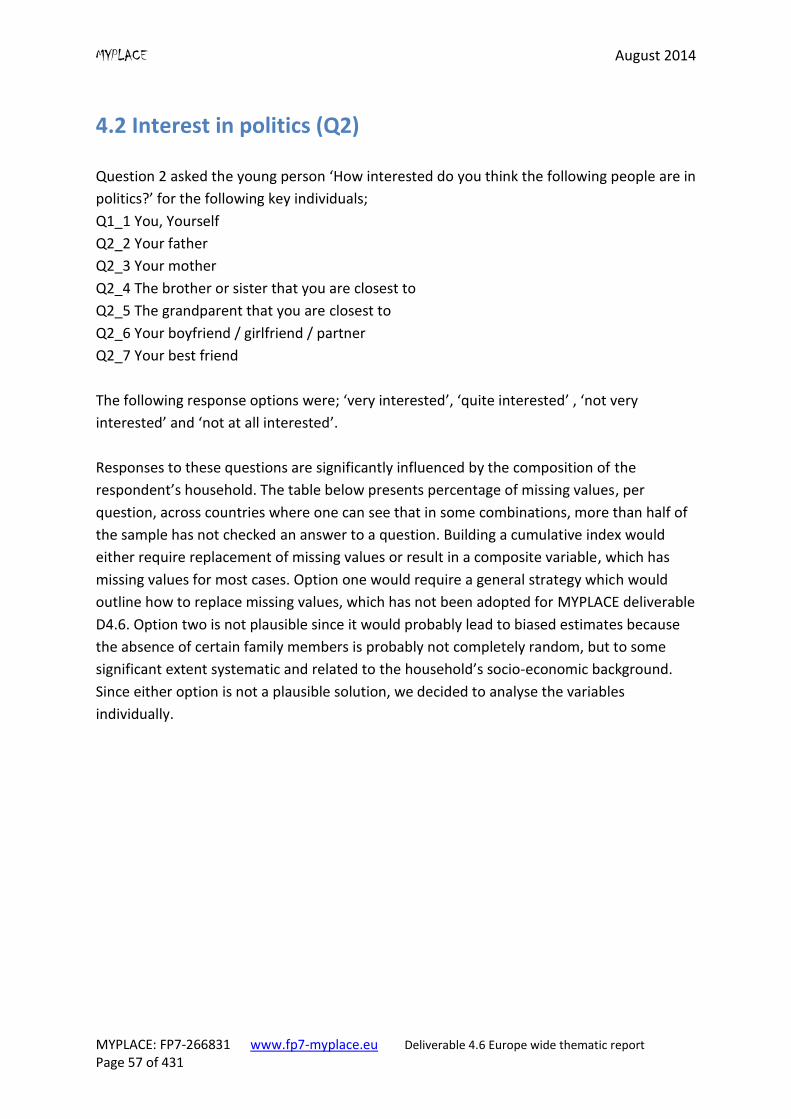
MYPLACE August 2014
MYPLACE: FP7-266831 www.fp7-myplace.eu Deliverable 4.6 Europe wide thematic report Page 57 of 431
4.2 Interest in politics (Q2)
Question 2 asked the young person ‘How interested do you think the following people are in
politics?’ for the following key individuals;
Q1_1 You, Yourself
Q2_2 Your father
Q2_3 Your mother
Q2_4 The brother or sister that you are closest to
Q2_5 The grandparent that you are closest to
Q2_6 Your boyfriend / girlfriend / partner
Q2_7 Your best friend
The following response options were; ‘very interested’, ‘quite interested’ , ‘not very
interested’ and ‘not at all interested’.
Responses to these questions are significantly influenced by the composition of the
respondent’s household. The table below presents percentage of missing values, per
question, across countries where one can see that in some combinations, more than half of
the sample has not checked an answer to a question. Building a cumulative index would
either require replacement of missing values or result in a composite variable, which has
missing values for most cases. Option one would require a general strategy which would
outline how to replace missing values, which has not been adopted for MYPLACE deliverable
D4.6. Option two is not plausible since it would probably lead to biased estimates because
the absence of certain family members is probably not completely random, but to some
significant extent systematic and related to the household’s socio-economic background.
Since either option is not a plausible solution, we decided to analyse the variables
individually.

MYPLACE August 2014
MYPLACE: FP7-266831 www.fp7-myplace.eu Deliverable 4.6 Europe wide thematic report Page 58 of 431
Table 4.2 Percentage of missing values per country and question. The question: How
interested do you think the following people are in politics?
Country Your father
Your
mother
The brother
or sister
that you are
closest to
The
grandparen
t that you
are closest
to
Your
boyfriend /
girlfriend /
partner
Your best
friend
Croatia 9 7 20 26 42 9
Denmark 5 2 5 20 44 2
Estonia 22 6 32 32 35 8
Finland 12 8 18 27 48 9
Georgia 17 5 22 31 51 4
Western
Germany 10 4 21 24 48 2
Eastern Germany 8 1 18 13 36 2
Greece 5 3 27 32 42 4
Hungary 14 7 17 26 37 12
Latvia 17 5 36 25 30 3
Portugal 11 6 35 30 39 10
Russia 21 9 27 20 24 9
Slovakia 9 4 20 20 33 12
Spain 9 4 28 26 52 2
UK 12 4 14 20 44 3
Average 12% 5% 23% 25% 40% 6%
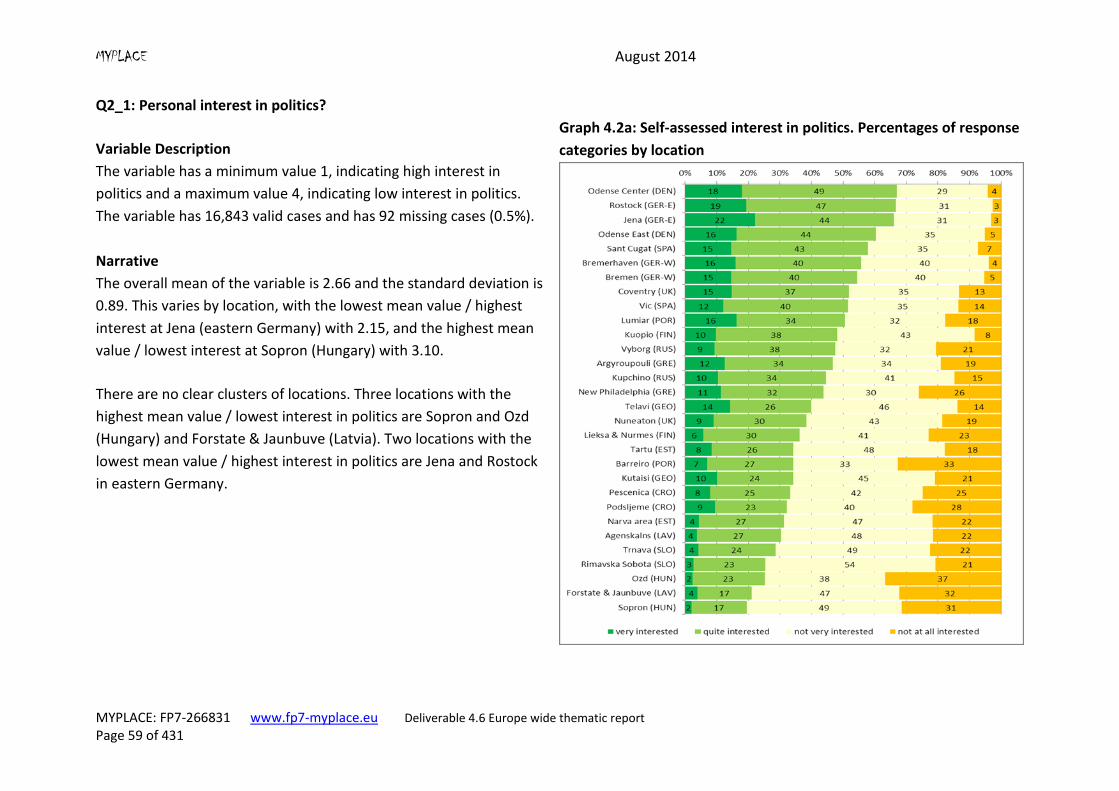
MYPLACE August 2014
MYPLACE: FP7-266831 www.fp7-myplace.eu Deliverable 4.6 Europe wide thematic report Page 59 of 431
Q2_1: Personal interest in politics?
Variable Description
The variable has a minimum value 1, indicating high interest in
politics and a maximum value 4, indicating low interest in politics.
The variable has 16,843 valid cases and has 92 missing cases (0.5%).
Graph 4.2a: Self-assessed interest in politics. Percentages of response
categories by location
Narrative
The overall mean of the variable is 2.66 and the standard deviation is
0.89. This varies by location, with the lowest mean value / highest
interest at Jena (eastern Germany) with 2.15, and the highest mean
value / lowest interest at Sopron (Hungary) with 3.10.
There are no clear clusters of locations. Three locations with the
highest mean value / lowest interest in politics are Sopron and Ozd
(Hungary) and Forstate & Jaunbuve (Latvia). Two locations with the
lowest mean value / highest interest in politics are Jena and Rostock
in eastern Germany.
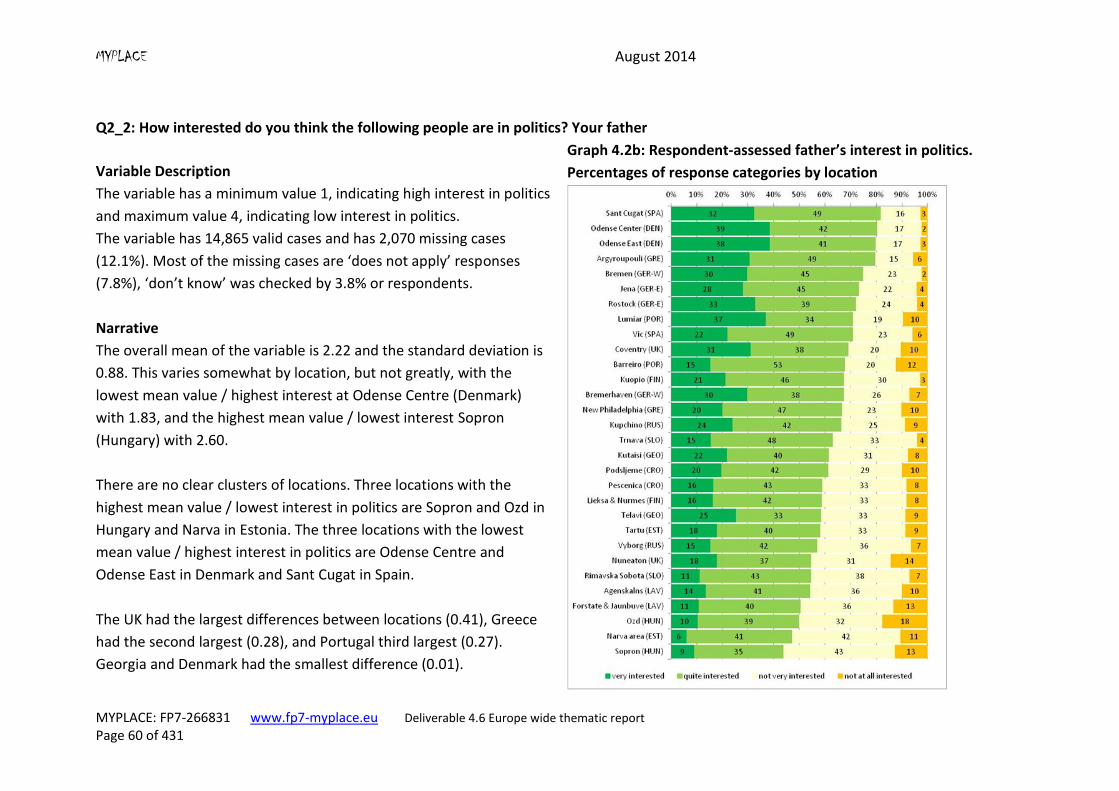
MYPLACE August 2014
MYPLACE: FP7-266831 www.fp7-myplace.eu Deliverable 4.6 Europe wide thematic report Page 60 of 431
Q2_2: How interested do you think the following people are in politics? Your father
Variable Description
The variable has a minimum value 1, indicating high interest in politics
and maximum value 4, indicating low interest in politics.
The variable has 14,865 valid cases and has 2,070 missing cases
(12.1%). Most of the missing cases are ‘does not apply’ responses
(7.8%), ‘don’t know’ was checked by 3.8% or respondents.
Graph 4.2b: Respondent-assessed father’s interest in politics.
Percentages of response categories by location
Narrative
The overall mean of the variable is 2.22 and the standard deviation is
0.88. This varies somewhat by location, but not greatly, with the
lowest mean value / highest interest at Odense Centre (Denmark)
with 1.83, and the highest mean value / lowest interest Sopron
(Hungary) with 2.60.
There are no clear clusters of locations. Three locations with the
highest mean value / lowest interest in politics are Sopron and Ozd in
Hungary and Narva in Estonia. The three locations with the lowest
mean value / highest interest in politics are Odense Centre and
Odense East in Denmark and Sant Cugat in Spain.
The UK had the largest differences between locations (0.41), Greece
had the second largest (0.28), and Portugal third largest (0.27).
Georgia and Denmark had the smallest difference (0.01).
MYPLACE August 2014
MYPLACE: FP7-266831 www.fp7-myplace.eu Deliverable 4.6 Europe wide thematic report Page 61 of 431
Q2_3: How interested do you think the following people are in politics? Your mother
Variable Description
The variable has a minimum value 1, indicating high interest in politics and a
maximum value 4, indicating low interest in politics.
The variable has 16,098 valid cases and has 837 missing cases (4.9%). Most
of the missing cases are ‘don’t know’ (2.5%), ‘does not apply’ was checked
by 2.0% of respondents.
Graph 4.2c: Respondent-assessed mother’s interest in politics.
Percentages of response categories by location
Narrative
The overall mean of the variable is 2.47 and the standard deviation is 0.86.
This varies somewhat by location, but not by much, with the lowest mean
value / highest interest at Odense East (Denmark) with 2.13, and the highest
mean value / lowest interest Jauna Forstadte (Latvia) with 2.80.
There are no clear clusters of locations. The three locations with the highest
mean value / lowest interest in politics are Jauna Forstadte in Latvia, and
Sopron and Ozd in Hungary. The three locations with the lowest mean value
/ highest interest in politics are Odense Centre and Odense East in Denmark
and Sant Cugat in Spain.
Portugal had the largest differences between locations (0.38), Spain had the
second largest (0.30), Latvia third largest (0.24) and Russia fourth largest
(0.20). Other countries had a difference smaller than 0.15.
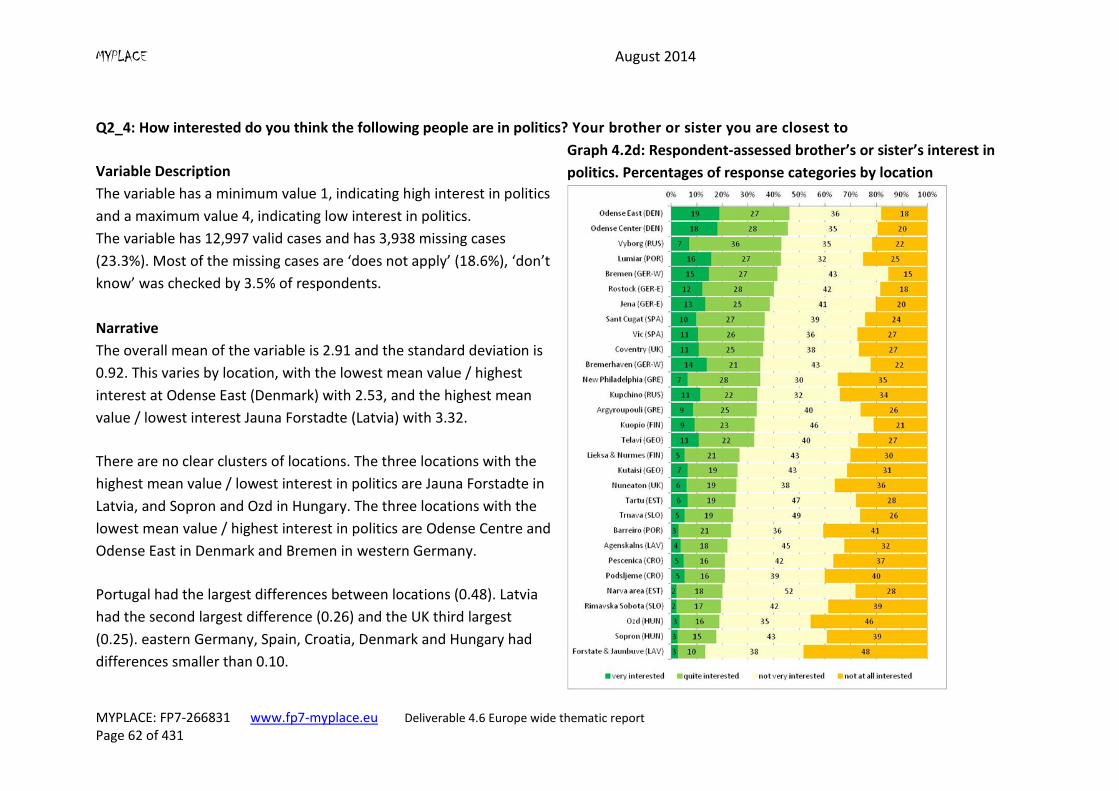
MYPLACE August 2014
MYPLACE: FP7-266831 www.fp7-myplace.eu Deliverable 4.6 Europe wide thematic report Page 62 of 431
Q2_4: How interested do you think the following people are in politics? Your brother or sister you are closest to
Variable Description
The variable has a minimum value 1, indicating high interest in politics
and a maximum value 4, indicating low interest in politics.
The variable has 12,997 valid cases and has 3,938 missing cases
(23.3%). Most of the missing cases are ‘does not apply’ (18.6%), ‘don’t
know’ was checked by 3.5% of respondents.
Graph 4.2d: Respondent-assessed brother’s or sister’s interest in
politics. Percentages of response categories by location
Narrative
The overall mean of the variable is 2.91 and the standard deviation is
0.92. This varies by location, with the lowest mean value / highest
interest at Odense East (Denmark) with 2.53, and the highest mean
value / lowest interest Jauna Forstadte (Latvia) with 3.32.
There are no clear clusters of locations. The three locations with the
highest mean value / lowest interest in politics are Jauna Forstadte in
Latvia, and Sopron and Ozd in Hungary. The three locations with the
lowest mean value / highest interest in politics are Odense Centre and
Odense East in Denmark and Bremen in western Germany.
Portugal had the largest differences between locations (0.48). Latvia
had the second largest difference (0.26) and the UK third largest
(0.25). eastern Germany, Spain, Croatia, Denmark and Hungary had
differences smaller than 0.10.
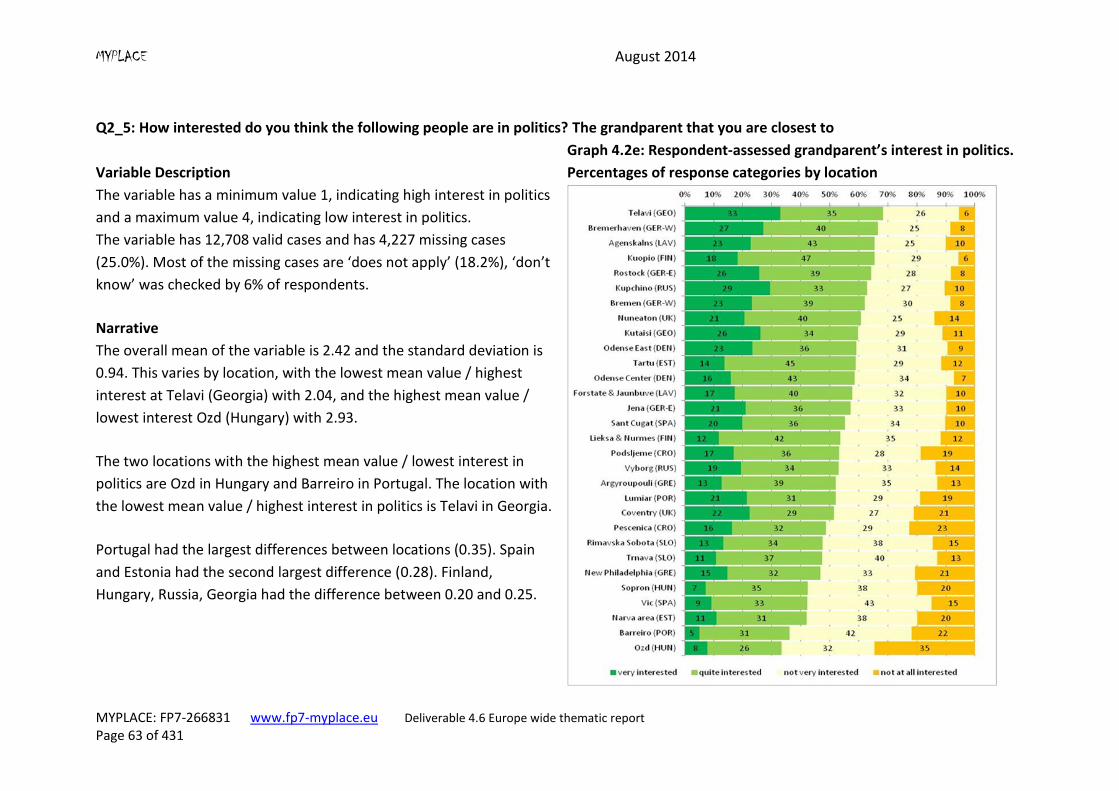
MYPLACE August 2014
MYPLACE: FP7-266831 www.fp7-myplace.eu Deliverable 4.6 Europe wide thematic report Page 63 of 431
Q2_5: How interested do you think the following people are in politics? The grandparent that you are closest to
Variable Description
The variable has a minimum value 1, indicating high interest in politics
and a maximum value 4, indicating low interest in politics.
The variable has 12,708 valid cases and has 4,227 missing cases
(25.0%). Most of the missing cases are ‘does not apply’ (18.2%), ‘don’t
know’ was checked by 6% of respondents.
Graph 4.2e: Respondent-assessed grandparent’s interest in politics.
Percentages of response categories by location
Narrative
The overall mean of the variable is 2.42 and the standard deviation is
0.94. This varies by location, with the lowest mean value / highest
interest at Telavi (Georgia) with 2.04, and the highest mean value /
lowest interest Ozd (Hungary) with 2.93.
The two locations with the highest mean value / lowest interest in
politics are Ozd in Hungary and Barreiro in Portugal. The location with
the lowest mean value / highest interest in politics is Telavi in Georgia.
Portugal had the largest differences between locations (0.35). Spain
and Estonia had the second largest difference (0.28). Finland,
Hungary, Russia, Georgia had the difference between 0.20 and 0.25.
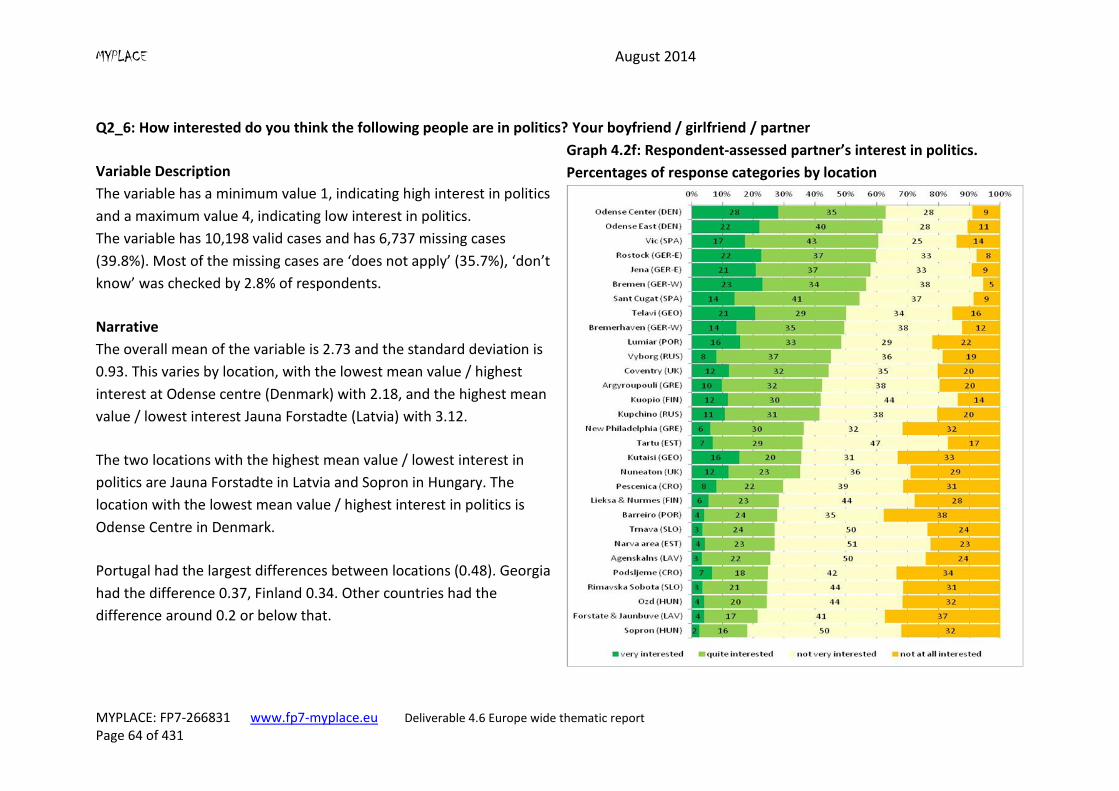
MYPLACE August 2014
MYPLACE: FP7-266831 www.fp7-myplace.eu Deliverable 4.6 Europe wide thematic report Page 64 of 431
Q2_6: How interested do you think the following people are in politics? Your boyfriend / girlfriend / partner
Variable Description
The variable has a minimum value 1, indicating high interest in politics
and a maximum value 4, indicating low interest in politics.
The variable has 10,198 valid cases and has 6,737 missing cases
(39.8%). Most of the missing cases are ‘does not apply’ (35.7%), ‘don’t
know’ was checked by 2.8% of respondents.
Graph 4.2f: Respondent-assessed partner’s interest in politics.
Percentages of response categories by location
Narrative
The overall mean of the variable is 2.73 and the standard deviation is
0.93. This varies by location, with the lowest mean value / highest
interest at Odense centre (Denmark) with 2.18, and the highest mean
value / lowest interest Jauna Forstadte (Latvia) with 3.12.
The two locations with the highest mean value / lowest interest in
politics are Jauna Forstadte in Latvia and Sopron in Hungary. The
location with the lowest mean value / highest interest in politics is
Odense Centre in Denmark.
Portugal had the largest differences between locations (0.48). Georgia
had the difference 0.37, Finland 0.34. Other countries had the
difference around 0.2 or below that.
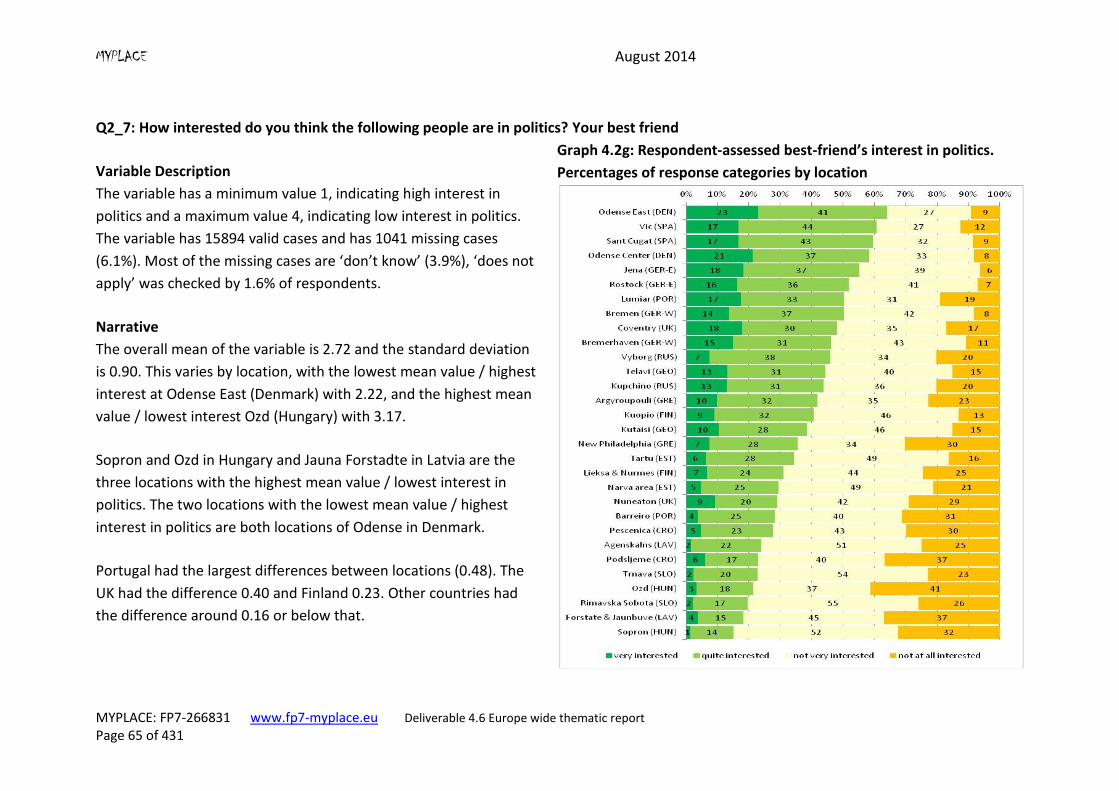
MYPLACE August 2014
MYPLACE: FP7-266831 www.fp7-myplace.eu Deliverable 4.6 Europe wide thematic report Page 65 of 431
Q2_7: How interested do you think the following people are in politics? Your best friend
Variable Description
The variable has a minimum value 1, indicating high interest in
politics and a maximum value 4, indicating low interest in politics.
The variable has 15894 valid cases and has 1041 missing cases
(6.1%). Most of the missing cases are ‘don’t know’ (3.9%), ‘does not
apply’ was checked by 1.6% of respondents.
Graph 4.2g: Respondent-assessed best-friend’s interest in politics.
Percentages of response categories by location
Narrative
The overall mean of the variable is 2.72 and the standard deviation
is 0.90. This varies by location, with the lowest mean value / highest
interest at Odense East (Denmark) with 2.22, and the highest mean
value / lowest interest Ozd (Hungary) with 3.17.
Sopron and Ozd in Hungary and Jauna Forstadte in Latvia are the
three locations with the highest mean value / lowest interest in
politics. The two locations with the lowest mean value / highest
interest in politics are both locations of Odense in Denmark.
Portugal had the largest differences between locations (0.48). The
UK had the difference 0.40 and Finland 0.23. Other countries had
the difference around 0.16 or below that.
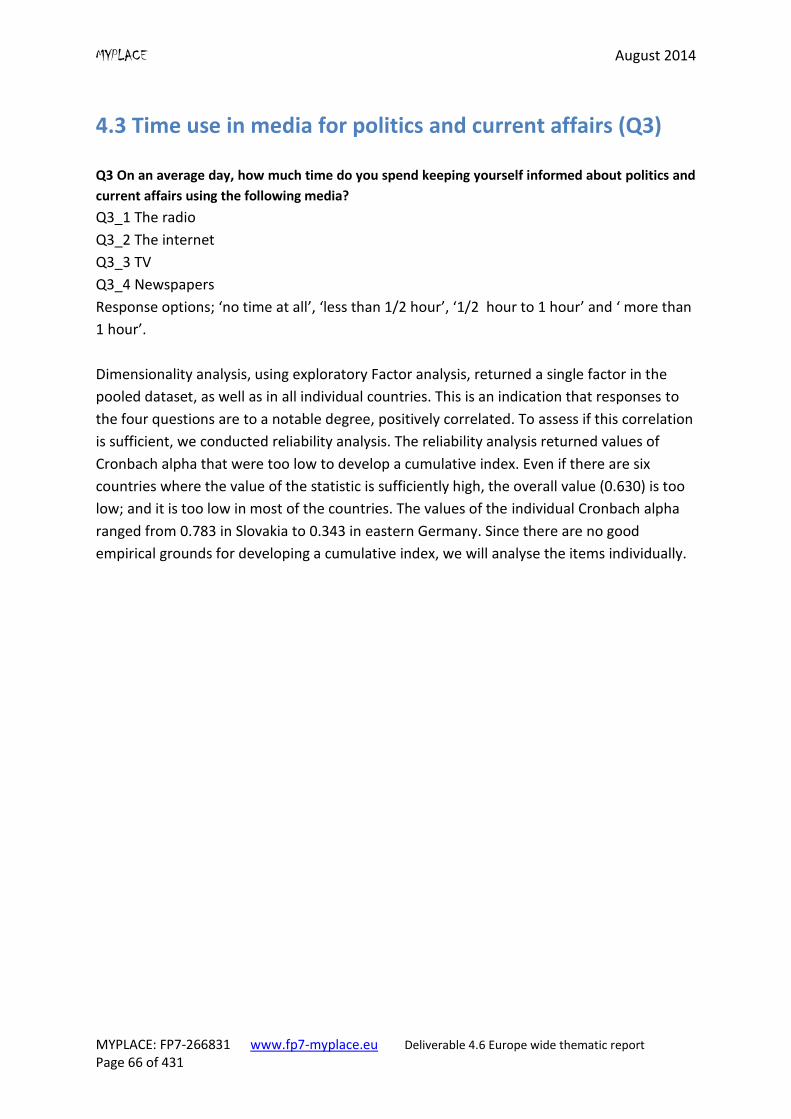
MYPLACE August 2014
MYPLACE: FP7-266831 www.fp7-myplace.eu Deliverable 4.6 Europe wide thematic report Page 66 of 431
4.3 Time use in media for politics and current affairs (Q3)
Q3 On an average day, how much time do you spend keeping yourself informed about politics and
current affairs using the following media?
Q3_1 The radio
Q3_2 The internet
Q3_3 TV
Q3_4 Newspapers
Response options; ‘no time at all’, ‘less than 1/2 hour’, ‘1/2 hour to 1 hour’ and ‘ more than
1 hour’.
Dimensionality analysis, using exploratory Factor analysis, returned a single factor in the
pooled dataset, as well as in all individual countries. This is an indication that responses to
the four questions are to a notable degree, positively correlated. To assess if this correlation
is sufficient, we conducted reliability analysis. The reliability analysis returned values of
Cronbach alpha that were too low to develop a cumulative index. Even if there are six
countries where the value of the statistic is sufficiently high, the overall value (0.630) is too
low; and it is too low in most of the countries. The values of the individual Cronbach alpha
ranged from 0.783 in Slovakia to 0.343 in eastern Germany. Since there are no good
empirical grounds for developing a cumulative index, we will analyse the items individually.
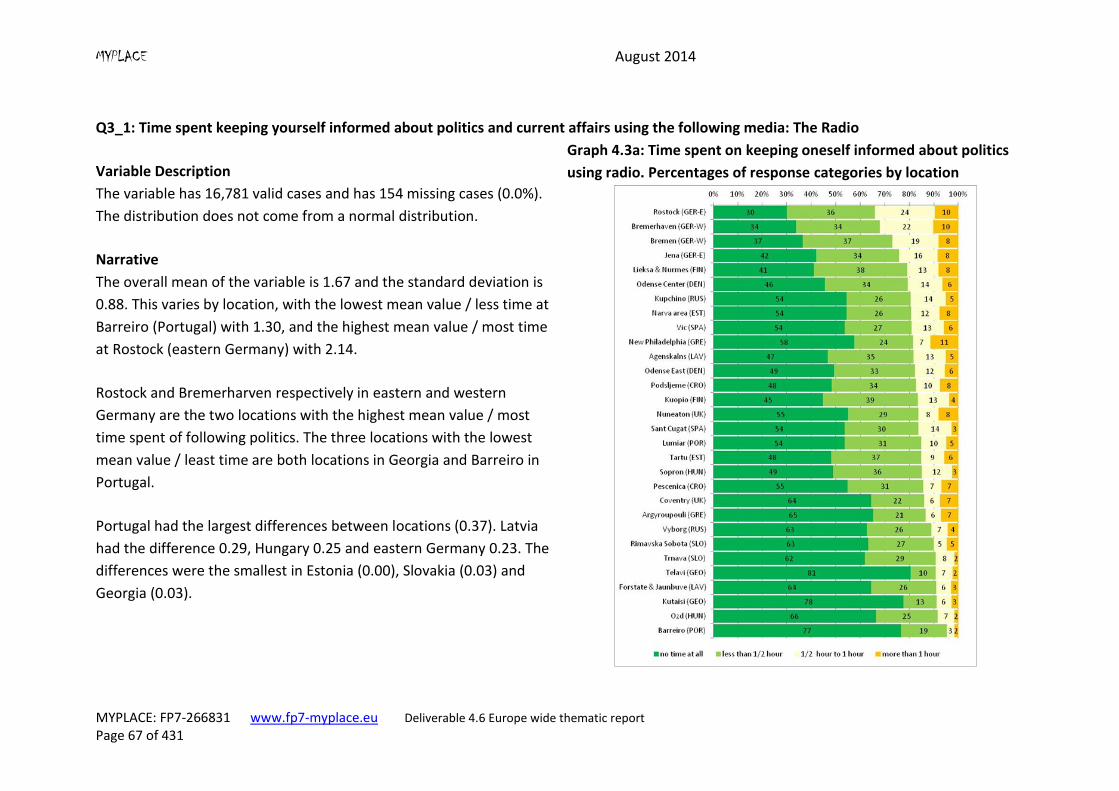
MYPLACE August 2014
MYPLACE: FP7-266831 www.fp7-myplace.eu Deliverable 4.6 Europe wide thematic report Page 67 of 431
Q3_1: Time spent keeping yourself informed about politics and current affairs using the following media: The Radio
Variable Description
The variable has 16,781 valid cases and has 154 missing cases (0.0%).
The distribution does not come from a normal distribution.
Graph 4.3a: Time spent on keeping oneself informed about politics
using radio. Percentages of response categories by location
Narrative
The overall mean of the variable is 1.67 and the standard deviation is
0.88. This varies by location, with the lowest mean value / less time at
Barreiro (Portugal) with 1.30, and the highest mean value / most time
at Rostock (eastern Germany) with 2.14.
Rostock and Bremerharven respectively in eastern and western
Germany are the two locations with the highest mean value / most
time spent of following politics. The three locations with the lowest
mean value / least time are both locations in Georgia and Barreiro in
Portugal.
Portugal had the largest differences between locations (0.37). Latvia
had the difference 0.29, Hungary 0.25 and eastern Germany 0.23. The
differences were the smallest in Estonia (0.00), Slovakia (0.03) and
Georgia (0.03).
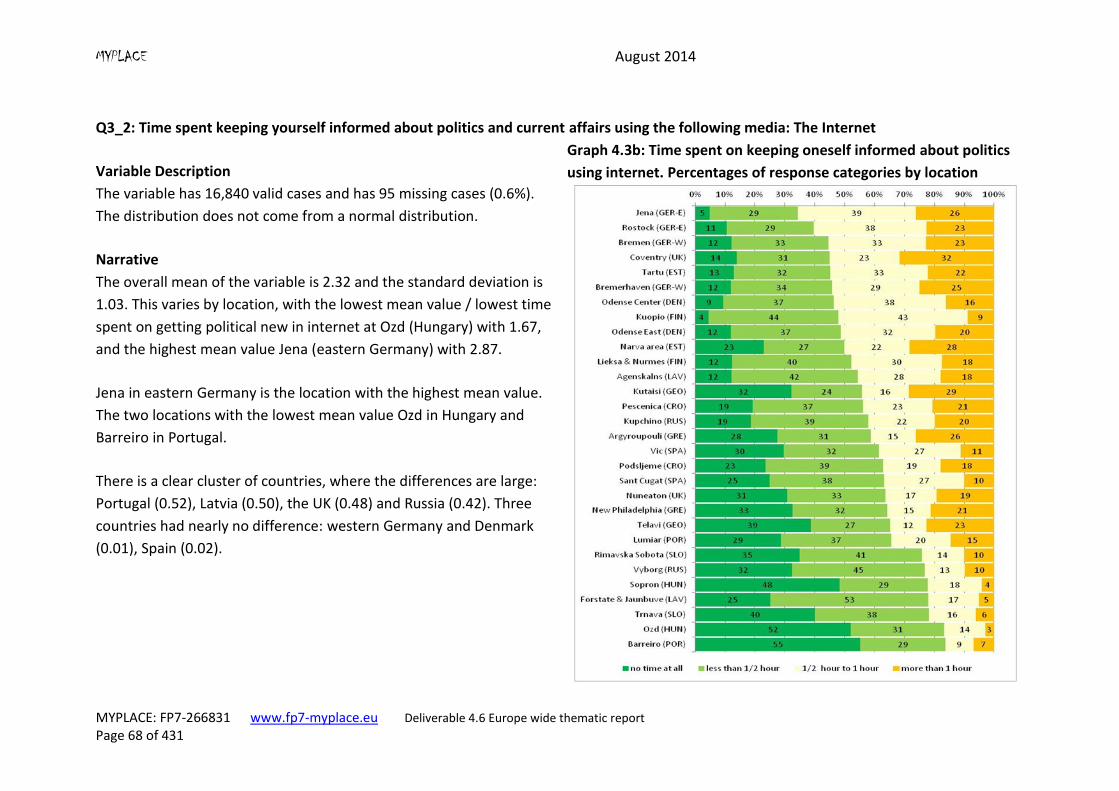
MYPLACE August 2014
MYPLACE: FP7-266831 www.fp7-myplace.eu Deliverable 4.6 Europe wide thematic report Page 68 of 431
Q3_2: Time spent keeping yourself informed about politics and current affairs using the following media: The Internet
Variable Description
The variable has 16,840 valid cases and has 95 missing cases (0.6%).
The distribution does not come from a normal distribution.
Graph 4.3b: Time spent on keeping oneself informed about politics
using internet. Percentages of response categories by location
Narrative
The overall mean of the variable is 2.32 and the standard deviation is
1.03. This varies by location, with the lowest mean value / lowest time
spent on getting political new in internet at Ozd (Hungary) with 1.67,
and the highest mean value Jena (eastern Germany) with 2.87.
Jena in eastern Germany is the location with the highest mean value.
The two locations with the lowest mean value Ozd in Hungary and
Barreiro in Portugal.
There is a clear cluster of countries, where the differences are large:
Portugal (0.52), Latvia (0.50), the UK (0.48) and Russia (0.42). Three
countries had nearly no difference: western Germany and Denmark
(0.01), Spain (0.02).
MYPLACE August 2014
MYPLACE: FP7-266831 www.fp7-myplace.eu Deliverable 4.6 Europe wide thematic report Page 69 of 431
Q3_3: Time spent keeping yourself informed about politics and current affairs using the following media: TV
Variable Description
The variable has 16,829 valid cases and has 106 missing cases (0.9%)
Graph 4.3c: Time spent on keeping oneself informed about politics
using TV. Percentages of response categories by location
Narrative
The overall mean of the variable is 2.27 and the standard deviation is
0.95. This varies by location, with the lowest mean value / least time
spent on following political news in TV at Jena (eastern Germany)
with 1.85, and the highest mean value at Telavi in Georgia with 2.85.
Both locations in Georgia are the two locations with the highest mean
value. Jena in eastern Germany is the location with the lowest mean
value.
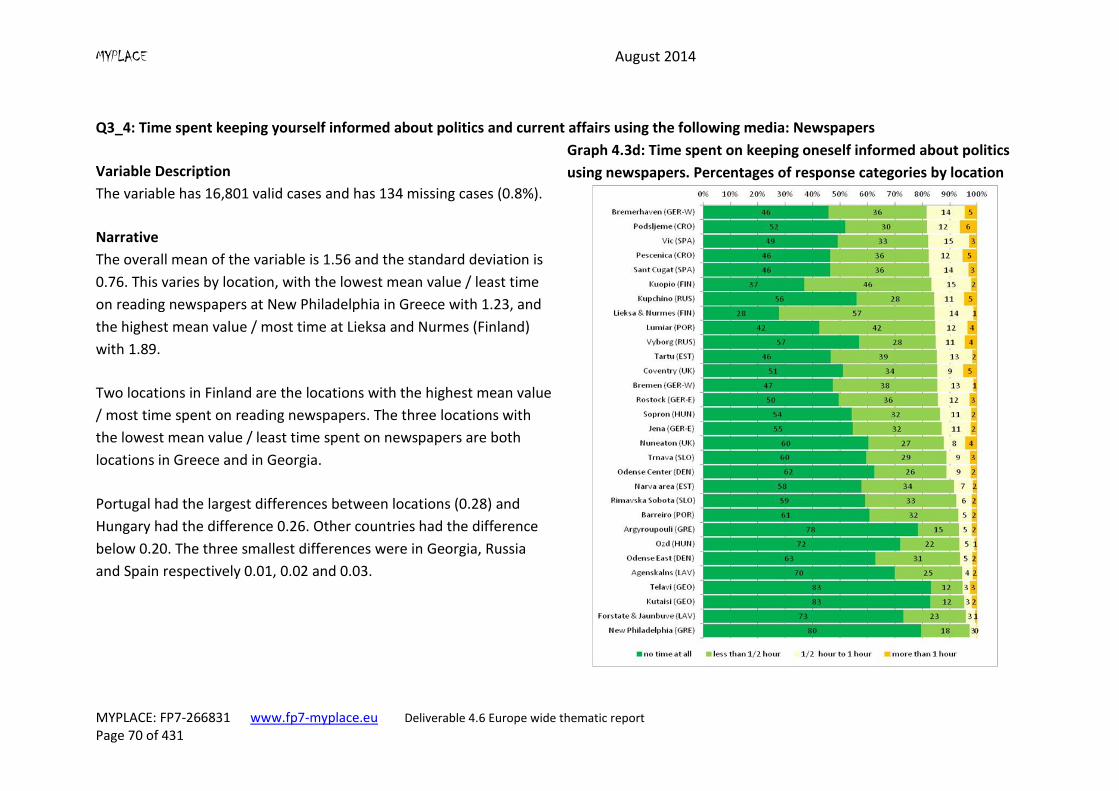
MYPLACE August 2014
MYPLACE: FP7-266831 www.fp7-myplace.eu Deliverable 4.6 Europe wide thematic report Page 70 of 431
Q3_4: Time spent keeping yourself informed about politics and current affairs using the following media: Newspapers
Variable Description
The variable has 16,801 valid cases and has 134 missing cases (0.8%).
Graph 4.3d: Time spent on keeping oneself informed about politics
using newspapers. Percentages of response categories by location
Narrative
The overall mean of the variable is 1.56 and the standard deviation is
0.76. This varies by location, with the lowest mean value / least time
on reading newspapers at New Philadelphia in Greece with 1.23, and
the highest mean value / most time at Lieksa and Nurmes (Finland)
with 1.89.
Two locations in Finland are the locations with the highest mean value
/ most time spent on reading newspapers. The three locations with
the lowest mean value / least time spent on newspapers are both
locations in Greece and in Georgia.
Portugal had the largest differences between locations (0.28) and
Hungary had the difference 0.26. Other countries had the difference
below 0.20. The three smallest differences were in Georgia, Russia
and Spain respectively 0.01, 0.02 and 0.03.
MYPLACE August 2014
MYPLACE: FP7-266831 www.fp7-myplace.eu Deliverable 4.6 Europe wide thematic report Page 71 of 431
4.4 Discussion on political issues with key individuals (Q4)
Question 4 asked the respondent ‘How often do you discuss political issues when you get
together with the following people?’ for a range of key individuals;
Q4_1 Your father
Q4_2 Your mother
Q4_3 The brother or sister that you are closest to
Q4_4 The grandparent that you are closest to
Q4_5 Your boyfriend / girlfriend / partner
Q4_6 Your best friend
There were five response options; ‘always’, ‘often’, ‘sometimes’, ‘rarely’ and ‘never.’
Responses to these questions are significantly influenced by the composition of
respondent’s household. The table below presents percentage of missing values, per
question, across countries where one can see that in some combinations, approximately
half of the sample has not checked an answer to a question. Building a cumulative index
would either require replacement of missing values or result in a composite variable, which
has missing values for most cases. Option one would require a general strategy which would
outline how to replace missing values, which has not been adopted for MYPLACE deliverable
D4.6. Option two is not plausible since it would probably lead to biased estimates because
the absence of certain family members is not completely random but to some significant
extent systematic and related to household’s socio-economic background. Since either
option is not a plausible solution, we decided to analyse the variables individually.
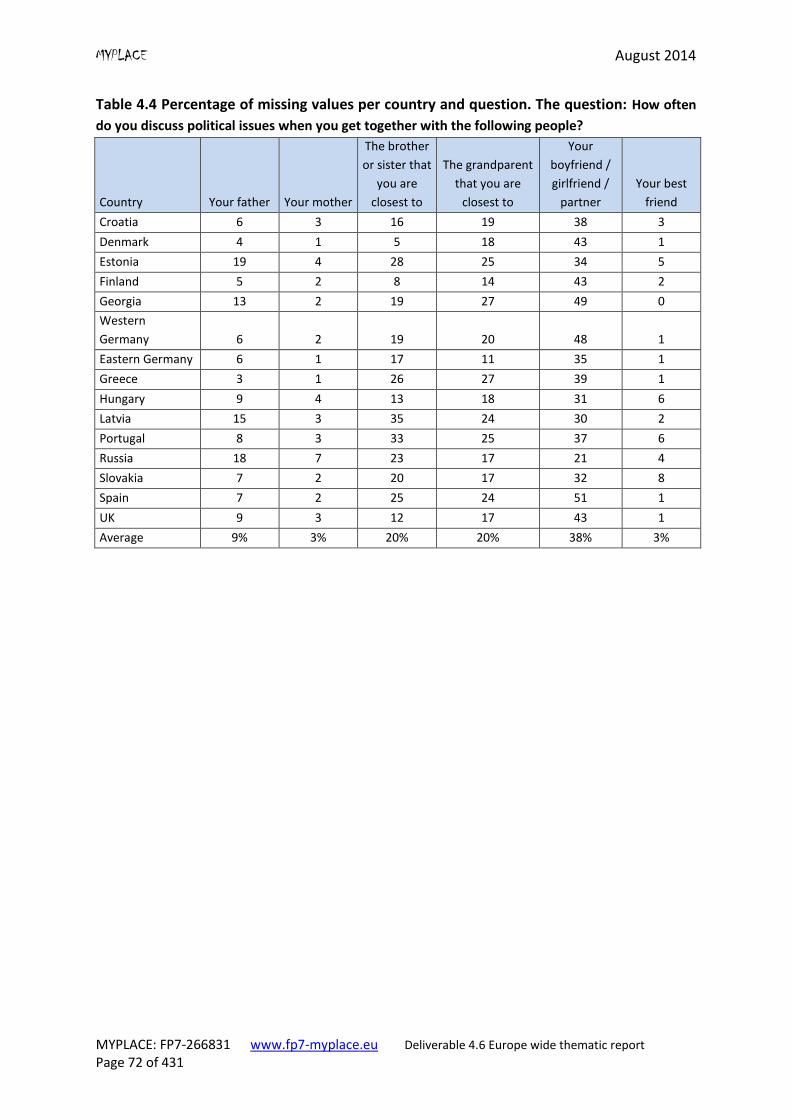
MYPLACE August 2014
MYPLACE: FP7-266831 www.fp7-myplace.eu Deliverable 4.6 Europe wide thematic report Page 72 of 431
Table 4.4 Percentage of missing values per country and question. The question: How often
do you discuss political issues when you get together with the following people?
Country Your father Your mother
The brother
or sister that
you are
closest to
The grandparent
that you are
closest to
Your
boyfriend /
girlfriend /
partner
Your best
friend
Croatia 6 3 16 19 38 3
Denmark 4 1 5 18 43 1
Estonia 19 4 28 25 34 5
Finland 5 2 8 14 43 2
Georgia 13 2 19 27 49 0
Western
Germany 6 2 19 20 48 1
Eastern Germany 6 1 17 11 35 1
Greece 3 1 26 27 39 1
Hungary 9 4 13 18 31 6
Latvia 15 3 35 24 30 2
Portugal 8 3 33 25 37 6
Russia 18 7 23 17 21 4
Slovakia 7 2 20 17 32 8
Spain 7 2 25 24 51 1
UK 9 3 12 17 43 1
Average 9% 3% 20% 20% 38% 3%
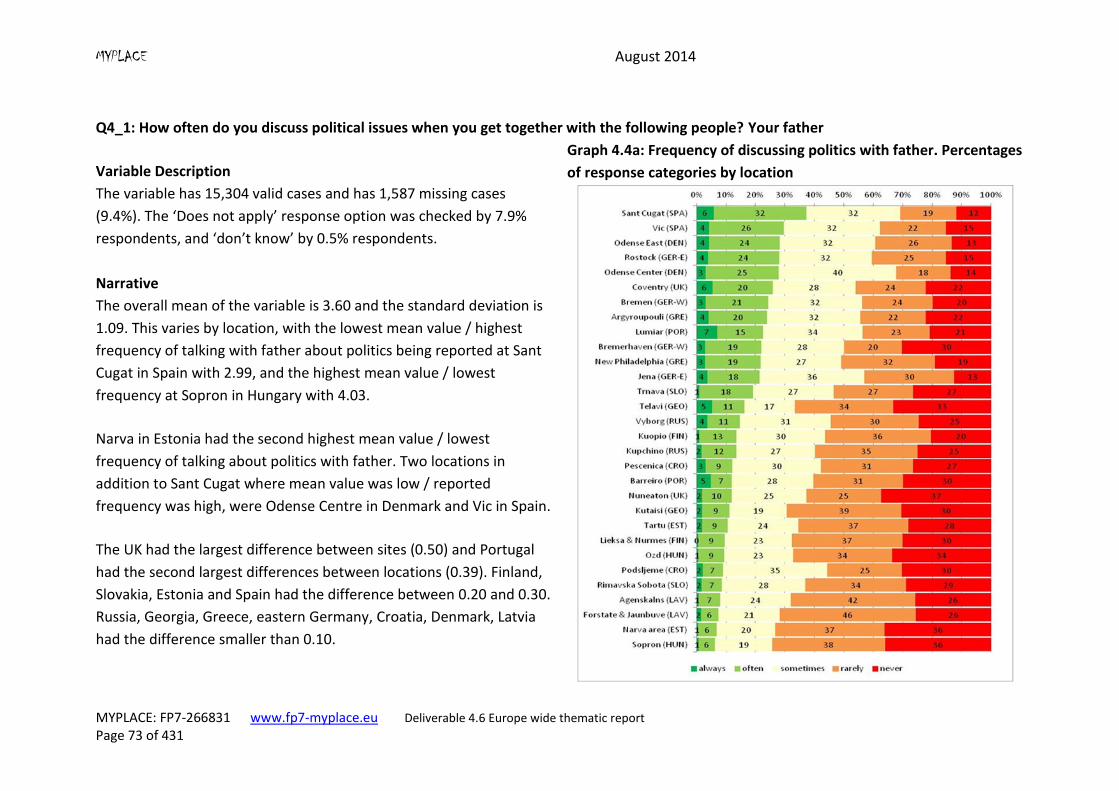
MYPLACE August 2014
MYPLACE: FP7-266831 www.fp7-myplace.eu Deliverable 4.6 Europe wide thematic report Page 73 of 431
Q4_1: How often do you discuss political issues when you get together with the following people? Your father
Variable Description
The variable has 15,304 valid cases and has 1,587 missing cases
(9.4%). The ‘Does not apply’ response option was checked by 7.9%
respondents, and ‘don’t know’ by 0.5% respondents.
Graph 4.4a: Frequency of discussing politics with father. Percentages
of response categories by location
Narrative
The overall mean of the variable is 3.60 and the standard deviation is
1.09. This varies by location, with the lowest mean value / highest
frequency of talking with father about politics being reported at Sant
Cugat in Spain with 2.99, and the highest mean value / lowest
frequency at Sopron in Hungary with 4.03.
Narva in Estonia had the second highest mean value / lowest
frequency of talking about politics with father. Two locations in
addition to Sant Cugat where mean value was low / reported
frequency was high, were Odense Centre in Denmark and Vic in Spain.
The UK had the largest difference between sites (0.50) and Portugal
had the second largest differences between locations (0.39). Finland,
Slovakia, Estonia and Spain had the difference between 0.20 and 0.30.
Russia, Georgia, Greece, eastern Germany, Croatia, Denmark, Latvia
had the difference smaller than 0.10.
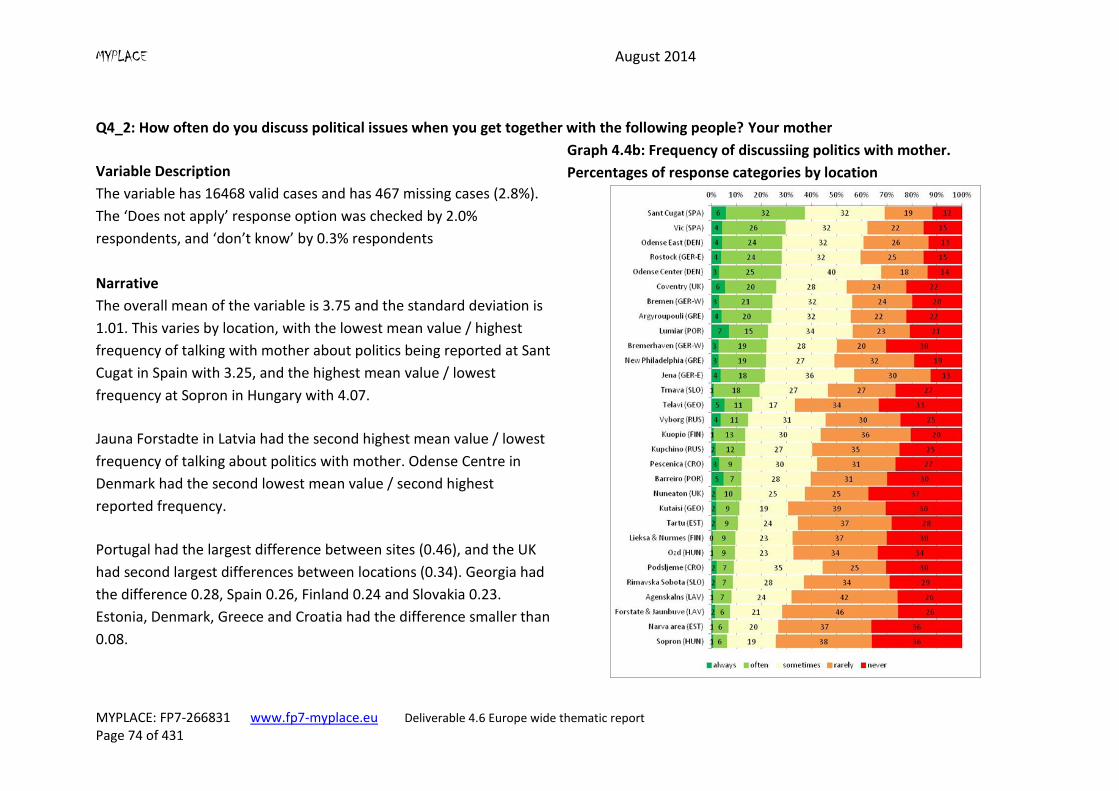
MYPLACE August 2014
MYPLACE: FP7-266831 www.fp7-myplace.eu Deliverable 4.6 Europe wide thematic report Page 74 of 431
Q4_2: How often do you discuss political issues when you get together with the following people? Your mother
Variable Description
The variable has 16468 valid cases and has 467 missing cases (2.8%).
The ‘Does not apply’ response option was checked by 2.0%
respondents, and ‘don’t know’ by 0.3% respondents
Graph 4.4b: Frequency of discussiing politics with mother.
Percentages of response categories by location
Narrative
The overall mean of the variable is 3.75 and the standard deviation is
1.01. This varies by location, with the lowest mean value / highest
frequency of talking with mother about politics being reported at Sant
Cugat in Spain with 3.25, and the highest mean value / lowest
frequency at Sopron in Hungary with 4.07.
Jauna Forstadte in Latvia had the second highest mean value / lowest
frequency of talking about politics with mother. Odense Centre in
Denmark had the second lowest mean value / second highest
reported frequency.
Portugal had the largest difference between sites (0.46), and the UK
had second largest differences between locations (0.34). Georgia had
the difference 0.28, Spain 0.26, Finland 0.24 and Slovakia 0.23.
Estonia, Denmark, Greece and Croatia had the difference smaller than
0.08.
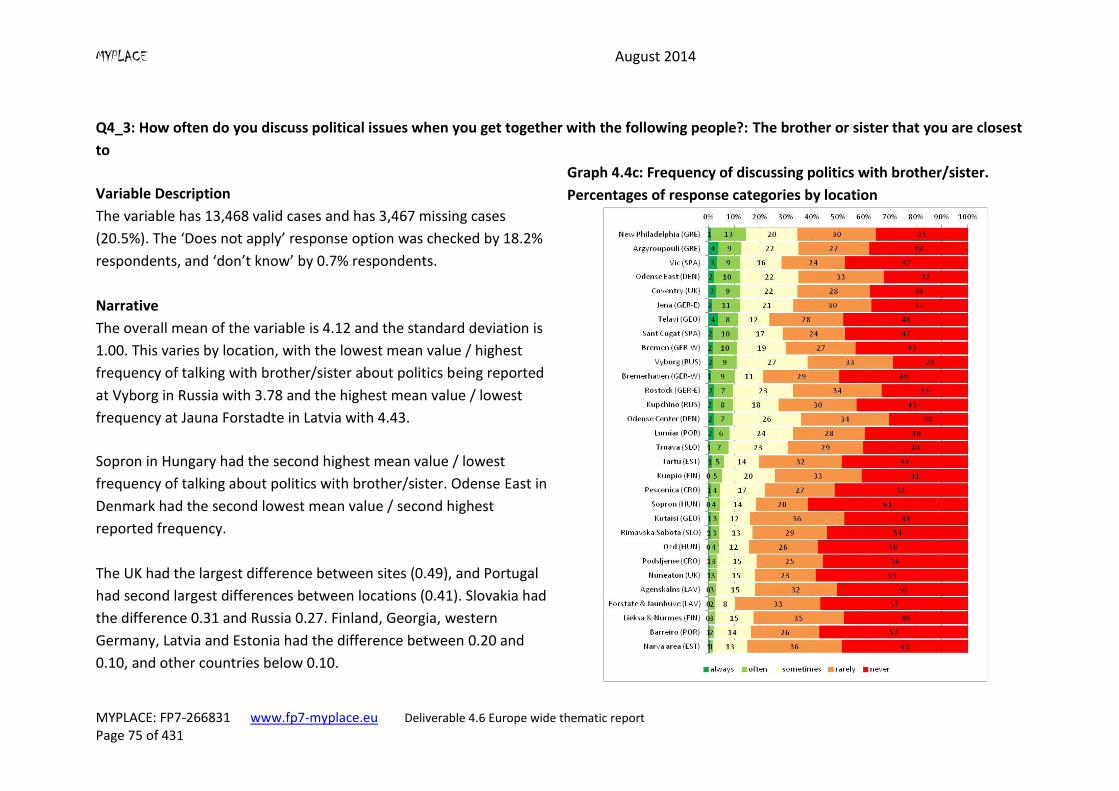
MYPLACE August 2014
MYPLACE: FP7-266831 www.fp7-myplace.eu Deliverable 4.6 Europe wide thematic report Page 75 of 431
Q4_3: How often do you discuss political issues when you get together with the following people?: The brother or sister that you are closest
to
Variable Description
The variable has 13,468 valid cases and has 3,467 missing cases
(20.5%). The ‘Does not apply’ response option was checked by 18.2%
respondents, and ‘don’t know’ by 0.7% respondents.
Graph 4.4c: Frequency of discussing politics with brother/sister.
Percentages of response categories by location
Narrative
The overall mean of the variable is 4.12 and the standard deviation is
1.00. This varies by location, with the lowest mean value / highest
frequency of talking with brother/sister about politics being reported
at Vyborg in Russia with 3.78 and the highest mean value / lowest
frequency at Jauna Forstadte in Latvia with 4.43.
Sopron in Hungary had the second highest mean value / lowest
frequency of talking about politics with brother/sister. Odense East in
Denmark had the second lowest mean value / second highest
reported frequency.
The UK had the largest difference between sites (0.49), and Portugal
had second largest differences between locations (0.41). Slovakia had
the difference 0.31 and Russia 0.27. Finland, Georgia, western
Germany, Latvia and Estonia had the difference between 0.20 and
0.10, and other countries below 0.10.
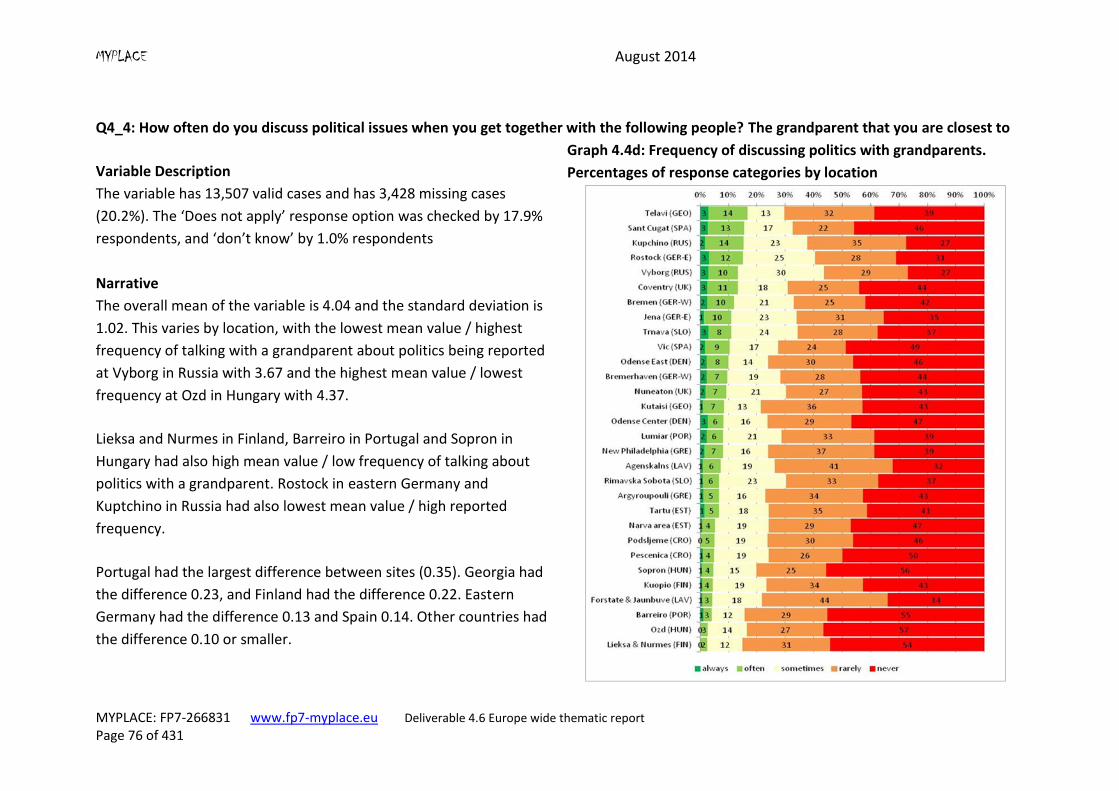
MYPLACE August 2014
MYPLACE: FP7-266831 www.fp7-myplace.eu Deliverable 4.6 Europe wide thematic report Page 76 of 431
Q4_4: How often do you discuss political issues when you get together with the following people? The grandparent that you are closest to
Variable Description
The variable has 13,507 valid cases and has 3,428 missing cases
(20.2%). The ‘Does not apply’ response option was checked by 17.9%
respondents, and ‘don’t know’ by 1.0% respondents
Graph 4.4d: Frequency of discussing politics with grandparents.
Percentages of response categories by location
Narrative
The overall mean of the variable is 4.04 and the standard deviation is
1.02. This varies by location, with the lowest mean value / highest
frequency of talking with a grandparent about politics being reported
at Vyborg in Russia with 3.67 and the highest mean value / lowest
frequency at Ozd in Hungary with 4.37.
Lieksa and Nurmes in Finland, Barreiro in Portugal and Sopron in
Hungary had also high mean value / low frequency of talking about
politics with a grandparent. Rostock in eastern Germany and
Kuptchino in Russia had also lowest mean value / high reported
frequency.
Portugal had the largest difference between sites (0.35). Georgia had
the difference 0.23, and Finland had the difference 0.22. Eastern
Germany had the difference 0.13 and Spain 0.14. Other countries had
the difference 0.10 or smaller.
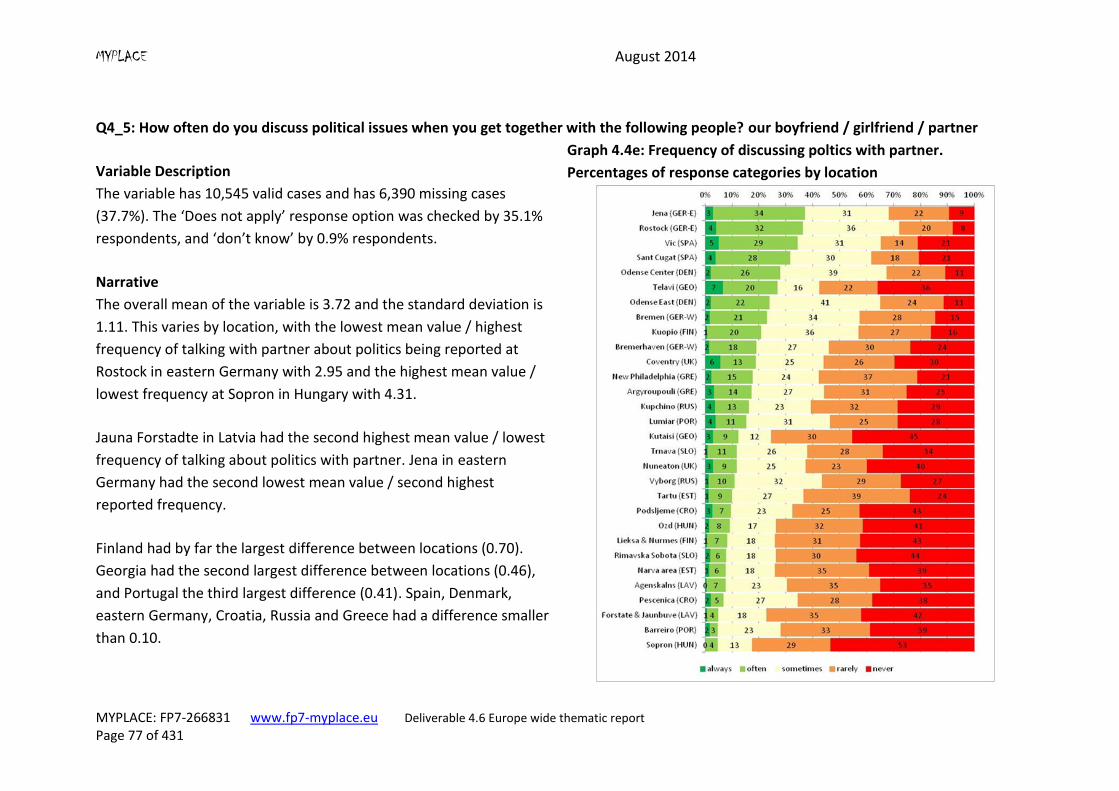
MYPLACE August 2014
MYPLACE: FP7-266831 www.fp7-myplace.eu Deliverable 4.6 Europe wide thematic report Page 77 of 431
Q4_5: How often do you discuss political issues when you get together with the following people? our boyfriend / girlfriend / partner
Variable Description
The variable has 10,545 valid cases and has 6,390 missing cases
(37.7%). The ‘Does not apply’ response option was checked by 35.1%
respondents, and ‘don’t know’ by 0.9% respondents.
Graph 4.4e: Frequency of discussing poltics with partner.
Percentages of response categories by location
Narrative
The overall mean of the variable is 3.72 and the standard deviation is
1.11. This varies by location, with the lowest mean value / highest
frequency of talking with partner about politics being reported at
Rostock in eastern Germany with 2.95 and the highest mean value /
lowest frequency at Sopron in Hungary with 4.31.
Jauna Forstadte in Latvia had the second highest mean value / lowest
frequency of talking about politics with partner. Jena in eastern
Germany had the second lowest mean value / second highest
reported frequency.
Finland had by far the largest difference between locations (0.70).
Georgia had the second largest difference between locations (0.46),
and Portugal the third largest difference (0.41). Spain, Denmark,
eastern Germany, Croatia, Russia and Greece had a difference smaller
than 0.10.
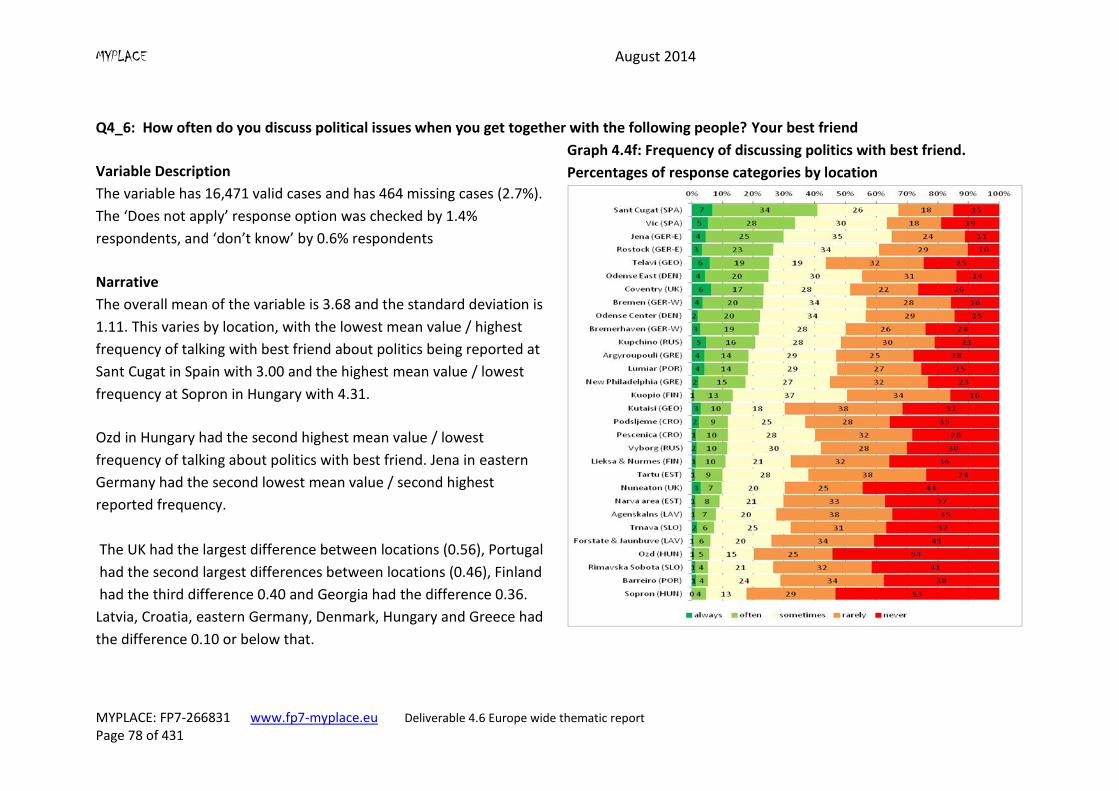
MYPLACE August 2014
MYPLACE: FP7-266831 www.fp7-myplace.eu Deliverable 4.6 Europe wide thematic report Page 78 of 431
Q4_6: How often do you discuss political issues when you get together with the following people? Your best friend
Variable Description
The variable has 16,471 valid cases and has 464 missing cases (2.7%).
The ‘Does not apply’ response option was checked by 1.4%
respondents, and ‘don’t know’ by 0.6% respondents
Graph 4.4f: Frequency of discussing politics with best friend.
Percentages of response categories by location
Narrative
The overall mean of the variable is 3.68 and the standard deviation is
1.11. This varies by location, with the lowest mean value / highest
frequency of talking with best friend about politics being reported at
Sant Cugat in Spain with 3.00 and the highest mean value / lowest
frequency at Sopron in Hungary with 4.31.
Ozd in Hungary had the second highest mean value / lowest
frequency of talking about politics with best friend. Jena in eastern
Germany had the second lowest mean value / second highest
reported frequency.
The UK had the largest difference between locations (0.56), Portugal
had the second largest differences between locations (0.46), Finland
had the third difference 0.40 and Georgia had the difference 0.36.
Latvia, Croatia, eastern Germany, Denmark, Hungary and Greece had
the difference 0.10 or below that.
MYPLACE August 2014
MYPLACE: FP7-266831 www.fp7-myplace.eu Deliverable 4.6 Europe wide thematic report Page 79 of 431
4.5 Interest in contemporary issues (Q5)
The following series of questions were asked using a 11 point scale (0 not interested … 10
very interested) To what extent are you personally interested in...?
Q5_1 immigration
Q5_2 LGBT rights (lesbian, gay, bisexual, and transgender)
Q5_3 the economy
Q5_4 national security
Q5_5 the environment
Q5_6 the European Union
Q5_7 general employment prospects
Q5_8 housing
Q5_9 local issues
Q5_10 women’s rights
A factor analysis identified that questions Q5_3 to Q5_10 could be used to form a good one-
dimensional cumulative scale. The Cronbach alpha was 0.887. Across countries, the value
varied from 0.713 in eastern Germany to 0.922 in Finland.
Therefore questions on Q5_1 immigration, and Q5_2 LGBT rights (lesbian, gay, bisexual,
and transgender) are analyses separately.
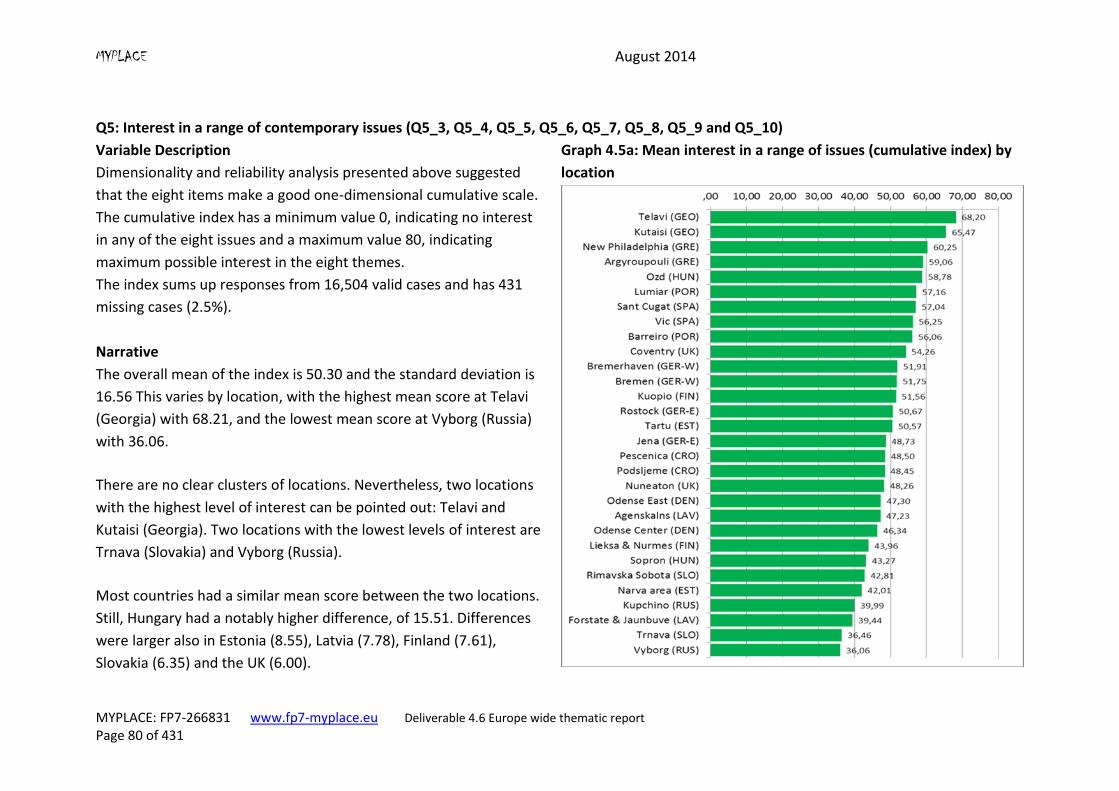
MYPLACE August 2014
MYPLACE: FP7-266831 www.fp7-myplace.eu Deliverable 4.6 Europe wide thematic report Page 80 of 431
Q5: Interest in a range of contemporary issues (Q5_3, Q5_4, Q5_5, Q5_6, Q5_7, Q5_8, Q5_9 and Q5_10)
Variable Description
Dimensionality and reliability analysis presented above suggested
that the eight items make a good one-dimensional cumulative scale.
The cumulative index has a minimum value 0, indicating no interest
in any of the eight issues and a maximum value 80, indicating
maximum possible interest in the eight themes.
The index sums up responses from 16,504 valid cases and has 431
missing cases (2.5%).
Graph 4.5a: Mean interest in a range of issues (cumulative index) by
location
Narrative
The overall mean of the index is 50.30 and the standard deviation is
16.56 This varies by location, with the highest mean score at Telavi
(Georgia) with 68.21, and the lowest mean score at Vyborg (Russia)
with 36.06.
There are no clear clusters of locations. Nevertheless, two locations
with the highest level of interest can be pointed out: Telavi and
Kutaisi (Georgia). Two locations with the lowest levels of interest are
Trnava (Slovakia) and Vyborg (Russia).
Most countries had a similar mean score between the two locations.
Still, Hungary had a notably higher difference, of 15.51. Differences
were larger also in Estonia (8.55), Latvia (7.78), Finland (7.61),
Slovakia (6.35) and the UK (6.00).
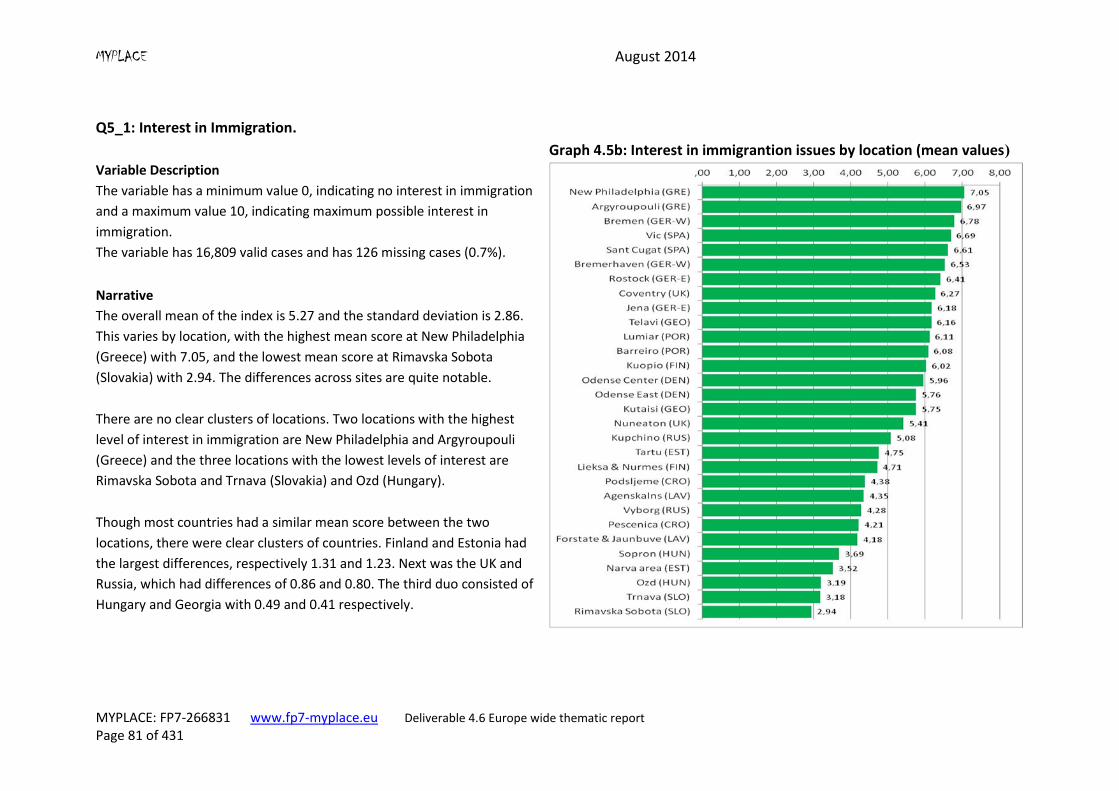
MYPLACE August 2014
MYPLACE: FP7-266831 www.fp7-myplace.eu Deliverable 4.6 Europe wide thematic report Page 81 of 431
Q5_1: Interest in Immigration.
Variable Description
The variable has a minimum value 0, indicating no interest in immigration
and a maximum value 10, indicating maximum possible interest in
immigration.
The variable has 16,809 valid cases and has 126 missing cases (0.7%).
Graph 4.5b: Interest in immigrantion issues by location (mean values)
Narrative
The overall mean of the index is 5.27 and the standard deviation is 2.86.
This varies by location, with the highest mean score at New Philadelphia
(Greece) with 7.05, and the lowest mean score at Rimavska Sobota
(Slovakia) with 2.94. The differences across sites are quite notable.
There are no clear clusters of locations. Two locations with the highest
level of interest in immigration are New Philadelphia and Argyroupouli
(Greece) and the three locations with the lowest levels of interest are
Rimavska Sobota and Trnava (Slovakia) and Ozd (Hungary).
Though most countries had a similar mean score between the two
locations, there were clear clusters of countries. Finland and Estonia had
the largest differences, respectively 1.31 and 1.23. Next was the UK and
Russia, which had differences of 0.86 and 0.80. The third duo consisted of
Hungary and Georgia with 0.49 and 0.41 respectively.
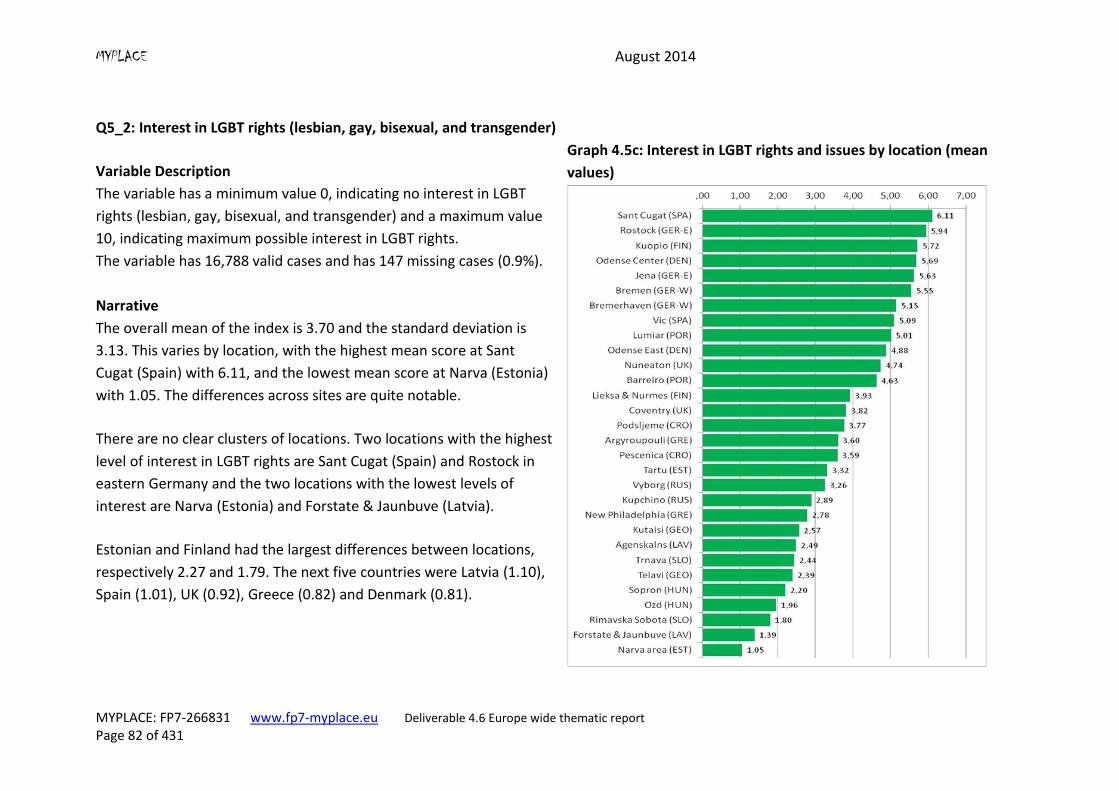
MYPLACE August 2014
MYPLACE: FP7-266831 www.fp7-myplace.eu Deliverable 4.6 Europe wide thematic report Page 82 of 431
Q5_2: Interest in LGBT rights (lesbian, gay, bisexual, and transgender)
Variable Description
The variable has a minimum value 0, indicating no interest in LGBT
rights (lesbian, gay, bisexual, and transgender) and a maximum value
10, indicating maximum possible interest in LGBT rights.
The variable has 16,788 valid cases and has 147 missing cases (0.9%).
Graph 4.5c: Interest in LGBT rights and issues by location (mean
values)
Narrative
The overall mean of the index is 3.70 and the standard deviation is
3.13. This varies by location, with the highest mean score at Sant
Cugat (Spain) with 6.11, and the lowest mean score at Narva (Estonia)
with 1.05. The differences across sites are quite notable.
There are no clear clusters of locations. Two locations with the highest
level of interest in LGBT rights are Sant Cugat (Spain) and Rostock in
eastern Germany and the two locations with the lowest levels of
interest are Narva (Estonia) and Forstate & Jaunbuve (Latvia).
Estonian and Finland had the largest differences between locations,
respectively 2.27 and 1.79. The next five countries were Latvia (1.10),
Spain (1.01), UK (0.92), Greece (0.82) and Denmark (0.81).
MYPLACE August 2014
MYPLACE: FP7-266831 www.fp7-myplace.eu Deliverable 4.6 Europe wide thematic report -DRAFT Page 83 of 431
4.6 Closeness of political views with family and peers (Q20)
Political socialisation is a process consisting of the acquisition of political values, principles
and habits that takes place in adolescence and the first stages of youth. Usually this process
is based on the transmission of political dispositions from one generation to the next. The
family plays a central role in the socialisation process, as it is the main agent in the
generational transmission of political values and views. This is the reason why family has
been identified by the classical studies on socialisation as the main socialisation agent
(Dawson and Prewitt 1969; Jaros 1973). However, some studies have pointed out that as
teenagers become older, the influence of family, even if it is still crucial, becomes weaker
and subsequently, peer influence becomes more and more important (Dostie-Goulet 2009).
Gordon and Taft (2011) consider that this peer influence is becoming more important,
particularly to politically active young people.
The MYPLACE survey contains a question that asks the respondent to place the closeness of
or the distance between their political views with different people on a scale of 0-10: the
father, the mother, the closest brother or sister, the closest grandparent, the boyfriend,
girlfriend or partner and the best friend. The question provides an opportunity to test the
influence of the environment on the construction of the political ideas and values.
Specifically we want to compare the effect of both family and peers on transmitting political
views.
To do so, we have created two variables indicating the declared closeness of political views
with family and with peers. For the family, the closeness indicator that we have taken into
account is the closeness with father, mother and the closest grandparent. We have left out
the closeness of political views with brothers and sisters because we have considered that
they can be in a middle way from family to peers. Brothers and sisters are obviously family
members but they potentially belong to the same generation as the respondent. In this
case, we want to contrast the role of family with the role of the peer group, so we preferred
to have a purer comparison. For the peers’ political views’ closeness, we have considered
the answers about the closeness with the best friend and with the partner (or
boyfriend/girlfriend). In order to minimise the missing responses, when the respondent
answers that he or she does not have a partner, the indicator considers only the best friend
answer. In this same way, in the cases where there are no grandparents, the answer about
the closeness to the mother’s political views is taken.
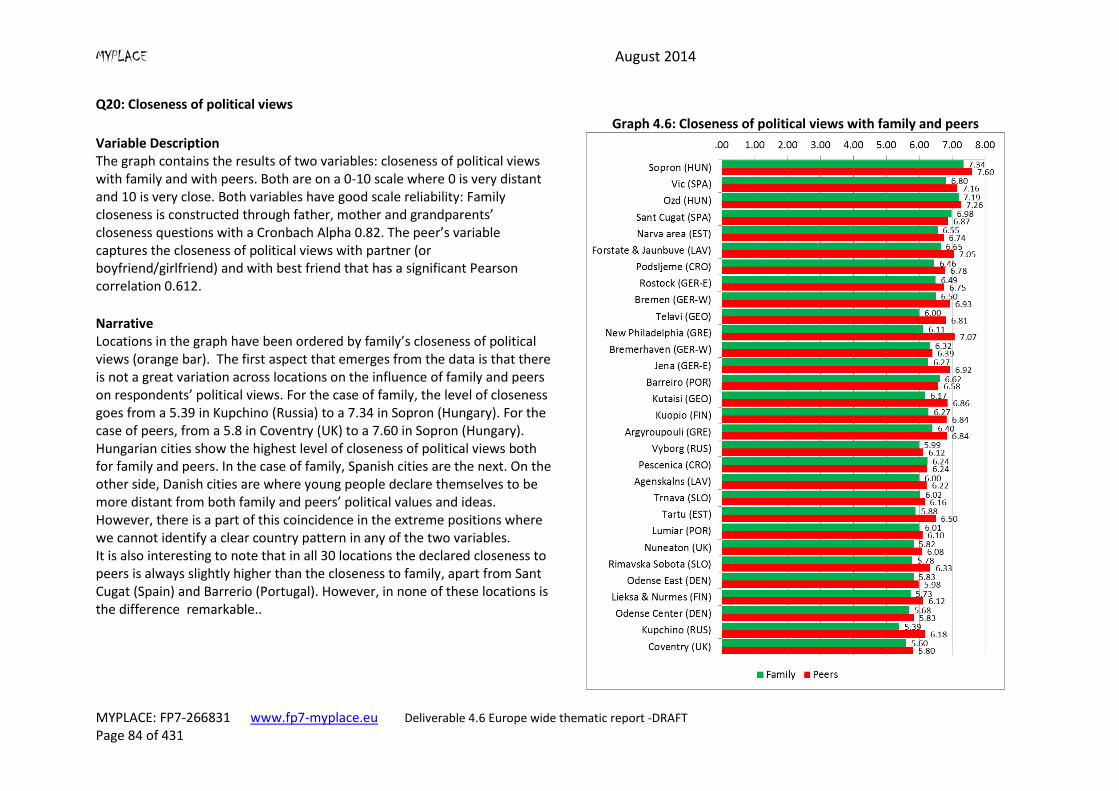
MYPLACE August 2014
MYPLACE: FP7-266831 www.fp7-myplace.eu Deliverable 4.6 Europe wide thematic report -DRAFT Page 84 of 431
Q20: Closeness of political views Variable Description The graph contains the results of two variables: closeness of political views with family and with peers. Both are on a 0-10 scale where 0 is very distant and 10 is very close. Both variables have good scale reliability: Family closeness is constructed through father, mother and grandparents’ closeness questions with a Cronbach Alpha 0.82. The peer’s variable captures the closeness of political views with partner (or boyfriend/girlfriend) and with best friend that has a significant Pearson correlation 0.612.
Graph 4.6: Closeness of political views with family and peers
Narrative Locations in the graph have been ordered by family’s closeness of political views (orange bar). The first aspect that emerges from the data is that there is not a great variation across locations on the influence of family and peers on respondents’ political views. For the case of family, the level of closeness goes from a 5.39 in Kupchino (Russia) to a 7.34 in Sopron (Hungary). For the case of peers, from a 5.8 in Coventry (UK) to a 7.60 in Sopron (Hungary). Hungarian cities show the highest level of closeness of political views both for family and peers. In the case of family, Spanish cities are the next. On the other side, Danish cities are where young people declare themselves to be more distant from both family and peers’ political values and ideas. However, there is a part of this coincidence in the extreme positions where we cannot identify a clear country pattern in any of the two variables. It is also interesting to note that in all 30 locations the declared closeness to peers is always slightly higher than the closeness to family, apart from Sant Cugat (Spain) and Barrerio (Portugal). However, in none of these locations is the difference remarkable..
MYPLACE August 2014
MYPLACE: FP7-266831 www.fp7-myplace.eu Deliverable 4.6 Europe wide thematic report
Page 85 of 431
4.7 Multi-level Modelling
4.7.1 Model 1: Political Interest
The purpose of multilevel modelling is to explain variation of political interest in terms of
individual and environmental factors.
For the purposes of this analysis, a cumulative index based on Q1 was developed. The main
reasons for selecting the Q1 are presented below:
The items are related to mental predispositions, which is what most of the authors in
the literature review considered to constitute the core of political interest.
The content of the question allows interpretation that it measures respondents’
general interest towards society, public affairs and politics.
Responses to the five items have no internal, hidden structure, suggesting that a
single cumulative index is an appropriate measure to be used.
The reliability measure of the index is sufficiently high.
Dependent variable
Our dependent variable is ‘political interest’, measured in the MYPLACE survey by the five
items question Q1 ‘How interested would you say you are in issues to do with …’ The scales
were reversed and as a result, values of the cumulative scale stretch from 0 (‘no interest in
politics) to 15 (‘maximum interest in politics’). To meet the needs of multilevel analysis, only
those respondents were selected which had valid values on all independent variables. The
number of such cases was 12,803 (75.6% of the total sample). The distribution of the index
is not normal, but is sufficiently close to normal distribution to undertake these analyses.
Multilevel modelling
The first question which needs to be answered before proceeding to multilevel modelling,
asks is the multilevel model plausible in the first place? Using a multilevel model is plausible
when the amount of variation at contextual level is significant. A common threshold is 10%.
If it is less than 10%, then a multilevel model would add little or nothing to our
understanding of what explains variation of the dependent variable.
Empty model
The first step in multilevel modelling is to estimate the amount of variation at contextual
level. For that, analysis of the empty model is conducted. Analysis of the empty model
shows that the share of variance at the level of research sites, accounts for 10% of variance
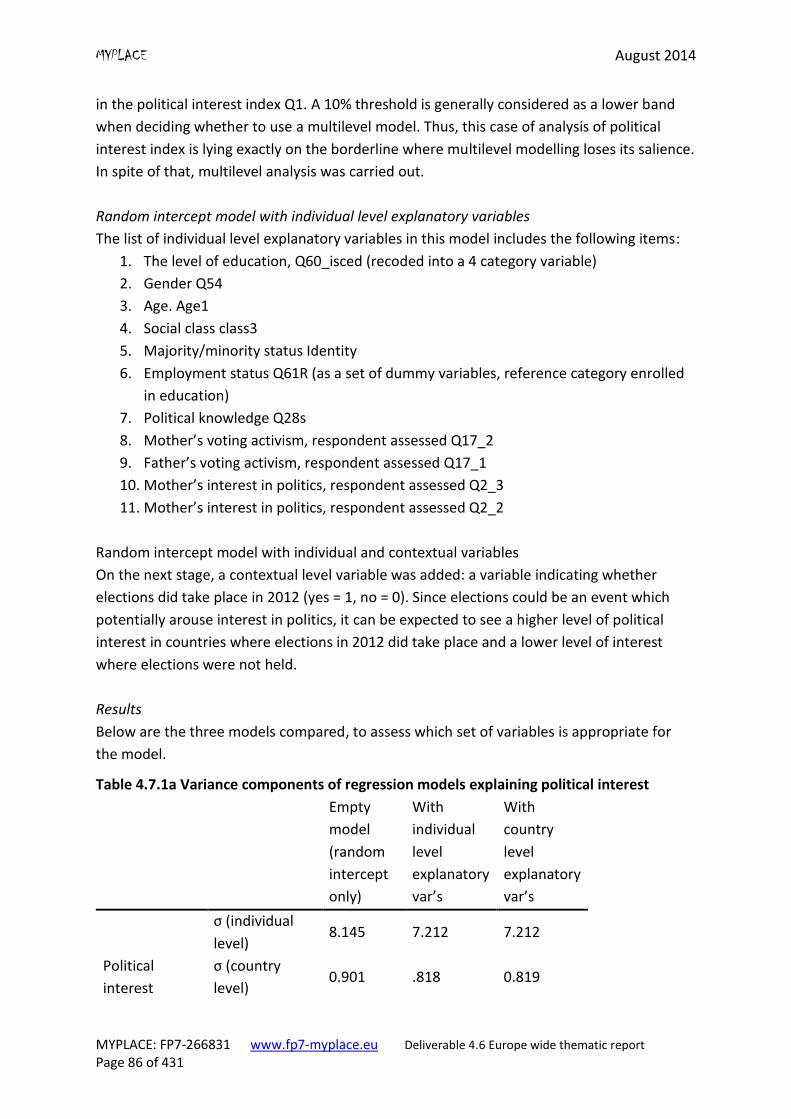
MYPLACE August 2014
MYPLACE: FP7-266831 www.fp7-myplace.eu Deliverable 4.6 Europe wide thematic report
Page 86 of 431
in the political interest index Q1. A 10% threshold is generally considered as a lower band
when deciding whether to use a multilevel model. Thus, this case of analysis of political
interest index is lying exactly on the borderline where multilevel modelling loses its salience.
In spite of that, multilevel analysis was carried out.
Random intercept model with individual level explanatory variables
The list of individual level explanatory variables in this model includes the following items:
1. The level of education, Q60_isced (recoded into a 4 category variable)
2. Gender Q54
3. Age. Age1
4. Social class class3
5. Majority/minority status Identity
6. Employment status Q61R (as a set of dummy variables, reference category enrolled
in education)
7. Political knowledge Q28s
8. Mother’s voting activism, respondent assessed Q17_2
9. Father’s voting activism, respondent assessed Q17_1
10. Mother’s interest in politics, respondent assessed Q2_3
11. Mother’s interest in politics, respondent assessed Q2_2
Random intercept model with individual and contextual variables
On the next stage, a contextual level variable was added: a variable indicating whether
elections did take place in 2012 (yes = 1, no = 0). Since elections could be an event which
potentially arouse interest in politics, it can be expected to see a higher level of political
interest in countries where elections in 2012 did take place and a lower level of interest
where elections were not held.
Results
Below are the three models compared, to assess which set of variables is appropriate for
the model.
Table 4.7.1a Variance components of regression models explaining political interest
Empty
model
(random
intercept
only)
With
individual
level
explanatory
var’s
With
country
level
explanatory
var’s
σ (individual
level) 8.145 7.212 7.212
Political
interest
σ (country
level) 0.901 .818 0.819
MYPLACE August 2014
MYPLACE: FP7-266831 www.fp7-myplace.eu Deliverable 4.6 Europe wide thematic report
Page 87 of 431
-loglikelihood 63302.510 61794.553 61793.905
ML estimates 63300.848 61730.389 61729.353
Changes in loglikelihood
The difference in loglikelihood between the empty model and the model with individual
level variables only is 1570.459 (63300.848-61730.3897). This is a highly significant
difference which means that the model using individual level variables is better that the
empty model. The difference in loglikelihood between the model with individual level
variables only and the full model, containing also one country level variable, is 1.036
(61730.389-61729.353). This change is not statistically significant which means that the
model containing contextual level model is not significantly better than the model
containing individual level variables only.
Comparison of the three models leads to the conclusion that the model containing only
individual level variables describes variation of the political interest index sufficiently well.
Including a variable, which indicated whether elections had taken place or not was
motivated by the wish to include a variable which would describe political environment. It
can be assumed that during an election period, people become targets of a relatively
intense flow of political messages. This in turn has a potential to arouse their interest in
politics. However, the hypothesis was not confirmed – this did not happen, the level of
interest was not linked to elections. Evidently, elections are not perceived as a sufficiently
outstanding political event to increase significantly young people’s interest in politics.
Indeed, regularly occurring elections are far less significant events than the fall of Berlin Wall
or the major crises in Greece, which have been reported to increase people’s interest in
politics and public matters. This finding is well in line with earlier research where political
interest has been found to be rather stable, an “unmovable mover”.
We can conclude that interest in politics is to a large extent determined by the following
individual level variables:
Level of education: higher educational attainment means also higher political
interest.
Age: higher age means also higher political interest.
Majority/minority group membership: belonging to the minority group means also
higher political interest.
Political knowledge: higher score on the political knowledge scale means also higher
political interest.
Mother’s frequency of voting: higher frequency means also higher political interest.
Father’s political interest: higher interest means also higher political interest.
7 The estimates were computed using maximum likelihood method for estimation parameter values, not the
restricted maximum likelihood method.
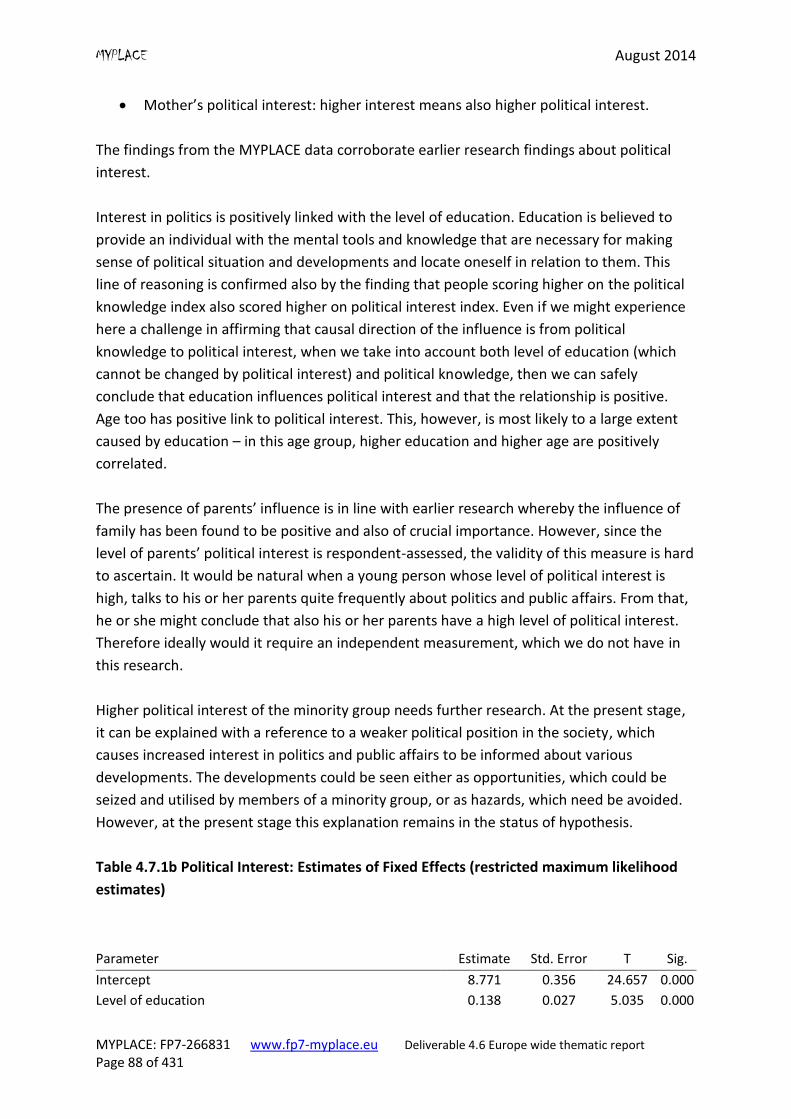
MYPLACE August 2014
MYPLACE: FP7-266831 www.fp7-myplace.eu Deliverable 4.6 Europe wide thematic report
Page 88 of 431
Mother’s political interest: higher interest means also higher political interest.
The findings from the MYPLACE data corroborate earlier research findings about political
interest.
Interest in politics is positively linked with the level of education. Education is believed to
provide an individual with the mental tools and knowledge that are necessary for making
sense of political situation and developments and locate oneself in relation to them. This
line of reasoning is confirmed also by the finding that people scoring higher on the political
knowledge index also scored higher on political interest index. Even if we might experience
here a challenge in affirming that causal direction of the influence is from political
knowledge to political interest, when we take into account both level of education (which
cannot be changed by political interest) and political knowledge, then we can safely
conclude that education influences political interest and that the relationship is positive.
Age too has positive link to political interest. This, however, is most likely to a large extent
caused by education – in this age group, higher education and higher age are positively
correlated.
The presence of parents’ influence is in line with earlier research whereby the influence of
family has been found to be positive and also of crucial importance. However, since the
level of parents’ political interest is respondent-assessed, the validity of this measure is hard
to ascertain. It would be natural when a young person whose level of political interest is
high, talks to his or her parents quite frequently about politics and public affairs. From that,
he or she might conclude that also his or her parents have a high level of political interest.
Therefore ideally would it require an independent measurement, which we do not have in
this research.
Higher political interest of the minority group needs further research. At the present stage,
it can be explained with a reference to a weaker political position in the society, which
causes increased interest in politics and public affairs to be informed about various
developments. The developments could be seen either as opportunities, which could be
seized and utilised by members of a minority group, or as hazards, which need be avoided.
However, at the present stage this explanation remains in the status of hypothesis.
Table 4.7.1b Political Interest: Estimates of Fixed Effects (restricted maximum likelihood
estimates)
Parameter Estimate Std. Error T Sig.
Intercept 8.771 0.356 24.657 0.000
Level of education 0.138 0.027 5.035 0.000
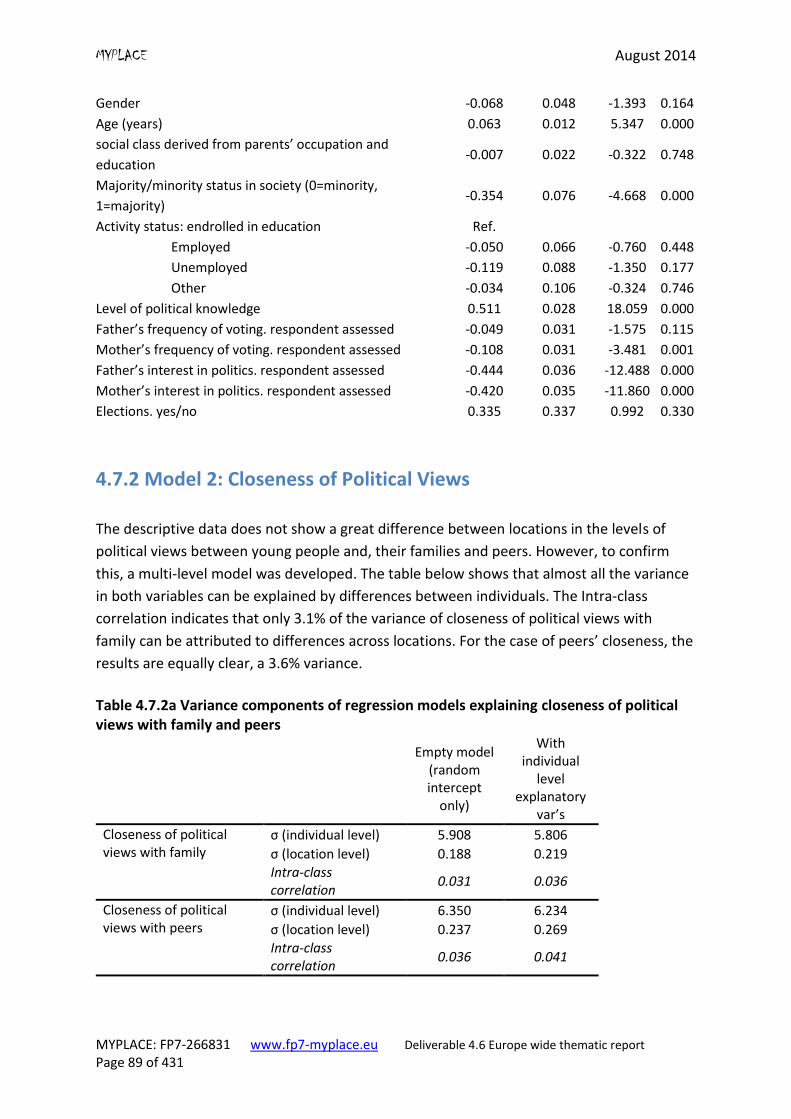
MYPLACE August 2014
MYPLACE: FP7-266831 www.fp7-myplace.eu Deliverable 4.6 Europe wide thematic report
Page 89 of 431
Gender -0.068 0.048 -1.393 0.164
Age (years) 0.063 0.012 5.347 0.000
social class derived from parents’ occupation and
education -0.007 0.022 -0.322 0.748
Majority/minority status in society (0=minority,
1=majority) -0.354 0.076 -4.668 0.000
Activity status: endrolled in education Ref.
Employed -0.050 0.066 -0.760 0.448
Unemployed -0.119 0.088 -1.350 0.177
Other -0.034 0.106 -0.324 0.746
Level of political knowledge 0.511 0.028 18.059 0.000
Father’s frequency of voting. respondent assessed -0.049 0.031 -1.575 0.115
Mother’s frequency of voting. respondent assessed -0.108 0.031 -3.481 0.001
Father’s interest in politics. respondent assessed -0.444 0.036 -12.488 0.000
Mother’s interest in politics. respondent assessed -0.420 0.035 -11.860 0.000
Elections. yes/no 0.335 0.337 0.992 0.330
4.7.2 Model 2: Closeness of Political Views
The descriptive data does not show a great difference between locations in the levels of
political views between young people and, their families and peers. However, to confirm
this, a multi-level model was developed. The table below shows that almost all the variance
in both variables can be explained by differences between individuals. The Intra-class
correlation indicates that only 3.1% of the variance of closeness of political views with
family can be attributed to differences across locations. For the case of peers’ closeness, the
results are equally clear, a 3.6% variance.
Table 4.7.2a Variance components of regression models explaining closeness of political views with family and peers
Empty model
(random intercept
only)
With individual
level explanatory
var’s Closeness of political views with family
σ (individual level) 5.908 5.806 σ (location level) 0.188 0.219 Intra-class correlation
0.031 0.036
Closeness of political views with peers
σ (individual level) 6.350 6.234 σ (location level) 0.237 0.269 Intra-class correlation
0.036 0.041
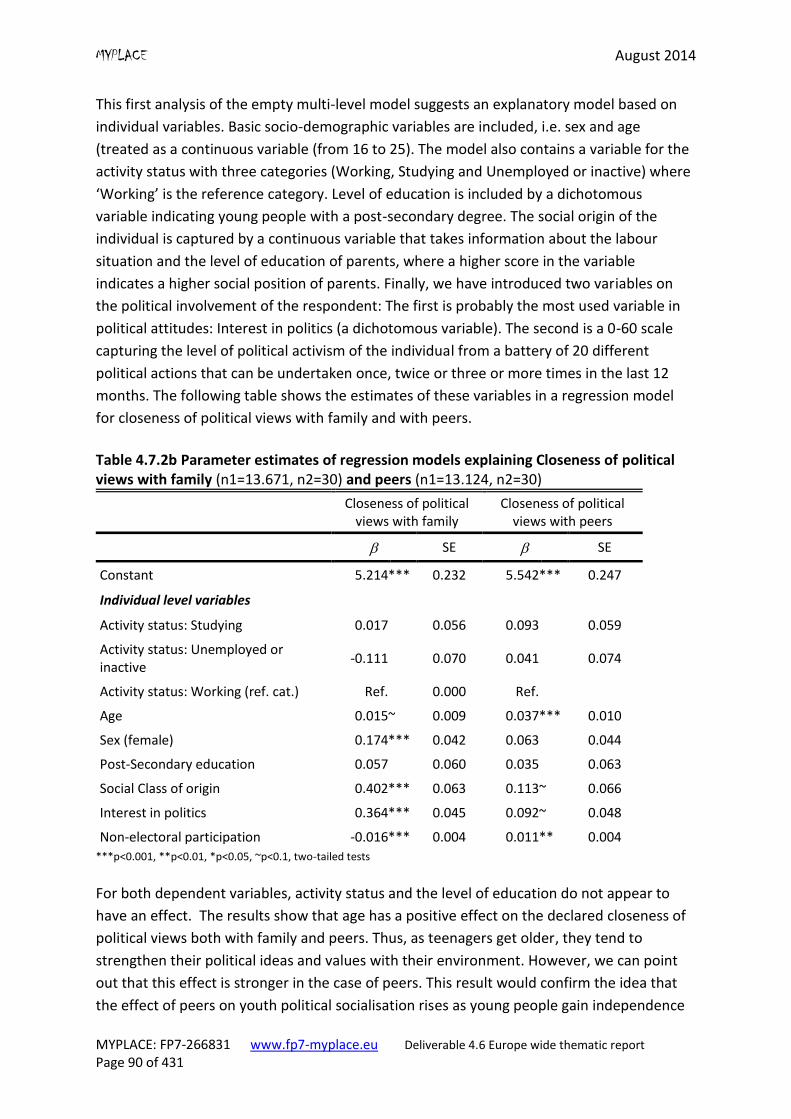
MYPLACE August 2014
MYPLACE: FP7-266831 www.fp7-myplace.eu Deliverable 4.6 Europe wide thematic report
Page 90 of 431
This first analysis of the empty multi-level model suggests an explanatory model based on
individual variables. Basic socio-demographic variables are included, i.e. sex and age
(treated as a continuous variable (from 16 to 25). The model also contains a variable for the
activity status with three categories (Working, Studying and Unemployed or inactive) where
‘Working’ is the reference category. Level of education is included by a dichotomous
variable indicating young people with a post-secondary degree. The social origin of the
individual is captured by a continuous variable that takes information about the labour
situation and the level of education of parents, where a higher score in the variable
indicates a higher social position of parents. Finally, we have introduced two variables on
the political involvement of the respondent: The first is probably the most used variable in
political attitudes: Interest in politics (a dichotomous variable). The second is a 0-60 scale
capturing the level of political activism of the individual from a battery of 20 different
political actions that can be undertaken once, twice or three or more times in the last 12
months. The following table shows the estimates of these variables in a regression model
for closeness of political views with family and with peers.
Table 4.7.2b Parameter estimates of regression models explaining Closeness of political views with family (n1=13.671, n2=30) and peers (n1=13.124, n2=30)
Closeness of political views with family
Closeness of political views with peers
SE SE
Constant 5.214 *** 0.232 5.542 *** 0.247
Individual level variables
Activity status: Studying 0.017 0.056 0.093 0.059
Activity status: Unemployed or inactive
-0.111 0.070 0.041 0.074
Activity status: Working (ref. cat.) Ref. 0.000 Ref.
Age 0.015 ~ 0.009 0.037 *** 0.010
Sex (female) 0.174 *** 0.042 0.063 0.044
Post-Secondary education 0.057 0.060 0.035 0.063
Social Class of origin 0.402 *** 0.063 0.113 ~ 0.066
Interest in politics 0.364 *** 0.045 0.092 ~ 0.048
Non-electoral participation -0.016 *** 0.004 0.011 ** 0.004 ***p<0.001, **p<0.01, *p<0.05, ~p<0.1, two-tailed tests For both dependent variables, activity status and the level of education do not appear to
have an effect. The results show that age has a positive effect on the declared closeness of
political views both with family and peers. Thus, as teenagers get older, they tend to
strengthen their political ideas and values with their environment. However, we can point
out that this effect is stronger in the case of peers. This result would confirm the idea that
the effect of peers on youth political socialisation rises as young people gain independence
MYPLACE August 2014
MYPLACE: FP7-266831 www.fp7-myplace.eu Deliverable 4.6 Europe wide thematic report
Page 91 of 431
from their family (Dostie-Goulet, 2009). Also in both cases, social class of origin and interest
in politics have a positive effect on political closeness with family and peers. Here, the effect
is stronger for family political views’ closeness. Regarding the effect of social class, it is
possible that there is more political discussion in families with higher levels of education and
that, political views are more defined, thus playing a positive role in transmitting political
ideas from one generation to another.
There are also a couple of variables that have a different impact on the closeness of political
views with family and with peers. Being a woman, for example, has a strong positive effect
on sharing the family’s political views but it does not have any effect for the case of peers.
The other variable with different effects on the closeness of family or peers is the level of
political activism of the respondent (non-electoral participation variable). This has a
negative effect on the sharing of political values and ideas with family, which means that
young people that are more politically active tend to feel more distant from their family’s
political ideas compared to more passive young people. By contrast, the level of political
activism has a positive effect on the closeness of political views with peers. These results
from the MYPLACE survey seem to confirm what Gordon and Taft (2011) report from a
qualitative analysis, in young activists it is the role of the peer-group on political socialisation
that is crucial. With these results we can confirm that young activists share the political
views of their peers more than non-activists and that they are more independent from their
family’s political ideas than young people who are politically inactive.
4.8 Summary
Following the dominant approach in the literature, which focuses on attitudinal as opposed
to behavioural aspects of political interest, the following definition of political interest was
adopted here: political interest is ‘curiosity, relation, attention and vigilance to political
issues and public affairs‘ (Schmid, 2004).
Political interest has been researched mainly within the framework of political activism. It
has been analysed as a factor, which influences a range of political attitudes, opinions and
forms of political activism. Political interest as a dependent variable, as a phenomenon in its
own right, has received relatively little research attention. There is no thorough
understanding of how it forms and what determines its levels. However, it is clear that the
level of political interest is very stable over the individual lifecourse and that, it forms to a
significant extent in quite early years, being strongly influenced by one’s parents and family.
Later in life, it fluctuates only as a result of very significant social disturbances and changes
such as the fall of Berlin Wall and the collapse of the Eastern Bloc in the late 1980s. Less
MYPLACE August 2014
MYPLACE: FP7-266831 www.fp7-myplace.eu Deliverable 4.6 Europe wide thematic report
Page 92 of 431
significant social and political events do not have sufficient weight to alter its levels
significantly.
MYPLACE data showed that the political interest of young people is divided. Across all
countries, more people reported that they were ‘not interested’ in politics than those who
reported that they were ‘interested’ in politics (58%:42%). The level varied across countries;
young people were interested in politics in some locations (in eastern Germany, Greece and
Spain) while, in other countries, they were not very interested (Croatia, Latvia, Finland and
Estonia). Youth was most interested in politics related to the country they lived in and the
municipality, they lived in. Interest was lowest towards countries neighbouring their
country. Europe and the immediate surroundings were of medium interest.
Employment, housing and environment were the three issues that were of interest for the
highest percentage of young people. The European Union, immigration and LGBT rights, in
contrast, scored lowest on the scale of political interest. Television and the Internet were
the two information channels used by young people to obtain information about politics
and public affairs. Radio and newspapers were far less popular. Levels of different aspects of
political interest vary across sites, but differences usually are not large. When sites are
ordered from highest to lowest then the differences between immediate neighbours are
incremental. In the case of most questions, no single research locations are characterised
by exceptionally high or low values of political interest. Neither are there concrete clusters
of sites.
Across all five questions on political interest, certain sites tend to report systematically
lower or higher values. The pattern is far from deterministic and contains exceptions but
one can distinguish between sites where political interest tends to be higher and where it
tends to be lower. To give a very ‘broad brush’ ranking of sites, a cumulative scale summing
responses from the entire five question block was developed and sites were ordered
according to mean value of the index. The following 10 sites tended to have relatively high
political interest:
1. Coventry (the highest average political interest)
2. Odense East
3. Jena
4. Odense Center
5. Vic
6. Bremen
7. Sant Cugat del Vallès
8. Lumiar
9. Rostock
10. Telavi

MYPLACE August 2014
MYPLACE: FP7-266831 www.fp7-myplace.eu Deliverable 4.6 Europe wide thematic report
Page 93 of 431
Among the sites where political interest tends to be low, are:
1. Pescenica Zitnjak
2. Lieksa and Nurmes
3. Nuneaton
4. Narva
5. Vyborg
6. Ozd
7. Trnava
8. Rimavska Sobota
9. Sopron
10. Forstate and Jaunbuve (the lowest average political interest)
This ordering of sites was obtained from summarising responses to all items in the five
questions. This index was not used earlier and thus the ranking of sites might vary from that
presented above. When using separate questions (Q1 to Q5) for ordering the sites, there is
some variation in rankings of the places. However, sites that scored high on one of the
questions, and appeared in the group of sites with high political interest, did not score so
low on any other question such that it also appeared in the group of sites with low political
interest. The opposite was also true. To conclude, despite some variation, the sites tended
to group in categories of low and high political interest. Detailed information is presented in
the graphs and tables above.
For multilevel analysis, the cumulative index built of responses to the first question (interest
in five different administrative/political/geographical units) was used. The level of political
interest was to a large extent explained by individual level variables (90%) and the role of
localities is small (10%). The variables, which significantly co-vary with the index of political
interest, are the following:
Level of education: higher educational attainment means also higher political
interest.
Age: higher age means also higher political interest.
Majority/minority group membership: belonging to a minority group means also
higher political interest.
Political knowledge: higher score on the political knowledge scale means also higher
political interest.
Mother’s frequency of voting: higher frequency means also higher political interest.
Father’s political interest: higher interest means also higher political interest.
Mother’s political interest: higher interest means also higher political interest.
The findings from the MYPLACE data corroborate earlier research findings about political
interest. Interest in politics is positively associated with the level of education. Education is
MYPLACE August 2014
MYPLACE: FP7-266831 www.fp7-myplace.eu Deliverable 4.6 Europe wide thematic report
Page 94 of 431
believed to provide an individual with the skills and knowledge that are necessary for
making sense of political situations and developments and locating oneself in relation to
them. This line of reasoning is confirmed also by the finding that people scoring higher on
the political knowledge index also scored higher on the political interest index. Age too has a
positive association with political interest. This, however, is likely to a large extent to be a
product of education – in this age group, education and age are positively correlated. The
presence of parents’ influence is in line with earlier research, which indicates the influence
of family to be of crucial importance. However, since the level of parents’ political interest
is respondent-assessed, the validity of this measure is hard to ascertain. Reasons for higher
political interest among minority groups need further research. At the present stage, it can
be hypothesised that minorities are somewhat more interested in politics and public affairs.
In this section, we analysed the level of coincidence between the political ideas of young
people and their families and peers. Through this, we can gain an idea of the role of the
environment in the political socialisation process. By measuring the declared closeness of
political views with family and peers, it was shown that, while differences are not very high,
young people tend to feel closer to their peers than their family.
The MYPLACE data set – drawing on 30 different European locations – provides the
opportunity to analyse the role of context in shaping different phenomena. In this case,
however,it seems that context does not have an important role to play in explaining how
close or distant the political ideas and values of young people are from their families and
peers.
The analysis of the effect of different variables in defining the closeness of political ideas to
those of family and peers has shown interesting results concerning the role of political
activism. As young people participate more in political actions, they tend to share more
political views with their peers and less with their families. Thus, it seems that political
engagement facilitates the establishment of new political preferences, which are
independent of family background.
References
Hadjar, A. and Becker, R. (2006). Politisches Interesse und politische Partizipation. In:
Hadjar, A.; Becker R. (eds.): Die Bildungsexpansion. Erwartete und unerwartete Folgen.
Wiesbaden: VS Verlag für Sozialwissenschaften, p. 179-204.
MYPLACE August 2014
MYPLACE: FP7-266831 www.fp7-myplace.eu Deliverable 4.6 Europe wide thematic report
Page 95 of 431
Holleque, M. (2011) Rethinking the Stability of Political Interest. Paper prepared for a
meeting of the University of Wisconsin’s Political Behavior Research Group, April 12th, 2011.
Kaase, M. (1990) Mass participation. In Jennings, M,K., van Deth, J.W. (eds.) Continuities in
political action, Walter de Gruyter, Berlin, New York.
Kaase, M., and Marsh, A. (1979) Political Action: A theoretical perspective. In Barnes, S.H.,
Kaase, M. (eds.) Political Action: Mass Participation in Five Western Democracies, Beverly
Hills, CA, Sage.
Kenski, K. and Stroud, N.J. (2006) Connections Between Internet Use and Political Efficacy,
Knowledge, and Participation. Journal of Broadcasting and Electronic Media 50(2), 2006, pp.
173–192.
Kuhn, H. P. and Schmid, C. (2004) Politisches Interesse, Mediennutzung und
Geschlechterdifferenz. Zwei Thesen zur Erklärung von Geschlechtsunterschieden im
politischen Interesse von Jugendlichen. In: Hoffmann, D.; Merkens, M. (eds.):
Jugendsoziologische Sozialisationstheorie. Impulse für die Jugendforschung, Weinheim and
München: Juventa, pp. 71-89.
Lange, D., Onken, H. and Slopinski, A. (2013) Politisches Interesse und Politische Bildung.
Zum Stand des Bürgerbewusstseins Jugendlicher und junger Erwachsener. Wiesbaden:
Springer VS.
Niedermayer, O. (2005) Bürger und Politik. Politische Orientierungen und Verhaltensweisen
der Deutschen. 2. Updated edition. Wiesbaden: VS Verlag.
Prior, M. (2010) You’ve Either Got It or You Don’t? The Stability of Political Interest over the
Life Cycle, The Journal of Politics, Vol. 72, No. 3, July 2010, Pp. 747–766.
Pritzker, S., Springer, M.J., McBride, A.M. (2012) Learning to Vote: Informing Political
Participation among College Students. CSD Working Papers No. 12–46.
Niemi R. G., Craig, S. C. and Mattei, F. (1991). Measuring Internal Political Efficacy in the
1988 National Election Study, The American Political Science Review. 85 (4): pp. 1407-1413.
Schmid, C. (2004) Politisches Interesse von Jugendlichen Eine Längsschnittuntersuchung zum
Einfluss von Eltern, Gleichaltrigen, Massenmedien und Schulunterricht. Wiesbaden:
Deutscher-Universitätsverlag.
Shani, D. (2009) On The Origins of Political Interest. A Dissertation Presented to the Faculty
of Princeton University in Candidacy for the Degree of Doctor of Philosophy. Recommended
for Acceptance by the Department of Politics. UMI Number: 3378025
Syal, R. (2012) What Are the Effects of Educational Mobility on Political Interest and
Participation in the Indian Electorate? Asian Survey, 52(2) (March/April 2012): pp. 423-439
Tenscher, J.; Scherer, P. (2012) Jugend, Politik und Medien. Politische Orientierungen und
Verhaltensweisen von Jugendlichen in Rheinland-Pfalz. Wien, Berlin: LIT Verlag.
MYPLACE August 2014
MYPLACE: FP7-266831 www.fp7-myplace.eu Deliverable 4.6 Europe wide thematic report
Page 96 of 431
Utter, G.H. (2011) Youth and political participation: a reference handbook. California , ABC-
CLIO, LLC,.
Van Deth, J.W. (1990) Interest in politics. In Jennings, M,K., van Deth, J.W. (eds.)
Continuities in political action, Walter de Gruyter, Berlin, New York.
Verba, S., Schlozman, K.L. and Brady, H.E. (1995). Voice and Equality: Civic Voluntarism in
American Politics, Boston, Harvard University Press.
MYPLACE August 2014
MYPLACE: FP7-266831 www.fp7-myplace.eu Deliverable 4.6 Europe wide thematic report
Page 97 of 431
Chapter 5: Attitudes and Trust
The country specific analyses (MYPLACE Deliverable 4.5.) has already showed that youth in
general have negative attitudes towards politicians and politics; have a tendency to believe
that politicians are corrupt, likely to be influenced by the rich and are not interested in
young people. For example in eastern Germany over 60% of youth perceive politicians as
corrupt, while in Croatia around 75% of youth perceive the same; about 60% of youth in
Spain considers that politicians are not interested in young people, while in Croatia only
about a tenth perceive politicians as interested in young people.
Additionally in country specific analyses several socio-demographic characteristics of youth
were confirmed as significant sources of differences in youth attitudes towards politicians
and politics such as age (e.g. Croatia, Georgia), level of education (e.g. Croatia, Georgia),
employment status (Georgia) and religious affiliation (in Jena in eastern Germany).
However, some country reports (e.g. eastern Germany) stressed no established significant
differences in youth attitudes towards politicians and politics with regard to those
characteristics (age, level of education, occupational status and social class), while some
reports stressed some additional correlates of attitudes towards politicians and politics such
as voting preferences (in Georgia).
Besides differences in attitudes towards politics and politicians on individual level socio-
demographic characteristics, some national reports (e.g. Croatia, Latvia) stressed the
difference with regard to locations (Croatia, Latvia, whereas attitudes were more negative in
economically poorer locations).
Thus generally speaking, findings to date, in addition to generally negative attitudes of
youth towards politicians and politics demonstrated that youth attitudes are determined by
individual characteristics, and in some cases by locations. However, also indicated was the
possibility that relationship between socio-demographic characteristic and attitudes could
depend on locations and countries as well as country level characteristics as possible
determinates of those attitudes.
Regarding trust in institutions, country level analyses indicate low to medium level of trust
among youth, especially towards national political institutions. For example, head of the
government and political parties were among lowest-ranked institutions in terms of trust in
Croatia and Spain. However, in some countries religious institutions (e.g. eastern Germany)
and banks (eastern Germany, western Germany) were lowest ranked. Some of the
institutions which were most trustworthy for young people are judiciary institutions, such as
courts and the police (in western Germany), or the army (UK followed by police and courts,
MYPLACE August 2014
MYPLACE: FP7-266831 www.fp7-myplace.eu Deliverable 4.6 Europe wide thematic report
Page 98 of 431
Croatia), international institutions Greenpeace or Amnesty International (Spain, Croatia,
after the army).
Additionally, country specific analyses indicated some of the socio-demographic
characteristics as possible determinants of young people’s trust in institutions: gender (in
Croatia), age (eastern Germany, western Germany), and social class (Croatia, eastern
Germany) level of education (eastern Germany). Generally speaking, females, youth in the
higher class and with higher the educational attainment expressed a higher level of trust in
national, as well as in international institutions. However, established differences with
regard to individual socio-demographic characteristics were small. Besides socio-
demographic characteristics some country analyses tested some attitudinal individual
variables as determinants of institutional trust such as satisfaction with democracy
(Georgia), political knowledge (eastern Germany), confirming these variables as positive
predictor of trust.
Besides this, some teams reported difference in some of the indicators of the level of trust
between their two research locations, whereas lower level of trust was more characteristic
for generally speaking, poorer location (Peščenica in Croatia, the Pielinen Karelia area in
Finland, Lumiar in Portugal, and Nuneaton in UK).
Thus, similarly to the country specific findings relating to attitudes towards politicians and
politics, the cross country analyses indicates that countries (and in some cases locations
within the countries) are significant determinants of young people’s trust toward
institutions. Moreover, findings indicate that the effects of some socio-demographic
variables could depend on context (country or location), in addition, some additional
individual level variables could be an important source of difference in the youth’s level of
trust towards political and social institutions.
In this chapter, we present findings of the cross-country analyses based on the merged data
set from all locations. In the following sections we firstly describe youth attitudes towards
politicians and politics, as well as youth trust in institutions with regard to locations and
countries in more detail (together with details on the construction and testing of composite
variables based on the cross-country merged data set). After these analyses, we report the
findings of two multivariate analyses; first with trust in national parliament as the
dependent variable and second with trust in the European Commission as the dependent
variable.
In this part, we will test the following hypotheses, which we developed for this study:
• Youth trust in national Parliament as well trust towards the European Commission
are differentiated by individual level characteristics as well as location and country level
characteristics
MYPLACE August 2014
MYPLACE: FP7-266831 www.fp7-myplace.eu Deliverable 4.6 Europe wide thematic report
Page 99 of 431
• Relationship between individual level determinants of trust towards national
parliament and the European Commission depends on context (specific location or country).
Literature
The existing research consistently shows that youth, with regard to their attitudes to politics
and politicians, can be characterised as dissatisfied and alienated from the political process
(Henn and Foard, 2012; White et al.,2000). For example, data from the international
CivicWeb project showed that youth in general saw politicians “as corrupt, boring, or hard
to understand; working only for their own interests; and far removed from the everyday
needs and realities of common citizens (Banaji and Buckingham, 2010:17). Moreover, such
negative youth attitudes could be, regarded as one of the sources of youth political
disengagement (at least from formal politics). However, as Marien argues “… critical
attitude towards the politicians in office is generally considered to be normal and healthy
part of democracy…However citizens should be able to put (some) trust in democratic
procedures and institutions (Marien, 2011:13).
Political trust is, usually defined as ‘a summary judgment that the system is responsive and
will do what is right even in the absence of constant scrutiny’ (Miller and Listhaug, 1990:
358). Thus, as Hooghe et al. (2014) stress, political trust can be considered as one of the
most important resources for a democratic political system. Research studies confirm the
important role of political trust in different citizens behaviour such as paying taxes (Orviska
and Hudson, 2003), policy preferences (Hetherington and Husser, 2012) as well voting
turnout (Jones and Hudson, 2000). In the context of considering the relation between
political trust and political participation or civic engagement in general it should be, noted
that there are many conflicting findings, which suggest that this relationship involves
complex interactions and contingencies (Levi and Stoker, 2000). For example, a recent study
(Hooghe and Marien, 2013) showed that political trust is positively associated with
institutional participation, while it is negatively associated with non – institutional
participation.
Data from international surveys e.g. European Social Survey shows a consistent pattern of
trust in different institutions: trust in implementing institutions is higher than in
representational institutions, while political parties and politicians receive relatively lowest
trust (Marien, 2011). Moreover, Mishler and Rose (2001) reported that citizens in post-
Communist societies express greatest distrust for political institutions, especially
parliaments and parties, while the military (as the least democratic institution) enjoys the
highest level of popular trust. Additionally, international institutions, especially in new
democracies, enjoy more trust than national institutions whereas level of citizens’ trust in
MYPLACE August 2014
MYPLACE: FP7-266831 www.fp7-myplace.eu Deliverable 4.6 Europe wide thematic report
Page 100 of 431
European parliament is usually higher than level of trust in national parliament. One of the
explanations is that this higher level of trust in international institution is a consequence of a
lack of direct experience with these institutions (Marien, 2011). Marien (2011) augmented
this claim with the fact that number of missing values is usually higher for international
institutions than for national institutions.
However, there are consistent cross-country differences in the level of trust in institutions.
Whereas Nordic countries and Netherlands are, characterized by higher political trust,
Central and Eastern Europe countries are characterised by rather low levels of trust (Van der
Meer, 2010). Hakhverdian and Mayne (2012) distinguished three groups of countries based
on levels of trust in national political institutions (from round 4 of European Social Survey);
the first group of ‘highly trusting’ countries consists of Sweden, the Netherlands,
Switzerland, Norway, Finland, and Denmark. A second group of ‘moderately trusting’
countries consists of Slovenia, Estonia, Spain, France, Great Britain, Belgium, and Germany,
while a third group of ‘low trusting’ countries consists of Latvia, Hungary, Croatia, Poland,
the Czech Republic, Portugal, Romania, and Greece. Analyses by Hooghe and Wilkenfeld
(2008) showed that the country patterns of political trust among youth correspond to those
established among general samples: on the level of country aggregates, higher level of trust
was characteristic for youth in Scandinavian countries and lower for youth in Southern and
Eastern Europe countries. Recent analyses by Harteveld et al.(2013) showed a reverse
pattern for trust in EU institutions. According to Eurobaremeter data, the most EU-trusting
citizens are characteristic for the new, post-2004 member states and, to a lesser extent, the
Benelux countries. While in post-communist developing democracies where national trust is
low, evaluation of EU competence as well as trust in EU are high (Harteveld et al.,2013). A
recent study by Armingeon and Ceka (2014) demonstrated a significant drop in the level of
trust in EU between 2007 and 2011 during the economic crisis.
In conceptualising political trust, two main theoretical approaches have been distinguished
(Mishler and Rose, 2001; Hakhverdian and Mayne 2011). According to cultural theories,
political trust is a consequences of attitudes and values that are, learned early in life and are
transmitted from generation to generation (Inglehart, 1997; Putnam, 2000). Within this
approach, one of the main proximal determinants of political trust is interpersonal or dyadic
trust. On the other side, according to the institutional theories political trust depends on
institutional performance and citizens evaluations of performance (Hakhverdian and Mayne
2011). In accordance with this approach Van der Meer and Dekker (2011) conceptualized
trust in national institutions as a citizen’s rational evaluation of the relationship between
citizen and state, which depends on four aspects: competence, care, accountability and
reliability.
Both general approaches make the distinction between macro and micro level determinants
of trust. Cultural theories emphasise the national traditions as macro level determinants
MYPLACE August 2014
MYPLACE: FP7-266831 www.fp7-myplace.eu Deliverable 4.6 Europe wide thematic report
Page 101 of 431
and individual socialisation experiences as micro level determinants. At the same time more
institutional approaches emphasise the aggregate performance of institutions, such as
those which could be operationalised by indicators of economic growth and level of
corruption as macro level determinants, while individual evaluations of institutional
performance are contingent upon individual experiences and attitudes and are regarded as
micro level determinants (Mishler and Rose, 2001).
Although political trust measures are common in many international and national surveys,
there is no consensus in the literature, which, is the best way to operationalise and analyse
political trust. As Marien (2011) emphasises, institutional trust has been conceptualised and
studied as both a one-dimensional and multidimensional attitude. Thus, some of the
authors (e.g. Michler and Rose 2001; Marien, 2011) analyse trust in institutions as a whole,
while others advocate using measures of trust towards specific institutions. Among those
specific institutions relatively frequently investigated were national parliament (e.g. Van der
Meer, 2010; Van der Meer and Dekker (2011), whereas “trust in parliament may be a good
measure because confidence in institutions is about something deeper and more
fundamental than trust in politicians or in particular governments” (Newton, 2013:?), as
well as European institutions (Roth et al.,2013).
Besides, as Levi and Stoker (2000) observed, survey research traditionally examines
individual level correlates of political trust, while macro level correlates have been the focus
of historical and comparative case studies. However in recent years there are more studies
which have employed multilevel statistical analyses which enable investigating individual as
well as macro level determinates of political trust (Van der Meer 2010; Van der Meer and
Dekker (2011), as well as their interaction. For example, Hakhverdian and Mayne (2012)
revealed that education at the individual level is negatively related to institutional trust in
corrupt societies and positively related to institutional trust in societies not regarded as
corrupt.
Regarding trust in the national parliament Van der Meer (2010) confirmed by multilevel
modelling that corruption, the electoral system, and former regime (communist) type are
important determinants of the cross-national differences in trust, while economic
performance is not related to trust in parliament. Additionally, Van der Meer and Dekker
(2011) revealed a negative effect of a recent communist regime is the same for both young
and old, indicating that the perceived negative effects of communist rule on political trust
endures even after a decade since its downfall (van der Mere and Dekker, 2011:104).
Regarding trust in European institutions, Harteveld et al.(2013) conceptualised that trust in
the EU could be the result of three different processes; rational, based on evaluations about
the performance and procedures of the European Union; emotional, based on the salience
of a European identity as well national identity, and extrapolation, based on national trust
MYPLACE August 2014
MYPLACE: FP7-266831 www.fp7-myplace.eu Deliverable 4.6 Europe wide thematic report
Page 102 of 431
and therefore unrelated to the European Union itself. Based on a multilevel analyses they
concluded that citizens’ trust in the EU can be predicted by their trust in national
institutions, regardless of their rational evaluation or emotional affiliation. Armingeon and
Ceka (2014) also confirmed that the trust in EU strongly depends on the trust in national
institutions, but also on individual evaluations of the national economy. However Munoz et
al.(2011) showed that the relationship between trust in national institutions and trust in
European institutions could be different at individual and country levels; at the country level
- living in a country with highly trusted and well-performing institutions hinders trust in the
European Parliament, while at the individual level those who are more trusting tend to be
so at both the national and the European level.
Although investigating the determinants of political trust is a relatively common research
topic, studies investigating political trust (trust in the EU especially) and their correlates
specifically among youth are relatively scarce (Hooghe and Wilkenfeld, 2008; Schoon and
Cheng, 2011; Torney-Purta et al.,2004). We believe there are no studies related to youth
political trust or youth trust towards specific national or European institutions which employ
multilevel analyses, investigating individual and country level determinates.
5.1 Attitudes towards politicians and politics (Q6)
Respondents were asked about their attitudes towards politics and politicians. The following
3 items with each having five points ranging from ‘strongly disagree’ to ‘strongly agree’ were
used to assess young people’s attitudes:
Q6_1: Politicians are interested in young people like me
Q6_2: Politicians are corrupt
Q6_3: The rich have too much influence over politics.
These three items are loaded under one factor which, explained 58.13% of their variance.
Further analysis of data suggests that these three items constitute a scale of acceptable
reliability α ≥ .60. Nevertheless, we have decided to use only two items (Q6_2 and Q6_3) for
a construction of ‘Attitude towards politicians and politics’ scale because in most of the
locations this solution has smaller number of missing cases and higher reliability as
presented in Table 5.1. However, it should be, noticed that in many locations the Cronbach
alpha is below acceptable level, for this option too. An ordinal by ordinal, Gamma
correlation of 0.588 suggests there is a strong relationship between the two variables and
theoretically they can be combined.
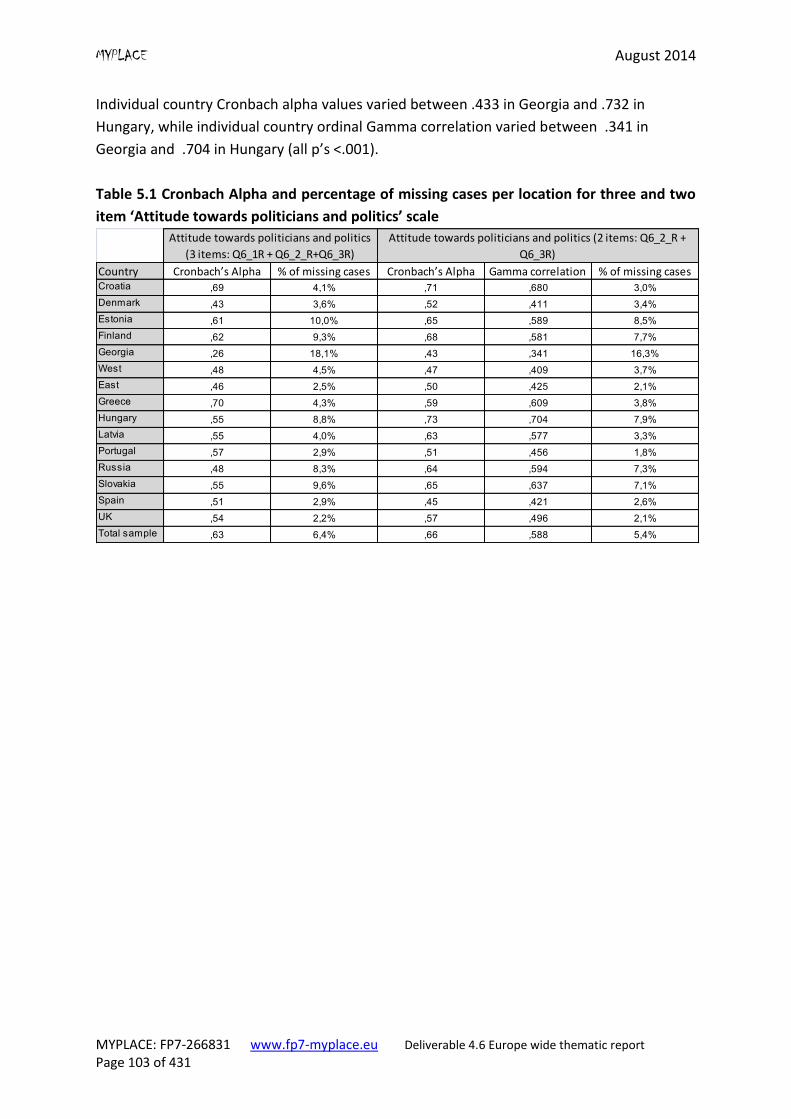
MYPLACE August 2014
MYPLACE: FP7-266831 www.fp7-myplace.eu Deliverable 4.6 Europe wide thematic report
Page 103 of 431
Individual country Cronbach alpha values varied between .433 in Georgia and .732 in
Hungary, while individual country ordinal Gamma correlation varied between .341 in
Georgia and .704 in Hungary (all p’s <.001).
Table 5.1 Cronbach Alpha and percentage of missing cases per location for three and two
item ‘Attitude towards politicians and politics’ scale
Country Cronbach’s Alpha % of missing cases Cronbach’s Alpha Gamma correlation % of missing casesCroatia ,69 4,1% ,71 ,680 3,0%
Denmark ,43 3,6% ,52 ,411 3,4%
Estonia ,61 10,0% ,65 ,589 8,5%
Finland ,62 9,3% ,68 ,581 7,7%
Georgia ,26 18,1% ,43 ,341 16,3%
West
Germany,48 4,5% ,47 ,409 3,7%
East
Germany,46 2,5% ,50 ,425 2,1%
Greece ,70 4,3% ,59 ,609 3,8%
Hungary ,55 8,8% ,73 ,704 7,9%
Latvia ,55 4,0% ,63 ,577 3,3%
Portugal ,57 2,9% ,51 ,456 1,8%
Russia ,48 8,3% ,64 ,594 7,3%
Slovakia ,55 9,6% ,65 ,637 7,1%
Spain ,51 2,9% ,45 ,421 2,6%
UK ,54 2,2% ,57 ,496 2,1%
Total sample ,63 6,4% ,66 ,588 5,4%
Attitude towards politicians and politics
(3 items: Q6_1R + Q6_2_R+Q6_3R)
Attitude towards politicians and politics (2 items: Q6_2_R +
Q6_3R)
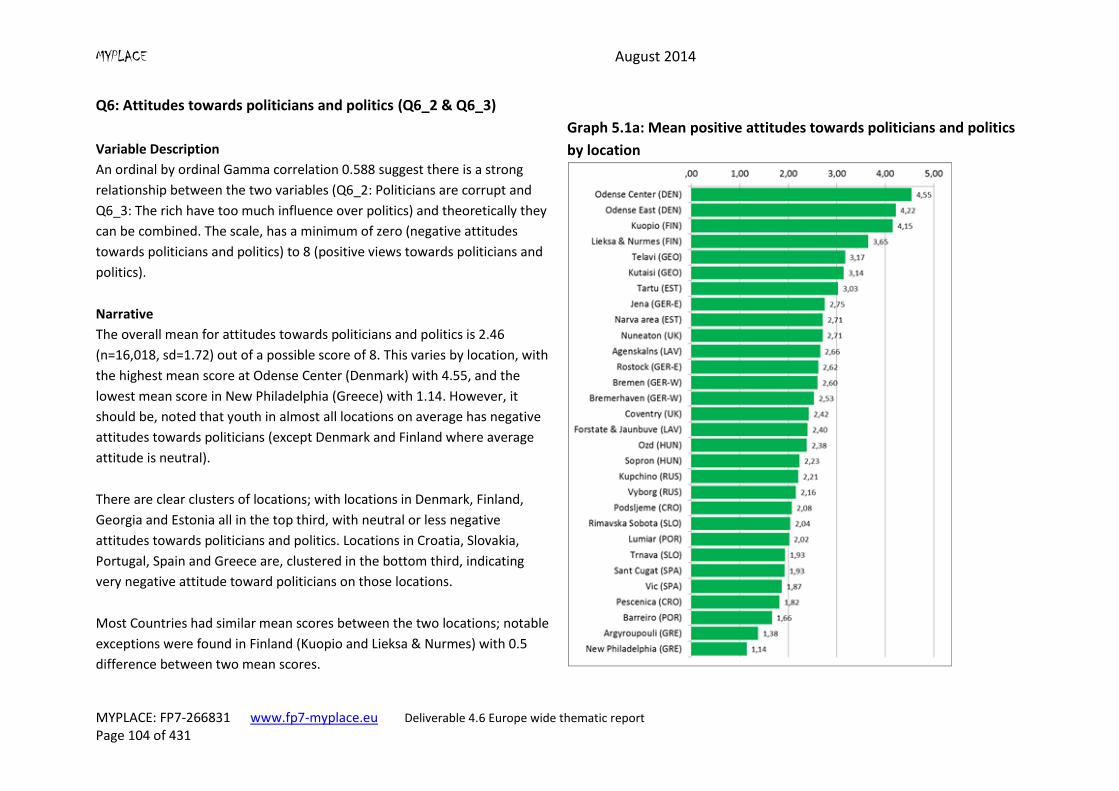
MYPLACE August 2014
MYPLACE: FP7-266831 www.fp7-myplace.eu Deliverable 4.6 Europe wide thematic report
Page 104 of 431
Q6: Attitudes towards politicians and politics (Q6_2 & Q6_3)
Variable Description
An ordinal by ordinal Gamma correlation 0.588 suggest there is a strong
relationship between the two variables (Q6_2: Politicians are corrupt and
Q6_3: The rich have too much influence over politics) and theoretically they
can be combined. The scale, has a minimum of zero (negative attitudes
towards politicians and politics) to 8 (positive views towards politicians and
politics).
Graph 5.1a: Mean positive attitudes towards politicians and politics
by location
Narrative
The overall mean for attitudes towards politicians and politics is 2.46
(n=16,018, sd=1.72) out of a possible score of 8. This varies by location, with
the highest mean score at Odense Center (Denmark) with 4.55, and the
lowest mean score in New Philadelphia (Greece) with 1.14. However, it
should be, noted that youth in almost all locations on average has negative
attitudes towards politicians (except Denmark and Finland where average
attitude is neutral).
There are clear clusters of locations; with locations in Denmark, Finland,
Georgia and Estonia all in the top third, with neutral or less negative
attitudes towards politicians and politics. Locations in Croatia, Slovakia,
Portugal, Spain and Greece are, clustered in the bottom third, indicating
very negative attitude toward politicians on those locations.
Most Countries had similar mean scores between the two locations; notable
exceptions were found in Finland (Kuopio and Lieksa & Nurmes) with 0.5
difference between two mean scores.
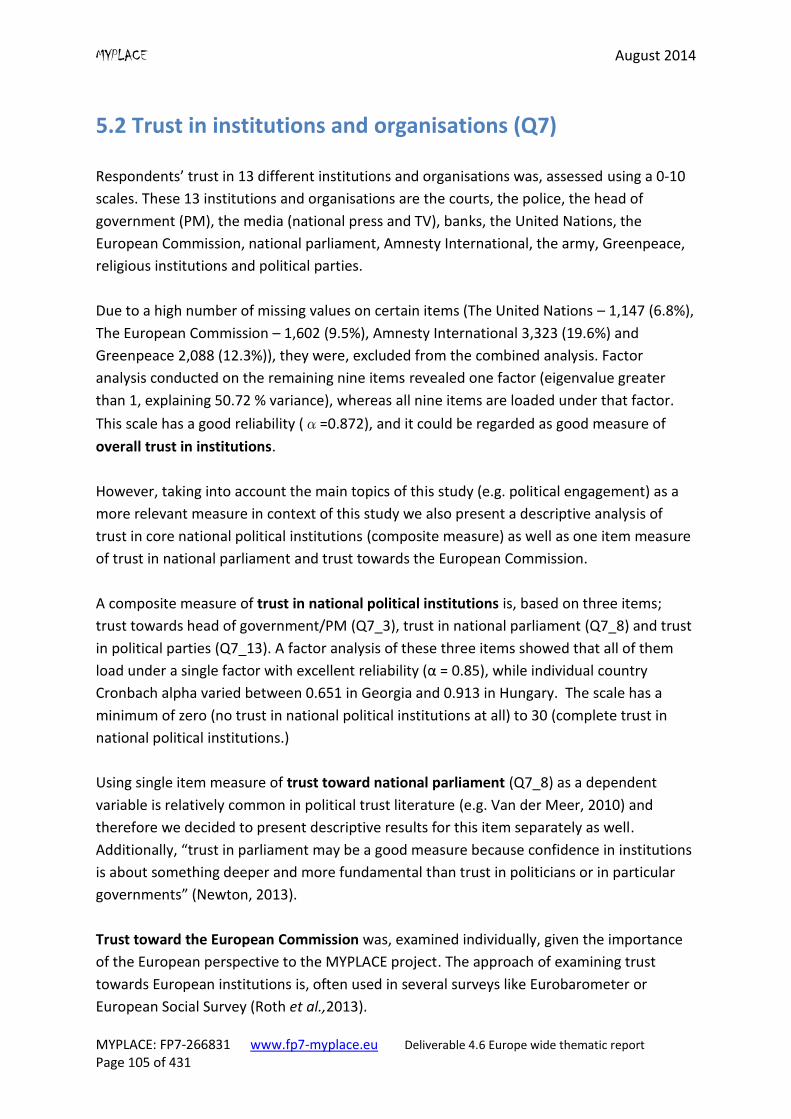
MYPLACE August 2014
MYPLACE: FP7-266831 www.fp7-myplace.eu Deliverable 4.6 Europe wide thematic report
Page 105 of 431
5.2 Trust in institutions and organisations (Q7)
Respondents’ trust in 13 different institutions and organisations was, assessed using a 0-10
scales. These 13 institutions and organisations are the courts, the police, the head of
government (PM), the media (national press and TV), banks, the United Nations, the
European Commission, national parliament, Amnesty International, the army, Greenpeace,
religious institutions and political parties.
Due to a high number of missing values on certain items (The United Nations – 1,147 (6.8%),
The European Commission – 1,602 (9.5%), Amnesty International 3,323 (19.6%) and
Greenpeace 2,088 (12.3%)), they were, excluded from the combined analysis. Factor
analysis conducted on the remaining nine items revealed one factor (eigenvalue greater
than 1, explaining 50.72 % variance), whereas all nine items are loaded under that factor.
This scale has a good reliability (α=0.872), and it could be regarded as good measure of
overall trust in institutions.
However, taking into account the main topics of this study (e.g. political engagement) as a
more relevant measure in context of this study we also present a descriptive analysis of
trust in core national political institutions (composite measure) as well as one item measure
of trust in national parliament and trust towards the European Commission.
A composite measure of trust in national political institutions is, based on three items;
trust towards head of government/PM (Q7_3), trust in national parliament (Q7_8) and trust
in political parties (Q7_13). A factor analysis of these three items showed that all of them
load under a single factor with excellent reliability (α = 0.85), while individual country
Cronbach alpha varied between 0.651 in Georgia and 0.913 in Hungary. The scale has a
minimum of zero (no trust in national political institutions at all) to 30 (complete trust in
national political institutions.)
Using single item measure of trust toward national parliament (Q7_8) as a dependent
variable is relatively common in political trust literature (e.g. Van der Meer, 2010) and
therefore we decided to present descriptive results for this item separately as well.
Additionally, “trust in parliament may be a good measure because confidence in institutions
is about something deeper and more fundamental than trust in politicians or in particular
governments” (Newton, 2013).
Trust toward the European Commission was, examined individually, given the importance
of the European perspective to the MYPLACE project. The approach of examining trust
towards European institutions is, often used in several surveys like Eurobarometer or
European Social Survey (Roth et al.,2013).
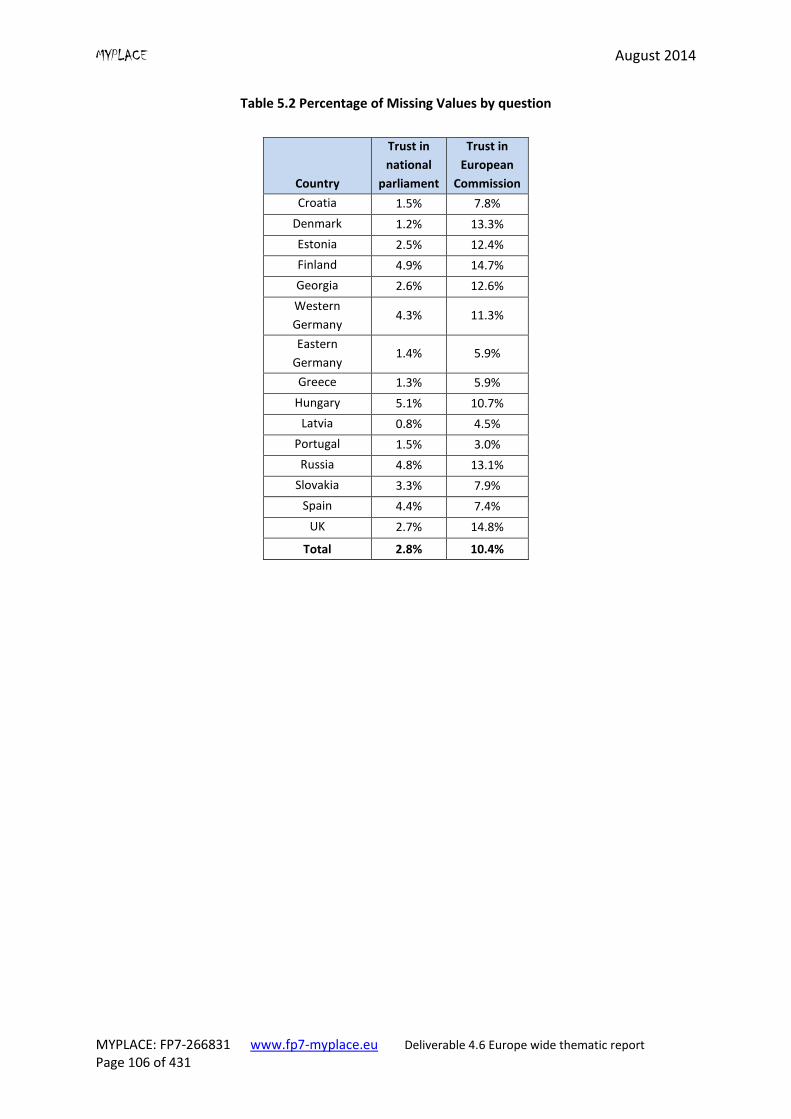
MYPLACE August 2014
MYPLACE: FP7-266831 www.fp7-myplace.eu Deliverable 4.6 Europe wide thematic report
Page 106 of 431
Table 5.2 Percentage of Missing Values by question
Country
Trust in
national
parliament
Trust in
European
Commission
Croatia 1.5% 7.8%
Denmark 1.2% 13.3%
Estonia 2.5% 12.4%
Finland 4.9% 14.7%
Georgia 2.6% 12.6%
Western
Germany 4.3% 11.3%
Eastern
Germany 1.4% 5.9%
Greece 1.3% 5.9%
Hungary 5.1% 10.7%
Latvia 0.8% 4.5%
Portugal 1.5% 3.0%
Russia 4.8% 13.1%
Slovakia 3.3% 7.9%
Spain 4.4% 7.4%
UK 2.7% 14.8%
Total 2.8% 10.4%
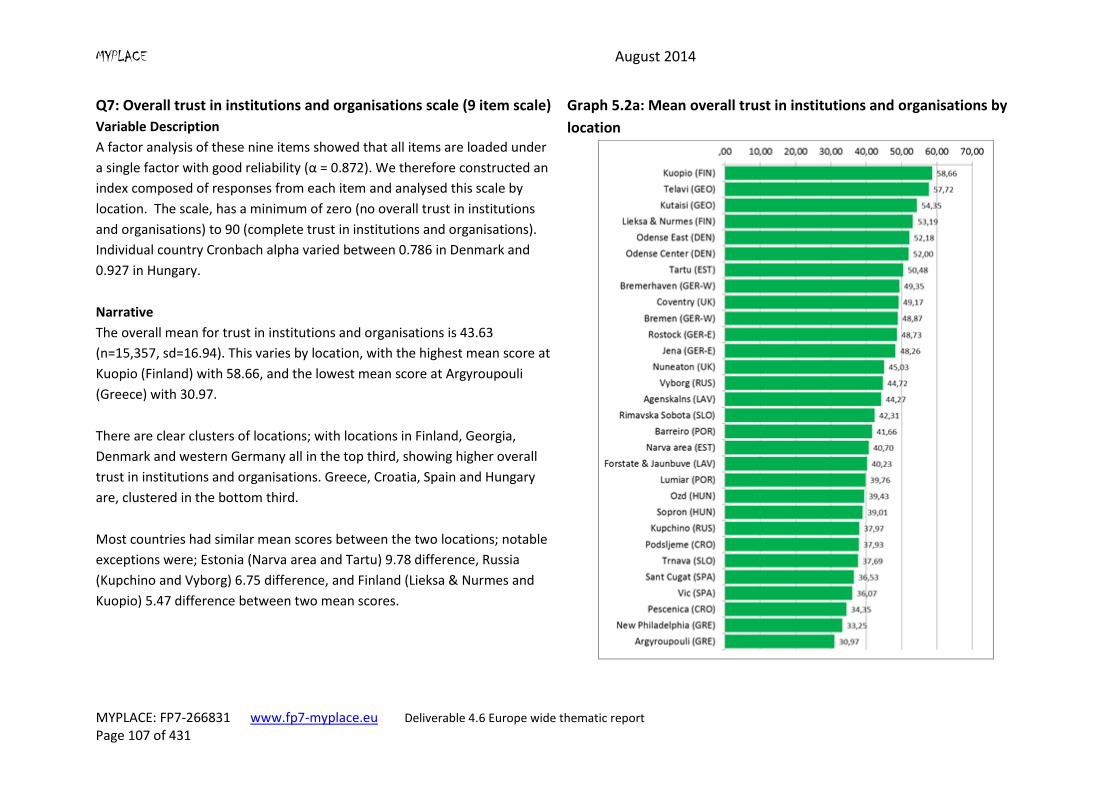
MYPLACE August 2014
MYPLACE: FP7-266831 www.fp7-myplace.eu Deliverable 4.6 Europe wide thematic report
Page 107 of 431
Q7: Overall trust in institutions and organisations scale (9 item scale) Graph 5.2a: Mean overall trust in institutions and organisations by
location
Variable Description
A factor analysis of these nine items showed that all items are loaded under
a single factor with good reliability (α = 0.872). We therefore constructed an
index composed of responses from each item and analysed this scale by
location. The scale, has a minimum of zero (no overall trust in institutions
and organisations) to 90 (complete trust in institutions and organisations).
Individual country Cronbach alpha varied between 0.786 in Denmark and
0.927 in Hungary.
Narrative
The overall mean for trust in institutions and organisations is 43.63
(n=15,357, sd=16.94). This varies by location, with the highest mean score at
Kuopio (Finland) with 58.66, and the lowest mean score at Argyroupouli
(Greece) with 30.97.
There are clear clusters of locations; with locations in Finland, Georgia,
Denmark and western Germany all in the top third, showing higher overall
trust in institutions and organisations. Greece, Croatia, Spain and Hungary
are, clustered in the bottom third.
Most countries had similar mean scores between the two locations; notable
exceptions were; Estonia (Narva area and Tartu) 9.78 difference, Russia
(Kupchino and Vyborg) 6.75 difference, and Finland (Lieksa & Nurmes and
Kuopio) 5.47 difference between two mean scores.
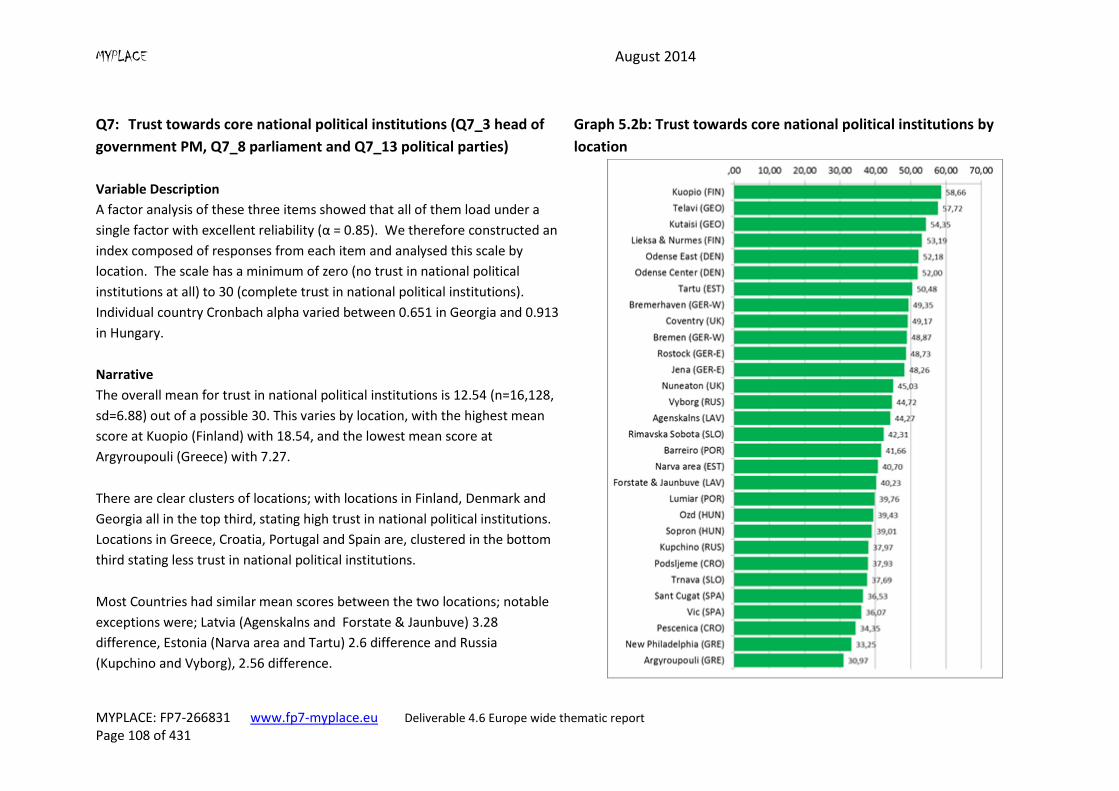
MYPLACE August 2014
MYPLACE: FP7-266831 www.fp7-myplace.eu Deliverable 4.6 Europe wide thematic report
Page 108 of 431
Q7: Trust towards core national political institutions (Q7_3 head of
government PM, Q7_8 parliament and Q7_13 political parties)
Graph 5.2b: Trust towards core national political institutions by
location
Variable Description
A factor analysis of these three items showed that all of them load under a
single factor with excellent reliability (α = 0.85). We therefore constructed an
index composed of responses from each item and analysed this scale by
location. The scale has a minimum of zero (no trust in national political
institutions at all) to 30 (complete trust in national political institutions).
Individual country Cronbach alpha varied between 0.651 in Georgia and 0.913
in Hungary.
Narrative
The overall mean for trust in national political institutions is 12.54 (n=16,128,
sd=6.88) out of a possible 30. This varies by location, with the highest mean
score at Kuopio (Finland) with 18.54, and the lowest mean score at
Argyroupouli (Greece) with 7.27.
There are clear clusters of locations; with locations in Finland, Denmark and
Georgia all in the top third, stating high trust in national political institutions.
Locations in Greece, Croatia, Portugal and Spain are, clustered in the bottom
third stating less trust in national political institutions.
Most Countries had similar mean scores between the two locations; notable
exceptions were; Latvia (Agenskalns and Forstate & Jaunbuve) 3.28
difference, Estonia (Narva area and Tartu) 2.6 difference and Russia
(Kupchino and Vyborg), 2.56 difference.
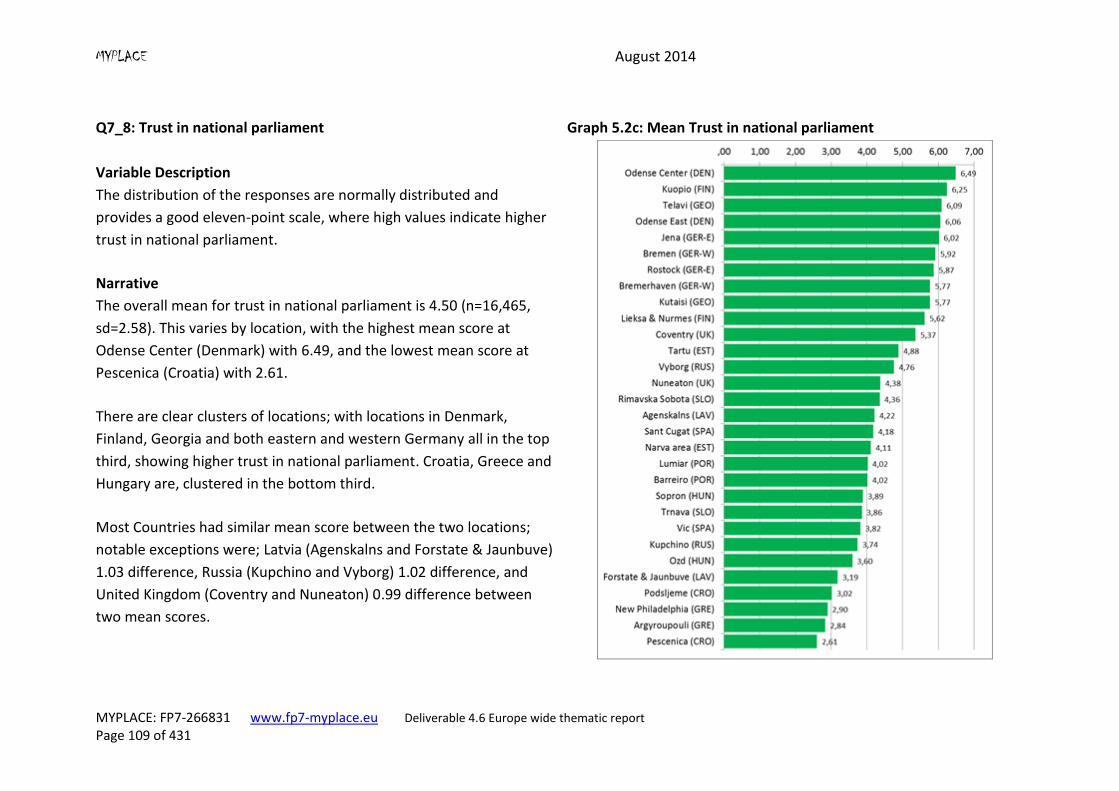
MYPLACE August 2014
MYPLACE: FP7-266831 www.fp7-myplace.eu Deliverable 4.6 Europe wide thematic report
Page 109 of 431
Q7_8: Trust in national parliament Graph 5.2c: Mean Trust in national parliament
Variable Description
The distribution of the responses are normally distributed and
provides a good eleven-point scale, where high values indicate higher
trust in national parliament.
Narrative
The overall mean for trust in national parliament is 4.50 (n=16,465,
sd=2.58). This varies by location, with the highest mean score at
Odense Center (Denmark) with 6.49, and the lowest mean score at
Pescenica (Croatia) with 2.61.
There are clear clusters of locations; with locations in Denmark,
Finland, Georgia and both eastern and western Germany all in the top
third, showing higher trust in national parliament. Croatia, Greece and
Hungary are, clustered in the bottom third.
Most Countries had similar mean score between the two locations;
notable exceptions were; Latvia (Agenskalns and Forstate & Jaunbuve)
1.03 difference, Russia (Kupchino and Vyborg) 1.02 difference, and
United Kingdom (Coventry and Nuneaton) 0.99 difference between
two mean scores.
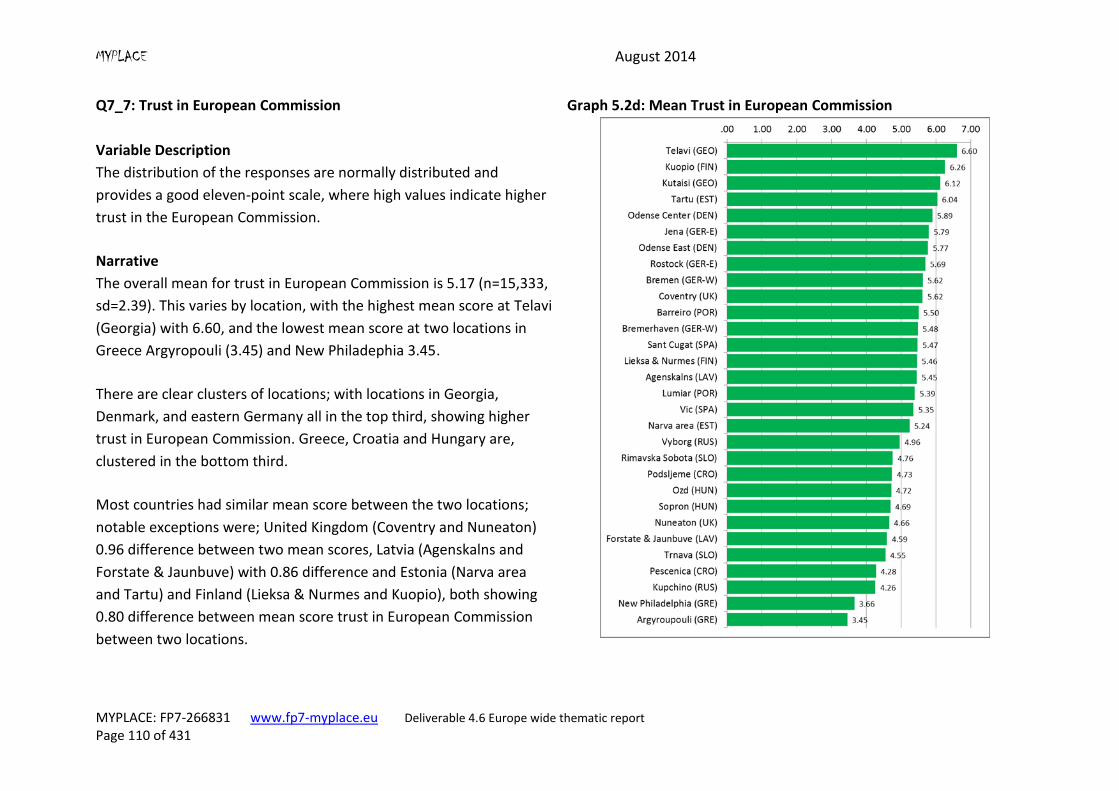
MYPLACE August 2014
MYPLACE: FP7-266831 www.fp7-myplace.eu Deliverable 4.6 Europe wide thematic report
Page 110 of 431
Q7_7: Trust in European Commission Graph 5.2d: Mean Trust in European Commission
Variable Description
The distribution of the responses are normally distributed and
provides a good eleven-point scale, where high values indicate higher
trust in the European Commission.
Narrative
The overall mean for trust in European Commission is 5.17 (n=15,333,
sd=2.39). This varies by location, with the highest mean score at Telavi
(Georgia) with 6.60, and the lowest mean score at two locations in
Greece Argyropouli (3.45) and New Philadephia 3.45.
There are clear clusters of locations; with locations in Georgia,
Denmark, and eastern Germany all in the top third, showing higher
trust in European Commission. Greece, Croatia and Hungary are,
clustered in the bottom third.
Most countries had similar mean score between the two locations;
notable exceptions were; United Kingdom (Coventry and Nuneaton)
0.96 difference between two mean scores, Latvia (Agenskalns and
Forstate & Jaunbuve) with 0.86 difference and Estonia (Narva area
and Tartu) and Finland (Lieksa & Nurmes and Kuopio), both showing
0.80 difference between mean score trust in European Commission
between two locations.
MYPLACE August 2014
MYPLACE: FP7-266831www.fp7-myplace.eu Deliverable 4.6 Europe wide thematic report Page 111 of 431
5.3 Multi-level Modelling
In this section, we present the results of multi-level modelling which took account of the
nested structure in our data set. First we present the effects of socio-demographic variables,
theoretically/empirically relevant individual level variables and contextual variables on the
trust in national parliament as a dependent variable (Model A), and latter we do the same
for trust in the European Commission as a dependent variable (Model B).
In order to establish the proportion of variability in our dependent variables associated with
individual level, location level and country level we ran a null (no predictors) model for both
of our dependent variables. Regarding trust in national parliament, 17.2% of the variance of
trust in parliament can be explained on the level of countries, while 2.4% of the variance can
be explained on the level of localities. Regarding trust in European commission, 7% of the
variance of trust in European commission can be explained on the level of countries, while
only 2.2% of the variance can be explained on the level of localities.
Due to a relatively low percentage of variance on the level of localities, we decided to
proceed with a two-level regression analysis with 16,935 individuals nested within 14
countries, ignoring the level of localities.
Model A: Trust in national parliament
Independent variables
Socio-demographic and individual level variables
After the null model, we present the results of a random intercept model with individual
level explanatory variables (Model 1). We included three socio-demographic variables - age,
gender and parental social class. Parental social class was used as a proxy for young
people’s social class because many young people in our sample still have not entered the
labour market. These socio-demographic variables were included as a control variables and
no specific hypothesis regarding their relationship with dependent variable were drawn.
In the next step of Model 1, we include six individual level variables. Two of them are more
general; social trust and life satisfaction. Social trust is expected to correlate with trust in
national parliament as Newton and Norris (2000) have already shown using World Value
Survey data. Both variables were measured by single item measures which is a common
approach used in many surveys (e.g. asking participants to assess on a 10 point scale
‘whether most people can be trusted, or that you can’t be too careful in dealing with
people’). The inclusion of a measure of life satisfaction is in line with recent evidence that
MYPLACE August 2014
MYPLACE: FP7-266831www.fp7-myplace.eu Deliverable 4.6 Europe wide thematic report Page 112 of 431
linked psychological traits with citizens political attitudes and behaviour (Mondak and
Halperin, 2008). We have also decided to use several individual level variables more related
to politics as predictors of trust towards national parliament: individuals’ self-positioning on
a left-right ideology scale which is usually used as a predictor for political opinions on
national political issues and has been associated with trust in national institutions (King
1997), satisfaction with democracy (single item measure) and interest in politics. We used
a composite measure of interest in politics made out from Q1 (all items), Q2_1 and Q2_3 (all
items) as suggested in the scale and index construction (see Appendix A). Finally, we
hypothesise that the level of care our respondent’s perceive to get from politicians is related
to the amount of trust they will have in national parliament. Van der Meer and Dekker
(2011) described care as one of four aspects responsible for citizens’ trust in state. In this
analysis we used a proxy measure of care, operationalised through a single item measure of
perception of politicians interest in young people (“Politicians are interested in young
people like me”, Q6_1). All individual level variables were grand-mean centred.
Contextual variables
We included three contextual variables in the analysis. The first refers to welfare state types
proposed by Kaariainen and Lehtonen (2006). The remaining two contextual variables are
Corruption perception Index (CPI), a common measure in this field of research introduced
by Transparency International in 2002 which measures perceived level of corruption in
country’s public sector, and rule of law, a summation of indicators; which measure the
extent to which agents have confidence in and abide by the rules of society (Jan et al.,
2013). A brief description of these indices is included in appendix.
Results
The inclusion of individual level variables resulted in 28.6% decrease of the residual,
meaning that almost thirty percent of variance of trust in national parliament within a
certain country can be attributed to a set of individual level predictors included. Chi-square
test of deviances (loglikelihood = 24049.218; df = 9) confirms that this is a highly
significant difference. The inclusion of individual level variables led to 70.4% of reduction of
intercept variance, indicating the amount of the variance of trust in national parliament
between countries that can be attributed to include a set of individual level predictors.
In the next step we included contextual variables, which led to 39.4% reduction of intercept
variance compared to the model containing only individual level predictors. This difference
in the fit of the model in comparison to a model containing only individual level predictors is
significant at.05 level as indicated by chi-square test of deviance (loglikelihood = 7.81; df
= 3).
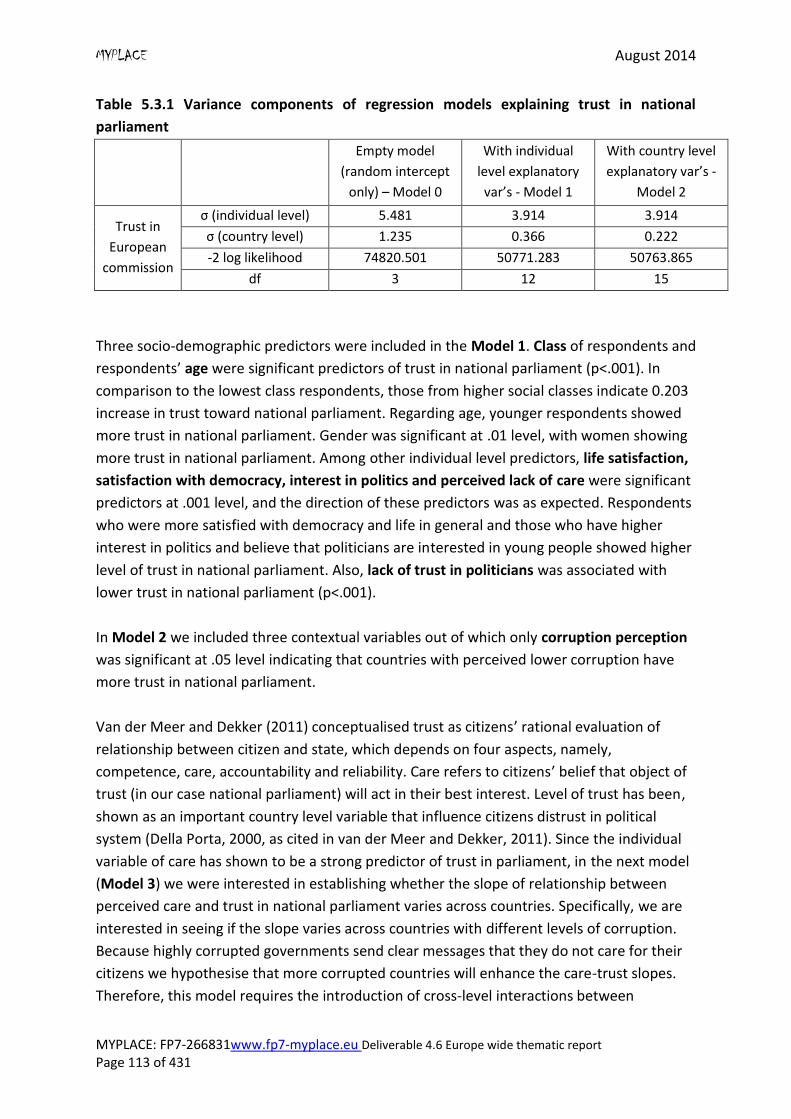
MYPLACE August 2014
MYPLACE: FP7-266831www.fp7-myplace.eu Deliverable 4.6 Europe wide thematic report Page 113 of 431
Table 5.3.1 Variance components of regression models explaining trust in national
parliament
Empty model
(random intercept
only) – Model 0
With individual
level explanatory
var’s - Model 1
With country level
explanatory var’s -
Model 2
Trust in
European
commission
σ (individual level) 5.481 3.914 3.914
σ (country level) 1.235 0.366 0.222
-2 log likelihood 74820.501 50771.283 50763.865
df 3 12 15
Three socio-demographic predictors were included in the Model 1. Class of respondents and
respondents’ age were significant predictors of trust in national parliament (p<.001). In
comparison to the lowest class respondents, those from higher social classes indicate 0.203
increase in trust toward national parliament. Regarding age, younger respondents showed
more trust in national parliament. Gender was significant at .01 level, with women showing
more trust in national parliament. Among other individual level predictors, life satisfaction,
satisfaction with democracy, interest in politics and perceived lack of care were significant
predictors at .001 level, and the direction of these predictors was as expected. Respondents
who were more satisfied with democracy and life in general and those who have higher
interest in politics and believe that politicians are interested in young people showed higher
level of trust in national parliament. Also, lack of trust in politicians was associated with
lower trust in national parliament (p<.001).
In Model 2 we included three contextual variables out of which only corruption perception
was significant at .05 level indicating that countries with perceived lower corruption have
more trust in national parliament.
Van der Meer and Dekker (2011) conceptualised trust as citizens’ rational evaluation of
relationship between citizen and state, which depends on four aspects, namely,
competence, care, accountability and reliability. Care refers to citizens’ belief that object of
trust (in our case national parliament) will act in their best interest. Level of trust has been,
shown as an important country level variable that influence citizens distrust in political
system (Della Porta, 2000, as cited in van der Meer and Dekker, 2011). Since the individual
variable of care has shown to be a strong predictor of trust in parliament, in the next model
(Model 3) we were interested in establishing whether the slope of relationship between
perceived care and trust in national parliament varies across countries. Specifically, we are
interested in seeing if the slope varies across countries with different levels of corruption.
Because highly corrupted governments send clear messages that they do not care for their
citizens we hypothesise that more corrupted countries will enhance the care-trust slopes.
Therefore, this model requires the introduction of cross-level interactions between
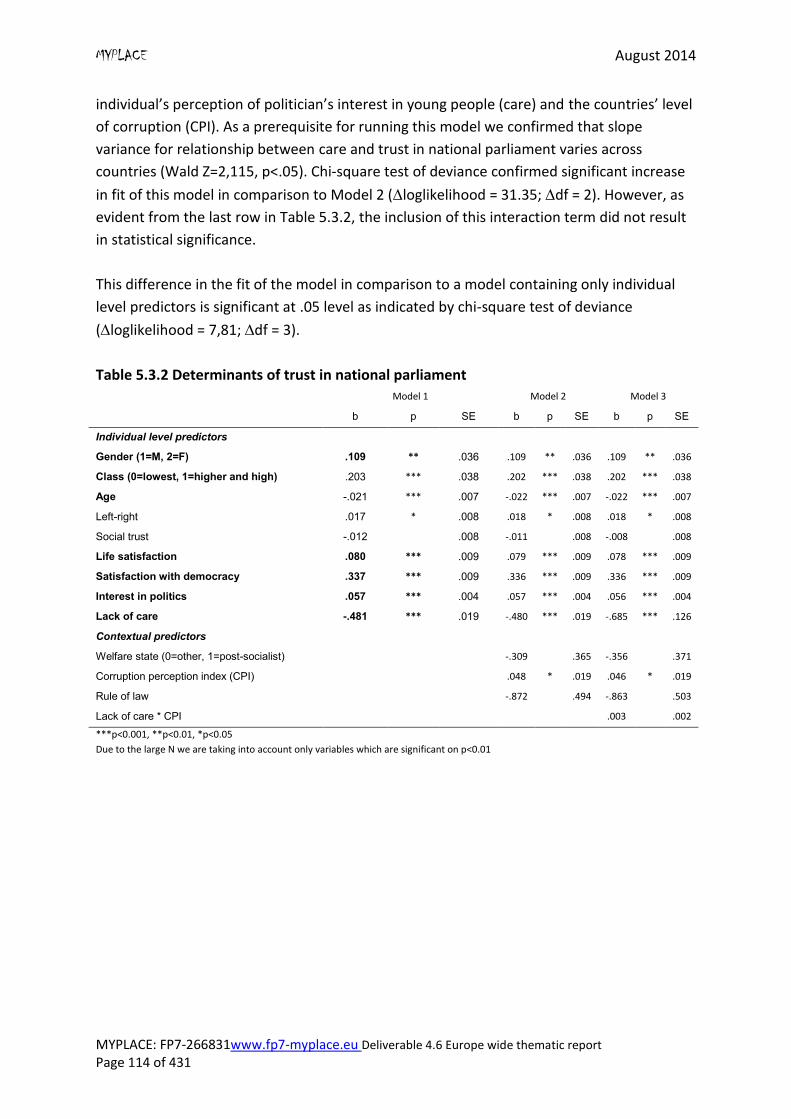
MYPLACE August 2014
MYPLACE: FP7-266831www.fp7-myplace.eu Deliverable 4.6 Europe wide thematic report Page 114 of 431
individual’s perception of politician’s interest in young people (care) and the countries’ level
of corruption (CPI). As a prerequisite for running this model we confirmed that slope
variance for relationship between care and trust in national parliament varies across
countries (Wald Z=2,115, p<.05). Chi-square test of deviance confirmed significant increase
in fit of this model in comparison to Model 2 (loglikelihood = 31.35; df = 2). However, as
evident from the last row in Table 5.3.2, the inclusion of this interaction term did not result
in statistical significance.
This difference in the fit of the model in comparison to a model containing only individual
level predictors is significant at .05 level as indicated by chi-square test of deviance
(loglikelihood = 7,81; df = 3).
Table 5.3.2 Determinants of trust in national parliament
Model 1 Model 2 Model 3
b p SE b p SE b p SE
Individual level predictors
Gender (1=M, 2=F) .109 ** .036 .109 ** .036 .109 ** .036
Class (0=lowest, 1=higher and high) .203 *** .038 .202 *** .038 .202 *** .038
Age -.021 *** .007 -.022 *** .007 -.022 *** .007
Left-right .017 * .008 .018 * .008 .018 * .008
Social trust -.012
.008 -.011
.008 -.008
.008
Life satisfaction .080 *** .009 .079 *** .009 .078 *** .009
Satisfaction with democracy .337 *** .009 .336 *** .009 .336 *** .009
Interest in politics .057 *** .004 .057 *** .004 .056 *** .004
Lack of care -.481 *** .019 -.480 *** .019 -.685 *** .126
Contextual predictors
Welfare state (0=other, 1=post-socialist)
-.309
.365 -.356
.371
Corruption perception index (CPI)
.048 * .019 .046 * .019
Rule of law
-.872
.494 -.863
.503
Lack of care * CPI
.003
.002
***p<0.001, **p<0.01, *p<0.05
Due to the large N we are taking into account only variables which are significant on p<0.01
MYPLACE August 2014
MYPLACE: FP7-266831www.fp7-myplace.eu Deliverable 4.6 Europe wide thematic report Page 115 of 431
Model B: Trust in European Commission
Independent variables
Socio-demographic and individual level variables
Three socio-demographic variables - age, gender and parental social class - were included in
modelling of trust in European Commission. As in Model A, parental social class was, used as
a proxy for young people’s social class because many young people in our sample still have
not entered the labour market. There is evidence that women (Nelsen and Guth, 2000) and
older people (Arnold et al.,2012) have, more negative evaluations of, EU institutions, but no
specific hypothesis regarding relationship between these socio-demographic variables were
made.
In the next step of Model 1, we included five individual level variables. As in Model A, we
tested social trust and life satisfaction as possible individual level predictors of trust towards
European Commission. Social trust, measured with a common approach used in many
surveys (asking participants to assess on a 10 point scale whether most people can be
trusted, or that you can’t be too careful in dealing with people) is also expected to influence
trust in European Commission. Inclusion of measure of life satisfaction (single item
measure) is in line with recent evidence that linked psychological traits with citizens’
political attitudes and behaviour (Mondak and Halperin, 2008). Higher life satisfaction has,
been connected with higher trust in European institutions, including European Commission.
As Christine et al. (2012) noticed, European issues are becoming more incorporated in
domestic political discourse so we also included in the model individuals’ self-positioning on
a left-right ideology scale. This is usually used, as a predictor for political opinions on
national political issues, assuming that this variable might also have an effect on trust in
issues beyond national scope.
Satisfaction with the functioning of the national democratic system has also been
connected with trust in European institutions (Norris, 1999), and therefore, we decided to
include this as an individual level predictor in our analysis too. This relationship is in line
with so called, congruence hypothesis according to which evaluations of the domestic
political system serve as a basis for evaluation of supranational institutions like the EU. This
hypothesis has received support in several researches (de Vries and van Kersbergen, 2007;
Scheuer and van der Brug, 2007) and we assume that people who are satisfied with national
democracy will be more likely to show higher trust in European Commission.
The final individual level predictor included in the analysis refers to interest in politics. We
used a composite measure of interest in politics made out from Q1 (all items), Q2_1 and
Q2_3 (all items) as suggested in the scale and index construction recommendations. Higher
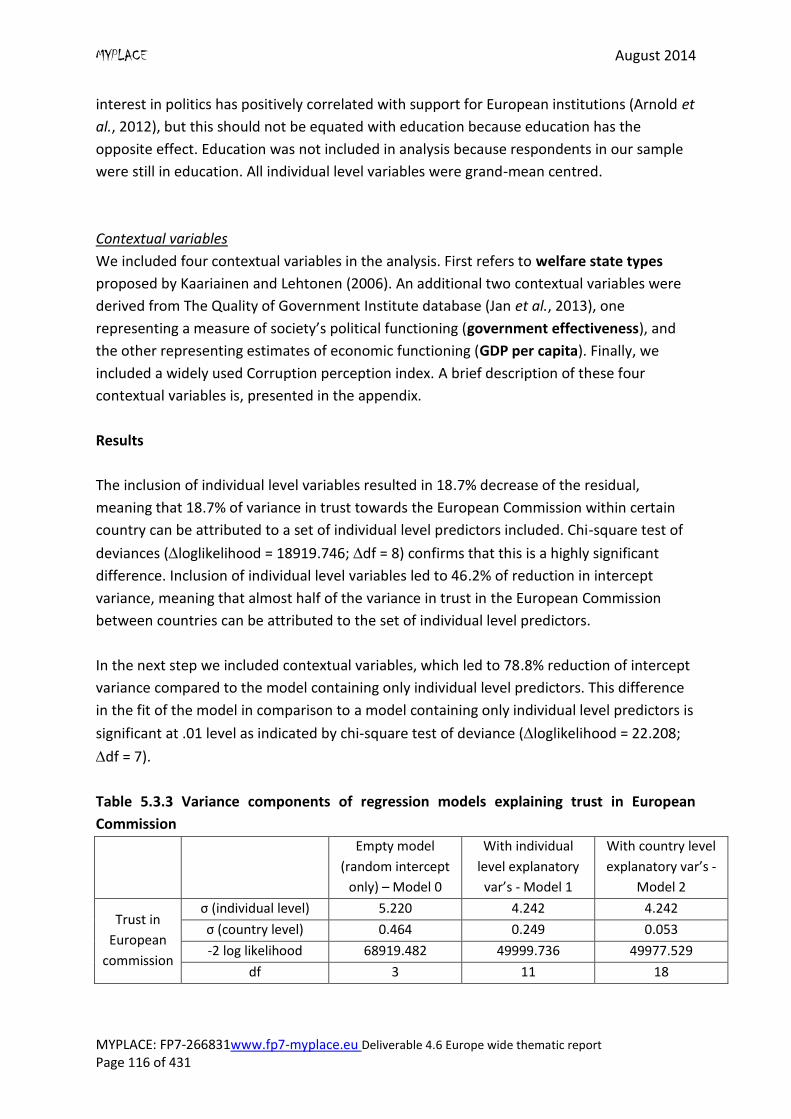
MYPLACE August 2014
MYPLACE: FP7-266831www.fp7-myplace.eu Deliverable 4.6 Europe wide thematic report Page 116 of 431
interest in politics has positively correlated with support for European institutions (Arnold et
al., 2012), but this should not be equated with education because education has the
opposite effect. Education was not included in analysis because respondents in our sample
were still in education. All individual level variables were grand-mean centred.
Contextual variables
We included four contextual variables in the analysis. First refers to welfare state types
proposed by Kaariainen and Lehtonen (2006). An additional two contextual variables were
derived from The Quality of Government Institute database (Jan et al., 2013), one
representing a measure of society’s political functioning (government effectiveness), and
the other representing estimates of economic functioning (GDP per capita). Finally, we
included a widely used Corruption perception index. A brief description of these four
contextual variables is, presented in the appendix.
Results
The inclusion of individual level variables resulted in 18.7% decrease of the residual,
meaning that 18.7% of variance in trust towards the European Commission within certain
country can be attributed to a set of individual level predictors included. Chi-square test of
deviances (loglikelihood = 18919.746; df = 8) confirms that this is a highly significant
difference. Inclusion of individual level variables led to 46.2% of reduction in intercept
variance, meaning that almost half of the variance in trust in the European Commission
between countries can be attributed to the set of individual level predictors.
In the next step we included contextual variables, which led to 78.8% reduction of intercept
variance compared to the model containing only individual level predictors. This difference
in the fit of the model in comparison to a model containing only individual level predictors is
significant at .01 level as indicated by chi-square test of deviance (loglikelihood = 22.208;
df = 7).
Table 5.3.3 Variance components of regression models explaining trust in European
Commission
Empty model
(random intercept
only) – Model 0
With individual
level explanatory
var’s - Model 1
With country level
explanatory var’s -
Model 2
Trust in
European
commission
σ (individual level) 5.220 4.242 4.242
σ (country level) 0.464 0.249 0.053
-2 log likelihood 68919.482 49999.736 49977.529
df 3 11 18
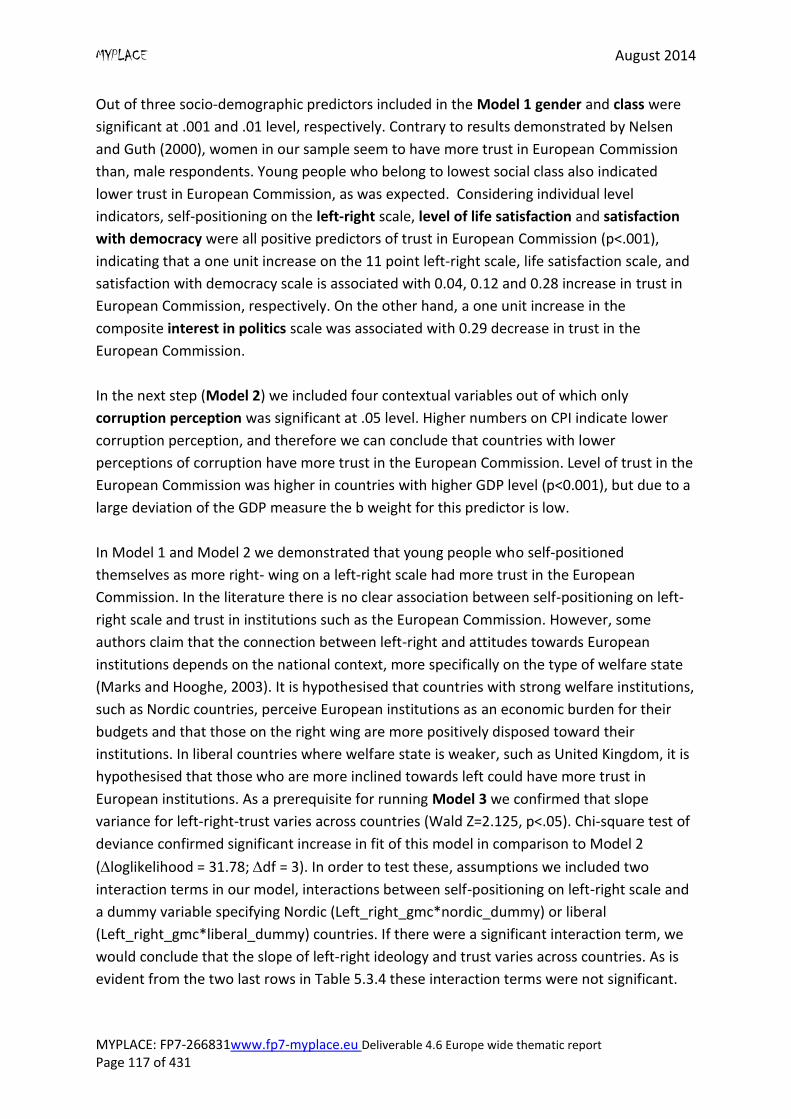
MYPLACE August 2014
MYPLACE: FP7-266831www.fp7-myplace.eu Deliverable 4.6 Europe wide thematic report Page 117 of 431
Out of three socio-demographic predictors included in the Model 1 gender and class were
significant at .001 and .01 level, respectively. Contrary to results demonstrated by Nelsen
and Guth (2000), women in our sample seem to have more trust in European Commission
than, male respondents. Young people who belong to lowest social class also indicated
lower trust in European Commission, as was expected. Considering individual level
indicators, self-positioning on the left-right scale, level of life satisfaction and satisfaction
with democracy were all positive predictors of trust in European Commission (p<.001),
indicating that a one unit increase on the 11 point left-right scale, life satisfaction scale, and
satisfaction with democracy scale is associated with 0.04, 0.12 and 0.28 increase in trust in
European Commission, respectively. On the other hand, a one unit increase in the
composite interest in politics scale was associated with 0.29 decrease in trust in the
European Commission.
In the next step (Model 2) we included four contextual variables out of which only
corruption perception was significant at .05 level. Higher numbers on CPI indicate lower
corruption perception, and therefore we can conclude that countries with lower
perceptions of corruption have more trust in the European Commission. Level of trust in the
European Commission was higher in countries with higher GDP level (p<0.001), but due to a
large deviation of the GDP measure the b weight for this predictor is low.
In Model 1 and Model 2 we demonstrated that young people who self-positioned
themselves as more right- wing on a left-right scale had more trust in the European
Commission. In the literature there is no clear association between self-positioning on left-
right scale and trust in institutions such as the European Commission. However, some
authors claim that the connection between left-right and attitudes towards European
institutions depends on the national context, more specifically on the type of welfare state
(Marks and Hooghe, 2003). It is hypothesised that countries with strong welfare institutions,
such as Nordic countries, perceive European institutions as an economic burden for their
budgets and that those on the right wing are more positively disposed toward their
institutions. In liberal countries where welfare state is weaker, such as United Kingdom, it is
hypothesised that those who are more inclined towards left could have more trust in
European institutions. As a prerequisite for running Model 3 we confirmed that slope
variance for left-right-trust varies across countries (Wald Z=2.125, p<.05). Chi-square test of
deviance confirmed significant increase in fit of this model in comparison to Model 2
(loglikelihood = 31.78; df = 3). In order to test these, assumptions we included two
interaction terms in our model, interactions between self-positioning on left-right scale and
a dummy variable specifying Nordic (Left_right_gmc*nordic_dummy) or liberal
(Left_right_gmc*liberal_dummy) countries. If there were a significant interaction term, we
would conclude that the slope of left-right ideology and trust varies across countries. As is
evident from the two last rows in Table 5.3.4 these interaction terms were not significant.
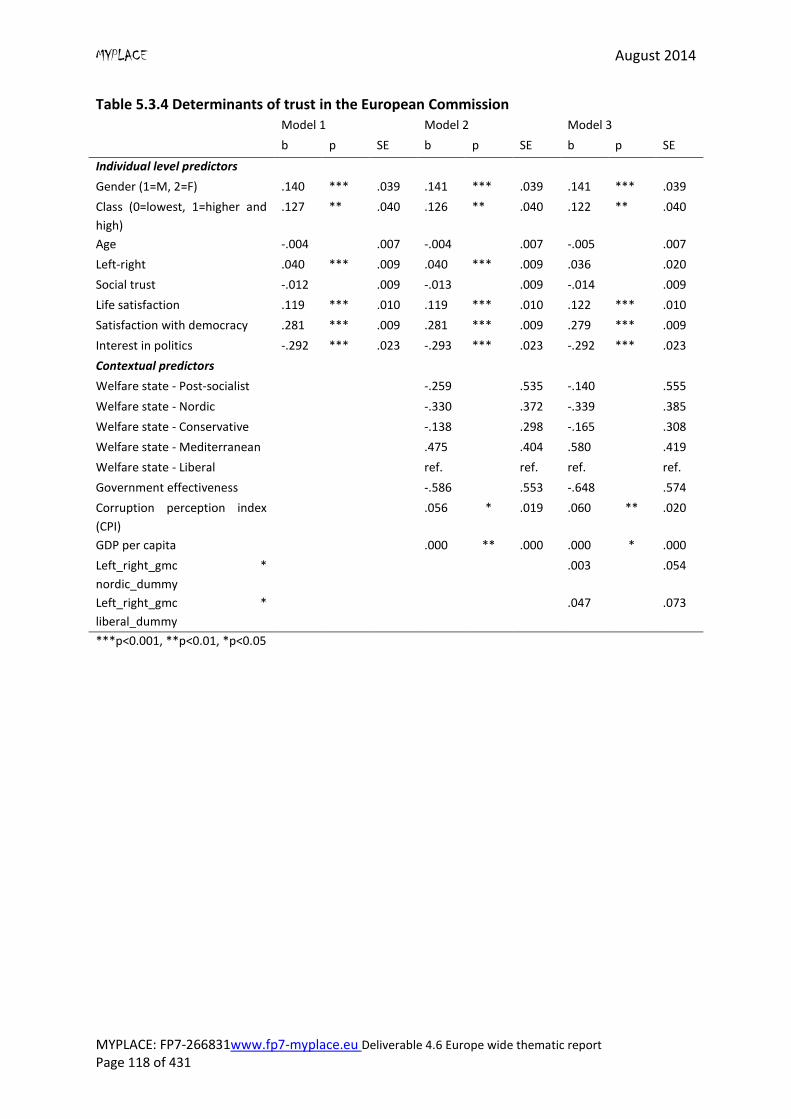
MYPLACE August 2014
MYPLACE: FP7-266831www.fp7-myplace.eu Deliverable 4.6 Europe wide thematic report Page 118 of 431
Table 5.3.4 Determinants of trust in the European Commission Model 1 Model 2 Model 3
b p SE b p SE b p SE
Individual level predictors
Gender (1=M, 2=F) .140 *** .039 .141 *** .039 .141 *** .039
Class (0=lowest, 1=higher and
high)
.127 ** .040 .126 ** .040 .122 ** .040
Age -.004 .007 -.004 .007 -.005 .007
Left-right .040 *** .009 .040 *** .009 .036 .020
Social trust -.012 .009 -.013 .009 -.014 .009
Life satisfaction .119 *** .010 .119 *** .010 .122 *** .010
Satisfaction with democracy .281 *** .009 .281 *** .009 .279 *** .009
Interest in politics -.292 *** .023 -.293 *** .023 -.292 *** .023
Contextual predictors
Welfare state - Post-socialist -.259 .535 -.140 .555
Welfare state - Nordic -.330 .372 -.339 .385
Welfare state - Conservative -.138 .298 -.165 .308
Welfare state - Mediterranean .475 .404 .580 .419
Welfare state - Liberal ref. ref. ref. ref.
Government effectiveness -.586 .553 -.648 .574
Corruption perception index
(CPI)
.056 * .019 .060 ** .020
GDP per capita .000 ** .000 .000 * .000
Left_right_gmc *
nordic_dummy
.003 .054
Left_right_gmc *
liberal_dummy
.047 .073
***p<0.001, **p<0.01, *p<0.05
MYPLACE August 2014
MYPLACE: FP7-266831www.fp7-myplace.eu Deliverable 4.6 Europe wide thematic report Page 119 of 431
5.4 Summary
In this chapter, we reported the findings of a cross-country analysis of youth attitudes
towards politicians and politics as well as trust ininstitutions.
Young people feel very much detached from politicians and tend to have a negative view of
them. Only 22% of our respondents agree with the statement: ‘politicians are interested in
young people like me’ whereas 60% agree with the statement ‘politicians are corrupt’ and
69% agree with the statement ‘the rich have too much influence in politics’. When
examined regionally, a majority of the Danish respondents actually agree that politicians are
interested in them whereas over 80% of our Greek respondents disagree.
On a 0 to 10 scale, young people tend not to trust the Prime Minister with an average value
of 4.3, parliament (4.5) and political parties (3.8) in their countries although the findings also
reveal country and regionally based patterns. The least trusting responses were
characteristic for young people from Greece, Croatia, Spain and Hungary, whereas Finland,
Georgia, Denmark, eastern and western Germany have levels of trust at the midpoint of the
scale.
The construction and testing of composite variables based on cross-country merged data
sets revealed that three items related to youth attitudes towards politics and politicians
constitute a one-dimensional scale of acceptable reliability. However, in order to reduce the
share of missing values we used only two items (Q6_2 and Q6_3) for the construction of the
‘Attitude towards politicians and politics’ scale, which also has higher reliability than the
three item scale.
Descriptive analyses revealed that young people in general have very negative attitudes
towards politicians and politics (mean=2.5, on scale from 0 to 8), whereas means scores by
locations range from 1.1 (in New Philadelphia Greece) to 4.6 in Odense Center (Denmark).
Thus, youth in almost all locations on average has negative attitudes towards politics and
politicians (with the exception of locations in Denmark and Finland where the average
attitude is neutral). The most negative attitudes towards politicians and politics were
characteristic for youth in Croatia, Slovakia, Portugal, Spain and Greece. Descriptive analyses
did not reveal significant differences in youth attitudes towards politics by locations within
countries.
With respect to analyses related to the construction and testing of composite variables
based on cross-country merged data about youth trust in 13 different institutions and
organisations we calculated two composite scores: overall trust in institutions (9 items) and
trust in national political institutions (3 items), both of which represent good scales.
Besides these composite results we also used one item measures towards specific
MYPLACE August 2014
MYPLACE: FP7-266831www.fp7-myplace.eu Deliverable 4.6 Europe wide thematic report Page 120 of 431
institutions: trust in national parliament and trust in European Commission depending on
the topic of further analysis.
Descriptive analyses revealed that young people are, characterised by a low level of trust in
institutions. The overall mean for trust in institutions and organisations is 43.6 (on a scale
from 0 to 90), while the overall mean for trust in national political institutions is 12.5 (on a
scale from 0 to 30). In both cases only in five out of 14 MYPLACE countries do young people
in both locations show trust levels above the midpoint of the scale (in Finland, Georgia,
Denmark, and Germany (eastern and western)). The lowest levels of overall trust towards
institutions as well trust in national political institutions were characteristic for youth in
Greece, Croatia, Spain and Hungary (and Portugal in the case of trust in national political
institutions). The descriptive analyses did not reveal significant differences in young people’s
general level of trust in institutions or their level of trust in national political institutions by
locations within countries.
Regarding the trust in national parliament the results were similar, youth expressed on
average medium levels of trust in national parliaments (mean=4.5 on a scale from 0 to 10),
which varies by location ranging from 2.6 in Pescenica (Croatia) to 6.5 in Odense Center
(Denmark). At the country level, only five of the MYPLACE countries show a level of trust in
the national parliament above the midpoint of the scale (Denmark, Finland, Georgia and
both eastern and western Germany), while the lowest level of trust in the national
parliament is characteristic for youth in both locations within Croatia, Greece and Hungary.
Average levels of trust in the European Commission is slightly higher than in national
parliament (5.2 on a scale from 0 to 10), although still moderate, with the highest mean
score in Telavi ( Georgia, mean=6.6) and the lowest mean score at two locations in Greece
(Argyroupouli, M=3.5 and New Philadelphia, mean=3.7). However, more than half of the
MYPLACE countries showed levels of trust in the European Commission above the midpoint
of the scale (Denmark, Finland, Georgia, eastern and western Germany, Spain and Portugal).
The lowest level of trust in the European Commission is characteristic for youth in locations
within Greece, Croatia, Slovakia and Hungary. Significant differences between locations
within countries in young people’s level of trust in national parliaments, as well as in the
European Commission, were more an exception than the rule. In the case of national
parliaments, differences were evident in three countries (Latvia, Russia and UK) while in the
case of the European Commission differences were found in four countries (UK, Latvia,
Estonia and Finland).
In order to explore the multivariate determinants of trust in national parliaments as well
trust in the European Commission, taking into account the nested structure of our data set,
we employed multilevel modelling. Initial results confirmed the justification of multilevel
analyses since it was demonstrated that 17% of the variance of trust in national parliaments,
MYPLACE August 2014
MYPLACE: FP7-266831www.fp7-myplace.eu Deliverable 4.6 Europe wide thematic report Page 121 of 431
and 7% of the variance of trust in the European Commission can be explained at the level of
countries. The percentage of variance which could be explained at the level of locations
within countries was much lower: 2% in case of trust in national parliaments; and 2% of the
variance in the case of trust in the European Commission. Such findings are in accordance
with the above and suggest relatively rare significant differences in youth levels of trust in
institutions between the two contrasting locations within countries. Thus, regarding the first
hypothesis according to which youth trust in national parliaments and trust in the European
Commission are differentiated by individual level characteristics as well as location and
country level characteristics, the above findings demonstrate that country level
characteristics are more important determinants of youth trust in national parliaments and
the European Commission than location level characteristics. Additionally they indicate
country level characteristics are more important determinants of trust in national
parliaments than trust in the European Commission. In further analyses we tested several
individual and country level characteristics as potential determinants of trust in national
parliaments as well as trust in the European Commission. Both regression analysis at the
individual level included the main socio-demographic variables (gender, age and social
class) and additional individual level variables, which represent more general dispositions
relevant in the context of trust in institutions such as social trust and life satisfaction, as well
as more politically relevant attitudes such as interest in politics (composite measure) and
satisfaction with democracy. Additionally, analyses of trust towards national parliaments
included a variable on ‘lack of care’ operationalised as agreement with the statement
Politicians are interested in young people like me. These individual level variables explained
29% of variance in trust in national parliaments within countries, and 19% of variance in
trust in the European Commission. This difference probably could be attributed to the fact
that the model with trust in the national parliament contained one more individual level
variable than the model with trust in the European Commission as a dependent variable,
which is, moreover, confirmed as the most important predictor of trust in the national
parliament (the variable concerning politicians’ ‘care’ about ‘young people like me’).
As the individual level determinants of trust in the national parliament analysis revealed, all
socio-demographic variables were significant8; higher trust in national parliament is more
characteristic for females as well as youth with higher and highest social class and younger
youth. In the case of trust in the European Commission the results were similar with regard
to gender and social class; however, age was not confirmed as an important independent
predictor of trust in the European Commission. Among other individual level variables, life
satisfaction, satisfaction with democracy and interest in politics are confirmed as significant
independent predictors of trust in national parliaments as well as trust in the European
Commission. This indicates that young people who are more satisfied with life in general,
and with democracy in their country, are particularly characterised by higher levels of trust
8 Due to the large N we are taking into account only variables which are significant on p<0.01
MYPLACE August 2014
MYPLACE: FP7-266831www.fp7-myplace.eu Deliverable 4.6 Europe wide thematic report Page 122 of 431
in national parliaments as well as in the European Commission. However, it seems that the
role of interest in politics is different for the case of trust in national parliament and the
European Commission. Namely, in the case of trust in national parliaments higher levels of
trust were more characteristic for those who have greater interest in politics, while, in the
case of trust in the European Commission. those who have greater interest in politics
showed lower levels of trust. These findings might be verified by employing other
operationalisations of interest in politics such as one based not only on self-reported
political interest but also a measure of following politics in the media. Additionally, these
findings could be a result of the presence of an additional individual level variable in the
individual level model of trust in national parliaments (whether politicians are interested in
‘young people like me’).
In the second model we tested the effect of country level variables: welfare state,
corruption perception index and rule of law estimate in the case of trust towards national
parliaments; and welfare state, corruption perception index, government effectiveness and
GDP per capita in analyses of trust in the European Commission. We did not confirm
significant (p<.01) effects for these variables in the case of trust in national parliaments. In
case of the European Commission, only the effect of GDP was significant (p<.01), but this
was negligible.
Finally, in the third model we tested the interaction between one individual level variable
and one country level variable in order to test the hypothesis that the relationship between
individual level determinants of trust in national parliaments and the European Commission
depends on context (specific location or country). In the case of trust in national parliament
our hypothesis was that the effect of an individual’s perception of politicians’ interest in
young people (care about young people like me) as an individual level determinant of trust
in national parliament could depend on a country’s level of corruption (CPI). In the case of
trust in the European Commission our hypothesis was that the effect of left-right political
ideology as an individual level variable could depend on the type of welfare state. However,
we did not confirm these expectations. Thus, it might be concluded, that we did not confirm
the general hypothesis according to which the relationship between individual level
determinants of trust towards national parliament and the European Commission depends
on context (specific location or country). However, it should be stressed that this does not
mean that this general hypothesis is not correct; it only means that it is not confirmed by
those combinations of variables included in the models tested here.
MYPLACE August 2014
MYPLACE: FP7-266831www.fp7-myplace.eu Deliverable 4.6 Europe wide thematic report Page 123 of 431
References
Armingeon, K., and Ceka, B. (2014). The loss of trust in the European Union during the great
recession since 2007: The role of heuristics from the national political system. European
Union Politics, 15: 82-107.
Arnold, C., Sapir, E.V., Zapryanova, G. (2012): ‘Trust in the institutions of the European
Union: A cross - country examination’ In: Beaudonnet, Laurie and Danilo Di Mauro (eds)
‘Beyond Euro - skepticism: Understanding attitudes towards the EU ’, European integration
online Papers (EIoP),Special Mini-Issue 2,Vol. 16, Article 8,
http://eiop.or.at/eiop/texte/2012-008a.htm.
Banaji, S., Buckingham, D., 2010. Young People, the Internet, and Civic Participation: An
Overview of Key Findings from the CivicWeb Project. International Journal of Learning and
Media 2, 15-24
de Vries, C.E. and van Kersbergen, K. (2007). Interests, Identity and Political Allegiance in
the European Union. Acta Politica, 42(2-3), 307-328.
Fisher, J., Van Heerde, J. and Tucker, A. (2010), Does One Trust Judgement Fit All? Linking
Theory and Empirics. The British Journal of Politics and International Relations, 12: 161–188.
doi: 10.1111/j.1467-856X.2009.00401.x
Hakhverdian, A., and Mayne, Q. (2012). Institutional trust, education, and corruption: a
micro-macro interactive approach. The Journal of Politics, 74(03), 739-750.
Henn, M., and Foard, N. (2012). Young people, political participation and trust in Britain.
Parliamentary affairs, 65(1), 47-67
Hooghe, M., and Wilkenfeld, B. (2008). The stability of political attitudes and behaviors
across adolescence and early adulthood: A comparison of survey data on adolescents and
young adults in eight countries. Journal of Youth and Adolescence, 37(2), 155-167.
Jan, T., Charron, N., Dahlberg, S., Holmberg, S., Rothstein, B., Sundin, P. and Svensson, R.
(2013). The Quality of Government Basic Dataset made from The Quality of Government
Dataset, version 15May13. University of Gothenburg: The Quality of Government Institute,
http://www.qog.pol.gu.se.
MYPLACE August 2014
MYPLACE: FP7-266831www.fp7-myplace.eu Deliverable 4.6 Europe wide thematic report Page 124 of 431
King, D. C. (1997). The Polarization of American Parties and Mistrust of Government. In: J.S.
Nye, P. D. Zelikow and D. C. King (Eds). Why People Don’t Trust Government. Cambridge,
Mass.: Harvard University Press.
Marien, S. (2011). Measuring Political Trust Across Time and Space. In: Hooghe M., Zmerli S.
(Eds.), Political Trust. Why Context Matters, Chapt. 2. Colchester: ECPR Press, 13-46.
Marks, G. and Hooghe, L. (2003). National Identity and Support for European Integration.
Wissenschaftszentrum Berlin für Sozialforschung (WZB), 1-40.
McLaren, L. (2007). Explaining Mass-Level Euroscepticism: Identity, Interests and
Institutional Distrust. Acta Politica, 42(2-3), 233-251.
Mishler, W., and Rose, R. (2001). What are the origins of political trust? Testing institutional
and cultural theories in post-communist societies. Comparative political studies, 34(1), 30-
62.
Mondak, J.J. and Halperin, K.D. (2008). A Framework for the Study of Personality and
Political Behavior. British Journal of Political Science, 38(2), 335-362.
Muñoz, J., Torcal, M., and Bonet, E. (2011). Institutional trust and multilevel government in
the European Union: Congruence or compensation?. European Union Politics, 12(4), 551-
574.
Newton, K. (2013). Social and Political Trust. Norwegian Social Science Data Services
(http://essedunet.nsd.uib.no/cms/topics/2/3/)
Newton, K., and Norris, P. (2000). Confidence in Public Institutions: Faith, Culture, or
Performance. In S. J. Pharr and R. D. Putnam (Eds.), Disaffected Democracies: What's
Troubling the Trilateral Countries? (pp. 52-73). Princeton: Princeton University Press.
Norris, P. (1999). Institutional Explanations for Political Support. In: P. Norris, (Ed.), Critical
Citizens: Global Support for Democratic Governance. Oxford: Oxford University Press, pp.
217-236.
Roth F., Nowak-Lehmann D. F. and Otter, T. (2013). Crisis and Trust in National and
European Union Institutions — Panel Evidence for the EU, 1999 to 2012. European University
Institute.
Scheuer, A. and van der Brug, W. (2007). Locating Support for European Integration. In: W.
van der Brug and C. van der Eijk, (Eds). European Elections and Domestic Politics. Lessons
from the Past and Scenarios for the Future. Notre Dame. University of Notre Dame Press, 94-
116.
MYPLACE August 2014
MYPLACE: FP7-266831www.fp7-myplace.eu Deliverable 4.6 Europe wide thematic report Page 125 of 431
Schoon, I., and Cheng, H. (2011). Determinants of Political Trust: A Lifetime Learning Model.
Developmental Psychology, 47 (3), 619 631. doi: 10.1037/a0021817
Torney-Purta, J., Barber, C. H., and Richardson, W. K. (2004). Trust in Government-related
Institutions and Political Engagement among Adolescents in Six Countries. Acta Politica,
39(4), 380-406.
van der Meer, T. (2010). In what we trust? A multi-level study into trust in parliament as an
evaluation of state characteristics. International review of administrative sciences, 76(3),
517-536.
van der Meer, T. and Dekker, P. (2011). Trustworthy state, trusting citizens? A multilevel
study into objective and subjective determinants of political trust. In: S. Zmerli, and M.
Hooghe (Eds.), Political Trust: Why Context Matters (p. 95-116), ECPR Press.
White, C., Bruce, S., and Ritchie, J. (2000). Young people's politics: Political interest and
engagement amongst 14-24 year olds. Layerthorpe: York Publishing Services.
MYPLACE August 2014
MYPLACE: FP7-266831www.fp7-myplace.eu Deliverable 4.6 Europe wide thematic report Page 126 of 431
Chapter 5: Appendix 1 Country-level variables
Government Effectiveness - Estimate (gov_eff) - Government Effectiveness combines
into a single grouping responses on the quality of public service provision, the quality
of the bureaucracy, the competence of civil servants, the independence of the civil service
from political pressures, and the credibility of the government’s commitment to policies.
The main, focus of this index is on “inputs” required for the government to be able to
produce and implement good policies and deliver public goods. Source: Quality of
Government Institute database (Jan et al., 2013)
Rule of Law – Estimate (rule_law) - Rule of Law includes several indicators which, measure
the extent to which agents have confidence in and abide, by the rules of society. These
include perceptions of the incidence of crime, the effectiveness and predictability of
the judiciary, and the enforceability of contracts. Together, these indicators measure
the success of a society in developing an environment in which fair and predictable
rules form the basis for economic and social interactions and the extent to which property
rights are protected. Source: Quality of Government Institute database (Jan et al., 2013)
GDP per Capita, PPP, Constant International USD (GDP_per_capita) - GDP per capita based
on purchasing power parity (PPP). PPP GDP is gross domestic product converted to
international dollars using purchasing power parity rates. An international dollar has the
same purchasing power over GDP as the U.S. dollar has in the United States. GDP at
purchaser's prices is the sum of gross value added by all resident producers in the
economy plus any product taxes and minus any subsidies not included in the value of
the products. It is calculated without making deductions for depreciation of fabricated
assets or for depletion and degradation of natural resources. Data are in constant 2005
international dollars. Source: Quality of Government Institute database (Jan et al., 2013)
Corruption perception index (CPI) - In addition to these three contextual variables taken
from Quality of Government Institute database (Jan et al., 2013), we have additionally
included a widely used Transparency International’s measure of corruption – Corruption
perception index (CPI). CPI scores and ranks countries based on how corrupt a country’s
public sector is perceived to be. Varieties of institutions participate in collection of data for
creation of this composite index. Since there is no meaningful way to assess levels of
corruption in different countries because they are usually comprised of illegal activities that
are, deliberately hidden, CPI is capturing perceptions of corruption of those in a position to
offer assessments of public sector corruption.
MYPLACE August 2014
MYPLACE: FP7-266831www.fp7-myplace.eu Deliverable 4.6 Europe wide thematic report Page 127 of 431
Chapter 6. Political Activism
In this chapter we examine a set of questions related to youth political activism and civic
engagement. Voting behaviour is one of the most important indicators of the relationship
between citizens and political organisations, and is essential to the legitimisation of political
power (Viegas and Faria, 2003) as well as being fundamental in the support of the
democratic system. While in recent decades there has been a significant decrease in the
rates of electoral turnout in most European countries (http://www.parties-and-
elections.eu/), of most significance to MYPLACE is the fact that throughout Europe it is
among young people that participation tends to be weakest (Fieldhouse et al.,2007;
Goerras, 2007), falling short of the level of participation among older age cohorts. Research
on this issue has shown that young people who do not exercise their right to vote the first
two opportunities for which they are eligible will probably turn into recurrent abstainers
(EACEA, 2013). This data supports the urgency of bringing this issue into the centre of
debate in order to identify the causes and to identify adequate solutions to this problem. In
this context, the objectives and methodologies adopted by MYPLACE can make an
important contribution to this discussion, encompassing 14 countries with very different
cultural, political and socio-economic backgrounds. Framing electoral behaviour with other
political and civic participation practices thus gives MYPLACE a vantage point onto a wider
understanding of this phenomenon.
In the last few decades, non-electoral participation activities have been increasingly used to
explain citizens’ political activism and particularly, the political activism of young people.
Several studies have demonstrated that electoral participation has decreased in younger
generations (Franklin et al., 2004; Putnam 2000; Pirie and Worcester 1998). However, and in
parallel, some other forms of participation have taken a growing role in explaining how
young people relate to politics. In particular, in most European countries an increase in
protest actions, political consumerism or Internet political activities have been detected
(Norris, 2004; Zukin et al., 2006; Dalton 2008; Michelletti, Follesdal and Stolle 2003; Stolle
and Hooghe, 2005). Young people seem to be diversifying the mechanisms that they use to
participate as they have a wider conceptualisation of the political (Henn et al., 2002; O'Toole
2003; Manning 2010). Consequently, in order to understand how young people behave
politically, it is necessary to have a complete battery of different political actions. One of
the analytical departing points of the MYPLACE project has been to approach the political
views and involvement of young people in a comprehensive way. Therefore, it was
necessary to consider a large number of political activities from different natures in order to
allow different approaches to political activism to emerge. To do so, the MYPLACE survey
includes a complete battery of 20 different non-electoral political actions (Q16) where
different dimensions of political activism can be found, such as classic institutional
participation actions (like volunteering in an election campaign or contacting politicians),
MYPLACE August 2014
MYPLACE: FP7-266831www.fp7-myplace.eu Deliverable 4.6 Europe wide thematic report Page 128 of 431
confrontational protest (like participating in a violent political event, occupying buildings or
blocking street), Internet activities (like uploading political material to the Internet, writing
in a blog) or expressive activities (like wearing a badge with a political message), among
many others.
In previous analyses from the MYPLACE project, this battery of political actions has already
been analysed for each country. These national reports (deliverables D4.5) have
demonstrated the great diversity of actions that young people use to participate. However,
these reports have also pointed out a great deal of diversity on both the level and the type
of participation among the European localities included in the MYPLACE project. In this
chapter, we want to go delve deeper into these differences.
6.1 Voting behaviour (Q8-Q13)
MYPLACE findings show that less than half (43.1%) of a total of 16,727 respondents
reported casting a vote in their country’s last national elections. Moreover, only 31% in a
total of 15,469 have voted in the last local elections. From those who did not vote in
national elections, 67.6% out of a total of 9,183 respondents were not eligible, 12.8% stated
that they would have liked to have voted but were unable to do so on that day, 6.4%
decided not to vote because there was no party aligned with their views, for 8.7% voting or
not voting was seen as equally pointless and finally 4.5% did not vote to show their
dissatisfaction with politicians and parties. Regarding local elections, the results are similar:
65% in a total of 10,774 respondents were not eligible to vote, 16% would have liked to
have voted but were unable to do it on the day, 6.7% decided not to vote because there was
no party aligned with their views, for 8.9% voting or not voting is equally pointless and 3.4%
did not vote to show their dissatisfaction with politicians and parties.
These results show that the main reason for not casting a vote in the last elections (national
or local) was simply not being eligible. This means that to capture meaningful motives for
not voting among the ones that had the right to do so requires the exclusion of the non-
eligible from the analysis. After this, it is admissible to say that 69% of the respondents
declared they went to the polls to vote in the last national elections. However, turnout rates
differ significantly from country to country. Denmark (93%), eastern Germany (84%) and
Spain (80%) have the highest turnout rates while Portugal (59%), Russia (50%) and UK (44%)
have the lowest. In local elections turn outs are even lower: 54% of eligible respondents
report that they voted in the last local elections. Spain (76%), Greece (70%) and eastern
Germany (69%) have the top positions; Russia (42%), Slovakia (36%) and UK (33%) were
bottom.
MYPLACE August 2014
MYPLACE: FP7-266831www.fp7-myplace.eu Deliverable 4.6 Europe wide thematic report Page 129 of 431
According to the literature, there are several variables that have to be considered in the
analysis of voting behaviour. The first set encompasses socio-demographic factors,
portraying the first picture of our research target and possible predictors of our dependent
variable – vote behaviour. Age is one of most meaningful variables in respect to voting
behaviour or elections turnout. Research has indicated a positive relationship between age
and turnout (Henn et al., 2002; Magalhães, 2001; Freire, 2001; Fieldhouse et al., 2007). In
other words, it is among the youngest that it is possible to find higher rates of electoral
turnout. On the other hand, gender displays a weaker or absent relation with turnout rates
(Viegas and Faria, 2004). However, while not statistically significant, women show higher
turnout rates (Fieldhouse et al., 2007; Viegas and Faria, 2004), and it is always important to
understand the behaviour of this independent variable.
Another important independent variable is education. The literature demonstrates that less
educated people tend to vote less frequently (Viegas and Faria, 2004; Fieldhouse et al.,
2007). Given that a large proportion of our respondents are, still in education we might
predict a negative relationship between education and voting behaviour among our sample.
Being religious is one of variables that is also positively related with voting behaviour,
according to Fieldhouse et al.(2007) respondents that declare themselves religious are more
likely to vote. This tends to happen because religious practices are considered a form of
social participation; therefore those who have a higher level of social participation in society
tend also to have higher political participation (Jonas-Correa and Leal, 2001).
Regarding employment status, Fieldhouse et al.(2007) reveal that there is no impact of
employment status on turnout rates; however, Viegas and Faria (2004) found contradictory
results, with active (employed) people tending to abstain more often. Considering that
youth unemployment is an important issue to Europe and to a significant proportion of
MYPLACE countries, it is essential to analyse how this independent variable may influence
turnout rates. Also important is social class. According to Flanagan and Levine (2010),
parents of high socio-economic status pass on to their children political awareness and
access to community and education resources, which leads to increased political
participation. This may have an important effect among MYPLACE respondents. Regarding
ethnic minorities, it is well documented that minorities tend to have less political
participation and lower electoral turnout. Therefore we expect to find similar results among
MYPLACE respondents.
Despite the significance of socio-economic variables to the understanding of the levels of
political participation, several other variables should also be considered. However, the
choice of these variables depends on the theoretical model adopted to explain the general
political participation and voting behaviour in particular. Among the various theories that
have emerged to explain this phenomenon, three have been highlighted in the literature
MYPLACE August 2014
MYPLACE: FP7-266831www.fp7-myplace.eu Deliverable 4.6 Europe wide thematic report Page 130 of 431
(Fieldhouse et al., 2007): rational choice theory (or general incentives), social capital theory
and the theory of civic voluntarism.
The theory of rational choice, accentuates the utility character of the vote. The vote is seen
as an investment in which participants expect to get some benefit from the victory of the
candidate they support. Social capital is based on the assumption that volunteer activities
encourage trust in others and encourage political activism (Putnam, 1993). Studies based on
the importance of social capital to voting behaviour try to observe the relatively minor
involvement of young people in civil society and also a lesser connection to the ideals of
democracy and democratic institutions, compared with older age groups (Huggins, 2001).
Young people are also the less trusting in governments and political institutions (Nye, 1997).
The last model - civic voluntarism - is based on the assumption that citizens with more
resources participate most in politics, i.e., young people’s low participation in political life is
associated with their lack of resources to establish connections with political institutions
and the sense of duty of the electorate as a whole. There are a number of studies that
suggest that young people in many countries are decoupled from the central aspects of
politics (Wattenbergm, 2002; Park, 2000). The model of civic voluntarism groups a set of
concepts in particular the level of involvement of young people in society, the political
efficacy (in other words, the perception that common citizens can change politics); the
concept of civic duty and finally the level of involvement of the respondents in politics are
the key variables to support this theoretical model. In order to analyse voting behaviour we
have decided to choose this last model; however, it was necessary to do make some
adaptations, as some variables such as civic duty were not included in the questionnaire.
As important as studying the individual characteristics of voters is the context in which they
are immersed. MYPLACE respondents are, nested in localities, which in turn are located in
countries. In this sense, it is important to consider other exogenous variables that may
influence voting behaviour, such as welfare state regimes and differences among political
systems. In order to analyse the impact of these factors on voting behaviour we have
introduced some contextual variables such as welfare regime, number of representation
cameras and type of parliamentary representation. According to Lister (2007) the model of
welfare state influences social norms and hence individual behaviour. In more egalitarian
societies with a Universalist Welfare State, it is predictable to find higher levels of political
participation. Some studies point out that countries with bicameral systems tend to have
higher rates of turnout due to the competition between the two bodies. Regarding types of
representation, the literature states that countries with proportional representation reveal
higher rates of turnout. This may happen because voters can be sure that they will be
represented in parliament even if it is only the opposition bench.
Analysing such variables entails considering a new level of analysis, which calls for a
multilevel modeling, balancing contextual variables with individual voter characteristics. In
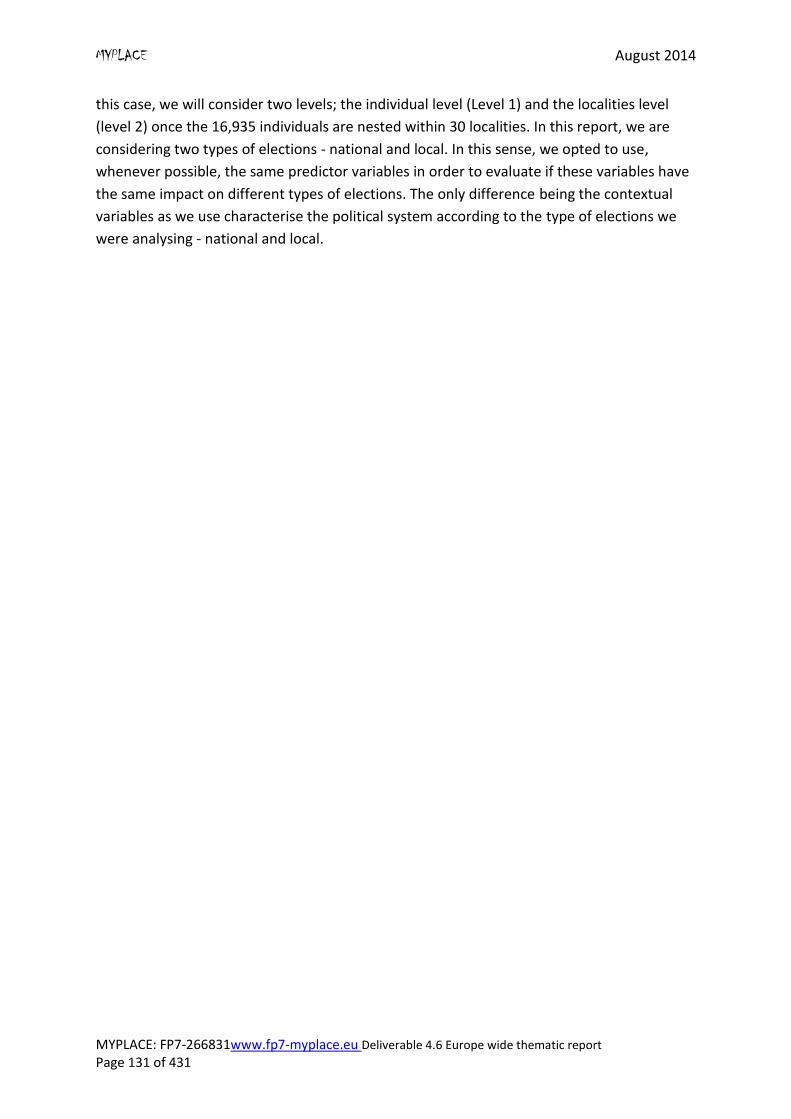
MYPLACE August 2014
MYPLACE: FP7-266831www.fp7-myplace.eu Deliverable 4.6 Europe wide thematic report Page 131 of 431
this case, we will consider two levels; the individual level (Level 1) and the localities level
(level 2) once the 16,935 individuals are nested within 30 localities. In this report, we are
considering two types of elections - national and local. In this sense, we opted to use,
whenever possible, the same predictor variables in order to evaluate if these variables have
the same impact on different types of elections. The only difference being the contextual
variables as we use characterise the political system according to the type of elections we
were analysing - national and local.
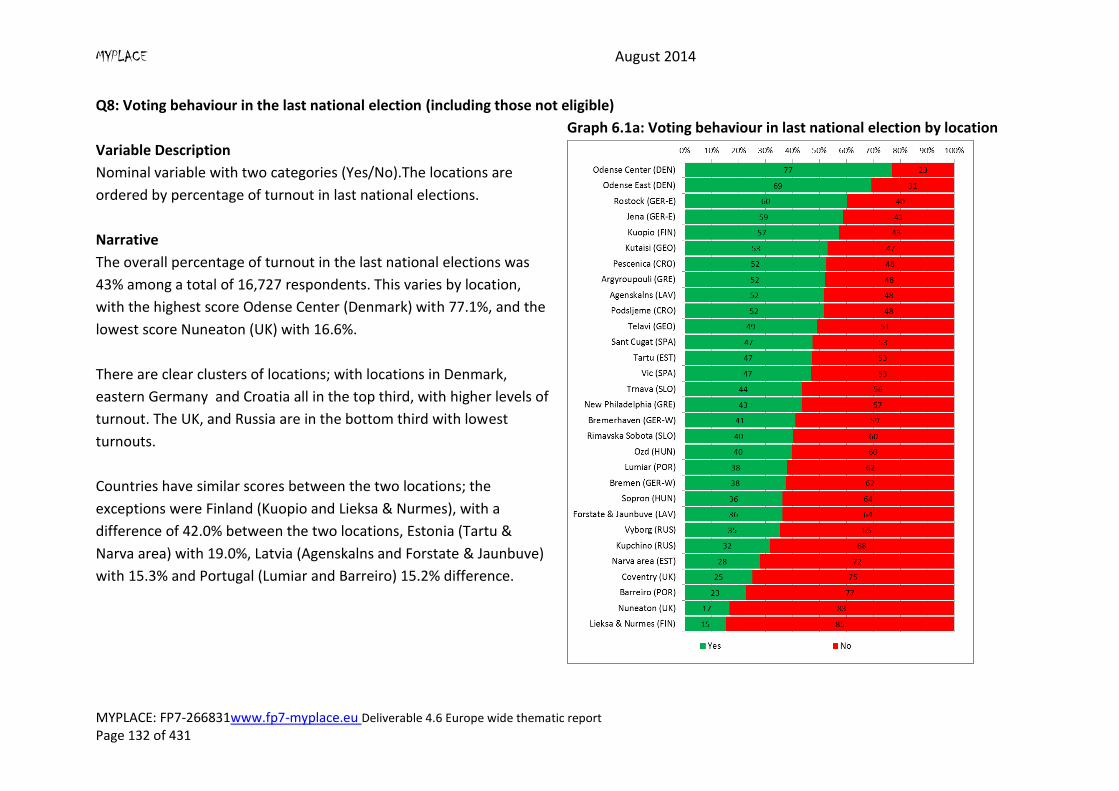
MYPLACE August 2014
MYPLACE: FP7-266831www.fp7-myplace.eu Deliverable 4.6 Europe wide thematic report Page 132 of 431
Q8: Voting behaviour in the last national election (including those not eligible)
Variable Description
Nominal variable with two categories (Yes/No).The locations are
ordered by percentage of turnout in last national elections.
Graph 6.1a: Voting behaviour in last national election by location
Narrative
The overall percentage of turnout in the last national elections was
43% among a total of 16,727 respondents. This varies by location,
with the highest score Odense Center (Denmark) with 77.1%, and the
lowest score Nuneaton (UK) with 16.6%.
There are clear clusters of locations; with locations in Denmark,
eastern Germany and Croatia all in the top third, with higher levels of
turnout. The UK, and Russia are in the bottom third with lowest
turnouts.
Countries have similar scores between the two locations; the
exceptions were Finland (Kuopio and Lieksa & Nurmes), with a
difference of 42.0% between the two locations, Estonia (Tartu &
Narva area) with 19.0%, Latvia (Agenskalns and Forstate & Jaunbuve)
with 15.3% and Portugal (Lumiar and Barreiro) 15.2% difference.
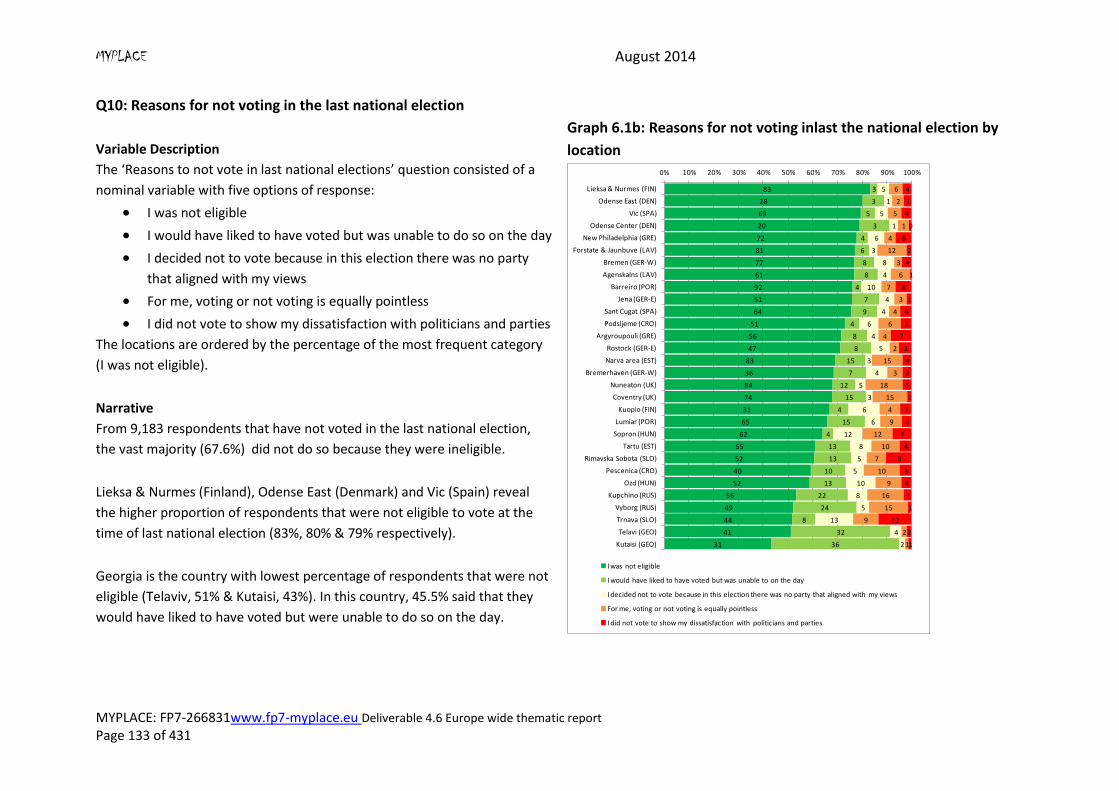
MYPLACE August 2014
MYPLACE: FP7-266831www.fp7-myplace.eu Deliverable 4.6 Europe wide thematic report Page 133 of 431
Q10: Reasons for not voting in the last national election
Variable Description
The ‘Reasons to not vote in last national elections’ question consisted of a
nominal variable with five options of response:
I was not eligible
I would have liked to have voted but was unable to do so on the day
I decided not to vote because in this election there was no party
that aligned with my views
For me, voting or not voting is equally pointless
I did not vote to show my dissatisfaction with politicians and parties
The locations are ordered by the percentage of the most frequent category
(I was not eligible).
Graph 6.1b: Reasons for not voting inlast the national election by
location
Narrative
From 9,183 respondents that have not voted in the last national election,
the vast majority (67.6%) did not do so because they were ineligible.
Lieksa & Nurmes (Finland), Odense East (Denmark) and Vic (Spain) reveal
the higher proportion of respondents that were not eligible to vote at the
time of last national election (83%, 80% & 79% respectively).
Georgia is the country with lowest percentage of respondents that were not
eligible (Telaviv, 51% & Kutaisi, 43%). In this country, 45.5% said that they
would have liked to have voted but were unable to do so on the day.
83
28
69
20
72
81
77
61
92
51
64
51
56
47
83
36
84
74
31
65
62
55
52
40
52
56
49
44
41
31
3
3
5
3
4
6
8
8
4
7
9
4
8
8
15
7
12
15
4
15
4
13
13
10
13
22
24
8
32
36
5
1
5
1
6
3
8
4
10
4
4
6
4
5
3
4
5
3
6
6
12
8
5
5
10
8
5
13
4
2
6
2
5
1
4
12
3
6
7
3
4
6
4
2
15
3
18
15
4
9
12
10
7
10
9
16
15
9
2
1
4
1
4
0
6
2
4
1
8
1
4
3
7
3
4
2
5
2
2
4
7
4
9
3
4
3
1
12
2
1
0% 10% 20% 30% 40% 50% 60% 70% 80% 90% 100%
Lieksa & Nurmes (FIN)
Odense East (DEN)
Vic (SPA)
Odense Center (DEN)
New Philadelphia (GRE)
Forstate & Jaunbuve (LAV)
Bremen (GER-W)
Agenskalns (LAV)
Barreiro (POR)
Jena (GER-E)
Sant Cugat (SPA)
Podsljeme (CRO)
Argyroupouli (GRE)
Rostock (GER-E)
Narva area (EST)
Bremerhaven (GER-W)
Nuneaton (UK)
Coventry (UK)
Kuopio (FIN)
Lumiar (POR)
Sopron (HUN)
Tartu (EST)
Rimavska Sobota (SLO)
Pescenica (CRO)
Ozd (HUN)
Kupchino (RUS)
Vyborg (RUS)
Trnava (SLO)
Telavi (GEO)
Kutaisi (GEO)
I was not eligible
I would have liked to have voted but was unable to on the day
I decided not to vote because in this election there was no party that aligned with my views
For me, voting or not voting is equally pointless
I did not vote to show my dissatisfaction with politicians and parties
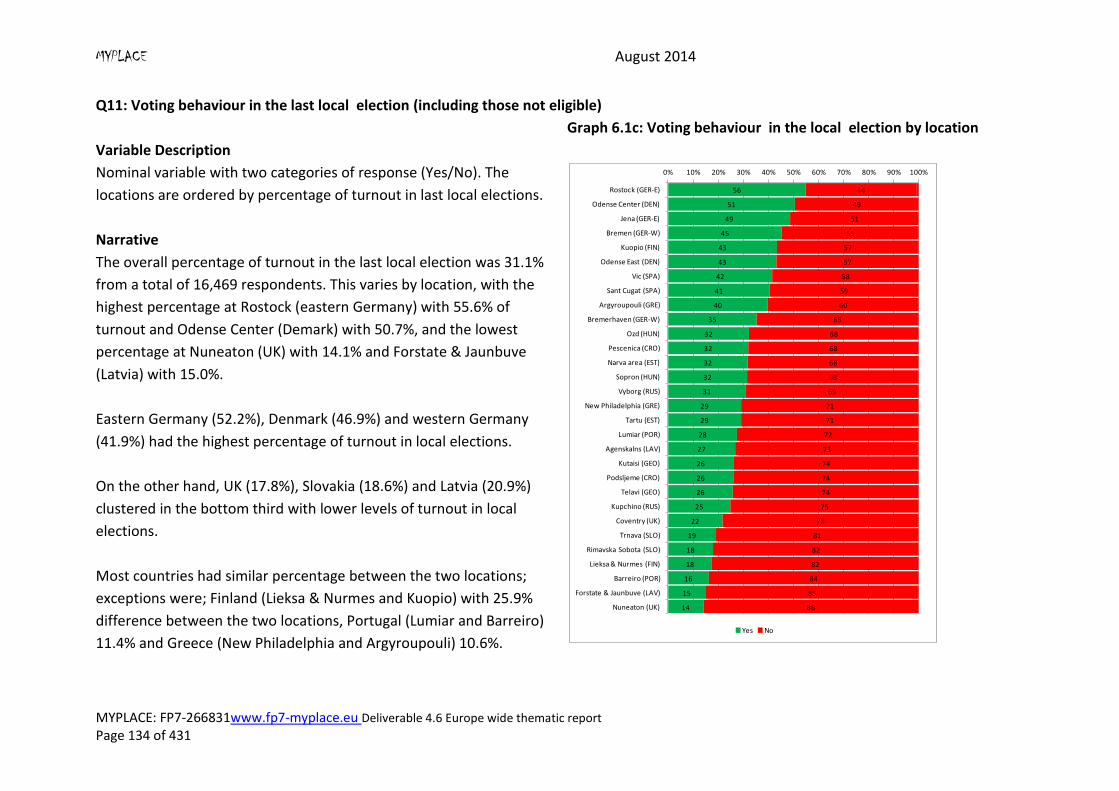
MYPLACE August 2014
MYPLACE: FP7-266831www.fp7-myplace.eu Deliverable 4.6 Europe wide thematic report Page 134 of 431
Q11: Voting behaviour in the last local election (including those not eligible)
Variable Description
Nominal variable with two categories of response (Yes/No). The
locations are ordered by percentage of turnout in last local elections.
Graph 6.1c: Voting behaviour in the local election by location
Narrative
The overall percentage of turnout in the last local election was 31.1%
from a total of 16,469 respondents. This varies by location, with the
highest percentage at Rostock (eastern Germany) with 55.6% of
turnout and Odense Center (Demark) with 50.7%, and the lowest
percentage at Nuneaton (UK) with 14.1% and Forstate & Jaunbuve
(Latvia) with 15.0%.
Eastern Germany (52.2%), Denmark (46.9%) and western Germany
(41.9%) had the highest percentage of turnout in local elections.
On the other hand, UK (17.8%), Slovakia (18.6%) and Latvia (20.9%)
clustered in the bottom third with lower levels of turnout in local
elections.
Most countries had similar percentage between the two locations;
exceptions were; Finland (Lieksa & Nurmes and Kuopio) with 25.9%
difference between the two locations, Portugal (Lumiar and Barreiro)
11.4% and Greece (New Philadelphia and Argyroupouli) 10.6%.
56
51
49
45
43
43
42
41
40
35
32
32
32
32
31
29
29
28
27
26
26
26
25
22
19
18
18
16
15
14
44
49
51
55
57
57
58
59
60
65
68
68
68
68
69
71
71
72
73
74
74
74
75
78
81
82
82
84
85
86
0% 10% 20% 30% 40% 50% 60% 70% 80% 90% 100%
Rostock (GER-E)
Odense Center (DEN)
Jena (GER-E)
Bremen (GER-W)
Kuopio (FIN)
Odense East (DEN)
Vic (SPA)
Sant Cugat (SPA)
Argyroupouli (GRE)
Bremerhaven (GER-W)
Ozd (HUN)
Pescenica (CRO)
Narva area (EST)
Sopron (HUN)
Vyborg (RUS)
New Philadelphia (GRE)
Tartu (EST)
Lumiar (POR)
Agenskalns (LAV)
Kutaisi (GEO)
Podsljeme (CRO)
Telavi (GEO)
Kupchino (RUS)
Coventry (UK)
Trnava (SLO)
Rimavska Sobota (SLO)
Lieksa & Nurmes (FIN)
Barreiro (POR)
Forstate & Jaunbuve (LAV)
Nuneaton (UK)
Yes No
MYPLACE August 2014
MYPLACE: FP7-266831www.fp7-myplace.eu Deliverable 4.6 Europe wide thematic report Page 135 of 431
Q13: Reasons for not voting in the last local election
Variable Description
There were five ‘Reasons to not vote in last local elections’
represented in a nominal variable. The locations are ordered by the
percentage of the most frequent category (I was not eligible).
Graph 6.1d: Reasons for not voting in the local election by location
Narrative
From 10,774 respondents that did not vote in the last local elections
the majority (63.6%) did not vote because they were not eligible;
15.9% were unable to do it on the day; 6.7% decided not to vote
because there was no party that aligned with their views; 8.9%
believed that voting or not voting is equally pointless and 3.6% did not
do it because they were disappointed with politicians and parties.
Barreiro (Portugal), Lieksa & Nurmes (Finland) and Forstate &
Jaunbuve (Latvia) reveal the higher proportion of respondents that
were not eligible at the time of last local election (82%, 82% and 81%
respectively).
Georgia (Kutaisi and Telavi) had the highest percentage of
respondents that did not vote because they were unable to on the
day even though they were eligible to do so.
82
61
85
57
57
68
57
59
70
66
52
60
59
26
52
37
46
21
56
48
51
36
46
44
37
20
35
24
20
35
3
3
8
4
6
7
5
5
13
10
5
11
10
8
25
13
6
6
16
14
16
12
32
18
16
15
22
18
12
19
5
3
4
4
3
5
4
5
3
4
3
5
7
3
3
6
10
3
4
5
10
8
2
8
9
3
3
6
7
5
6
5
7
4
4
3
3
4
5
4
7
7
10
4
1
3
9
4
16
15
6
6
1
13
8
3
13
3
6
19
4
2
1
3
3
4
5
3
1
4
3
2
3
1
2
1
5
1
4
2
6
3
1
3
3
2
1
2
2
4
0% 10% 20% 30% 40% 50% 60% 70% 80% 90% 100%
Barreiro (POR)
Lieksa & Nurmes (FIN)
Forstate & Jaunbuve (LAV)
Sant Cugat (SPA)
Vic (SPA)
New Philadelphia (GRE)
Argyroupouli (GRE)
Podsljeme (CRO)
Agenskalns (LAV)
Rimavska Sobota (SLO)
Pescenica (CRO)
Lumiar (POR)
Tartu (EST)
Odense East (DEN)
Telavi (GEO)
Jena (GER-E)
Sopron (HUN)
Odense Center (DEN)
Nuneaton (UK)
Coventry (UK)
Trnava (SLO)
Bremen (GER-W)
Kutaisi (GEO)
Kupchino (RUS)
Ozd (HUN)
Bremerhaven (GER-W)
Vyborg (RUS)
Rostock (GER-E)
Kuopio (FIN)
Narva area (EST)
I was not eligible
I would have liked to have voted but was unable to on the day
I decided not to vote because in this election there was no party that aligned with my views
For me, voting or not voting is equally pointless
I did not vote to show my dissatisfaction with politicians and parties
MYPLACE August 2014
MYPLACE: FP7-266831www.fp7-myplace.eu Deliverable 4.6 Europe wide thematic report Page 136 of 431
6.2 Closeness with political parties (Q14-Q15)
Parties are an important intermediary between citizens and the state. They have a
fundamental role in democracy as they allow citizens to socialise political issues, and they
aggregate preferences, organise ideas, practices and priorities around ideological
orientations (Hoogle and Kern, 2013). However, in recent years their role in the political
system has changed. But even more relevant than the change in the importance of parties in
the political system was what has changed in respect to the role of citizens in the
development of party activities. Parties are increasingly professionalized and less dependent
on citizens, financially and logistically. The emergence in Europe of several cases of
independent candidates who are not, affiliated with a particular party has gained relevance
in the political landscape. These changes that have occurred in recent decades raise
questions about the importance of the proximity between citizens and parties and the role
of parties in the democratic system.
Our findings show that young people are the group with the most tenuous connection to
political parties. The decrease of importance of formal linkages to political parties widens
the interest of studying the informal relations between citizens and parties and the degree
of closeness with political parties. Although closeness with political parties or party
identification is not a sine qua non condition to political and electoral participation, it may
consist on a crucial indicator of the predisposition to exert both (Blaís et al., 2001).
In this report, besides the importance of socio-demographic variables we intend to verify
the nature of the relationship between political participation, political efficacy and trust in
political systems influence, closeness to a party and in which way this influence take place.
We predict that political participation, political efficacy and trust in political systems has a
positive impact on the closeness to political party.
MYPLACE August 2014
MYPLACE: FP7-266831www.fp7-myplace.eu Deliverable 4.6 Europe wide thematic report Page 137 of 431
Q14: Closeness with political parties
Variable Description
Nominal variable with two categories of response (Yes/No). The
locations are ordered by percentage of respondents that declare
feeling close to a particular political party.
Graph 6.2: Closeness with political parties by location
Narrative
From a total of 15,957 respondents, more than half of respondents
(59.1%) declared that they did not feel close to any political party.
Denmark (66.6%), Spain (60.4%) and western Germany (57.8%) are on
the top third of countries with the highest proportion of young people
that feel close to a particular political party.
At the opposite extreme, Hungary (18.6%), Croatia (26.5%) and Latvia
(31.0%) are the countries with lowest percentage of young people
that feel close to a particular political party.
Most countries had similar percentages between the two locations;
notable exceptions were; Portugal (Lumiar and Barreiro), with a
difference of 22.8% between the two locations, and Latvia
(Agenskalns and Forstate & Jaunbuve) with 16.8%.
68
65
64
60
56
56
55
53
49
45
43
43
42
39
39
39
39
39
39
38
37
36
36
32
27
26
22
21
20
17
32
35
36
40
44
44
45
47
51
55
57
57
58
61
61
61
61
61
61
62
63
64
64
68
73
74
78
79
80
83
0% 10% 20% 30% 40% 50% 60% 70% 80% 90% 100%
Odense East (DEN)
Odense Center (DEN)
Sant Cugat (SPA)
Bremen (GER-W)
Vic (SPA)
Jena (GER-E)
Bremerhaven (GER-W)
Rostock (GER-E)
Kuopio (FIN)
Telavi (GEO)
Lumiar (POR)
Tartu (EST)
Coventry (UK)
Agenskalns (LAV)
Argyroupouli (GRE)
New Philadelphia (GRE)
Lieksa & Nurmes (FIN)
Narva area (EST)
Rimavska Sobota (SLO)
Trnava (SLO)
Nuneaton (UK)
Kutaisi (GEO)
Kupchino (RUS)
Vyborg (RUS)
Podsljeme (CRO)
Pescenica (CRO)
Forstate & Jaunbuve (LAV)
Ozd (HUN)
Barreiro (POR)
Sopron (HUN)
Yes No
MYPLACE August 2014
MYPLACE: FP7-266831 www.fp7-myplace.eu Deliverable 4.6 Europe wide thematic report -DRAFT Page 138 of 431
6.3 Non-electoral political activities (Q16)
To analyse the political behaviour of young people beyond electoral participation, the
MYPLACE survey includes a battery of 20 different political activities. Respondents were
asked if they had undertaken each of these activities once, twice or three or more times in
the last 12 months.
We first start analysing an indicator that includes the participation in all the 20 items. This
variable indicates the global level of non-electoral participation on a 0-60 scale. However a
factor analysis, presented below, suggests that we can identify different dimensions of
political activism that are useful for understanding differences among locations.
Table 6.3 Factor analysis on political activities
Component
1 2 3 4
Volunteered in an election campaign 0.005 0.754 0.090 -0.038
Contacted a politician (e-mail / phone / SMS / letter /
fax etc) 0.402 0.525 -0.027 0.086
Attended a public meeting dealing with political issues 0.536 0.411 0.197 0.029
Signed a petition 0.681 0.125 0.083 0.057
Collected signatures 0.153 0.556 0.185 0.037
Given a political speech 0.198 0.519 0.036 0.178
Distributed leaflets with a political content 0.114 0.736 0.203 0.072
Boycotted and bought certain products for political,
ethical or environmental reasons 0.704 0.055 0.117 0.150
Written political messages or graffiti on walls 0.165 0.031 0.024 0.760
Worn a badge with a political message 0.376 0.382 0.324 -0.032
Participated in a demonstration 0.353 0.145 0.713 0.000
Participated in a strike 0.084 0.041 0.756 0.072
Donated money to support a political group or
organisation 0.339 0.270 0.079 0.137
Written an article -in an organisation journal, a blog- 0.451 0.261 -0.001 0.237
Written or forwarded a letter/an email with a political
content 0.632 0.214 0.163 0.027
Participated in a violent political event 0.009 0.143 0.220 0.717
Occupied buildings or blocked streets/railways -0.013 0.133 0.592 0.328
Participated in a flash mob 0.201 0.179 0.402 0.094
Uploaded political material to the internet 0.526 0.134 0.317 -0.064
Voted in student union elections 0.350 0.104 0.303 -0.143
MYPLACE August 2014
MYPLACE: FP7-266831 www.fp7-myplace.eu Deliverable 4.6 Europe wide thematic report -DRAFT Page 139 of 431
From these results, we constructed three different variables for three dimensions of
participation (mixing component 3 and 4).
Private individual participation (component 1) - It groups the less intense forms of
participation that usually occur in a private sphere. To do these types of actions, the
individual is not exposed to the public, so they take place in a more anonymous
environment. It is a 0-18 scale with a Cronbach Alpha of 0.73
Public traditional participation (component 2)- It differs from the former type of
participation because these actions are more exposed to the public. They are also
traditional ways of participation that are usually oriented to representative
institutions. It is a 0-15 scale with a Cronbach Alpha of 0.69.
Protest participation (components 3 and 4)- We have joined together components 3
and 4 because they both refer to protest actions. Component 4 captures the more
extreme and confrontational protest actions. It is a 0-18 scale with a Cronbach Alpha
of 0.62.
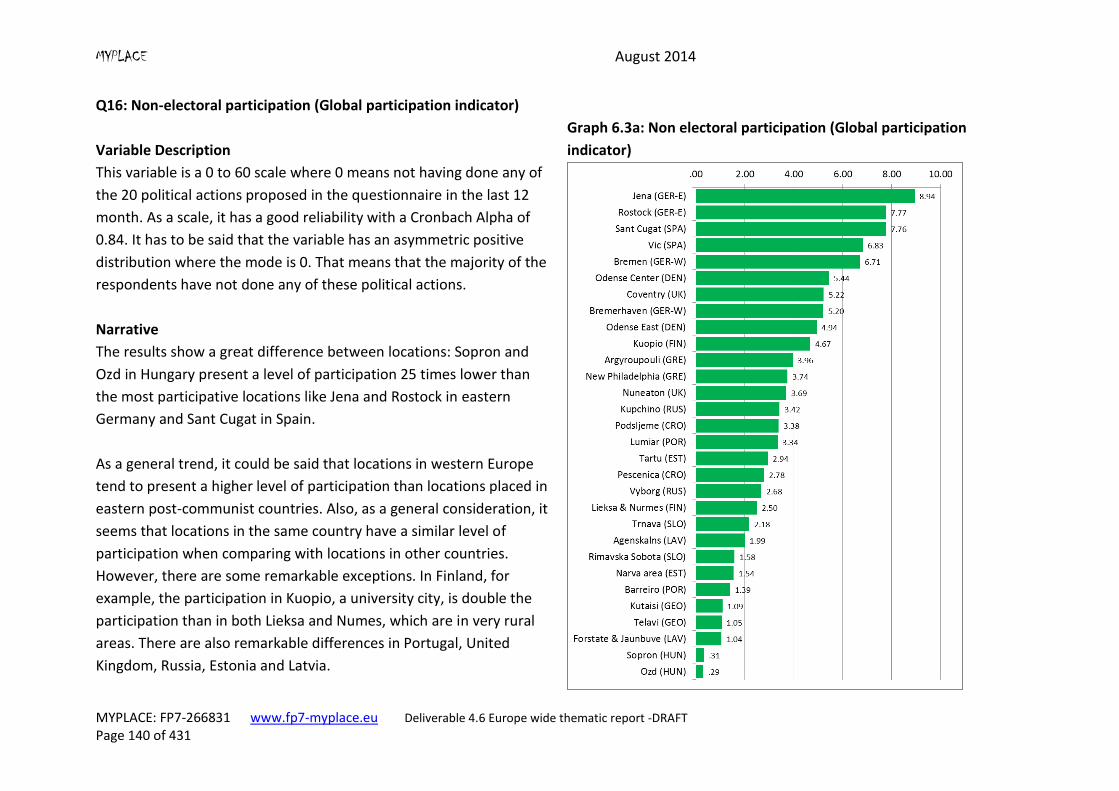
MYPLACE August 2014
MYPLACE: FP7-266831 www.fp7-myplace.eu Deliverable 4.6 Europe wide thematic report -DRAFT Page 140 of 431
Q16: Non-electoral participation (Global participation indicator)
Variable Description
This variable is a 0 to 60 scale where 0 means not having done any of
the 20 political actions proposed in the questionnaire in the last 12
month. As a scale, it has a good reliability with a Cronbach Alpha of
0.84. It has to be said that the variable has an asymmetric positive
distribution where the mode is 0. That means that the majority of the
respondents have not done any of these political actions.
Graph 6.3a: Non electoral participation (Global participation
indicator)
Narrative
The results show a great difference between locations: Sopron and
Ozd in Hungary present a level of participation 25 times lower than
the most participative locations like Jena and Rostock in eastern
Germany and Sant Cugat in Spain.
As a general trend, it could be said that locations in western Europe
tend to present a higher level of participation than locations placed in
eastern post-communist countries. Also, as a general consideration, it
seems that locations in the same country have a similar level of
participation when comparing with locations in other countries.
However, there are some remarkable exceptions. In Finland, for
example, the participation in Kuopio, a university city, is double the
participation than in both Lieksa and Numes, which are in very rural
areas. There are also remarkable differences in Portugal, United
Kingdom, Russia, Estonia and Latvia.
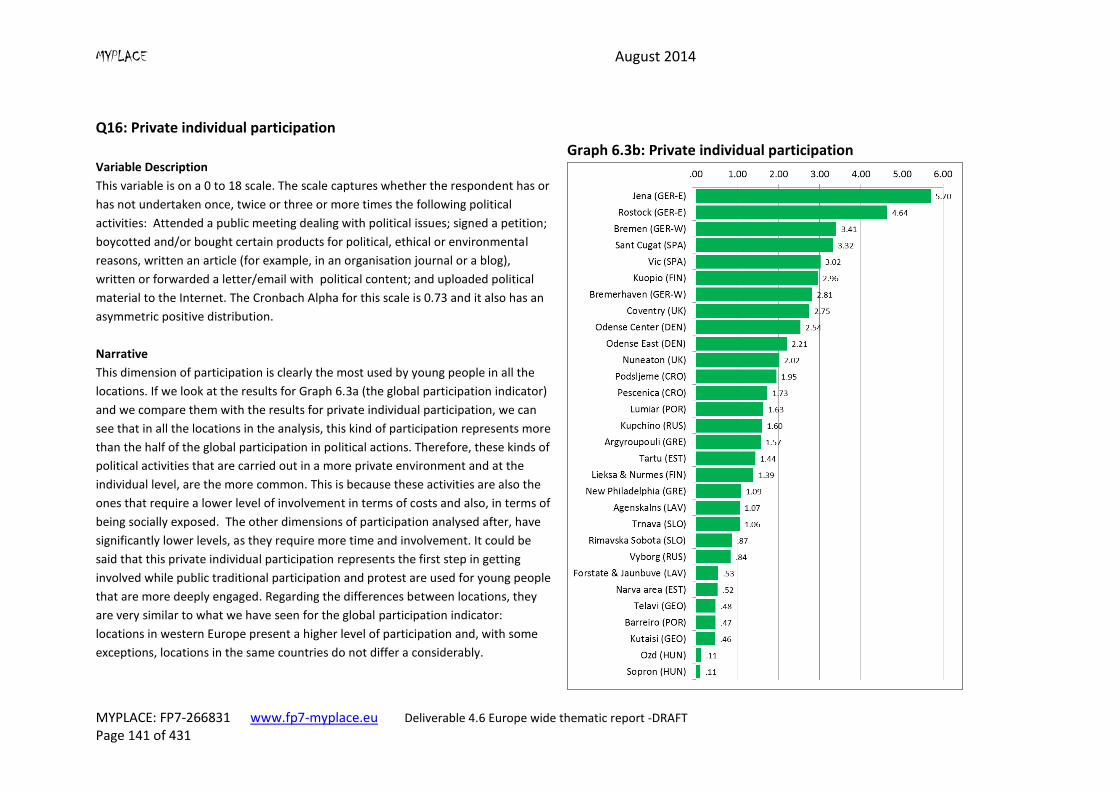
MYPLACE August 2014
MYPLACE: FP7-266831 www.fp7-myplace.eu Deliverable 4.6 Europe wide thematic report -DRAFT Page 141 of 431
Q16: Private individual participation
Variable Description
This variable is on a 0 to 18 scale. The scale captures whether the respondent has or
has not undertaken once, twice or three or more times the following political
activities: Attended a public meeting dealing with political issues; signed a petition;
boycotted and/or bought certain products for political, ethical or environmental
reasons, written an article (for example, in an organisation journal or a blog),
written or forwarded a letter/email with political content; and uploaded political
material to the Internet. The Cronbach Alpha for this scale is 0.73 and it also has an
asymmetric positive distribution.
Graph 6.3b: Private individual participation
Narrative
This dimension of participation is clearly the most used by young people in all the
locations. If we look at the results for Graph 6.3a (the global participation indicator)
and we compare them with the results for private individual participation, we can
see that in all the locations in the analysis, this kind of participation represents more
than the half of the global participation in political actions. Therefore, these kinds of
political activities that are carried out in a more private environment and at the
individual level, are the more common. This is because these activities are also the
ones that require a lower level of involvement in terms of costs and also, in terms of
being socially exposed. The other dimensions of participation analysed after, have
significantly lower levels, as they require more time and involvement. It could be
said that this private individual participation represents the first step in getting
involved while public traditional participation and protest are used for young people
that are more deeply engaged. Regarding the differences between locations, they
are very similar to what we have seen for the global participation indicator:
locations in western Europe present a higher level of participation and, with some
exceptions, locations in the same countries do not differ a considerably.
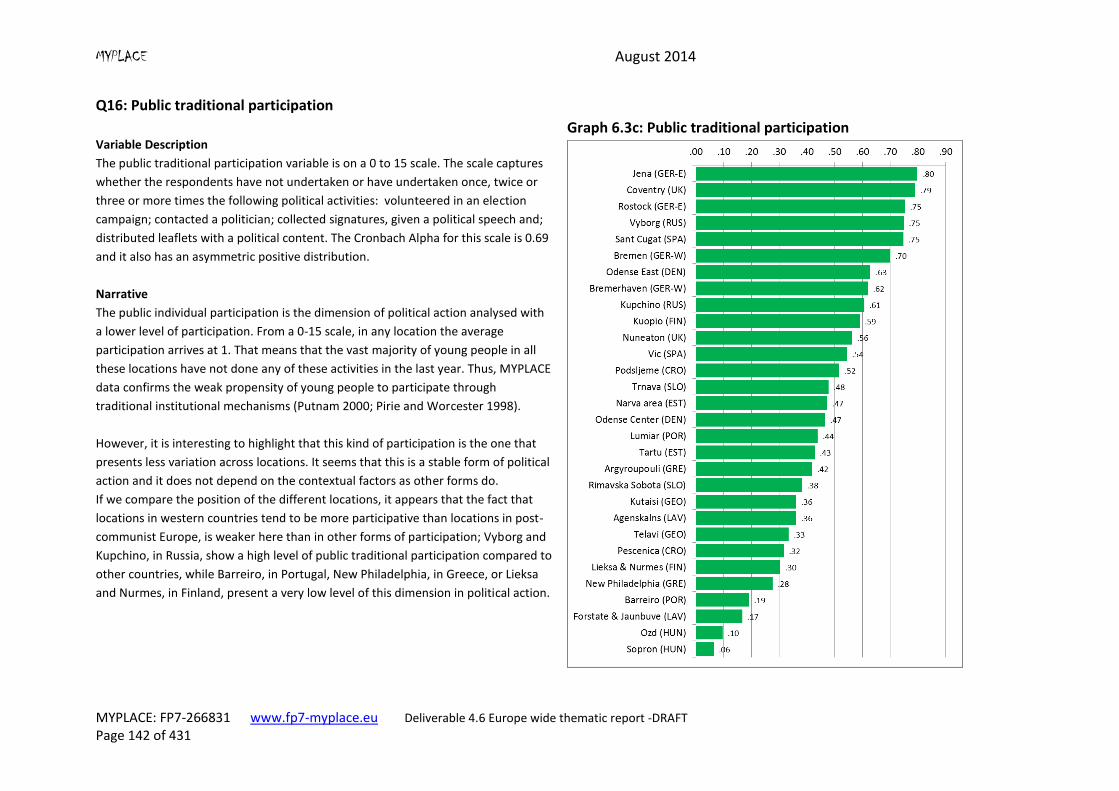
MYPLACE August 2014
MYPLACE: FP7-266831 www.fp7-myplace.eu Deliverable 4.6 Europe wide thematic report -DRAFT Page 142 of 431
Q16: Public traditional participation
Variable Description
The public traditional participation variable is on a 0 to 15 scale. The scale captures
whether the respondents have not undertaken or have undertaken once, twice or
three or more times the following political activities: volunteered in an election
campaign; contacted a politician; collected signatures, given a political speech and;
distributed leaflets with a political content. The Cronbach Alpha for this scale is 0.69
and it also has an asymmetric positive distribution.
Graph 6.3c: Public traditional participation
Narrative
The public individual participation is the dimension of political action analysed with
a lower level of participation. From a 0-15 scale, in any location the average
participation arrives at 1. That means that the vast majority of young people in all
these locations have not done any of these activities in the last year. Thus, MYPLACE
data confirms the weak propensity of young people to participate through
traditional institutional mechanisms (Putnam 2000; Pirie and Worcester 1998).
However, it is interesting to highlight that this kind of participation is the one that
presents less variation across locations. It seems that this is a stable form of political
action and it does not depend on the contextual factors as other forms do.
If we compare the position of the different locations, it appears that the fact that
locations in western countries tend to be more participative than locations in post-
communist Europe, is weaker here than in other forms of participation; Vyborg and
Kupchino, in Russia, show a high level of public traditional participation compared to
other countries, while Barreiro, in Portugal, New Philadelphia, in Greece, or Lieksa
and Nurmes, in Finland, present a very low level of this dimension in political action.
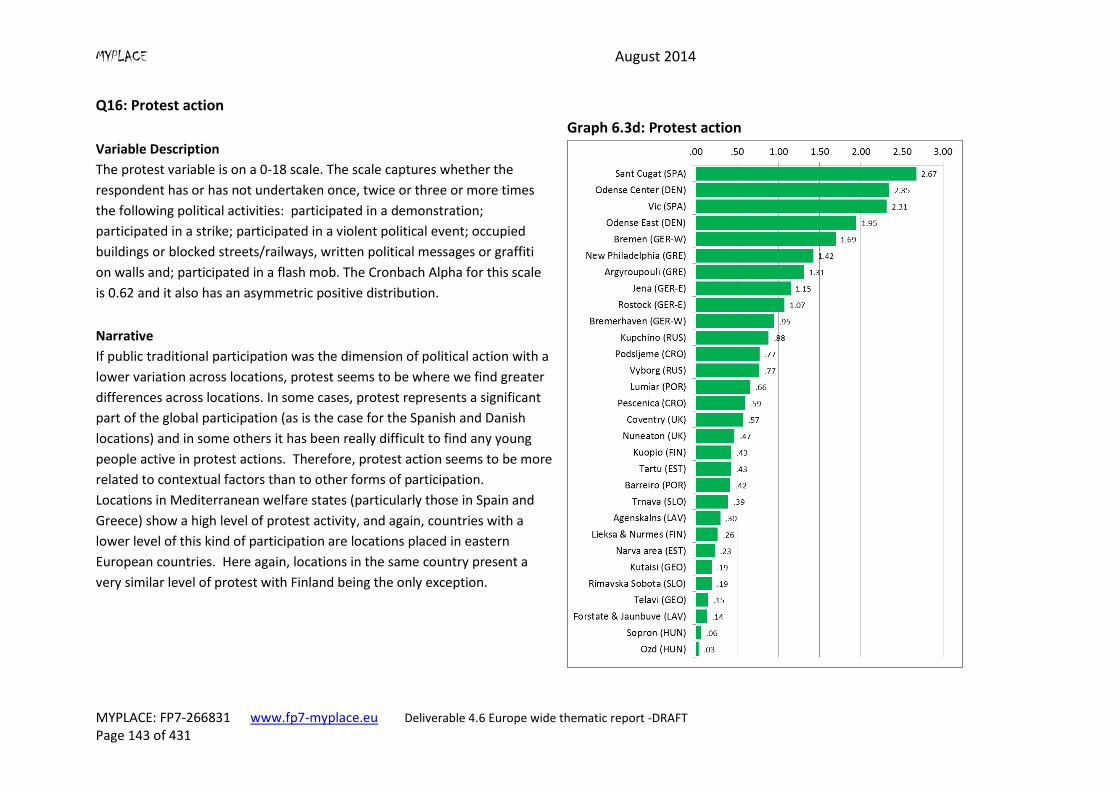
MYPLACE August 2014
MYPLACE: FP7-266831 www.fp7-myplace.eu Deliverable 4.6 Europe wide thematic report -DRAFT Page 143 of 431
Q16: Protest action
Variable Description
The protest variable is on a 0-18 scale. The scale captures whether the
respondent has or has not undertaken once, twice or three or more times
the following political activities: participated in a demonstration;
participated in a strike; participated in a violent political event; occupied
buildings or blocked streets/railways, written political messages or graffiti
on walls and; participated in a flash mob. The Cronbach Alpha for this scale
is 0.62 and it also has an asymmetric positive distribution.
Graph 6.3d: Protest action
Narrative
If public traditional participation was the dimension of political action with a
lower variation across locations, protest seems to be where we find greater
differences across locations. In some cases, protest represents a significant
part of the global participation (as is the case for the Spanish and Danish
locations) and in some others it has been really difficult to find any young
people active in protest actions. Therefore, protest action seems to be more
related to contextual factors than to other forms of participation.
Locations in Mediterranean welfare states (particularly those in Spain and
Greece) show a high level of protest activity, and again, countries with a
lower level of this kind of participation are locations placed in eastern
European countries. Here again, locations in the same country present a
very similar level of protest with Finland being the only exception.
MYPLACE August 2014
MYPLACE: FP7-266831 www.fp7-myplace.eu Deliverable 4.6 Europe wide thematic report Page 144 of 431
6.4. Multi-level Modelling
6.4.1 Model 1: Voting behaviour – National elections
According to prior studies, socio-demographic variables have an impact on voting behaviour. It is
among peripheral groups that it is possible to observe the highest rates of abstention (Viegas and
Freire, 2007). In other words, it is among the least educated, unemployed, lower social classes and
ethnic minority groups that we may observe lower turnout rates. The literature also shows other
variables with significant impact on voting behaviour. We have selected two of them: political
efficacy and political participation. Political efficacy refers to the perception that ordinary people
can influence political decisions. Therefore, those who have higher levels of political efficacy tend
to have higher turnout rates. In this report, this variable results from an index obtained through
the average answer to a set of items under the question ‘How effectively, do you think, the
following actions can influence politics in your country?’
Political involvement also has a positive impact on vote behaviour. The literature says that it is
between groups with higher levels of political involvement that it is possible to find higher turnout
rates. Political involvement was obtained through an index of variables used in a MYPLACE
previous report – WP6: Mapping Activism.
Besides individual variables, other contextual variables were considered, such as welfare state
regime, different type of parliament representation and cameral organisation. According to the
literature, countries with proportional representation tend to register higher levels of turnout.
This is also true to bicameral regimes. The welfare state regimes also can impact turnout rates.
Since more egalitarian societies favour the voting behaviour.
To sum up, we have predicted that age will have a positive impact on turnout. We have also
predicted that it is between young people with low education levels belonging to lower social class
families and minority groups and unemployed that abstention rate is higher. One other
assumption is that political efficacy and political involvement are positive influences on turnout
rates. Regarding contextual variables, and in line with the literature, we predict that countries with
proportional representation and bicameral regimes will show higher levels of electoral turnout.
Regarding the impact of welfare state regimes our hypothesis is that liberal regimes will have a
negative influence on turnout rates, once this regime emphasises the responsibility of individuals
for themselves and a weaker role of government and political decisions on people’s lives.
As said before, MYPLACE sample is hierarchically structured, since the respondents are nested into
localities and localities are nested in countries. This structure requires a more complex analysis of
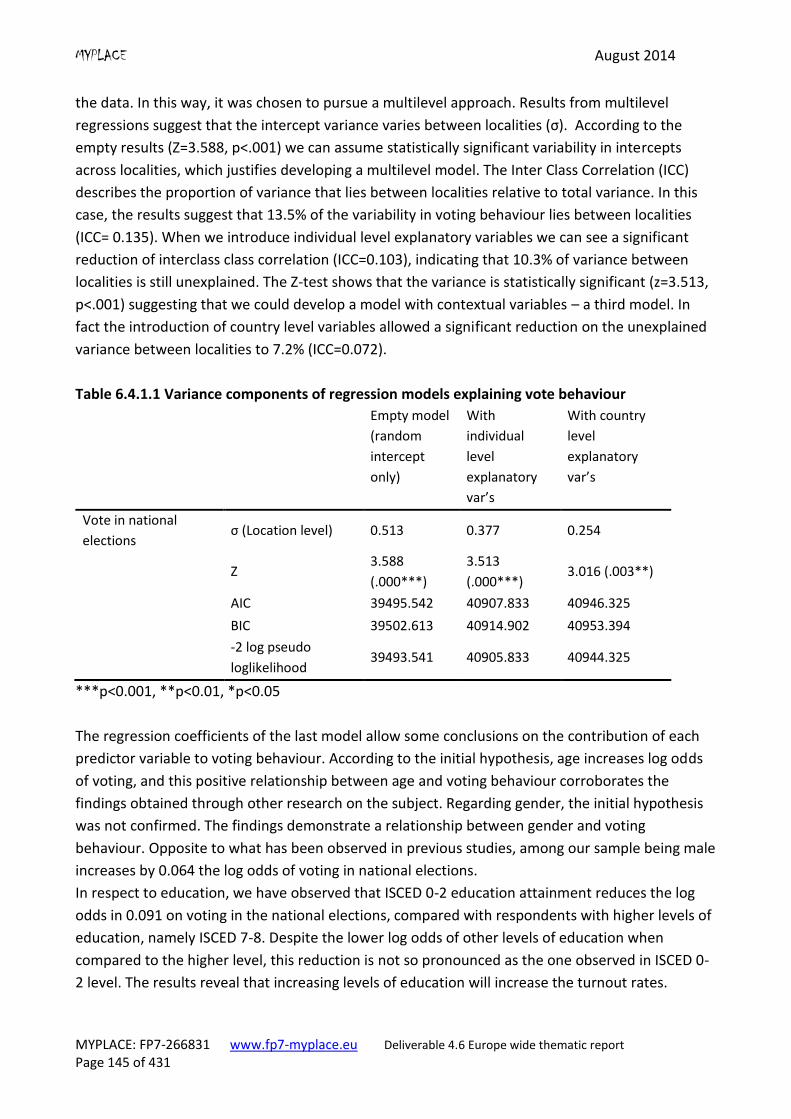
MYPLACE August 2014
MYPLACE: FP7-266831 www.fp7-myplace.eu Deliverable 4.6 Europe wide thematic report Page 145 of 431
the data. In this way, it was chosen to pursue a multilevel approach. Results from multilevel
regressions suggest that the intercept variance varies between localities (σ). According to the
empty results (Z=3.588, p<.001) we can assume statistically significant variability in intercepts
across localities, which justifies developing a multilevel model. The Inter Class Correlation (ICC)
describes the proportion of variance that lies between localities relative to total variance. In this
case, the results suggest that 13.5% of the variability in voting behaviour lies between localities
(ICC= 0.135). When we introduce individual level explanatory variables we can see a significant
reduction of interclass class correlation (ICC=0.103), indicating that 10.3% of variance between
localities is still unexplained. The Z-test shows that the variance is statistically significant (z=3.513,
p<.001) suggesting that we could develop a model with contextual variables – a third model. In
fact the introduction of country level variables allowed a significant reduction on the unexplained
variance between localities to 7.2% (ICC=0.072).
Table 6.4.1.1 Variance components of regression models explaining vote behaviour
Empty model
(random
intercept
only)
With
individual
level
explanatory
var’s
With country
level
explanatory
var’s
Vote in national
elections σ (Location level) 0.513 0.377 0.254
Z
3.588
(.000***)
3.513
(.000***) 3.016 (.003**)
AIC 39495.542 40907.833 40946.325
BIC 39502.613 40914.902 40953.394
-2 log pseudo
loglikelihood 39493.541 40905.833 40944.325
***p<0.001, **p<0.01, *p<0.05
The regression coefficients of the last model allow some conclusions on the contribution of each
predictor variable to voting behaviour. According to the initial hypothesis, age increases log odds
of voting, and this positive relationship between age and voting behaviour corroborates the
findings obtained through other research on the subject. Regarding gender, the initial hypothesis
was not confirmed. The findings demonstrate a relationship between gender and voting
behaviour. Opposite to what has been observed in previous studies, among our sample being male
increases by 0.064 the log odds of voting in national elections.
In respect to education, we have observed that ISCED 0-2 education attainment reduces the log
odds in 0.091 on voting in the national elections, compared with respondents with higher levels of
education, namely ISCED 7-8. Despite the lower log odds of other levels of education when
compared to the higher level, this reduction is not so pronounced as the one observed in ISCED 0-
2 level. The results reveal that increasing levels of education will increase the turnout rates.
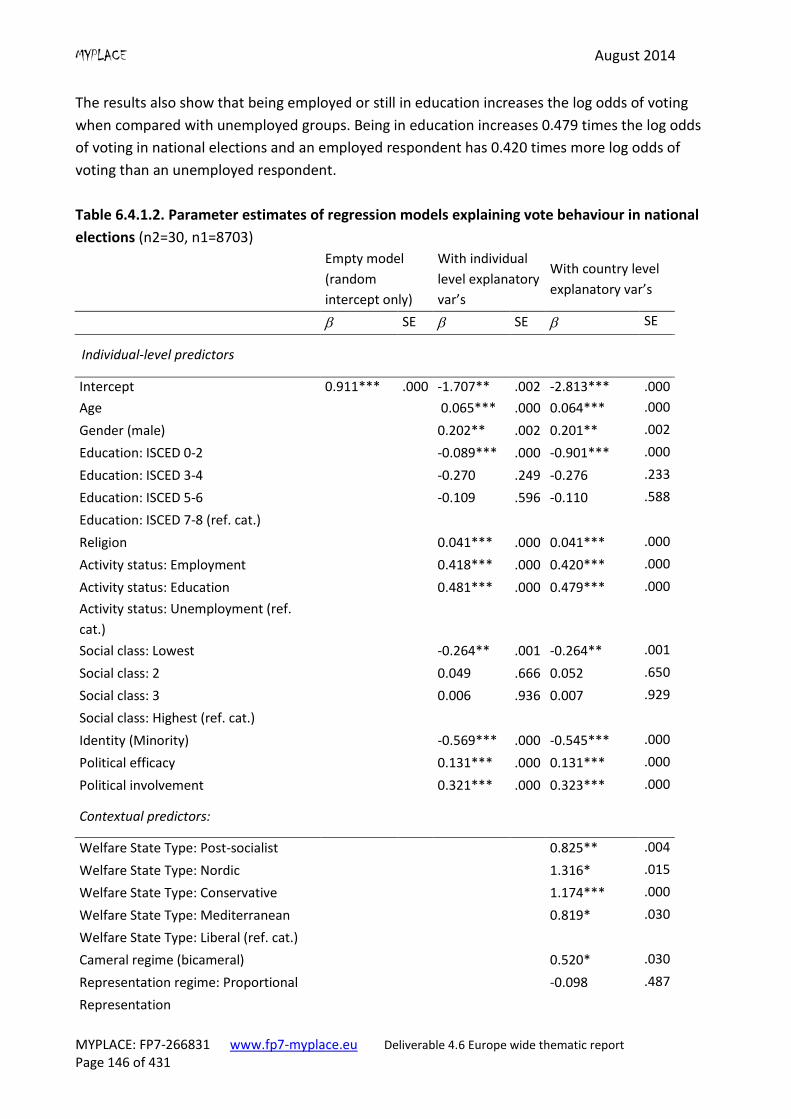
MYPLACE August 2014
MYPLACE: FP7-266831 www.fp7-myplace.eu Deliverable 4.6 Europe wide thematic report Page 146 of 431
The results also show that being employed or still in education increases the log odds of voting
when compared with unemployed groups. Being in education increases 0.479 times the log odds
of voting in national elections and an employed respondent has 0.420 times more log odds of
voting than an unemployed respondent.
Table 6.4.1.2. Parameter estimates of regression models explaining vote behaviour in national
elections (n2=30, n1=8703)
Empty model
(random
intercept only)
With individual
level explanatory
var’s
With country level
explanatory var’s
SE SE SE
Individual-level predictors
Intercept 0.911*** .000 -1.707** .002 -2.813*** .000
Age 0.065*** .000 0.064*** .000
Gender (male) 0.202** .002 0.201** .002
Education: ISCED 0-2 -0.089*** .000 -0.901*** .000
Education: ISCED 3-4 -0.270 .249 -0.276 .233
Education: ISCED 5-6 -0.109 .596 -0.110 .588
Education: ISCED 7-8 (ref. cat.)
Religion 0.041*** .000 0.041*** .000
Activity status: Employment 0.418*** .000 0.420*** .000
Activity status: Education 0.481*** .000 0.479*** .000
Activity status: Unemployment (ref.
cat.)
Social class: Lowest -0.264** .001 -0.264** .001
Social class: 2 0.049 .666 0.052 .650
Social class: 3 0.006 .936 0.007 .929
Social class: Highest (ref. cat.)
Identity (Minority) -0.569*** .000 -0.545*** .000
Political efficacy 0.131*** .000 0.131*** .000
Political involvement 0.321*** .000 0.323*** .000
Contextual predictors:
Welfare State Type: Post-socialist 0.825** .004
Welfare State Type: Nordic 1.316* .015
Welfare State Type: Conservative 1.174*** .000
Welfare State Type: Mediterranean 0.819* .030
Welfare State Type: Liberal (ref. cat.)
Cameral regime (bicameral) 0.520* .030
Representation regime: Proportional -0.098 .487
Representation
MYPLACE August 2014
MYPLACE: FP7-266831 www.fp7-myplace.eu Deliverable 4.6 Europe wide thematic report Page 147 of 431
regime:Majoritarian(ref. cat.)
Representation regime:Mixed (ref. cat.)
***p<0.001, **p<0.01, *p<0.05
The data also corroborates that social class has an impact on voting behaviour. Respondents from
lower social classes see their log odds of voting decrease 0.264 times when compared with the
higher social class. The same is true for minority groups: belonging to a minority group reduces
0.545 log odds of voting, which suggests that they are about half as likely to vote when compared
to the general population.
Regarding policy efficacy and political involvement, the results indicate that both increase the log
odds of voting in national elections. However this impact is greater when analysing the coefficient
associated with political involvement. The increase of 1 unit in the level of political involvement
increases 0.323 log odds of voting in national elections. With respect to the contextual variables it
is possible to observe that, as expected, the welfare state regime has an impact on the voting
behaviour of its citizens. Countries with the Nordic type of welfare state have more favourable
voting behaviours. Living in a country with this type of welfare state increases 1.316 log odds of
voting when compared with states with liberal regimes. When other welfare state regimes’ results
are observed we may conclude that liberal regimes are those who most contribute to the
abstention in national elections.
Regarding cameral system, as originally expected bicameral system favours turnout rates.
Bicameral regimes increases 0.52 log odds of voting when compared with countries with
unicameral systems. Type of parliament representation does not have impact on vote behaviour,
according to our results.
6.4.2 Model 2: Voting behaviour – Local elections
In order to analyse the voting behaviour in local elections we have adopted the same strategy that
was used in the analysis of national elections, once the data was organised in the same way,
according to a hierarchical structure. Regarding individual predictor variables, we have used the
variables listed in previous analysis. This will allow us to observe if the same variables have
different impacts when considering different types of elections.
With respect to the contextual variables it was necessary to introduce some changes to adapt the
analysis to local elections. In this case we maintained the hypothesis that welfare regimes, cameral
system, parliamentary representation have an impact on voting behaviour, but we have added
two more variables: the population size and the type of mayor elections (direct or indirect).
According to literature, in small localities it is possible to observe higher rates of voter turnout as it
allows greater proximity between the candidate and the population. In respect to the way mayors
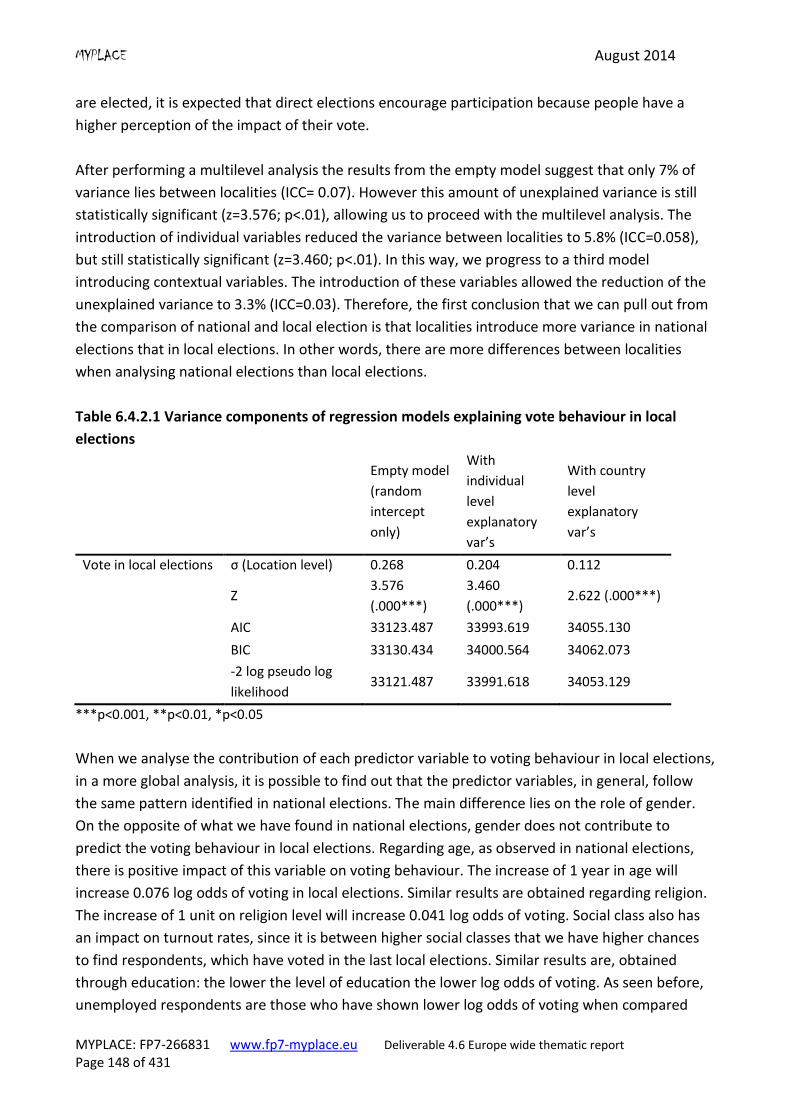
MYPLACE August 2014
MYPLACE: FP7-266831 www.fp7-myplace.eu Deliverable 4.6 Europe wide thematic report Page 148 of 431
are elected, it is expected that direct elections encourage participation because people have a
higher perception of the impact of their vote.
After performing a multilevel analysis the results from the empty model suggest that only 7% of
variance lies between localities (ICC= 0.07). However this amount of unexplained variance is still
statistically significant (z=3.576; p<.01), allowing us to proceed with the multilevel analysis. The
introduction of individual variables reduced the variance between localities to 5.8% (ICC=0.058),
but still statistically significant (z=3.460; p<.01). In this way, we progress to a third model
introducing contextual variables. The introduction of these variables allowed the reduction of the
unexplained variance to 3.3% (ICC=0.03). Therefore, the first conclusion that we can pull out from
the comparison of national and local election is that localities introduce more variance in national
elections that in local elections. In other words, there are more differences between localities
when analysing national elections than local elections.
Table 6.4.2.1 Variance components of regression models explaining vote behaviour in local
elections
Empty model
(random
intercept
only)
With
individual
level
explanatory
var’s
With country
level
explanatory
var’s
Vote in local elections σ (Location level) 0.268 0.204 0.112
Z
3.576
(.000***)
3.460
(.000***) 2.622 (.000***)
AIC 33123.487 33993.619 34055.130
BIC 33130.434 34000.564 34062.073
-2 log pseudo log
likelihood 33121.487 33991.618 34053.129
***p<0.001, **p<0.01, *p<0.05
When we analyse the contribution of each predictor variable to voting behaviour in local elections,
in a more global analysis, it is possible to find out that the predictor variables, in general, follow
the same pattern identified in national elections. The main difference lies on the role of gender.
On the opposite of what we have found in national elections, gender does not contribute to
predict the voting behaviour in local elections. Regarding age, as observed in national elections,
there is positive impact of this variable on voting behaviour. The increase of 1 year in age will
increase 0.076 log odds of voting in local elections. Similar results are obtained regarding religion.
The increase of 1 unit on religion level will increase 0.041 log odds of voting. Social class also has
an impact on turnout rates, since it is between higher social classes that we have higher chances
to find respondents, which have voted in the last local elections. Similar results are, obtained
through education: the lower the level of education the lower log odds of voting. As seen before,
unemployed respondents are those who have shown lower log odds of voting when compared
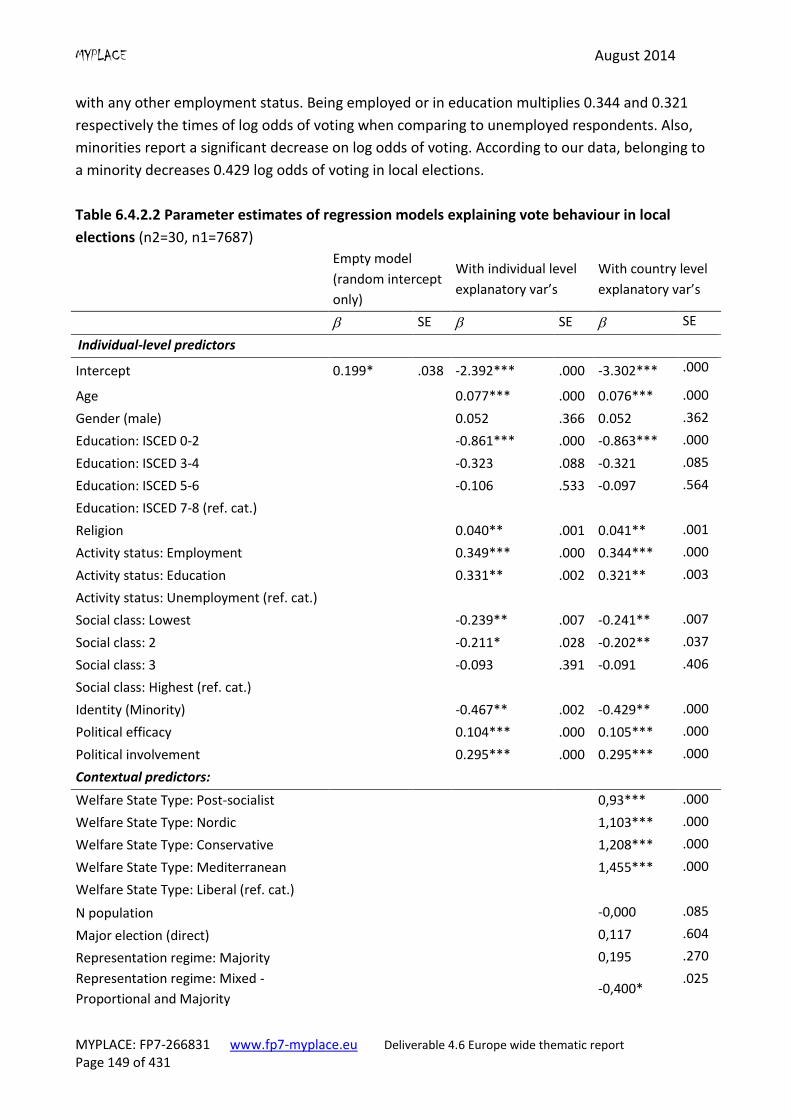
MYPLACE August 2014
MYPLACE: FP7-266831 www.fp7-myplace.eu Deliverable 4.6 Europe wide thematic report Page 149 of 431
with any other employment status. Being employed or in education multiplies 0.344 and 0.321
respectively the times of log odds of voting when comparing to unemployed respondents. Also,
minorities report a significant decrease on log odds of voting. According to our data, belonging to
a minority decreases 0.429 log odds of voting in local elections.
Table 6.4.2.2 Parameter estimates of regression models explaining vote behaviour in local
elections (n2=30, n1=7687)
Empty model
(random intercept
only)
With individual level
explanatory var’s
With country level
explanatory var’s
SE SE SE
Individual-level predictors
Intercept 0.199* .038 -2.392*** .000 -3.302*** .000
Age 0.077*** .000 0.076*** .000
Gender (male) 0.052 .366 0.052 .362
Education: ISCED 0-2 -0.861*** .000 -0.863*** .000
Education: ISCED 3-4 -0.323 .088 -0.321 .085
Education: ISCED 5-6 -0.106 .533 -0.097 .564
Education: ISCED 7-8 (ref. cat.)
Religion 0.040** .001 0.041** .001
Activity status: Employment 0.349*** .000 0.344*** .000
Activity status: Education 0.331** .002 0.321** .003
Activity status: Unemployment (ref. cat.)
Social class: Lowest -0.239** .007 -0.241** .007
Social class: 2 -0.211* .028 -0.202** .037
Social class: 3 -0.093 .391 -0.091 .406
Social class: Highest (ref. cat.)
Identity (Minority) -0.467** .002 -0.429** .000
Political efficacy 0.104*** .000 0.105*** .000
Political involvement 0.295*** .000 0.295*** .000
Contextual predictors:
Welfare State Type: Post-socialist 0,93*** .000
Welfare State Type: Nordic 1,103*** .000
Welfare State Type: Conservative 1,208*** .000
Welfare State Type: Mediterranean 1,455*** .000
Welfare State Type: Liberal (ref. cat.)
N population -0,000 .085
Major election (direct) 0,117 .604
Representation regime: Majority 0,195 .270
Representation regime: Mixed -
Proportional and Majority -0,400*
.025
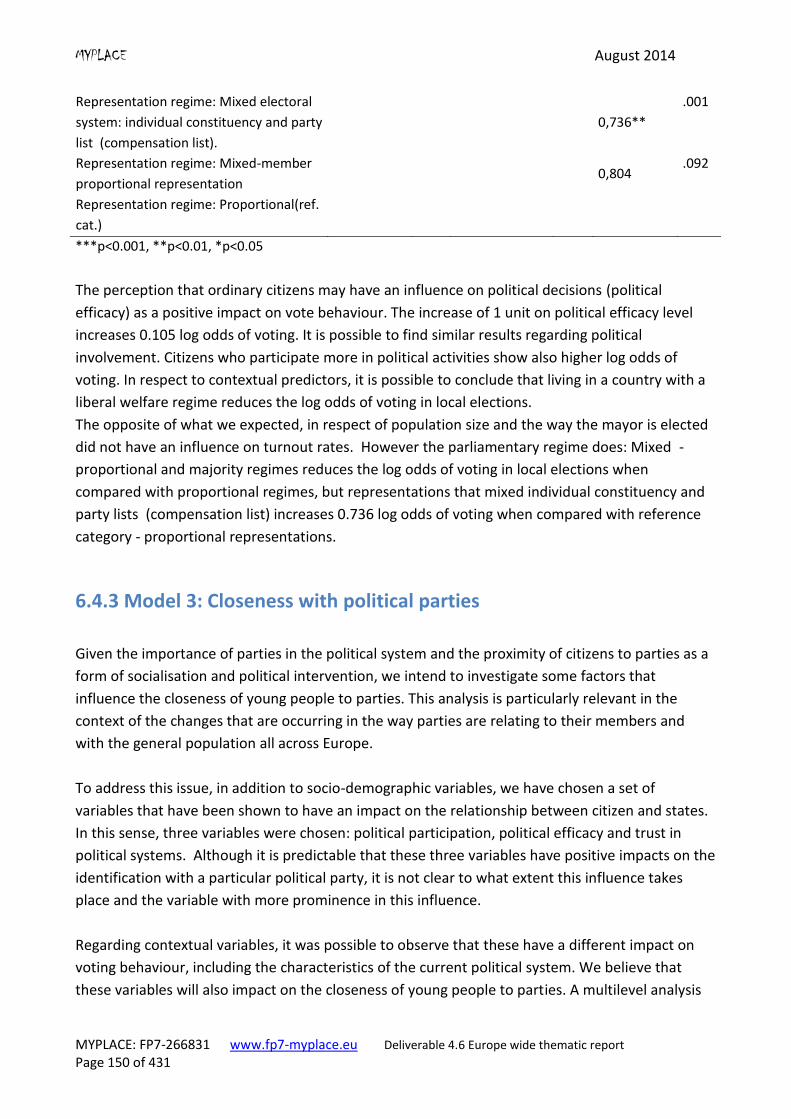
MYPLACE August 2014
MYPLACE: FP7-266831 www.fp7-myplace.eu Deliverable 4.6 Europe wide thematic report Page 150 of 431
Representation regime: Mixed electoral
system: individual constituency and party
list (compensation list).
0,736**
.001
Representation regime: Mixed-member
proportional representation 0,804
.092
Representation regime: Proportional(ref.
cat.)
***p<0.001, **p<0.01, *p<0.05
The perception that ordinary citizens may have an influence on political decisions (political
efficacy) as a positive impact on vote behaviour. The increase of 1 unit on political efficacy level
increases 0.105 log odds of voting. It is possible to find similar results regarding political
involvement. Citizens who participate more in political activities show also higher log odds of
voting. In respect to contextual predictors, it is possible to conclude that living in a country with a
liberal welfare regime reduces the log odds of voting in local elections.
The opposite of what we expected, in respect of population size and the way the mayor is elected
did not have an influence on turnout rates. However the parliamentary regime does: Mixed -
proportional and majority regimes reduces the log odds of voting in local elections when
compared with proportional regimes, but representations that mixed individual constituency and
party lists (compensation list) increases 0.736 log odds of voting when compared with reference
category - proportional representations.
6.4.3 Model 3: Closeness with political parties
Given the importance of parties in the political system and the proximity of citizens to parties as a
form of socialisation and political intervention, we intend to investigate some factors that
influence the closeness of young people to parties. This analysis is particularly relevant in the
context of the changes that are occurring in the way parties are relating to their members and
with the general population all across Europe.
To address this issue, in addition to socio-demographic variables, we have chosen a set of
variables that have been shown to have an impact on the relationship between citizen and states.
In this sense, three variables were chosen: political participation, political efficacy and trust in
political systems. Although it is predictable that these three variables have positive impacts on the
identification with a particular political party, it is not clear to what extent this influence takes
place and the variable with more prominence in this influence.
Regarding contextual variables, it was possible to observe that these have a different impact on
voting behaviour, including the characteristics of the current political system. We believe that
these variables will also impact on the closeness of young people to parties. A multilevel analysis
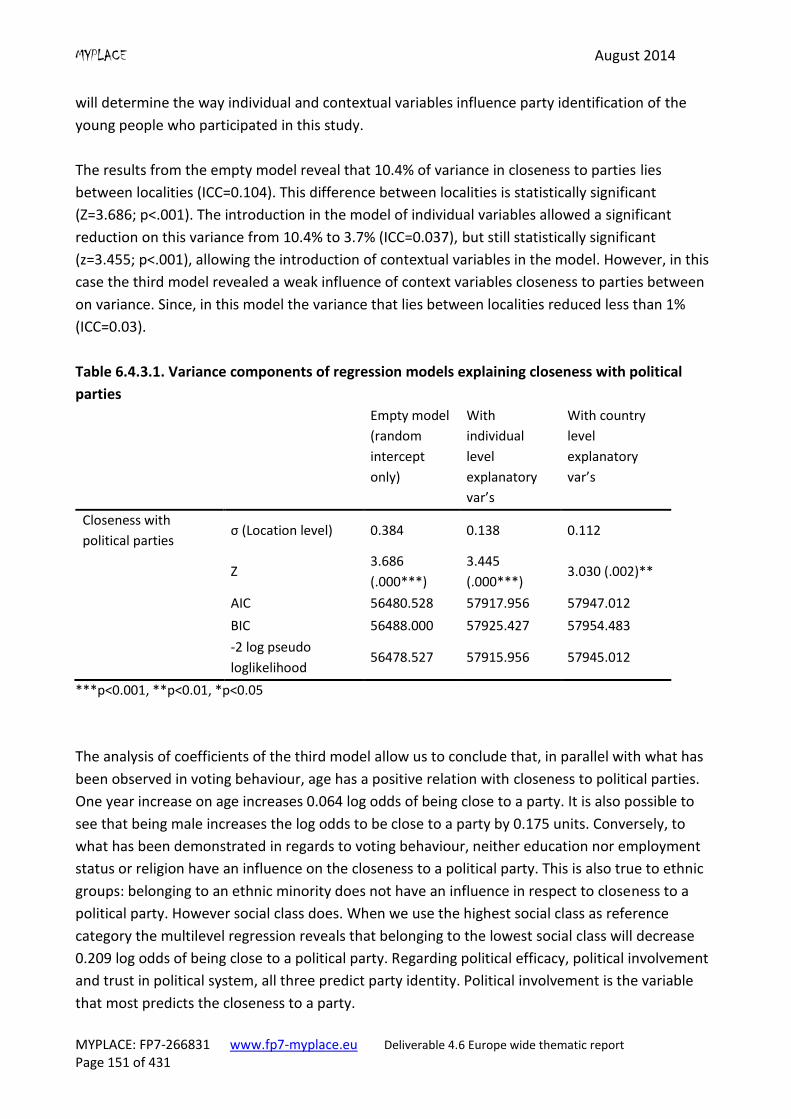
MYPLACE August 2014
MYPLACE: FP7-266831 www.fp7-myplace.eu Deliverable 4.6 Europe wide thematic report Page 151 of 431
will determine the way individual and contextual variables influence party identification of the
young people who participated in this study.
The results from the empty model reveal that 10.4% of variance in closeness to parties lies
between localities (ICC=0.104). This difference between localities is statistically significant
(Z=3.686; p<.001). The introduction in the model of individual variables allowed a significant
reduction on this variance from 10.4% to 3.7% (ICC=0.037), but still statistically significant
(z=3.455; p<.001), allowing the introduction of contextual variables in the model. However, in this
case the third model revealed a weak influence of context variables closeness to parties between
on variance. Since, in this model the variance that lies between localities reduced less than 1%
(ICC=0.03).
Table 6.4.3.1. Variance components of regression models explaining closeness with political
parties
Empty model
(random
intercept
only)
With
individual
level
explanatory
var’s
With country
level
explanatory
var’s
Closeness with
political parties σ (Location level) 0.384 0.138 0.112
Z
3.686
(.000***)
3.445
(.000***) 3.030 (.002)**
AIC 56480.528 57917.956 57947.012
BIC 56488.000 57925.427 57954.483
-2 log pseudo
loglikelihood 56478.527 57915.956 57945.012
***p<0.001, **p<0.01, *p<0.05
The analysis of coefficients of the third model allow us to conclude that, in parallel with what has
been observed in voting behaviour, age has a positive relation with closeness to political parties.
One year increase on age increases 0.064 log odds of being close to a party. It is also possible to
see that being male increases the log odds to be close to a party by 0.175 units. Conversely, to
what has been demonstrated in regards to voting behaviour, neither education nor employment
status or religion have an influence on the closeness to a political party. This is also true to ethnic
groups: belonging to an ethnic minority does not have an influence in respect to closeness to a
political party. However social class does. When we use the highest social class as reference
category the multilevel regression reveals that belonging to the lowest social class will decrease
0.209 log odds of being close to a political party. Regarding political efficacy, political involvement
and trust in political system, all three predict party identity. Political involvement is the variable
that most predicts the closeness to a party.
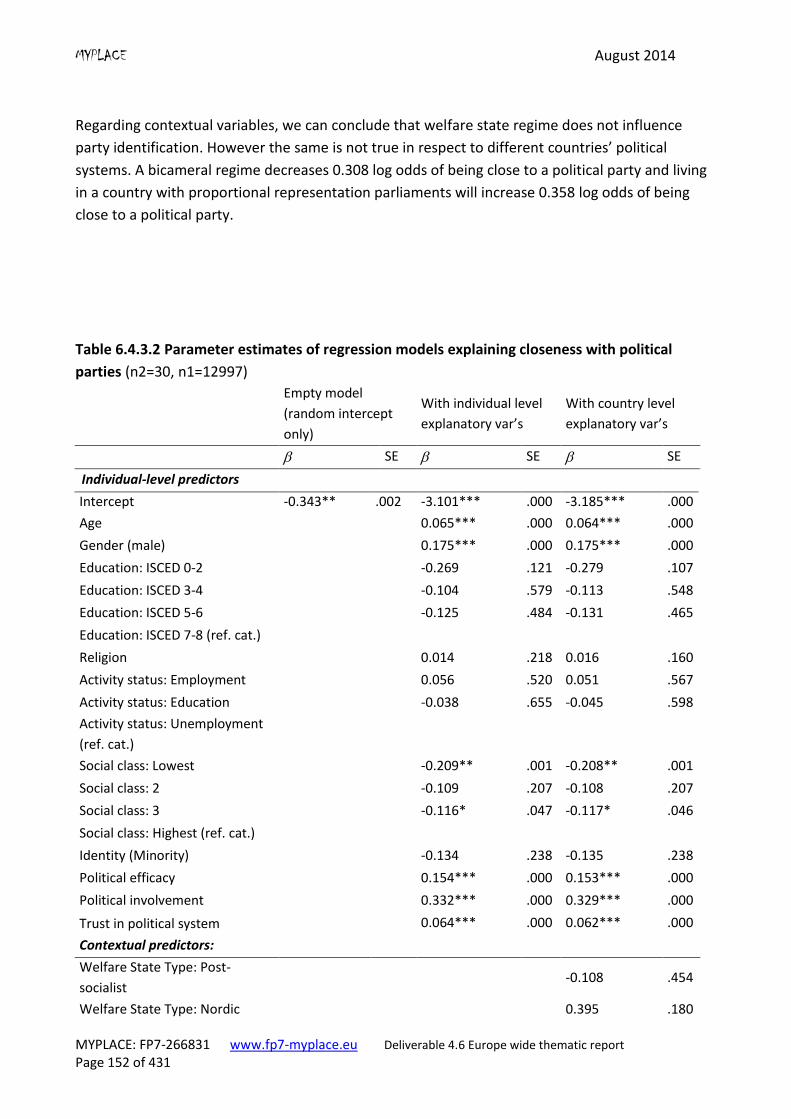
MYPLACE August 2014
MYPLACE: FP7-266831 www.fp7-myplace.eu Deliverable 4.6 Europe wide thematic report Page 152 of 431
Regarding contextual variables, we can conclude that welfare state regime does not influence
party identification. However the same is not true in respect to different countries’ political
systems. A bicameral regime decreases 0.308 log odds of being close to a political party and living
in a country with proportional representation parliaments will increase 0.358 log odds of being
close to a political party.
Table 6.4.3.2 Parameter estimates of regression models explaining closeness with political
parties (n2=30, n1=12997)
Empty model
(random intercept
only)
With individual level
explanatory var’s
With country level
explanatory var’s
SE SE SE
Individual-level predictors
Intercept -0.343** .002 -3.101*** .000 -3.185*** .000
Age 0.065*** .000 0.064*** .000
Gender (male) 0.175*** .000 0.175*** .000
Education: ISCED 0-2 -0.269 .121 -0.279 .107
Education: ISCED 3-4 -0.104 .579 -0.113 .548
Education: ISCED 5-6 -0.125 .484 -0.131 .465
Education: ISCED 7-8 (ref. cat.)
Religion 0.014 .218 0.016 .160
Activity status: Employment 0.056 .520 0.051 .567
Activity status: Education -0.038 .655 -0.045 .598
Activity status: Unemployment
(ref. cat.)
Social class: Lowest -0.209** .001 -0.208** .001
Social class: 2 -0.109 .207 -0.108 .207
Social class: 3 -0.116* .047 -0.117* .046
Social class: Highest (ref. cat.)
Identity (Minority) -0.134 .238 -0.135 .238
Political efficacy 0.154*** .000 0.153*** .000
Political involvement 0.332*** .000 0.329*** .000
Trust in political system 0.064*** .000 0.062*** .000
Contextual predictors:
Welfare State Type: Post-
socialist -0.108 .454
Welfare State Type: Nordic 0.395 .180
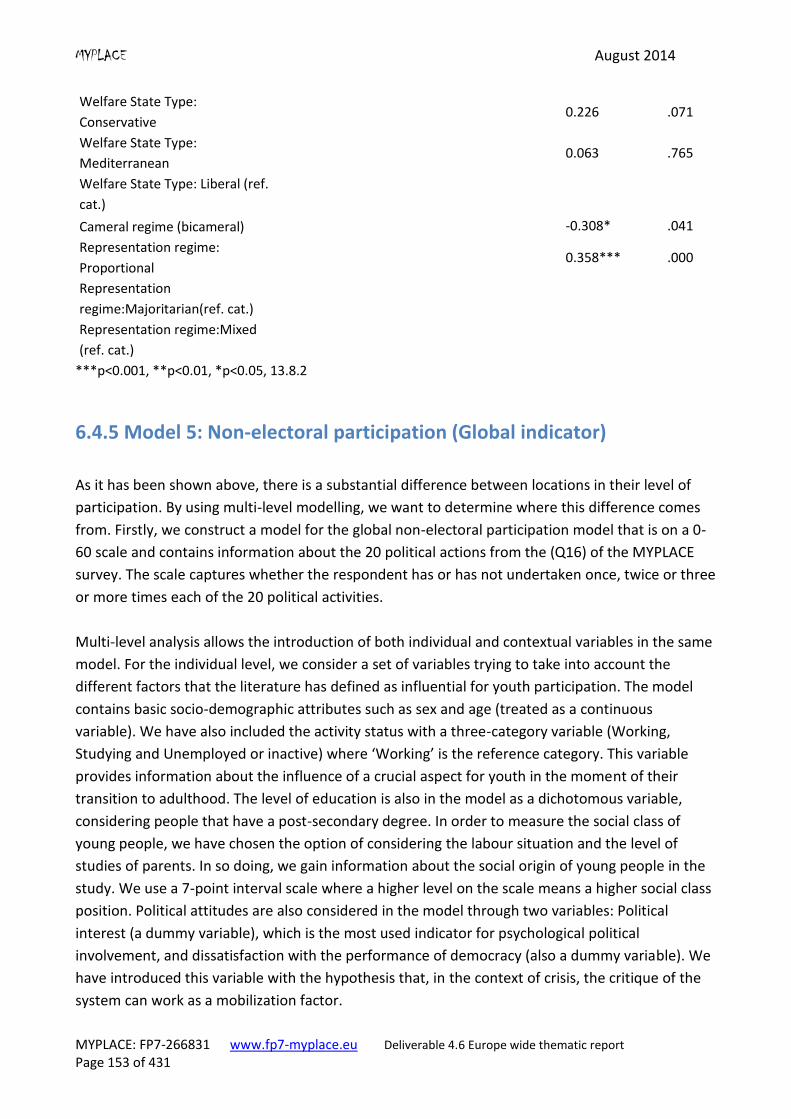
MYPLACE August 2014
MYPLACE: FP7-266831 www.fp7-myplace.eu Deliverable 4.6 Europe wide thematic report Page 153 of 431
Welfare State Type:
Conservative 0.226 .071
Welfare State Type:
Mediterranean 0.063 .765
Welfare State Type: Liberal (ref.
cat.)
Cameral regime (bicameral) -0.308* .041
Representation regime:
Proportional 0.358*** .000
Representation
regime:Majoritarian(ref. cat.)
Representation regime:Mixed
(ref. cat.)
***p<0.001, **p<0.01, *p<0.05, 13.8.2
6.4.5 Model 5: Non-electoral participation (Global indicator)
As it has been shown above, there is a substantial difference between locations in their level of
participation. By using multi-level modelling, we want to determine where this difference comes
from. Firstly, we construct a model for the global non-electoral participation model that is on a 0-
60 scale and contains information about the 20 political actions from the (Q16) of the MYPLACE
survey. The scale captures whether the respondent has or has not undertaken once, twice or three
or more times each of the 20 political activities.
Multi-level analysis allows the introduction of both individual and contextual variables in the same
model. For the individual level, we consider a set of variables trying to take into account the
different factors that the literature has defined as influential for youth participation. The model
contains basic socio-demographic attributes such as sex and age (treated as a continuous
variable). We have also included the activity status with a three-category variable (Working,
Studying and Unemployed or inactive) where ‘Working’ is the reference category. This variable
provides information about the influence of a crucial aspect for youth in the moment of their
transition to adulthood. The level of education is also in the model as a dichotomous variable,
considering people that have a post-secondary degree. In order to measure the social class of
young people, we have chosen the option of considering the labour situation and the level of
studies of parents. In so doing, we gain information about the social origin of young people in the
study. We use a 7-point interval scale where a higher level on the scale means a higher social class
position. Political attitudes are also considered in the model through two variables: Political
interest (a dummy variable), which is the most used indicator for psychological political
involvement, and dissatisfaction with the performance of democracy (also a dummy variable). We
have introduced this variable with the hypothesis that, in the context of crisis, the critique of the
system can work as a mobilization factor.
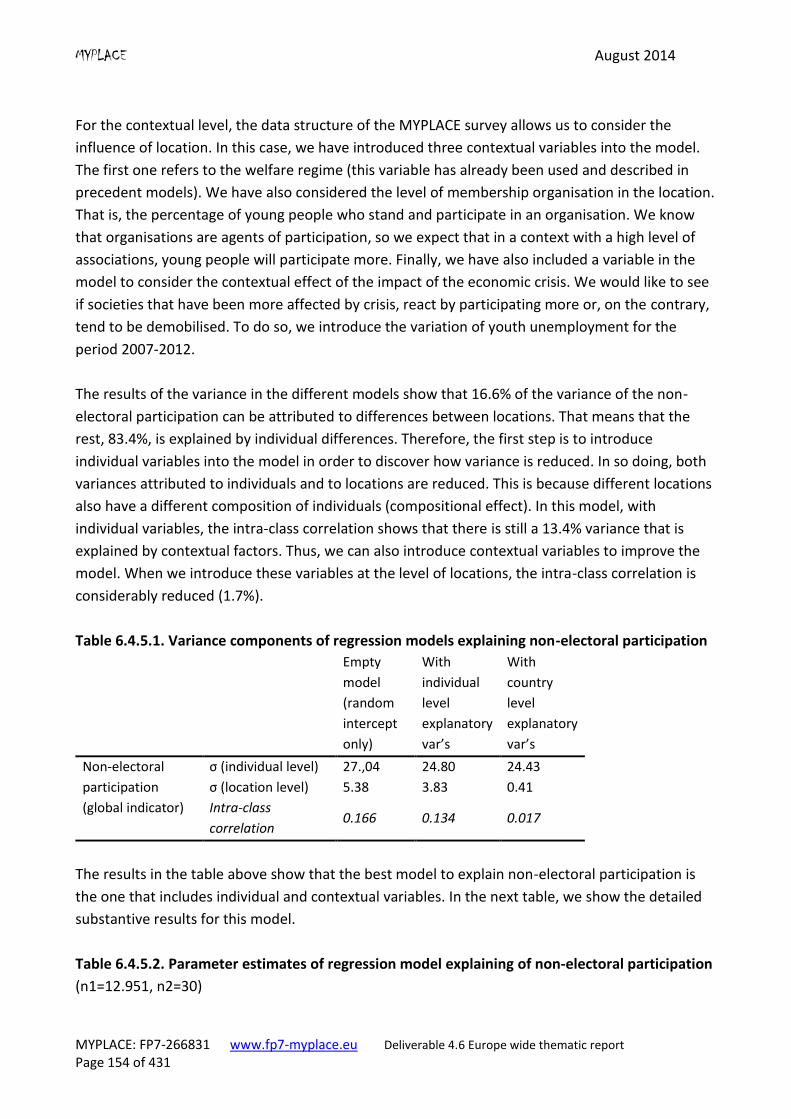
MYPLACE August 2014
MYPLACE: FP7-266831 www.fp7-myplace.eu Deliverable 4.6 Europe wide thematic report Page 154 of 431
For the contextual level, the data structure of the MYPLACE survey allows us to consider the
influence of location. In this case, we have introduced three contextual variables into the model.
The first one refers to the welfare regime (this variable has already been used and described in
precedent models). We have also considered the level of membership organisation in the location.
That is, the percentage of young people who stand and participate in an organisation. We know
that organisations are agents of participation, so we expect that in a context with a high level of
associations, young people will participate more. Finally, we have also included a variable in the
model to consider the contextual effect of the impact of the economic crisis. We would like to see
if societies that have been more affected by crisis, react by participating more or, on the contrary,
tend to be demobilised. To do so, we introduce the variation of youth unemployment for the
period 2007-2012.
The results of the variance in the different models show that 16.6% of the variance of the non-
electoral participation can be attributed to differences between locations. That means that the
rest, 83.4%, is explained by individual differences. Therefore, the first step is to introduce
individual variables into the model in order to discover how variance is reduced. In so doing, both
variances attributed to individuals and to locations are reduced. This is because different locations
also have a different composition of individuals (compositional effect). In this model, with
individual variables, the intra-class correlation shows that there is still a 13.4% variance that is
explained by contextual factors. Thus, we can also introduce contextual variables to improve the
model. When we introduce these variables at the level of locations, the intra-class correlation is
considerably reduced (1.7%).
Table 6.4.5.1. Variance components of regression models explaining non-electoral participation
Empty
model
(random
intercept
only)
With
individual
level
explanatory
var’s
With
country
level
explanatory
var’s
Non-electoral
participation
(global indicator)
σ (individual level) 27.,04 24.80 24.43
σ (location level) 5.38 3.83 0.41
Intra-class
correlation 0.166 0.134 0.017
The results in the table above show that the best model to explain non-electoral participation is
the one that includes individual and contextual variables. In the next table, we show the detailed
substantive results for this model.
Table 6.4.5.2. Parameter estimates of regression model explaining of non-electoral participation
(n1=12.951, n2=30)
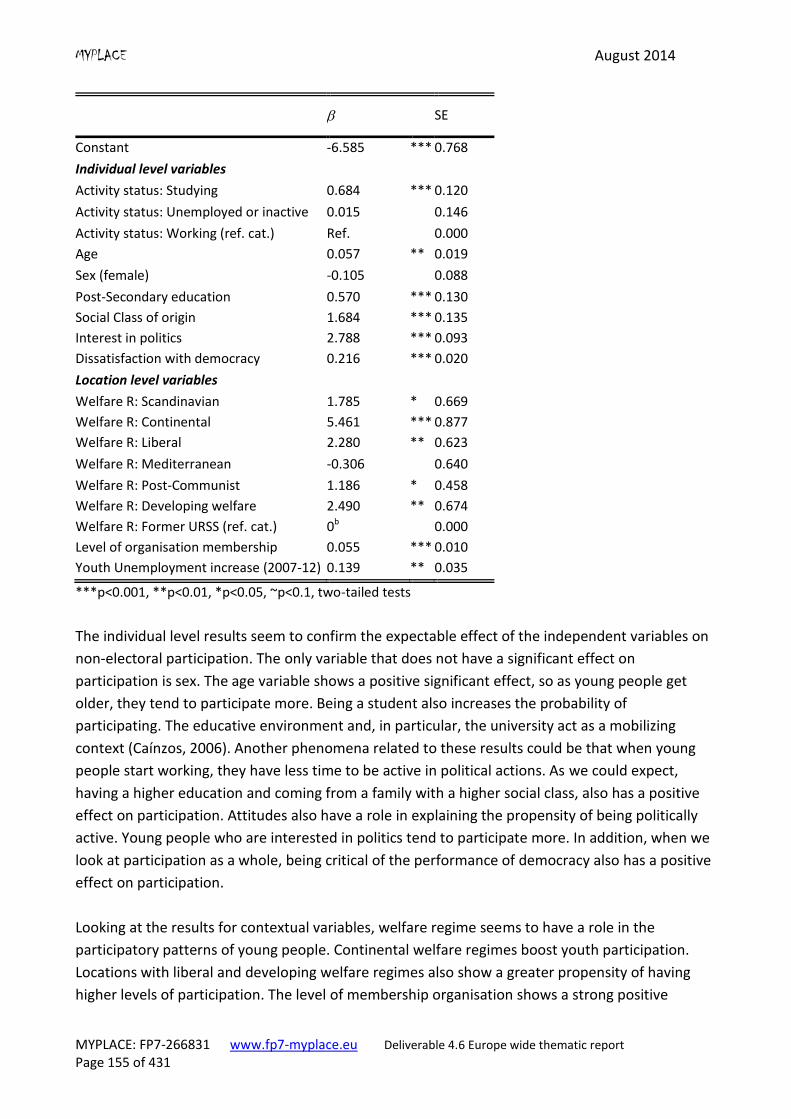
MYPLACE August 2014
MYPLACE: FP7-266831 www.fp7-myplace.eu Deliverable 4.6 Europe wide thematic report Page 155 of 431
SE
Constant -6.585 *** 0.768
Individual level variables
Activity status: Studying 0.684 *** 0.120
Activity status: Unemployed or inactive 0.015 0.146
Activity status: Working (ref. cat.) Ref. 0.000
Age 0.057 ** 0.019
Sex (female) -0.105 0.088
Post-Secondary education 0.570 *** 0.130
Social Class of origin 1.684 *** 0.135
Interest in politics 2.788 *** 0.093
Dissatisfaction with democracy 0.216 *** 0.020
Location level variables
Welfare R: Scandinavian 1.785 * 0.669
Welfare R: Continental 5.461 *** 0.877
Welfare R: Liberal 2.280 ** 0.623
Welfare R: Mediterranean -0.306 0.640
Welfare R: Post-Communist 1.186 * 0.458
Welfare R: Developing welfare 2.490 ** 0.674
Welfare R: Former URSS (ref. cat.) 0b 0.000
Level of organisation membership 0.055 *** 0.010
Youth Unemployment increase (2007-12) 0.139 ** 0.035
***p<0.001, **p<0.01, *p<0.05, ~p<0.1, two-tailed tests
The individual level results seem to confirm the expectable effect of the independent variables on
non-electoral participation. The only variable that does not have a significant effect on
participation is sex. The age variable shows a positive significant effect, so as young people get
older, they tend to participate more. Being a student also increases the probability of
participating. The educative environment and, in particular, the university act as a mobilizing
context (Caínzos, 2006). Another phenomena related to these results could be that when young
people start working, they have less time to be active in political actions. As we could expect,
having a higher education and coming from a family with a higher social class, also has a positive
effect on participation. Attitudes also have a role in explaining the propensity of being politically
active. Young people who are interested in politics tend to participate more. In addition, when we
look at participation as a whole, being critical of the performance of democracy also has a positive
effect on participation.
Looking at the results for contextual variables, welfare regime seems to have a role in the
participatory patterns of young people. Continental welfare regimes boost youth participation.
Locations with liberal and developing welfare regimes also show a greater propensity of having
higher levels of participation. The level of membership organisation shows a strong positive
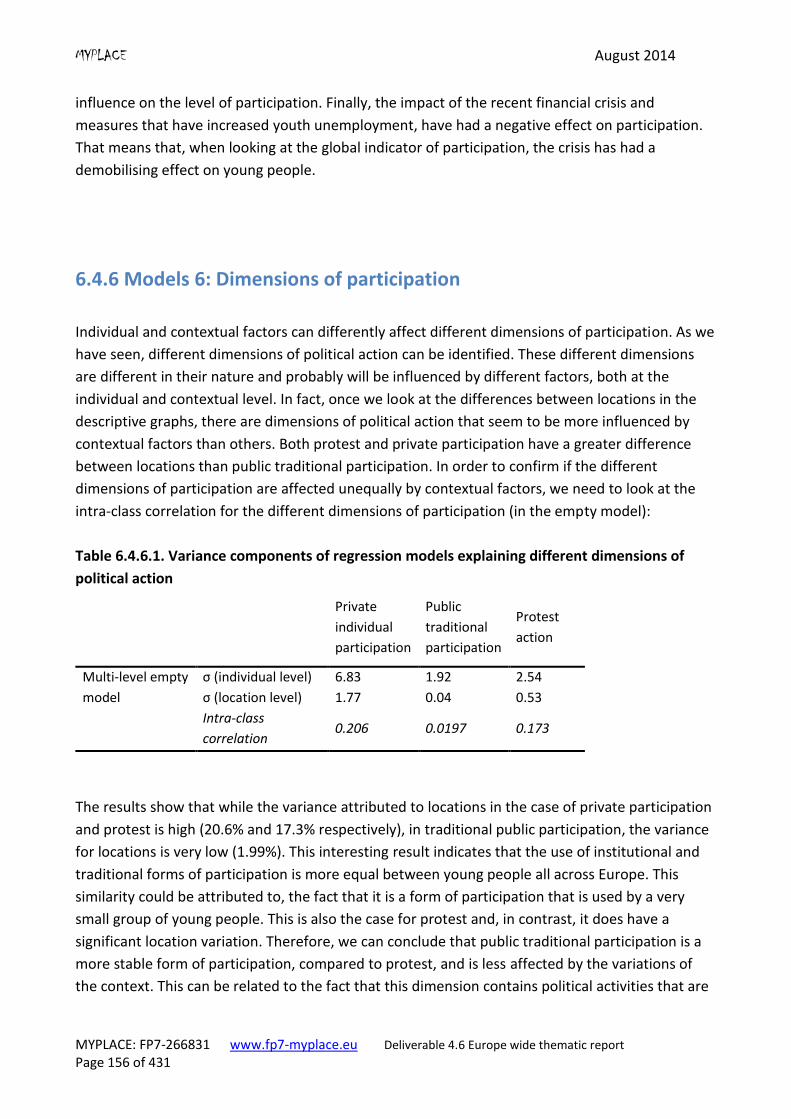
MYPLACE August 2014
MYPLACE: FP7-266831 www.fp7-myplace.eu Deliverable 4.6 Europe wide thematic report Page 156 of 431
influence on the level of participation. Finally, the impact of the recent financial crisis and
measures that have increased youth unemployment, have had a negative effect on participation.
That means that, when looking at the global indicator of participation, the crisis has had a
demobilising effect on young people.
6.4.6 Models 6: Dimensions of participation
Individual and contextual factors can differently affect different dimensions of participation. As we
have seen, different dimensions of political action can be identified. These different dimensions
are different in their nature and probably will be influenced by different factors, both at the
individual and contextual level. In fact, once we look at the differences between locations in the
descriptive graphs, there are dimensions of political action that seem to be more influenced by
contextual factors than others. Both protest and private participation have a greater difference
between locations than public traditional participation. In order to confirm if the different
dimensions of participation are affected unequally by contextual factors, we need to look at the
intra-class correlation for the different dimensions of participation (in the empty model):
Table 6.4.6.1. Variance components of regression models explaining different dimensions of
political action
Private
individual
participation
Public
traditional
participation
Protest
action
Multi-level empty
model
σ (individual level) 6.83 1.92 2.54
σ (location level) 1.77 0.04 0.53
Intra-class
correlation 0.206 0.0197 0.173
The results show that while the variance attributed to locations in the case of private participation
and protest is high (20.6% and 17.3% respectively), in traditional public participation, the variance
for locations is very low (1.99%). This interesting result indicates that the use of institutional and
traditional forms of participation is more equal between young people all across Europe. This
similarity could be attributed to, the fact that it is a form of participation that is used by a very
small group of young people. This is also the case for protest and, in contrast, it does have a
significant location variation. Therefore, we can conclude that public traditional participation is a
more stable form of participation, compared to protest, and is less affected by the variations of
the context. This can be related to the fact that this dimension contains political activities that are
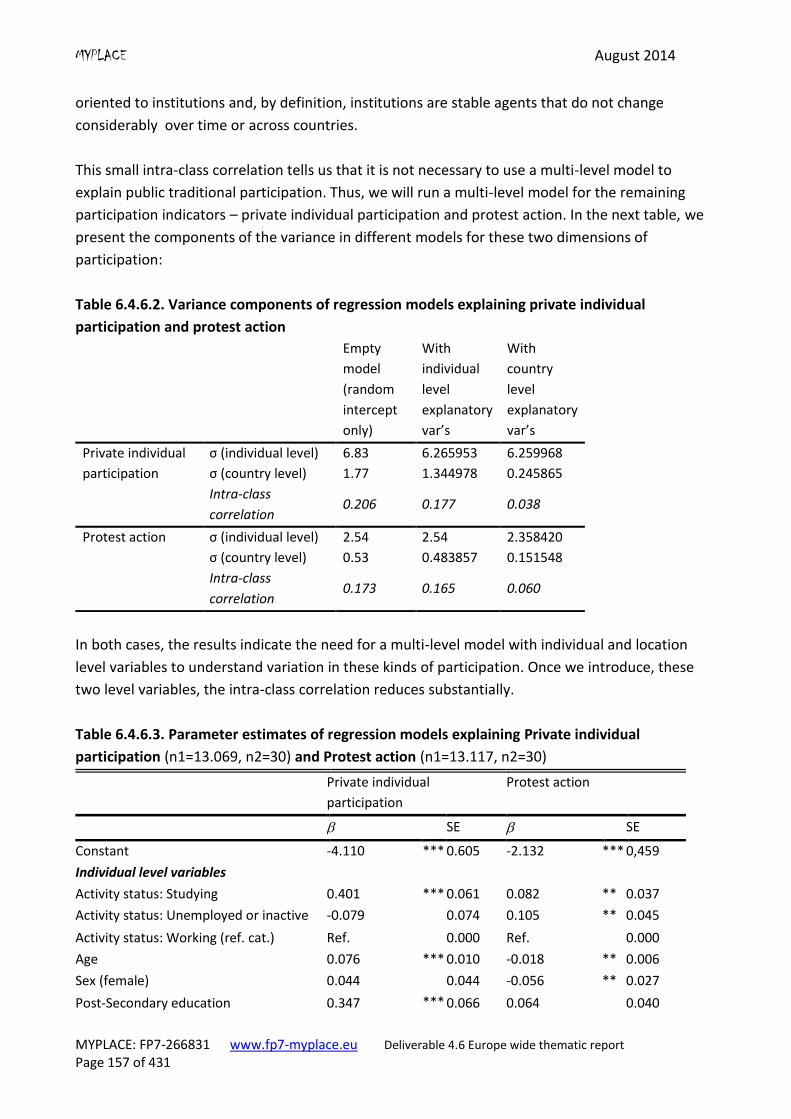
MYPLACE August 2014
MYPLACE: FP7-266831 www.fp7-myplace.eu Deliverable 4.6 Europe wide thematic report Page 157 of 431
oriented to institutions and, by definition, institutions are stable agents that do not change
considerably over time or across countries.
This small intra-class correlation tells us that it is not necessary to use a multi-level model to
explain public traditional participation. Thus, we will run a multi-level model for the remaining
participation indicators – private individual participation and protest action. In the next table, we
present the components of the variance in different models for these two dimensions of
participation:
Table 6.4.6.2. Variance components of regression models explaining private individual
participation and protest action
Empty
model
(random
intercept
only)
With
individual
level
explanatory
var’s
With
country
level
explanatory
var’s
Private individual
participation
σ (individual level) 6.83 6.265953 6.259968
σ (country level) 1.77 1.344978 0.245865
Intra-class
correlation 0.206 0.177 0.038
Protest action σ (individual level) 2.54 2.54 2.358420
σ (country level) 0.53 0.483857 0.151548
Intra-class
correlation 0.173 0.165 0.060
In both cases, the results indicate the need for a multi-level model with individual and location
level variables to understand variation in these kinds of participation. Once we introduce, these
two level variables, the intra-class correlation reduces substantially.
Table 6.4.6.3. Parameter estimates of regression models explaining Private individual
participation (n1=13.069, n2=30) and Protest action (n1=13.117, n2=30)
Private individual
participation
Protest action
SE SE
Constant -4.110 *** 0.605 -2.132 *** 0,459
Individual level variables
Activity status: Studying 0.401 *** 0.061 0.082 ** 0.037
Activity status: Unemployed or inactive -0.079 0.074 0.105 ** 0.045
Activity status: Working (ref. cat.) Ref. 0.000 Ref. 0.000
Age 0.076 *** 0.010 -0.018 ** 0.006
Sex (female) 0.044 0.044 -0.056 ** 0.027
Post-Secondary education 0.347 *** 0.066 0.064 0.040
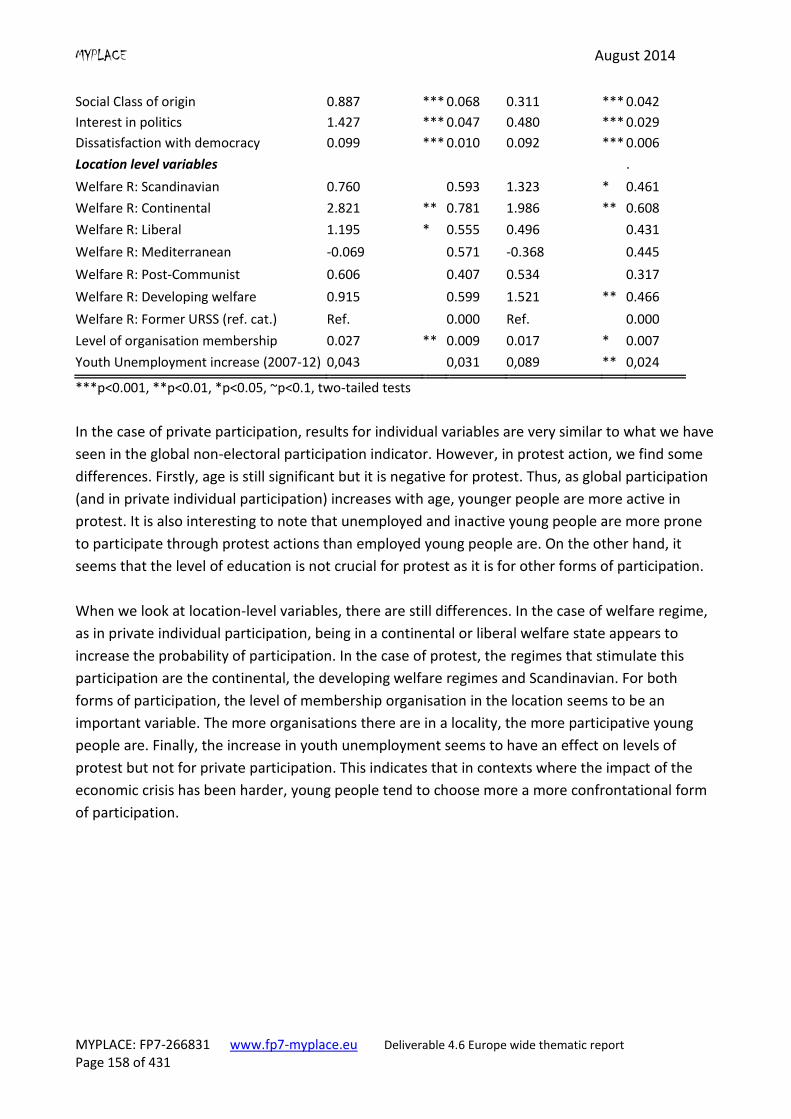
MYPLACE August 2014
MYPLACE: FP7-266831 www.fp7-myplace.eu Deliverable 4.6 Europe wide thematic report Page 158 of 431
Social Class of origin 0.887 *** 0.068 0.311 *** 0.042
Interest in politics 1.427 *** 0.047 0.480 *** 0.029
Dissatisfaction with democracy 0.099 *** 0.010 0.092 *** 0.006
Location level variables .
Welfare R: Scandinavian 0.760 0.593 1.323 * 0.461
Welfare R: Continental 2.821 ** 0.781 1.986 ** 0.608
Welfare R: Liberal 1.195 * 0.555 0.496 0.431
Welfare R: Mediterranean -0.069 0.571 -0.368 0.445
Welfare R: Post-Communist 0.606 0.407 0.534 0.317
Welfare R: Developing welfare 0.915 0.599 1.521 ** 0.466
Welfare R: Former URSS (ref. cat.) Ref. 0.000 Ref. 0.000
Level of organisation membership 0.027 ** 0.009 0.017 * 0.007
Youth Unemployment increase (2007-12) 0,043 0,031 0,089 ** 0,024
***p<0.001, **p<0.01, *p<0.05, ~p<0.1, two-tailed tests
In the case of private participation, results for individual variables are very similar to what we have
seen in the global non-electoral participation indicator. However, in protest action, we find some
differences. Firstly, age is still significant but it is negative for protest. Thus, as global participation
(and in private individual participation) increases with age, younger people are more active in
protest. It is also interesting to note that unemployed and inactive young people are more prone
to participate through protest actions than employed young people are. On the other hand, it
seems that the level of education is not crucial for protest as it is for other forms of participation.
When we look at location-level variables, there are still differences. In the case of welfare regime,
as in private individual participation, being in a continental or liberal welfare state appears to
increase the probability of participation. In the case of protest, the regimes that stimulate this
participation are the continental, the developing welfare regimes and Scandinavian. For both
forms of participation, the level of membership organisation in the location seems to be an
important variable. The more organisations there are in a locality, the more participative young
people are. Finally, the increase in youth unemployment seems to have an effect on levels of
protest but not for private participation. This indicates that in contexts where the impact of the
economic crisis has been harder, young people tend to choose more a more confrontational form
of participation.
MYPLACE August 2014
MYPLACE: FP7-266831 www.fp7-myplace.eu Deliverable 4.6 Europe wide thematic report Page 159 of 431
6.5 Summary
Of those young people eligible to vote in national elections, 71% actually did at the last
opportunity and 17% made a conscious decision not to vote. The remaining 11% reported that
they would have voted but were unable to. Locations with voting levels in excess of 80% were
Podsljeme, both Danish locations, Kuopio (Finland), both eastern German locations, Agenskalns
(Latvia) and Vic (Spain). By far the lowest level of voting was in Nuneaton (UK) where only 39% of
eligible voters chose to do so, with 43% of eligible voters deliberately choosing to stay away from
the polls.
More than half of respondents (59%) declared that they did not feel close to any political party.
In this chapter we analysed potential predictor variables of youth political activism. In order to
address this issue we opted to use multilevel regression analysis as MYPLACE data is organised in a
hierarchical structure. Individuals are nested in localities and localities are nested in countries. One
important dimension of political activism is voting behaviour. From the multilevel analysis
performed it was observed that it is in national elections that there is a higher level of variance
between localities, compared to local elections. In other words, contextual variables have more
impact in national elections than in local elections.
The results of variable coefficients allowed us to conclude that predictor variables follow very
similar patterns in the two types of elections. Older voters have higher log odds of voting. Religion
also has an influence on voting behaviour. Those who declared higher levels of religious identity
tend to demonstrate higher levels of participation in local and national elections.
As seen in previous studies, lower levels of education, belonging to a lower social class and
minority groups decrease the log odds of voting when compared to more privileged groups, such
as those with higher education, higher social class and integrated in the ethnic majority. Gender is
one of the few predictors that appears to behave differently with respect to national or local
elections. Males have higher log odds of voting in national elections than females, but this
difference is not statistically significant regarding local elections.
According to the literature on political efficacy, political involvement has a positive impact on
turnout rates. Our results support this statement. The increasing of political efficacy and political
involvement levels also increases the log odds of voting. Regarding contextual variables, we can
see that different political systems have different effects on voting behaviour. Liberal welfare state
regimes tend to discourage turnout. Bicameral regimes and proportional representation
parliaments increase the log odds of participation in elections.
We have also analysed closeness to political parties among young people. According to the data,
10% of the variance of youth closeness to political parties is explained by the differences between
MYPLACE August 2014
MYPLACE: FP7-266831 www.fp7-myplace.eu Deliverable 4.6 Europe wide thematic report Page 160 of 431
localities. A more detailed analysis shows a lower predictive ability of socio-demographic variables
such as employment status, educational attainment or ethnic belonging; none of these variables
has statistically significant capability to predict the closeness of the participants to a specific
political party. However, the same is not true of social class, it was observed, that belonging to the
higher social class increases the log odds of proximity to a political party.
Political efficacy, political involvement and trust in the political system also have an influence on
party identity; increasing levels of efficacy, political involvement and trust in the political system
result in higher log odds of feeling close to a political party. Regarding contextual variables only
cameral regimes and type of parliament representation influence the closeness to political parties.
Results suggest that living in countries with unicameral regimes and proportional representation
parliaments promote closeness to politics and decision making and, in this way, to political parties.
The MYPLACE survey allows for extended analysis of non-electoral political actions. This is crucial
when analysing young peoples’ participation since a number of published studies point to the
diversification of the political repertoires of young people (Soler-i-Martí, 2013). In addition, the
MYPLACE data permit the study of the impact of factors at the individual and the contextual level.
This is very interesting given the huge variation in the level of political activismacross Europe. In
order to capture diversity in forms of participation, we first have to identify different dimensions
in the participation repertoires of young Europeans. It is interesting to note that the first
dimension in a factorial analysis identifies a private and individual form of participation in which
the use of the Internet or political consumerism play important roles. This is the form of
participation more prevalent among young people. It is also the form of participation that is less
demanding in time and other costs such as exposure to the public since it usually occurs in the
private sphere. The other two dimensions of political participation that are identified capture
some more classical dimensions of political participation: traditional, and more institutional,
participation (that we have called public traditional participation); and protest actions (both legal
and non-legal). It is a minority of young people who carry out these two forms of political action.
Nevertheless, especially in the case of protest, there is great variation across countries and
locations.
Consequently, the focus of this chapter has been the explanation of differences across locations in
levels of participation. When we look at the global level of non-electoral participation, the
differences between the 30 locations in the study are huge. As an example, the two locations in
Hungary present a level of participation 25 times lower than some locations in eastern Germany or
Spain. Some of these differences are caused by what is called the compositional effect. That is that
the different locations have different compositions of individuals. However we have also analysed
the effect of contextual variables. We have seen that welfare regimes have an impact on
participation and that the level of membership in organisations improves the participation level of
young people in a location. We also wanted to see the effect of the economic crisis on the
participation patterns of young people. The results for the global indicator of non-electoral
MYPLACE August 2014
MYPLACE: FP7-266831 www.fp7-myplace.eu Deliverable 4.6 Europe wide thematic report Page 161 of 431
participation show that the impact of the crisis in youth unemployment has a negative effect.
However, it is interesting to highlight that when we analysed protest actions specifically, the
opposite effect is found. Therefore in locations that have experienced a greater impact of the
crisis, young people participate less in global terms but tend to participate more through protest
actions. In these contexts, where the dissatisfaction with institutions is higher, young people opt
for a more confrontational form of participation.
References
Blais, A., Gidengil, E., Nadeau, R. and Nevitte, N. (2001) Measuring Party Identification: Britain,
Canada, and the United States. Political Behavior, 23, 1, 5-22.
Dalton, R. (2007) The Good Citizen. How a Younger Generation is Reshaping American Politics.
Washington: CQ Press.
Education, Audiovisual and Culture Executive Agency (EACEA). (2013) EACEA 2010/03: Youth
Participation in Democratic Life. London School of Economics Final report. Retrieved April 15, 2014,
from
http://eacea.ec.europa.eu/youth/tools/documents/lse_study_on_youth_participation_2013.pdf.
Fieldhouse, E., Tranmer, M. and Russell, A. (2007) Something about young people or something
about elections? Electoral participation of young people in Europe: Evidence from a multilevel
analysis of the European Social Survey. European Journal of Political Research. 46: 797-822.
Franklin, M., Lyons, P. and Marsh, M. (2004) Generational Basis of Turnout Decline in Established
Democracies. Acta Politica 39 (2): 115-151.
Freire, André (2001) Modelos do Comportamento Eleitoral, Oeiras, Celta Editora.
Goerres, Achim. 2007. Why are Older People more Likely to Vote? The Impact of Ageing on
Electoral Turnout across Europe, British Journal of Politics and International Relations, 9/1: 90-121.
Henn, M., Weinstein, M. and Wring, D. (2002) A Generation Apart? Youth and Political
Participation in Britain. The British Journal of Politics and International Relations 4 (2): 167-192.
Hooghe, M., Kern, A. (2013) Party membership and closeness and the development of trust in
political institutions: An analysis of the European Social Survey, 2002-2010. Party Politics, 21-13: 1-
13.
Huggins, R. (2001) The transformation of the political audience. In B. Axford and R. Huggins (eds.),
New media and politics. London: Sage.
MYPLACE August 2014
MYPLACE: FP7-266831 www.fp7-myplace.eu Deliverable 4.6 Europe wide thematic report Page 162 of 431
Lister, M. (2007) Institutions, Inequality and Social Norms: Explaining Variations in Participation.
British Journal of Politics 9: 20-35.
Magalhães, Pedro. (2001) Desigualdade, desinteresse e desconfiança: a abstenção nas eleições
legislativas de 1999.Análise Social35 (157): 1079-1093.
Manning, N. (2010) Tensions in Young People's Conceptualisation and practice of Politics.
Sociological Research Online 15 (4).
Micheletti, M., Follesdal, A., and Stolle, D. Eds. (2003) Politics, products and markets: Exploring
political consumerism past and present. New Brunswick: Transaction Press.
Norris, P. (2004) Young People and political activism: From the politics of loyalties to the politics of
choice. Report for the Council of Europe Symposium: Young people and democratic institutions:
from disillusionment to participation. Strasbourg, 27-28th November 2003.
Nye, J. (1997) Why people don’t trust government. Cambridge, MA: Harvard University Press.
O'Toole, T. (2003) Engaging with Young People's Conceptions of the Political. Children's
Geographies 1(1): 71-90.
Park, A. (2000)‘The Generation Game’ in National Centre for Social Research British Social
Attitudes: Focusing on Diversity, London: Sage.
Pirie, M. and Worcestern, R. (1998) The Millennial Generation. London: MORI / Adam Smith
Institute.
Putnam, R. (1993) Making democracy work: Civic traditions in modern Italy. Princeton, NJ:
Princeton University Press.
Putnam, R. (2000) Bowling Alone: The Collapse and Revival of American Community. New York:
Simon and Schuster.
Soler-i-Martí, R. (2013) Democràcia, participació i joventut. Barcelona: Generalitat de Catalunya.
Stolle, D. and Hooghe, M. (2005) ‘Politics in the Supermarket: Political Consumerism as a Form of
Political Participation’ International Political Science Review 26 (3): 245-269.
Viegas, J. M., and Faria, S. (2003) A abstenção nas eleições legislativas de 2002. Retrieved April 15,
2014, from
http://www.ics.ul.pt/ceapp/conferencias/portugalavotos/viegasfaria/aabstencaoeleitoralde2002.
pdf.
Wattenberg, M. (2002) Where have all the voters gone? Cambridge, MA: Harvard University Press.
MYPLACE August 2014
MYPLACE: FP7-266831 www.fp7-myplace.eu Deliverable 4.6 Europe wide thematic report Page 163 of 431
Zukin, C., Keeter, S., Andolina, M., Jenkins, K. and Delli Carpini, M. X. (2006) A New Engagement?
Political Participation, Civic Life, and the Changing American Citizen. New York: Oxford University
Press.
MYPLACE August 2014
MYPLACE: FP7-266831 www.fp7-myplace.eu Deliverable 4.6 Europe wide thematic report Page 164 of 431
Chapter 7: Civic Engagement
Literature
Over the past 20 years, there has been considerable focus on youth civic engagement, mainly
because of concerns about the erosion of civic engagement in the younger generation, as has
been the case in the United States (Putnam 1995; 1997; 2000). In addition to the generational
‘problem’, however, there are also a number of other relevant issues to explore in order to
understand young people’s civic and political participation. Based on survey data on youth
engagement in political and civic associations, we aim to explore the socially conditioned
inequalities in civic and political participation and how structural factors influence young people’s
participation in the civic and political spheres.
Civic participation is often defined very broadly as individual and collective activities performed to
make a difference in society. Consequently, civic participation potentially covers many different
and sometimes quite diverse activities (Berger 2009, Ekman and Amnå 2012). In this chapter we
focus only on youth involvement in political and civic, and therefore we are mainly interested in
collective forms of organised formal participation.9 This kind of participation typically involves
citizens’ involvement in associations or organisations that pursue certain policy objectives or
interests through organised and collective activities vis a vis the political system or organise
certain civic activities.
In particular, associations like political parties and trade unions are important for the organisation
and representation of various social groups and political interests in society. They are seen as
important for democracy, not only because many of them function as mobilisers and channels of
political influence (Rosenstone and Hansen 2002, Warren 2001), but also because organisations
play a role as ‘schools of democracy’ (Tocqueville 1840). Seen from this perspective the engaged
members of associations develop a combination of social, associational, and political skills and
resources, such as self-confidence, associational and political knowledge and social contacts.
Political and civic associations play a significant role for the creation of local and national social
networks, and they can be seen as a link between citizens and the political system. Some have
very close connections to the established political systems, while others mainly are working at a
grass roots level, or in other important spheres of society such as religion and culture. In other
words, there are major differences between the various kinds of associations with regard to their
member base and forms of civic and political involvement and activities. During the last fifty years,
9 In their suggestion for a new typology of political participation and civic engagement Ekman & Amnå (2012), propose
two basic dimensions: The first dimension distinguishes between social involvement, civic engagement, formal political participation and (extra parliamentary) activism; and the second dimension distinguishes between individual and collective forms.
MYPLACE August 2014
MYPLACE: FP7-266831 www.fp7-myplace.eu Deliverable 4.6 Europe wide thematic report Page 165 of 431
especially political parties and labour unions have experienced declining member rates in most
parts of the western world, while associations and organisations connected to the new social
movements or traditional activities have experienced greater levels of public engagement,
especially among the younger generations. Despite these differences, we have in this chapter
chosen to summarise participation in an overall measure of membership in civic and political
associations.
In the following section, we first summarise the theoretical assumptions underlying the
hypotheses tested. In the analysis section, we first present an overview of how levels of
membership of civic and political associations vary across study locations and countries in the
MYPLACE study, and then we perform a comprehensive multilevel analysis that takes into account
the variation at the individual level and at the country level.
Explaining youth civic and political participation across locations – theory and hypotheses
When explaining why people do not participate in politics, there is a very simple way of expressing
it: “because they can’t, because they don’t want to, or because nobody asked” (Brady et
al.,1995:271). These three reasons, basically refer to the lack of resources (time, money and skills);
the absence of psychological engagement (political interest and concern with political issues); and
the absence of recruitment networks. Furthermore, one could also add that in some places they
not allowed to participate. A great deal of political participation research has examined how
participation corresponds with a number of demographic factors such as gender, age, and
resources related to education and social class. In line with this research we are also interested in
examining differences in young people’s civic participation across different social backgrounds;
however we are especially concerned with the question of how political participation varies across
the different research locations and countries in the MYPLACE study.
Explaining cross-country variation
Previous research in political participation has shown that in addition to individual variation there
is a considerable variation at the national level, indicating that cultural and institutional conditions
affect civic participation. One of the first major empirical studies addressing this issue was The
Civic Culture study by Almond and Verba (1989/1963). They explored the levels of civic
engagement in five different nations, using a cross-country survey, and found that at that time the
USA had considerably high levels of engagement. Later the more extensive World Values Study
(see e.g. Inglehart, 1997) confirmed the general picture of country variation in civic participation. A
common feature of these comparative approaches is that civic participation is seen as rooted in
different cultures and value systems (like materialist and post materialist values).
Schofer and Fourcade-Gourinchas (2001) present a ‘structuralist’ view on civic participation. They
analysed voluntary association membership in 32 countries, based on the World Values Surveys.
They suggest that two institutional distinctions account for much of the variation in organisational
MYPLACE August 2014
MYPLACE: FP7-266831 www.fp7-myplace.eu Deliverable 4.6 Europe wide thematic report Page 166 of 431
membership across countries: First, the distinction between Statist versus non-Statist (liberal)
societies, and second the distinction between cooperate versus non corporate societies. These
dimensions reflect the differences in state structure and political institutions, which encourage or
discourage the development of various types of organisations and civic participation in
organisations. An interesting finding in their study is that the level of statism has a particularly
strong negative impact on the overall level of membership in a country, and that the level of
corporateness has a positive impact (Schofer and Fourcade-Gourinchas, 2001).
Two more recent analyses contribute to this debate, with quite similar results in terms of the
variation at the country level. In a comparative analysis of the variety of social capital in welfare
states regimes, Kääriäinen and Lehtonen (2006), found that different forms of social capital are
connected to welfare states in different ways: Mediterranean welfare states have higher levels of
close familiar networks, while citizens in Scandinavian welfare states are more likely to engage in
voluntary associations. In an analysis of membership of political associations in 17 western
democracies, Morales (2009) also provides evidence for variation in political participation across
countries. Differences in levels of education, the socio-economic characteristics of the citizenry
alone, cannot explain country differences, and therefore Morales suggests that the political
context is of critical importance, and especially the existence and networks of politically active
organisations enabling mobilisation of citizens (Morales 2009:209).
In our analysis of young people’s membership of political associations we apply a modified version
of the theory of welfare state regimes, which was originally introduced by Esping-Andersen (1990).
Esping-Andersen considers welfare states to be complexes of institutions regulating the relations
between the state, the economy and the households. Historically welfare states have emerged at
different times and have followed different paths. Based on the degree of de-commodification and
the type of stratification, Esping-Andersen distinguishes between three ideal types of welfare
regimes: the liberal, the conservative and the social-democratic. To some extent, these regimes
also reflect the geopolitical map, and hence in the literature they are also called the Anglo-Saxon,
the Continental, and the Scandinavian. De-commodification is about the degree of government
regulation of the market, which is reflected in how different welfare services are offered.
Stratification refers to the scale of the social policy regulation in terms of offering benefits to
citizens. Compared to other welfare states, the Scandinavian welfare regime has a high degree of
regulation and a more comprehensive universalism, in the sense that citizens have equal access to
public services and benefits. Liberal Anglo-Saxon welfare states are characterised by a low degree
of de-commodification and a low degree of universalism, while conservative/continental welfare
states are placed between the first two. In the literature on welfare states, there has been much
debate on whether these distinctions are sufficiently accurate and nuanced. Certainly, there are
many differences within each group of welfare state types.
Later studies have suggested that the South European welfare states have special features, and
therefore should be added as a special type. They are characterised by a relatively low degree of
MYPLACE August 2014
MYPLACE: FP7-266831 www.fp7-myplace.eu Deliverable 4.6 Europe wide thematic report Page 167 of 431
de-commodification and a limited universality. The Catholic Church has historically played a major
role in the provision of social services and benefits (Arts and Gelissen 2002, Kääriäinen and
Lehtonen 2006). Furthermore, the new (re-)established states in Eastern Europe, has also
increased the interest in this group of states that despite large individual differences, have some
historical commonalities in their previous connection to the Soviet Union. Since the dissolution of
communist (or socialist) regimes, all these states went through a rapid and profound economic
transition. These states continue to be characterised by a certain degree of universalism, as the
economic transformation helped to reduce the degree of de-commodification.
As mentioned earlier we think the welfare state typologies may help to provide a useful analytical
categorisation, however, when theoretically considering what characteristics are essential for the
development of political associations and the level at political participation, it is also important to
note that it is not only a question of universalism and de-commodification. As pointed out by
Schofer and Fourcade-Gourinchas (2001) and Morales (2009) the relationship between the state
and civil society is of vital importance, especially to what extent the state supports and cooperates
with free political associations and organisations. Table 7 shows how we have categorised each of
the countries in the MYPLACE-study.
Table 7 Welfare state types
Welfare state typology Universalism De-
commodification
Statist
tradition +
Liberal
tradition -
Corporate
+
Non-
corporate
-
Countries in
MYPLACE-
survey
Scandinavian/
Social democratic
+ + (-) + Denmark,
Finland
Continental/Conservative - (+) + Western
Germany
Anglo-Saxon/Liberal - - - - UK
Mediterranean/ (Catholic) - - (+) - Spain,
Portugal
Greece
Post-communist (+) - + - Eastern
Germany,
Russia,
Estonia,
Latvia,
Croatia,
Hungary,
Slovenia,
Georgia
Hypotheses
MYPLACE August 2014
MYPLACE: FP7-266831 www.fp7-myplace.eu Deliverable 4.6 Europe wide thematic report Page 168 of 431
Based on previous comparative studies, our overall hypothesis regarding young people’s
membership of political associations in that we will find significant differences between groups of
welfare states. We also expect that participation in youth membership of political associations is
most pronounced in welfare states characterised by a high degree of universalism, de-
comodification and corporate relations between state and civil society.
This analysis of the MYPLACE data takes into account the country level differences by exploring to
what extend structural characteristics, related to welfare regime affects, the levels of civic
engagement among young people. In the analysis we include also a number of variables at the
individual level.
Gender and participation
Despite a movement towards greater gender equality in political participation and representation,
research still shows consistent differences in male and female political engagement. Women are
less interested in politics and are less politically active than men (Box-Steffensmeier et al., 2004;
Hayes and Bean, 1993; Howell and Day, 2000). Regarding affiliation with political associations,
research shows that women are slightly less likely than men to be affiliated with any organisation,
whether political or non-political. On average men are also affiliated with more voluntary
associations than women. Furthermore, men and women are involved in different kinds of
associations: In general, men are more likely to be involved in political and professional
associations and organisations, while women are more likely to be involved in religious and
educational organisations (Burns et al., 2001). We hypothesise that these patterns of gender
differences will also be present in the MYPLACE study.
Age and civic participation
Previous studies of civic engagement have noted that involvement is relative low in early
adulthood and increases with age. Jennings and Stokers’ (2004) longitudinal study of a 1965
cohort, across age 18-50, showed that engagement in various kinds of civic organisations was
highest in adolescence and midlife, but lowest during transition to adulthood. These participatory
patterns across the life cycle patterns are very much dependent on familial and institutional
boundaries. Civic participation in early adulthood is often related to school and education
activities, while exposure to more policy-oriented organisations, such as trade unions and political
parties, typically develops when people have settled into careers and adult roles such as,
parenting, home ownership (Kinder, 2006).
As the MYPLACE survey only involves young people age 16-25, we will not be able to analyse
participation in political organisations across the life span. However, we still expect to find an age
effect. The years of early adulthood are in many ways a turbulent phase of life, which is
particularly marked by social instability in terms of attachment to family and local community.
During these years many young people leave, their family home due to their choice of education,
jobs etc. Studies of young people’s voting patterns have shown that voter turnout is actually
MYPLACE August 2014
MYPLACE: FP7-266831 www.fp7-myplace.eu Deliverable 4.6 Europe wide thematic report Page 169 of 431
higher for the youngest voters, still living with their parents, than for those who have just left their
family home.
Social class, education and participation
Political participation is characterised by great social inequalities. People with higher incomes,
stable life situations, and especially higher education are typically more likely to participate in
politics (Milbrath and Goel, 1977, Nie and Verba, 1987). The positive correlation between levels of
education and political participation is among the best documented findings in political research
(Nie et al., 1996.).This also applies for participation in social and political organisations
(Rosenstone and Hansen, 2002). Part of the explanation for this is that social inequality often is
rooted in family background. Well-educated parents are typically more inclined to engage in social
and political life and raise their children to participate in society. Research into political
socialisation shows that children growing up in such families, are more likely to acquire knowledge
about politics, and a greater degree of political confidence.
The MYPLACE survey includes information about respondents’ employment status and level of
education. Based on previous research on inequality and political participation, we also expect
that education and employment will have a significant impact on the level of participation.
Motivation, knowledge, trust and religiosity
Besides the contextual and the socio-economic variables, we have also included variables
measuring political motivation, trust and religiosity. We expect that levels of trust in political
institutions has a positive impact on memberships of political associations, however this
relationship may vary according to the type of welfare state. We expect that positive relationships
mainly exist in the Scandinavian type of welfare state. In the MYPLACE survey respondents were
asked about their level of trust towards to different societal institutions and organisations. Index
for political trust was constructed from four different items.10
7.1 Civic Engagement Index (Q18)
Our dependent variable is ‘membership of political associations’. We have chosen to
establish a composite measure of the number of memberships. Based on the concept of
‘bridging social capital’ (Putnam, 1993), we think this to a certain degree reflects the extent
to which respondents in the survey are likely to be organised in different (although
sometimes overlapping) political associations. For the analysis, we constructed a
10
We use questions from Q7. Index consist the following items: trust in PM (Q7_3), trust in EC (Q7_7), trust in local parliament (Q7_8) and trust in parties (Q7_13). Trust in European commission is included in the index, because we find that supranational EU-level politics is an inseparable part of the local politics as well. Political trust index ranges from 0 - 40. Higher score means greater trust. A Cronbach Alpha value of 0.86 indicates that this four item scale has excellent reliability as a composite measure.
MYPLACE August 2014
MYPLACE: FP7-266831 www.fp7-myplace.eu Deliverable 4.6 Europe wide thematic report Page 170 of 431
membership index, including 11 out of 15 organisations mentioned in the survey
questionnaire. The organisations included are: ‘political parties or youth sections of political
parties’; ‘religious or church organisations or religious youth organisations’; ‘trade unions or
youth organisations of trade unions’; ‘national or local youth parliaments’; ‘environmental
organisations’; ‘animal welfare groups’; ‘peace organisations’; ‘human rights organisations’;
‘national or cultural organisations (for instance diaspora or ethnic minority organisations)’;
‘women’s organisations’ ; and ‘anti-globalisation organisations or movements’. Thus, our
dependent variable refers to the number of political organisations each of our respondents is
joining. The distribution of the responses is zero-inflated and provides an eleven-point scale
ranging from 0 to 11, where high values indicate high civic engagement.
As shown below, there is a considerable variation in membership of political organisations across
the different MYPLACE locations.
MYPLACE August 2014
MYPLACE: FP7-266831 www.fp7-myplace.eu Deliverable 4.6 Europe wide thematic report Page 171 of 431
Q18: Membership of Political Associations
Variable Description
The distribution of the responses is zero-inflated and provides an eleven-
point scale ranging from 0 to 11, where high values indicate high civic
engagement.
Graph 7.1: Mean Membership of Political Associations by location
Narrative
The overall mean for civic engagement is 0.25 (n=16,597, sd=0.716). This
varies by location, with the highest mean score at Odense Center (Denmark)
with 0.98, and the lowest mean score at Ozd (Hungary) with 0.04.
There are quite clear clusters of locations; with locations in Denmark,
eastern Germany, and western Germany, all at the top of the table, with
higher levels of civic engagement. Post-socialist countries, including
Hungary, Slovakia, Georgia and Latvia, are clustered in the bottom of the
table, with lower levels of membership in political organisations. In general,
civic participation is at a low level and most differences within countries are
relatively small. Also, countries with the very low levels of civic engagement
(under 0.30) have small differences between city and rural areas.
When compared with previous studies of memberships of political
associations, we find quite strong similarities in the way in which countries
are ranked in relation to each other (see Schofer and Fourcade-Gourinchas,
2001 and Morales, 2007).
MYPLACE August 2014
MYPLACE: FP7-266831 www.fp7-myplace.eu Deliverable 4.6 Europe wide thematic report Page 172 of 431
7.2 Multi-level Modelling
As the next step of the analysis, we performed multilevel analysis in order to estimate the
overall individual and country variation in civic participation, across the different European
research locations. As individual level variables, we have included gender, age, social class,
minority/majority status, education, employment, religiosity, political knowledge and
political interest, and political trust.
Model: Level of civic engagement
Table 7.2.1 Variance components of regression models explaining civic engagement
Empty
model
(random
intercept
only)
With
individual
level
explanatory
var’s
With country
level
explanatory
variable
σ (individual level) 1 1 1
Civic Engagement σ (country level) 0.645 0.506 0.118
-2 log pseudo likelihood 85761.757 84646.070 84433.203
The analysis of variance components expresses that 84 percent of the variance in
membership engagement can be explained by differences between individuals; whereas 16
percent of the variance can be explained by localities (Intra-class correlation (ICC) = 0.16). In
order to explain variation at the level of localities, a multilevel analysis (Generalised Linear
Mixed Model) was run.
By adding individual level variables to the null model, intercept variance is reduced by 22
percent in order to explain differences between localities in civic engagement scores. When
the contextual variable (‘welfare state regime’) was added, it explained a significant
proportion of the differences as intercept variance reduced even 77 percent.
MYPLACE August 2014
MYPLACE: FP7-266831 www.fp7-myplace.eu Deliverable 4.6 Europe wide thematic report Page 173 of 431
Table 7.2.2 Determinants of civic engagement
n2=30, n1=15,058
Model 1
b SE
Individual level predictors
Women Ref. Ref.
Men -0.161 *** (0.040)
Age 0.046 *** (0.012)
High Social Class - 3 Ref. Ref.
Class 2 -0.199 ** (0.075)
Class 1 -0.087 (0.062)
Low Social Class - 0 -0.164 * (0.067)
Majority Ref. Ref.
Minority 0.148 * 0.062
Other Ref. Ref.
Employed 0.205 0.108
In education 0.220 * 0.103
Unemployed 0.296 0.161
Religious Ref. Ref.
Not religious -0.265 ** 0.092
Political knowledge 0.129 *** 0.032
Not at all interested in politics Ref. Ref.
Not very interested in politics 0.192 0.104
Quite interested in politics 0.521 *** 0.101
Very interested in politics 0.942 *** 0.032
Political trust 0.003 0.015
Contextual level predictors
Liberal Ref. Ref.
Mediterranean -0.711 *** 0.188
Conservative 0.315 0.091
Nordic 0.747 *** 0.204
Post-socialist -0.876 *** 0.203
Intercept -2.835 *** 0.366
***p<.001, **p<.01, *p<.05, ~p<.1, two-tailed tests.
Starting with the individual level variables, we see from the full model in table 7.2.2, that
age has a positive impact on participation, however somewhat surprisingly the statistical
effect is quite weak. Another surprising finding is that women seem to have more political
memberships than men do (p<.001). As one might expect, civic engagement is also related
MYPLACE August 2014
MYPLACE: FP7-266831 www.fp7-myplace.eu Deliverable 4.6 Europe wide thematic report Page 174 of 431
to social class status. Roughly, the higher the social class that respondents belong to, the
more likely they are to participate. Unexpectedly, young people who are unemployed are
more likely to be members, than students or people who are employed. However, the
differences between groups are not statistically significant.
Civic engagement varies only a little between ethnic majority and minority groups.
However, we do find that young people belonging to minority groups tend to have slightly
higher level of memberships. The reason for this is presumably that the associational
memberships are related to specific political minority interests and activities. The young
people who are religious are more likely to be members of political associations than the
non-religious group. The difference is statistically significant (p<.01).
As expected, young people who are interested in politics are also more likely to be members
of political associations. Respondents who consider themselves to be very interested in
politics are considerably more active than the respondents with less political interest. In
addition, the more young people have political knowledge, the more they participate
(p<.001). It is evident that the causal relationship between these variables and associational
membership may also follow the opposite direction, in the sense that the associational
membership will produce more politically interested and knowledgeable members.
Quite surprisingly, political trust is not related to civic engagement as the regression
coefficient of the political trust variable is at very low level. The different is not statistically
significant (p=0.836).
As shown in graph 7.1, membership of political associations, varies notably between
countries. A central question in this chapter was to what extent these differences persist,
when we take into account the variation on the individual level. As revealed in the bottom
of table 7.2.2, young people belonging to the Nordic welfare regime are clearly more likely
to be members of political associations than young people from other welfare regimes,
whereas Mediterranean and particularly post-socialist regime are the least active regimes
(p<.001 in all aforementioned regimes).
7.3 Summary
16.4 Civic Engagement: Summary
Consistent with previous studies, our study of young Europeans aged 16-25, has shown that
there is considerable variation across countries and the variation is greater than the
variation between different locations in each of the countries. Similarities with previous
MYPLACE August 2014
MYPLACE: FP7-266831 www.fp7-myplace.eu Deliverable 4.6 Europe wide thematic report Page 175 of 431
studies are also evident in terms of how the countries are ranked in relation to each other.
Young people from the Nordic countries (Denmark and Finland), clearly have the highest
levels of membership of political associations, while young people from Mediterranean
(Portugal, Spain and Greece) and post-communist countries (Hungary, Slovakia, Georgia and
Latvia) have the lowest levels.
Based on institutional theory, and consistent with previous studies, we suggest that these
differences can be explained best by the ways in which states cooperate and support
political organisations. In the Nordic countries, especially Denmark, many voluntary
associations and organisations receive direct and indirect public subsidies with the purpose
of developing associations and civic engagement. Part of the conditions for receiving
economic funding is that these associations must comply with basic rules regarding
democratic organisation and economy. This also applies to political parties. Also labour
unions are encouraged through the tax deduction that members receive for their
membership.
From an institutional perspective, it is also important how the relationship between the
state and unions has evolved historically. In former communist countries political
associations, which were in opposition to the established regime, weres banned and
citizens’ political participation was only accepted if it supported the communist regime.
In relation to individual level variables, a surprising finding was that young women seem to
have a higher rate of membership than their male counterparts. While previous studies
have indicated a trend towards decreasing gender inequality, our research provides
empirical evidence that young women are about to overtake men in terms of their
membership of political organisations.
References
Adler, R. P. and Goggin, J. (2005) What Do We Mean By “Civic Engagement”? Journal of
Transformative Education 3, 3: 236–53.
Almond, G. A. and Verba, S. (1989). The Civic Culture: Political Attitudes and Democracy in
Five Nations. Sage Publications, Inc.
Arts, W. I. L. and Gelissen, J. (2002) Three Worlds of Welfare Capitalism or More? A State-of-
the-Art Report. Journal of European Social Policy 12, 2: 137–58.
Box-Steffensmeier, J. M., De Boef, S., and Lin, T. (2004). The dynamics of the gender gap.
American Political Science Review, 98, 515–528.
MYPLACE August 2014
MYPLACE: FP7-266831 www.fp7-myplace.eu Deliverable 4.6 Europe wide thematic report Page 176 of 431
Burns, N., Schlozman, K. L. and Verba, S. (2001). The private roots of public action: Gender,
quality, and political participation. Cambridge: Harvard University Press.
Berger, B. (2009) Political Theory, Political Science and the End of Civic Engagement.
Perspectives on Politics 7, 02: 335–50.
Howell, S. E., and Day, C. L. (2000) Complexities of the Gender Gap. Journal of Politics 62, 3:
858–874.
Ekman, J, and Amnå, E. (2012) Political Participation and Civic Engagement: Towards a New
Typology. Human Affairs 22, 3: 283–300.
Esping-Andersen, G. (1990.) The Three Worlds of Welfare Capitalism. Princeton, N.J:
Princeton University Press.
Hayes, B. C. and Bean, C. S. (1993) Gender and Local Political Interest: Some International
Comparisons. Political Studies 41, 4: 672–82.
Inglehart, R. (1997) Modernization and Postmodernization. Princeton, New Jersey: Princeton
University Press.
Kinder, D. R. (2006) Politics and the Life Cycle. Science 312(5782): 1905–8.
Milbrath, L. W. and Goel, M. L. (1977) Political Participation: How and Why Do People Get
Involved in Politics? Chicago: Rand McNally and Co
Morales, L. and Geurts, P. (2007). ‘Associational Involvement’. In Citizenship and
Involvement in European Democracies: A Comparative Analysis, ed. van Deth, J.W.,
Montero, J.R. and Westholm, A. 135-157. Routledge.
Morales, L. (2009) Joining Political Organisations: Institutions, Mobilization, and
Participation in Western Democracies. Colchester: European Consortium for Political
Research Press.
Nie, N. H., and Verba, S. (1987) Participation in America: Political Democracy and Social
Equality. Chicago: University of Chicago Press.
Nie, N.H., Junn, J. and Stehlik-Barry, K. (1996) Education and Democratic Citizenship in
America. Chicago: University of Chicago Press.
Putnam, R. D., Leonardi, R, and Nanetti, R.Y. (1993) Making Democracy Work: Civic
Traditions in Modern Italy. Princeton University Press.
Putnam, R. D. (1995) Tuning In, Tuning Out: The Strange Disappearance of Social Capital in
America». PS: Political Science and Politics 28, 4: 664–83.
Putnam, R. D. (2001) Bowling Alone: The Collapse and Revival of American Community. New
York, NY: Touchstone Books by Simon and Schuster.
Rosenstone, S. J. and Hansen, J. M. (2002) Mobilization, Participation, and Democracy in
America. 1 edition. New York: Pearson.
MYPLACE August 2014
MYPLACE: FP7-266831 www.fp7-myplace.eu Deliverable 4.6 Europe wide thematic report Page 177 of 431
Schofer, E. and Fourcade-Gourinchas. M. (2001) The Structural Contexts of Civic
Engagement: Voluntary Association Membership in Comparative Perspective. American
Sociological Review 66, 6: 806–28.
Tocqueville, Alexis de (1994/1840) Democracy in America. New York: Everyman’s Library.
Adolph A. Knopf.
Warren, M. E. (2001) Democracy and Association. Princeton, New Jersey: Princeton
University Press.
MYPLACE August 2014
MYPLACE: FP7-266831 www.fp7-myplace.eu Deliverable 4.6 Europe wide thematic report Page 178 of 431
Chapter 8: Effective Political Action
It was important to find out how effectively, in respondents’ opinion, certain activities can
influence politics in the respective country. An 11-point scale was used to measure
perceived effectiveness of each of the following actions:
Being active in a political party (Q19_1),
Working in voluntary organisations and associations (Q19_2),
Personally contacting politicians (Q19_3),
Gaining publicity through media exposure (Q19_4),
Boycotting or boycotting certain products (Q19_5),
Participating in public demonstrations (Q19_6),
Signing petitions (Q19_7),
Participating in illegal activities (Q19_8),
Participating in violent protest activities (Q19_9),
Distributing political messages on social media sites (Q19_10),
Voting in elections (Q19_11).
Analysis of respondents’ answers proceeds in three steps.
First, we apply factor analysis to explore the possibility of reducing variables to any
underlying factors. This analysis suggests that the survey questions track onto two
underlying variables — legal or nonviolent political activity, and illegal or violent activity. We
therefore develop a composite scale for each variable, each of which has high reliability and
internal consistency.
Second, having reduced variables to the underlying scales, we analyse the scales by survey
location across all partners (total of 30 survey locations). We present descriptive statistics
for each scale, discuss clusters of locations with similar descriptive statistics, and discuss any
obvious disparities between two locations within the same country.
Third, we develop a multi-level regression model to explain individual attitudes toward the
effectiveness of political action. We focus analysis on the scale that captures attitudes on
the effectiveness of legal or nonviolent activity. With the model we are able to explore both
individual-level and contextual-level determinants of these attitudes.
Literature
Much of the recent literature on youth political participation emphasises an increasing
cynicism that is associated with declining rates of political participation. That is, structural
and institutional changes may lead to social dislocation which makes young people less
MYPLACE August 2014
MYPLACE: FP7-266831 www.fp7-myplace.eu Deliverable 4.6 Europe wide thematic report Page 179 of 431
confident that political activity is likely to be effective (see, for example, (Horvath and
Paolini, 2014) for an overview specific to survey research on European youth).
The predominant general explanations for political participation might be usefully
categorised into modernisation, political culture, and social capital approaches. The
modernisation approach typically holds that economic development causes changes in
economic and social organisation. These changes, including increased urbanisation,
industrialisation, education, and technological development may produce political
participation that is either constructive (Lipset, 1959; Epstein et al., 2006; Boix and Stokes,
2003) or non-constructive (Huntington, 1968; O’Donnell, 1973).
Cultural approaches build on structural explanations by arguing that economic development
operates on individual attitudes and beliefs to affect political participation. Typically, the
modernisation process encourages increased political participation through the
development of “modern” attitudes of diffuse interpersonal trust and resistance to
authority (Almond and Verba, 1963) or “postmodern” pursuits of goals beyond immediate
economic requirements (Inglehart, 1997).
Finally, social capital approaches draw on both structure and culture to explain patterns of
political participation. In the most prominent example, historically developed patterns of
interpersonal trust, diffuse social networks, and norms of reciprocity serve as solutions to
the collective action problem of political activity, resulting in greater government
accountability. This effective governance provides positive feedback, encouraging greater
political participation and creating virtuous cycles of citizen engagement and good
governance. Conversely, more closed forms of social organisation create vicious cycles of
disengagement and ineffective governance (Putnam et al., 1993).
While these general approaches to political participation do not deal directly with
individuals' perceptions of the effectiveness of specific types of political activity, their logic
might potentially explain these perceptions. Other studies have noted that survey questions
on perceptions of efficacy are unlikely to track perfectly onto actual participation (Horvath
and Paolini, 2014). However, factors that drive changes in participation are likely to have
some effect on how young people perceive the effectiveness of participation. Indeed,
Horvath and Paolini identify social dislocation resulting from supranational political
institutions and globalisation, shifts in political attitudes, and economic instability that have
led young people to lose faith in the effectiveness of traditional, institutionalised forms of
participation like political parties, in favour of more individualised, expressive forms of
participation. Similarly, Forbrig (2005) emphasises that frustration with traditional
democratic institutional channels has led young people to shift patterns of political
participation (see also Taft and Gordon, 2013). Other studies in this vein emphasise the
decline of political institutions (Duin, 1997), personal economic considerations (Winston,
MYPLACE August 2014
MYPLACE: FP7-266831 www.fp7-myplace.eu Deliverable 4.6 Europe wide thematic report Page 180 of 431
2013), and dislocation due to structural change (Edwards, 2009) as determinants of
attitudes toward political participation. This section draws on these approaches to develop a
multi-level model that explores how group-level indicators for globalisation, political
accountability, and welfare regimes interact with individual-level demographic variables to
affect youth attitudes toward the efficacy of political action.
8.1 Effectiveness of political activity scales (Q19)
Factor analysis of all Q19 survey items suggested two underlying latent variables—one
representing effectiveness of legal and nonviolent activity (Q19_1, Q19_2, Q19_3, Q19_4,
Q19_5, Q19_6, Q19_7, Q19_10, Q19_11) and another representing effectiveness of illegal
and/or violent activity (Q19_8 and Q19_9).11
The legal/nonviolent scale exhibited high reliability (Cronbach alpha = 0.884) with strong
internal consistency (location level Cronbach alphas ranging from 0.798 for Odense Center
in Denmark to 0.942 for Trnava in Slovakia). The resulting scale indicates the individual's
mean response on nine questions of the Q19 series — those concerned with the
effectiveness of political activity that is legal or nonviolent (‘political party activity’, ‘work in
voluntary organisations’, ‘contacting politicians’, ‘gaining media exposure’, ‘boycotts or
“buycotts”’, ‘demonstrations’, ‘petitions’, ‘social media activity’, and ‘voting’).
The illegal/violent activity scale also exhibited high reliability (Cronbach alpha = 0.852) with
strong internal consistency (location level Cronbach alphas ranging from 0.742 for Rostock
to 0.931 for Sopron). The resulting scale indicates the individual's mean response on two
questions of the Q19 series—those concerned with the effectiveness of political activity that
is illegal or violent (violent or illegal protest activities).
11
We also explored the possibility of an alternative set of three underlying factors: traditional institutional activity (including political parties, voluntary organisations, contacting politicians, traditional media, and voting), nontraditional or ad-hoc activity (including boycotts, demonstrations, petitions, and social media), and violent activity (violent or illegal protests). While factor analysis provided some support for these three latent scales, factor loadings were relatively low, despite high reliability tests. While these composites are theoretically interesting, we have decided to proceed with the stronger empirical argument, the two factor solution.
MYPLACE August 2014
MYPLACE: FP7-266831 www.fp7-myplace.eu Deliverable 4.6 Europe wide thematic report Page 181 of 431
Q19 Scale A: Effectiveness of Legal/Nonviolent Activity
Variable Description Variable is an 11-point scale ranging from 0.0 (low effectiveness) to 10.0
(high effectiveness). The distribution of scores on the scale is approximately
normal, although slightly skewed toward lower values. The distribution is
somewhat zero-inflated, with 235 respondents (1.4% of all respondents)
registering a score of zero (“not at all effective”). Respondents registering a
score of zero do not appear to be, distributed uniformly across locations. The
greatest percentage of these respondents were, located in Podslijeme
(Croatia) and Kupchino (Russia), each of which contained 10.6% (25
respondents each) of the respondents that registered zero on the scale.
Several locations, on the other hand, contained no respondents that
recorded a zero on the scale, including Odense East (Denmark), Jena
(eastern Germany), and Rostock (eastern Germany).
Narrative The overall mean for effectiveness of legal or nonviolent political activity is
5.26 (n=15,318, sd=1.94). This varies by location, with the highest mean
score in Telavi (Georgia) with 6.49, and the lowest mean score in Sopron
(Hungary) with 3.92.
There is some clustering of locations; both locations in Denmark, Georgia,
eastern Germany and western Germany near the top, indicating higher levels
of belief in the efficacy of legal or nonviolent action. Central European
countries including Croatia, Slovakia, and Hungary are clustered toward the
bottom, indicating lower levels.
Most countries had similar mean score between the two locations in the
given country; there does not appear to be any large differences between
locations within each country.
Graph 8.1a: Mean effectiveness of legal/nonviolent activity by location
MYPLACE August 2014
MYPLACE: FP7-266831 www.fp7-myplace.eu Deliverable 4.6 Europe wide thematic report Page 182 of 431
Q19 Scale B: Effectiveness of Illegal/Violent Activity Variable Description
Variable is an 11-point scale ranging from 0.0 (low effectiveness) to 10.0 (high
effectiveness). The distribution of scores on the scale is vaguely normal, skewed toward
higher values, and heavily zero-inflated, with 3110 respondents (18.4%) registering a
score of zero. These respondents do not appear to be, uniformly distributed across
locations. Podslijeme (Croatia) contained the highest percentage of respondents that
registered a zero at 5.8% (180 respondents). Kuopio (Finland) contained their lowest
percentage at 1.6% (49 respondents).
Graph 8.1b: Mean effectiveness of illegal/violent activity by
location
Narrative
The overall mean for effectiveness of illegal or violent political activity is 3.21
(n=16,038, sd=2.60). This varies by location, with the highest mean score in Telavi
(Georgia) with 5.51, and the lowest mean score in Rostock (eastern Germany) with
2.33. There is some clustering of locations; both locations in Georgia, UK, and Latvia
near the top, indicating higher levels of belief in the efficacy of illegal or violent actions.
eastern and western Germany, Spain, and Denmark clustered toward the bottom,
indicating lower levels.
Most countries had a similar mean score between the two locations. Indeed, except
for the two Georgian locations, the entire sample exhibits relatively low variation. The
means of the two Georgian locations (Telavi and Kutaisi), though, are both statistically
significantly different at 90% confidence from the next highest location. At this stage,
we have developed two potential explanations for this difference. First, the 2003 Rose
Revolution and subsequent series of illegal or violent protest in Georgia may serve as
an “availability heuristic,” providing a successful example that leads respondents to
assess this strategy as effective. Second, respondents in countries with a historical
tradition of political protests may be more likely to perceive any given protest event as
a legitimate public demonstration. In contrast, respondents from countries lacking this
tradition, or which have historically defined public protest as illegal, may be more likely
to perceive any given protest event as illegal or violent. At this point, however, these
hypotheses are speculative, and require additional testing. Note also that this
difference exists for each of this scales constituent individual items (Q19_8 and Q19_9).

MYPLACE August 2014
MYPLACE: FP7-266831 www.fp7-myplace.eu Deliverable 4.6 Europe wide thematic report Page 183 of 431
8.2 Effective political action (Q19) - Constituent items
Respondents were asked to indicate on an 11-point scale, “How effectively do you think the
following actions can influence politics in your country?” with zero indicating “not at all
effective” and 10 indicating “very effective.” Respondents were, asked about 11 specific
types of political activity, including:
Q19_1: Being active in a political party
Q19_2: Working in voluntary organisations and associations
Q19_3: Personally contacting politicians
Q19_4: Gaining publicity through media exposure (TV/radio/newspapers)
Q19_5: Boycotting certain products
Q19_6: Participating in public demonstrations
Q19_7: Signing petitions
Q19_8: Participating in illegal protest activities
Q19_9: Participating in violent protest activities
Q19_10: Distributing political messages on social media sites
Q19_11: Voting in elections
Chart 8.2 displays the mean responses for each of the individual items (the composite scales
are included for comparison). Due to the large sample size, the mean responses for most
items are statistically significant. The exceptions (participation in political parties, voluntary
organisations, and public demonstrations) do not appear to be statistically significant from
each other. Voting in elections received the highest mean response for effectiveness, while
violent protest activities received the lowest rating for effectiveness.
Below, we present results for each of the items asked.
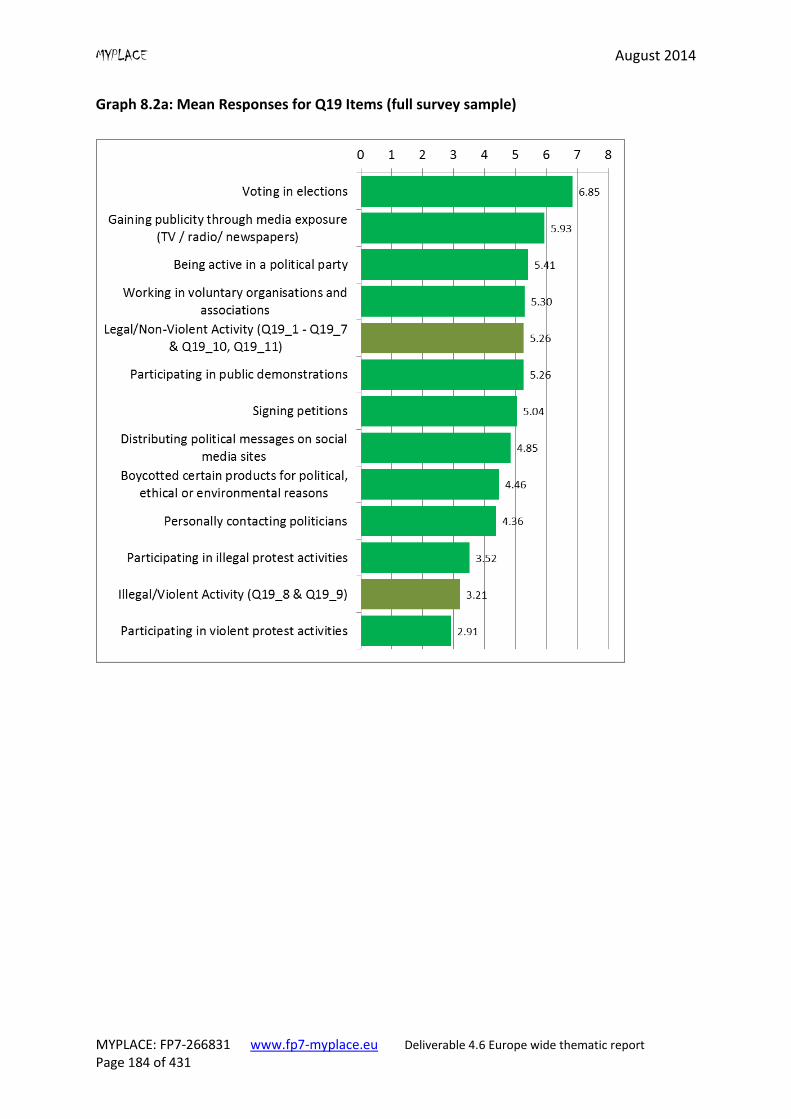
MYPLACE August 2014
MYPLACE: FP7-266831 www.fp7-myplace.eu Deliverable 4.6 Europe wide thematic report Page 184 of 431
Graph 8.2a: Mean Responses for Q19 Items (full survey sample)
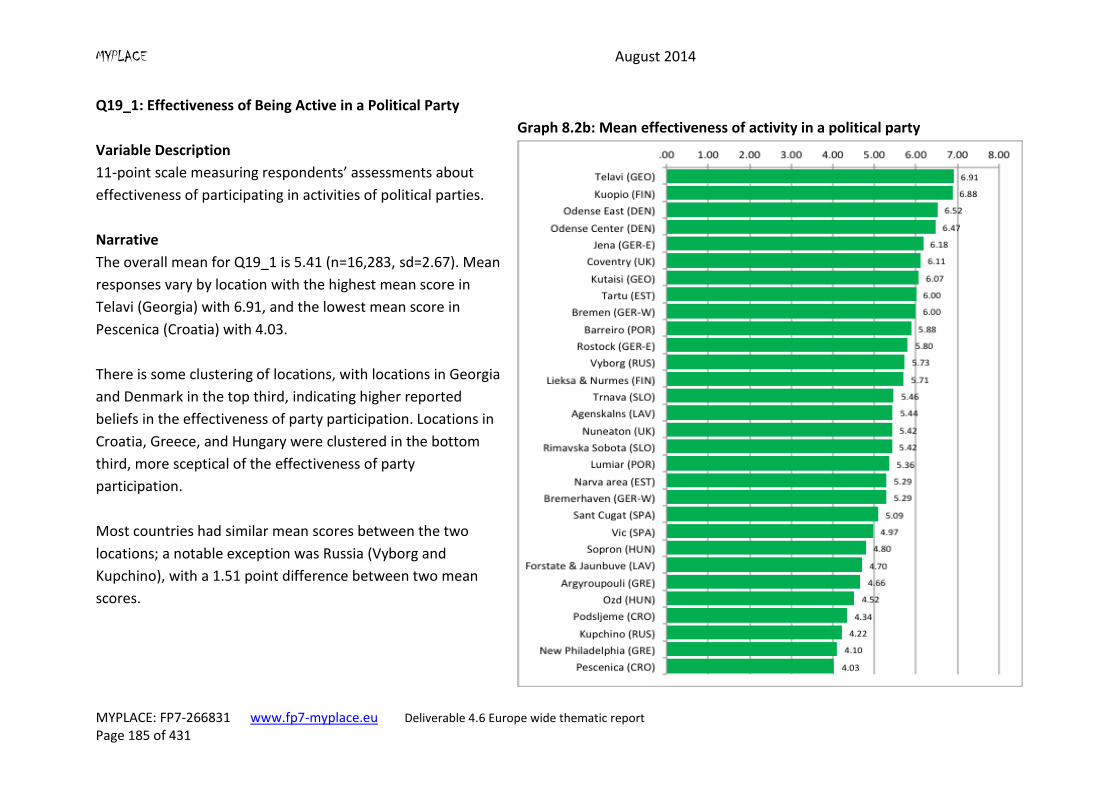
MYPLACE August 2014
MYPLACE: FP7-266831 www.fp7-myplace.eu Deliverable 4.6 Europe wide thematic report Page 185 of 431
Q19_1: Effectiveness of Being Active in a Political Party
Variable Description
11-point scale measuring respondents’ assessments about
effectiveness of participating in activities of political parties.
Graph 8.2b: Mean effectiveness of activity in a political party
Narrative
The overall mean for Q19_1 is 5.41 (n=16,283, sd=2.67). Mean
responses vary by location with the highest mean score in
Telavi (Georgia) with 6.91, and the lowest mean score in
Pescenica (Croatia) with 4.03.
There is some clustering of locations, with locations in Georgia
and Denmark in the top third, indicating higher reported
beliefs in the effectiveness of party participation. Locations in
Croatia, Greece, and Hungary were clustered in the bottom
third, more sceptical of the effectiveness of party
participation.
Most countries had similar mean scores between the two
locations; a notable exception was Russia (Vyborg and
Kupchino), with a 1.51 point difference between two mean
scores.
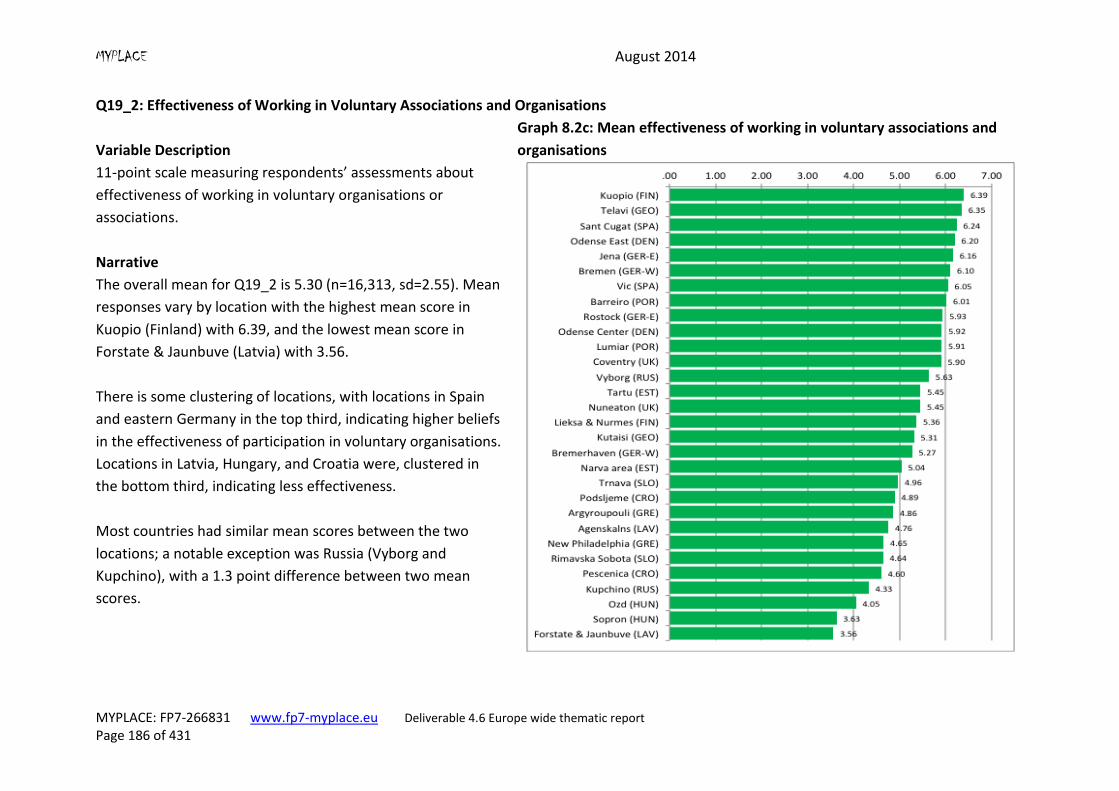
MYPLACE August 2014
MYPLACE: FP7-266831 www.fp7-myplace.eu Deliverable 4.6 Europe wide thematic report Page 186 of 431
Q19_2: Effectiveness of Working in Voluntary Associations and Organisations
Variable Description
11-point scale measuring respondents’ assessments about
effectiveness of working in voluntary organisations or
associations.
Graph 8.2c: Mean effectiveness of working in voluntary associations and
organisations
Narrative
The overall mean for Q19_2 is 5.30 (n=16,313, sd=2.55). Mean
responses vary by location with the highest mean score in
Kuopio (Finland) with 6.39, and the lowest mean score in
Forstate & Jaunbuve (Latvia) with 3.56.
There is some clustering of locations, with locations in Spain
and eastern Germany in the top third, indicating higher beliefs
in the effectiveness of participation in voluntary organisations.
Locations in Latvia, Hungary, and Croatia were, clustered in
the bottom third, indicating less effectiveness.
Most countries had similar mean scores between the two
locations; a notable exception was Russia (Vyborg and
Kupchino), with a 1.3 point difference between two mean
scores.
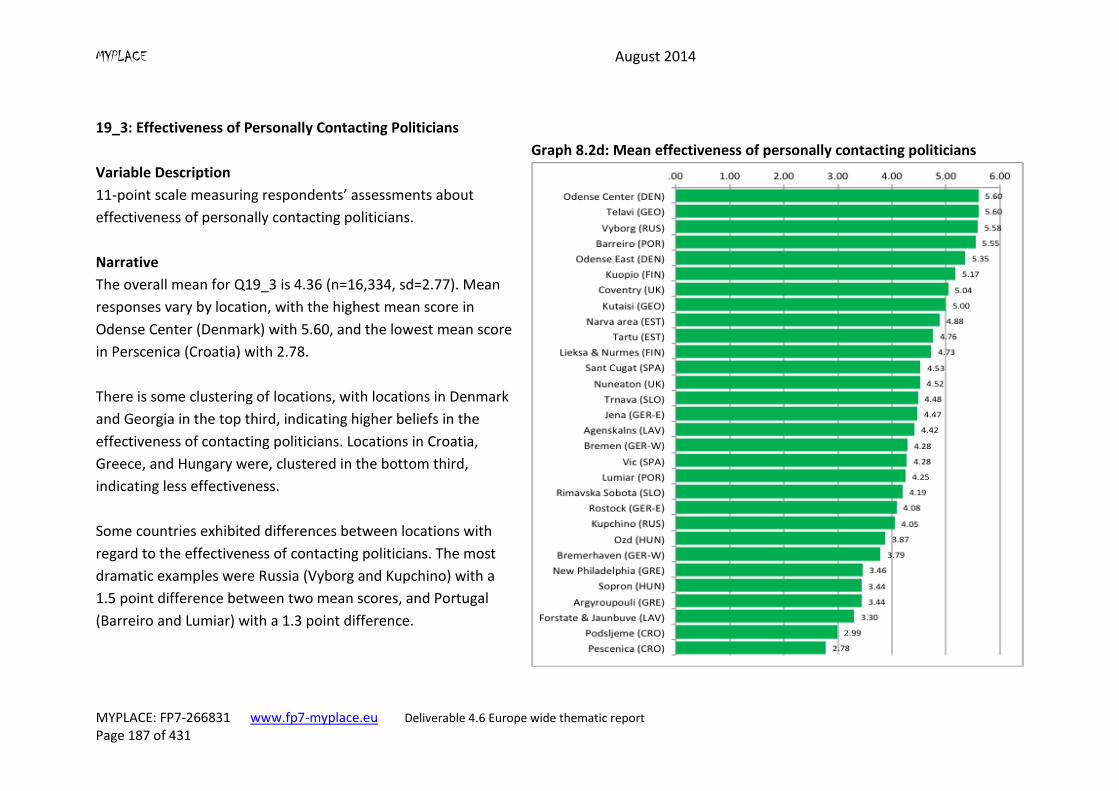
MYPLACE August 2014
MYPLACE: FP7-266831 www.fp7-myplace.eu Deliverable 4.6 Europe wide thematic report Page 187 of 431
19_3: Effectiveness of Personally Contacting Politicians
Variable Description
11-point scale measuring respondents’ assessments about
effectiveness of personally contacting politicians.
Graph 8.2d: Mean effectiveness of personally contacting politicians
Narrative
The overall mean for Q19_3 is 4.36 (n=16,334, sd=2.77). Mean
responses vary by location, with the highest mean score in
Odense Center (Denmark) with 5.60, and the lowest mean score
in Perscenica (Croatia) with 2.78.
There is some clustering of locations, with locations in Denmark
and Georgia in the top third, indicating higher beliefs in the
effectiveness of contacting politicians. Locations in Croatia,
Greece, and Hungary were, clustered in the bottom third,
indicating less effectiveness.
Some countries exhibited differences between locations with
regard to the effectiveness of contacting politicians. The most
dramatic examples were Russia (Vyborg and Kupchino) with a
1.5 point difference between two mean scores, and Portugal
(Barreiro and Lumiar) with a 1.3 point difference.
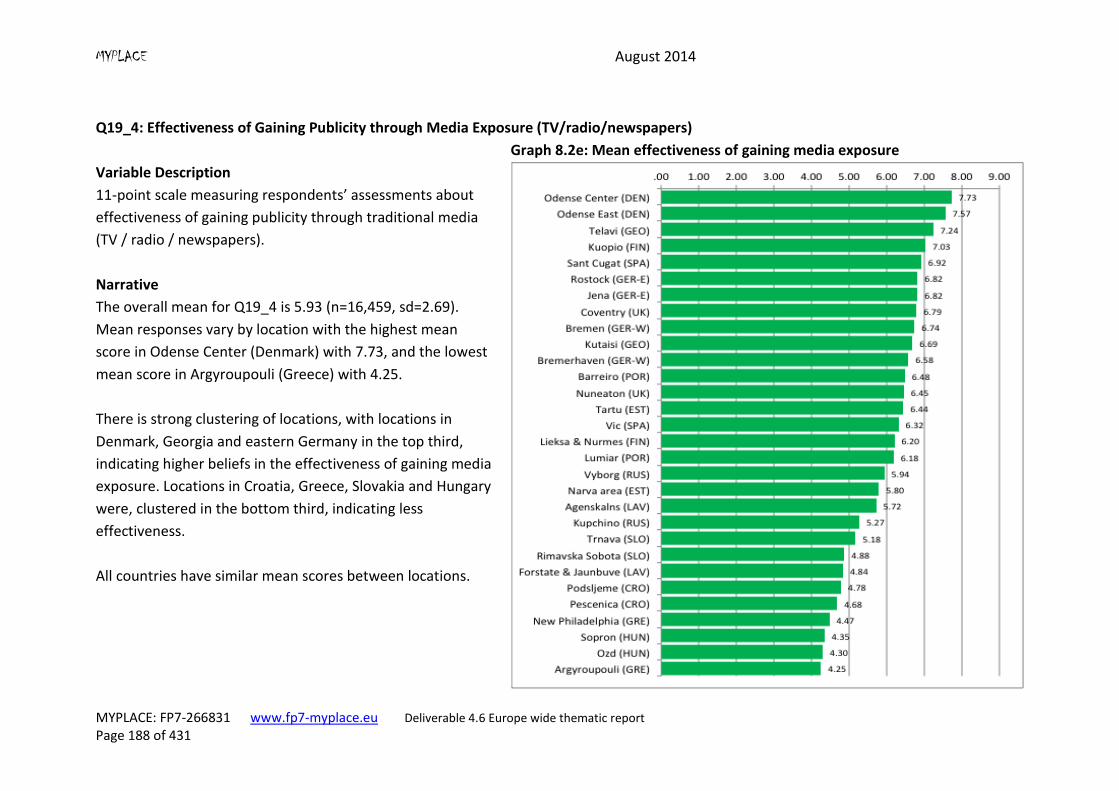
MYPLACE August 2014
MYPLACE: FP7-266831 www.fp7-myplace.eu Deliverable 4.6 Europe wide thematic report Page 188 of 431
Q19_4: Effectiveness of Gaining Publicity through Media Exposure (TV/radio/newspapers)
Variable Description
11-point scale measuring respondents’ assessments about
effectiveness of gaining publicity through traditional media
(TV / radio / newspapers).
Graph 8.2e: Mean effectiveness of gaining media exposure
Narrative
The overall mean for Q19_4 is 5.93 (n=16,459, sd=2.69).
Mean responses vary by location with the highest mean
score in Odense Center (Denmark) with 7.73, and the lowest
mean score in Argyroupouli (Greece) with 4.25.
There is strong clustering of locations, with locations in
Denmark, Georgia and eastern Germany in the top third,
indicating higher beliefs in the effectiveness of gaining media
exposure. Locations in Croatia, Greece, Slovakia and Hungary
were, clustered in the bottom third, indicating less
effectiveness.
All countries have similar mean scores between locations.
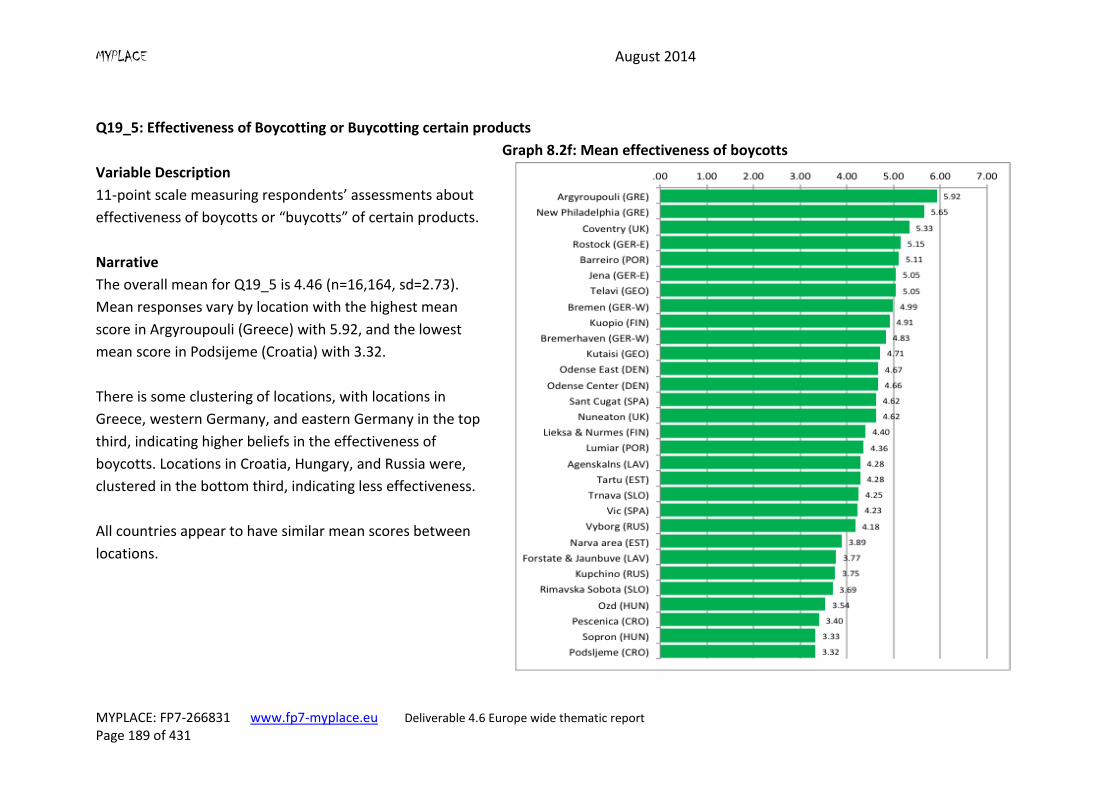
MYPLACE August 2014
MYPLACE: FP7-266831 www.fp7-myplace.eu Deliverable 4.6 Europe wide thematic report Page 189 of 431
Q19_5: Effectiveness of Boycotting or Buycotting certain products
Variable Description
11-point scale measuring respondents’ assessments about
effectiveness of boycotts or “buycotts” of certain products.
Graph 8.2f: Mean effectiveness of boycotts
Narrative
The overall mean for Q19_5 is 4.46 (n=16,164, sd=2.73).
Mean responses vary by location with the highest mean
score in Argyroupouli (Greece) with 5.92, and the lowest
mean score in Podsijeme (Croatia) with 3.32.
There is some clustering of locations, with locations in
Greece, western Germany, and eastern Germany in the top
third, indicating higher beliefs in the effectiveness of
boycotts. Locations in Croatia, Hungary, and Russia were,
clustered in the bottom third, indicating less effectiveness.
All countries appear to have similar mean scores between
locations.
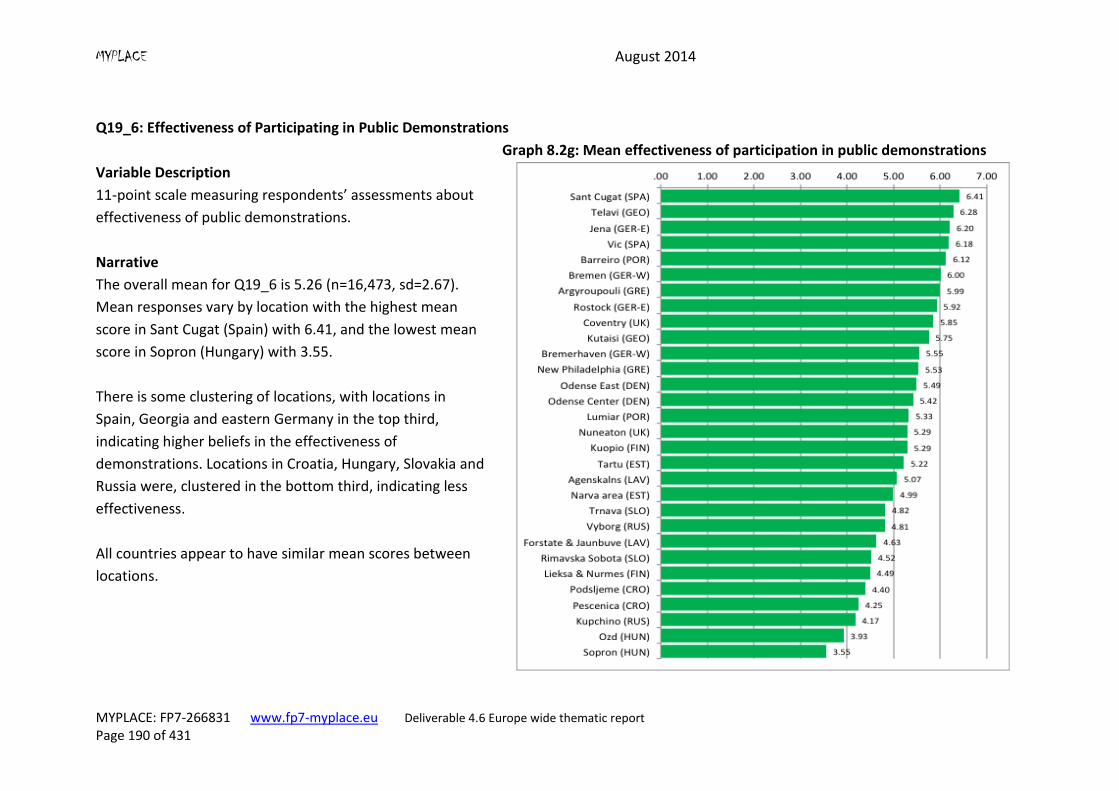
MYPLACE August 2014
MYPLACE: FP7-266831 www.fp7-myplace.eu Deliverable 4.6 Europe wide thematic report Page 190 of 431
Q19_6: Effectiveness of Participating in Public Demonstrations
Variable Description
11-point scale measuring respondents’ assessments about
effectiveness of public demonstrations.
Graph 8.2g: Mean effectiveness of participation in public demonstrations
Narrative
The overall mean for Q19_6 is 5.26 (n=16,473, sd=2.67).
Mean responses vary by location with the highest mean
score in Sant Cugat (Spain) with 6.41, and the lowest mean
score in Sopron (Hungary) with 3.55.
There is some clustering of locations, with locations in
Spain, Georgia and eastern Germany in the top third,
indicating higher beliefs in the effectiveness of
demonstrations. Locations in Croatia, Hungary, Slovakia and
Russia were, clustered in the bottom third, indicating less
effectiveness.
All countries appear to have similar mean scores between
locations.
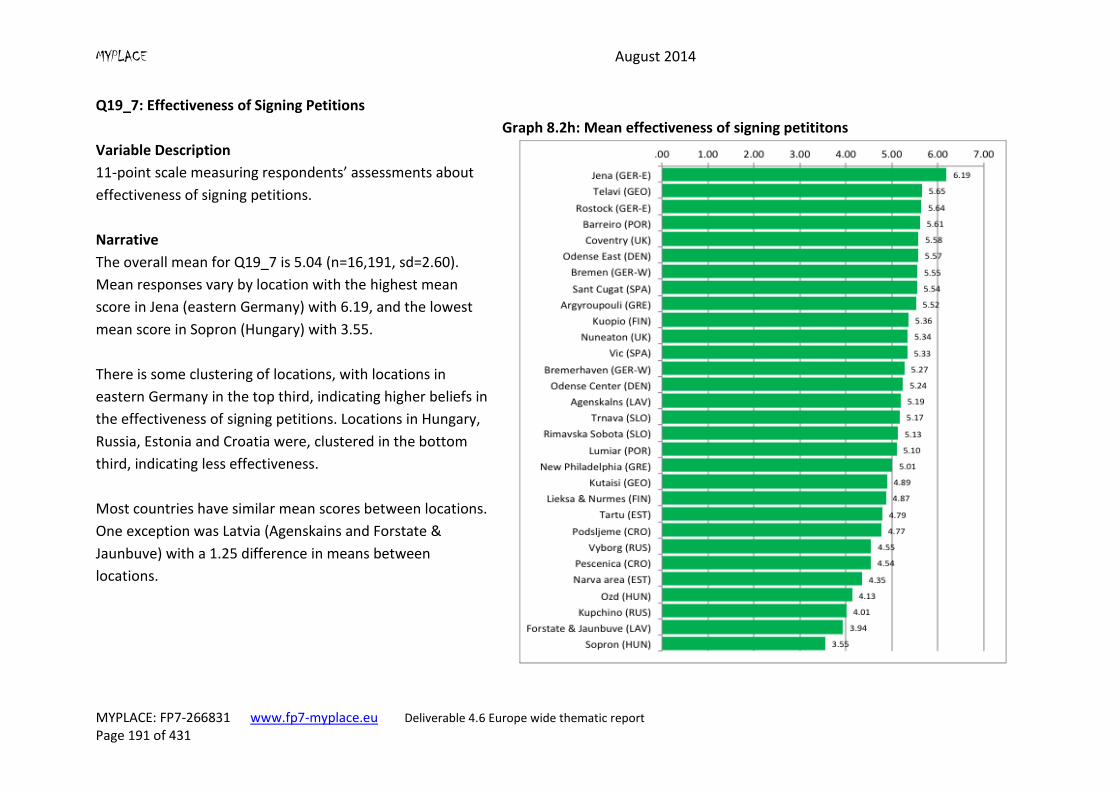
MYPLACE August 2014
MYPLACE: FP7-266831 www.fp7-myplace.eu Deliverable 4.6 Europe wide thematic report Page 191 of 431
Q19_7: Effectiveness of Signing Petitions
Variable Description
11-point scale measuring respondents’ assessments about
effectiveness of signing petitions.
Graph 8.2h: Mean effectiveness of signing petititons
Narrative
The overall mean for Q19_7 is 5.04 (n=16,191, sd=2.60).
Mean responses vary by location with the highest mean
score in Jena (eastern Germany) with 6.19, and the lowest
mean score in Sopron (Hungary) with 3.55.
There is some clustering of locations, with locations in
eastern Germany in the top third, indicating higher beliefs in
the effectiveness of signing petitions. Locations in Hungary,
Russia, Estonia and Croatia were, clustered in the bottom
third, indicating less effectiveness.
Most countries have similar mean scores between locations.
One exception was Latvia (Agenskains and Forstate &
Jaunbuve) with a 1.25 difference in means between
locations.
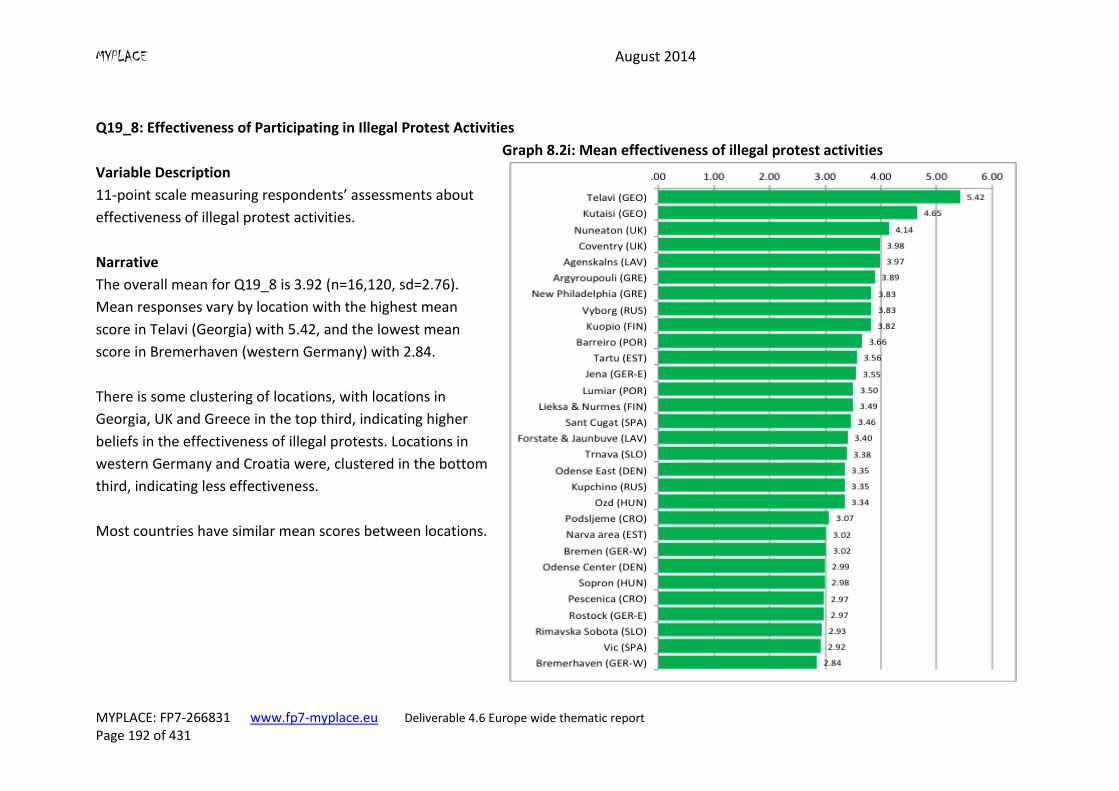
MYPLACE August 2014
MYPLACE: FP7-266831 www.fp7-myplace.eu Deliverable 4.6 Europe wide thematic report Page 192 of 431
Q19_8: Effectiveness of Participating in Illegal Protest Activities
Variable Description
11-point scale measuring respondents’ assessments about
effectiveness of illegal protest activities.
Graph 8.2i: Mean effectiveness of illegal protest activities
Narrative
The overall mean for Q19_8 is 3.92 (n=16,120, sd=2.76).
Mean responses vary by location with the highest mean
score in Telavi (Georgia) with 5.42, and the lowest mean
score in Bremerhaven (western Germany) with 2.84.
There is some clustering of locations, with locations in
Georgia, UK and Greece in the top third, indicating higher
beliefs in the effectiveness of illegal protests. Locations in
western Germany and Croatia were, clustered in the bottom
third, indicating less effectiveness.
Most countries have similar mean scores between locations.
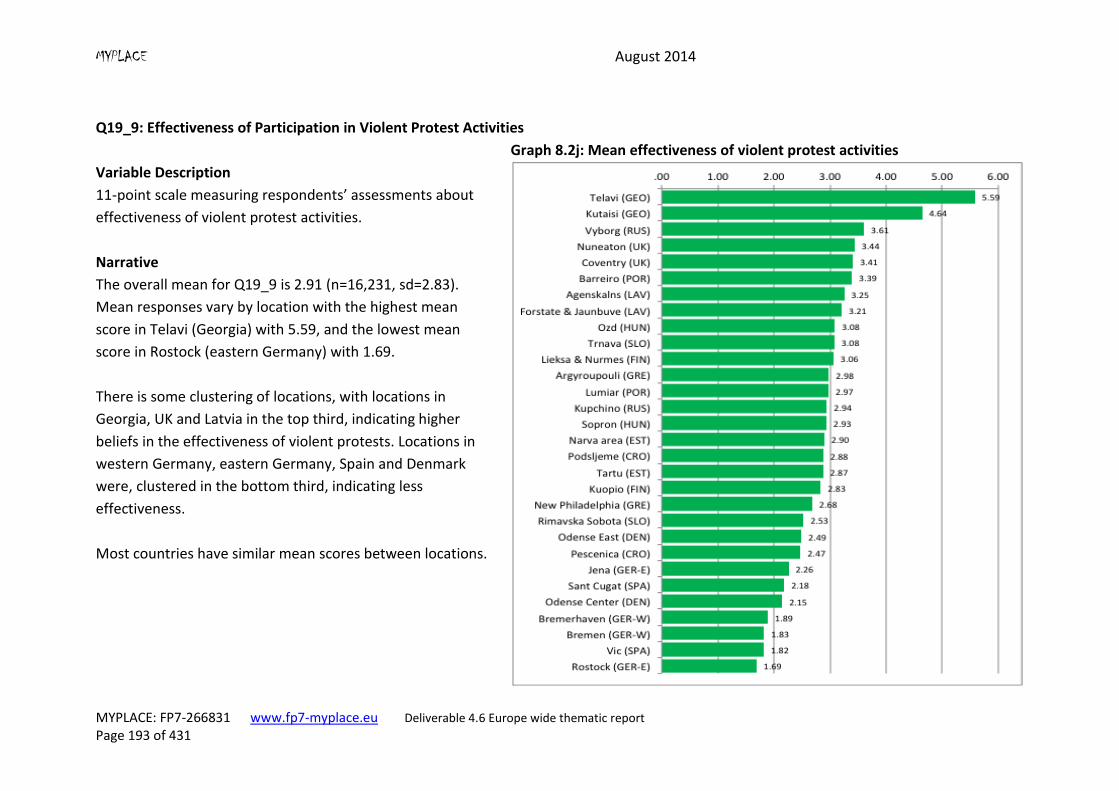
MYPLACE August 2014
MYPLACE: FP7-266831 www.fp7-myplace.eu Deliverable 4.6 Europe wide thematic report Page 193 of 431
Q19_9: Effectiveness of Participation in Violent Protest Activities
Variable Description
11-point scale measuring respondents’ assessments about
effectiveness of violent protest activities.
Graph 8.2j: Mean effectiveness of violent protest activities
Narrative
The overall mean for Q19_9 is 2.91 (n=16,231, sd=2.83).
Mean responses vary by location with the highest mean
score in Telavi (Georgia) with 5.59, and the lowest mean
score in Rostock (eastern Germany) with 1.69.
There is some clustering of locations, with locations in
Georgia, UK and Latvia in the top third, indicating higher
beliefs in the effectiveness of violent protests. Locations in
western Germany, eastern Germany, Spain and Denmark
were, clustered in the bottom third, indicating less
effectiveness.
Most countries have similar mean scores between locations.
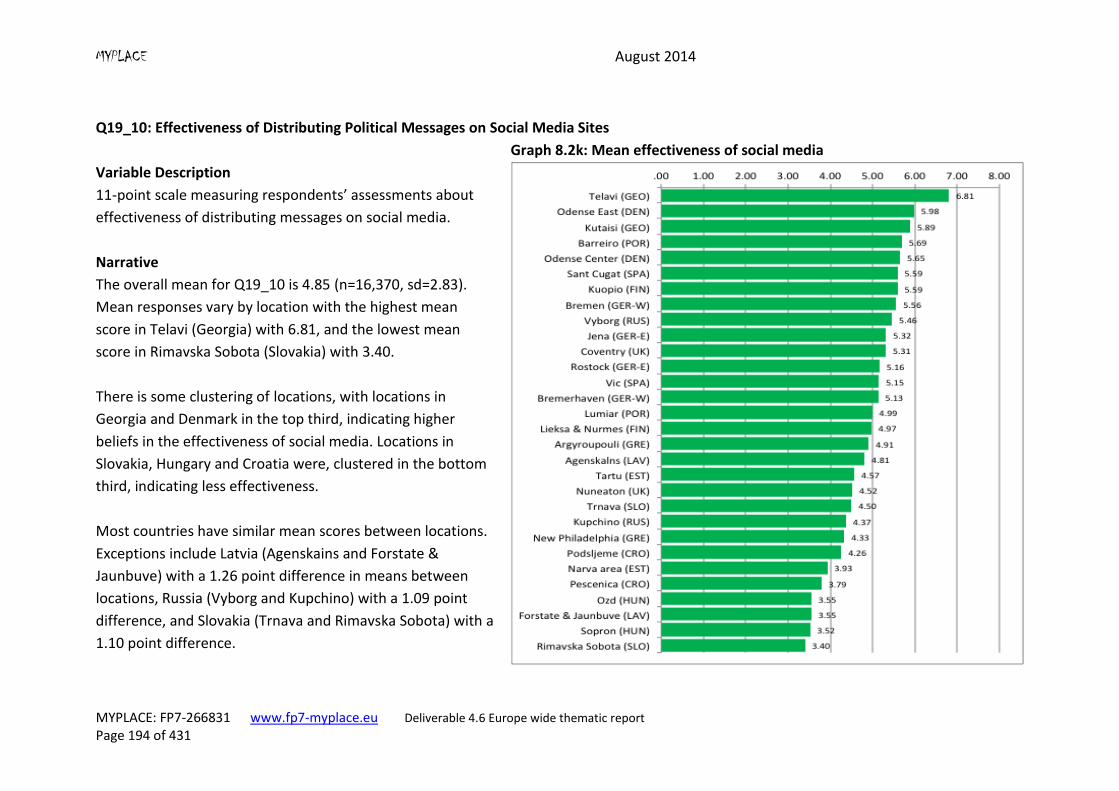
MYPLACE August 2014
MYPLACE: FP7-266831 www.fp7-myplace.eu Deliverable 4.6 Europe wide thematic report Page 194 of 431
Q19_10: Effectiveness of Distributing Political Messages on Social Media Sites
Variable Description
11-point scale measuring respondents’ assessments about
effectiveness of distributing messages on social media.
Graph 8.2k: Mean effectiveness of social media
Narrative
The overall mean for Q19_10 is 4.85 (n=16,370, sd=2.83).
Mean responses vary by location with the highest mean
score in Telavi (Georgia) with 6.81, and the lowest mean
score in Rimavska Sobota (Slovakia) with 3.40.
There is some clustering of locations, with locations in
Georgia and Denmark in the top third, indicating higher
beliefs in the effectiveness of social media. Locations in
Slovakia, Hungary and Croatia were, clustered in the bottom
third, indicating less effectiveness.
Most countries have similar mean scores between locations.
Exceptions include Latvia (Agenskains and Forstate &
Jaunbuve) with a 1.26 point difference in means between
locations, Russia (Vyborg and Kupchino) with a 1.09 point
difference, and Slovakia (Trnava and Rimavska Sobota) with a
1.10 point difference.
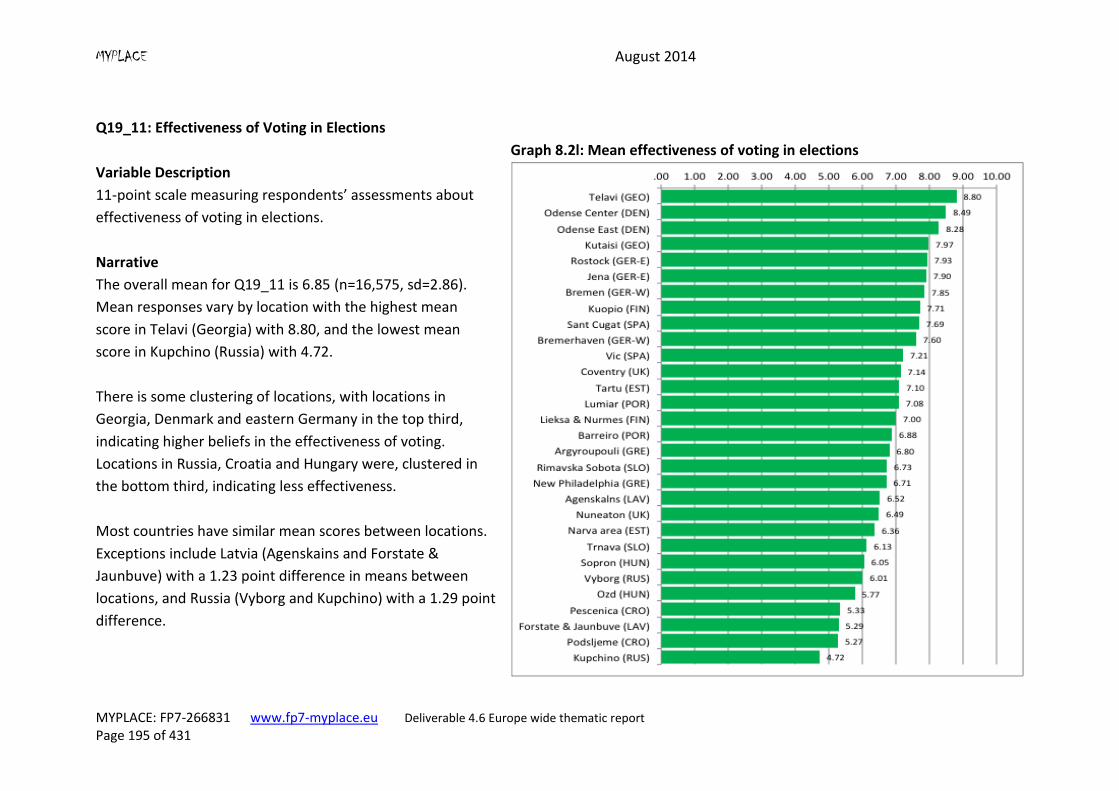
MYPLACE August 2014
MYPLACE: FP7-266831 www.fp7-myplace.eu Deliverable 4.6 Europe wide thematic report Page 195 of 431
Q19_11: Effectiveness of Voting in Elections
Variable Description
11-point scale measuring respondents’ assessments about
effectiveness of voting in elections.
Graph 8.2l: Mean effectiveness of voting in elections
Narrative
The overall mean for Q19_11 is 6.85 (n=16,575, sd=2.86).
Mean responses vary by location with the highest mean
score in Telavi (Georgia) with 8.80, and the lowest mean
score in Kupchino (Russia) with 4.72.
There is some clustering of locations, with locations in
Georgia, Denmark and eastern Germany in the top third,
indicating higher beliefs in the effectiveness of voting.
Locations in Russia, Croatia and Hungary were, clustered in
the bottom third, indicating less effectiveness.
Most countries have similar mean scores between locations.
Exceptions include Latvia (Agenskains and Forstate &
Jaunbuve) with a 1.23 point difference in means between
locations, and Russia (Vyborg and Kupchino) with a 1.29 point
difference.
MYPLACE August 2014
MYPLACE: FP7-266831www.fp7-myplace.eu Deliverable 4.6 Europe wide thematic report Page 196 of 431
8.3 Multi-Level Modelling
In this section, we analyse the determinants of young people’s beliefs in the effectiveness of
legal or nonviolent political activity. To account for the nested structure of MYPLACE survey
data, i.e. individuals nested in locations, which are nested within countries, the analysis
employs a multilevel regression model that tests the effects of both individual-level and
group-level variables.
The analysis proceeds in three stages. First, we provide a conceptual overview of the
dependent variable, and several independent variables advanced by the relevant literature
that may be, expected to affect young people’s attitudes toward the effectiveness of legal
or nonviolent political activity. Second, we confirm that adding contextual level variables in
a multilevel analysis is appropriate through the analysis of variance components of models
with individual and group-level indicators added successively. Third, we present the
substantive results of a linear multilevel regression model. Initial findings suggest that
several demographic variables have a statistically significant effect on attitudes toward the
effectiveness of legal or nonviolent political activity, although that effect is substantively
small to moderate. Among individual level variables, internet usage and political knowledge
exhibited the largest substantive effects. The only group-level variable with a statistically
and substantively significant effect on youth attitudes toward the effectiveness of legal or
nonviolent politically activity was welfare regime type, with post-communist welfare
regimes associated with substantively lower beliefs in the effectiveness of this activity
relative to the reference category of liberal welfare regimes.
Dependent Variable:
The dependent variable is a composite scale of respondents’ ratings of the effectiveness of a
series of nine specific types of legal and non-violent political activity. As discussed in the
descriptive analysis section above, the MYPLACE survey asked young respondents, “How
effectively, do you think, the following actions can influence politics in your country?” with
reference to 11 specific actions. Effectiveness of each action was, rated by, the respondents
on an 11-point scale, with code 0 meaning “not effective at all” and code 10 meaning “very
effective.” A factor analysis of the 11-item series suggested two latent variables, one of
which might be, called “legal or nonviolent activity.” This variable captures nine of the
original items, including activity in political parties, voluntary organisations, contacting
politicians, gaining media exposure, boycotts, public demonstrations, petitions, distributing
messages by social media, and voting (illegal protest activity and violent protest activity
tracked onto a separate latent variable, according to the factor analysis). Therefore, the
composite variable “legal or nonviolent political activity” is a scale aggregating responses on
the nine constituent items. The scale ranges from 0 to 90, with higher scores indicating
MYPLACE August 2014
MYPLACE: FP7-266831www.fp7-myplace.eu Deliverable 4.6 Europe wide thematic report Page 197 of 431
stronger beliefs in the effectiveness of legal or nonviolent activity.12 This scale is,
approximately normally distributed, although somewhat zero-inflated. The mean for the
entire survey sample is 47.78 with a standard deviation of 17.21 (N=14,269).13
Due to the approximately normal distribution of the legal or nonviolent political activity
scale, we have opted to employ a linear mixed model for analysis. Although conscious of the
potential for violations of regression assumptions with a zero-inflated distribution, at this
point, a linear model seems to be the best fit for the data. While negative binomial or
Poisson models are usually employed to account for zero-inflation, these distributions are
usually generated by “counts” or discrete incidents within a geographical area or time
period, which, does not match the data-generating process behind ratings of the
effectiveness of political activity. While composite variables can often approximate a
“count” distribution, making negative binomial or Poisson models appropriate, the
distribution on our dependent variable most closely approximates a classic normal
distribution. Furthermore, the zero-inflation in the distribution is small to moderate, with
only 1.3% of the sample (189 individuals) recording a score of zero on the scale. Finally,
linear regression allows for more straightforward interpretation of estimates, which is
perhaps more useful for an initial analysis. Publications intended for peer-review, however,
should explore additional tests for model fit, including standard tests for violations of linear
regression assumptions.14
Independent variables:
As noted in the brief literature review above, several individual-level variables might be,
expected to affect young people’s attitudes toward the effectiveness of legal or nonviolent
political activity. According to the logic of the modernisation theory, for example, structural
economic changes drive changes in distribution of income, access to information and
education that lead to increased political activity. Exposure to a greater variety of people
from different social, economic, or ethnic groups, combined with greater access to
information and increased economic resources may lead to increased consciousness of
12
Note that the scale used for the multilevel model is different from the conceptually identical scale analysed in the descriptive section. In order to facilitate potential analysis with a variety of models, including negative binomial and log-linear models, the scale of average responses ranging from 0-10 in the first section was converted to an integer scale ranging from 0-90 in this section. 13
Includes only individuals included in the multilevel model. Individuals were filtered prior to analysis to drop any cases with missing values on any variable. Filtering at the beginning of the analysis ensures that models used for comparison are run on an identical set of observations. 14
We did conduct analysis using alternative distributions for all models described below, including negative binomial and log-linear models for all steps. A particular problem for this analysis was that these models indicated that practically no variance (0.000) in the dependent variable was explained by group-level variables. While possible, we thought this unlikely given the nested data structure, the selection process for locations, and obvious differences in location and country-level means. However, having most or all variance explained at the individual level is certainly possible. We also conducted a linear mixed model dropping all respondents that registered “0” on the legal or nonviolent political action scale. However, this analysis suggested no major differences in the significance, direction, or magnitude of effects.
MYPLACE August 2014
MYPLACE: FP7-266831www.fp7-myplace.eu Deliverable 4.6 Europe wide thematic report Page 198 of 431
political interests, making political participation more likely (Lipset, 1959; Almond and
Verba, 1963; Epstein et al, 2006; Boix and Stokes, 2003; Huntington, 1968; O’Donnell, 1973;
Przeworski et al., 2000). Applied to our dependent variable, these changes may lead young
people to rate legal or nonviolent political activity as more effective, at least according to
those promoting the modernisation theory (Lipset, 1959; Almond and Verba, 1963; Boix and
Stokes, 2003). On the other hand, if these changes outstrip the capacity of political
institutions to channel new political demands (see, for example, Huntington, 1968;
O’Donnell, 1973), they may lead young people to rate legal or nonviolent political activity as
less effective. To test these hypotheses among the population in the MYPLACE survey, we
include individual-level variables for average daily use of the internet use for information on
politics or current events (Q3_2), parental social class (since most respondents have not
entered the work force yet, or had the opportunity to transition between social classes, we
use parental social class as a proxy for the respondents’ social class), and political
knowledge (Q28s15).
Political culture approaches to democratisation suggest another set of independent
variables that might affect political activity. For political culture explanations, economic
structural changes drive changes in attitudes that are more conducive to democracy. For
instance, several cultural explanations have suggested that the degree to which individuals
trust people outside of their kin, ethnic, or economic group facilitates effective democratic
governance (see, for example, Almond and Verba, 1963 and Putnam et al., 1993). Putnam et
al. (1993) is perhaps most specific about the mechanisms linking trust and governance by
arguing that interpersonal trust makes citizens more likely to participate constructively in
collective action. We might therefore expect that higher levels of interpersonal trust are
associated with higher beliefs in the effectiveness of legal or nonviolent political action. To
test this hypothesis among MYPLACE respondents, we employ the item for interpersonal
trust (Q29) as an individual-level independent variable.
A third group of literature more specific to the issue of beliefs about the effectiveness of
political action argues that cynicism with political participation results from
disenfranchisement associated with economic or political globalisation, or from
disillusionment with governance. Horvath and Polini (2014), for example, find that
supranational political institutions, economic globalisation and economic instability have
caused young people to lose faith in institutionalised participation like political parties.
Several other studies have emphasised that disillusionment with democratic governance
have led to shifts in how young people evaluate the effectiveness of political activity
(Forbrig, 2005; Taft and Gordon, 2013; Duin, 1997). Finally, economic dislocation and
instability, in particular extended adolescence due to an absence of economic opportunities,
15
Although country-specific variance was allowed in questions measuring respondents’ knowledge about current politics in their country (Q28_1, Q28_2 and Q28_3), these questions provide reliable and comparable measure of how well the respondents are informed about national politics.
MYPLACE August 2014
MYPLACE: FP7-266831www.fp7-myplace.eu Deliverable 4.6 Europe wide thematic report Page 199 of 431
drive young people’s cynicism about political participation. According to this same logic, we
might expect members of historically marginalised groups, including women and ethnic and
racial minorities, to have more pessimistic views about the effectiveness of legal or
nonviolent political activity. We test these hypotheses among the MYPLACE respondents
using individual-level variables, including respondents’ employment status (Q61R2),16
gender (Q54), minority/majority status (variable “identity”); and group-level variables,
including the Index of Globalisation (GI) and the Voice and Accountability indicator from the
World Bank Worldwide Governance Indicators. We also include the harmonised welfare
regime type variable (Kaariainan and Lehtonen, 2006), under the logic that a highly
developed welfare regime has the potential to mitigate many of the problems associated
with political and economic dislocation. Finally, age and religiousness are included as
individual-level control variables.
Results
Variance Component Analysis
A first step in developing a multilevel model is to analyse the variance components of a
series of increasingly complex models to determine whether adding indicators at different
levels of aggregation reduces unexplained variance. First, we derive the variance
components for an empty- or null-model for individuals clustered within survey locations,
with a random intercept and no individual- or group-level variables. The variance
components of the null model suggest an intra-class correlation (ICC), or the correlation
between two randomly selected respondents from the same survey location, of 0.132.17 The
ICC for the null model suggests that 13.2% of variance in ratings of effectiveness of legal or
nonviolent political activity is explained by differences at the group level (conversely, 86.8%
of variance is explained by differences between individuals), suggesting that a multilevel
analysis is appropriate.
Next, we develop a fixed effects model using only individual-level variables to determine
whether these indicators reduce unexplained variance at either individual- or group-level.
The ICC of this model was 0.119, indicating that the inclusion of individual-level variables led
to 11.9% of variance explained by differences between locations. Indeed, inclusion of the
individual-level variables led to a 4% reduction in residual individual-level variation, and a
14.5% reduction in variance at the level of locations.
Finally, we develop a fixed effects model that includes the group-level variables in addition
to the individual-level indicators. The ICC for the third model was 0.063, suggesting that
16
Variable Q61R was recoded to change the reference level to “unemployed.” 17
The ICC is derived by calculating the proportion of location-level variance to the total variance (location-level plus individual-level variance).
MYPLACE August 2014
MYPLACE: FP7-266831www.fp7-myplace.eu Deliverable 4.6 Europe wide thematic report Page 200 of 431
6.3% of remaining variation is explained by differences between locations. Inclusion of the
group-level variables led to practically no reduction (0.00004) in individual-level variance,
but a 50% reduction in group-level variance.
The results of the variance component analysis suggest that only a small to moderate
amount of variance in attitudes toward the effectiveness of legal or nonviolent political
action is explained by differences in locations. While including group-level variables reduce
the intercept variance, they reduce little unexplained variance at the individual level.
Furthermore, the estimates in the individual-level variables only model (not reported) are
very similar in significance, direction, and magnitude to the multilevel model that includes
contextual variables. Also, the variance component analysis using negative binomial and
loglinear models produced ICCs of virtually zero, which would also seem to indicate that
little individual-level variance can be explained by differences in locations.
Table 8.3.1 Variance Components of Regression Models for Perceptions of Effectiveness of
Legal or Nonviolent Political Action
Null Model (Random
Intercept Only)
Fixed Effects Model
with Individual-Level
Variables Only
Fixed Effects Model
with Individual- and
Group-Level Variables
σ (individual level) 259.368877 248.391427 248.391344
Scale: Perception of
Effectiveness of Legal
or Nonviolent Political
Action
σ (group level) 39.499110 33.783464 16.823747
-loglikelihood 119929.613 119312.330 119291.883
ICC 0.132 0.119 0.063
Substantive Results
Turning to the substantive results of the multilevel model, we find tentative support for
some of our hypotheses. In particular, at the individual level, both usage of internet to get
information about politics and current affairs and political knowledge exhibited statistically
significant and substantively large effects on respondents’ perceptions of the effectiveness
of legal or nonviolent political activity. Specifically, the mean effectiveness rating by the
respondents who spent “no time at all” using the internet for information on politics or
current affairs was 5.12 points lower than that by the reference group—respondents who
spent more than an hour during an average day using the internet for news or political
information, holding other variables constant. Similarly, the mean effectiveness rating
among respondents in the two lowest political knowledge category was approximately 5
MYPLACE August 2014
MYPLACE: FP7-266831www.fp7-myplace.eu Deliverable 4.6 Europe wide thematic report Page 201 of 431
points lower than the mean rating for the highest political knowledge category.
Respondents that answered all three political knowledge questions correctly indicated a
mean effectiveness of legal and nonviolent political activity that was about five points
higher than those that answered one or no question correctly, holding other variables
constant. These results lend some support to the traditional modernisation hypothesis—
that the development of technology makes information more accessible, in turn leading to
more constructive political engagement.
Several other individual-level variables exhibited a highly statistically significant effect on
perceptions of the effectiveness of legal or nonviolent political activity, but those effects
were substantively small. Males tended to have lower perceptions than females of the
effectiveness of this type of political activity, averaging 2.33 points lower on the 90 point
scale, holding other variables constant. Similarly, non-religious people rated legal or
nonviolent activity less effective on average than did religious people, though the effect was
similarly small. Likewise, members of the lowest socioeconomic class rated legal or
nonviolent activity less effective on average than did respondents of the highest social class,
while respondents that were employed or in education exhibited slightly more optimism
about the effectiveness of this type of activity relative to the reference group of
unemployed respondents. Both interpersonal trust and age exhibited a statistically
significant and negative effect on perceptions of effectiveness of legal/nonviolent political
activity, though these effects were substantively very small: -0.3 and -0.13 on a 90-point
scale, respectively. The remaining individual-level variable, “identity”, was not statistically
significant.
Taken as a whole, these results provide little support for strictly economic or dislocation
hypotheses. Members of high socioeconomic class and respondents that were employed or
in education, as expected, were more likely to view legal or nonviolent political activity as
effective, but only marginally so. There is no evidence in these results that historically
marginalised groups are less optimistic about the effectiveness of this type of activity than
majority-group respondents. Finally, contrary to the expectations of political culture
approaches to civic activism, there is no evidence that higher ratings of interpersonal trust
are associated with perceptions of greater effectiveness of constructive political activity.
Among the group-level variables, only the “post-socialist” welfare regime group and the
Index of Globalisation were statistically significant. The effect of economic, cultural, and
political globalisation on perceptions of effectiveness of legal or nonviolent activity was
negative, but substantively small, -0.38 on a 90-point scale. The indicator for Voice and
Accountability, on the other hand, did not exhibit a statistically significant effect of
perceptions of effectiveness. These results, therefore, provide little support for the
hypotheses that supranational political, cultural, and economic changes cause dislocation
that makes young people more cynical about constructive political participation. Similarly,
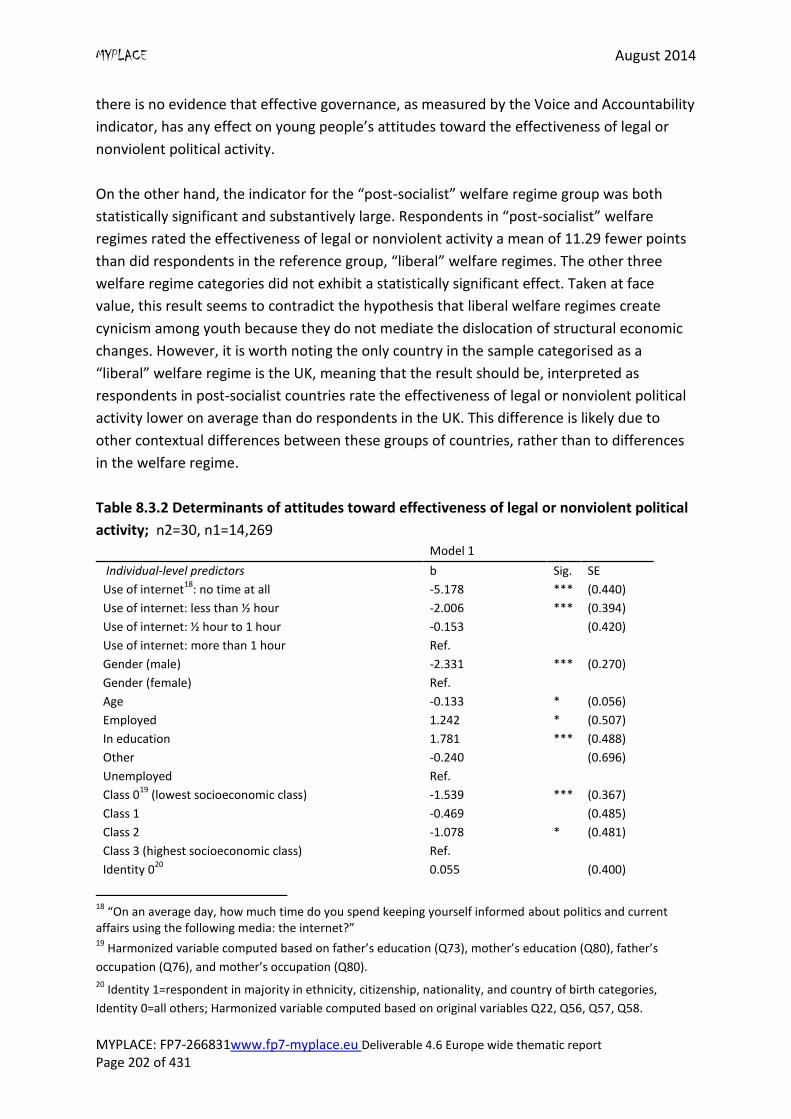
MYPLACE August 2014
MYPLACE: FP7-266831www.fp7-myplace.eu Deliverable 4.6 Europe wide thematic report Page 202 of 431
there is no evidence that effective governance, as measured by the Voice and Accountability
indicator, has any effect on young people’s attitudes toward the effectiveness of legal or
nonviolent political activity.
On the other hand, the indicator for the “post-socialist” welfare regime group was both
statistically significant and substantively large. Respondents in “post-socialist” welfare
regimes rated the effectiveness of legal or nonviolent activity a mean of 11.29 fewer points
than did respondents in the reference group, “liberal” welfare regimes. The other three
welfare regime categories did not exhibit a statistically significant effect. Taken at face
value, this result seems to contradict the hypothesis that liberal welfare regimes create
cynicism among youth because they do not mediate the dislocation of structural economic
changes. However, it is worth noting the only country in the sample categorised as a
“liberal” welfare regime is the UK, meaning that the result should be, interpreted as
respondents in post-socialist countries rate the effectiveness of legal or nonviolent political
activity lower on average than do respondents in the UK. This difference is likely due to
other contextual differences between these groups of countries, rather than to differences
in the welfare regime.
Table 8.3.2 Determinants of attitudes toward effectiveness of legal or nonviolent political
activity; n2=30, n1=14,269 Model 1
Individual-level predictors b Sig. SE
Use of internet18
: no time at all -5.178 *** (0.440)
Use of internet: less than ½ hour -2.006 *** (0.394)
Use of internet: ½ hour to 1 hour -0.153 (0.420)
Use of internet: more than 1 hour Ref.
Gender (male) -2.331 *** (0.270)
Gender (female) Ref.
Age -0.133 * (0.056)
Employed 1.242 * (0.507)
In education 1.781 *** (0.488)
Other -0.240 (0.696)
Unemployed Ref.
Class 019
(lowest socioeconomic class) -1.539 *** (0.367)
Class 1 -0.469 (0.485)
Class 2 -1.078 * (0.481)
Class 3 (highest socioeconomic class) Ref.
Identity 020
0.055 (0.400)
18
“On an average day, how much time do you spend keeping yourself informed about politics and current affairs using the following media: the internet?” 19
Harmonized variable computed based on father’s education (Q73), mother’s education (Q80), father’s
occupation (Q76), and mother’s occupation (Q80). 20
Identity 1=respondent in majority in ethnicity, citizenship, nationality, and country of birth categories,
Identity 0=all others; Harmonized variable computed based on original variables Q22, Q56, Q57, Q58.
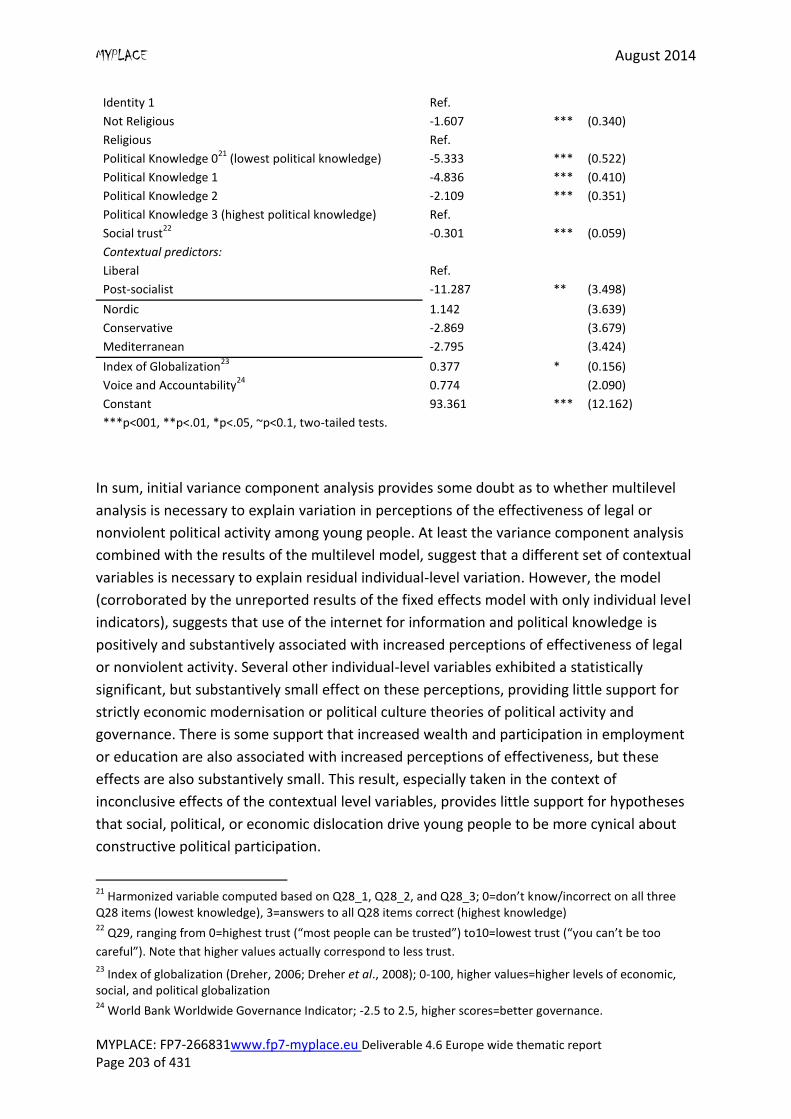
MYPLACE August 2014
MYPLACE: FP7-266831www.fp7-myplace.eu Deliverable 4.6 Europe wide thematic report Page 203 of 431
Identity 1 Ref.
Not Religious -1.607 *** (0.340)
Religious Ref.
Political Knowledge 021
(lowest political knowledge) -5.333 *** (0.522)
Political Knowledge 1 -4.836 *** (0.410)
Political Knowledge 2 -2.109 *** (0.351)
Political Knowledge 3 (highest political knowledge) Ref.
Social trust22
-0.301 *** (0.059)
Contextual predictors:
Liberal Ref.
Post-socialist -11.287 ** (3.498)
Nordic 1.142 (3.639)
Conservative -2.869 (3.679)
Mediterranean -2.795 (3.424)
Index of Globalization23
0.377 * (0.156)
Voice and Accountability24
0.774 (2.090)
Constant 93.361 *** (12.162)
***p<001, **p<.01, *p<.05, ~p<0.1, two-tailed tests.
In sum, initial variance component analysis provides some doubt as to whether multilevel
analysis is necessary to explain variation in perceptions of the effectiveness of legal or
nonviolent political activity among young people. At least the variance component analysis
combined with the results of the multilevel model, suggest that a different set of contextual
variables is necessary to explain residual individual-level variation. However, the model
(corroborated by the unreported results of the fixed effects model with only individual level
indicators), suggests that use of the internet for information and political knowledge is
positively and substantively associated with increased perceptions of effectiveness of legal
or nonviolent activity. Several other individual-level variables exhibited a statistically
significant, but substantively small effect on these perceptions, providing little support for
strictly economic modernisation or political culture theories of political activity and
governance. There is some support that increased wealth and participation in employment
or education are also associated with increased perceptions of effectiveness, but these
effects are also substantively small. This result, especially taken in the context of
inconclusive effects of the contextual level variables, provides little support for hypotheses
that social, political, or economic dislocation drive young people to be more cynical about
constructive political participation.
21
Harmonized variable computed based on Q28_1, Q28_2, and Q28_3; 0=don’t know/incorrect on all three Q28 items (lowest knowledge), 3=answers to all Q28 items correct (highest knowledge) 22
Q29, ranging from 0=highest trust (“most people can be trusted”) to10=lowest trust (“you can’t be too
careful”). Note that higher values actually correspond to less trust. 23
Index of globalization (Dreher, 2006; Dreher et al., 2008); 0-100, higher values=higher levels of economic, social, and political globalization 24
World Bank Worldwide Governance Indicator; -2.5 to 2.5, higher scores=better governance.
MYPLACE August 2014
MYPLACE: FP7-266831www.fp7-myplace.eu Deliverable 4.6 Europe wide thematic report Page 204 of 431
8.4 Summary
This chapter presents analysis conducted on the Q19 items of the MYPLACE survey, which
asks respondents to rate their perceptions of the effectiveness of a series of political
activities in influencing politics in their countries.
On a 0 to 10 scale, voting in elections received the highest mean score for effectiveness of
political action (6.9), followed by gaining publicity through media exposure (5.9) and being
active in a political party (5.4). Participating in violent and illegal protest activities are
universally regarded as the least effective with scores of 2.9 and 3.5 respectively.
The analysis proceeded in three main stages. First, we conducted a factor analysis to reduce
the number of indicators to underlying latent variables. The factor analysis produced a two-
factor solution, with Q19 items tracking on to two separate scales: perceptions of the
effectiveness of legal or nonviolent political activity; and perceptions of the effectiveness of
illegal or violent political activity. We constructed both scales accordingly for use in future
analysis. Second, we conducted a descriptive analysis of all Q19 items and scales by survey
location. Individual items and scales did exhibit clustering by locations, although it is difficult
to identify patterns without statistical tests. In general, voting in elections received the
highest mean response for effectiveness of political action, followed by gaining publicity
through media exposure and being active in a political party. Participating in violent and
illegal protest activities are the least effective.In particular, the two Georgian locations
tended to rate all Q19 items as relatively effective while Russia and the Central European
countries (including Hungary, Croatia and Slovakia) tended to be relatively pessimistic about
the effectiveness of Q19 activities. Third, we conducted a multilevel regression analysis to
explore individual-level and group-level determinants of variation in the effectiveness of
legal or nonviolent activity scale. The results of the model suggest some support for the
hypotheses that the use of the internet for information and political knowledge were
associated with increased perceptions of effectiveness of legal or nonviolent activity.
However, the model provided little support, although did not conclusively falsify, major
hypotheses about youth political activity, including those derived from economic
modernisation theory, and the hypothesis that supranational political and economic change
may lead young people to be more pessimistic about the effectiveness of constructive
political participation. In terms of the goals of the MYPLACE project, this result seems to
indicate that accession to supranational political and economic institutions like the EU has
not had any significant effect, either positive or negative, on young people’s attitudes
toward the effectiveness of legal or nonviolent political activity. However, given the
concerns about the model elaborated above, further research is necessary to bring
additional evidence to bear on this hypothesis.
MYPLACE August 2014
MYPLACE: FP7-266831www.fp7-myplace.eu Deliverable 4.6 Europe wide thematic report Page 205 of 431
References
Almond, G. A, and Verba, S. (1963) The Civic Culture: Political Attitudes and Democracy in
Five Nations. Newbury Park, Calif.: Sage Publications.
Boix, C. and Stokes, S. C. (2003) “Endogenous Democratization.” World Politics 55 (4): 517–
49. doi:10.1353/wp.2003.0019.
Dreher, A., Gaston, N. and Martens, P. (2008) Measuring Globalization – Gauging its
Consecquences. New York: Springer.
Duin, T. (1997) “The Decline of the SPD among Young People: A Study of Causes.” German
Politics 6 (3): 103–19. doi:10.1080/09644009708404491.
Edwards, K. (2009) “Disenfranchised Not ‘Deficient’: How the (Neoliberal) State
Disenfranchises Young People.” Australian Journal of Social Issues (Australian Council of
Social Service) 44 (1): 23–37.
Epstein, D. L., Bates, R., Goldstone, J., Kristensen, I. and O’Halloran, S. (2006) “Democratic
Transitions.” American Journal of Political Science 50 (3): 551–69. doi:10.1111/j.1540-
5907.2006.00201.x.
Forbrig, J. (2005) Revisiting Youth Political Participation: Challenges for Research and
Democratic Practice in Europe. Council of Europe.
Horvath, A.and Paolini, G. (2014). “Political Participation and EU Citizenship: Perceptions
and Behaviors of Young People.”
http://eacea.ec.europa.eu/youth/tools/documents/perception-behaviours.pdf.
Huntington, S.l P. (1968) Political Order in Changing Societies. New Haven, CT: Yale
University Press.
Inglehart, R. (1997) Modernization and Postmodernisation: Cultural, Economic, and Political
Change in 43 Societies.
Kääriäinen, J. andLehtonen, H. ( 2006) “The Variety of Social Capital in Welfare State
Regimes – a Comparative Study of 21 Countries.” European Societies 8 (1): 27–57.
doi:10.1080/14616690500491399.
Kaufmann, D., Kraay, A. and Mastruzzi, M. (2009) “Governance Matters VIII: Aggregate and
Individual Governance Indicators for 1996–2008”. World Bank Policy Research Paper No.
4978. http://ssrn.com/abstract=1424591
Lipset, S. M. (1959) “Some Social Requisites of Democracy: Economic Development and
Political Legitimacy.” American Political Science Review 53 (01): 69–105.
doi:10.2307/1951731.
MYPLACE August 2014
MYPLACE: FP7-266831www.fp7-myplace.eu Deliverable 4.6 Europe wide thematic report Page 206 of 431
O’Donnell, G. A. (1973) Modernization and Bureaucratic-Authoritarianism: Studies in South
American Politics. Vol. 9. Institute of International Studies, University of California Berkeley.
http://www.getcited.org/pub/101476732.
Przeworski, A., Alvarez, M. E., Cheibub, J. A.and Limongi, F. (2000) Democracy and
Development: Political Institutions and Well-Being in the World, 1950-1990. 1st ed.
Cambridge University Press.
Putnam, R. D., Leonardi, R. and Nanetti.R. Y. (1993) Making Democracy Work: Civic
Traditions in Modern Italy. Princeton University Press.
Taft, J. K. and Gordon, H. R. (2013) “Youth Activists, Youth Councils, and Constrained
Democracy.” Education, Citizenship and Social Justice 8 (1): 87–100.
Winston, F. (2013) “Decisions to Make a Difference: The Role of Efficacy in Moderate
Student Activism.” Social Movement Studies 12 (4): 414–28.
doi:http://dx.doi.org/10.1080/14742837.2013.827569.
MYPLACE August 2014
MYPLACE: FP7-266831www.fp7-myplace.eu Deliverable 4.6 Europe wide thematic report Page 207 of 431
Chapter 9: Citizenship
Literature
Citizenship Studies, as a separate multi-disciplinary field, was formed at the end of the 20th
century (Hoffman, 1999). At the beginning of the 21st century, there was an upsurge in the
research of citizenship (Stevenson, 2001). Traditional understandings of citizenship were put
to the test by the new political, economic and cultural conditions: globalisation and
mobility, neoliberalism and the neoconservative turn, which occurred in many countries
(Heater, 1999; Ellison, 1997). Nowadays, citizenship is conceptualised by a whole range of
disciplines: such as, sociology, political science, law, history, geography, pedagogy and
others. One of the classical definitions of citizenship is ‘a formal status of a national
affiliation of a person in state, implying a clear set of universal rights, implying equality of all
members of the state‘ (Marshall, 2006). Being a complex and multiple phenomenon,
citizenship is analysed through various components and manifestations (Ellison, 1997;
Crowley et al., 1997:1-3).
Ellison states three key directions in the analysis of citizenship: state-centred, pluralistic, and
post-structural (Ellison, 1997). ‘State-centred’ researchers understand citizenship in line
with Marshall’s definition – through the common rights and duties of a citizen, which he or
she gains being a citizen of a nation state. Additionally, two ways of understanding relations
between the state and citizens can be defined: liberal and republican (Oldfield, 1990; Miller,
1990).
Liberal theorists (Kymlicka, 1995; 2001) emphasise individual freedom and the right to live
one’s own life, as long as it does not interfere with the rights of other people (Mouffe,
1992:6). According to this understanding, cultural minorities are accepted in the liberal
society – they are allowed to preserve their own values and are not forced to share any
values that could be alien to them. State interference in individuals’ lives is justified mainly
as a way to maintain the rule of mutual respect - ‘respect the rights of others‘. Enhanced
integration of nation states and the need to regulate co-existence of multiple cultural
models, within a single state, have led to the emergence of multiculturalism - both in its
‘hard’ (Kymlicka, 1995) and ‘soft’ versions (Kukathas, 2009). Ideally, this approach has to
support cultural and ethnic diversity and maintain their conflict-free interaction. The
critique of this idea is concerned with the risk of equalising cultural differences and
reproduction of the dominant culture (Walzer, 2000). Zizek has argued that the neutrality
of multiculturalism is only the ’mask‘ of Eurocentrism (Interpassivity, 2005).
‘Republicanism‘ (Pettit and Skinner, 1997). According to this idea, freedom can exist only if
there is a suitable mode of law that protects citizens from violent interference and
MYPLACE August 2014
MYPLACE: FP7-266831www.fp7-myplace.eu Deliverable 4.6 Europe wide thematic report Page 208 of 431
despotism. In the republican tradition, civil participation is an essential element of
citizenship. ‘True’ citizens should be interested in the common good and are willing to
contribute to it (Honohan, 2002: 5).
There is also a ‘communitarianist‘ position, whose ideas are to some extent similar to the
followers of ‘republicanism' (Walzer,2000). There is the need for a new form of sociality,
which would combine social duty and a desire for social good with personal autonomy.
Communitarians have accused liberals of excessive individualism and low social
responsibility, stating that they exaggerate the rights of citizens over the duties.
Followers of the ‘pluralist tradition‘ criticise the universal understanding of citizenship and
emphasise unequal access to rights and political participation (Young, 1989).Within the
frames of post-structuralism, the concept of citizenship is redefined as one of the aspects of
identity politics. Post-structuralists stress its dynamism, plurality and dependence on various
interpretations articulated in the context of democratic societies of late modernity (Mouffe,
2005; Seidman, 1999).
Based on these approaches of understanding citizenship, we can highlight several key
definitions:
1. Citizenship is a term that describes people’s belonging to a community and their
membership in it, as well as exclusion of the ‘other’ – ‘non-citizens’, ‘aliens’. Therefore,
citizenship is one of the most powerful ways of border-making in the contemporary world.
Brubaker is one of the first thinkers who pointed to this role of citizenship. In ‘Citizenship
and Nationhood in France and Germany’ he states that ‘citizenship itself by its very nature
has not only inclusive, but also exclusive status. Globally, citizenship is an extremely
powerful tool for social closeness. It protects prosperous and peaceful states, if there would
be no borders, from the vast majority of those who would want to escape from war, civil
strife, hunger, unemployment, environmental degradation, or decided to change their place
of residence in the hope of providing better opportunities for their children. The possibility
of obtaining citizenship is limited everywhere...’ (Brubaker, 1992; 2004). In this case, the
question of citizenship concerns not only formal membership in the society/state, but
politics of identity and democratic principles, also defined as ‘politics of recognition and
respect‘ (Lister, 2003:37; Hopkins, 2011).
2. Citizenship is a term that describes both passive membership and active participation. On
the one hand, one can be a citizen by just having a formal status without public participation
for the common good and the use of granted rights (e.g. the right to vote). Researchers in
recent years have pointed to the decline in interest to participation in politics (Putnam,
1999; Lister, 2002). On the other hand, we should assume that the status of a citizen, not
only refers to rights, but also the duties to be performed by a person. (See, for example,
MYPLACE August 2014
MYPLACE: FP7-266831www.fp7-myplace.eu Deliverable 4.6 Europe wide thematic report Page 209 of 431
Oldfield, 1990). Being a citizen means to be active and to act for the common good. This
very understanding of participation and citizenship is also undergoing significant changes.
Today, people prefer not to act in the field of traditional politics, but rather in the fields of
culture, consumption, and the Internet (Stevenson, 2003; Delanty, 2000).
3.- Nowadays, citizenship describes legal political membership and activism as well as non-
political involvement in a community and non-political participation based on common
values. Additionally, citizenship is increasingly becoming associated not only with rights and
obligations, but also with certain pleasures. Riley et al.(2010) have even introduced the
concept of a ‘citizen of fun‘, which is used to describe new forms of youth communities
based on the values of hedonism. By analysing leisure activities, the authors conceptualise
personal, local and informal aspects of citizenship. In particular, they state that leisure is
increasingly becoming an important area for the construction of new identities (Haste,
2004).
4. Citizenship can be also regarded as a characteristic of a particular individual, indicating
one’s individual status and personal interests. On the other hand, it appears to be a trait of
collectivity (of one’s belonging to the community) (Gaventa, 2009).
Another discussion on citizenship considers ‘territorial rootedness‘ and citizens' mobility
(Urry, 2012). The link between citizenship and the nation state is not always relevant today.
Thus, according to some authors, citizenship is not only a matter of official belonging to the
state and living on its territory, it is more about subjective meanings, feelings and
performative strategies of being a citizen, in different communities at different levels: local,
national and global (Gaventa, 2009). One of the outcomes of globalisation today is the
emergence of a ‘global citizen‘ or a ‘’citizen of the world‘ who has overcome one’s own
rootedness in a certain territory, nation, ideology, family, tradition; he or she is mobile
among the countries without being emotionally bounded to places or people.
These avenues of understanding of citizenship in the westernern academic context show
that this category can be used to describe contradictory phenomena. At the same time,
their meanings are closely connected. In fact, the term ‘citizen‘ was conceptualised for the
strict distribution of rights, assets and duties in society. Yet in any contemporary
approaches to citizenship, deconstructing, rethinking and criticising this link between
citizenship and the nation state, do not overcome this concept’s scope, which, a-priori,
implies the existence of at least some identity connected to the state (Sassen, 2002). This
again brings us back to the construction of ‘citizen’ within the nation state. The question
emerges: ‘Who can be considered a citizen?’ In many works there is a dichotomy between
‘ethnic‘ and ‘civic‘ nationalism. Kohn can be regarded as the founder of this approach (Kohn,
1944.), who considered Eastern Europe through ‘ethnic nationalism‘ and Western Europe
through ‘civic nationalism‘. Keating defines civic nationalism, as opposed to ethnic
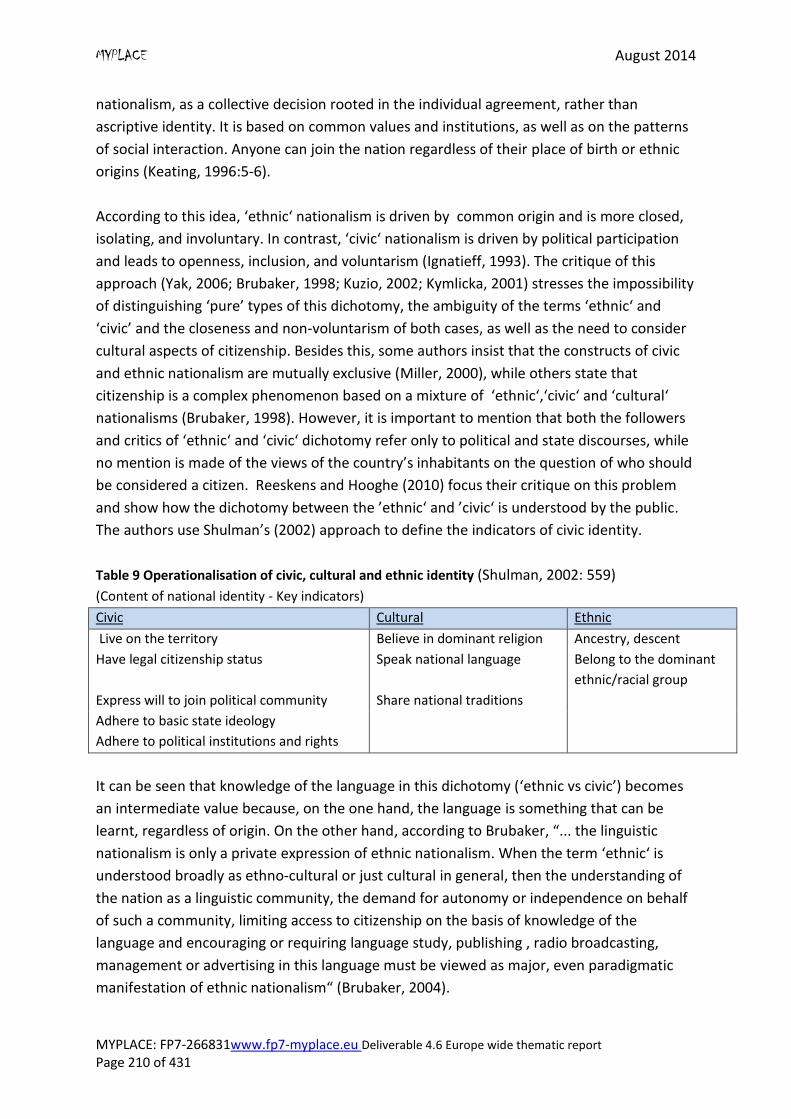
MYPLACE August 2014
MYPLACE: FP7-266831www.fp7-myplace.eu Deliverable 4.6 Europe wide thematic report Page 210 of 431
nationalism, as a collective decision rooted in the individual agreement, rather than
ascriptive identity. It is based on common values and institutions, as well as on the patterns
of social interaction. Anyone can join the nation regardless of their place of birth or ethnic
origins (Keating, 1996:5-6).
According to this idea, ‘ethnic‘ nationalism is driven by common origin and is more closed,
isolating, and involuntary. In contrast, ‘civic‘ nationalism is driven by political participation
and leads to openness, inclusion, and voluntarism (Ignatieff, 1993). The critique of this
approach (Yak, 2006; Brubaker, 1998; Kuzio, 2002; Kymlicka, 2001) stresses the impossibility
of distinguishing ‘pure’ types of this dichotomy, the ambiguity of the terms ‘ethnic‘ and
‘civic’ and the closeness and non-voluntarism of both cases, as well as the need to consider
cultural aspects of citizenship. Besides this, some authors insist that the constructs of civic
and ethnic nationalism are mutually exclusive (Miller, 2000), while others state that
citizenship is a complex phenomenon based on a mixture of ‘ethnic‘,‘civic‘ and ‘cultural‘
nationalisms (Brubaker, 1998). However, it is important to mention that both the followers
and critics of ‘ethnic‘ and ‘civic‘ dichotomy refer only to political and state discourses, while
no mention is made of the views of the country’s inhabitants on the question of who should
be considered a citizen. Reeskens and Hooghe (2010) focus their critique on this problem
and show how the dichotomy between the ’ethnic‘ and ’civic‘ is understood by the public.
The authors use Shulman’s (2002) approach to define the indicators of civic identity.
Table 9 Operationalisation of civic, cultural and ethnic identity (Shulman, 2002: 559)
(Content of national identity - Key indicators)
Civic Cultural Ethnic
Live on the territory Believe in dominant religion Ancestry, descent
Have legal citizenship status Speak national language Belong to the dominant
ethnic/racial group
Express will to join political community Share national traditions
Adhere to basic state ideology
Adhere to political institutions and rights
It can be seen that knowledge of the language in this dichotomy (‘ethnic vs civic’) becomes
an intermediate value because, on the one hand, the language is something that can be
learnt, regardless of origin. On the other hand, according to Brubaker, “... the linguistic
nationalism is only a private expression of ethnic nationalism. When the term ‘ethnic‘ is
understood broadly as ethno-cultural or just cultural in general, then the understanding of
the nation as a linguistic community, the demand for autonomy or independence on behalf
of such a community, limiting access to citizenship on the basis of knowledge of the
language and encouraging or requiring language study, publishing , radio broadcasting,
management or advertising in this language must be viewed as major, even paradigmatic
manifestation of ethnic nationalism“ (Brubaker, 2004).
MYPLACE August 2014
MYPLACE: FP7-266831www.fp7-myplace.eu Deliverable 4.6 Europe wide thematic report Page 211 of 431
In recent academic discussion, there has been a weakening of the ‘nationalism’ concept and
an emergence of the idea of the post-national state and trans-national citizenship. This
approach stresses the disconnection between rights and national belonging, citizenship and
national territories (such as, denationalisation, deterritorialisation) as well as the rupture
between formal and emotional belonging (Sassen, 2002). As Habermas argued, nationalism,
as a form of cultural identity, no longer reflects contemporary reality, ’so the overcoming of
fascism creates a particular historical perspective, from which the post-national identity is
formed based on the principles of law and democracy‘ (Habermas, 1990: 154).
In connection with this, in citizenship studies particular attention is paid to the question of
European identity. It has been expected that citizens who identify themselves as ‘European’
will show mutual solidarity; they expect to be prepared to share resources together and
thus agree to pay for less wealthy fellow citizens (Duschesne et al., 2013). However, critics
argue that the European identity is an artificial and vague concept that does not really exist.
Many researchers suggest that, more often, EU citizens identify themselves with their
national state rather than with the European Union (Bauböck et al., 2009). ‘Promoters of
the political identity claim that a common cultural background in Europe is too weak to
encourage Europeans’ awareness of belonging to this community‘(Pichler, 2012). It also
shows the ambiguity of the perception of free movement in the integrated European space
by the residents of the EU, according to the migration policy. Some researchers argue that
there are no existing social mechanisms to protect the rights of migrants outside of the
nation state in order to implement the concept of post-nationalism (Malakhov, 2014).
Globalisation leads to the emergence of a phenomenon, which researchers have called the
devaluation of sovereignty. In a global market, nation states are lacking the resources for
building their own economy. The emergence of supra-national political and economic
structures leads to de-territorialisation and changing the nation state’s function as the
provider of peace, comfort and well-being. In this case there are two approaches to the
vision of the nation state. In the first case, welfare is not connected with care for the nation,
but with the concern for the economic interests of the state, which entails the building of
public policy in the context of global economic and political trends. In the second approach,
the protection of ‘national interests‘ refers to the confrontation with global trends; the
government’s policy is aimed at the protection of domestic economy and the security of
citizens (Lakić, 2011; Malakhov, 2005).
Taking into consideration a complex understanding of citizenship, which includes political
participation, civil activism, and interaction of different communities within one territory, in
our analysis, we concentrate on the value assets of citizenship and young people’s
understanding of the relationship between the state and its citizens, as well as the
relationship between the state in which they live and other countries.

MYPLACE August 2014
MYPLACE: FP7-266831www.fp7-myplace.eu Deliverable 4.6 Europe wide thematic report Page 212 of 431
9.1 National identity (Q22)
We asked our respondents the following question:
Q22: Are you a citizen of your country?
Besides this, we included the following questions in our survey:
Q56: What is your country of birth?
Q57: What is your nationality?
Q58: What is your ethnic group?
Based on all four questions, we created a combined category that describes the identity of
the respondent in terms of: belonging to the majority (which includes the dominant
nationality in the country and dominant ethnic group/s in the country) and to the minority.
MYPLACE August 2014
MYPLACE: FP7-266831www.fp7-myplace.eu Deliverable 4.6 Europe wide thematic report Page 213 of 431
Q22: National identity
Variable Description
In the MYPLACE survey, respondents were asked the question: Are you a citizen of this country? It was a dummy variable with ‘yes/no’ categories. The locations in this graph are given in decreasing order of the
number of respondents who answered that they are citizens of this
country.
Graph 9.1a: Respondents’ citizenship (by location)
Narrative
16,905 respondents - from all survey locations - answered this
question. 93% of them considered themselves to be citizens of their
country and 7% said that they are not citizens of their country.
According to the results of the analysis, it turned out that only in 5
localities is the number of non-citizens greater than 10%: Narva
(Estonia), Coventry (UK), Vic (Spain), Forstate & Jaunbuve (Latvia) and
Barreiro (Portugal). As can be seen on Graph 9.1a, an interesting
cluster (which includes Slovakia, Hungary, Georgia, Russia, Croatia,
Finland) shows the number of citizens close to 100%.
MYPLACE August 2014
MYPLACE: FP7-266831www.fp7-myplace.eu Deliverable 4.6 Europe wide thematic report Page 214 of 431
Q22, Q56, Q57 & Q58: Majority/minority status
Variable Description
This variable was created during the process of harmonising the data
from all the participating countries. The decision was taken by the
MYPLACE project leader. Based on 4 questions; Are you a citizen of
your country? What is your country of birth? What is your
nationality? What is your ethnic group? A unified category was
created, which describes a respondent’s identity in terms of:
belonging to the majority (which includes the dominant nationality in
the country and dominant ethnic group/s in the country) and to the
minority.
Graph 9.1b: Respondent’s majority/minority status (by location)
Narrative
The current index that describes a respondent’s identity covered
16,679 respondents. Based on the criteria we used, overall, 80% of
the respondents represent majority groups in their location, and 20%
represent minority groups.
We can highlight several countries with equal or almost equal number
of respondents that can be assigned to the minority using the index.
These are Georgia, Finland, Croatia and western Germany. In other
countries the difference between localities is vast. Especially, it can be
noticed in Estonia, Slovakia, Latvia and the United Kingdom.
MYPLACE August 2014
MYPLACE: FP7-266831www.fp7-myplace.eu Deliverable 4.6 Europe wide thematic report Page 215 of 431
9.2 Feeling proud of current citizenship (Q24)
The existing traditional construct of citizenship as the formal belonging of a person to the
state, has excluded the person themselves from the process of citizenship ‘uptake‘. Such an
approach neglects the meaning of subjectivity of a citizen, paying attention only to accepted
roles. In this sense the importance of perception of oneself as citizen of a country becomes,
in some ways, a construct through the prism of which identity citizenship can be formed.
Respondents were asked to evaluate this using a 4 grade scale (‘very proud‘, ‘quite proud‘,
‘not very proud’, ‘not proud at all‘):‘How proud you are to be a citizen of your country?’
MYPLACE August 2014
MYPLACE: FP7-266831www.fp7-myplace.eu Deliverable 4.6 Europe wide thematic report Page 216 of 431
Q24: Feeling proud of current citizenship
Variable Description
The graph shows, by location, levels of pride in being a citizen of a given. It is
ordered from highest to lowest levels of pride. Responses of ‘very proud’
and ‘quite proud’ were combined in order to calculate the level of pride in
citizenship.
Graph 9.2: How proud are you to have this citizenship? (by location)
Narrative
16,349 respondents answered this question from all survey locations. 39% of
them said that they are ‘very proud‘ that they are citizens of their country;
40% answered with ‘quite proud‘; 15% chose the option ‘not very proud‘;
6% said that they are ‘not proud at all‘ to be citizens of their country.
The highest percentage of those who are very proud of their citizenship is in
Georgia (in both locations this answer was given by more than 80% of
respondents). The lowest level of proudness of one’s own state citizenship is
in eastern Germany (in both localities only 12-13% said that they are ’very
proud’).
We can highlight two opposite groups of countries: 1. Where the majority of
youth are proud of their citizen status. 2. Where almost half of the
respondents are not proud to be citizens. The first cluster consists of
Georgia, Finland, Denmark and the United Kingdom. The second one – Spain
and eastern Germany. In many countries, in both localities the percentage of
youth who are proud to be citizens is close to equal. Nevertheless, in Latvia
and Estonia in different localities the amount of respondents in the
combined coefficient (‘not very proud’ and ‘not proud at all’) differs by 20%.
It is interesting that particularly in these countries (see the Graph 9.1b)
there is the highest difference between localities on the merged index of
belonging to majority or minority.

MYPLACE August 2014
MYPLACE: FP7-266831www.fp7-myplace.eu Deliverable 4.6 Europe wide thematic report Page 217 of 431
9.3 Important things relating to country citizenship (Q25)
Citizenship in a modern understanding, is inseparable from a person and from their values
and beliefs on what it means to be a citizen of one’s own country. In our research,
respondents answered the question: ‘Some people say the following things are important
for being a citizen of country. Others say that they are not important. How important do you
think each of the following is?’
Using the five-grade scale (‘very important’, ‘important’, ‘neither important nor
unimportant’, ‘not very important’, ‘not important at all’) the young people who
participated in the research had to evaluate the importance of each of the following
notions:
Q25_1: To have been born in [COUNTRY]
Q25_2: To be able to speak [THE NATIONAL LANGUAGE]
Q25_3: To have at least one [COUNTRY] parent
Q25_4: To respect [COUNTRY] political institutions and laws
In line with the theoretical approach that was examined earlier, during our analysis we
combined Q25_1: To have been born in [COUNTRY] and Q25_3: To have at least one
[COUNTRY] parent in one unified scale as an indicator of ethnic nationalism demonstration.
Q25_4: To respect [COUNTRY] political institutions and laws is analysed as an indicator of
civic nationalism as opposed to ethnic.
Variable Q25_2: To be able to speak [THE NATIONAL LANGUAGE] [NOTE: if more than one
national language, ask the national languages] will be reviewed separately.
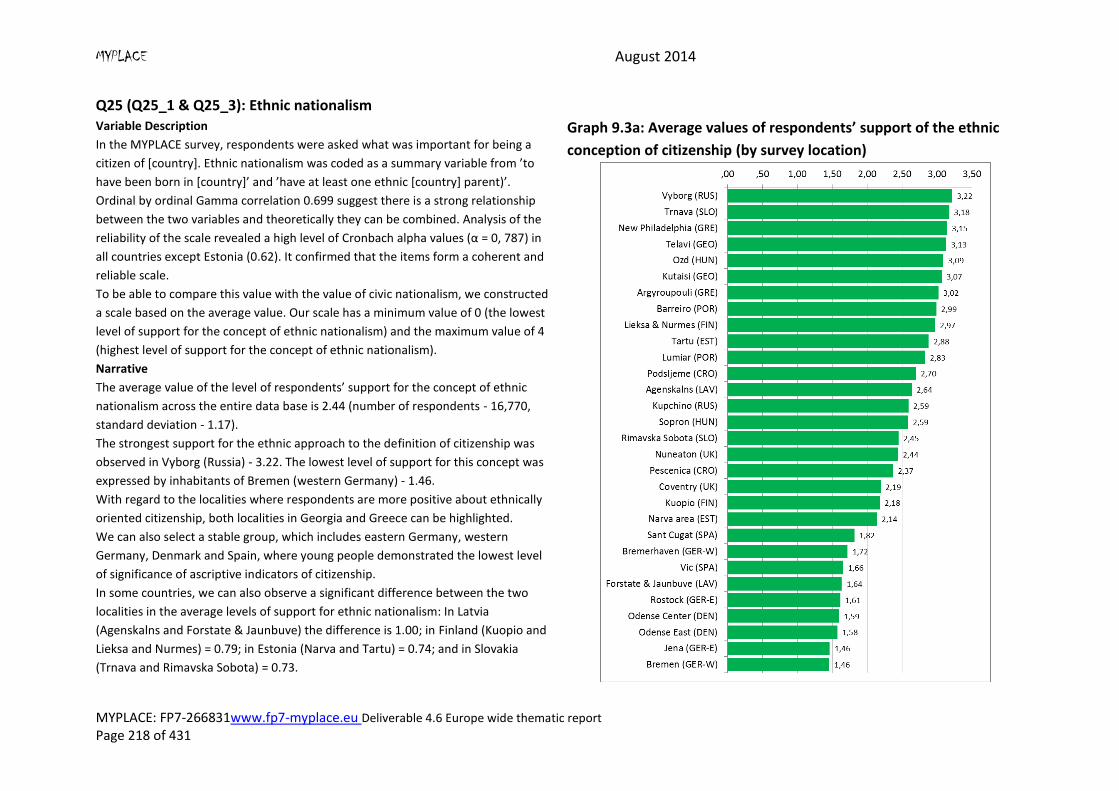
MYPLACE August 2014
MYPLACE: FP7-266831www.fp7-myplace.eu Deliverable 4.6 Europe wide thematic report Page 218 of 431
Q25 (Q25_1 & Q25_3): Ethnic nationalism
Variable Description
In the MYPLACE survey, respondents were asked what was important for being a
citizen of [country]. Ethnic nationalism was coded as a summary variable from ’to
have been born in [country]’ and ’have at least one ethnic [country] parent)’.
Ordinal by ordinal Gamma correlation 0.699 suggest there is a strong relationship
between the two variables and theoretically they can be combined. Analysis of the
reliability of the scale revealed a high level of Cronbach alpha values (α = 0, 787) in
all countries except Estonia (0.62). It confirmed that the items form a coherent and
reliable scale.
To be able to compare this value with the value of civic nationalism, we constructed
a scale based on the average value. Our scale has a minimum value of 0 (the lowest
level of support for the concept of ethnic nationalism) and the maximum value of 4
(highest level of support for the concept of ethnic nationalism).
Graph 9.3a: Average values of respondents’ support of the ethnic
conception of citizenship (by survey location)
Narrative
The average value of the level of respondents’ support for the concept of ethnic
nationalism across the entire data base is 2.44 (number of respondents - 16,770,
standard deviation - 1.17).
The strongest support for the ethnic approach to the definition of citizenship was
observed in Vyborg (Russia) - 3.22. The lowest level of support for this concept was
expressed by inhabitants of Bremen (western Germany) - 1.46.
With regard to the localities where respondents are more positive about ethnically
oriented citizenship, both localities in Georgia and Greece can be highlighted.
We can also select a stable group, which includes eastern Germany, western
Germany, Denmark and Spain, where young people demonstrated the lowest level
of significance of ascriptive indicators of citizenship.
In some countries, we can also observe a significant difference between the two
localities in the average levels of support for ethnic nationalism: In Latvia
(Agenskalns and Forstate & Jaunbuve) the difference is 1.00; in Finland (Kuopio and
Lieksa and Nurmes) = 0.79; in Estonia (Narva and Tartu) = 0.74; and in Slovakia
(Trnava and Rimavska Sobota) = 0.73.
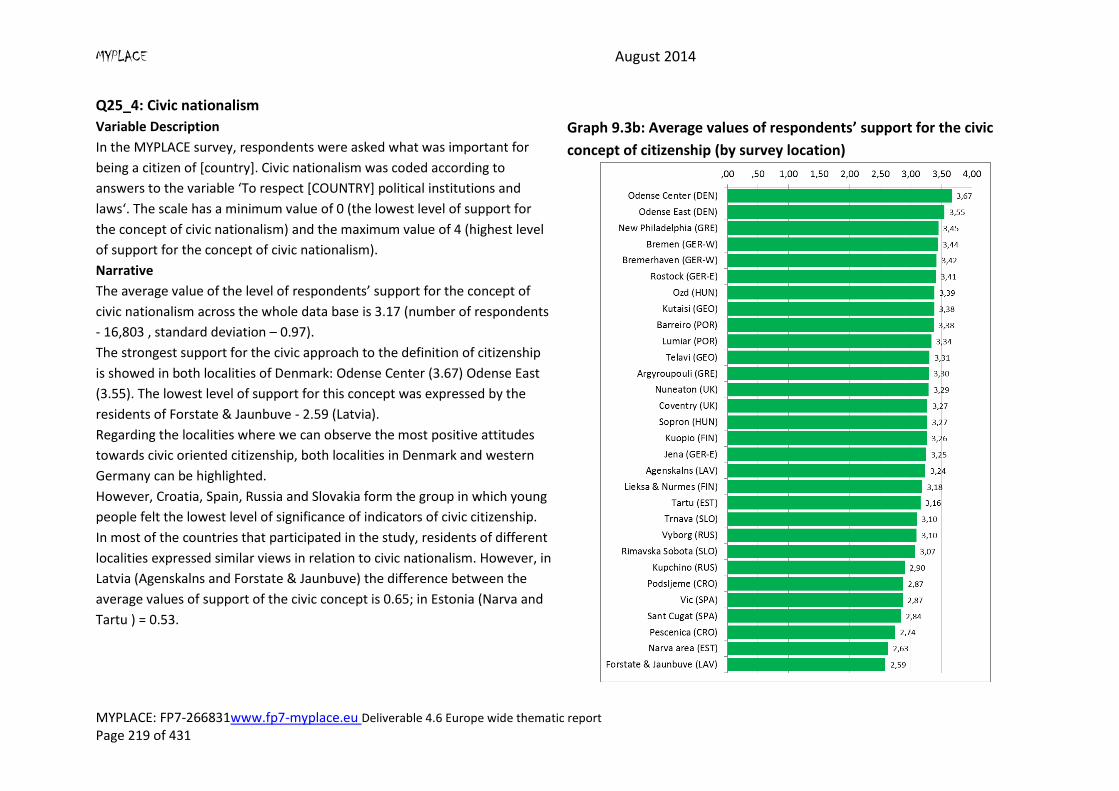
MYPLACE August 2014
MYPLACE: FP7-266831www.fp7-myplace.eu Deliverable 4.6 Europe wide thematic report Page 219 of 431
Q25_4: Civic nationalism
Variable Description
In the MYPLACE survey, respondents were asked what was important for
being a citizen of [country]. Civic nationalism was coded according to
answers to the variable ‘To respect [COUNTRY] political institutions and
laws‘. The scale has a minimum value of 0 (the lowest level of support for
the concept of civic nationalism) and the maximum value of 4 (highest level
of support for the concept of civic nationalism).
Graph 9.3b: Average values of respondents’ support for the civic
concept of citizenship (by survey location)
Narrative
The average value of the level of respondents’ support for the concept of
civic nationalism across the whole data base is 3.17 (number of respondents
- 16,803 , standard deviation – 0.97).
The strongest support for the civic approach to the definition of citizenship
is showed in both localities of Denmark: Odense Center (3.67) Odense East
(3.55). The lowest level of support for this concept was expressed by the
residents of Forstate & Jaunbuve - 2.59 (Latvia).
Regarding the localities where we can observe the most positive attitudes
towards civic oriented citizenship, both localities in Denmark and western
Germany can be highlighted.
However, Croatia, Spain, Russia and Slovakia form the group in which young
people felt the lowest level of significance of indicators of civic citizenship.
In most of the countries that participated in the study, residents of different
localities expressed similar views in relation to civic nationalism. However, in
Latvia (Agenskalns and Forstate & Jaunbuve) the difference between the
average values of support of the civic concept is 0.65; in Estonia (Narva and
Tartu ) = 0.53.
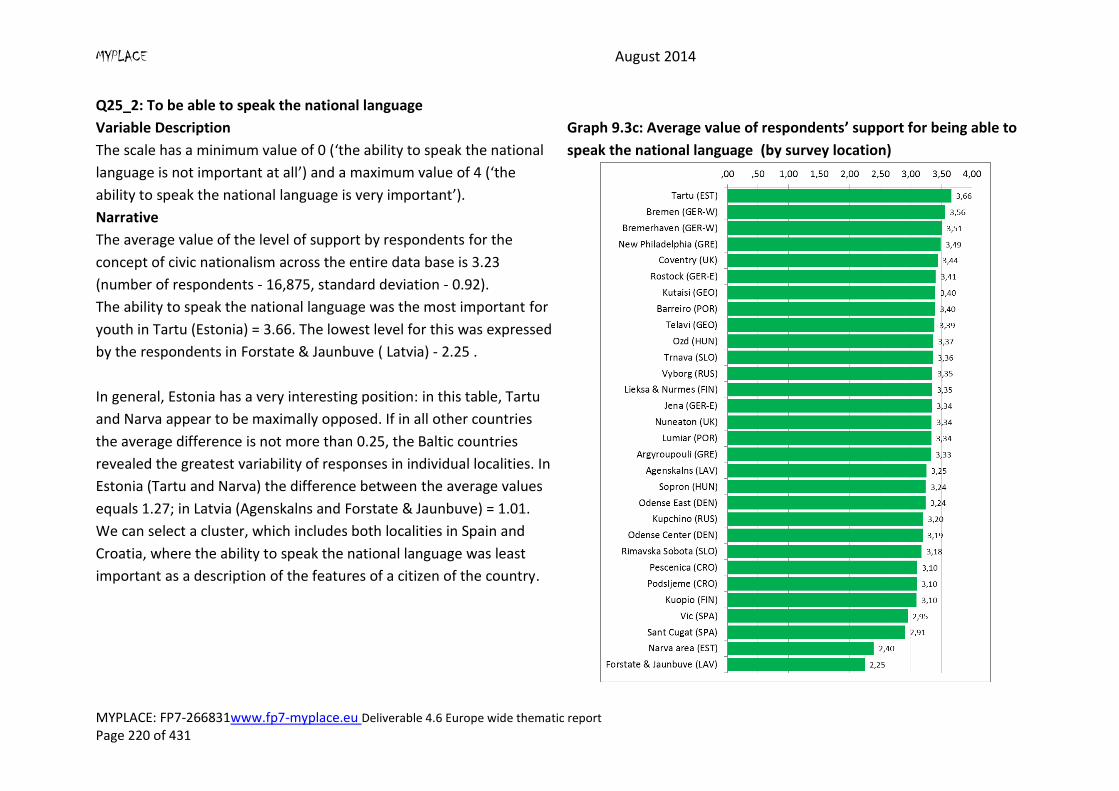
MYPLACE August 2014
MYPLACE: FP7-266831www.fp7-myplace.eu Deliverable 4.6 Europe wide thematic report Page 220 of 431
Q25_2: To be able to speak the national language
Variable Description
The scale has a minimum value of 0 (‘the ability to speak the national
language is not important at all’) and a maximum value of 4 (‘the
ability to speak the national language is very important’).
Graph 9.3c: Average value of respondents’ support for being able to
speak the national language (by survey location)
Narrative
The average value of the level of support by respondents for the
concept of civic nationalism across the entire data base is 3.23
(number of respondents - 16,875, standard deviation - 0.92).
The ability to speak the national language was the most important for
youth in Tartu (Estonia) = 3.66. The lowest level for this was expressed
by the respondents in Forstate & Jaunbuve ( Latvia) - 2.25 .
In general, Estonia has a very interesting position: in this table, Tartu
and Narva appear to be maximally opposed. If in all other countries
the average difference is not more than 0.25, the Baltic countries
revealed the greatest variability of responses in individual localities. In
Estonia (Tartu and Narva) the difference between the average values
equals 1.27; in Latvia (Agenskalns and Forstate & Jaunbuve) = 1.01.
We can select a cluster, which includes both localities in Spain and
Croatia, where the ability to speak the national language was least
important as a description of the features of a citizen of the country.
MYPLACE August 2014
MYPLACE: FP7-266831www.fp7-myplace.eu Deliverable 4.6 Europe wide thematic report Page 221 of 431
9.4 Attitudes towards national sovereignty and externalities
(Q26)
Citizenship as a legal concept, in some ways naturally implies the existence of state
guarantees to protect citizens, their welfare and other legal privileges. Another issue is how
equitable and universal such dissemination of guarantees is for individuals that are
somehow included in the community-state scheme. From this perspective, the definition of
who exactly should be granted the privileges begins with alignment of boundaries between
‘us‘ and ‘them‘. And here we are not interested in power discourse as the rationale for state
sovereignty existence, territorial protection and protectionist policy. The Important focus
for our analysis is the attitude of young people to participating in such political aspects of
citizenship.
In the study, respondents were asked to rate on a five grade scale (‘strongly agree‘, ‘agree‘,
‘hard to say whether agree or disagree‘ , ‘disagree ‘, ‘strongly disagree‘) their attitude to the
following statements:
Q26_1: [COUNTRY] should limit the import of foreign products in order to protect its
national economy
Q26_2: The availability of foreign films, music, and books greatly contributes to
(COUNTRY’S) national culture
Q26_3: [COUNTRY] should follow its own interests, even if this leads to conflicts with
other nations
Q26_4: Foreigners should not be allowed to buy land in [COUNTRY]
Q26_5: Membership of the European Union greatly benefits this country
Q25_5 variable cannot be used for construction of a combined index as the question was
not answered by respondents from all countries (for youth in Georgia and Russia this
variable is not applicable for the analysis).
Using the factor analysis of the main components with the Varimax rotation, on the basis of
their own decisions across the data base, we have identified two factors explaining 67.5 %
of the variance. The first factor was assigned for variables (Q26_1, Q26_3, Q26_4), the
second - Q26_2. Suitability analysis showed the significance of Cronbach alpha (α = 0,608).
There is no certainty that this scale is stable, as the factor analysis for individual countries
demonstrates the integration of the different variables in the factors and satisfactory results
from the combined scale (Q26_1, Q26_3, Q26_4), Cronbach alpha ( greater than 0.6 ) can be
seen only in two countries (Estonia α = 0.600 ; Hungary α = 0,611).
For this reason, we did not produce indices and analyse each of the items separately.
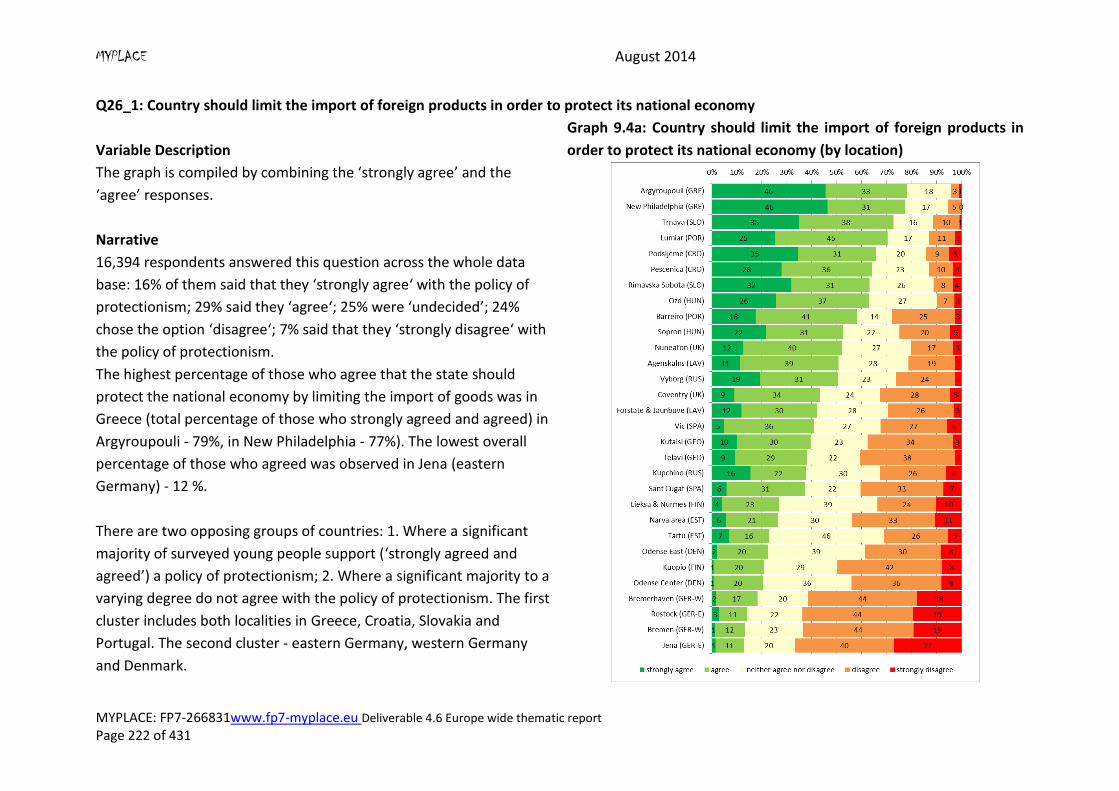
MYPLACE August 2014
MYPLACE: FP7-266831www.fp7-myplace.eu Deliverable 4.6 Europe wide thematic report Page 222 of 431
Q26_1: Country should limit the import of foreign products in order to protect its national economy
Variable Description
The graph is compiled by combining the ‘strongly agree’ and the
‘agree’ responses.
Graph 9.4a: Country should limit the import of foreign products in
order to protect its national economy (by location)
Narrative
16,394 respondents answered this question across the whole data
base: 16% of them said that they ‘strongly agree‘ with the policy of
protectionism; 29% said they ‘agree‘; 25% were ‘undecided’; 24%
chose the option ‘disagree‘; 7% said that they ‘strongly disagree‘ with
the policy of protectionism.
The highest percentage of those who agree that the state should
protect the national economy by limiting the import of goods was in
Greece (total percentage of those who strongly agreed and agreed) in
Argyroupouli - 79%, in New Philadelphia - 77%). The lowest overall
percentage of those who agreed was observed in Jena (eastern
Germany) - 12 %.
There are two opposing groups of countries: 1. Where a significant
majority of surveyed young people support (‘strongly agreed and
agreed’) a policy of protectionism; 2. Where a significant majority to a
varying degree do not agree with the policy of protectionism. The first
cluster includes both localities in Greece, Croatia, Slovakia and
Portugal. The second cluster - eastern Germany, western Germany
and Denmark.
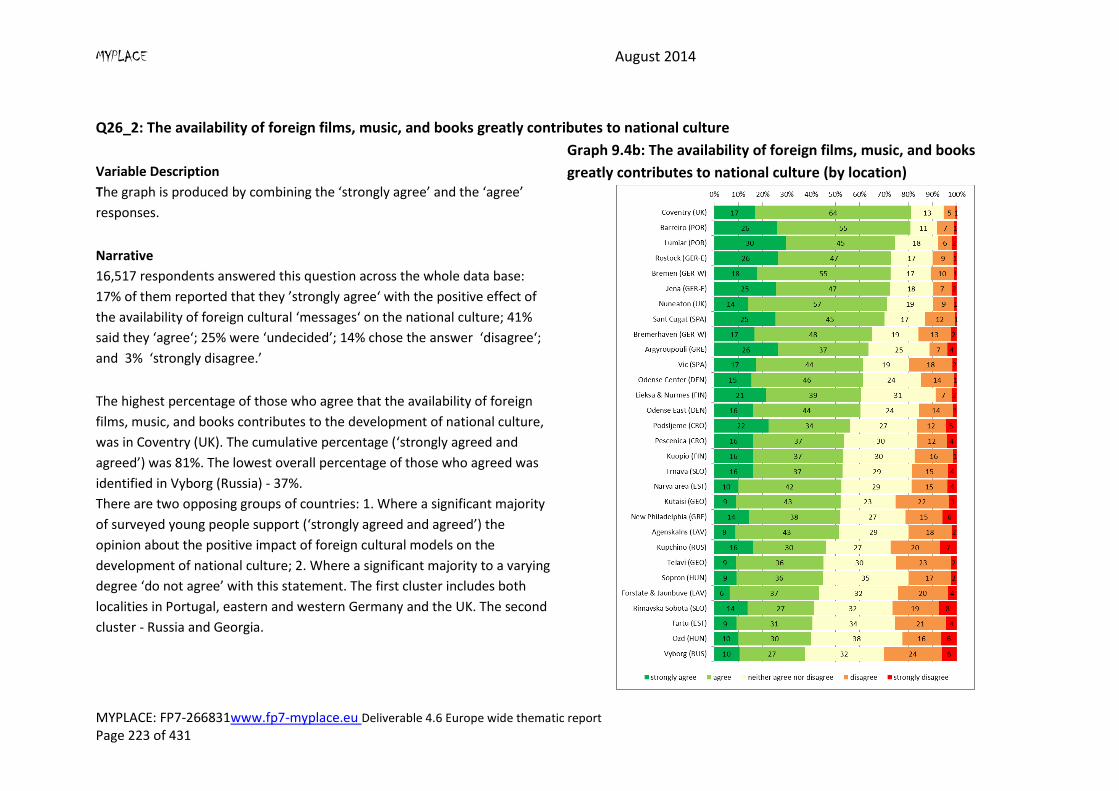
MYPLACE August 2014
MYPLACE: FP7-266831www.fp7-myplace.eu Deliverable 4.6 Europe wide thematic report Page 223 of 431
Q26_2: The availability of foreign films, music, and books greatly contributes to national culture
Variable Description
The graph is produced by combining the ‘strongly agree’ and the ‘agree’
responses.
Graph 9.4b: The availability of foreign films, music, and books
greatly contributes to national culture (by location)
Narrative
16,517 respondents answered this question across the whole data base:
17% of them reported that they ’strongly agree‘ with the positive effect of
the availability of foreign cultural ‘messages‘ on the national culture; 41%
said they ‘agree‘; 25% were ‘undecided’; 14% chose the answer ‘disagree‘;
and 3% ‘strongly disagree.’
The highest percentage of those who agree that the availability of foreign
films, music, and books contributes to the development of national culture,
was in Coventry (UK). The cumulative percentage (‘strongly agreed and
agreed’) was 81%. The lowest overall percentage of those who agreed was
identified in Vyborg (Russia) - 37%.
There are two opposing groups of countries: 1. Where a significant majority
of surveyed young people support (‘strongly agreed and agreed’) the
opinion about the positive impact of foreign cultural models on the
development of national culture; 2. Where a significant majority to a varying
degree ‘do not agree’ with this statement. The first cluster includes both
localities in Portugal, eastern and western Germany and the UK. The second
cluster - Russia and Georgia.
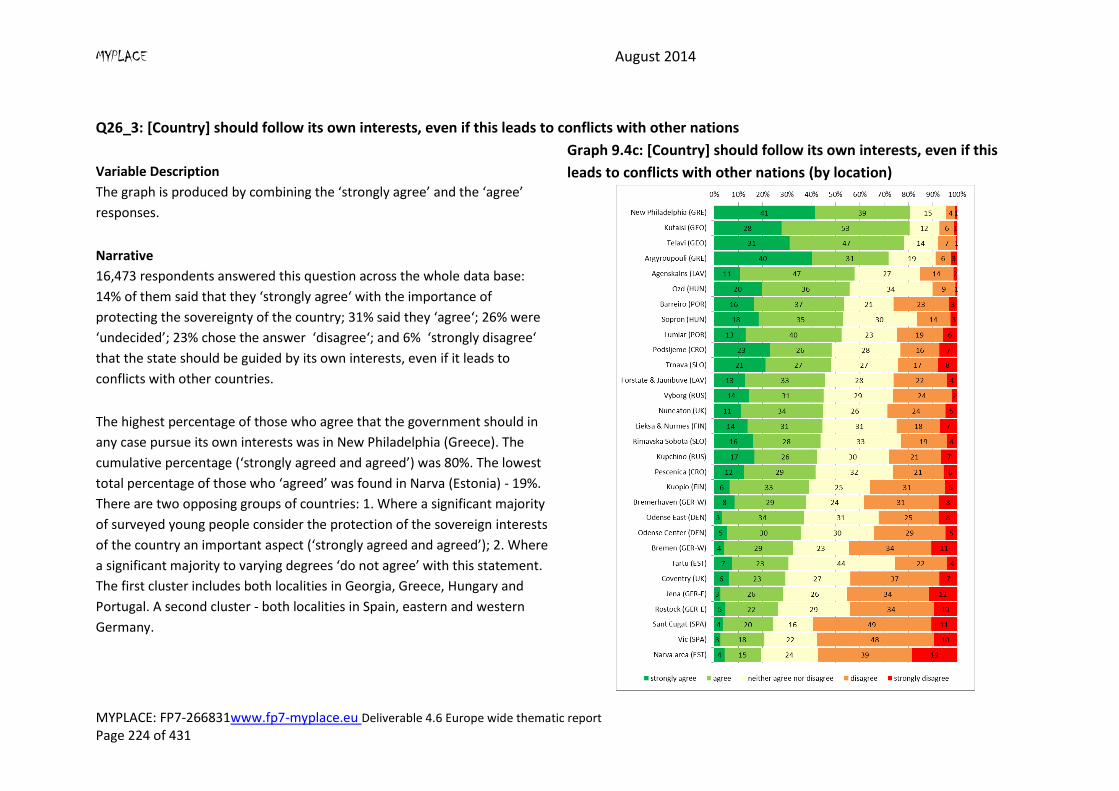
MYPLACE August 2014
MYPLACE: FP7-266831www.fp7-myplace.eu Deliverable 4.6 Europe wide thematic report Page 224 of 431
Q26_3: [Country] should follow its own interests, even if this leads to conflicts with other nations
Variable Description
The graph is produced by combining the ‘strongly agree’ and the ‘agree’
responses.
Graph 9.4c: [Country] should follow its own interests, even if this
leads to conflicts with other nations (by location)
Narrative
16,473 respondents answered this question across the whole data base:
14% of them said that they ‘strongly agree‘ with the importance of
protecting the sovereignty of the country; 31% said they ‘agree‘; 26% were
‘undecided’; 23% chose the answer ‘disagree‘; and 6% ‘strongly disagree‘
that the state should be guided by its own interests, even if it leads to
conflicts with other countries.
The highest percentage of those who agree that the government should in
any case pursue its own interests was in New Philadelphia (Greece). The
cumulative percentage (‘strongly agreed and agreed’) was 80%. The lowest
total percentage of those who ‘agreed’ was found in Narva (Estonia) - 19%.
There are two opposing groups of countries: 1. Where a significant majority
of surveyed young people consider the protection of the sovereign interests
of the country an important aspect (‘strongly agreed and agreed’); 2. Where
a significant majority to varying degrees ‘do not agree’ with this statement.
The first cluster includes both localities in Georgia, Greece, Hungary and
Portugal. A second cluster - both localities in Spain, eastern and western
Germany.
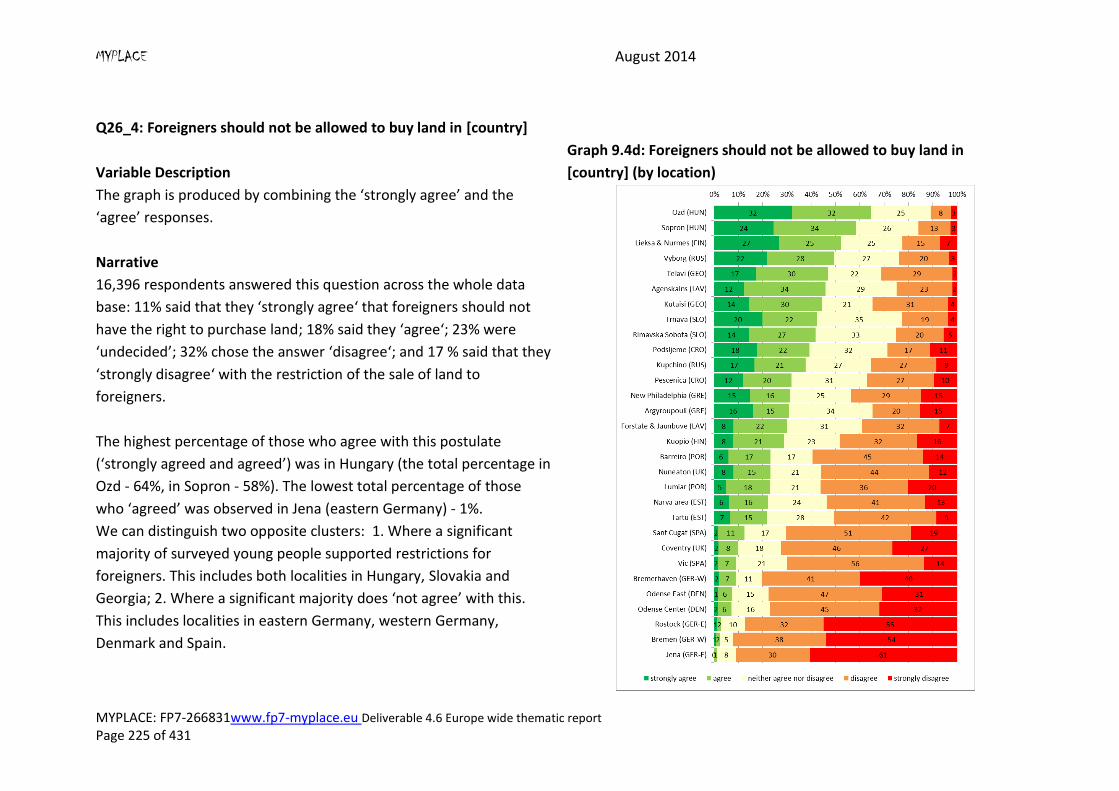
MYPLACE August 2014
MYPLACE: FP7-266831www.fp7-myplace.eu Deliverable 4.6 Europe wide thematic report Page 225 of 431
Q26_4: Foreigners should not be allowed to buy land in [country]
Variable Description
The graph is produced by combining the ‘strongly agree’ and the
‘agree’ responses.
Graph 9.4d: Foreigners should not be allowed to buy land in
[country] (by location)
Narrative
16,396 respondents answered this question across the whole data
base: 11% said that they ‘strongly agree‘ that foreigners should not
have the right to purchase land; 18% said they ‘agree‘; 23% were
‘undecided’; 32% chose the answer ‘disagree‘; and 17 % said that they
‘strongly disagree‘ with the restriction of the sale of land to
foreigners.
The highest percentage of those who agree with this postulate
(‘strongly agreed and agreed’) was in Hungary (the total percentage in
Ozd - 64%, in Sopron - 58%). The lowest total percentage of those
who ‘agreed’ was observed in Jena (eastern Germany) - 1%.
We can distinguish two opposite clusters: 1. Where a significant
majority of surveyed young people supported restrictions for
foreigners. This includes both localities in Hungary, Slovakia and
Georgia; 2. Where a significant majority does ‘not agree’ with this.
This includes localities in eastern Germany, western Germany,
Denmark and Spain.
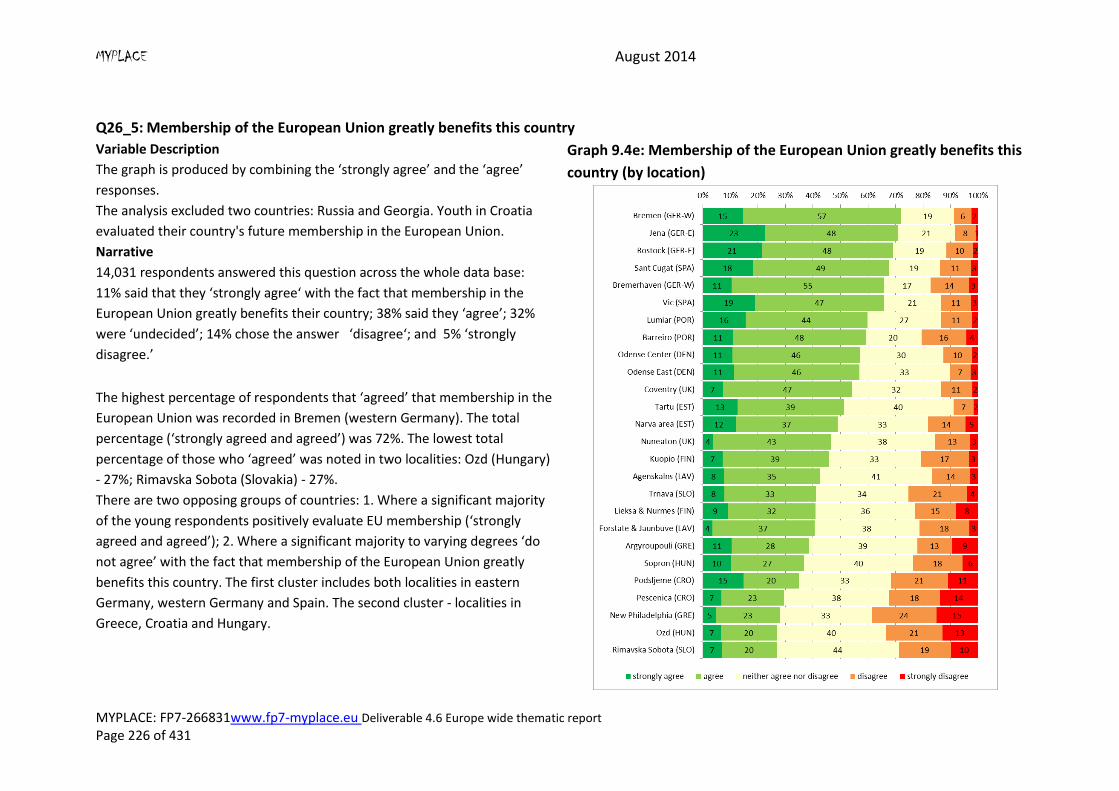
MYPLACE August 2014
MYPLACE: FP7-266831www.fp7-myplace.eu Deliverable 4.6 Europe wide thematic report Page 226 of 431
Q26_5: Membership of the European Union greatly benefits this country
Variable Description
The graph is produced by combining the ‘strongly agree’ and the ‘agree’
responses.
The analysis excluded two countries: Russia and Georgia. Youth in Croatia
evaluated their country's future membership in the European Union.
Graph 9.4e: Membership of the European Union greatly benefits this
country (by location)
Narrative
14,031 respondents answered this question across the whole data base:
11% said that they ‘strongly agree‘ with the fact that membership in the
European Union greatly benefits their country; 38% said they ‘agree’; 32%
were ‘undecided’; 14% chose the answer ‘disagree‘; and 5% ‘strongly
disagree.’
The highest percentage of respondents that ‘agreed’ that membership in the
European Union was recorded in Bremen (western Germany). The total
percentage (‘strongly agreed and agreed’) was 72%. The lowest total
percentage of those who ‘agreed’ was noted in two localities: Ozd (Hungary)
- 27%; Rimavska Sobota (Slovakia) - 27%.
There are two opposing groups of countries: 1. Where a significant majority
of the young respondents positively evaluate EU membership (‘strongly
agreed and agreed’); 2. Where a significant majority to varying degrees ‘do
not agree’ with the fact that membership of the European Union greatly
benefits this country. The first cluster includes both localities in eastern
Germany, western Germany and Spain. The second cluster - localities in
Greece, Croatia and Hungary.
MYPLACE August 2014
MYPLACE: FP7-266831 www.fp7-myplace.eu Deliverable 4.6 Europe wide thematic report Page 227 of 431
9.5 Multi-level Modelling
Citizenship is a complex phenomenon, its interpretations and meanings are varied in
different societies and in different periods, ranging from the legal norms to political
philosophy and sociological concepts. Global transformations, the formation of
transnational and multicultural streams, and increasing migration invite researchers to
rethink the notions of citizenship and its practical implementation.
The issue of ‘de-territorialisation’ (‘de-nationalisation’) and the creation of supra-national
identities and communities, as we have already examined, in theoretical literature is one of
the key issues surrounding the modern concept of citizenship. Social researchers attempt to
define indicators, which allow us to evaluate and approach citizenship in terms of
isolation/inclusivity, openness/closedness, and rigid sovereignty/global cooperation. For
further analysis, we have chosen several variables, which strongly reflect these tendencies:
- Support for ’ethnic nationalism‘ (Graph 9.3.a)
- Attitude to the country joining the European Union (Graph 9.4.e)
- Support for the sovereignty of the country (Graph 9.4.c)
What follows is an analysis of the 3 models based on Multi-level regression analysis.
To understand the basic social meaning that young people give to the concept of
‘citizenship‘ in all three models, we consider individual understandings of citizenship from
several angles:
Through the status characteristics: gender (Q54), age (recoded variable – age1),
income (Q82), education (recoded variable - Q61R), nationality (harmonised
variable – Q57R), citizenship (harmonised variable – Q22R), social class (parents’
social class - harmonised variable, including parents’ education and profession
etc.).
Through the experience of personal identity: experience of feeling oneself a
citizen (Q24).
Through the construction of the ‘true‘ citizen (Q25).
Through the construction of the ‘right‘ country where one wants to live (Q26).
The parameters within the offered differentiation define the predictors of the individual
level in the three models.
We chose the following contextual predictors for model-building:
Indicators that characterise the economic status of the country:
o Per capita GDP (in US dollars)
Indicators that characterise the labour force of the country (unemployment rate,
population size in locations)
Net immigration rate
MYPLACE August 2014
MYPLACE: FP7-266831 www.fp7-myplace.eu Deliverable 4.6 Europe wide thematic report Page 228 of 431
Indicators of the political regime, which indicate the political/historical context of
the current situation in the country.
In the further analysis, we consider ordinal variables measured by a 5 and higher points
system factiously ordinal and continuous.
9.5.1 Model А – Ethnic ‘Nationalism’
Our dependent variable is ethnic ‘nationalism‘ (Graph 9.3.a), which, according to many
researchers, strengthens anti-migrant and xenophobic attitudes. In this case, the concept of
citizenship contains several meanings: formal status, belonging, exclusion and inclusion,
local and global, individual rights and collective solidarity, and images of the ’other‘. These
meanings can be contradictory sometimes, but this variance illustrates the complexity of
citizenship in contemporary society. As one of the hypotheses, we analysed interaction
among the three indicators of citizenship that we defined (Brubaker, 1998).
Independent variables25
The following is a short description of social factors, which determine young people’s
support of ‘ethnic nationalism’. Along with traditional socio-economic indicators like age,
gender, education, profession, social class – we included the country of birth, citizenship
and ethnic groups in our analysis. Research on citizenship gains much importance also in the
context of research on young people as a particular age group. Traditionally, citizenship has
been associated with attaining a certain age to have rights and duties including those in the
family and labour force, as well as a new autonomous and responsible status (Thomson et
al., 2004). However, in recent years this process has become problematic due to a high level
of youth unemployment and new post-material values and lifestyles (Bauman, 2002). In this
context, young people are more likely to stay living with their parents longer, and not hurry
to start their own family and have their own responsibilities, redefining the category of
‘adulthood‘ as well as the concept of ‘citizen‘. Our understanding of citizenship is closely
connected to the adult status and marked by life events, such as leaving home, getting a job,
starting a family, acquiring legal rights and responsibilities. While building the model, we
assumed that moving into adulthood is associated with an increased focus towards civic
nationalism.
In the latter part of the 1900s, the problem of conceptualising national identity was
characterised by the shift towards the definition of national identity in post-socialist
democratic transition (Central and Eastern Europe, Eurasia). Some researchers have
described the national identity of this region as ‘ethnic’ (Brubaker; Schopflin, 1995). For
25
A list of independent variables at the individual level for all models is included in Appendix 1.
MYPLACE August 2014
MYPLACE: FP7-266831 www.fp7-myplace.eu Deliverable 4.6 Europe wide thematic report Page 229 of 431
example, Brubaker concludes that in these countries, nationalist movements contributed to
the creation of the state and the state itself was created in the interest of a particular
ethno-political group. In line with this logic, we can assume that in the new democracies of
Central and Eastern Europe there is little chance of sharing the patterns of civic identity. In
the context of the removal of the Communist ideology, by other opposing ideas and values,
ethnicity has remained the only factor that is present in the structure of the national
identity in the region (Schopflin, 1995).
As we have already noted above, ‘citizenship‘ refers both to the inclusion and exclusion of
people. It has become one of the most powerful ways of constructing boundaries in the
contemporary world. Nowadays, in any society, one can find marginalised groups, whose
rights to ownership and recognition can be questioned. In our models, we described these
groups through migrants and ethnic minorities. In particular, as the independent variables,
we considered the presence of friends of a different ethnicity in their close environment, a
composite index of the attitude towards minorities, and the feeling of threat caused by
respondents’ belonging to ethnic or religious minorities. Based on our findings, as a
hypothesis, we assumed that the positive experience of interethnic interaction minimises
the support for the concept of ethnic nationalism.
The variable ‘negative attitude to minorities‘ used in the building of the model is composite
from 7 items, which were recoded from the point of view of negative attitude:
Roma, Gypsies and travellers make a positive contribution to society (Q40_1)
The police should be stricter with Roma / Gypsies / travellers (Q40_2)
Jewish people talk too much about what happened to them during the Holocaust
(Q40_3)
Jewish people make an important contribution to society (Q40_4)
Muslims make a positive contribution to society (Q40_5)
It is right to be suspicious of Muslims (Q40_6)
Migrants greatly contribute to national cultural diversity (Q41_3).
Factor analysis composes all the 7 items in one factor explaining 41.3% of the variance.
Reliability analysis shows a high value of Cronbach alpha (α = 0, 756).
According to many researchers, xenophobia is often based on the lack of adequate
knowledge and understanding of politics. Therefore, besides the interest in politics based on
some theoretical notions (Pettigrew 1971: Fetzer 2000), we included in our model the
presence of wide extended social networks, which include ethnic minorities.
As a hypothesis, while choosing individual-level predictors in our model, we assumed that,
in accordance with the widely shared views, ethnic nationalism is also strongly associated
with political and social trust. There is a theoretical approach that asserts that a strong
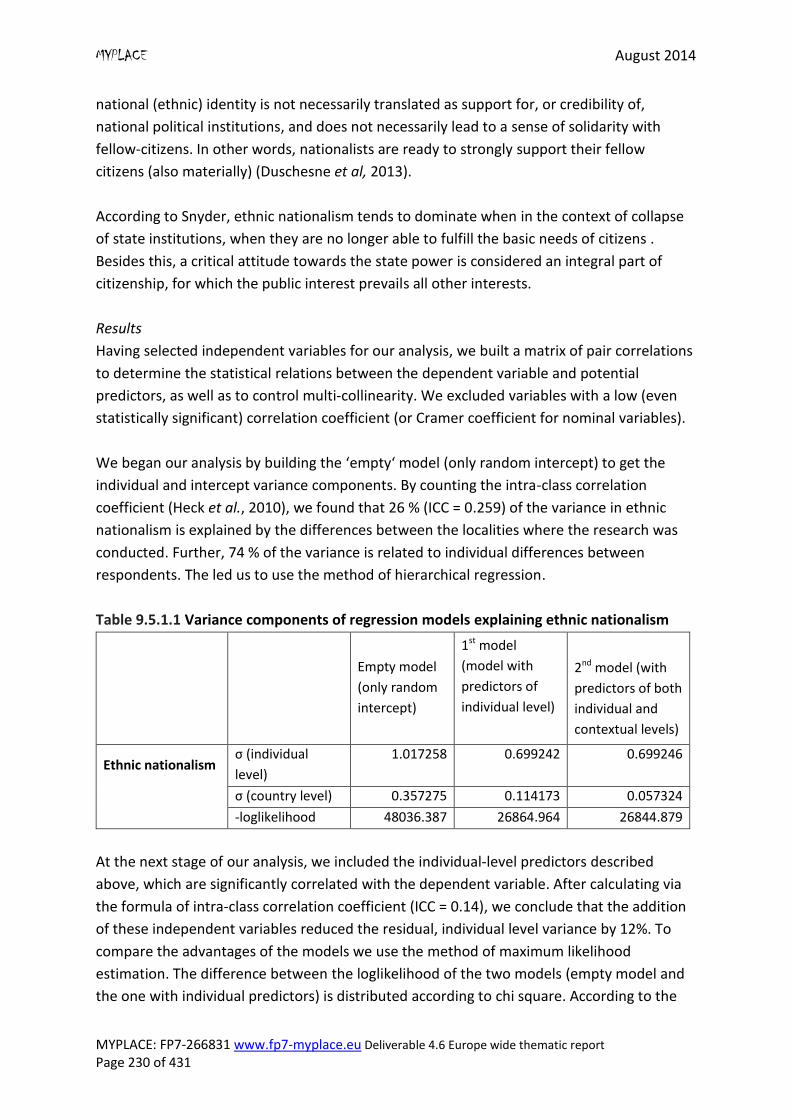
MYPLACE August 2014
MYPLACE: FP7-266831 www.fp7-myplace.eu Deliverable 4.6 Europe wide thematic report Page 230 of 431
national (ethnic) identity is not necessarily translated as support for, or credibility of,
national political institutions, and does not necessarily lead to a sense of solidarity with
fellow-citizens. In other words, nationalists are ready to strongly support their fellow
citizens (also materially) (Duschesne et al, 2013).
According to Snyder, ethnic nationalism tends to dominate when in the context of collapse
of state institutions, when they are no longer able to fulfill the basic needs of citizens .
Besides this, a critical attitude towards the state power is considered an integral part of
citizenship, for which the public interest prevails all other interests.
Results
Having selected independent variables for our analysis, we built a matrix of pair correlations
to determine the statistical relations between the dependent variable and potential
predictors, as well as to control multi-collinearity. We excluded variables with a low (even
statistically significant) correlation coefficient (or Cramer coefficient for nominal variables).
We began our analysis by building the ‘empty‘ model (only random intercept) to get the
individual and intercept variance components. By counting the intra-class correlation
coefficient (Heck et al., 2010), we found that 26 % (ICC = 0.259) of the variance in ethnic
nationalism is explained by the differences between the localities where the research was
conducted. Further, 74 % of the variance is related to individual differences between
respondents. The led us to use the method of hierarchical regression.
Table 9.5.1.1 Variance components of regression models explaining ethnic nationalism
Empty model
(only random
intercept)
1st model
(model with
predictors of
individual level)
2nd model (with
predictors of both
individual and
contextual levels)
Ethnic nationalism
σ (individual
level)
1.017258 0.699242 0.699246
σ (country level) 0.357275 0.114173 0.057324
-loglikelihood 48036.387 26864.964 26844.879
At the next stage of our analysis, we included the individual-level predictors described
above, which are significantly correlated with the dependent variable. After calculating via
the formula of intra-class correlation coefficient (ICC = 0.14), we conclude that the addition
of these independent variables reduced the residual, individual level variance by 12%. To
compare the advantages of the models we use the method of maximum likelihood
estimation. The difference between the loglikelihood of the two models (empty model and
the one with individual predictors) is distributed according to chi square. According to the
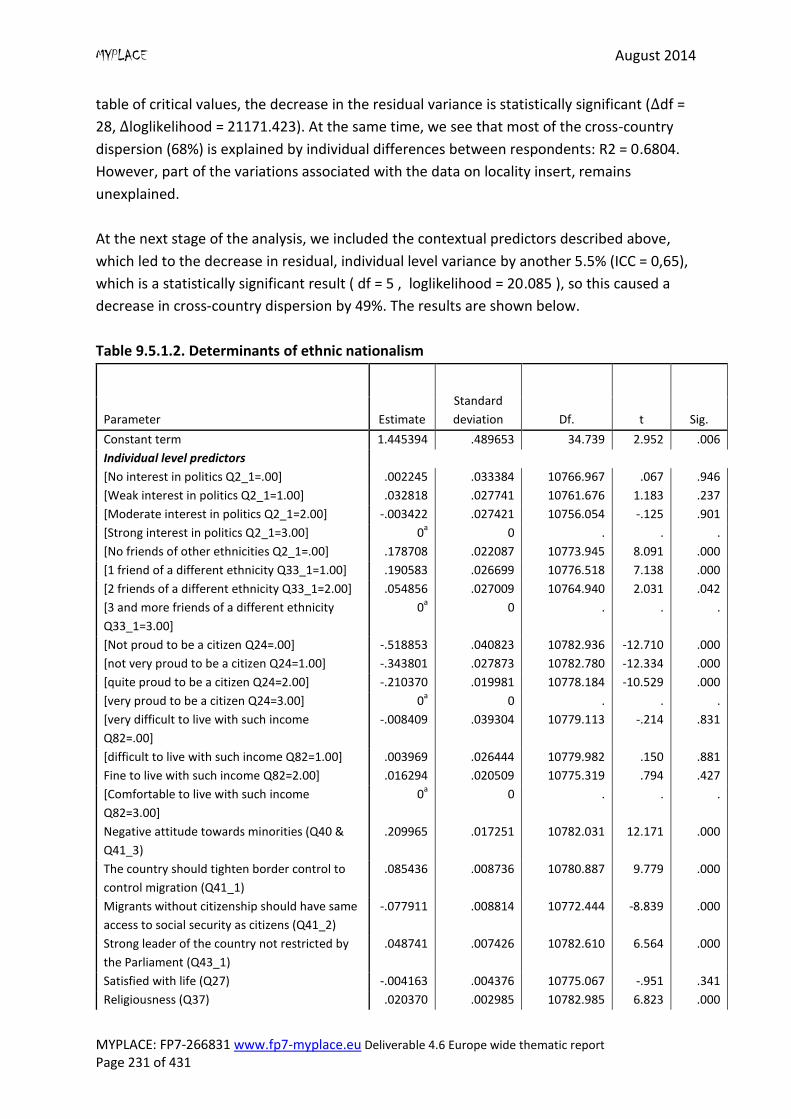
MYPLACE August 2014
MYPLACE: FP7-266831 www.fp7-myplace.eu Deliverable 4.6 Europe wide thematic report Page 231 of 431
table of critical values, the decrease in the residual variance is statistically significant ( df =
28, loglikelihood = 21171.423). At the same time, we see that most of the cross-country
dispersion (68%) is explained by individual differences between respondents: R2 = 0.6804.
However, part of the variations associated with the data on locality insert, remains
unexplained.
At the next stage of the analysis, we included the contextual predictors described above,
which led to the decrease in residual, individual level variance by another 5.5% (ICC = 0,65),
which is a statistically significant result ( df = 5 , loglikelihood = 20.085 ), so this caused a
decrease in cross-country dispersion by 49%. The results are shown below.
Table 9.5.1.2. Determinants of ethnic nationalism
Parameter Estimate
Standard
deviation Df. t Sig.
Constant term 1.445394 .489653 34.739 2.952 .006
Individual level predictors
[No interest in politics Q2_1=.00] .002245 .033384 10766.967 .067 .946
[Weak interest in politics Q2_1=1.00] .032818 .027741 10761.676 1.183 .237
[Moderate interest in politics Q2_1=2.00] -.003422 .027421 10756.054 -.125 .901
[Strong interest in politics Q2_1=3.00] 0a 0 . . .
[No friends of other ethnicities Q2_1=.00] .178708 .022087 10773.945 8.091 .000
[1 friend of a different ethnicity Q33_1=1.00] .190583 .026699 10776.518 7.138 .000
[2 friends of a different ethnicity Q33_1=2.00] .054856 .027009 10764.940 2.031 .042
[3 and more friends of a different ethnicity
Q33_1=3.00]
0a 0 . . .
[Not proud to be a citizen Q24=.00] -.518853 .040823 10782.936 -12.710 .000
[not very proud to be a citizen Q24=1.00] -.343801 .027873 10782.780 -12.334 .000
[quite proud to be a citizen Q24=2.00] -.210370 .019981 10778.184 -10.529 .000
[very proud to be a citizen Q24=3.00] 0a 0 . . .
[very difficult to live with such income
Q82=.00]
-.008409 .039304 10779.113 -.214 .831
[difficult to live with such income Q82=1.00] .003969 .026444 10779.982 .150 .881
Fine to live with such income Q82=2.00] .016294 .020509 10775.319 .794 .427
[Comfortable to live with such income
Q82=3.00]
0a 0 . . .
Negative attitude towards minorities (Q40 &
Q41_3)
.209965 .017251 10782.031 12.171 .000
The country should tighten border control to
control migration (Q41_1)
.085436 .008736 10780.887 9.779 .000
Migrants without citizenship should have same
access to social security as citizens (Q41_2)
-.077911 .008814 10772.444 -8.839 .000
Strong leader of the country not restricted by
the Parliament (Q43_1)
.048741 .007426 10782.610 6.564 .000
Satisfied with life (Q27) -.004163 .004376 10775.067 -.951 .341
Religiousness (Q37) .020370 .002985 10782.985 6.823 .000
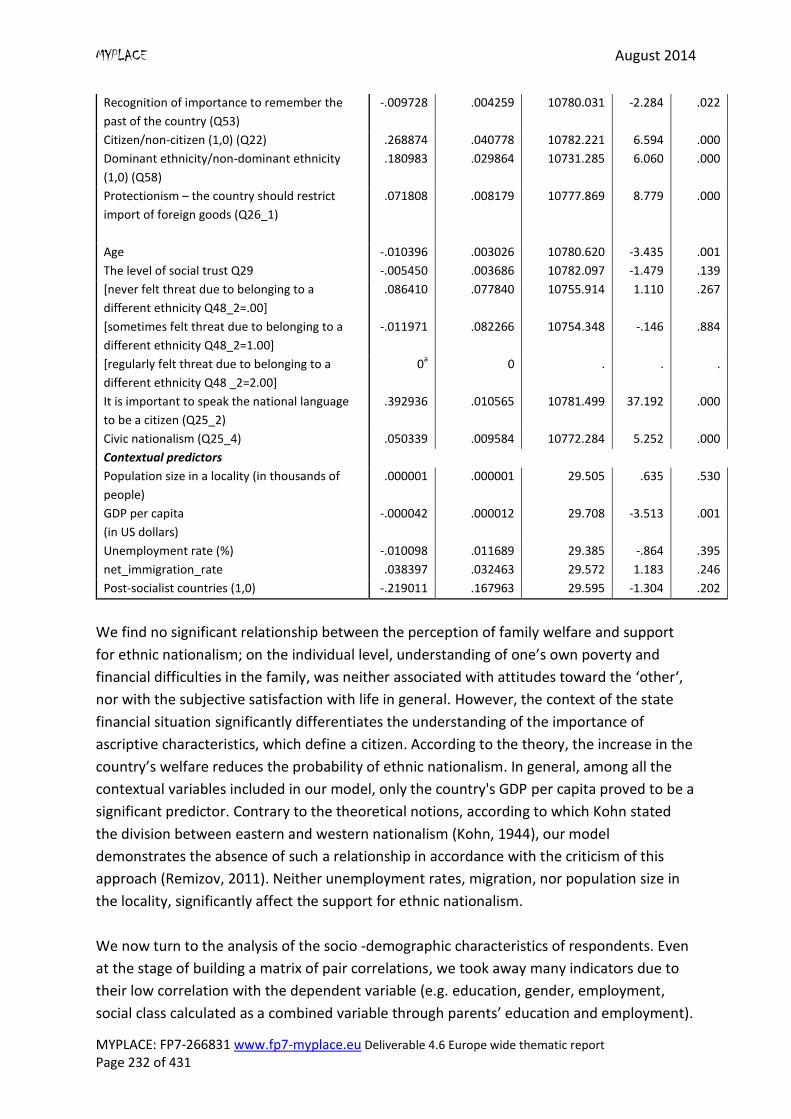
MYPLACE August 2014
MYPLACE: FP7-266831 www.fp7-myplace.eu Deliverable 4.6 Europe wide thematic report Page 232 of 431
Recognition of importance to remember the
past of the country (Q53)
-.009728 .004259 10780.031 -2.284 .022
Citizen/non-citizen (1,0) (Q22) .268874 .040778 10782.221 6.594 .000
Dominant ethnicity/non-dominant ethnicity
(1,0) (Q58)
.180983 .029864 10731.285 6.060 .000
Protectionism – the country should restrict
import of foreign goods (Q26_1)
.071808 .008179 10777.869 8.779 .000
Age -.010396 .003026 10780.620 -3.435 .001
The level of social trust Q29 -.005450 .003686 10782.097 -1.479 .139
[never felt threat due to belonging to a
different ethnicity Q48_2=.00]
.086410 .077840 10755.914 1.110 .267
[sometimes felt threat due to belonging to a
different ethnicity Q48_2=1.00]
-.011971 .082266 10754.348 -.146 .884
[regularly felt threat due to belonging to a
different ethnicity Q48 _2=2.00]
0a 0 . . .
It is important to speak the national language
to be a citizen (Q25_2)
.392936 .010565 10781.499 37.192 .000
Civic nationalism (Q25_4) .050339 .009584 10772.284 5.252 .000
Contextual predictors
Population size in a locality (in thousands of
people)
.000001 .000001 29.505 .635 .530
GDP per capita
(in US dollars)
-.000042 .000012 29.708 -3.513 .001
Unemployment rate (%) -.010098 .011689 29.385 -.864 .395
net_immigration_rate .038397 .032463 29.572 1.183 .246
Post-socialist countries (1,0) -.219011 .167963 29.595 -1.304 .202
We find no significant relationship between the perception of family welfare and support
for ethnic nationalism; on the individual level, understanding of one’s own poverty and
financial difficulties in the family, was neither associated with attitudes toward the ‘other‘,
nor with the subjective satisfaction with life in general. However, the context of the state
financial situation significantly differentiates the understanding of the importance of
ascriptive characteristics, which define a citizen. According to the theory, the increase in the
country’s welfare reduces the probability of ethnic nationalism. In general, among all the
contextual variables included in our model, only the country's GDP per capita proved to be a
significant predictor. Contrary to the theoretical notions, according to which Kohn stated
the division between eastern and western nationalism (Kohn, 1944), our model
demonstrates the absence of such a relationship in accordance with the criticism of this
approach (Remizov, 2011). Neither unemployment rates, migration, nor population size in
the locality, significantly affect the support for ethnic nationalism.
We now turn to the analysis of the socio -demographic characteristics of respondents. Even
at the stage of building a matrix of pair correlations, we took away many indicators due to
their low correlation with the dependent variable (e.g. education, gender, employment,
social class calculated as a combined variable through parents’ education and employment).
MYPLACE August 2014
MYPLACE: FP7-266831 www.fp7-myplace.eu Deliverable 4.6 Europe wide thematic report Page 233 of 431
Among all the socio-demographic indicators included in our model, age has the smallest
effect on the support for an ethnic understanding of citizenship (the degree of impact is
based on Student statistics (t), as Estimates are not standardised and defined by the unit
variable). Nevertheless, growing older reduces the role of the place of birth in the definition
of a citizen, as we predicted in our hypothesis.
A dominant position in the country, in terms of having citizenship and belonging to the
dominant ethnicity, increases the probability of ethnic nationalism. This is supported by a
theoretical hypothesis of a higher importance of national identity for people belonging to
the dominant ethnic group (Lewin-Epstein, Levanon, 2005). In our study, only 13% of
respondents from all the countries indicated different ethnicity, and among them, 26%
reported that at least sometimes they felt threatened due to belonging to the minority. This
may explain the fact that this independent variable does not differentiate the attitude
towards ethnic nationalism. In contrast, positive experience of cooperation, such as broad
ethnic networks, reduces the support for an ethnic concept of citizenship.
Some researchers recognise a discursive link between citizenship and religion (Omel’chenko,
2012). In our model, respondents confirmed the influence of religiousness on support for
the ethnic concept of citizenship: more religious people are more likely to consider
ascriptive characteristics as important for citizenship.
With regard to the influence of the cognitive component, this turned out to be statistically
insignificant. Recognition of the importance of cultural and historical heritage has a weak,
but decreasing effect on the dependent variable.
In analysing the relationship between ideas of the ‘right‘ structure of the world and support
for ethnic concept of citizenship, we admit that our model does not allow us to understand
the causal relationship, but only a pattern of interaction between the variables.
Value assets that determine the importance of formal citizenship are in a significant linear
relationship with our dependent variable. The lower the importance of citizenship, the
lower the importance of ethnic characteristics of citizenship. This finding is supported by the
research on Russian youth conducted by the research centre ‘Region‘(Russia) and the Centre
for Youth Studies (Russia). Their research shows that the nation state is recognised as an
‘imagined community’ (Anderson, 2001) that constitutes individual identity, according to
which the value of being a citizen of the nation, leads to the protection of its borders. A
logical and theoretically relevant finding is the observed relationship between negative
attitudes towards minorities and the choice of ‘ethnic citizenship‘. An increase by 1 unit of
negative attitude leads to an increase by 0.203 units of the significance of ascriptive
characteristics in the definition of the ‘right‘ citizen (both variables are measured by a 5-
point scale ranging from 0 to 4).
MYPLACE August 2014
MYPLACE: FP7-266831 www.fp7-myplace.eu Deliverable 4.6 Europe wide thematic report Page 234 of 431
Young people’s support for the closed nation state, focused on the minimisation of
migration, support for the national economy against international global economic streams,
segregation of migrants, and their distancing from the system of social security - increases
the probability of ethnic nationalism. As we have noted above, the post-socialist status of
the country is not significant in this case. However, the support for totalitarian autocratic
principles of the political system enforces ethnic nationalism.
Let us refer to our hypothesis on the interaction between all the three defined indicators of
citizenship. Coefficients of determination support this hypothesis. Thus, the ability to speak
the national language has the strongest effect on the dependent variable. This indirectly
supports the theory of Reeskens and Hooghe (2010), who in their study noted that the
language of nationalism is not present. At the same time, in accordance with Brubaker’s
argument, the growth of civic nationalism leads to the increase of ethnic nationalism.
9.5.2 Model В – Membership of the European Union greatly
benefits this country
The emergence of supra-national social institutions and the hegemony of rights of a human
and not a citizen, which are actively promoted by contemporary political and philosophical
thinkers, leads one to attempt to rethink and outline the borders of emerging transnational
identities.
From this point of view, it is interesting to analyse the respondents' assessment of the
significance of their countries joining the EU. Dependent variable - ‘the importance of
membership in the EU‘ (Graph 9.4.e), in the questionnaire it was asked as ‘Membership of
the European Union greatly benefits this country’ (Q26_5). The participants had to agree or
disagree with this statement. Respondents from 13 countries answered this question
(excluding Russia and Georgia).
Independent variables
In building the model, we used traditional indicators of SES and socio-demographic status.
Some studies state that people in managerial position, as well social activists, support the
idea of European integration and justify all the problems it may provoke. However, most of
the ‘ordinary’ citizens do not share this view. ’Less privileged people do not like the EU
because they fear a loss of national sovereignty and the breakup of the welfare state. They
do have these fears, but they are related more generally to globalisation, not specifically - or
in some cases, at all - to European integration. Regarding integration, what characterises
working class people is their sheer lack of interest in Europe, the evident sense that they
MYPLACE August 2014
MYPLACE: FP7-266831 www.fp7-myplace.eu Deliverable 4.6 Europe wide thematic report Page 235 of 431
simply do not pay attention to it, that they overlook it. European issues are just not salient‘
(Citizens' Reactions…, 2013).
Therefore, we assumed that socio-economic status is one of the important characteristics,
which is closely related to the support for EU membership. It partially supports the
theoretical assumption that higher levels of well-being and the high presence of the middle
class reduces the significance of nationalist ideas.
The idea of a united Europe is based on the assumption that all the citizens of European
countries consider themselves primarily as ‘Europeans’. Some scholars consider that
European identity is a phenomenon that was brought up in opposition to national feelings.
However, most people believe that European identity and national identity, in contrast, are
compatible and are positively correlated: ‘It is clear that national identity is not competing
with feeling oneself as European: on the contrary, national identity is for most citizens a
template for European identification. People (albeit with some notable exceptions) feel
European because they feel German, French, Italian, Spanish, Polish, Czech, etc.‘ (Citizens'
Reactions…, 2013). It comes from a study of national or European identity in the structure of
the dominant.
There are two research positions describing the attitude of citizens of EU member states to
membership in the EU. One position states that dissatisfaction with EU membership is due
to a lack of confidence in the supra-national institutions, in terms of their ability to solve the
problems of the country (Baranowsky, 2006). According to another point of view, on the
contrary, dissatisfaction is not driven by the economic and social processes of EU
membership, but by a low degree of trust in their national political institutions, as opposed
to the credibility of European institutions (Alexandrov, 2008).
Level of political trust was calculated as a unified variable, including trust in:
The head of government (Q7_3)
Parliament (Q7_8)
Political parties (Q7_13).
Reliability analysis shows a high value of Cronbach alpha (α = 0.847).
We also included in the model such indicators as respondent’s interest in events happening
in their city, country, and the world. The variable is composite from 5 items - How interested
would you say you are in issues concerning:
the neighbourhood you currently live in (Q1_1)
the city you currently live in (Q1_2)
the country you live in (Q1_3)
countries neighbouring the country you live in (Q1_4)
Europe (Q1_5)
Factor analysis composes all the 5 items in one factor explaining 56.7% of the variance.
Reliability analysis shows a high value of Cronbach alpha (α = 0.807).
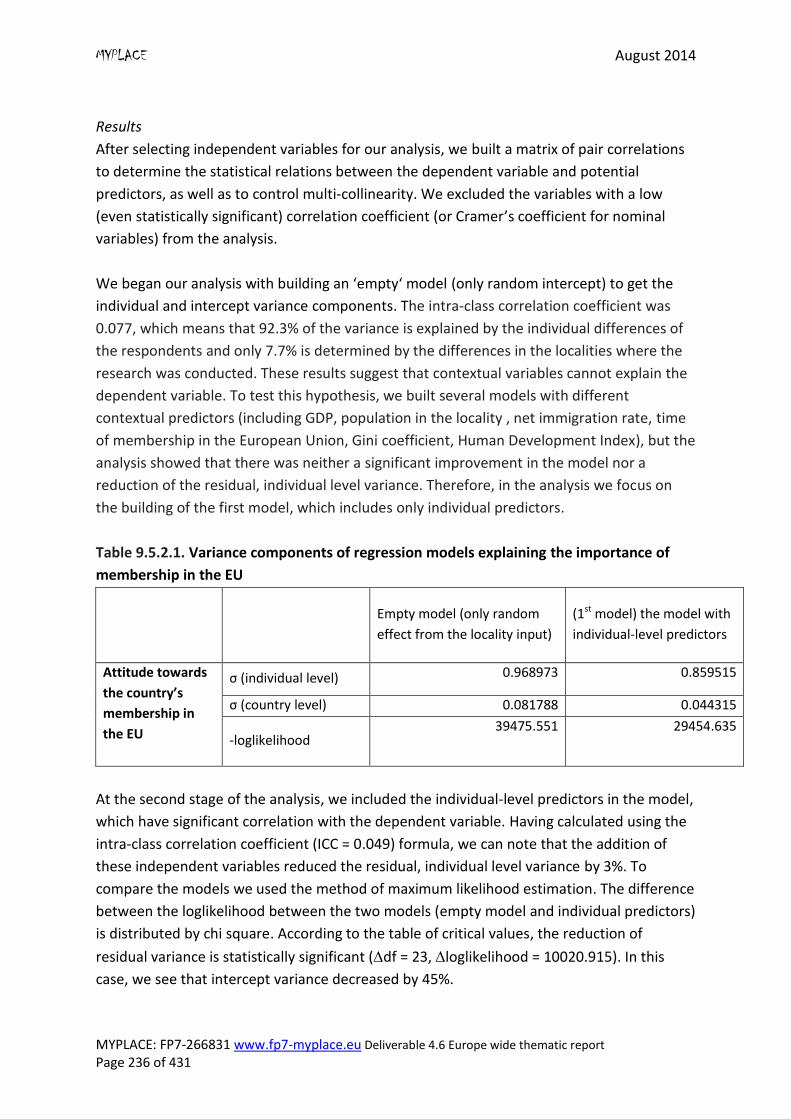
MYPLACE August 2014
MYPLACE: FP7-266831 www.fp7-myplace.eu Deliverable 4.6 Europe wide thematic report Page 236 of 431
Results
After selecting independent variables for our analysis, we built a matrix of pair correlations
to determine the statistical relations between the dependent variable and potential
predictors, as well as to control multi-collinearity. We excluded the variables with a low
(even statistically significant) correlation coefficient (or Cramer’s coefficient for nominal
variables) from the analysis.
We began our analysis with building an ‘empty‘ model (only random intercept) to get the
individual and intercept variance components. The intra-class correlation coefficient was
0.077, which means that 92.3% of the variance is explained by the individual differences of
the respondents and only 7.7% is determined by the differences in the localities where the
research was conducted. These results suggest that contextual variables cannot explain the
dependent variable. To test this hypothesis, we built several models with different
contextual predictors (including GDP, population in the locality , net immigration rate, time
of membership in the European Union, Gini coefficient, Human Development Index), but the
analysis showed that there was neither a significant improvement in the model nor a
reduction of the residual, individual level variance. Therefore, in the analysis we focus on
the building of the first model, which includes only individual predictors.
Table 9.5.2.1. Variance components of regression models explaining the importance of
membership in the EU
Empty model (only random
effect from the locality input)
(1st model) the model with
individual-level predictors
Attitude towards
the country’s
membership in
the EU
σ (individual level) 0.968973 0.859515
σ (country level) 0.081788 0.044315
-loglikelihood 39475.551 29454.635
At the second stage of the analysis, we included the individual-level predictors in the model,
which have significant correlation with the dependent variable. Having calculated using the
intra-class correlation coefficient (ICC = 0.049) formula, we can note that the addition of
these independent variables reduced the residual, individual level variance by 3%. To
compare the models we used the method of maximum likelihood estimation. The difference
between the loglikelihood between the two models (empty model and individual predictors)
is distributed by chi square. According to the table of critical values, the reduction of
residual variance is statistically significant (df = 23, loglikelihood = 10020.915). In this
case, we see that intercept variance decreased by 45%.
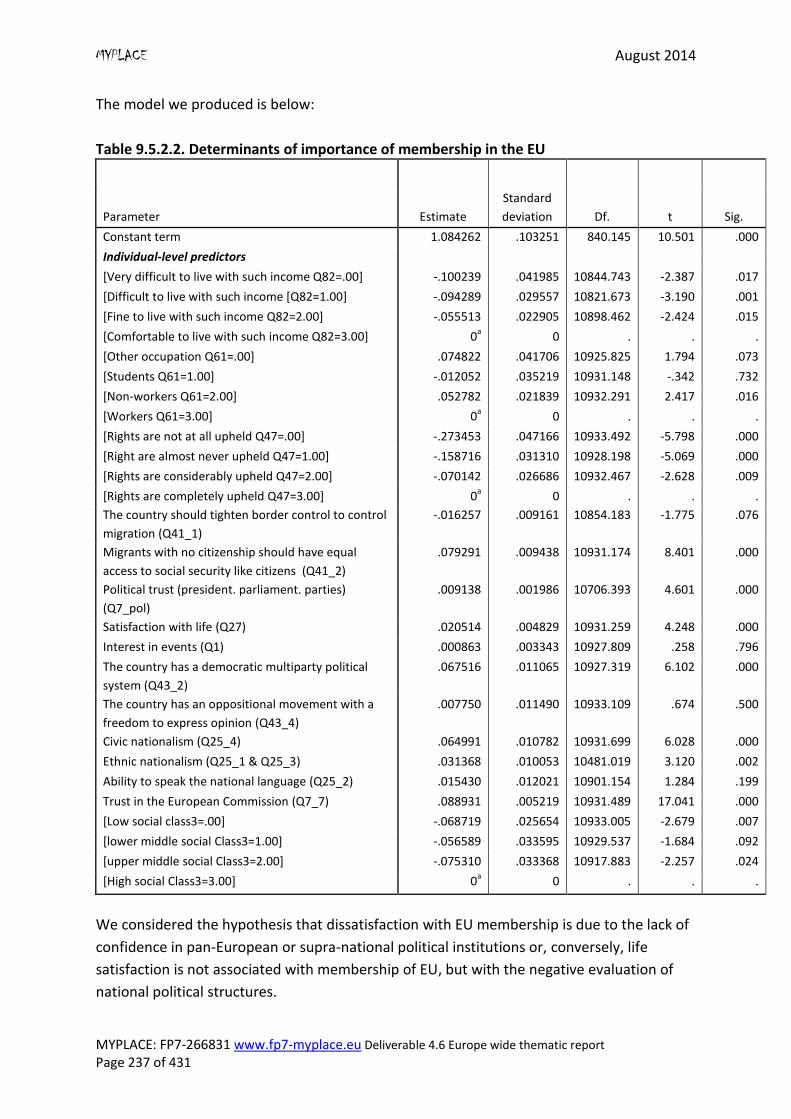
MYPLACE August 2014
MYPLACE: FP7-266831 www.fp7-myplace.eu Deliverable 4.6 Europe wide thematic report Page 237 of 431
The model we produced is below:
Table 9.5.2.2. Determinants of importance of membership in the EU
Parameter Estimate
Standard
deviation Df. t Sig.
Constant term 1.084262 .103251 840.145 10.501 .000
Individual-level predictors
[Very difficult to live with such income Q82=.00] -.100239 .041985 10844.743 -2.387 .017
[Difficult to live with such income [Q82=1.00] -.094289 .029557 10821.673 -3.190 .001
[Fine to live with such income Q82=2.00] -.055513 .022905 10898.462 -2.424 .015
[Comfortable to live with such income Q82=3.00] 0a 0 . . .
[Other occupation Q61=.00] .074822 .041706 10925.825 1.794 .073
[Students Q61=1.00] -.012052 .035219 10931.148 -.342 .732
[Non-workers Q61=2.00] .052782 .021839 10932.291 2.417 .016
[Workers Q61=3.00] 0a 0 . . .
[Rights are not at all upheld Q47=.00] -.273453 .047166 10933.492 -5.798 .000
[Right are almost never upheld Q47=1.00] -.158716 .031310 10928.198 -5.069 .000
[Rights are considerably upheld Q47=2.00] -.070142 .026686 10932.467 -2.628 .009
[Rights are completely upheld Q47=3.00] 0a 0 . . .
The country should tighten border control to control
migration (Q41_1)
-.016257 .009161 10854.183 -1.775 .076
Migrants with no citizenship should have equal
access to social security like citizens (Q41_2)
.079291 .009438 10931.174 8.401 .000
Political trust (president. parliament. parties)
(Q7_pol)
.009138 .001986 10706.393 4.601 .000
Satisfaction with life (Q27) .020514 .004829 10931.259 4.248 .000
Interest in events (Q1) .000863 .003343 10927.809 .258 .796
The country has a democratic multiparty political
system (Q43_2)
.067516 .011065 10927.319 6.102 .000
The country has an oppositional movement with a
freedom to express opinion (Q43_4)
.007750 .011490 10933.109 .674 .500
Civic nationalism (Q25_4) .064991 .010782 10931.699 6.028 .000
Ethnic nationalism (Q25_1 & Q25_3) .031368 .010053 10481.019 3.120 .002
Ability to speak the national language (Q25_2) .015430 .012021 10901.154 1.284 .199
Trust in the European Commission (Q7_7) .088931 .005219 10931.489 17.041 .000
[Low social class3=.00] -.068719 .025654 10933.005 -2.679 .007
[lower middle social Class3=1.00] -.056589 .033595 10929.537 -1.684 .092
[upper middle social Class3=2.00] -.075310 .033368 10917.883 -2.257 .024
[High social Class3=3.00] 0a 0 . . .
We considered the hypothesis that dissatisfaction with EU membership is due to the lack of
confidence in pan-European or supra-national political institutions or, conversely, life
satisfaction is not associated with membership of EU, but with the negative evaluation of
national political structures.
MYPLACE August 2014
MYPLACE: FP7-266831 www.fp7-myplace.eu Deliverable 4.6 Europe wide thematic report Page 238 of 431
However, both the hypotheses were only partly confirmed in our model. The strongest
effect (according to Student statistics (t)) on the recognition of the importance of
membership was confidence in the European Commission as an institution. The higher the
level of trust in the European Commission, the more positive the young people’s assessment
of the country’s membership in the EU. At the same time, the growth of confidence in the
national political institutions (government, parliament, political parties) causes an increase
in the support for EU membership.
According to researchers of European identity, our model shows that the increase in life
satisfaction leads to an increase in support for joining the EU. Similar logic is found in the
subjective understanding of one’s own economic well-being: the less satisfying it is, the
more negative attitude towards joining the EU the person has.
Additionally, the social capital of the respondent, employment, social class of parents, does
not have a significant effect on the dependent variable. It is also worth noting that the idea
of violation of human rights in the nation state only reduces the positive attitude towards
the EU. This may occur due to the loss of trust in social institutions that guarantee human
rights in general: if a country cannot provide an individual with human rights it means that
supra-national institutions have even less chance of providing them.
There is a theoretical hypothesis that the ethno-cultural factor in the EU functions as a
deconstruction of its unity, strengthening the dichotomy between a United Europe vs
Europe of nations (Berendeev, 2012; Popova, 2002). This idea about the relationship
between national identity and attitudes towards the countries joining the European Union
was not confirmed. If we consider ‘ethnic‘ and ‘civic‘ components that imply the national
construct of citizenship, the importance of civic and ethnic nationalism increases the
positive attitude towards EU membership. Also, the support for the democratic political
system and the absence of anti-immigrant ideas also increases the importance of joining the
European Union. This may create a basis for the further construction of transnational
identity.
9.5.3 Model C – The support for sovereignty
We have already noted the duality of citizenship, which describes characteristics of the
individual and community (for example, a nation state). In the latter characteristic of
citizenship the emphasis is on the construction of the ‘right‘ community and the world
around it. In the Russian case, such a duality of meanings is grasped by the concepts of
‘citizenship‘ and ‘nationality‘, where the first determines individual rights, and the second
the community’s characteristic.
MYPLACE August 2014
MYPLACE: FP7-266831 www.fp7-myplace.eu Deliverable 4.6 Europe wide thematic report Page 239 of 431
The collective element of citizenship includes relations with other countries, that is, the
distribution of power within the state and outside. From this perspective, in our study the
protection of the sovereign rights of the state has crucial meaning. However, the
sovereignty and the freedom of each state in international relations are limited by the
freedom of other states. In our study, we approach the concept of sovereignty by ignoring
possible conflicts with other countries.
Our dependent variable ‘the support for sovereignty’ (Graph 9.4.c) – was measured by the
five-point scale of agreement/disagreement with the following statement: [COUNTRY]
should follow its own interests, even if this leads to conflicts with other nations (Q26_3).
Independent variable
Quite often this dichotomy becomes the framework of thinking about the concepts of an
opened/closed state and democratic/authoritarian forms of rule. To understand these
relations, we included individual predictors, such as attitude towards minorities, support for
protectionism, and approval of a strong leader in the country not constrained by the
Parliament. We also considered belonging to the dominant nationality as a controlling
factor.
Researchers define citizenship as a part of identity politics, which acquires complex and
situational meanings. A nation ceases to be the only ‘imagined community’ and one’s own
identity can be based on any other category (religion, economic views, knowledge, ethnicity,
ideology). Two forms of interaction with the state are constructed:
- People feel national and care for it because they depend on what public policies provide
for them in terms of protection and empowerment. As Norbert Elias (2000) explained,
feeling as ‘we‘ is the manifestation of an identity that first relates to people’s units of
survival, to the communities, concreted and imagined, that give them the resources to go
on. Nations remain the template for political identification because they provide their
citizens with resources that secure their social rights (Elias, 2000). There is a shift from the
support for the nation state to more individual identities (Malakhov, 2005).
- One’s own identity is created through the attitude to the state, to its power structures, and
through the reproduction of ideas about the ‘ideal‘ country, in which one wants to live. In
our research we asked the respondents not only about their formal citizenship, but also how
proud they are to be citizens of their countries. This independent variable is used to assess
the impact of nation-oriented personal values on the nation-oriented state policy.
Researchers have already stressed the existing inequality in access to the rights among
different population groups (Lister, 2003). In this case, the question of citizenship concerns
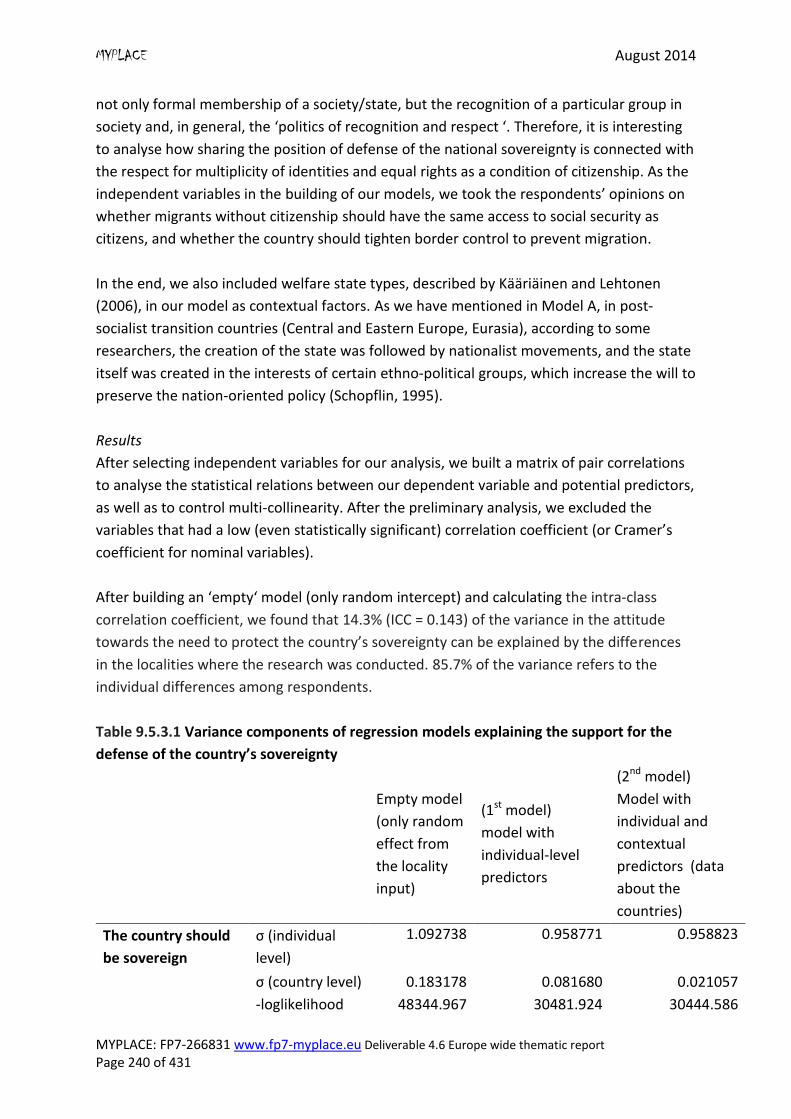
MYPLACE August 2014
MYPLACE: FP7-266831 www.fp7-myplace.eu Deliverable 4.6 Europe wide thematic report Page 240 of 431
not only formal membership of a society/state, but the recognition of a particular group in
society and, in general, the ‘politics of recognition and respect ‘. Therefore, it is interesting
to analyse how sharing the position of defense of the national sovereignty is connected with
the respect for multiplicity of identities and equal rights as a condition of citizenship. As the
independent variables in the building of our models, we took the respondents’ opinions on
whether migrants without citizenship should have the same access to social security as
citizens, and whether the country should tighten border control to prevent migration.
In the end, we also included welfare state types, described by Kääriäinen and Lehtonen
(2006), in our model as contextual factors. As we have mentioned in Model A, in post-
socialist transition countries (Central and Eastern Europe, Eurasia), according to some
researchers, the creation of the state was followed by nationalist movements, and the state
itself was created in the interests of certain ethno-political groups, which increase the will to
preserve the nation-oriented policy (Schopflin, 1995).
Results
After selecting independent variables for our analysis, we built a matrix of pair correlations
to analyse the statistical relations between our dependent variable and potential predictors,
as well as to control multi-collinearity. After the preliminary analysis, we excluded the
variables that had a low (even statistically significant) correlation coefficient (or Cramer’s
coefficient for nominal variables).
After building an ‘empty‘ model (only random intercept) and calculating the intra-class
correlation coefficient, we found that 14.3% (ICC = 0.143) of the variance in the attitude
towards the need to protect the country’s sovereignty can be explained by the differences
in the localities where the research was conducted. 85.7% of the variance refers to the
individual differences among respondents.
Table 9.5.3.1 Variance components of regression models explaining the support for the
defense of the country’s sovereignty
Empty model
(only random
effect from
the locality
input)
(1st model)
model with
individual-level
predictors
(2nd model)
Model with
individual and
contextual
predictors (data
about the
countries)
The country should
be sovereign
σ (individual
level)
1.092738 0.958771 0.958823
σ (country level) 0.183178 0.081680 0.021057
-loglikelihood 48344.967 30481.924 30444.586
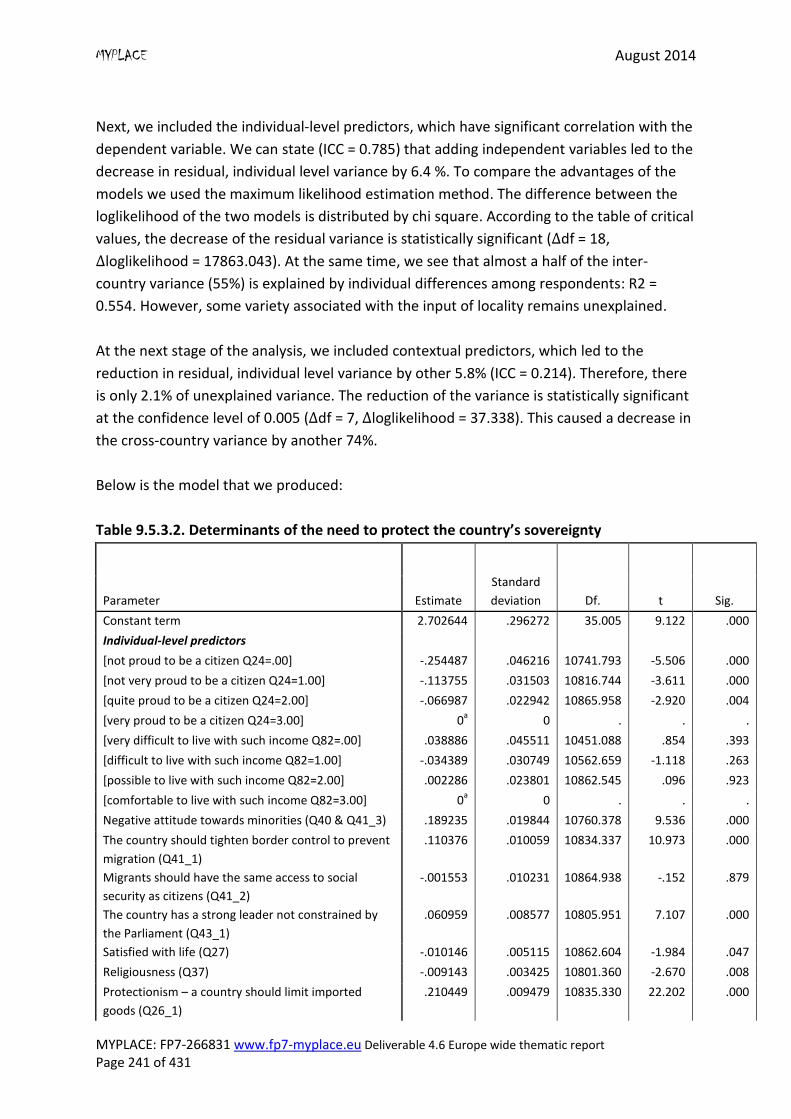
MYPLACE August 2014
MYPLACE: FP7-266831 www.fp7-myplace.eu Deliverable 4.6 Europe wide thematic report Page 241 of 431
Next, we included the individual-level predictors, which have significant correlation with the
dependent variable. We can state (ICC = 0.785) that adding independent variables led to the
decrease in residual, individual level variance by 6.4 %. To compare the advantages of the
models we used the maximum likelihood estimation method. The difference between the
loglikelihood of the two models is distributed by chi square. According to the table of critical
values, the decrease of the residual variance is statistically significant ( df = 18,
loglikelihood = 17863.043). At the same time, we see that almost a half of the inter-
country variance (55%) is explained by individual differences among respondents: R2 =
0.554. However, some variety associated with the input of locality remains unexplained.
At the next stage of the analysis, we included contextual predictors, which led to the
reduction in residual, individual level variance by other 5.8% (ICC = 0.214). Therefore, there
is only 2.1% of unexplained variance. The reduction of the variance is statistically significant
at the confidence level of 0.005 ( df = 7, loglikelihood = 37.338). This caused a decrease in
the cross-country variance by another 74%.
Below is the model that we produced:
Table 9.5.3.2. Determinants of the need to protect the country’s sovereignty
Parameter Estimate
Standard
deviation Df. t Sig.
Constant term 2.702644 .296272 35.005 9.122 .000
Individual-level predictors
[not proud to be a citizen Q24=.00] -.254487 .046216 10741.793 -5.506 .000
[not very proud to be a citizen Q24=1.00] -.113755 .031503 10816.744 -3.611 .000
[quite proud to be a citizen Q24=2.00] -.066987 .022942 10865.958 -2.920 .004
[very proud to be a citizen Q24=3.00] 0a 0 . . .
[very difficult to live with such income Q82=.00] .038886 .045511 10451.088 .854 .393
[difficult to live with such income Q82=1.00] -.034389 .030749 10562.659 -1.118 .263
[possible to live with such income Q82=2.00] .002286 .023801 10862.545 .096 .923
[comfortable to live with such income Q82=3.00] 0a 0 . . .
Negative attitude towards minorities (Q40 & Q41_3) .189235 .019844 10760.378 9.536 .000
The country should tighten border control to prevent
migration (Q41_1)
.110376 .010059 10834.337 10.973 .000
Migrants should have the same access to social
security as citizens (Q41_2)
-.001553 .010231 10864.938 -.152 .879
The country has a strong leader not constrained by
the Parliament (Q43_1)
.060959 .008577 10805.951 7.107 .000
Satisfied with life (Q27) -.010146 .005115 10862.604 -1.984 .047
Religiousness (Q37) -.009143 .003425 10801.360 -2.670 .008
Protectionism – a country should limit imported
goods (Q26_1)
.210449 .009479 10835.330 22.202 .000
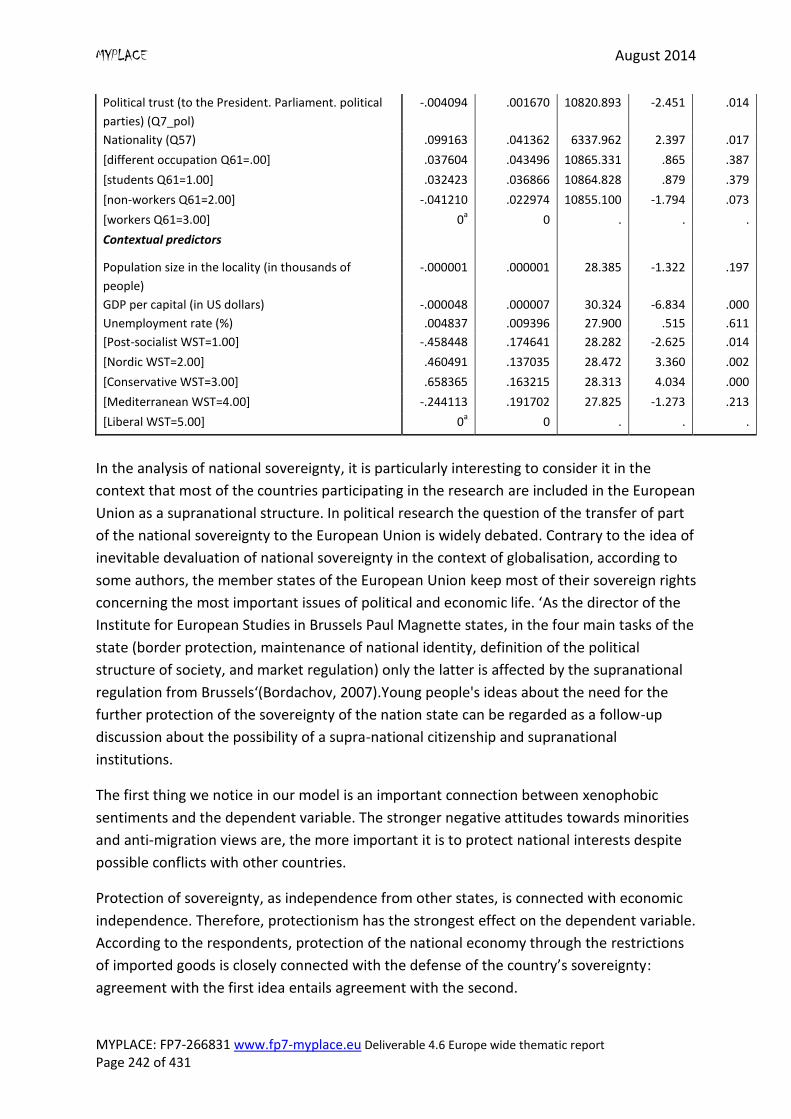
MYPLACE August 2014
MYPLACE: FP7-266831 www.fp7-myplace.eu Deliverable 4.6 Europe wide thematic report Page 242 of 431
Political trust (to the President. Parliament. political
parties) (Q7_pol)
-.004094 .001670 10820.893 -2.451 .014
Nationality (Q57) .099163 .041362 6337.962 2.397 .017
[different occupation Q61=.00] .037604 .043496 10865.331 .865 .387
[students Q61=1.00] .032423 .036866 10864.828 .879 .379
[non-workers Q61=2.00] -.041210 .022974 10855.100 -1.794 .073
[workers Q61=3.00] 0a 0 . . .
Contextual predictors
Population size in the locality (in thousands of
people)
-.000001 .000001 28.385 -1.322 .197
GDP per capital (in US dollars) -.000048 .000007 30.324 -6.834 .000
Unemployment rate (%) .004837 .009396 27.900 .515 .611
[Post-socialist WST=1.00] -.458448 .174641 28.282 -2.625 .014
[Nordic WST=2.00] .460491 .137035 28.472 3.360 .002
[Conservative WST=3.00] .658365 .163215 28.313 4.034 .000
[Mediterranean WST=4.00] -.244113 .191702 27.825 -1.273 .213
[Liberal WST=5.00] 0a 0 . . .
In the analysis of national sovereignty, it is particularly interesting to consider it in the
context that most of the countries participating in the research are included in the European
Union as a supranational structure. In political research the question of the transfer of part
of the national sovereignty to the European Union is widely debated. Contrary to the idea of
inevitable devaluation of national sovereignty in the context of globalisation, according to
some authors, the member states of the European Union keep most of their sovereign rights
concerning the most important issues of political and economic life. ‘As the director of the
Institute for European Studies in Brussels Paul Magnette states, in the four main tasks of the
state (border protection, maintenance of national identity, definition of the political
structure of society, and market regulation) only the latter is affected by the supranational
regulation from Brussels‘(Bordachov, 2007).Young people's ideas about the need for the
further protection of the sovereignty of the nation state can be regarded as a follow-up
discussion about the possibility of a supra-national citizenship and supranational
institutions.
The first thing we notice in our model is an important connection between xenophobic
sentiments and the dependent variable. The stronger negative attitudes towards minorities
and anti-migration views are, the more important it is to protect national interests despite
possible conflicts with other countries.
Protection of sovereignty, as independence from other states, is connected with economic
independence. Therefore, protectionism has the strongest effect on the dependent variable.
According to the respondents, protection of the national economy through the restrictions
of imported goods is closely connected with the defense of the country’s sovereignty:
agreement with the first idea entails agreement with the second.
MYPLACE August 2014
MYPLACE: FP7-266831 www.fp7-myplace.eu Deliverable 4.6 Europe wide thematic report Page 243 of 431
With regard to the connection between political trust and national sovereignty, a high level
of trust in political institutions reduces the support for national sovereignty.
Our analysis confirmed the hypothesis that the commitment to a more totalitarian regime
largely determines the attitude to the country’s independence. At the same time, the
analysis of contextual variables, in which we included welfare state types, shows the
following trend: for post-socialist countries the importance of national sovereignty is much
weaker than for Nordic and Conservative countries.
Satisfaction with life reduces the importance of sovereignty of the state. However, from the
point of material well-being, macro-economic indicators of the country’s welfare become
more important rather than individual financial difficulties.
Concerning the assumption that ethno-cultural factors are a differentiating phenomenon
based on national identity (Berendeev, 2012), we also find that belonging to the dominant
nationality increases the respondents’ agreement with the dominance of the state’s
interests. As we expected, the importance of the country’s sovereignty is associated with a
higher level of national pride: a higher level of pride of being a citizen determines a higher
level of significance of the dependent variable. In eastern Germany and Spain, the survey
showed young people’s lowest level of pride for their citizenship (the same for both
localities), and in these countries the support for sovereignty is much lower than in other
countries.
9.6 Summary Global transformations of contemporary society, the formation of transnational and
multicultural flows and migration processes are changing the traditional understanding of
citizenship as the formal belonging of an individual to the nation state. In this regard, in our
study we focused on various forms of contemporary citizenship, including certain values and
experience of self-determination. Taking into account the whole variety of interpretations
and meanings, we focused on the value assets of national identity, and young people’s
views on global and local state relations in cultural, economic and political dimensions.
Formation of one’s own civic views and position, is inextricably connected with the values of
young people and perception of oneself as a citizen of one’s country. Those who are most
proud of their citizenship status26 are the young people from locations in Georgia, Finland,
26 Our analysis is sensitive to nuances across our research locations where nationality, ethnicity and citizenship
have specific local connotations. The large ethnically Russian population in the Narva area in Estonia as well as
the Forstate and Jaunbuve districts in Latvia are particularly important in this respect. In addition, Coventry in
the UK is particularly ethnically diverse. Our analysis therefore uses a measure of ‘identity’ based on citizen,
nationality and ethnic status. Overall 80% of respondents can be attributed to the dominant majority26
of the
MYPLACE August 2014
MYPLACE: FP7-266831 www.fp7-myplace.eu Deliverable 4.6 Europe wide thematic report Page 244 of 431
Denmark and the UK with levels of pride around 90%. Approximately 60% of the young
people from Vic and Sant Cugat (both locations are in Catalonia) state that they are not
proud of their citizenship. Other locations where levels of pride in citizenship were less than
70% are: the Narva area (Estonia), Bremen (western Germany) Jena and Rostock (both in
eastern Germany), and Forstate & Jaunbuve (Latvia).
In general, in both western and eastern Germany, Denmark and Spain, young people placed
low importance on ascriptive indicators of citizenship. The strongest meaning of ethnic
citizenship was found in Vyborg (Russia). The ethnic role of citizenship is also strongly
supported in all the localities in Georgia and Greece. However, there is a strong difference
between localities in the following countries: Latvia (Agenskalns and Forstate and
Jaunbuve), Finland (Kuopio and Lieksa/Nurmes), Estonia (Narva and Tartu) and Slovenia
(Trnava and Rimavska Sobota). In these countries, indicators of support for ethnic
nationalism between the two different localities are significantly different.
In our study there are the two opposing groups of countries: one in which a significant
majority of young respondents fully, or partially, support the policy of protectionism
(Greece, Croatia , Slovakia and Portugal); and a second comprising those who do not agree
with it (eastern and western Germany, Denmark). For example, 77-79% of respondents in
the two localities in Greece support the idea that the state should protect its national
economy by limiting imported goods. In contrast, for example, in eastern Germany, the
proportion was only 12%. Support for the protection of sovereignty ranges from 19% in
Narva (Estonia) to 80% in New Philadelphia (Greece). The idea that the ‘country should
follow its own interests even if this leads to conflicts with other nations’, is supported by the
majority of respondents in locations in Georgia, Greece, Hungary and Portugal.A significant
majority do not agree with this position in Spain, eastern and western Germany.
The highest percentage of those who support restrictions for foreigners, for example, on
their right to purchase land, is in Hungary (from 58% to 64% of the respondents in both
localities). A similar view is supported in Georgia and Slovakia. In general, throughout the
whole dataset, this view is supported by 29% of young people. Thus, for example in eastern
Germany, in Jena, only 1% of people support this view. In eastern and western Germany,
Denmark and Spain, a significant majority did not agree with it.
Finally, an important factor in the understanding of citizenship is the evaluation of
membership of the EU. The overall results of the study demonstrated young people’s
country, i.e. not belonging to any minority citizen, national or ethnic group within the country though this
varies significantly, in Estonia for example, in the Narva area only 9% are classified as part of the majority
whereas in Tartu the figure is 96%.
MYPLACE August 2014
MYPLACE: FP7-266831 www.fp7-myplace.eu Deliverable 4.6 Europe wide thematic report Page 245 of 431
support for such integration (the total percentage of the full or partial agreement was 72%).
The highest rate was found in Bremen (westernern Germany), the lowest - in Ozd (Hungary)
and Rimavska Sobota (Slovakia) - 27%. A significant majority of young respondents positively
evaluate EU membership in eastern Germany, western Germany and Spain. However, in
Greece, Croatia and Hungary young people mostly disagree with it.
If we sum up these trends, we can identify a cluster of countries where most young people
share the idea of the nation state in its classical sense: Greece, Hungary, Slovakia, Portugal,
Georgia. There is also a group of countries where young people prefer other state
formations that are not rooted in the protection of "national interests”.
The availability of foreign films, music and books contributes to the development of national
culture received the greatest support in Coventry (UK). Again, there is a clear difference
between countries where a significant majority of young people see the positive impact of
foreign cultural models on the development of national culture (Portugal, eastern and
western Germany, UK) and countries, where young people do not support this view (Russia
and Georgia).
In our further analysis, using Multilevel Modeling, we analysed three models, which, in our
opinion, have the strongest differentiating impact on the approach to citizenship: support
for ‘ethnic nationalism‘; ’the importance of the country’s membership in the EU‘; and ‘the
importance of the protection of national sovereignty’.
The first model was based on the analysis of social factors that lead to young people’s
support for ethnic nationalism. It should first be noted that there is an intersection of
ethnic, civil and cultural indicators of citizenship. Thus, the ability to speak the national
language and its relevance for civic nationalism, is associated with ethnic nationalism.
Contextual characteristics of the position of the country and its well-being increase or
decrease the probability of ethnic nationalism. Of the contextual variables included in our
model, the country's GDP per capita has the highest impact on the importance of ethnic
citizenship: the higher the GDP, the higher the support for ethnic nationalism.
Being a citizen of the country and belonging to the dominant ethnic group increases the
probability of ethnic nationalism. The importance of the status of citizenship for a young
person is in a significant linear relationship with support for the concept of ethnic
nationalism. The lower it is, the lower the importance of ethnic characteristics of citizenship.
There is also a direct relationship between negative attitudes towards minorities and
preference for the ’ethnic concept‘ of citizenship. In contrast, the positive experience of
inter-ethnic interaction and wider inter-ethnic networks reduces the relevance of the ethnic
concept of citizenship.
MYPLACE August 2014
MYPLACE: FP7-266831 www.fp7-myplace.eu Deliverable 4.6 Europe wide thematic report Page 246 of 431
Young people’s support for a closed image of the nation state, strict control of migration,
protection of the national economy against global economic flows and segregation of
migrants increase the probability of ethnic nationalism. Contrary to our expectations, the
post-socialist status of the country was not significant. However, support for totalitarian or
autocratic state forms reinforces ethnic nationalism.
The socio-demographic characteristics of the respondents (education, gender, age,
employment, social class) have no significant effect on the adoption of the ethnic concept of
citizenship.
The second model was based on the assessment of the importance of EU membership.
Confidence in pan-European or supra-national political institutions has an interesting effect
on the evaluation of membership of the EU. Trust in the European Commission leads to
support for EU membership. However, the same trend is found in relation to the national
political institutions (government, parliament, political parties).
Violation of human rights in the nation state only reduces positive attitudes towards
membership of the EU. This may occur due to the general loss of confidence in social
institutions as providers of human rights. A positive attitude towards EU membership not
only increases social capital (employment, social class), but also a subjective view
onmaterial well-being and the overall level of satisfaction with life.
The importance of both civic and ethnic nationalism increases the positive attitude towards
EU membership. Again this confirms the importance of both ’ethnic‘ and ‘civic’ components
in the understanding of citizenship.
At the same time, support for a democratic political system and the lack of anti-migrant
sentiments also leads to the positive assessment of membership of the EU. This may create
the basis for the further construction of transnational identity.
The third model is based on the understanding of the prioritisation of national sovereignty.
Support for the idea of sovereignty is directly related to the xenophobic attitudes of our
respondents. Strong anti-migration sentiment leads to stronger support for the protection
of the ‘national interests‘, such as the need to be guided by public interest despite possible
conflicts with other countries (and this applies both to the political and economic
sovereignty). At the same time, belonging to the dominant ‘group’ and satisfaction with the
status of a citizen of the country increase respondents’ agreement with the dominance of
state interests. The level of trust in the national political institutions also has an interesting
effect; a low level of trust increases the will for political and economic sovereignty
MYPLACE August 2014
MYPLACE: FP7-266831 www.fp7-myplace.eu Deliverable 4.6 Europe wide thematic report Page 247 of 431
In contrast, the factor of the country's financial well-being is very significant; the more
financially successful the state, the less support for the idea of the national sovereignty.
Moreover, it is macro-economic indicators that are important here - individual poverty or
wealth do not play a key role. Similarly, an increasing level of satisfaction with life in general
reduces the importance of the protection of the sovereign rights of the state.
References
Anderson, B. (2001) Imagined Communities. Moscow: Canon Press - C, Kuchkovo Field,
Baranowsky, V.G. (2006) European Community in international relations.
Bauböck, R., Perchinig, B., Sievers, W. (2009) (eds). Citizenship Policies in the New Europe.
Amsterdam: IMISCOE / Amsterdam University Press.
Bauman, Z. (2002) The Individualized Society / Per. from English. ed VL Inozemtseva .
Moscow: Logos,
Berendeev, M. (2012) "European identity" today: the category of political practice or
discourse? Bulletin of the Baltic Federal University. Kant. 6. pp. 70-79
Bordachov, T. (2007) Evolution of the European Union and Russia-EU relations nowadays /
The Club of the world political economy. URL: http://www.wpec.ru/text/200708291310.htm
Brubaker, R. (1992) Citizenship and Nationhood in France and Germany. Cambridge, MA:
Harvard University Press.
Brubaker, R. (2004) Ethnicity without Groups. Harvard, Harvard University Press
Brubaker, R. (1998) Myths and Misconceptions in the Study of Nationalism. from The State
of the Nation. Ernest Gellner and the Theory of Nationalism. UK.
Duchesne, S., Frazer, E., Haegel, F. and Van Ingelgom, V. (eds) (2013) Citizens' Reactions to
European Integration Compared: Overlooking Europe. Basingstoke: Palgrave Macmillan
Crowley, H. et al. (1997) Citizenship: Pushing the Boundaries. Feminist Review. 57 (1)
Delanty, G. (2000) The Resurgence of the City in Europe?: The Space of European
Citizenship. In Isin. E. F. (ed.) (2000) Democracy, Citizenship and the Global City. London:
Routledge pp. 79-92
Elias, N. (2000) The Civilizing Process. Sociogenetic and Psychogenetic Investigations. Revised
edition. Oxford: Blackwell.
Ellison, N. (1997) Towards a new social politics: citizenship and reflexivity in late modernity.
Sociology. 31 (4): pp. 697-717
MYPLACE August 2014
MYPLACE: FP7-266831 www.fp7-myplace.eu Deliverable 4.6 Europe wide thematic report Page 248 of 431
Gaventa, J. (2009) Exploring citizenship, participation and accountability. IDS bulletin. 33 (2):
pp. 1-14
Habermas, J. des Neohistorismus, G.. Ein Gesprach mit JM Ferr i (1990) Kleine politischen
schriften. F / am-Mein.
Haste, H. (2004) Constructing the Citizen Political Psychology. 25 (3): pp. 413-439
Heater, D. (1999) What is Citizenship? Cambridge: Polity Press
Heck, R. H., Thomas S. L., Tabata L. N. (2010) Multilevel and longitudinal modeling with IBM
SPSS. New York: Routledge.
Hoffman, J. (2004) Citizenship Beyond the State. Sage
Honohan, I. (2002) Civic Republicanism. Routledge, London.
Hopkins, N., Blackwood L. (2011) Everyday citizenship: Identity and recognition / / Journal of
Community and Applied Social Psychology. 21 (3): pp. 215-227.
Ignatieff, M. (1993) Blood and Belonging: Journeys into the New Nationalism. N.Y: Farrar,
Straus and Giroux.
Interpassivity. Desire. Multiculturalism / Per. from English. Smirnova; ed. Mazin B. and G.
Rohonyan. St. Petersburg. : Aletheia, 2005
Kääriäinen, J. and Lehtonen, H. (2006) The Variety of Social Capital in Welfare Sate Regimes
‐ A Comparative Study of 21 Countries. European Societies. 8(1): pp. 27-57
Keating, M. (1996) Nations against the State: The New Politics of Nationalism in Quebec,
Catalonia and Scotland. New York, St. Martin's Press,
Kohn, H. (1994) The Idea of Nationalism. A Study in Its Origin and Background. London:
Macmillan.
Kukathas, C. (2009) Theoretical Foundations of Multiculturalism. URL:
http://inliberty.ru/library/study/327/
Kuzio, T. (2002) The myth of the civic state. A critical survey of Hans Kohn’s framework for
understanding nationalism. Ethnic and Racial Studies. 25(1): pp. 20–39
Kymlicka, W. (1995) Multicultural Citizenship: A Liberal Theory of Minority Rights. New York:
Oxford University Press
Kymlicka, W. (2001) Politics in the Vernacular: Nationalism, Multiculturalism, and
Citizenship. Oxford: Oxford University Press.
Lakić, N. (2011) Is globalization a challenge or a threat to nation-states as a dominant form
of polity? Western Balkans Security Observer 6 (21): pp. 6-17
Lewin-Epstein, N., Levanon, A. (2005) National identity and xenophobia in an ethnically
divided society. In UNESCO: National Identity and attitudes toward migrants. Findings from
the ISSP. International Journal in Multicultural Societies. 7 (2)
MYPLACE August 2014
MYPLACE: FP7-266831 www.fp7-myplace.eu Deliverable 4.6 Europe wide thematic report Page 249 of 431
Lister, R. A (2002) Politics of recognition and respect: Involving people with experience in
poverty in decision making that affects their lives. Social Policy and Society. 1: pp. 37 – 46
Lister, R. Citizenship (2003) Feminist Perspectives. 2 ed. Palgrave: Macmillan, 2003
Malakhov, V.S. (2005) Nationalism as a political ideology. Moscow: KDU.
Marshall, T. (2006) Citizenship and social class. The Welfare State Reader. Polity Press,
Bristol. pp. 30-39
Miller, D. (2000) Citizenship and National Identity. Cambridge: Polity Press.
Miller, D. (1990) Market, state, and community: Theoretical foundations of market socialism.
Oxford University Press
Mouffe, C. (ed.) (1992) Dimensions of Radical Democracy: Pluralism, Citizenship, Community.
Verso, London and New York.
Mouffe, C. (2005) The return of the political. Verso: London/New York
Oldfield, A. (1990) Citizenship and community: Civic republicanism and the modern world.
London: Routledge
Pettit, P. H. (1997) Republicanism: A Theory of Freedom and Government. Oxford University
Press, Oxford
Pichler, F. (2014) European Identity: Conceptual Approaches. URL: www.cinefogo. cuni.cz /
getfile.php? & id_file = 87
Popova, O.V. (2002) Political identity in the transformation of society. St. Petersburg, Univ
State University
Putnam, R. (1999) Bowling Alone. New York, Simon and Shuster
Reeskens, T., Hooghe, M. (2010) Beyond the civic-ethnic dichotomy. Investigating the
structure of citizenship concepts across 13 OECD countries. Nations and Nationalism. 16(4):
pp. 579-597.
Remizov, M. (2011) Russian civic nationalism against neo-feudalism. Issues of nationalism. 5.
Riley, S., Morey, Y. and Griffin, C. (2010) The 'Pleasure Citizen': Analysing Partying as a Form
of Social and Political Participation. Young. 18 (1): pp. 33-54
Sassen, S. (2002) Towards Post-National and Denationalized Citizenship in Isin E. and Turner
B. eds. (2002) Handbook of Citizenship Studies. Sage, pp. 277-292
Schopflin, G. (1995) Nationalism and Ethnicity in Europe, East and West. Nationalism and
Nationalities in the New Europe / CA Kupchan Ed. Ithaca, NY: Cornell University Press, 1995.
pp. 37 - 65
Seidman, G. (1999) Gendered Citizenship: South Africa's Democratic Transition and the
Construction of a Gendered State. Gender and Society (13) 3. pp. 287-307
MYPLACE August 2014
MYPLACE: FP7-266831 www.fp7-myplace.eu Deliverable 4.6 Europe wide thematic report Page 250 of 431
Shulman, S. (2002) Challenging the civic/ethnic and West/East dichotomies in the study of
nationalism. Comparative Political Studies. 35 (5)
Stevenson, N. (2001) (ed.) Culture and Citizenship. Sage
Stevenson, N. (2003) Cultural Citizenship in the Cultural Society: A Cosmopolitan Approach.
Citizenship Studies. 7 (3): pp. 331-348
Thomson, R., et al.(2004) Inventing Adulthoods: a Biographical Approach to Understanding
Youth Citizenship. The Sociological Review 52(2): pp. 218-239.
Turner, B. S. (1999) The Sociology of Citizenship. London: Sage
Urry, J. (2012) Sociology beyond societies: types of mobility for the XXI century. Ed.: Higher
School of Economics
Walzer, M. (2000) On Toleration. Moscow: Idea
Young, I. (1989) Polity and group difference: A critique of the ideal universal citizenship.
Ethics. 99: pp. 250-274
Malakhov, V. (2014) Kul’turnye razlichiia I politicheskie granitsy v epokhu global’nykh
migratsii /Vladimir Malakhov: Novoe literaturnoe obozrenie. Institut filosofii.
Kozlova, A. A. (2005) (ed.) O patriotizme I grazhdanstvennosti. SPB: EleksisPrint
Omel’chenko, E. L. (2012) Kak nauchit’ lyubit’ rodinu? Diskursivnye praktiki patrioticheskogo
vospitaniia molodezhi. In S chego nachinaetsya rodina: molodezh’ v labirintakh patriotizma/
Eds. Omel’chenko, E. and Pilkington, H. (2012) Ul’ianovsk: Ul’ianovskii gosudarstennyi
universitetpp. 263-310.
Yak, B. (2006) Mif grazhdanskoi natsii. Prognozis 2 (6)
MYPLACE August 2014
MYPLACE: FP7-266831 www.fp7-myplace.eu Deliverable 4.6 Europe wide thematic report Page 251 of 431
Chapter 10: Social networks, gender relationships and
sexuality
Early in the MYPLACE questionnaire, the section ‘Social networks, gender relationships and
sexuality‘, contains two questions aiming at a general assessment of the society the
respondents live in were asked. The first one focuses on trust and the second one on
people`s readiness to help others. The main part of this questionnaire section consists of
three questions on the frequency and way of contact (in person or via social networks,
media) to close friends as well as the diversity between the respondents and their friends.
Further on, some provoking statements were implemented in this section yielding at
enlightening the respondent`s attitudes towards women`s and homosexuals` rights and
positions in society.
Key Findings on social networks, gender relationships and
sexuality of national reports
There is no general archetype to classify the empirical results related to social networks,
gender relationship and sexuality across all the fourteen countries and 30 research locations
included in the MYPLACE project. The analysis is initially undertaken at the locational level
as the data for each location is representative. Subsequent analysis examines the extent to
which there are similarities or differences between the locations within each country. There
are two important caveats here: firstly there are four research locations in Germany, two in
eastern Germany and two in western Germany, for this reason we talk of “15 countries” to
differentiate the data. Secondly, in aggregating the data in this way we do not assert that it
is nationally representative. It cannot be as these reseach sites were chosen purposively
and the data is only representative of them and not of any national unit. Hence we are
examining the extent to which these locations, selected to contrast with each other within a
country, show similarities or difference. With this qualification we are able to assert that:
none of the research hypotheses, that better educated young people, coming from higher
social classes,
have higher trust in other people,
are embedded in a network of friends with a highly diverse pattern are more supportive towards gender equality and
accept homosexuality and
accept the right of women for abortion concerned, have been falsified by the empirical findings.
However if we focus only on
MYPLACE August 2014
MYPLACE: FP7-266831 www.fp7-myplace.eu Deliverable 4.6 Europe wide thematic report Page 252 of 431
a single topic out of the three sub themes (either social networks, or gender relationship or sexuality) across all countries or
one case (= country), but then comprising all three sub themes (social networks, gender relationship and sexuality),
general patterns become more visible.
Last but not least, there were only slight differences between the two sites of each of the 15
countries, if any. Mostly these differences can be explained by different socio-economic
conditions of the sites.
First coming to the key findings related to social networks:
Here we distinguish between the network of friends and the general trust in people (= social
trust).
In five out of 15 countries the social trust of young people is comparably low (Croatia,
eastern Germany, Greece, Latvia, Russia). In all of the 15 countries, the general pattern is
that better educated young people, quite often accompanied by membership to upper
social classes, tend to have higher trust in other people. The only exception is eastern
Germany, where better educated, people have a lower level of social trust. Religious young
people have lower trust to other people (e.g. in Georgia).
Concerning the interaction with friends, in all 15 countries we find a relatively high level of
networks of friends. What is interesting is the level of diversity of these “mate” networks (in
terms of socio-economic backgrounds, political views, gender). It is interesting to note, that
diverse political views do not construct a criteria for inclusion/exclusion as well as the
gender, whereas the level of education is influencing very much the level of diversity of the
friends´ networks. Furthermore, members of upper social classes in general hold a higher
diversity in friendship networks.
Concerning the intensity of interaction with friends, young males, unmarried, in education,
have a higher level of interaction with close friends (UK case). Furthermore, there is a
positive correlation between the usage of social media and a broad network of friends
(Russia, western Germany).Finally but not least: The older the young people are, the
broader is their network (Finland).
Concerning the sub theme, gender relationship, the supporters of equal opportunities for
men and women in the labour market and in politics have a vast majority in all 15 countires.
However there a some major constraints, regarding to
male/female views
ethnicity
religion.
MYPLACE August 2014
MYPLACE: FP7-266831 www.fp7-myplace.eu Deliverable 4.6 Europe wide thematic report Page 253 of 431
Differences between young men and young women: In some countries, young women tend
to support gender equality (Finland, Georgia, eastern Germany) whereas in Greece and
Russia men generally support patriarchal views. Western Germany is an exception insofar,
as young women prioritise men in the labour market, when jobs are scarce.
Different ethnicities and religions could play an important role for the question of equal
opportunities: For example in Denmark, young Muslims have a less equalitarian attitude
than Christians or non-believers. In Latvia young people from the Russian minority again
have more conservative views about equal opportunities for men and women.
The sub theme sexuality has to be, split between the attitudes of young people towards
homosexuality and towards the right of women for abortion. In six countries (Croatia,
Estonia, Greece, Hungary, Russia and Slovakia), the majority of respondents are against
homosexuality. Of course there are differences between the cases: Women are more
tolerant with regard to homosexuality than men (e.g. western and eastern Germany,
Finland, Greece), as well as high educated youths (Croatia, UK). In contrast young Muslims
reject homosexuality more than young Christians and non-believers (UK, Denmark, Estonia).
The right of women for abortion is under dispute. In the majority of the 15 cases this right is
accepted, but again with important constraints: In general more young women than young
men are accepting this right, especially in Croatia, eastern Germany and the UK. In Greece
the majority of males disapprove of this right. Furthermore there is an ethnic/religious
division for this question. In particular Muslims reject this right (UK, eastern Germany).
In Russia attitudes are divided: 40 percent are against abortion.
Literature
Social Trust
The issues of trust and information are not only related to direct social interactions, but can
also be applied to the analysis of bureaucracy and democracy. Social trust constitutes the
foundation for social cooperation and, by extension, for the integration and stability of
modern society (Nannestad, 2008; Rothstein and Eek, 2009). Classic authors such as de
Tocqueville, J.S. Mill, Durkheim, Simmel, Tönnies, and Kornhauser relate trust to
membership in voluntary organisations and stress the social benefits that result from this
trust and behaviour for the community.27
Similar assertions are stated in Karen S. Cook’s edited book ‘Trust in Society’ (2003) by
several authors where they stress the many functions trust performs in social and political
life in diverse social settings, from the local and personal to the national and institutional.
27
For a review of the classic literature on trust see Misztal, 1996.
MYPLACE August 2014
MYPLACE: FP7-266831 www.fp7-myplace.eu Deliverable 4.6 Europe wide thematic report Page 254 of 431
Hardin (2000) explores some of the conceptual complexities of trust relationships. He
differentiates between two kinds of trust: trust that relates to the confidence a specific
individual places in another individual (encapsulated interest) and, the second, generalised
trustworthiness. Hardin explores the ways in which the government can promote trust in
the latter sense. Referring to Hume he also puts forward that, institutions “play a role in
underwriting interpersonal trust” (ibid. 30).
However, exploring the empirical association between social and political trust, and its
relationship with membership of voluntary organisations, Newton (2001) argues that the
relationship between social and political trust and democracy is more complex and indirect
than appears to be the case at first.
Other studies confirm the strong relationship. Tao et al. (2014) find strong evidence that
political trust enhances social trust in China by referring to a generalised social trust
question, as well as three contextualised trust questions. They also shed light on the impact
of economic modernisation on social trust.
When applying these theories about social trust to young people, Kelly (2009) says that
young people are particularly affected by social exclusion resulting from disparities in
educational settings, economic disadvantages, and health disparities are more likely to
experience and feel low social trust. He stresses that social trust is an important factor for
civic and social engagement and is therefore a significant trait for adulthood. His article does
not only offer a dense overview of literature but also focuses on young migrants in the U.S.
and factors that contribute to their inclusion into society.
Social Networks
The analysis of social networks “is suggested as a tool for linking micro and macro levels of
sociological theory”, as Granovetter (1973:1360) suggests in his famous article ‘The strength
of weak ties’. The analysis of processes in interpersonal networks allows us to translate
small-scale interactions into large-scale patterns. To explore how and where influence,
information, mobility opportunity and community organisation is diffused in social
interactions, Granovetter suggests to not only focus on strong ties between individuals
(thus, interaction within small well defined groups) but also to consider the weak ties – thus,
the relations between groups. Weak ties allow for a wider social structure and for a wider
exchange of ideas, values and innovations because bridging ties gives access to resources
and opportunities that exist in one network to a member of another network. The structure
and group dynamics of a network can either facilitate or constrain the individual’s ability to
gather information and to increase access to different forms of capital, particularly
intellectual capital. Social ties can facilitate undesirable behaviours and imprison actors in
risky social situations. Woolcock (2001) elaborates on “social capital” and how one’s family,
MYPLACE August 2014
MYPLACE: FP7-266831 www.fp7-myplace.eu Deliverable 4.6 Europe wide thematic report Page 255 of 431
friends, and associates constitute an important asset, not only in situations of crisis, but also
for material gain and economic development.
Newman and Dale (2005) put forward that not all social networks are, created equally.
“Networks composed of a diversity of “bridging” links to a diverse web of resources and
“bonding” links that build trust strengthen a community’s ability to adapt to change, but
networks composed only of “bonding” links can impose constraining social norms and foster
group homophily, reducing resilience. Diversity fosters the resilience needed to adapt to
unexpected change, and can also enlarge the ability to proactively make collective decisions
that optimize future options” (ibid 1).
Similarly, McPherson et al. (2001) analyse causes of homophily and refer to geography,
family ties, organisational foci, informal roles, cognitive processes. They stress that
“homophily“ limits people's social worlds in a way that has powerful implications for the
information they receive, the attitudes they form, and the interactions they experience.
Homophily in race and ethnicity creates the strongest divides in people’s personal
environments, with age, religion, education, occupation, and gender following in roughly
that order” (ibid. 415).
According to these theories and approaches, social networking site users have probably
more friends and more close friends. Exploring people’s overall social networks and how use
of new media technologies is, related to trust, tolerance, social support, and community and
political engagement, Hampton et al. (2011) conclude that users of social networking
technologies are associated with having a larger overall network.
Wimmer and Lewis’ (2010) remarkable work on racial homogeneity in a group of college
students who used Facebook shows that “homophily based on other attributes—including
socioeconomic status, regional background, and shared cultural taste—may intersect with
racial homophily if there is significant overlap in category membership” (ibid. 586). They
further stress that also balancing mechanisms such as the tendency to reciprocate
friendships or to befriend the friends of friends, can amplify the homogeneity effects of
homophily.
Gender Relationships and Sexuality
Engagement and trust in democracy is, closely linked to equality, diversity and inclusion. In
this respect, young people’s perceptions of gender roles, relationships and sexuality are an
indicator of their reflexivity on diversity and their tolerance as such. Discourses of gender
and sexuality show how young people position themselves and how far they are, affected by
gender and sexuality related violence (Rivers and Duncan, 2013).
MYPLACE August 2014
MYPLACE: FP7-266831 www.fp7-myplace.eu Deliverable 4.6 Europe wide thematic report Page 256 of 431
Herek (2009) presents a framework analysis on sexual stigma and prejudice and shows how
they develop as cultural constructs in societies. O’Neil and Gidengil (2006) put forward in
their book that gender is a social capital and can considerably affect political engagement
and career.
The acceptance of gender non-conformity varies according to young people’s contact with
gay and lesbian persons, as Collier et al. (2010) found out in their research. Similar findings
are also, suggested by Heinze and Horn (2009) in their study about the relationship between
intergroup contact and adolescents’ attitudes regarding homosexuality and the treatment
of lesbian and gay (LG) peers.
10.1 Social trust (Q29) and Views on helpfulness of others
(Q30), combined
The respondents` assessment of people`s trustworthiness and their helpfulness is measured
on an 11-point-scale (from 0 to 10). Thereby, the highest value stands for the most sceptical
attitude (‘can`t be too careful’ and ‘most people look out for themselves’).
For the following analyses, we recoded the values in order to have the highest value
standing for the most positive attitude. We considered constructing a scale referring to
respondent`s assessment of the society they live in by adding both questions. Cronbach`s α
had a value of 0.69 for this scale and a correlation test revealed a correlation coefficient of
0.53. Thus, both questions were, added in a scale (“society trust scale”) and are presented
together in this sub section.
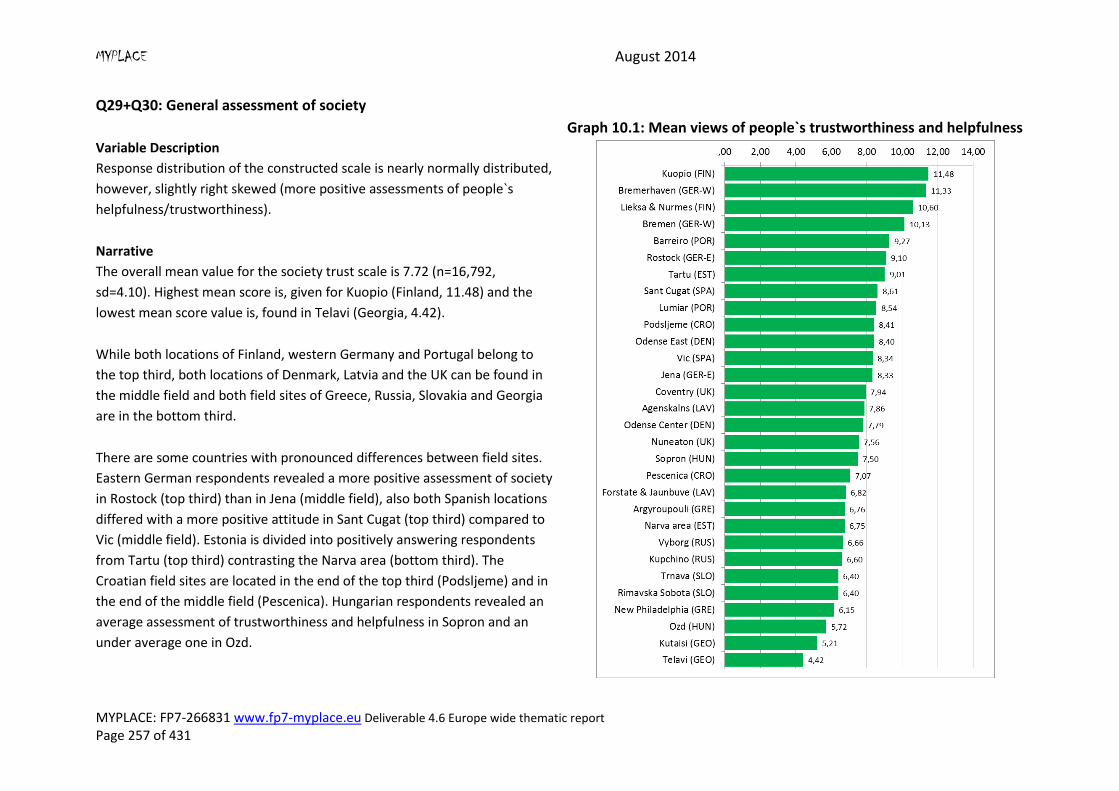
MYPLACE August 2014
MYPLACE: FP7-266831 www.fp7-myplace.eu Deliverable 4.6 Europe wide thematic report Page 257 of 431
Q29+Q30: General assessment of society
Variable Description
Response distribution of the constructed scale is nearly normally distributed,
however, slightly right skewed (more positive assessments of people`s
helpfulness/trustworthiness).
Graph 10.1: Mean views of people`s trustworthiness and helpfulness
Narrative
The overall mean value for the society trust scale is 7.72 (n=16,792,
sd=4.10). Highest mean score is, given for Kuopio (Finland, 11.48) and the
lowest mean score value is, found in Telavi (Georgia, 4.42).
While both locations of Finland, western Germany and Portugal belong to
the top third, both locations of Denmark, Latvia and the UK can be found in
the middle field and both field sites of Greece, Russia, Slovakia and Georgia
are in the bottom third.
There are some countries with pronounced differences between field sites.
Eastern German respondents revealed a more positive assessment of society
in Rostock (top third) than in Jena (middle field), also both Spanish locations
differed with a more positive attitude in Sant Cugat (top third) compared to
Vic (middle field). Estonia is divided into positively answering respondents
from Tartu (top third) contrasting the Narva area (bottom third). The
Croatian field sites are located in the end of the top third (Podsljeme) and in
the end of the middle field (Pescenica). Hungarian respondents revealed an
average assessment of trustworthiness and helpfulness in Sopron and an
under average one in Ozd.
MYPLACE August 2014
MYPLACE: FP7-266831 www.fp7-myplace.eu Deliverable 4.6 Europe wide thematic report Page 258 of 431
10.3 Interaction with friends (Q31)
Question 31 covers the frequency of personal contacts to close friends asked within a time
framework of the last year. Answer options offered ‘Several times a week’, ‘Once a week’,
‘At least once a month’, ‘Several times a year’, ‘Once a year or less’ and ‘I don`t have any
close friends’.
As the following question (Q32) on the duration of media contact to friends refers to a
different time frame (an average weekday and duration instead of frequency), it was
impossible to combine these two questions. Consequently, question Q31 was, handled as a
single variable in the following analyses.
The coding was, reversed to identify the most frequent answer option with the highest
value.
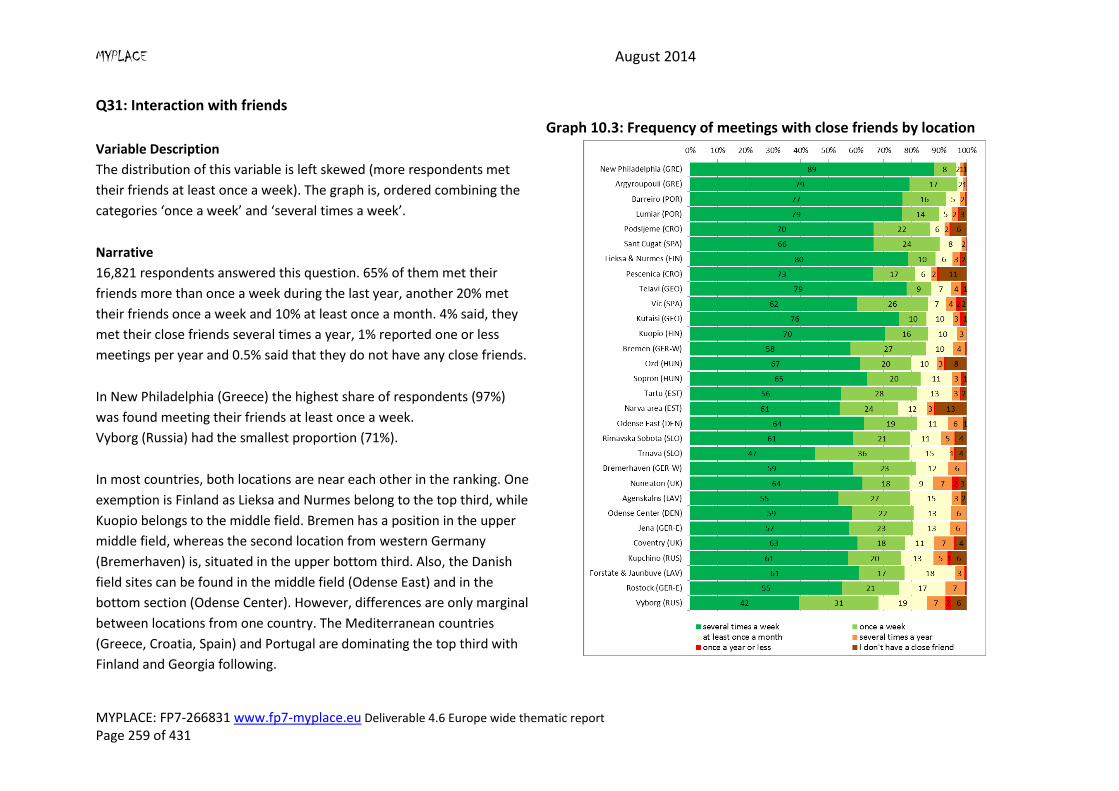
MYPLACE August 2014
MYPLACE: FP7-266831 www.fp7-myplace.eu Deliverable 4.6 Europe wide thematic report Page 259 of 431
Q31: Interaction with friends
Variable Description
The distribution of this variable is left skewed (more respondents met
their friends at least once a week). The graph is, ordered combining the
categories ‘once a week’ and ‘several times a week’.
Narrative
16,821 respondents answered this question. 65% of them met their
friends more than once a week during the last year, another 20% met
their friends once a week and 10% at least once a month. 4% said, they
met their close friends several times a year, 1% reported one or less
meetings per year and 0.5% said that they do not have any close friends.
In New Philadelphia (Greece) the highest share of respondents (97%)
was found meeting their friends at least once a week.
Vyborg (Russia) had the smallest proportion (71%).
In most countries, both locations are near each other in the ranking. One
exemption is Finland as Lieksa and Nurmes belong to the top third, while
Kuopio belongs to the middle field. Bremen has a position in the upper
middle field, whereas the second location from western Germany
(Bremerhaven) is, situated in the upper bottom third. Also, the Danish
field sites can be found in the middle field (Odense East) and in the
bottom section (Odense Center). However, differences are only marginal
between locations from one country. The Mediterranean countries
(Greece, Croatia, Spain) and Portugal are dominating the top third with
Finland and Georgia following.
Graph 10.3: Frequency of meetings with close friends by location
MYPLACE August 2014
MYPLACE: FP7-266831 www.fp7-myplace.eu Deliverable 4.6 Europe wide thematic report Page 260 of 431
10.4 Use of media technologies and social networking sites
(Q32)
For estimating the respondent`s contact to friends via media technologies, they were asked
for the duration of communicating with their friends via social media or other technologies
(e.g. text messages). The following answer options were offered: ‘No time at all’, ‘Less than
1 hour’, ‘1 hour to 2 hours’, ‘More than 2 hours’. This question was handled as a single
variable in the following analyses.
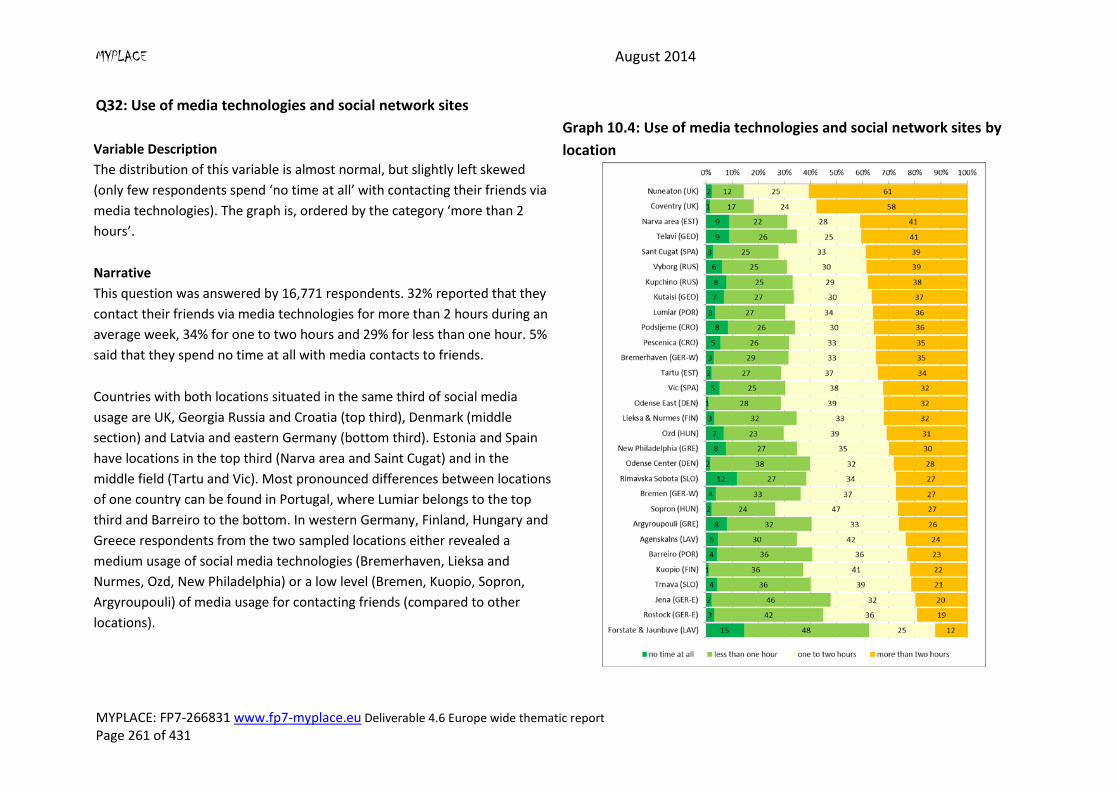
MYPLACE August 2014
MYPLACE: FP7-266831 www.fp7-myplace.eu Deliverable 4.6 Europe wide thematic report Page 261 of 431
Q32: Use of media technologies and social network sites
Variable Description
The distribution of this variable is almost normal, but slightly left skewed
(only few respondents spend ‘no time at all’ with contacting their friends via
media technologies). The graph is, ordered by the category ‘more than 2
hours’.
Narrative
This question was answered by 16,771 respondents. 32% reported that they
contact their friends via media technologies for more than 2 hours during an
average week, 34% for one to two hours and 29% for less than one hour. 5%
said that they spend no time at all with media contacts to friends.
Countries with both locations situated in the same third of social media
usage are UK, Georgia Russia and Croatia (top third), Denmark (middle
section) and Latvia and eastern Germany (bottom third). Estonia and Spain
have locations in the top third (Narva area and Saint Cugat) and in the
middle field (Tartu and Vic). Most pronounced differences between locations
of one country can be found in Portugal, where Lumiar belongs to the top
third and Barreiro to the bottom. In western Germany, Finland, Hungary and
Greece respondents from the two sampled locations either revealed a
medium usage of social media technologies (Bremerhaven, Lieksa and
Nurmes, Ozd, New Philadelphia) or a low level (Bremen, Kuopio, Sopron,
Argyroupouli) of media usage for contacting friends (compared to other
locations).
Graph 10.4: Use of media technologies and social network sites by
location
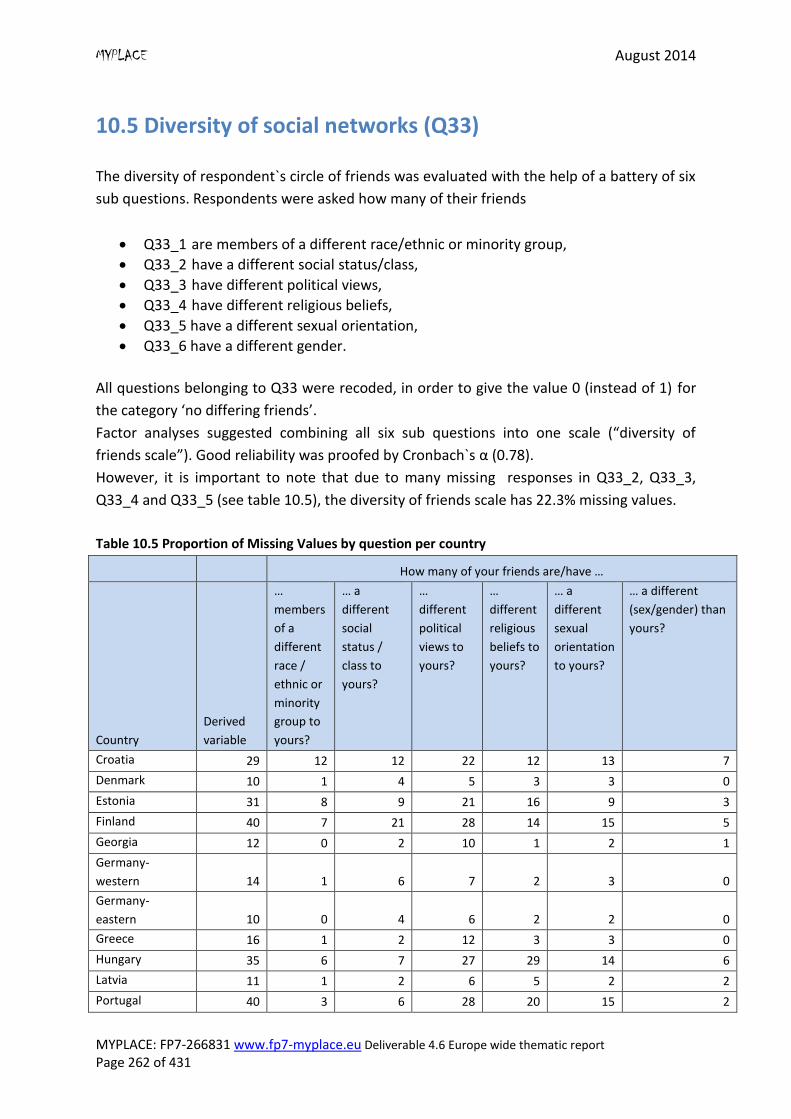
MYPLACE August 2014
MYPLACE: FP7-266831 www.fp7-myplace.eu Deliverable 4.6 Europe wide thematic report Page 262 of 431
10.5 Diversity of social networks (Q33)
The diversity of respondent`s circle of friends was evaluated with the help of a battery of six
sub questions. Respondents were asked how many of their friends
Q33_1 are members of a different race/ethnic or minority group,
Q33_2 have a different social status/class,
Q33_3 have different political views,
Q33_4 have different religious beliefs,
Q33_5 have a different sexual orientation,
Q33_6 have a different gender.
All questions belonging to Q33 were recoded, in order to give the value 0 (instead of 1) for
the category ‘no differing friends’.
Factor analyses suggested combining all six sub questions into one scale (“diversity of
friends scale”). Good reliability was proofed by Cronbach`s α (0.78).
However, it is important to note that due to many missing responses in Q33_2, Q33_3,
Q33_4 and Q33_5 (see table 10.5), the diversity of friends scale has 22.3% missing values.
Table 10.5 Proportion of Missing Values by question per country
How many of your friends are/have …
Country
Derived
variable
…
members
of a
different
race /
ethnic or
minority
group to
yours?
… a
different
social
status /
class to
yours?
…
different
political
views to
yours?
…
different
religious
beliefs to
yours?
… a
different
sexual
orientation
to yours?
… a different
(sex/gender) than
yours?
Croatia 29 12 12 22 12 13 7
Denmark 10 1 4 5 3 3 0
Estonia 31 8 9 21 16 9 3
Finland 40 7 21 28 14 15 5
Georgia 12 0 2 10 1 2 1
Germany-
western 14 1 6 7 2 3 0
Germany-
eastern 10 0 4 6 2 2 0
Greece 16 1 2 12 3 3 0
Hungary 35 6 7 27 29 14 6
Latvia 11 1 2 6 5 2 2
Portugal 40 3 6 28 20 15 2
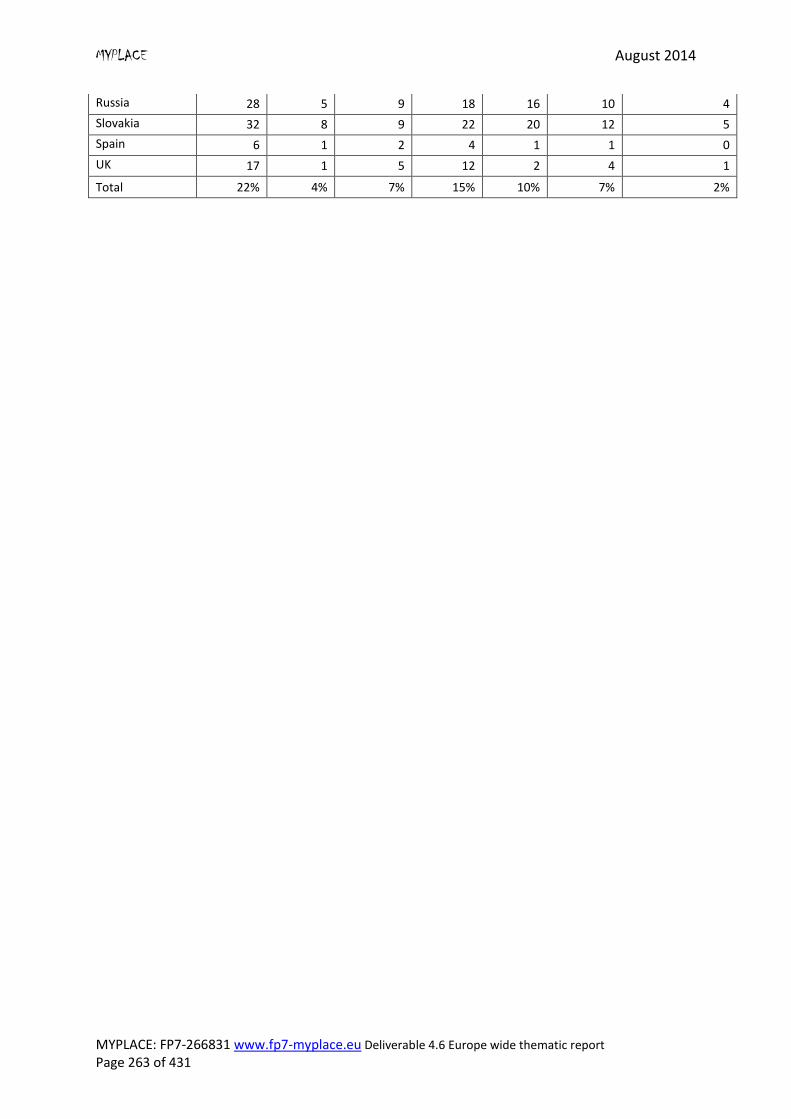
MYPLACE August 2014
MYPLACE: FP7-266831 www.fp7-myplace.eu Deliverable 4.6 Europe wide thematic report Page 263 of 431
Russia 28 5 9 18 16 10 4
Slovakia 32 8 9 22 20 12 5
Spain 6 1 2 4 1 1 0
UK 17 1 5 12 2 4 1
Total 22% 4% 7% 15% 10% 7% 2%
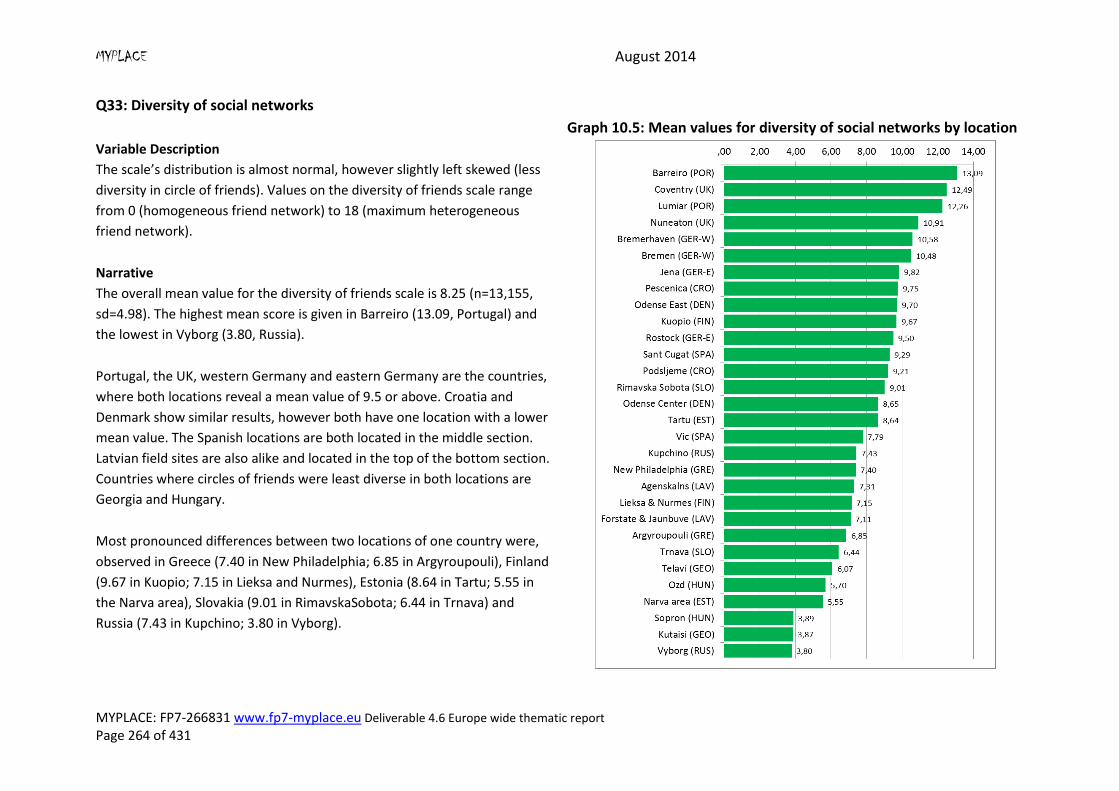
MYPLACE August 2014
MYPLACE: FP7-266831 www.fp7-myplace.eu Deliverable 4.6 Europe wide thematic report Page 264 of 431
Q33: Diversity of social networks
Variable Description
The scale’s distribution is almost normal, however slightly left skewed (less
diversity in circle of friends). Values on the diversity of friends scale range
from 0 (homogeneous friend network) to 18 (maximum heterogeneous
friend network).
Graph 10.5: Mean values for diversity of social networks by location
Narrative
The overall mean value for the diversity of friends scale is 8.25 (n=13,155,
sd=4.98). The highest mean score is given in Barreiro (13.09, Portugal) and
the lowest in Vyborg (3.80, Russia).
Portugal, the UK, western Germany and eastern Germany are the countries,
where both locations reveal a mean value of 9.5 or above. Croatia and
Denmark show similar results, however both have one location with a lower
mean value. The Spanish locations are both located in the middle section.
Latvian field sites are also alike and located in the top of the bottom section.
Countries where circles of friends were least diverse in both locations are
Georgia and Hungary.
Most pronounced differences between two locations of one country were,
observed in Greece (7.40 in New Philadelphia; 6.85 in Argyroupouli), Finland
(9.67 in Kuopio; 7.15 in Lieksa and Nurmes), Estonia (8.64 in Tartu; 5.55 in
the Narva area), Slovakia (9.01 in RimavskaSobota; 6.44 in Trnava) and
Russia (7.43 in Kupchino; 3.80 in Vyborg).
MYPLACE August 2014
MYPLACE: FP7-266831 www.fp7-myplace.eu Deliverable 4.6 Europe wide thematic report Page 265 of 431
10.6 Attitude towards roles of women and men in society
(Q34)
Two questions were added in the section “Social networks, gender relationships and
sexuality” to enlighten respondents` attitudes towards women`s role in society. The first
one refers directly to the labour market and the second one to (political) leadership.
Respondents were asked to agree or disagree on a 5 point scale to the following statements:
Q34_1: When jobs are scarce, men should have more right to a job than women.
Q34_2: Women make as good political leaders as men.
Answer options were ‘Strongly agree’, ‘Agree’, ‘Neither agree nor disagree’, ‘Disagree’ and
‘Strongly disagree’.
For the following analyses, the scale for Q34_2 was recoded in order to receive the highest
value for the most positive attitude towards women in both sub questions. Both questions
were added to a scale. However, Cronbach`s α implied a poor reliability (0.54).
Nevertheless, the correlation coefficient calculated was 0.37. Thus, a scale consisting of
Q34_1 and Q34_2 can be used.
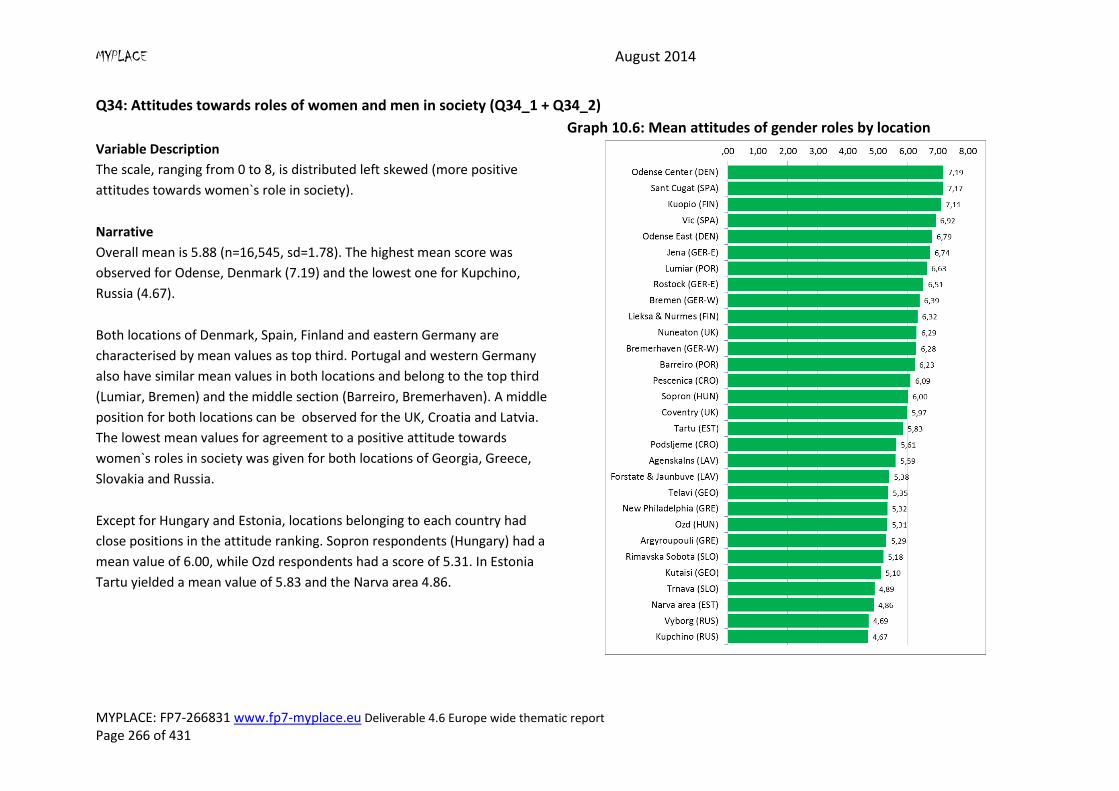
MYPLACE August 2014
MYPLACE: FP7-266831 www.fp7-myplace.eu Deliverable 4.6 Europe wide thematic report Page 266 of 431
Q34: Attitudes towards roles of women and men in society (Q34_1 + Q34_2)
Variable Description
The scale, ranging from 0 to 8, is distributed left skewed (more positive
attitudes towards women`s role in society).
Graph 10.6: Mean attitudes of gender roles by location
Narrative
Overall mean is 5.88 (n=16,545, sd=1.78). The highest mean score was
observed for Odense, Denmark (7.19) and the lowest one for Kupchino,
Russia (4.67).
Both locations of Denmark, Spain, Finland and eastern Germany are
characterised by mean values as top third. Portugal and western Germany
also have similar mean values in both locations and belong to the top third
(Lumiar, Bremen) and the middle section (Barreiro, Bremerhaven). A middle
position for both locations can be observed for the UK, Croatia and Latvia.
The lowest mean values for agreement to a positive attitude towards
women`s roles in society was given for both locations of Georgia, Greece,
Slovakia and Russia.
Except for Hungary and Estonia, locations belonging to each country had
close positions in the attitude ranking. Sopron respondents (Hungary) had a
mean value of 6.00, while Ozd respondents had a score of 5.31. In Estonia
Tartu yielded a mean value of 5.83 and the Narva area 4.86.
MYPLACE August 2014
MYPLACE: FP7-266831 www.fp7-myplace.eu Deliverable 4.6 Europe wide thematic report Page 267 of 431
10.7 Attitude towards homosexuality (Q35)
Two questions captured respondent`s attitude towards homosexuality. Respondents were
asked to agree or disagree on a 5 point scale to the following statements:
Q35_1: Homosexuality is unnatural.
Q35_2: Same sex couples should be able to adopt children.
Answer options were ‘Strongly agree’, ‘Agree’, ‘Neither agree nor disagree’, ‘Disagree’ and
‘Strongly disagree’.
For the following analyses, the scale for Q35_2 was recoded in order to receive the highest
value for the most positive attitude towards homosexuality in both sub questions. Both
questions were added to a scale. Cronbach`s α underlined a good reliability (0.77) for the
‘homosexuality scale’. Additionally, a correlation coefficient was calculated (0.62), also
indicating a good reliability. Thus, a scale consisting of Q35_1 and Q35_2 can be used.
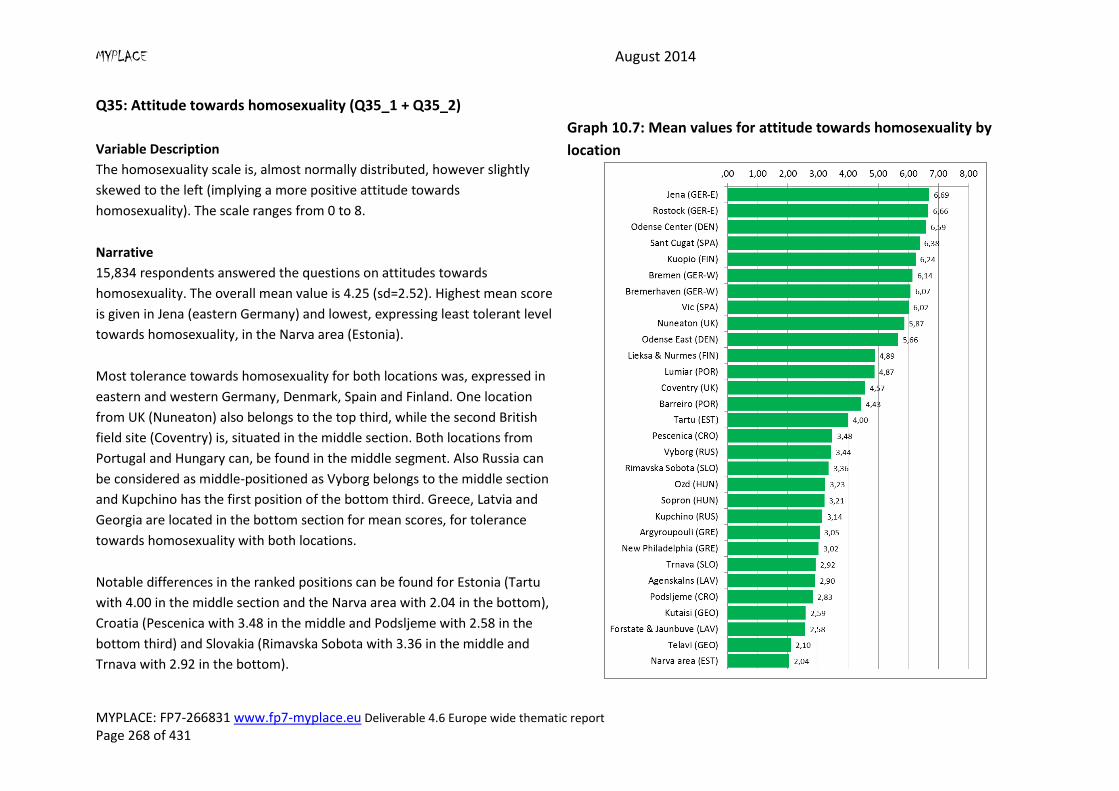
MYPLACE August 2014
MYPLACE: FP7-266831 www.fp7-myplace.eu Deliverable 4.6 Europe wide thematic report Page 268 of 431
Q35: Attitude towards homosexuality (Q35_1 + Q35_2)
Variable Description
The homosexuality scale is, almost normally distributed, however slightly
skewed to the left (implying a more positive attitude towards
homosexuality). The scale ranges from 0 to 8.
Graph 10.7: Mean values for attitude towards homosexuality by
location
Narrative
15,834 respondents answered the questions on attitudes towards
homosexuality. The overall mean value is 4.25 (sd=2.52). Highest mean score
is given in Jena (eastern Germany) and lowest, expressing least tolerant level
towards homosexuality, in the Narva area (Estonia).
Most tolerance towards homosexuality for both locations was, expressed in
eastern and western Germany, Denmark, Spain and Finland. One location
from UK (Nuneaton) also belongs to the top third, while the second British
field site (Coventry) is, situated in the middle section. Both locations from
Portugal and Hungary can, be found in the middle segment. Also Russia can
be considered as middle-positioned as Vyborg belongs to the middle section
and Kupchino has the first position of the bottom third. Greece, Latvia and
Georgia are located in the bottom section for mean scores, for tolerance
towards homosexuality with both locations.
Notable differences in the ranked positions can be found for Estonia (Tartu
with 4.00 in the middle section and the Narva area with 2.04 in the bottom),
Croatia (Pescenica with 3.48 in the middle and Podsljeme with 2.58 in the
bottom third) and Slovakia (Rimavska Sobota with 3.36 in the middle and
Trnava with 2.92 in the bottom).
MYPLACE August 2014
MYPLACE: FP7-266831 www.fp7-myplace.eu Deliverable 4.6 Europe wide thematic report Page 269 of 431
10.8 Views on women to have access to abortion (Q36)
Respondents were, asked whether they thought that women should have the right to have
access to abortion or not. Answer options were ‘Yes’ or ‘No’.
As there were no other variables in the section “Social networks, gender relationships and
sexuality” suitable for a combination with this question, Q36 was handled as a single
variable in the following analyses.
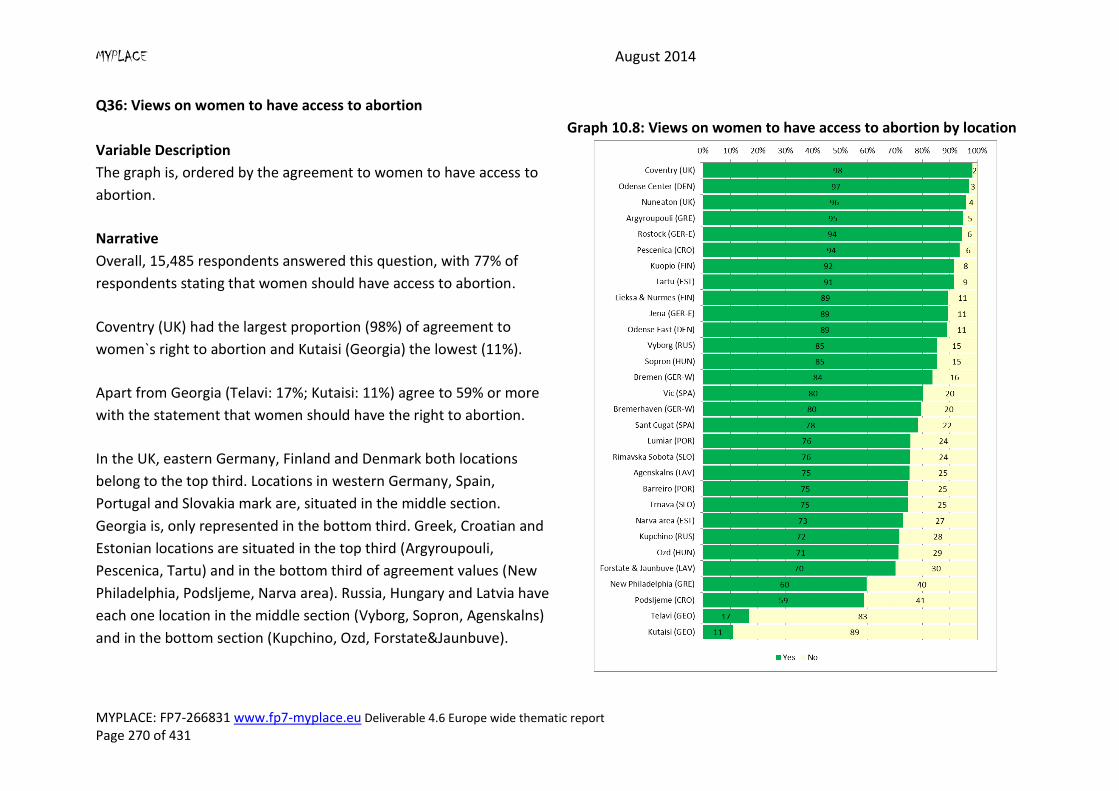
MYPLACE August 2014
MYPLACE: FP7-266831 www.fp7-myplace.eu Deliverable 4.6 Europe wide thematic report Page 270 of 431
Q36: Views on women to have access to abortion
Variable Description
The graph is, ordered by the agreement to women to have access to
abortion.
Graph 10.8: Views on women to have access to abortion by location
Narrative
Overall, 15,485 respondents answered this question, with 77% of
respondents stating that women should have access to abortion.
Coventry (UK) had the largest proportion (98%) of agreement to
women`s right to abortion and Kutaisi (Georgia) the lowest (11%).
Apart from Georgia (Telavi: 17%; Kutaisi: 11%) agree to 59% or more
with the statement that women should have the right to abortion.
In the UK, eastern Germany, Finland and Denmark both locations
belong to the top third. Locations in western Germany, Spain,
Portugal and Slovakia mark are, situated in the middle section.
Georgia is, only represented in the bottom third. Greek, Croatian and
Estonian locations are situated in the top third (Argyroupouli,
Pescenica, Tartu) and in the bottom third of agreement values (New
Philadelphia, Podsljeme, Narva area). Russia, Hungary and Latvia have
each one location in the middle section (Vyborg, Sopron, Agenskalns)
and in the bottom section (Kupchino, Ozd, Forstate&Jaunbuve).
MYPLACE August 2014
MYPLACE: FP7-266831 www.fp7-myplace.eu Deliverable 4.6 Europe wide thematic report Page 271 of 431
10.9 Multi-level Modelling
Dependent variable
The dependent variable used is the social trust scale computed on basis of question Q29 and
Q30 (see above). As this variable is an almost normally distributed scale variable, a linear
mixed model was used.
Independent variables
On the individual level, several socio-demographic independent variables were used.
According to Kelly (2009), factors like a person`s economic situation have a major impact on
social exclusion and thus, on trust in society. Thus, we included variables for income
satisfaction (ordinal from 0=very difficult to live on, 1=difficult to live on, 2=coping to
3=living comfortably) and the respondent`s employment status (nominal from 0=Other,
1=Unemployed, 2=In education to 3=Employed) in the analyses. We also included the social
class variable (ordinal from 0=lowest class to 3=highest class) as a complementation.
Additionally, we used gender (dummy) and age (z-transformed) as control variables.
Assuming that a strong religious belief could have a positive effect when it comes to trusting
other people, we included a dummy in the analyses giving information if the respondent
was religious or not. Another aspect connected with integration in society is ethnicity.
Belonging to a country`s ethnic majority is assumed to convey integration and thus, a
positive attitude towards society. For this reason, we included a dummy variable for ethnic
majority.
Contextual variables used in the multi-level analyses were, extracted from administrative
datasets. One exception, the welfare state type (ordinal, from 0=Post-socialist, 1=Nordic,
2=Conservative, 3=Mediterranean to 4=Liberal), came from the original MYPLACE dataset.
Different welfare state types indicate different levels of social expenditures and thus, are,
expected to have an impact on social inclusion/exclusion, linked with trust in society.
The administrative data used gave information on:
a. Various aspects of the political process, civil liberties and political rights. b. Political stability. c. The quality of public service provision, the quality of the bureaucracy, the
competence of civil servants, the independence of the civil service from political pressures, and the credibility of the government’s commitment to policies.
d. Market regulatory qualities. e. The extent to which, agents have confidence in and abide by the rules of society.
These include perceptions of the incidence of crime, the effectiveness and predictability of the judiciary, and the enforceability of contracts.
f. The level of control of corruptions. g. GDP.
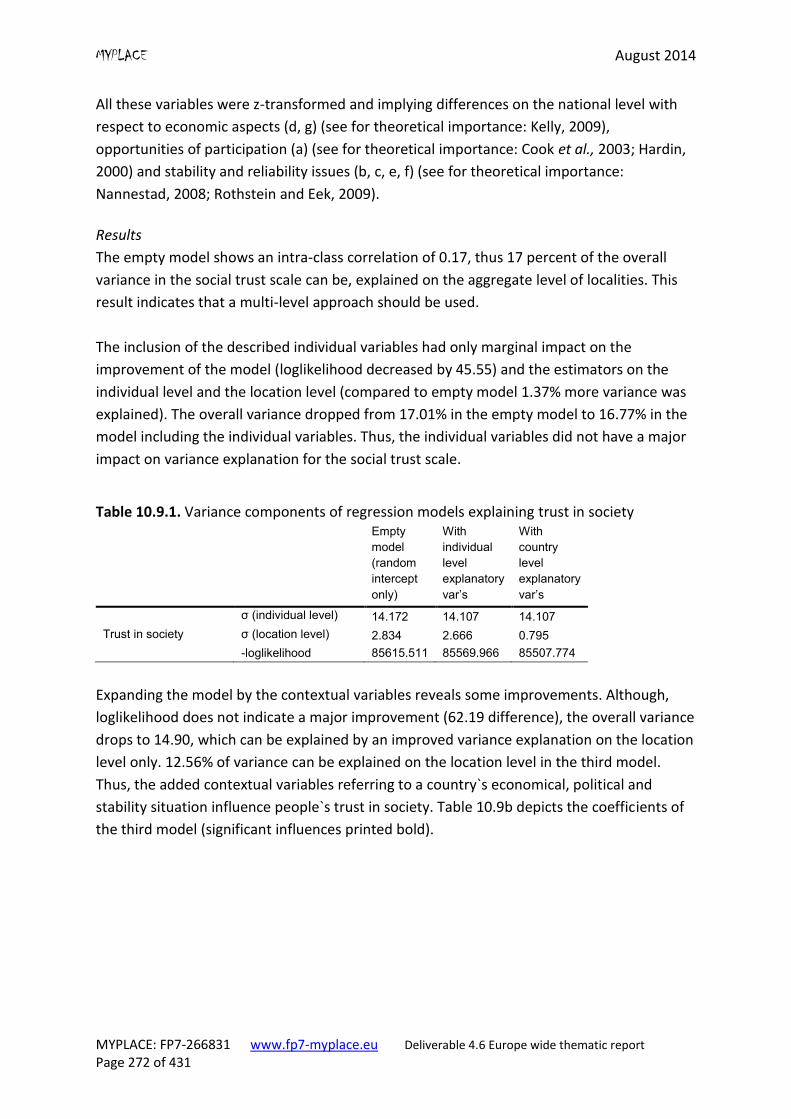
MYPLACE August 2014
MYPLACE: FP7-266831 www.fp7-myplace.eu Deliverable 4.6 Europe wide thematic report Page 272 of 431
All these variables were z-transformed and implying differences on the national level with
respect to economic aspects (d, g) (see for theoretical importance: Kelly, 2009),
opportunities of participation (a) (see for theoretical importance: Cook et al., 2003; Hardin,
2000) and stability and reliability issues (b, c, e, f) (see for theoretical importance:
Nannestad, 2008; Rothstein and Eek, 2009).
Results
The empty model shows an intra-class correlation of 0.17, thus 17 percent of the overall
variance in the social trust scale can be, explained on the aggregate level of localities. This
result indicates that a multi-level approach should be used.
The inclusion of the described individual variables had only marginal impact on the
improvement of the model (loglikelihood decreased by 45.55) and the estimators on the
individual level and the location level (compared to empty model 1.37% more variance was
explained). The overall variance dropped from 17.01% in the empty model to 16.77% in the
model including the individual variables. Thus, the individual variables did not have a major
impact on variance explanation for the social trust scale.
Table 10.9.1. Variance components of regression models explaining trust in society Empty
model
(random
intercept
only)
With
individual
level
explanatory
var’s
With
country
level
explanatory
var’s
σ (individual level) 14.172 14.107 14.107
Trust in society σ (location level) 2.834 2.666 0.795
-loglikelihood 85615.511 85569.966 85507.774
Expanding the model by the contextual variables reveals some improvements. Although,
loglikelihood does not indicate a major improvement (62.19 difference), the overall variance
drops to 14.90, which can be explained by an improved variance explanation on the location
level only. 12.56% of variance can be explained on the location level in the third model.
Thus, the added contextual variables referring to a country`s economical, political and
stability situation influence people`s trust in society. Table 10.9b depicts the coefficients of
the third model (significant influences printed bold).
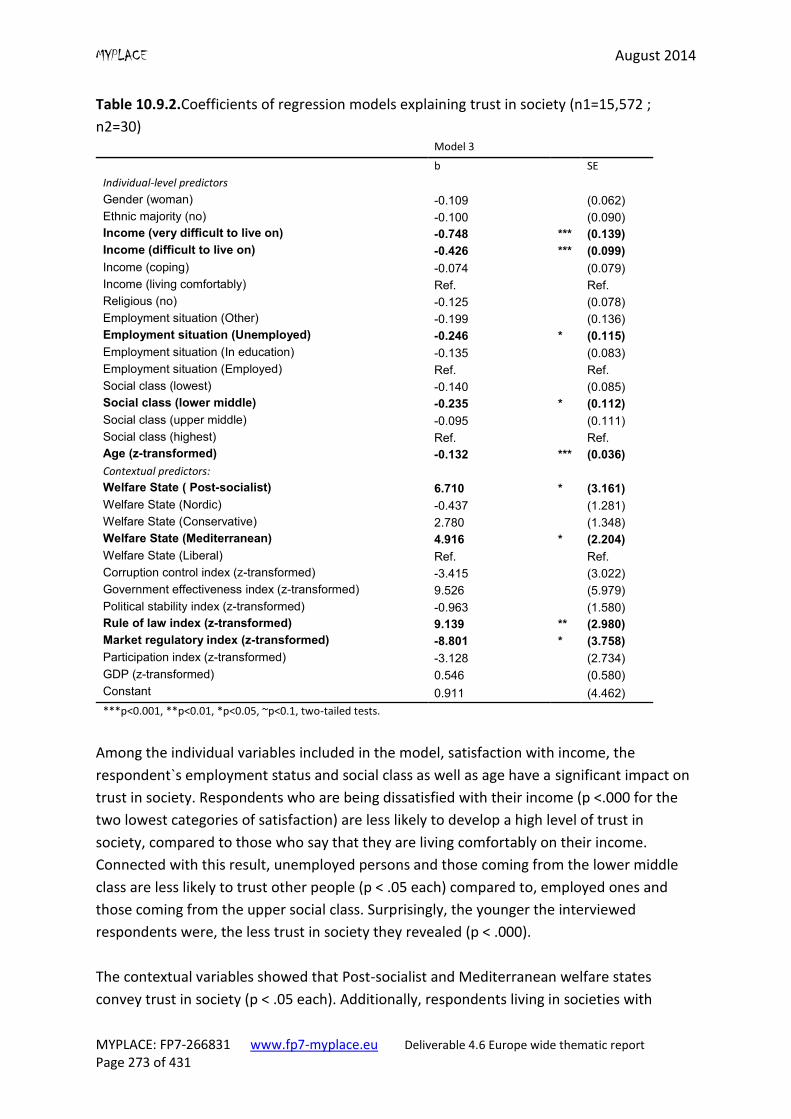
MYPLACE August 2014
MYPLACE: FP7-266831 www.fp7-myplace.eu Deliverable 4.6 Europe wide thematic report Page 273 of 431
Table 10.9.2.Coefficients of regression models explaining trust in society (n1=15,572 ;
n2=30)
Among the individual variables included in the model, satisfaction with income, the
respondent`s employment status and social class as well as age have a significant impact on
trust in society. Respondents who are being dissatisfied with their income (p <.000 for the
two lowest categories of satisfaction) are less likely to develop a high level of trust in
society, compared to those who say that they are living comfortably on their income.
Connected with this result, unemployed persons and those coming from the lower middle
class are less likely to trust other people (p < .05 each) compared to, employed ones and
those coming from the upper social class. Surprisingly, the younger the interviewed
respondents were, the less trust in society they revealed (p < .000).
The contextual variables showed that Post-socialist and Mediterranean welfare states
convey trust in society (p < .05 each). Additionally, respondents living in societies with
Model 3
b SE
Individual-level predictors
Gender (woman) -0.109 (0.062)
Ethnic majority (no) -0.100 (0.090)
Income (very difficult to live on) -0.748 *** (0.139)
Income (difficult to live on) -0.426 *** (0.099)
Income (coping) -0.074 (0.079)
Income (living comfortably) Ref. Ref.
Religious (no) -0.125 (0.078)
Employment situation (Other) -0.199 (0.136)
Employment situation (Unemployed) -0.246 * (0.115)
Employment situation (In education) -0.135 (0.083)
Employment situation (Employed) Ref. Ref.
Social class (lowest) -0.140 (0.085)
Social class (lower middle) -0.235 * (0.112)
Social class (upper middle) -0.095 (0.111)
Social class (highest) Ref. Ref.
Age (z-transformed) -0.132 *** (0.036)
Contextual predictors:
Welfare State ( Post-socialist) 6.710 * (3.161)
Welfare State (Nordic) -0.437 (1.281)
Welfare State (Conservative) 2.780 (1.348)
Welfare State (Mediterranean) 4.916 * (2.204)
Welfare State (Liberal) Ref. Ref.
Corruption control index (z-transformed) -3.415 (3.022)
Government effectiveness index (z-transformed) 9.526 (5.979)
Political stability index (z-transformed) -0.963 (1.580)
Rule of law index (z-transformed) 9.139 ** (2.980)
Market regulatory index (z-transformed) -8.801 * (3.758)
Participation index (z-transformed) -3.128 (2.734)
GDP (z-transformed) 0.546 (0.580)
Constant 0.911 (4.462)
***p<0.001, **p<0.01, *p<0.05, ~p<0.1, two-tailed tests.
MYPLACE August 2014
MYPLACE: FP7-266831 www.fp7-myplace.eu Deliverable 4.6 Europe wide thematic report Page 274 of 431
positive beliefs in the juridical system and lower crime rates are more prevalent to develop
a positive attitude towards society (p < .01) and less strict market regulations also convey
trust in society (p < .05) on a significant level.
In general the theoretical assumption that a person`s economic status influences the
development of people`s trust in society can be confirmed. Additionally, age turned out as
an important predictor for trust in society. It is unclear, what the reason for this might be.
On the contextual side, Post-socialist and Mediterranean regimes both turned out as
welfare state systems with potential for mediating a high level of trust in society. This result
is unexpected as social expenditures are lower in these states than in Nordic or conservative
welfare states. However, the reference category was liberal states, where social
expenditures are also low. The most influencing variables coming from the administrative
dataset were those indices depicting beliefs in the juridicial system and market regulations.
This result suggests that countries without governmental interventions in the economy and
a well-developed juridicial system provide the best conditions for a society with a high level
of trust.
10.10 Summary
The scale expressing the level of trust in society indicated highest levels of trust in Finnish,
western German and Portuguese locations, while Greece, Russia, Slovakia and Georgia had
the lowest mean values for level of trust in society. This scale was also used as a dependent
variable in the multi-level model, which identified respondents from Mediterranean
countries as more likely to develop a high level of trust in society. However, Greece was
located in the bottom third of all participating countries when it comes to mean trust
scores. As the survey was conducted in a period when Greece was hit particularly hard by
the Euro crisis and the stability of the government and market were undermined the low
level of trust measured is comprehensible.
When it comes to the frequency of meeting friends in person, the Mediterranean countries
as well as Portugal had the highest rates. However, in all locations the majority reported
meeting their friends at least once a week.
Media technologies were used with higher duration in the UK, Georgia, Russia and Croatia,
while Latvian and eastern German field sites had more respondents using technologies for
shorter periods. However, the survey asked for the duration of technology usage for social
contacts, not for frequency, which might produce different results.
The question battery Q34 was added to a scale indicating the diversity of respondents’
network of friends. Portugal, the UK and Germany (eastern and western) had the highest
MYPLACE August 2014
MYPLACE: FP7-266831 www.fp7-myplace.eu Deliverable 4.6 Europe wide thematic report Page 275 of 431
mean values. The UK and Germany have a high share of migrants, this might be one reason
for more heterogeneous social networks. Georgian and Hungarian respondents had the
most homogeneous circles of friends.
The most positive attitudes towards women`s role in society and homosexuals were
expressed in the Nordic countries (Denmark, Finland) as well as Spain and Germany.
In Georgia, Greece, Slovakia and Russia, gender based inequality tends to be supported by
the interviewed youths. Rejecting equality for homosexuals was, most often expressed in
Greece, Latvia and Georgia.
Women`s access to abortion is most supported in eastern Germany, Spain and Estonia.
Young people in locations in Russia, Greece and Georgia were the most likely to disapprove
of women’s access to abortion.
The multi-level model testing influences on trust in society revealed that 17% of variance
could be explained at the level of locations. Thus, the context variables were of special
interest. In sum, a country`s welfare state system, the rigidity of the regulation of its market
and juridicial system are decisive aspects when it comes to shaping people`s trust in society.
Additionally, individual economic aspects as well as age play an important role.
References
Cook, K. S. (2003).Trust in Society. New York: Sage.
Collier, K. L., Bos, H. M. W., and Sanford, T. G. M. (2010). Intergroup Contact, Attitudes
Toward Homosexuality, and the Role of Acceptance of Gender Non-conformity in Young
Adolescents. Journal of Adolescence 35(4) pp. 899–907.
Granovetter, M. S. (1973).The Strength of Weak Ties. American Journal of Sociology, 78(6):
1360-1380.
Hampton, K., Sessions Goulet, L., Rainie, L., and Purcell, K. (2011). Social Networking Sites
and Our Lives: How People’s Trust, Personal Relationships, and Civic and Political
Involvement are Connected to Their Use of Social Networking Sites and Other Technologies.
Pew Research Center’s Internet and American Life Project: URL:
http://pewinternet.org/Reports/2011/Technology-and-social-networks.aspx.
Hardin, R. (2000).Trust and Society. In:Galeotti, G., Salmon, P., and Wintrobe, R. (Eds.).
Competition and Structure: The Political Economy of Collective Decisions. Essays in Honor of
Albert Breton(17-46). Cambridge: University of Cambridge Press.
MYPLACE August 2014
MYPLACE: FP7-266831 www.fp7-myplace.eu Deliverable 4.6 Europe wide thematic report Page 276 of 431
Heinze, J. E., andHorn, S. S. (2009).Intergroup Contact and Beliefs about Homosexuality in
Adolescence. Journal of Youth and Adolescence 38: 937–951.
Herek, G. M. (2009). Sexual Prejudice. In:Nelson, T.D. (Ed.).Handbook of Prejudice,
Stereotyping, and Discrimination (441-468).New York: Taylor and Francis.
Kelly, D. C. (2009). In Preparation for Adulthood: Exploring Civic Participation and Social
Trust Among Young Minorities. Youth and Society40(4):526-540.
McPherson, M., Smith-Lovin, L., and Cook, J. M. (2001).Birds of a Feather: Homophily in
Social Networks. Annual Review of Sociology27:415-444.
Misztal, B.A. (1996). Trust in Modern Societies. Oxford: Blackwell.
Nannestad, P. (2008). What have we learned about generalized trust, if anything? Annual
Review of Political Science11: 413–436.
Newman, L. L., and Dale, A. (2005). Network Structure, Diversity, and Proactive Resilience
Building: A Response to Tompkins and Adger. Ecology and Society 10(1): r2. [online] URL:
http://www.ecologyandsociety.org/vol10/iss1/resp2.
Newton, K. (2001).Trust, Social Capital, Civil Society, and Democracy. International Political
Science Review, 22(2): pp. 201-214.
O'Neill, B., and Gidengil, E. (2006).Gender and Social Capital. New York: Taylor and Francis.
Rivers, I., and Duncan, N. (2013).Bullying: Experiences and Discourses of Sexuality and
Gender.New York: Routledge.
Rothstein, B., and Eek, D. (2009).Political Corruption and Social Trust. Rationality and Society
21(1):81–112.
Tao, R., Young, D. L., Ming, L., and Xi, L. (2014). How Does Political Trust Affect Social Trust?
An Analysis of Survey Data from Rural China using an Instrumental Variables Approach.
International Political Science Review35(2): 237–253.
Wimmer, A., and Lewis, K. (2010).Beyond and Below Racial Homophily: ERG Models of a
Friendship Network Documented on Facebook. American Journal of Sociology116(2):583–
642.
Woolcock, M. (2001). The Place of Social Capital in Understanding Social and Economic
Outcomes. Canadian Journal of Policy Research2(1):11–17.
MYPLACE August 2014
MYPLACE: FP7-266831 www.fp7-myplace.eu Deliverable 4.6 Europe wide thematic report Page 277 of 431
Chapter 11: Religion
In this chapter we present the results from the analysis of respondents’ attitudes towards
religion. This was measured using a range of questions covering the degree of religiosity, the
frequency of attending religious services, as well as attitudes towards specific issues
including religion’s role in politics.
Literature
Human religiosity and its different components has been the subject of numerous studies
especially in the western (Küçükcan, 2010; Verbit, 1970). Discussions about the extent to
which religion has declined and society secularized (Kepel, 1991) are central to debates
about religion and have been since at least the 1960s. Young people and religion has been
a separate interest among researchers, e.g. The National Study of Religion and Youth
(www.youthandreligion.org) in the USA. Some of these studies tend to reach the conclusion
that young people are less and less religious and that many of them are self-identified as
atheists, agnostics or not affiliated with any specific religion (Bengtson, 2013; Collins-Mayo,
2012). Furthermore, many studies have explored the association between religiosity and
youth wellbeing and whether religious young people are more or less optimistic than non-
religious ones; but not enough studies were traced concerning the hypotheses of our
research.
Religion and gender is one of the main topics in the fields of the sociology of religion
(Nason-Clark and Neitz, 2001; Hawthorne, 2011), theology (Clark, 1997; Bendroth, 1993)
and feminist studies (Juschka, 2001; Fulkerson, 1994). A significant number of studies have
concluded that women, compared to men, are more religious and are more likely to be
engaged in religious practices (Loewenthal et al., 2002; Woodhead, 2007). It is argued that
women are more likely to participate in social networks that act and are supported by
religious organisations (Krause et al., 2002). Loewenthal et al. (2002) argue that women are
prone to be engaged in religious practices due to socialisation processes that reproduce
specific stereotypes of women, as more caring and sensitive, destined to be in help of
others. Being mothers they spend more time in raising their children than men and part of
this raising is also the religious socialisation.
The same applies to socialisation and nurturing of boys often based on stereotypes
regarding their behaviour in society. What is important to notice is that gender differences
regarding religiosity, are differentiated depending on the religion. For example, Muslim
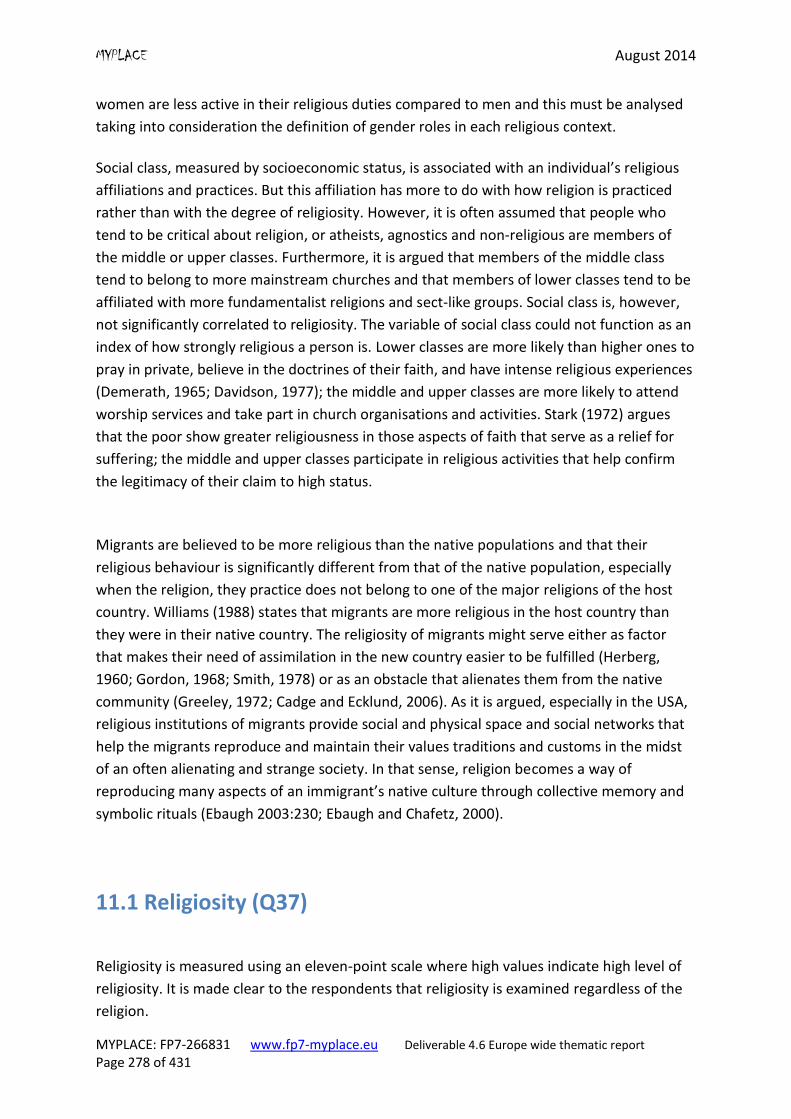
MYPLACE August 2014
MYPLACE: FP7-266831 www.fp7-myplace.eu Deliverable 4.6 Europe wide thematic report Page 278 of 431
women are less active in their religious duties compared to men and this must be analysed
taking into consideration the definition of gender roles in each religious context.
Social class, measured by socioeconomic status, is associated with an individual’s religious
affiliations and practices. But this affiliation has more to do with how religion is practiced
rather than with the degree of religiosity. However, it is often assumed that people who
tend to be critical about religion, or atheists, agnostics and non-religious are members of
the middle or upper classes. Furthermore, it is argued that members of the middle class
tend to belong to more mainstream churches and that members of lower classes tend to be
affiliated with more fundamentalist religions and sect-like groups. Social class is, however,
not significantly correlated to religiosity. The variable of social class could not function as an
index of how strongly religious a person is. Lower classes are more likely than higher ones to
pray in private, believe in the doctrines of their faith, and have intense religious experiences
(Demerath, 1965; Davidson, 1977); the middle and upper classes are more likely to attend
worship services and take part in church organisations and activities. Stark (1972) argues
that the poor show greater religiousness in those aspects of faith that serve as a relief for
suffering; the middle and upper classes participate in religious activities that help confirm
the legitimacy of their claim to high status.
Migrants are believed to be more religious than the native populations and that their
religious behaviour is significantly different from that of the native population, especially
when the religion, they practice does not belong to one of the major religions of the host
country. Williams (1988) states that migrants are more religious in the host country than
they were in their native country. The religiosity of migrants might serve either as factor
that makes their need of assimilation in the new country easier to be fulfilled (Herberg,
1960; Gordon, 1968; Smith, 1978) or as an obstacle that alienates them from the native
community (Greeley, 1972; Cadge and Ecklund, 2006). As it is argued, especially in the USA,
religious institutions of migrants provide social and physical space and social networks that
help the migrants reproduce and maintain their values traditions and customs in the midst
of an often alienating and strange society. In that sense, religion becomes a way of
reproducing many aspects of an immigrant’s native culture through collective memory and
symbolic rituals (Ebaugh 2003:230; Ebaugh and Chafetz, 2000).
11.1 Religiosity (Q37)
Religiosity is measured using an eleven-point scale where high values indicate high level of
religiosity. It is made clear to the respondents that religiosity is examined regardless of the
religion.
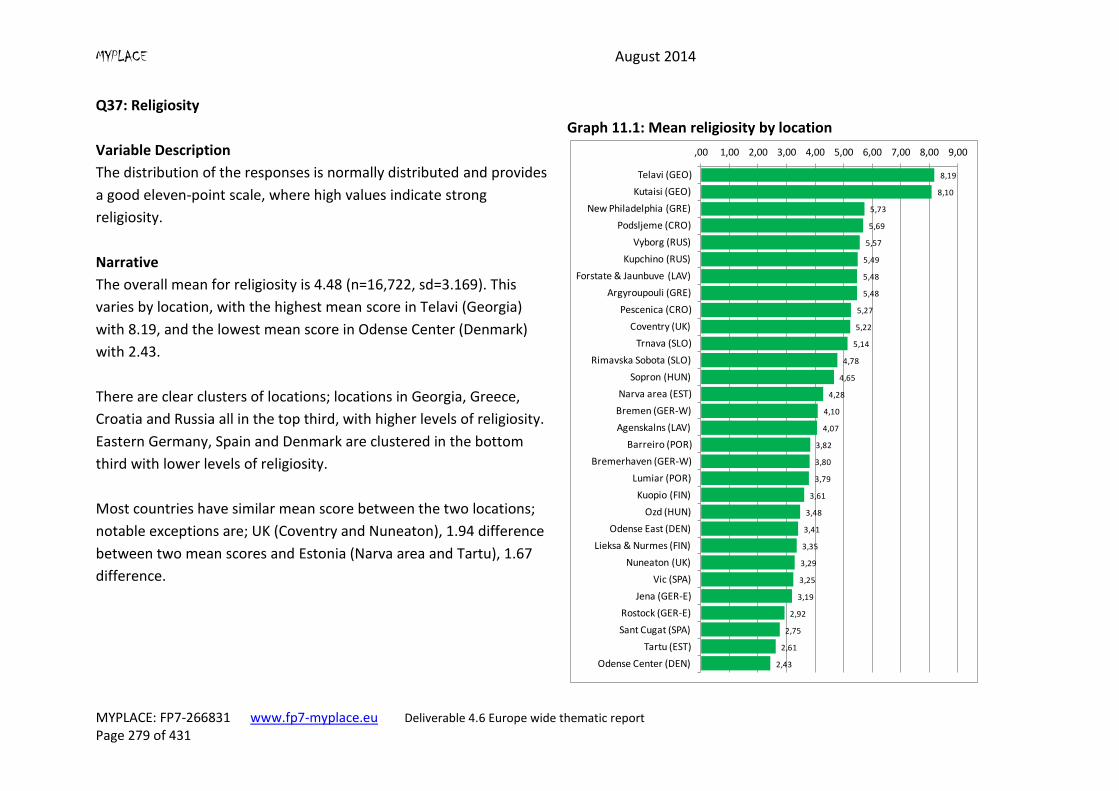
MYPLACE August 2014
MYPLACE: FP7-266831 www.fp7-myplace.eu Deliverable 4.6 Europe wide thematic report Page 279 of 431
Q37: Religiosity
Variable Description
The distribution of the responses is normally distributed and provides
a good eleven-point scale, where high values indicate strong
religiosity.
Graph 11.1: Mean religiosity by location
Narrative
The overall mean for religiosity is 4.48 (n=16,722, sd=3.169). This
varies by location, with the highest mean score in Telavi (Georgia)
with 8.19, and the lowest mean score in Odense Center (Denmark)
with 2.43.
There are clear clusters of locations; locations in Georgia, Greece,
Croatia and Russia all in the top third, with higher levels of religiosity.
Eastern Germany, Spain and Denmark are clustered in the bottom
third with lower levels of religiosity.
Most countries have similar mean score between the two locations;
notable exceptions are; UK (Coventry and Nuneaton), 1.94 difference
between two mean scores and Estonia (Narva area and Tartu), 1.67
difference.
8,19
8,10
5,73
5,69
5,57
5,49
5,48
5,48
5,27
5,22
5,14
4,78
4,65
4,28
4,10
4,07
3,82
3,80
3,79
3,61
3,48
3,41
3,35
3,29
3,25
3,19
2,92
2,75
2,61
2,43
,00 1,00 2,00 3,00 4,00 5,00 6,00 7,00 8,00 9,00
Telavi (GEO)
Kutaisi (GEO)
New Philadelphia (GRE)
Podsljeme (CRO)
Vyborg (RUS)
Kupchino (RUS)
Forstate & Jaunbuve (LAV)
Argyroupouli (GRE)
Pescenica (CRO)
Coventry (UK)
Trnava (SLO)
Rimavska Sobota (SLO)
Sopron (HUN)
Narva area (EST)
Bremen (GER-W)
Agenskalns (LAV)
Barreiro (POR)
Bremerhaven (GER-W)
Lumiar (POR)
Kuopio (FIN)
Ozd (HUN)
Odense East (DEN)
Lieksa & Nurmes (FIN)
Nuneaton (UK)
Vic (SPA)
Jena (GER-E)
Rostock (GER-E)
Sant Cugat (SPA)
Tartu (EST)
Odense Center (DEN)
MYPLACE August 2014
MYPLACE: FP7-266831 www.fp7-myplace.eu Deliverable 4.6 Europe wide thematic report Page 280 of 431
11.2 Attending religious services (Q38)
Frequency of attending religious services is investigated using the following scale:
Many times/ week
Once/ week
At least once/ month
More than twice/ year
Once or twice/ year
Less than once/ year
Never
An important clarification for the respondents is that the frequency examined does not
include weddings, baptisms and funerals.
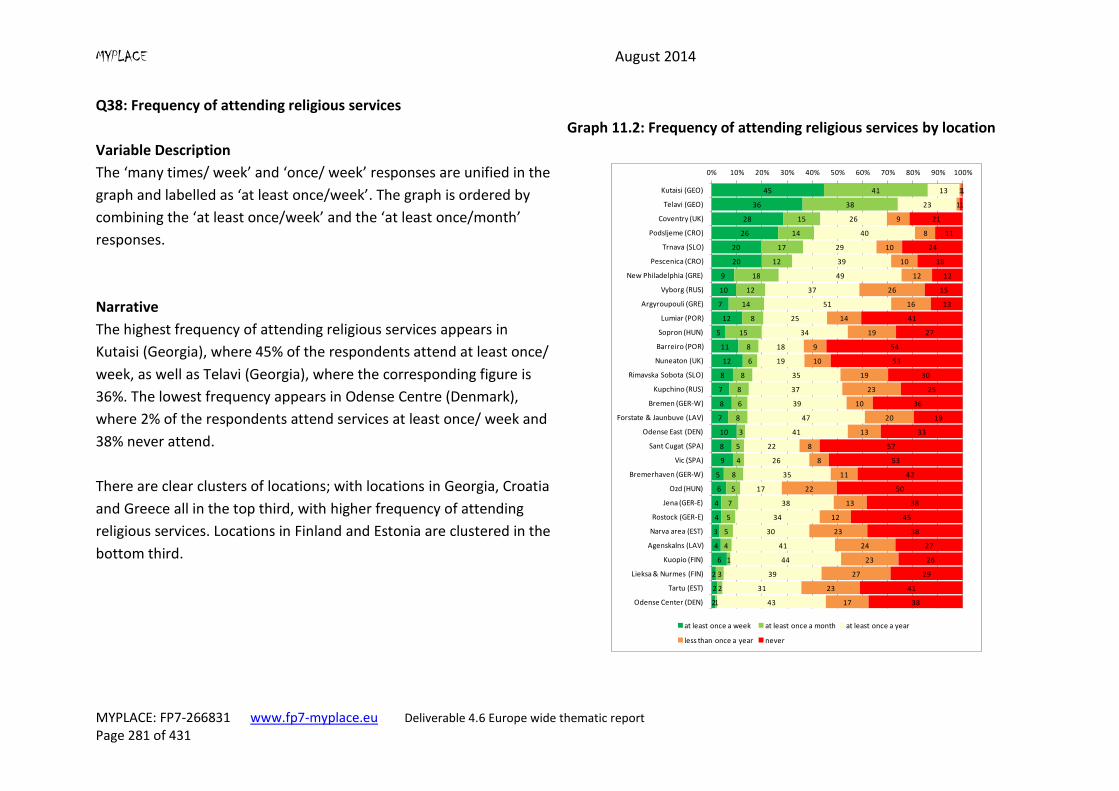
MYPLACE August 2014
MYPLACE: FP7-266831 www.fp7-myplace.eu Deliverable 4.6 Europe wide thematic report Page 281 of 431
Q38: Frequency of attending religious services
Variable Description
The ‘many times/ week’ and ‘once/ week’ responses are unified in the
graph and labelled as ‘at least once/week’. The graph is ordered by
combining the ‘at least once/week’ and the ‘at least once/month’
responses.
Graph 11.2: Frequency of attending religious services by location
Narrative
The highest frequency of attending religious services appears in
Kutaisi (Georgia), where 45% of the respondents attend at least once/
week, as well as Telavi (Georgia), where the corresponding figure is
36%. The lowest frequency appears in Odense Centre (Denmark),
where 2% of the respondents attend services at least once/ week and
38% never attend.
There are clear clusters of locations; with locations in Georgia, Croatia
and Greece all in the top third, with higher frequency of attending
religious services. Locations in Finland and Estonia are clustered in the
bottom third.
45
36
28
26
20
20
9
10
7
12
5
11
12
8
7
8
7
10
8
9
5
6
4
4
3
4
6
2
2
2
41
38
15
14
17
12
18
12
14
8
15
8
6
8
8
6
8
3
5
4
8
5
7
5
5
4
1
3
2
1
13
23
26
40
29
39
49
37
51
25
34
18
19
35
37
39
47
41
22
26
35
17
38
34
30
41
44
39
31
43
1
1
9
8
10
10
12
26
16
14
19
9
10
19
23
10
20
13
8
8
11
22
13
12
23
24
23
27
23
17
1
1
21
11
24
18
12
15
13
41
27
54
53
30
25
36
19
33
57
53
42
50
38
45
38
27
26
29
41
38
0% 10% 20% 30% 40% 50% 60% 70% 80% 90% 100%
Kutaisi (GEO)
Telavi (GEO)
Coventry (UK)
Podsljeme (CRO)
Trnava (SLO)
Pescenica (CRO)
New Philadelphia (GRE)
Vyborg (RUS)
Argyroupouli (GRE)
Lumiar (POR)
Sopron (HUN)
Barreiro (POR)
Nuneaton (UK)
Rimavska Sobota (SLO)
Kupchino (RUS)
Bremen (GER-W)
Forstate & Jaunbuve (LAV)
Odense East (DEN)
Sant Cugat (SPA)
Vic (SPA)
Bremerhaven (GER-W)
Ozd (HUN)
Jena (GER-E)
Rostock (GER-E)
Narva area (EST)
Agenskalns (LAV)
Kuopio (FIN)
Lieksa & Nurmes (FIN)
Tartu (EST)
Odense Center (DEN)
at least once a week at least once a month at least once a year
less than once a year never

MYPLACE August 2014
MYPLACE: FP7-266831 www.fp7-myplace.eu Deliverable 4.6 Europe wide thematic report Page 282 of 431
11.3 Attitude towards religion and the role of religion in
politics (Q39)
Respondents’ attitudes towards religion and its role in politics were measured by a four-
item question. Two of the items examine attitudes towards religious truths (items 1 and 4)
and two of the items investigate the attitudes toward religion’s role in politics (items 2 and
3).
Q39_1 There is only one true religion
Q39_2 Good politicians believe in God
Q39_3 Religious leaders should have no influence on government decisions
Q39_4 None of the major religions have any truths to offer
The factor analysis of these four items did not produce distinct factors, therefore we did not
produce indices and analysed each of the items separately.
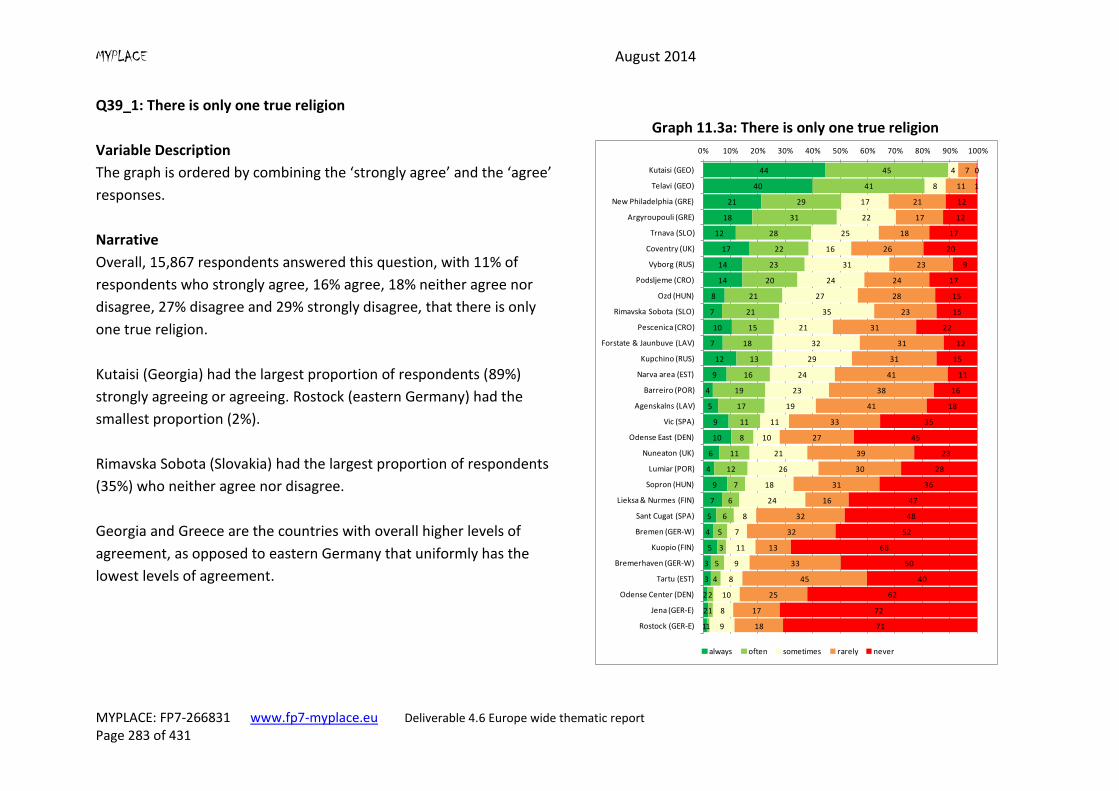
MYPLACE August 2014
MYPLACE: FP7-266831 www.fp7-myplace.eu Deliverable 4.6 Europe wide thematic report Page 283 of 431
Q39_1: There is only one true religion
Variable Description
The graph is ordered by combining the ‘strongly agree’ and the ‘agree’
responses.
Graph 11.3a: There is only one true religion
Narrative
Overall, 15,867 respondents answered this question, with 11% of
respondents who strongly agree, 16% agree, 18% neither agree nor
disagree, 27% disagree and 29% strongly disagree, that there is only
one true religion.
Kutaisi (Georgia) had the largest proportion of respondents (89%)
strongly agreeing or agreeing. Rostock (eastern Germany) had the
smallest proportion (2%).
Rimavska Sobota (Slovakia) had the largest proportion of respondents
(35%) who neither agree nor disagree.
Georgia and Greece are the countries with overall higher levels of
agreement, as opposed to eastern Germany that uniformly has the
lowest levels of agreement.
44
40
21
18
12
17
14
14
8
7
10
7
12
9
4
5
9
10
6
4
9
7
5
4
5
3
3
2
2
1
45
41
29
31
28
22
23
20
21
21
15
18
13
16
19
17
11
8
11
12
7
6
6
5
3
5
4
2
1
1
4
8
17
22
25
16
31
24
27
35
21
32
29
24
23
19
11
10
21
26
18
24
8
7
11
9
8
10
8
9
7
11
21
17
18
26
23
24
28
23
31
31
31
41
38
41
33
27
39
30
31
16
32
32
13
33
45
25
17
18
0
1
12
12
17
20
9
17
15
15
22
12
15
11
16
18
35
45
23
28
36
47
48
52
68
50
40
62
72
71
0% 10% 20% 30% 40% 50% 60% 70% 80% 90% 100%
Kutaisi (GEO)
Telavi (GEO)
New Philadelphia (GRE)
Argyroupouli (GRE)
Trnava (SLO)
Coventry (UK)
Vyborg (RUS)
Podsljeme (CRO)
Ozd (HUN)
Rimavska Sobota (SLO)
Pescenica (CRO)
Forstate & Jaunbuve (LAV)
Kupchino (RUS)
Narva area (EST)
Barreiro (POR)
Agenskalns (LAV)
Vic (SPA)
Odense East (DEN)
Nuneaton (UK)
Lumiar (POR)
Sopron (HUN)
Lieksa & Nurmes (FIN)
Sant Cugat (SPA)
Bremen (GER-W)
Kuopio (FIN)
Bremerhaven (GER-W)
Tartu (EST)
Odense Center (DEN)
Jena (GER-E)
Rostock (GER-E)
always often sometimes rarely never
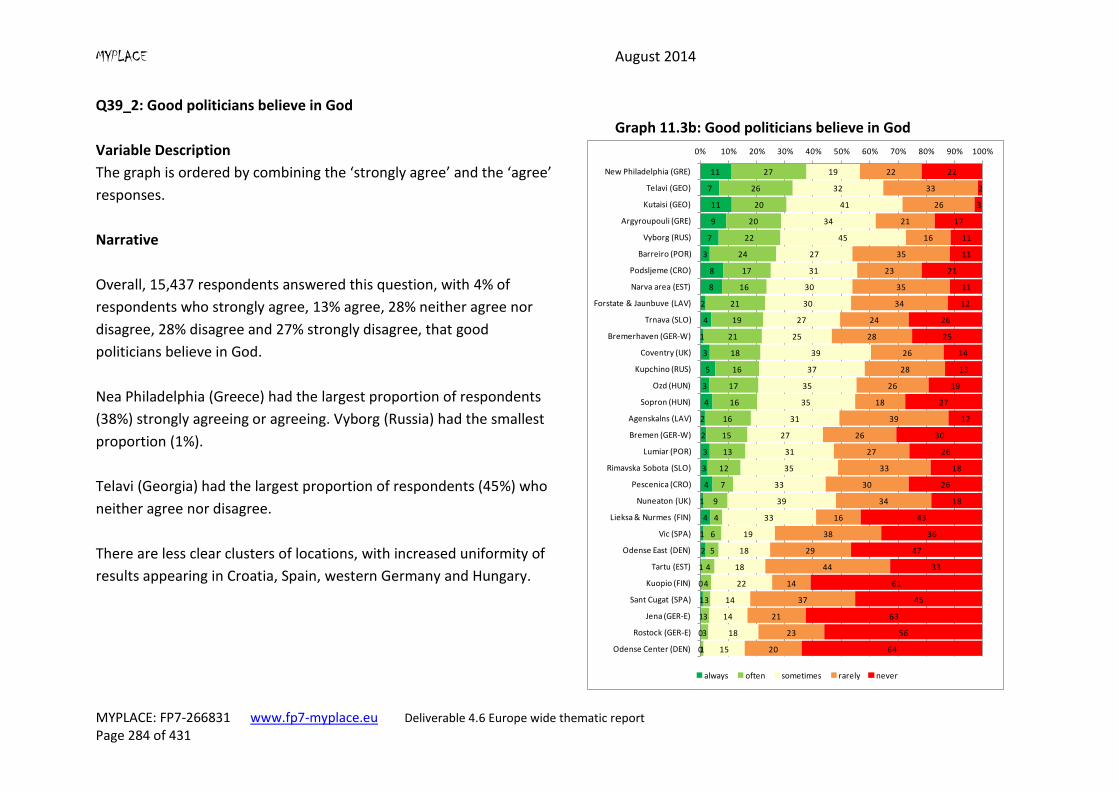
MYPLACE August 2014
MYPLACE: FP7-266831 www.fp7-myplace.eu Deliverable 4.6 Europe wide thematic report Page 284 of 431
Q39_2: Good politicians believe in God
Variable Description
The graph is ordered by combining the ‘strongly agree’ and the ‘agree’
responses.
Graph 11.3b: Good politicians believe in God
Narrative
Overall, 15,437 respondents answered this question, with 4% of
respondents who strongly agree, 13% agree, 28% neither agree nor
disagree, 28% disagree and 27% strongly disagree, that good
politicians believe in God.
Nea Philadelphia (Greece) had the largest proportion of respondents
(38%) strongly agreeing or agreeing. Vyborg (Russia) had the smallest
proportion (1%).
Telavi (Georgia) had the largest proportion of respondents (45%) who
neither agree nor disagree.
There are less clear clusters of locations, with increased uniformity of
results appearing in Croatia, Spain, western Germany and Hungary.
11
7
11
9
7
3
8
8
2
4
1
3
5
3
4
2
2
3
3
4
1
4
1
2
1
0
1
1
0
0
27
26
20
20
22
24
17
16
21
19
21
18
16
17
16
16
15
13
12
7
9
4
6
5
4
4
3
3
3
1
19
32
41
34
45
27
31
30
30
27
25
39
37
35
35
31
27
31
35
33
39
33
19
18
18
22
14
14
18
15
22
33
26
21
16
35
23
35
34
24
28
26
28
26
18
39
26
27
33
30
34
16
38
29
44
14
37
21
23
20
22
2
3
17
11
11
21
11
12
26
25
14
13
19
27
12
30
26
18
26
18
43
36
47
33
61
45
63
56
64
0% 10% 20% 30% 40% 50% 60% 70% 80% 90% 100%
New Philadelphia (GRE)
Telavi (GEO)
Kutaisi (GEO)
Argyroupouli (GRE)
Vyborg (RUS)
Barreiro (POR)
Podsljeme (CRO)
Narva area (EST)
Forstate & Jaunbuve (LAV)
Trnava (SLO)
Bremerhaven (GER-W)
Coventry (UK)
Kupchino (RUS)
Ozd (HUN)
Sopron (HUN)
Agenskalns (LAV)
Bremen (GER-W)
Lumiar (POR)
Rimavska Sobota (SLO)
Pescenica (CRO)
Nuneaton (UK)
Lieksa & Nurmes (FIN)
Vic (SPA)
Odense East (DEN)
Tartu (EST)
Kuopio (FIN)
Sant Cugat (SPA)
Jena (GER-E)
Rostock (GER-E)
Odense Center (DEN)
always often sometimes rarely never
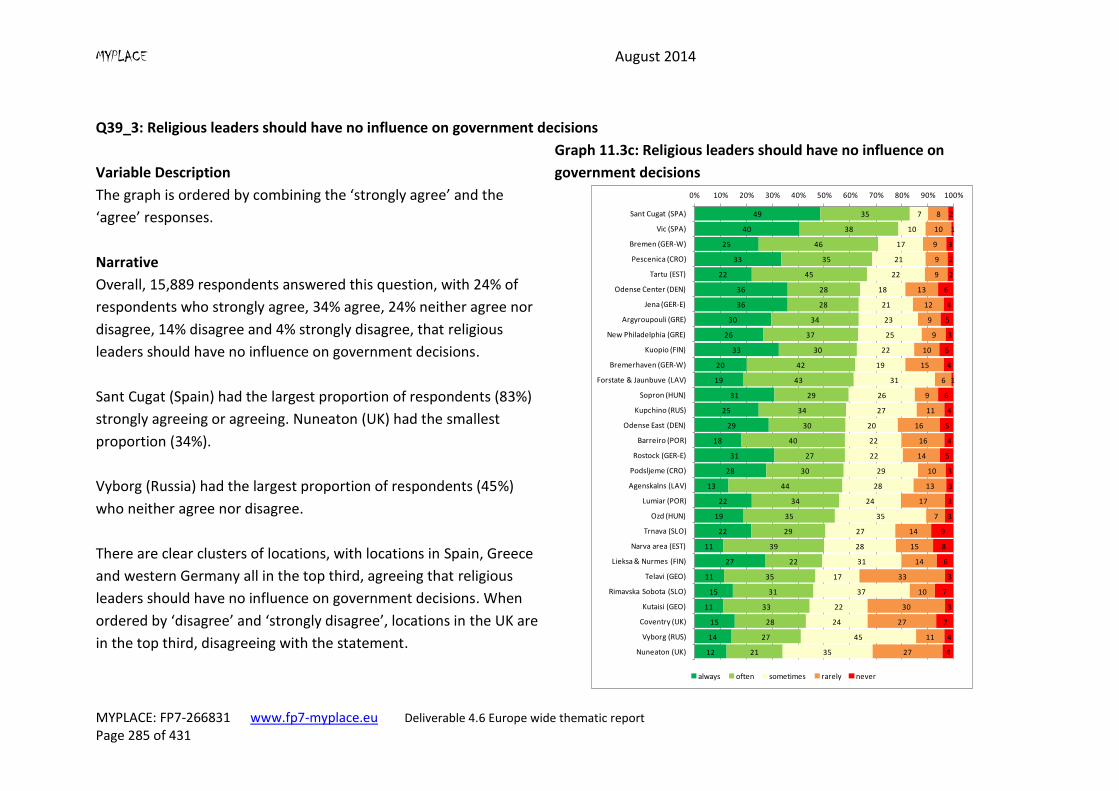
MYPLACE August 2014
MYPLACE: FP7-266831 www.fp7-myplace.eu Deliverable 4.6 Europe wide thematic report Page 285 of 431
Q39_3: Religious leaders should have no influence on government decisions
Variable Description
The graph is ordered by combining the ‘strongly agree’ and the
‘agree’ responses.
Graph 11.3c: Religious leaders should have no influence on
government decisions
Narrative
Overall, 15,889 respondents answered this question, with 24% of
respondents who strongly agree, 34% agree, 24% neither agree nor
disagree, 14% disagree and 4% strongly disagree, that religious
leaders should have no influence on government decisions.
Sant Cugat (Spain) had the largest proportion of respondents (83%)
strongly agreeing or agreeing. Nuneaton (UK) had the smallest
proportion (34%).
Vyborg (Russia) had the largest proportion of respondents (45%)
who neither agree nor disagree.
There are clear clusters of locations, with locations in Spain, Greece
and western Germany all in the top third, agreeing that religious
leaders should have no influence on government decisions. When
ordered by ‘disagree’ and ‘strongly disagree’, locations in the UK are
in the top third, disagreeing with the statement.
49
40
25
33
22
36
36
30
26
33
20
19
31
25
29
18
31
28
13
22
19
22
11
27
11
15
11
15
14
12
35
38
46
35
45
28
28
34
37
30
42
43
29
34
30
40
27
30
44
34
35
29
39
22
35
31
33
28
27
21
7
10
17
21
22
18
21
23
25
22
19
31
26
27
20
22
22
29
28
24
35
27
28
31
17
37
22
24
45
35
8
10
9
9
9
13
12
9
9
10
15
6
9
11
16
16
14
10
13
17
7
14
15
14
33
10
30
27
11
27
2
1
3
2
2
6
4
5
3
6
4
1
6
4
5
4
5
3
3
3
3
9
8
6
3
7
3
7
4
4
0% 10% 20% 30% 40% 50% 60% 70% 80% 90% 100%
Sant Cugat (SPA)
Vic (SPA)
Bremen (GER-W)
Pescenica (CRO)
Tartu (EST)
Odense Center (DEN)
Jena (GER-E)
Argyroupouli (GRE)
New Philadelphia (GRE)
Kuopio (FIN)
Bremerhaven (GER-W)
Forstate & Jaunbuve (LAV)
Sopron (HUN)
Kupchino (RUS)
Odense East (DEN)
Barreiro (POR)
Rostock (GER-E)
Podsljeme (CRO)
Agenskalns (LAV)
Lumiar (POR)
Ozd (HUN)
Trnava (SLO)
Narva area (EST)
Lieksa & Nurmes (FIN)
Telavi (GEO)
Rimavska Sobota (SLO)
Kutaisi (GEO)
Coventry (UK)
Vyborg (RUS)
Nuneaton (UK)
always often sometimes rarely never
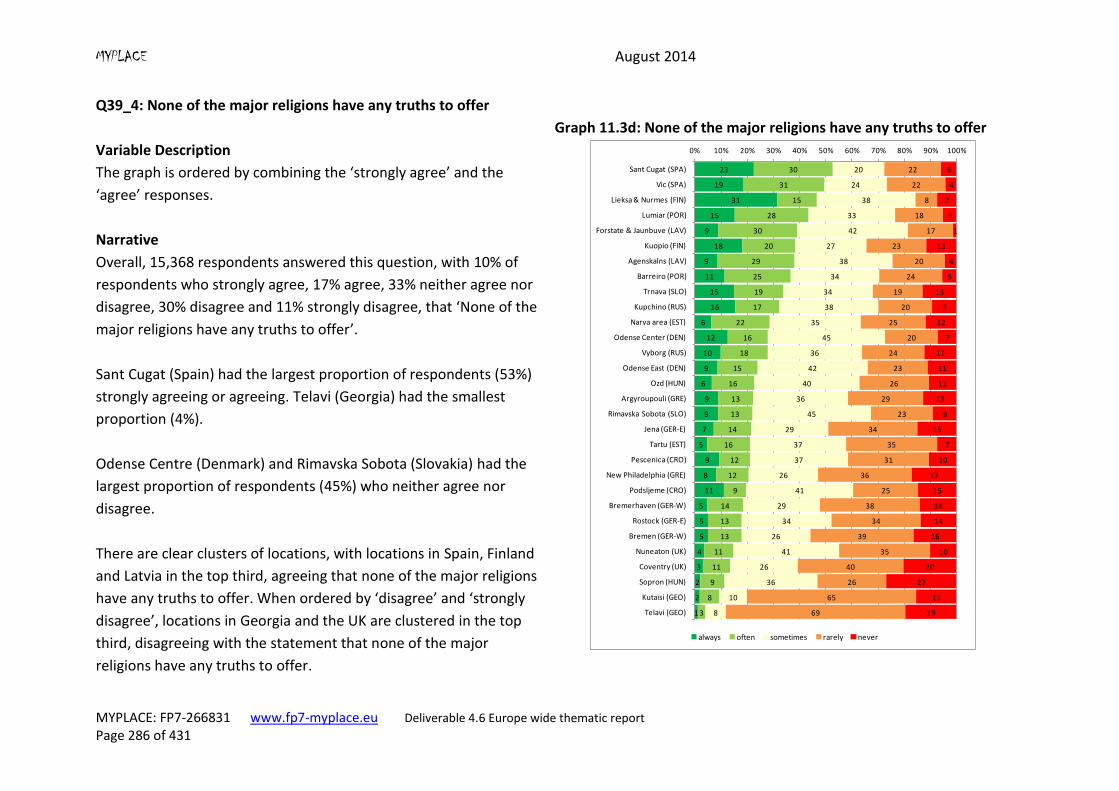
MYPLACE August 2014
MYPLACE: FP7-266831 www.fp7-myplace.eu Deliverable 4.6 Europe wide thematic report Page 286 of 431
Q39_4: None of the major religions have any truths to offer
Variable Description
The graph is ordered by combining the ‘strongly agree’ and the
‘agree’ responses.
Graph 11.3d: None of the major religions have any truths to offer
Narrative
Overall, 15,368 respondents answered this question, with 10% of
respondents who strongly agree, 17% agree, 33% neither agree nor
disagree, 30% disagree and 11% strongly disagree, that ‘None of the
major religions have any truths to offer’.
Sant Cugat (Spain) had the largest proportion of respondents (53%)
strongly agreeing or agreeing. Telavi (Georgia) had the smallest
proportion (4%).
Odense Centre (Denmark) and Rimavska Sobota (Slovakia) had the
largest proportion of respondents (45%) who neither agree nor
disagree.
There are clear clusters of locations, with locations in Spain, Finland
and Latvia in the top third, agreeing that none of the major religions
have any truths to offer. When ordered by ‘disagree’ and ‘strongly
disagree’, locations in Georgia and the UK are clustered in the top
third, disagreeing with the statement that none of the major
religions have any truths to offer.
23
19
31
15
9
18
9
11
15
16
6
12
10
9
6
9
9
7
5
9
8
11
5
5
5
4
3
2
2
1
30
31
15
28
30
20
29
25
19
17
22
16
18
15
16
13
13
14
16
12
12
9
14
13
13
11
11
9
8
3
20
24
38
33
42
27
38
34
34
38
35
45
36
42
40
36
45
29
37
37
26
41
29
34
26
41
26
36
10
8
22
22
8
18
17
23
20
24
19
20
25
20
24
23
26
29
23
34
35
31
36
25
38
34
39
35
40
26
65
69
6
4
7
5
1
11
4
5
13
9
12
7
12
11
11
13
9
15
7
10
17
15
14
14
16
10
20
27
15
19
0% 10% 20% 30% 40% 50% 60% 70% 80% 90% 100%
Sant Cugat (SPA)
Vic (SPA)
Lieksa & Nurmes (FIN)
Lumiar (POR)
Forstate & Jaunbuve (LAV)
Kuopio (FIN)
Agenskalns (LAV)
Barreiro (POR)
Trnava (SLO)
Kupchino (RUS)
Narva area (EST)
Odense Center (DEN)
Vyborg (RUS)
Odense East (DEN)
Ozd (HUN)
Argyroupouli (GRE)
Rimavska Sobota (SLO)
Jena (GER-E)
Tartu (EST)
Pescenica (CRO)
New Philadelphia (GRE)
Podsljeme (CRO)
Bremerhaven (GER-W)
Rostock (GER-E)
Bremen (GER-W)
Nuneaton (UK)
Coventry (UK)
Sopron (HUN)
Kutaisi (GEO)
Telavi (GEO)
always often sometimes rarely never

MYPLACE August 2014
MYPLACE: FP7-266831 www.fp7-myplace.eu Deliverable 4.6 Europe wide thematic report Page 287 of 431
11.4 Multi-level Modelling
The determinants of “religiousness”
Dependent variable
Our dependent variable is “religiousness”, measured in MYPLACE survey by an eleven-scale
question (Q37): “Regardless of whether or not you belong to a particular religion, how
religious would you say you are? 0 means not religious at all and 10 very religious”.
Independent variables
Having reviewed literature on religion and youth, a number of standard socio-economic
variables were included in the model that explain religiousness:
Gender, on the basis of substantial research conducted until today worldwide, investigating possible gender differences regarding religiosity, as well as participation on religious activities.
Parental social class, based on the assumption that lower social status increases the degree of religiousness. Parental is preferred instead of personal status since many young people have not entered the labor market yet and their living standards heavily rely on their parent’s socio/economic status.
Respondent’s economic activity, based on the same rationale explained above: unemployed individuals might express higher need for religiousness, whereas employed – therefore more independent - young people are potentially less religious.
Religion, deriving from the hypothesis that certain religions such as Muslim and Jewish, are associated with more intense religiosity compared to others.
Identity, since being part of the minority in a country might increase the need for religiousness, in the sense of “belonging” to a group as well as in order to feel empowered.
Additionally, a context variable was incorporated in the model, the welfare state types, in
order to investigate whether living in a post-communist country has played a role in shaping
religiousness.
Results
The initial analysis of variance components in the ‘empty’ model in Table 11.8a reveals that
80.3% of the variance in young people’s ‘religiousness’ can be explained by differences
between individuals. Furthermore, an intra-class correlation of 0.197 suggests that 19.7
percent of the overall variance in ‘religiousness’ lies at the level of localities. The substantial
variation at local level justifies the reason for using multilevel analysis in our data.
The inclusion of the described individual variables (in Model 1 in Table 11.8a) resulted in a
27.0% decrease of residual, individual level variance. Chi-square test of deviances
(loglikelihood = 4926.816; df = 13) confirms that this is a significant difference. Adding
individual level variables, led to a 44.6% reduction in the intercept variance, indicating that
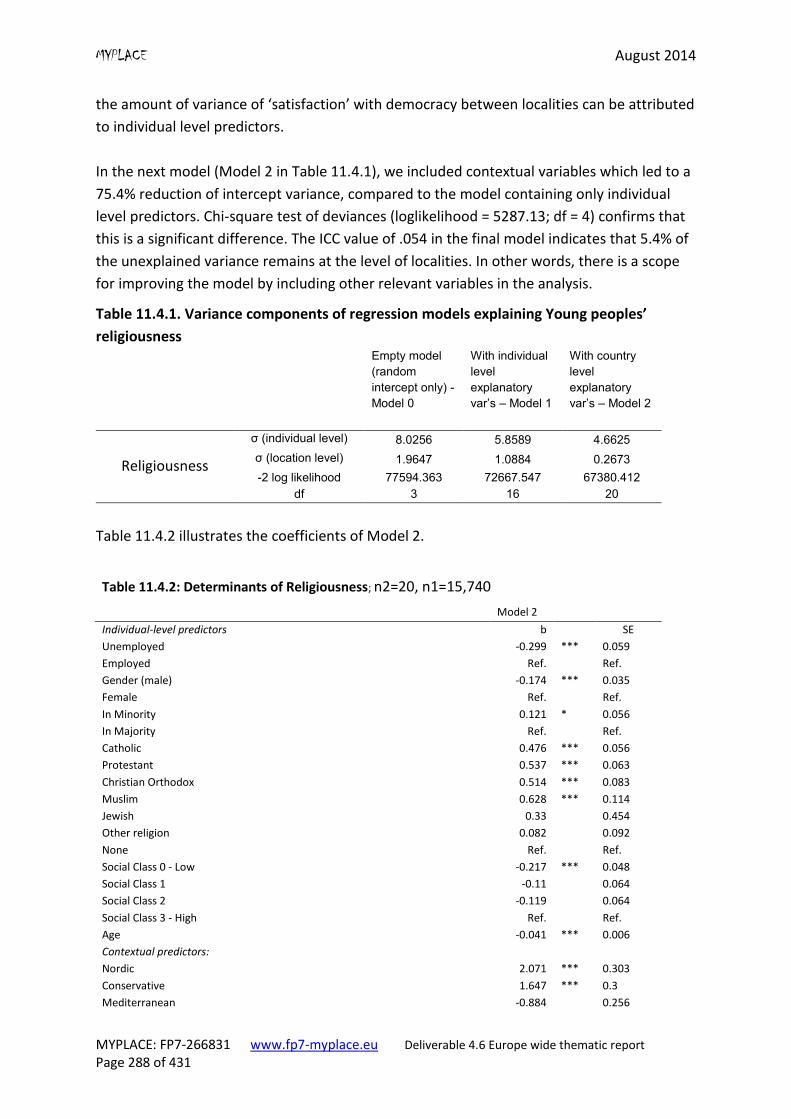
MYPLACE August 2014
MYPLACE: FP7-266831 www.fp7-myplace.eu Deliverable 4.6 Europe wide thematic report Page 288 of 431
the amount of variance of ‘satisfaction’ with democracy between localities can be attributed
to individual level predictors.
In the next model (Model 2 in Table 11.4.1), we included contextual variables which led to a
75.4% reduction of intercept variance, compared to the model containing only individual
level predictors. Chi-square test of deviances (loglikelihood = 5287.13; df = 4) confirms that
this is a significant difference. The ICC value of .054 in the final model indicates that 5.4% of
the unexplained variance remains at the level of localities. In other words, there is a scope
for improving the model by including other relevant variables in the analysis.
Table 11.4.1. Variance components of regression models explaining Young peoples’
religiousness Empty model
(random
intercept only) -
Model 0
With individual
level
explanatory
var’s – Model 1
With country
level
explanatory
var’s – Model 2
Religiousness
σ (individual level) 8.0256 5.8589 4.6625
σ (location level) 1.9647 1.0884 0.2673
-2 log likelihood 77594.363 72667.547 67380.412
df 3 16 20
Table 11.4.2 illustrates the coefficients of Model 2.
Table 11.4.2: Determinants of Religiousness; n2=20, n1=15,740
Model 2
Individual-level predictors b
SE
Unemployed -0.299 *** 0.059
Employed Ref. Ref.
Gender (male) -0.174 *** 0.035
Female Ref. Ref.
In Minority 0.121 * 0.056
In Majority Ref. Ref.
Catholic 0.476 *** 0.056
Protestant 0.537 *** 0.063
Christian Orthodox 0.514 *** 0.083
Muslim 0.628 *** 0.114
Jewish 0.33 0.454
Other religion 0.082 0.092
None Ref. Ref.
Social Class 0 - Low -0.217 *** 0.048
Social Class 1 -0.11 0.064
Social Class 2 -0.119 0.064
Social Class 3 - High Ref. Ref.
Age -0.041 *** 0.006
Contextual predictors:
Nordic 2.071 *** 0.303
Conservative 1.647 *** 0.3
Mediterranean -0.884 0.256
MYPLACE August 2014
MYPLACE: FP7-266831 www.fp7-myplace.eu Deliverable 4.6 Europe wide thematic report Page 289 of 431
Liberal 0.664 0.4
Post-socialist Ref. Ref.
Constant 4.625 *** 0.152
***p<0.001, **p<0.01, *p<0.05; two-tailed tests.
There are a number of individual level predictors, which are significant in the multi-level
model of religiousness. As far as gender is concerned, females appear more religious than
men, confirming the extensive relevant research findings. Young people who are
unemployed are less religious than those who are employed. Social class is also significant,
with young people from a higher parental social class are more religious than those from
lower social class groups.
In terms of religion, Muslims express higher levels of religiousness, as expected. Protestants
follow, along with Christian Orthodox and Catholics when compared with nonbelievers.
Jewish and Other religions were not significant. The age of young people was significant,
with older respondents stating they were less religious than younger respondents were. This
could be due to the greater influence of home life/parents over younger people regarding
religion, and as young people become more independent, they become less religious.
Moreover, being a minority member increases religiousness (p<.05), compared to belonging
in the majority within the country. This finding is in line with our initial hypothesis. We
expected that people who don’t belong to the mass culture express their faith more
intensely for a number of reasons. To begin with, being “different” generates the need to
strengthen one’s identity; religion can become one of the fundamental components of
personal identity. Moreover, being religious can mean attending religious services,
preserving traditions and executing rituals, all the above potentially contributing to social
integration. Furthermore, being a minority could lead to marginalization, thus increasing the
need to feel empowered – a possible benefit of intense religiousness.
Welfare State type contextual predictors, illustrate that young people from Nordic and
Conservative welfare state types have significantly higher levels of religiousness than post-
socialist types. Mediterranean countries are less religious, but are not statistically
significant.
11.5 Summary
Measuring religiosity is a difficult task due to the variety of components that it includes. In
the present survey we used an eleven-point scale where respondents categorised
themselves based on whether they believed they were religious or not. From the
comparative analysis of results, different clusters of countries appeared according to their
MYPLACE August 2014
MYPLACE: FP7-266831 www.fp7-myplace.eu Deliverable 4.6 Europe wide thematic report Page 290 of 431
level of religiosity. Georgia, Greece, Croatia and Russia were part of the cluster which
exhibited high scores on religiosity, whereas eastern Germany, Spain and Denmark
constituted the cluster with low levels of religiosity.
Regarding the frequency of attending religious services, Georgia, Croatia and Greece were
again those countries characterised by high levels of frequency of attending religious
services, whereas Finland, Estonia and Denmark belonged to the cluster exhibiting low
levels of frequency.
Georgia and Greece were the countries in which, overall, higher levels of agreement with
the statement that there is only one true religion were encountered; eastern Germany
demonstrated the lowest levels of agreement. Along the same lines, New Philadelphia in
Greece scored highly in ‘strongly agreeing/agreeing’ with the the statement that good
politicians believe in God. The results of the analysis of responses to that statement showed
that there was significant differences both within and between countries. Eighty three per-
cent of the respondents from Sant Cugat, Spain, ‘strongly agreed or agreed’ that religious
leaders should have no influence on government decisions, whereas 34% of the
respondents in Nuneaton, UK ‘strongly agreed or agreed’ to the aforementioned statement.
Again, three clear clusters of locations were identified, with locations in Spain, Greece and
western Germany agreeing that religious leaders should have no influence on government
decisions. Locations in the UK were in the top third disagreeing with the statement.
Fifty three per-cent of the respondents in Sant Cugat in Spain, ‘strongly agreed or disagreed’
with the statement that none of the major religions have any truths to offer while only 4% of
the respondents in Telavi in Georgia ‘strongly agreed or agreed’ with this statement. Spain,
Finland and Latvia constituted the cluster of countries that agreed more with that
statement, whereas Georgia and UK presented high scores of disagreement.
Regarding the most significant determinants of religiosity, the analysis verified our original
hypotheses. More specifically, gender turned out to be a variable that affects levels of
religiosity, as women appeared more religious than men. Numerous surveys have
repeatedly argued that women are characterised by high levels of religiosity and this
explains the fact that in every piece of quantitative research the gender variable is included
(Stark, 2002:496).
As expected and stated in our original hypotheses, Muslim respondents appear more
religious. Orthodox Christians follow, along with Catholic and Jewish respondents.
Protestant respondents expressed religiousness to a somewhat lesser extent than others
declaring belonging to a faith group, although their religiosity was still significant.
MYPLACE August 2014
MYPLACE: FP7-266831 www.fp7-myplace.eu Deliverable 4.6 Europe wide thematic report Page 291 of 431
Finally, being a part of a minority group increases one’s level of religiosity. This mainly
applies to immigrants who are equipped with different social and cultural capital compared
to the native population and thus try to preserve it and to communicate it to the next
generations in order to maintain their collective memory and identity. Religion in this
process of assimilation plays a crucial role and is vital in the process of crafting an identity.
Religion is not a trait or a characteristic that is strongly associated with a country or a certain
place, and thus helps the people in a country to overcome isolation and marginalisation.
Furthermore being active in religious activities and organisations enables the process of
socialisation and provides people with opportunities for civic engagement and social action.
Finally, when religion is a prominent component of a person’s identity and much of
everyday life is organised around these needs, then it is possible that other differences that
mark an individual’s marginalised place in society, are less pronounced.
References
Bendroth, M.L. (1993). Fundamentalism and Gender: 1875 to the present, New Haven: Yale
University Press.
Bengtson, V.L., Putney, N., Harris, S. (2013). Families and Faith: How Religion is Passed Dawn
Across Generations, New York: Oxford University Press.
Cadge, W. and Ecklund, E.H. (2006). ‘Religious Service Attendance among Immigrants:
Evidence from the New Immigrant Survey-Pilot’, American Behavioral Scientist, No 49 (11),
pp.1574-1595.
Clark, E.A. (ed.) (1997). Women and Religion: The Original Sourcebook of Women in Christian
Thought, San Francisco: Harper.
Collins-Mayo, S. (2012). “Youth and Religion: An International Perspective”, Theo-Web.
Zeitschrift fur Religionspadagogik 11, H.1, pp:80-94.
Davidson, J.D. (1977). “Socio-Economic Status and Ten Dimensions of Religious
Commitment,” Sociology and Social Research, No 61, pp: 462-485.
Demereth, N.J. III (1965). Social Class in American Protestantism, Chicago: Rand McNally.
Ebaugh, H.R. and Chafetz, J.S. (2000). Religion and the New Immigrants: Continuities and
Adaptations in Immigrant Congregations, Walnut Creek, CA: Alta Mira Press.
Ebaugh, H.R. (2003). “Religion and the New Immigrants”, in M.Dillon (ed.), Handbook of the
Sociology of Religion, New York: Cambridge University Press, pp:225-239.
Fulkerson, M. (1994). Changing the Subject: Women’s discourses and Feminist Theology,
Minneapolis: Fortress Press.
Gordon, M.M. (1964). Assimilation in American Life, New York: Oxford University Press.
MYPLACE August 2014
MYPLACE: FP7-266831 www.fp7-myplace.eu Deliverable 4.6 Europe wide thematic report Page 292 of 431
Greeley, A.M. (1972). The Denominational Society: A Sociological Approach to Religion in
America, Glenview, IL: Scott, Foresman.
Hawthorne, S. (2011). “Religion and Gender”, in P.Clarke (ed.), The Oxford Handbook of the
Sociology of Religion, Oxford: Oxford University Press, pp:134-151.
Juschka, D.M. (ed.) (2001). Feminism in the Study of Religion: A Reader, London, New York:
Continuum.
Kepel, G. (1991). La Revanche de Dieu, Paris: Editions du Seuil
Krause, N., Ellison, C.G. and Markum, J.P. (2002). “The effects of church-based emotional
support on health. Do they vary by gender?”, Sociology of Religion, No 63(1), pp: 21-47.
Küçükcan, T. (2010). Multidimensional Approach to Religion: a way of looking at religious
phenomena. Journal for the Study of Religions and Ideologies, No 4(10), pp: 60-70.
Lowenthal, K.M., MacLeod, A.K. and Cinnirella, M. (2002). “Are women more religious than
men? Gender differences in religion activities among different religion groups in UK”.
Personality and Individual differences, No 32, pp: 133-139.
Nason-Clark, N. and Neitz, M. (eds.) (2001). Feminist Narratives and the Sociology of
Religion, Oxford: AltaMira Press.
Smith, T. (1978). ‘Religion and Ethnicity in America’, American Historical Review, No 83, pp:
1155-1185.
Stark, R. (1972). “The Economics of Piety,” in G. Thielbar and S. Feldman (eds) Issues in
Social Inequality. Boston: Little Brown, pp: 483-503.
Stark. R. (2002). Physiology and faith: Addressing the ‘universal’ gender difference in
religious commitment”. Journal for the scientific study of religion, No 41(3), pp: 495-507.
Verbit, M. F. (1970). “The components and dimensions of religious behavior: Toward a
reconceptualization of religiosity”. American mosaic, pp: 24 - 39.
Woodhead, L. (2007). “Gender Differences in Religious Practice and Significance”, in
J.Beckford and N.J.Demerath III (eds.) The Sage Handbook of the Sociology of Religion,
London: Sage, pp: 566-586.
MYPLACE August 2014
MYPLACE: FP7-266831 www.fp7-myplace.eu Deliverable 4.6 Europe wide thematic report Page 293 of 431
Chapter 12: Attitudes towards minority groups
Since the recent global economic crisis, right wing extremism and support for populist
radical right parties across Europe, has been on a rise, driven by rising anti-immigrant and
anti-establishment sentiments. Therefore, one of the main goals of the MYPLACE survey was
to analyse young people’s support for far right ideology: the prevalence of xenophobia,
welfare chauvinism, exclusionism, and overall negative attitudes towards minority groups.
In this chapter we look at how widespread, these attitudes are among youth, in our selected
localities, and what factors are driving them.
The national reports provide a mixed picture of the intra-country differences between our
research locations, as well as views of different socio-demographic groups. In some
countries one can observe large differences between the opinions of respondents in the two
research locations (e.g., Greece, Spain, Hungary, Latvia, Estonia, Russia, Finland, the UK),
whereas in others the differences are small or almost non-existent (e.g., Denmark).
Considering the similar cultural background of the localities within a country, one can
assume that certain contextual or compositional factors might explain the differences.
Nevertheless, there are some intriguing similarities that researchers have found in their
data, pointing to more general determinants of negative attitudes towards different ethnic
and religious minorities.
In some cases, the intra-country differences still do not obscure the distinctiveness of
attitudes of the young inhabitants of some countries. For example, citizens of post-Soviet
countries, Latvia, Estonia, and Russia, seem to have generally the most negative attitudes
towards minorities and immigrants, whereas young people in Germany hold the most
tolerant and inclusive opinions. The national reports also reveal a strong concern about the
growing immigration rates among young people in the South of Europe, especially in Greece
and Portugal, regardless of the location; resulting in calls for stricter border controls.
Moreover, xenophobia is also extremely widespread among youth in Russia.
While in Russia, one can talk about a general prejudice towards minorities and immigrants
as one attitudinal dimension, in other countries (e.g., Greece or Hungary) it is not
necessarily the case. National reports clearly show that all ethnic or religious minorities, are
not treated the same by the young people; some are more tolerated or respected than
others. In many of our surveyed countries (e.g., Denmark, Finland, Portugal, Spain, Russia,
Slovakia), the ethnic group most prone to discrimination are the Roma. In Greece, especially
the Argyroupoli area, the least trusted group are Albanians, who are the largest minority
group in the country. In post-Soviet, Estonia and Latvia, there is a large minority of Russians,
yet attitudes towards this group, despite the politicised issue of ethnic relations in these
MYPLACE August 2014
MYPLACE: FP7-266831 www.fp7-myplace.eu Deliverable 4.6 Europe wide thematic report Page 294 of 431
countries, are mostly positive. The report on Latvia highlights the role of history and media
in facilitating inter-ethnic tensions.
Several socio-demographic variables are consistently linked to negative attitudes towards
ethnic and religious minorities across the localities covered in the national reports. In many
countries (e.g., Finland, Germany, Russia, and the UK) individuals with low levels of
education and working class backgrounds are most likely to have negative attitudes towards
minorities and immigrants. Nevertheless, there are some exceptions: in Slovakia the lowest
education and socio-economic status group tends to have more positive views on the Roma,
which the authors explain by the fact that respondents of lower social classes, are more
likely to be Roma themselves. In several national reports (e.g., Latvia, Spain) researchers
note that attitudes towards immigrants and minorities are also linked to a person’s financial
situation, with those experiencing resource-stress bearing more negative views. In Russia,
researchers find that age or rather experience of meeting different ‘others’ can increase
tolerance and lessen prejudice. In addition, some reports (eastern Germany, Latvia) have
also highlighted the importance of political knowledge and interest in politics as factors
reducing prejudice towards immigrants and different ethnic and religious groups. In some
other countries (Greece, Russia, and the UK) male respondents were found to bear more
extreme and negative views towards minorities, than females.
Analysis of Southern European countries (Spain, Greece) indicates that attitudes towards
minorities can depend on the number of immigrants or minority residents in the area.
Nevertheless, for example in Denmark, the fact that there are more Muslims in Odense East
than Odense Centrum does not result in differing attitudes towards this group, and in Latvia
xenophobic attitudes are widespread, despite the very low immigration rates. Analysing the
Spanish localities, researchers note that the type of immigration might explain at least some
of the differences: most immigrants in Sant Cugat are from the richest European countries,
whereas Vic receives very a different kind of migrants, resulting in much higher support for
far right anti-immigrant parties in this location. The Russian national report suggests that
attitudes towards minorities and immigrants can also depend on the type and size of
locality: young people in Vyborg - a small, provincial and conservative locality – have more
anti-immigrant attitudes, whereas in Kupchino, which is a part of a large city, ethno-religious
tensions are more widespread.
Attitudes towards different ethnic minorities seem to vary by the country of origin or ethnic
group that the respondent himself belongs to, yet the effect is not consistent. In some cases
it is the majority ethnic group that holds comparatively more discriminatory attitudes
towards minorities (e.g. in Latvia, Slovakia, or the UK), in some – the non-majority groups
(e.g., in eastern Germany). A closer inspection of the data reveals that ethnic minorities
tend to have more positive attitudes towards their own group, whereas in general, ethnic
majority group seems to be more tolerant. A good example is Estonia, where Estonians are
MYPLACE August 2014
MYPLACE: FP7-266831 www.fp7-myplace.eu Deliverable 4.6 Europe wide thematic report Page 295 of 431
more accepting of the Roma, Jews, and Muslims, whereas other ethnic groups
(predominantly Russians) voice more positive views in respect to Russians. In Slovakia, too
researchers explain more positive attitudes towards Roma among minority respondents, by
the fact that many of them are Roma themselves. Similarly, in the UK, respondents in
Coventry, which is a much more ethnically diverse location, have greater tolerance towards
immigrants and more positive attitudes towards ethnic and religious minorities compared to
the more ethnically homogenous Nuneaton.
Finally, the national reports reveal that young people have generally positive views
regarding the contribution of immigrants to cultural diversity, and most often would support
granting them the same rights to welfare as the local population. Nevertheless, the issue of
jobs is by far the most sensitive. In many of the surveyed countries (e.g., Estonia, Greece,
Portugal, and Spain) despite overall positive attitudes towards immigrants, young people
believe that in a situation when jobs are scarce, employers should give priority to local
people.
Literature Negative attitudes towards minorities, xenophobia, as well as welfare chauvinism and
exclusionism, are characteristic features of far right ideology, often leading to social
exclusion, discrimination, or even open aggression and conflicts. Which social group is
disliked or stigmatised the most, differs from country to country. In Western Europe, much
attention has been drawn to immigrants from outside the European Union, especially
Muslims, in the context of the alleged ‘Islamisation’ of Europe or the debate on terrorism
and security (Mares, 2013; Yilmaz, 2012). East-Central countries have received criticism as
regards treatment of certain ethnic groups (e.g., Russians in Latvia and Estonia, Hungarians
in Romania and Slovakia, Turks in Bulgaria), yet the most victimised minority group in the
region is still the Roma (Mudde, 2005). For historical reasons, unlike in the western, in post-
communist countries the concept of ‘other’ revolves most around the ethnic groups that
settled in these countries during the Soviet times.
Not all countries have the same minority groups, and for historical reasons the
characteristics of these groups and attitudes towards them vary. In addition, the level of
development and welfare systems may influence the numbers and type of immigrants the
country attracts, as well as options for immigrants to integrate into the labour market. The
question of welfare provision to immigrants has recently been growing in importance in the
political agenda of Western European countries too.
Different explanations have been given to far right attitudes, some concentrating on
individual social background or socio-psychological characteristics of an individual, some -
socio-political or protest attitudes, or socio-structural explanations (immigration,
MYPLACE August 2014
MYPLACE: FP7-266831 www.fp7-myplace.eu Deliverable 4.6 Europe wide thematic report Page 296 of 431
unemployment etc.) and institutional factors (political opportunity structure). Previous
research has shown that those at the bottom of the social structure (working class, with a
lower level of education and income) due to their less secure position feel more insecure
and can be expected to bear more far-right attitudes. The dominant ethnic group, has been
shown in previous studies, to ascribe higher importance to national identity (Lewin-Epstein
and Levanon, 2005),. Whereas according to the ‘cultural affinity thesis’, those who are
themselves excluded from the dominant culture, are more likely to develop feelings of
acceptance and empathy towards members of other marginalised or minority groups
(Fetzer, 2000; Hewstone et al., 2002; Binder et al., 1997). Ethnic nationalism has also been
mentioned as one of the factors driving exclusionist attitudes, as well as overall
suspiciousness and lack of trust in people in general. Xenophobia and negative attitudes
towards minorities are often fuelled by populist ideology, and it thrives on ignorance and
irrational fear, as being most likely to appeal to people who have little knowledge and
understanding of politics, and little trust in politicians. According to the ‘contact hypothesis’
(Allport, 1954; Pettigrew, 1971; Fetzer, 2000), contact with minorities is supposed to lessen
extra-group hostility and prejudice. If there are more such people in the locality, there is
more information and contact with other ethnic groups, thus, less space for extra-group
stereotypes. Welfare state type can also have an effect on xenophobia and negative
attitudes towards minorities. Due to their historical legacies, post-soviet countries, can be
expected to be more xenophobic and prejudiced against minority groups. Also, low social
expenditure leads to economic insecurity (Mau et al., 2012) thus one can expect the liberal
regime type to facilitate xenophobia, more than the Scandinavian type that offers
comprehensive social insurance coverage. ‘Realistic group conflict’ theory (Sherif and Sherif
1953) holds that if people see poverty around them, the economy of their country going
downhill, and immigration rates increasing, resource stress will facilitate development of
xenophobia and negative attitudes towards minority groups.
Based on the literature, we include several individual and contextual variables in our
regression models predicting negative attitudes towards minorities, xenophobia, welfare
chauvinism and exclusionism. Among them are standard socio-economic variables such as
age; gender; education; income (how easy to cope on present household income) and
economic status (unemployed, student, other vs. employed). Considering that many young
people still have not entered the labour market, we use parents’ social class as a proxy for
young people’s social class. We also include in our analysis country of birth ([country],
other), citizenship ([country], other), and ethnic group (majority, other). Surprisingly, these
variables are not too closely related, which would make a simultaneous inclusion of all of
them in the model impossible.
Among attitudinal variables, ethnic nationalism was included in the model, coded as a
summary variable from how important it is, for being a citizen of [country], ’to have been
born in [country]’ and’have at least one ethnic [country] parent)’. Crombach Alpha values
MYPLACE August 2014
MYPLACE: FP7-266831 www.fp7-myplace.eu Deliverable 4.6 Europe wide thematic report Page 297 of 431
>0.7 in all countries except Estonia (0.62) confirmed that the items form a coherent and
reliable scale; Attitudes towards minority groups can also be influenced by overall trust in
fellow people, thus, we included the generalised trust question. To test the impact of
dissatisfaction with incumbent politicians, we calculated the political trust index, consisting
of trust in government, parliament, and parties. Besides ‘interest in politics’ we also include
in our model, political knowledge score, calculated as a summary index of how many of the
three knowledge questions (country-specific) the respondent answered correctly.
Considering the ‘contact hypothesis’, we also include in our model, contact with minorities
index (how many close friends are members of a different race / ethnic or minority group);
Another potentially important explanatory variable - media exposure – was coded as a
summary index of the intensity of following news in media.
Among the contextual variables, we include welfare state types (Kaariainen and Lehtonen,
2006). We also analyse the effect of immigration rates, changes in GPD during the recent
economic crisis, and local-level poverty rates.28 In addition, we include the percentage of
young people born outside the country (as a proxy for recent immigrant population) and
belonging to an ethnic minority.
12.1 Attitudes towards minorities (Q40)
Six questions were included in the MYPLACE survey that measure attitudes towards three
different minority groups - Roma, Jews, and Muslims – as well as immigrants in general,
using a 5-point scale from strongly agree to strongly disagree:
Q40_1 Roma, Gypsies and travellers make a positive contribution to society
(‘strongly agree, agree, neither agree nor disagree, disagree, strongly disagree’)
Q40_2 The police should be stricter with Roma / Gypsies / travellers
Q40_3 Jewish people talk too much about what happened to them during the
Holocaust
Q40_4 Jewish people make an important contribution to society
Q40_5 Muslims make a positive contribution to society
Q40_6 It is right to be suspicious of Muslims
Q41_3 Migrants greatly contribute to national cultural diversity
The items were recoded so that in all cases a higher value would indicate a more negative
attitude. Considering that the attitudes towards different minorities should not necessarily
correlate, an index was created from these seven questions, by summing the scores and
dividing it by the number of items.
28
The percentage of families who find it difficult or very difficult to get by on their present income, aggregated from the answers of respondents as this is the most precise available measure at the level of localities.
MYPLACE August 2014
MYPLACE: FP7-266831 www.fp7-myplace.eu Deliverable 4.6 Europe wide thematic report Page 298 of 431
A further analysis revealed that except for Georgia (0.31) and Hungary (0.54), Cronbach
Alpha values of the newly formed factor are above 0.6. An overall Conbach Alpha of 0.73
indicates a good internal consistency of the scale. Principal Component Analysis too
suggested a one-factor solution, based on Eigenvalues >1, which explains 44% of the
variation in the data. Spearman correlations (two-tailed) between the seven items are all
highly significant and range from 0.2 to 0.57. It means that if a person has a negative
attitude towards one minority group, he or she is more likely to have negative attitudes
towards other groups too.
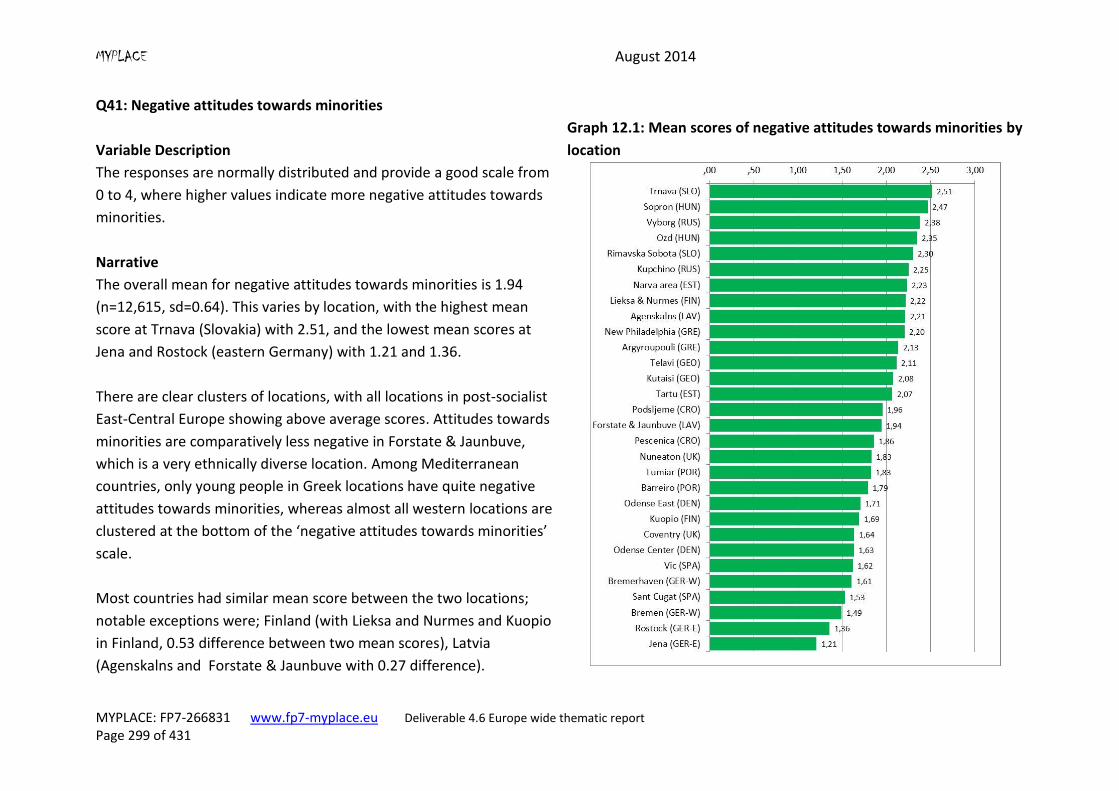
MYPLACE August 2014
MYPLACE: FP7-266831 www.fp7-myplace.eu Deliverable 4.6 Europe wide thematic report Page 299 of 431
Q41: Negative attitudes towards minorities
Variable Description
The responses are normally distributed and provide a good scale from
0 to 4, where higher values indicate more negative attitudes towards
minorities.
Graph 12.1: Mean scores of negative attitudes towards minorities by
location
Narrative
The overall mean for negative attitudes towards minorities is 1.94
(n=12,615, sd=0.64). This varies by location, with the highest mean
score at Trnava (Slovakia) with 2.51, and the lowest mean scores at
Jena and Rostock (eastern Germany) with 1.21 and 1.36.
There are clear clusters of locations, with all locations in post-socialist
East-Central Europe showing above average scores. Attitudes towards
minorities are comparatively less negative in Forstate & Jaunbuve,
which is a very ethnically diverse location. Among Mediterranean
countries, only young people in Greek locations have quite negative
attitudes towards minorities, whereas almost all western locations are
clustered at the bottom of the ‘negative attitudes towards minorities’
scale.
Most countries had similar mean score between the two locations;
notable exceptions were; Finland (with Lieksa and Nurmes and Kuopio
in Finland, 0.53 difference between two mean scores), Latvia
(Agenskalns and Forstate & Jaunbuve with 0.27 difference).
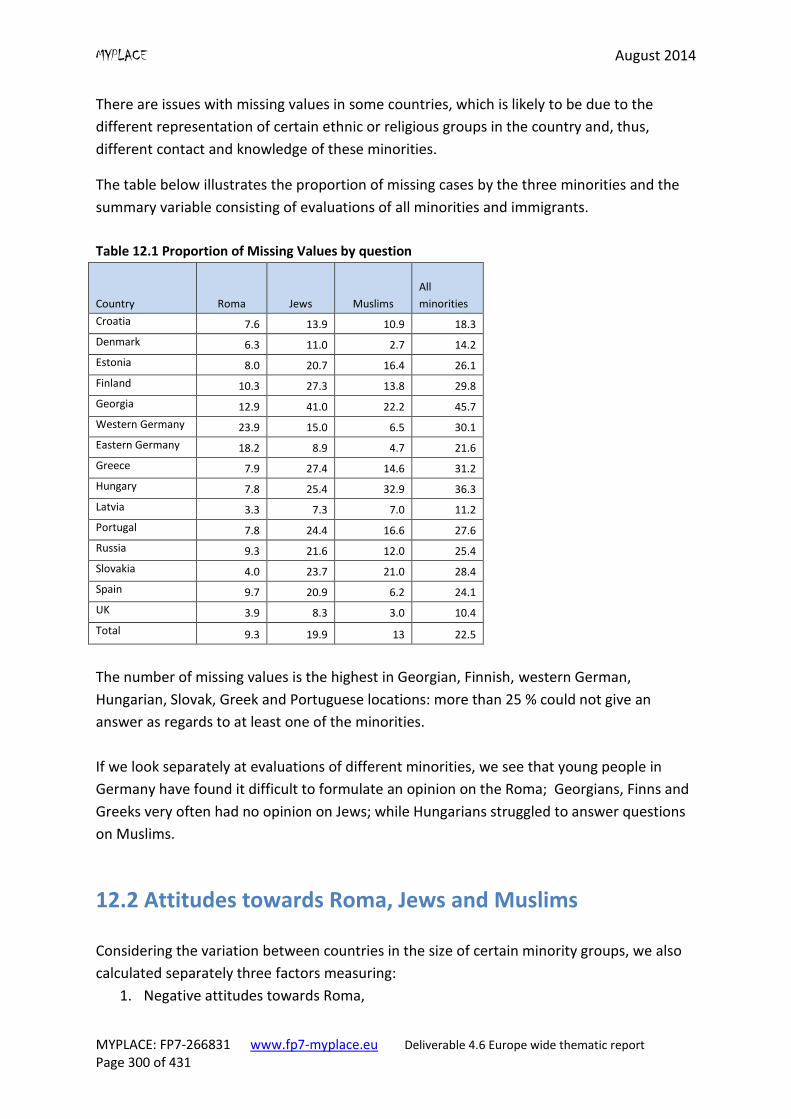
MYPLACE August 2014
MYPLACE: FP7-266831 www.fp7-myplace.eu Deliverable 4.6 Europe wide thematic report Page 300 of 431
There are issues with missing values in some countries, which is likely to be due to the
different representation of certain ethnic or religious groups in the country and, thus,
different contact and knowledge of these minorities.
The table below illustrates the proportion of missing cases by the three minorities and the
summary variable consisting of evaluations of all minorities and immigrants.
Table 12.1 Proportion of Missing Values by question
Country Roma Jews Muslims
All
minorities
Croatia 7.6 13.9 10.9 18.3
Denmark 6.3 11.0 2.7 14.2
Estonia 8.0 20.7 16.4 26.1
Finland 10.3 27.3 13.8 29.8
Georgia 12.9 41.0 22.2 45.7
Western Germany 23.9 15.0 6.5 30.1
Eastern Germany 18.2 8.9 4.7 21.6
Greece 7.9 27.4 14.6 31.2
Hungary 7.8 25.4 32.9 36.3
Latvia 3.3 7.3 7.0 11.2
Portugal 7.8 24.4 16.6 27.6
Russia 9.3 21.6 12.0 25.4
Slovakia 4.0 23.7 21.0 28.4
Spain 9.7 20.9 6.2 24.1
UK 3.9 8.3 3.0 10.4
Total 9.3 19.9 13 22.5
The number of missing values is the highest in Georgian, Finnish, western German,
Hungarian, Slovak, Greek and Portuguese locations: more than 25 % could not give an
answer as regards to at least one of the minorities.
If we look separately at evaluations of different minorities, we see that young people in
Germany have found it difficult to formulate an opinion on the Roma; Georgians, Finns and
Greeks very often had no opinion on Jews; while Hungarians struggled to answer questions
on Muslims.
12.2 Attitudes towards Roma, Jews and Muslims
Considering the variation between countries in the size of certain minority groups, we also
calculated separately three factors measuring:
1. Negative attitudes towards Roma,

MYPLACE August 2014
MYPLACE: FP7-266831 www.fp7-myplace.eu Deliverable 4.6 Europe wide thematic report Page 301 of 431
2. Negative attitudes towards Jews and
3. Negative attitudes towards Muslims.
To learn about respondents’ attitudes towards Roma, they were asked, using a 5-point scale
from ‘strongly agree’ to ‘strongly disagree’, if:
Q40_1 Roma, Gypsies and travellers make a positive contribution to society
(‘strongly agree, agree, neither agree nor disagree, disagree, strongly disagree’)
Q40_2 The police should be stricter with Roma / Gypsies / travellers
Attitudes towards Jews were measured on the basis of following items:
Q40_3 Jewish people talk too much about what happened to them during the
Holocaust
Q40_4 Jewish people make an important contribution to society
And, finally, attitudes towards Muslims – with the following items:
Q40_5 Muslims make a positive contribution to society
Q40_6 It is right to be suspicious of Muslims
The items were recoded so that in all cases a higher value would indicate a more negative
attitude. An index was created from these two questions, by summing the scores and
dividing it by two.
The two items measuring attitudes towards Roma and Muslims were highly correlated, and
can be said to form an acceptable scale (Cronbach Alpha>0.6), whereas the two items
measuring attitudes towards Jews Q40_3 and Q40_4 are not so closely related (Spearman’s
correlation 0.25, Cronbach Alpha 0.41). Nevertheless, they both indicate negative
associations with Jews, so we code them together.
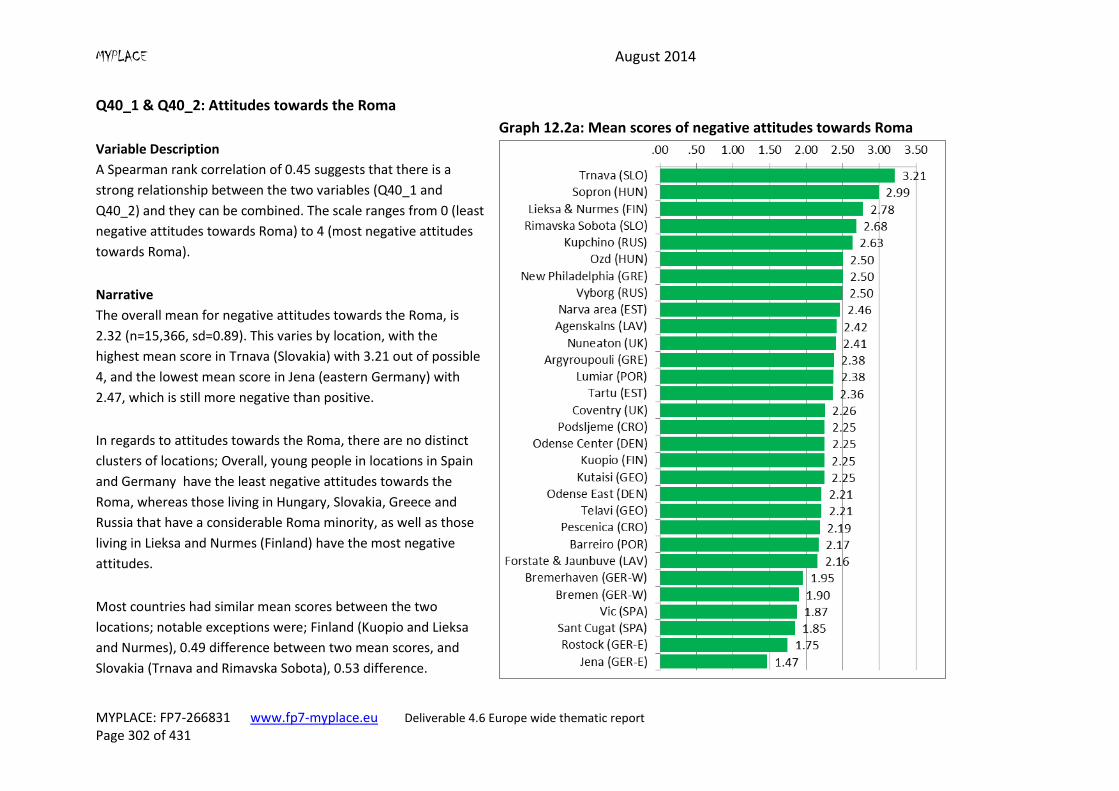
MYPLACE August 2014
MYPLACE: FP7-266831 www.fp7-myplace.eu Deliverable 4.6 Europe wide thematic report Page 302 of 431
Q40_1 & Q40_2: Attitudes towards the Roma
Variable Description
A Spearman rank correlation of 0.45 suggests that there is a
strong relationship between the two variables (Q40_1 and
Q40_2) and they can be combined. The scale ranges from 0 (least
negative attitudes towards Roma) to 4 (most negative attitudes
towards Roma).
Graph 12.2a: Mean scores of negative attitudes towards Roma
Narrative
The overall mean for negative attitudes towards the Roma, is
2.32 (n=15,366, sd=0.89). This varies by location, with the
highest mean score in Trnava (Slovakia) with 3.21 out of possible
4, and the lowest mean score in Jena (eastern Germany) with
2.47, which is still more negative than positive.
In regards to attitudes towards the Roma, there are no distinct
clusters of locations; Overall, young people in locations in Spain
and Germany have the least negative attitudes towards the
Roma, whereas those living in Hungary, Slovakia, Greece and
Russia that have a considerable Roma minority, as well as those
living in Lieksa and Nurmes (Finland) have the most negative
attitudes.
Most countries had similar mean scores between the two
locations; notable exceptions were; Finland (Kuopio and Lieksa
and Nurmes), 0.49 difference between two mean scores, and
Slovakia (Trnava and Rimavska Sobota), 0.53 difference.
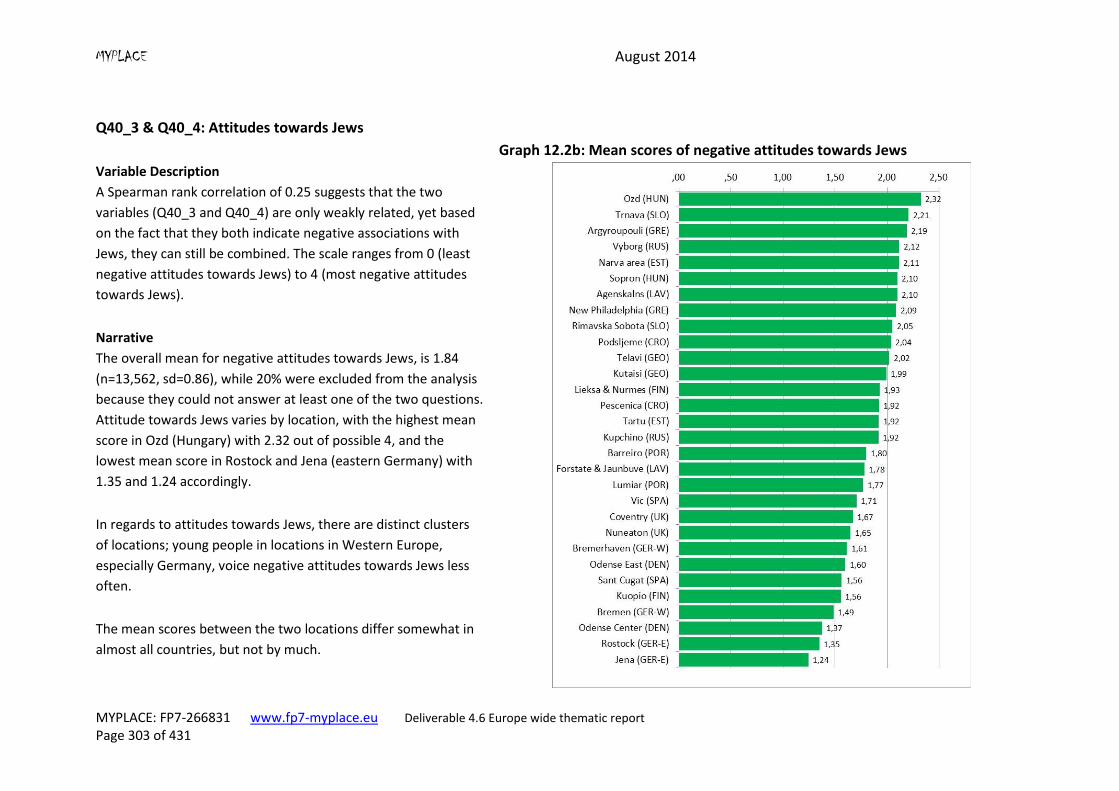
MYPLACE August 2014
MYPLACE: FP7-266831 www.fp7-myplace.eu Deliverable 4.6 Europe wide thematic report Page 303 of 431
Q40_3 & Q40_4: Attitudes towards Jews
Variable Description
A Spearman rank correlation of 0.25 suggests that the two
variables (Q40_3 and Q40_4) are only weakly related, yet based
on the fact that they both indicate negative associations with
Jews, they can still be combined. The scale ranges from 0 (least
negative attitudes towards Jews) to 4 (most negative attitudes
towards Jews).
Graph 12.2b: Mean scores of negative attitudes towards Jews
Narrative
The overall mean for negative attitudes towards Jews, is 1.84
(n=13,562, sd=0.86), while 20% were excluded from the analysis
because they could not answer at least one of the two questions.
Attitude towards Jews varies by location, with the highest mean
score in Ozd (Hungary) with 2.32 out of possible 4, and the
lowest mean score in Rostock and Jena (eastern Germany) with
1.35 and 1.24 accordingly.
In regards to attitudes towards Jews, there are distinct clusters
of locations; young people in locations in Western Europe,
especially Germany, voice negative attitudes towards Jews less
often.
The mean scores between the two locations differ somewhat in
almost all countries, but not by much.
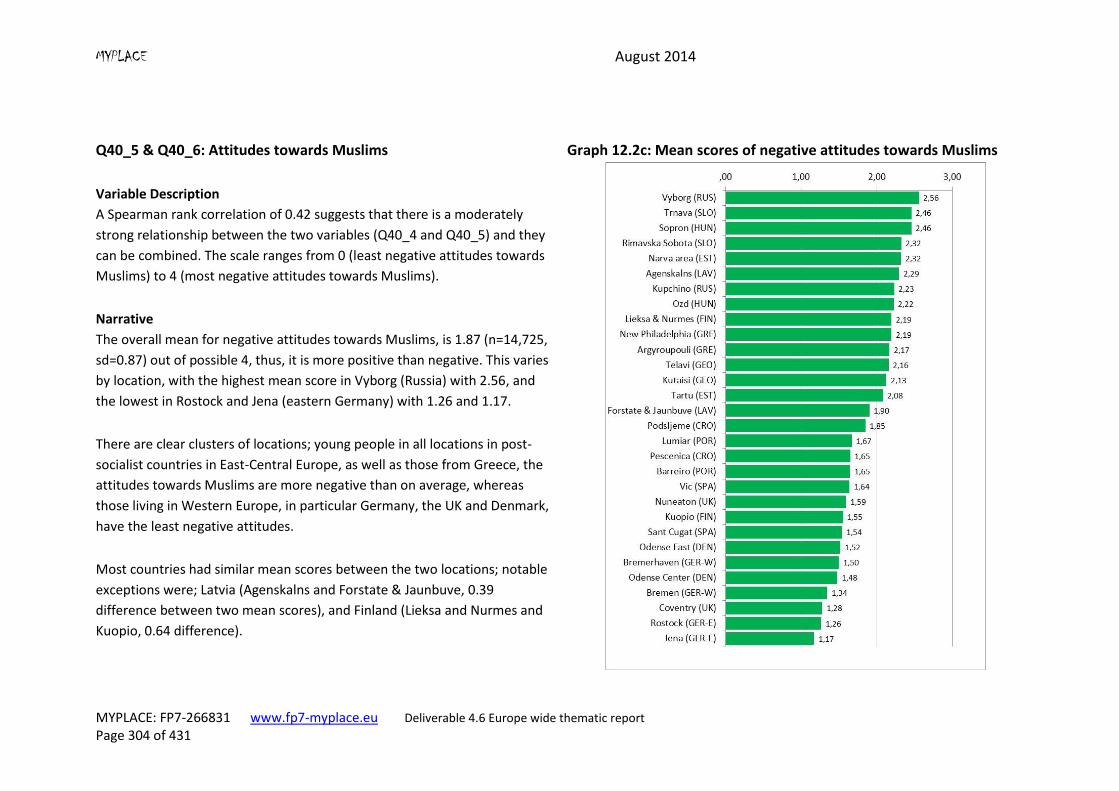
MYPLACE August 2014
MYPLACE: FP7-266831 www.fp7-myplace.eu Deliverable 4.6 Europe wide thematic report Page 304 of 431
Q40_5 & Q40_6: Attitudes towards Muslims Graph 12.2c: Mean scores of negative attitudes towards Muslims
Variable Description
A Spearman rank correlation of 0.42 suggests that there is a moderately
strong relationship between the two variables (Q40_4 and Q40_5) and they
can be combined. The scale ranges from 0 (least negative attitudes towards
Muslims) to 4 (most negative attitudes towards Muslims).
Narrative
The overall mean for negative attitudes towards Muslims, is 1.87 (n=14,725,
sd=0.87) out of possible 4, thus, it is more positive than negative. This varies
by location, with the highest mean score in Vyborg (Russia) with 2.56, and
the lowest in Rostock and Jena (eastern Germany) with 1.26 and 1.17.
There are clear clusters of locations; young people in all locations in post-
socialist countries in East-Central Europe, as well as those from Greece, the
attitudes towards Muslims are more negative than on average, whereas
those living in Western Europe, in particular Germany, the UK and Denmark,
have the least negative attitudes.
Most countries had similar mean scores between the two locations; notable
exceptions were; Latvia (Agenskalns and Forstate & Jaunbuve, 0.39
difference between two mean scores), and Finland (Lieksa and Nurmes and
Kuopio, 0.64 difference).

MYPLACE August 2014
MYPLACE: FP7-266831 www.fp7-myplace.eu Deliverable 4.6 Europe wide thematic report Page 305 of 431
12.3 Xenophobia (Q41)
Respondents were asked, using a 5-point scale from ‘strongly agree’ to ‘strongly disagree’, if
[country] should have stricter border controls and visa restrictions to prevent further
immigration’.
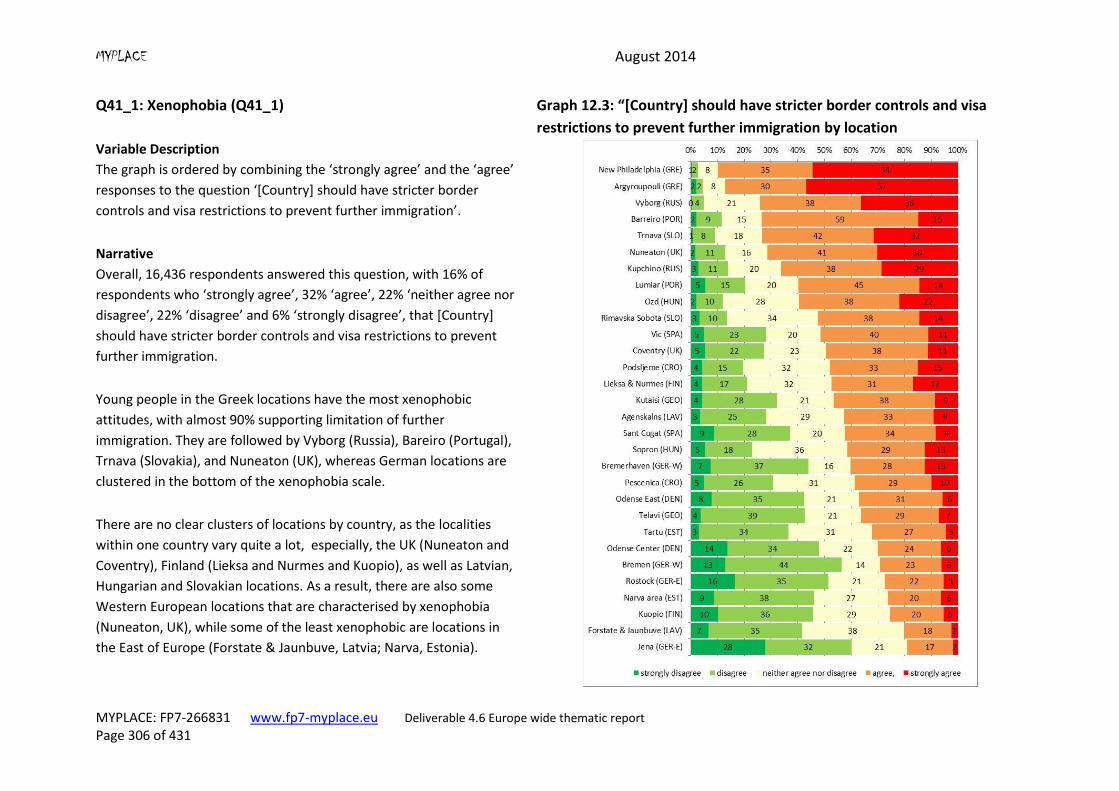
MYPLACE August 2014
MYPLACE: FP7-266831 www.fp7-myplace.eu Deliverable 4.6 Europe wide thematic report Page 306 of 431
Q41_1: Xenophobia (Q41_1) Graph 12.3: “[Country] should have stricter border controls and visa
restrictions to prevent further immigration by location
Variable Description
The graph is ordered by combining the ‘strongly agree’ and the ‘agree’
responses to the question ‘[Country] should have stricter border
controls and visa restrictions to prevent further immigration’.
Narrative
Overall, 16,436 respondents answered this question, with 16% of
respondents who ‘strongly agree’, 32% ‘agree’, 22% ‘neither agree nor
disagree’, 22% ‘disagree’ and 6% ‘strongly disagree’, that [Country]
should have stricter border controls and visa restrictions to prevent
further immigration.
Young people in the Greek locations have the most xenophobic
attitudes, with almost 90% supporting limitation of further
immigration. They are followed by Vyborg (Russia), Bareiro (Portugal),
Trnava (Slovakia), and Nuneaton (UK), whereas German locations are
clustered in the bottom of the xenophobia scale.
There are no clear clusters of locations by country, as the localities
within one country vary quite a lot, especially, the UK (Nuneaton and
Coventry), Finland (Lieksa and Nurmes and Kuopio), as well as Latvian,
Hungarian and Slovakian locations. As a result, there are also some
Western European locations that are characterised by xenophobia
(Nuneaton, UK), while some of the least xenophobic are locations in
the East of Europe (Forstate & Jaunbuve, Latvia; Narva, Estonia).

MYPLACE August 2014
MYPLACE: FP7-266831 www.fp7-myplace.eu Deliverable 4.6 Europe wide thematic report Page 307 of 431
12.4 Exclusionism (Q41_2, Q41_4, Q41_5)
Exclusionism was operationalised on the basis of three items that describe exclusion from
three different resources: jobs, land, and welfare. They were measured on a 5-point scale
from strongly agree to strongly disagree:
Q41_2 Foreigners should not be allowed to buy land in [COUNTRY] (‘strongly agree,
agree, neither agree nor disagree, disagree, strongly disagree’)
Q41_4 Migrants should have the same rights to welfare (health care, housing,
education) as people from [COUNTRY]
Q26_5 When jobs are scarce, employers should give priority to [COUNTRY] people
over foreign workers
The items were recoded so that in all cases a higher value would indicate a more
exclusionist attitude. Considering that the exclusionist attitudes as regards to different
resources should not necessarily correlate, an index was created from these three
questions, by summing the scores and dividing it by the number of items.
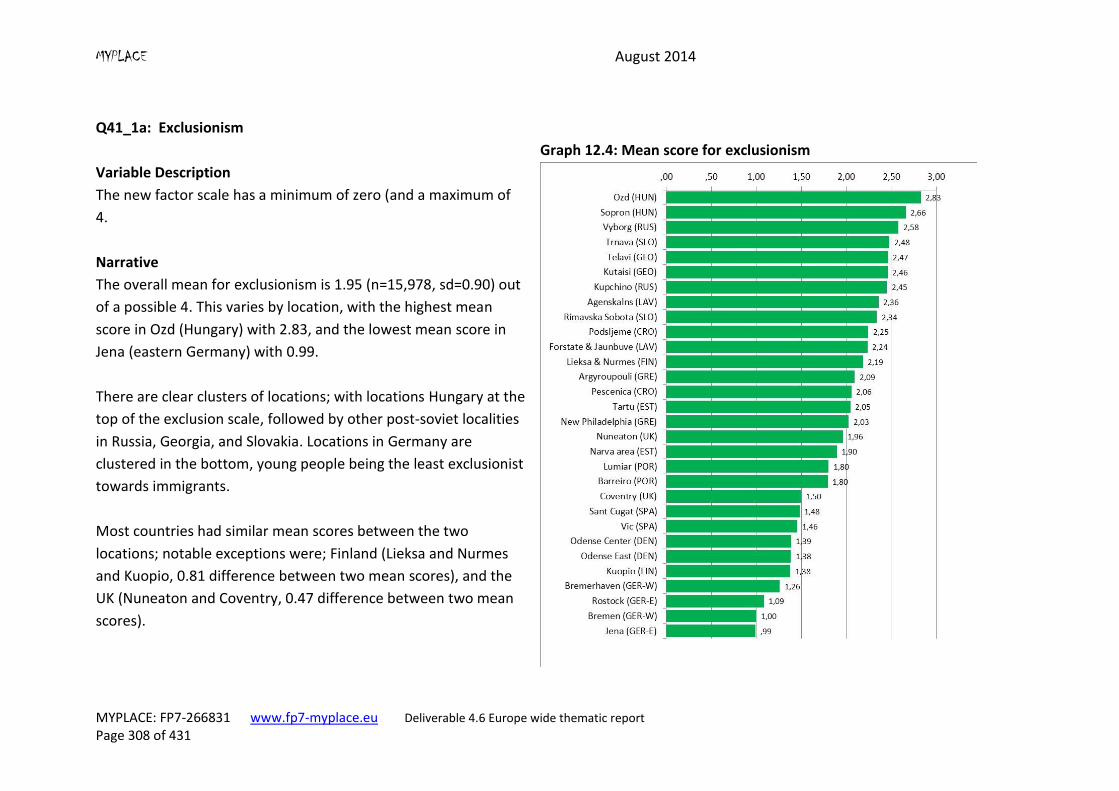
MYPLACE August 2014
MYPLACE: FP7-266831 www.fp7-myplace.eu Deliverable 4.6 Europe wide thematic report Page 308 of 431
Q41_1a: Exclusionism
Variable Description
The new factor scale has a minimum of zero (and a maximum of
4.
Graph 12.4: Mean score for exclusionism
Narrative
The overall mean for exclusionism is 1.95 (n=15,978, sd=0.90) out
of a possible 4. This varies by location, with the highest mean
score in Ozd (Hungary) with 2.83, and the lowest mean score in
Jena (eastern Germany) with 0.99.
There are clear clusters of locations; with locations Hungary at the
top of the exclusion scale, followed by other post-soviet localities
in Russia, Georgia, and Slovakia. Locations in Germany are
clustered in the bottom, young people being the least exclusionist
towards immigrants.
Most countries had similar mean scores between the two
locations; notable exceptions were; Finland (Lieksa and Nurmes
and Kuopio, 0.81 difference between two mean scores), and the
UK (Nuneaton and Coventry, 0.47 difference between two mean
scores).
MYPLACE August 2014
MYPLACE: FP7-266831 www.fp7-myplace.eu Deliverable 4.6 Europe wide thematic report Page 309 of 431
12.5 Welfare chauvinism (Q41_2)
Welfare chauvinism was measured by a question ’Migrants should have the same rights to
welfare (health care, housing, education) as people from [COUNTRY]’ which was reversed,
for more positive answers to mean more welfare chauvinistic attitudes.
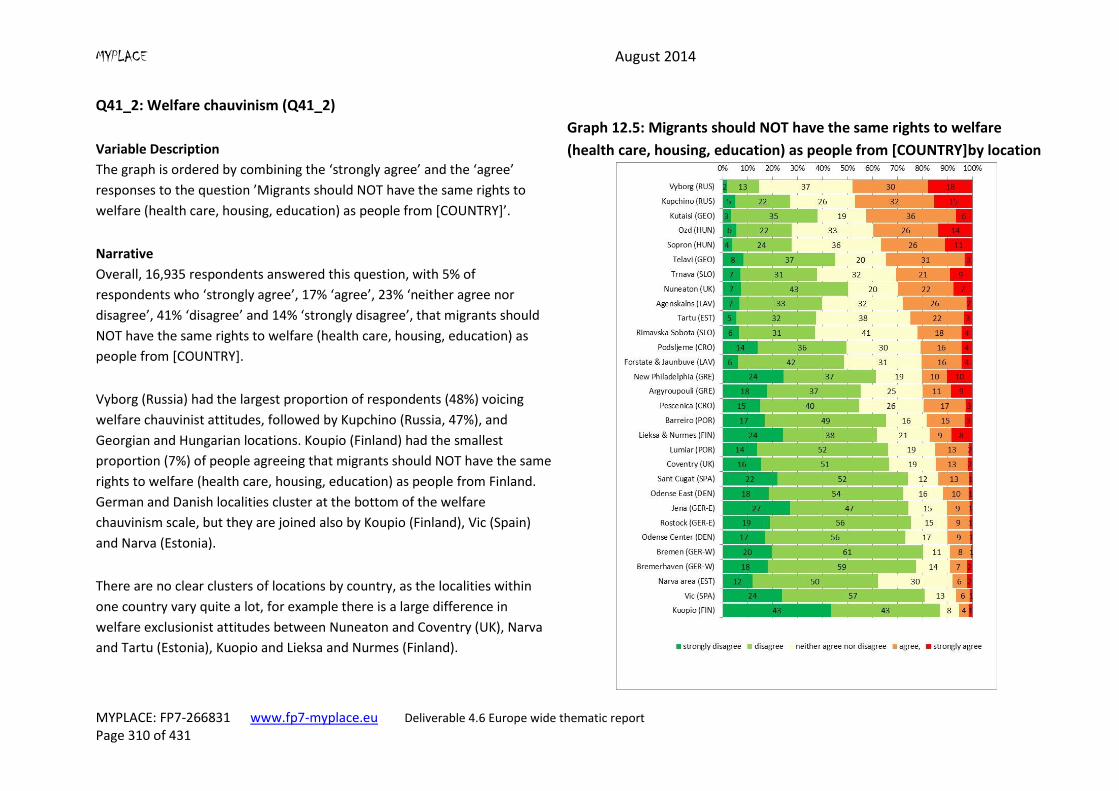
MYPLACE August 2014
MYPLACE: FP7-266831 www.fp7-myplace.eu Deliverable 4.6 Europe wide thematic report Page 310 of 431
Q41_2: Welfare chauvinism (Q41_2)
Variable Description
The graph is ordered by combining the ‘strongly agree’ and the ‘agree’
responses to the question ’Migrants should NOT have the same rights to
welfare (health care, housing, education) as people from [COUNTRY]’.
Graph 12.5: Migrants should NOT have the same rights to welfare
(health care, housing, education) as people from [COUNTRY]by location
Narrative
Overall, 16,935 respondents answered this question, with 5% of
respondents who ‘strongly agree’, 17% ‘agree’, 23% ‘neither agree nor
disagree’, 41% ‘disagree’ and 14% ‘strongly disagree’, that migrants should
NOT have the same rights to welfare (health care, housing, education) as
people from [COUNTRY].
Vyborg (Russia) had the largest proportion of respondents (48%) voicing
welfare chauvinist attitudes, followed by Kupchino (Russia, 47%), and
Georgian and Hungarian locations. Koupio (Finland) had the smallest
proportion (7%) of people agreeing that migrants should NOT have the same
rights to welfare (health care, housing, education) as people from Finland.
German and Danish localities cluster at the bottom of the welfare
chauvinism scale, but they are joined also by Koupio (Finland), Vic (Spain)
and Narva (Estonia).
There are no clear clusters of locations by country, as the localities within
one country vary quite a lot, for example there is a large difference in
welfare exclusionist attitudes between Nuneaton and Coventry (UK), Narva
and Tartu (Estonia), Kuopio and Lieksa and Nurmes (Finland).
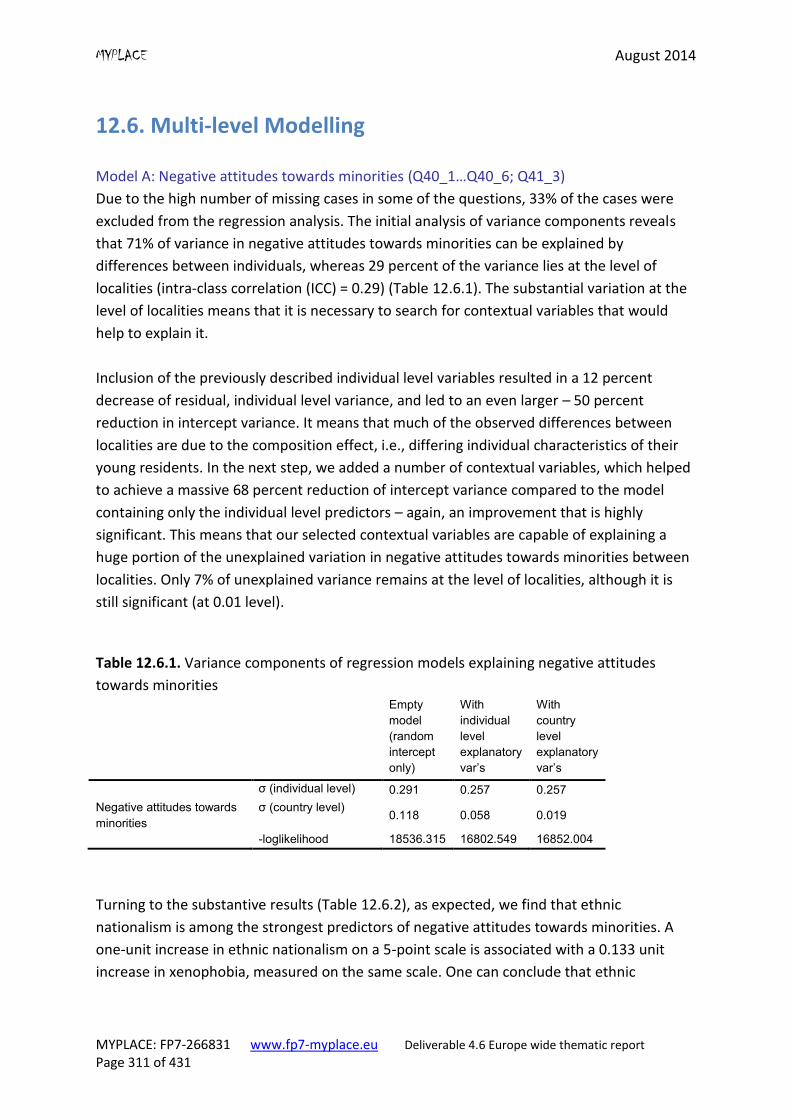
MYPLACE August 2014
MYPLACE: FP7-266831 www.fp7-myplace.eu Deliverable 4.6 Europe wide thematic report Page 311 of 431
12.6. Multi-level Modelling
Model A: Negative attitudes towards minorities (Q40_1…Q40_6; Q41_3)
Due to the high number of missing cases in some of the questions, 33% of the cases were
excluded from the regression analysis. The initial analysis of variance components reveals
that 71% of variance in negative attitudes towards minorities can be explained by
differences between individuals, whereas 29 percent of the variance lies at the level of
localities (intra-class correlation (ICC) = 0.29) (Table 12.6.1). The substantial variation at the
level of localities means that it is necessary to search for contextual variables that would
help to explain it.
Inclusion of the previously described individual level variables resulted in a 12 percent
decrease of residual, individual level variance, and led to an even larger – 50 percent
reduction in intercept variance. It means that much of the observed differences between
localities are due to the composition effect, i.e., differing individual characteristics of their
young residents. In the next step, we added a number of contextual variables, which helped
to achieve a massive 68 percent reduction of intercept variance compared to the model
containing only the individual level predictors – again, an improvement that is highly
significant. This means that our selected contextual variables are capable of explaining a
huge portion of the unexplained variation in negative attitudes towards minorities between
localities. Only 7% of unexplained variance remains at the level of localities, although it is
still significant (at 0.01 level).
Table 12.6.1. Variance components of regression models explaining negative attitudes
towards minorities Empty
model
(random
intercept
only)
With
individual
level
explanatory
var’s
With
country
level
explanatory
var’s
σ (individual level) 0.291 0.257 0.257
Negative attitudes towards
minorities
σ (country level) 0.118 0.058 0.019
-loglikelihood 18536.315 16802.549 16852.004
Turning to the substantive results (Table 12.6.2), as expected, we find that ethnic
nationalism is among the strongest predictors of negative attitudes towards minorities. A
one-unit increase in ethnic nationalism on a 5-point scale is associated with a 0.133 unit
increase in xenophobia, measured on the same scale. One can conclude that ethnic
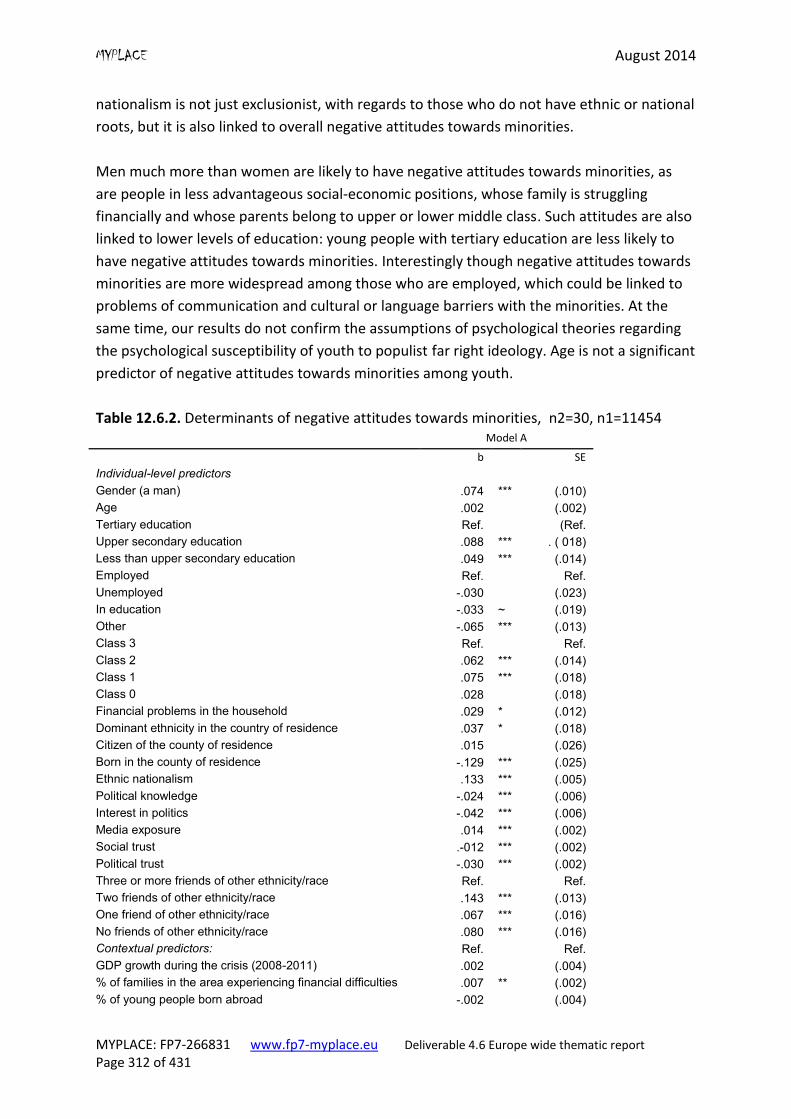
MYPLACE August 2014
MYPLACE: FP7-266831 www.fp7-myplace.eu Deliverable 4.6 Europe wide thematic report Page 312 of 431
nationalism is not just exclusionist, with regards to those who do not have ethnic or national
roots, but it is also linked to overall negative attitudes towards minorities.
Men much more than women are likely to have negative attitudes towards minorities, as
are people in less advantageous social-economic positions, whose family is struggling
financially and whose parents belong to upper or lower middle class. Such attitudes are also
linked to lower levels of education: young people with tertiary education are less likely to
have negative attitudes towards minorities. Interestingly though negative attitudes towards
minorities are more widespread among those who are employed, which could be linked to
problems of communication and cultural or language barriers with the minorities. At the
same time, our results do not confirm the assumptions of psychological theories regarding
the psychological susceptibility of youth to populist far right ideology. Age is not a significant
predictor of negative attitudes towards minorities among youth.
Table 12.6.2. Determinants of negative attitudes towards minorities, n2=30, n1=11454 Model A
b SE
Individual-level predictors
Gender (a man) .074 *** (.010)
Age .002 (.002)
Tertiary education Ref. (Ref.
Upper secondary education .088 *** . ( 018)
Less than upper secondary education .049 *** (.014)
Employed Ref. Ref.
Unemployed -.030 (.023)
In education -.033 ~ (.019)
Other -.065 *** (.013)
Class 3 Ref. Ref.
Class 2 .062 *** (.014)
Class 1 .075 *** (.018)
Class 0 .028 (.018)
Financial problems in the household .029 * (.012)
Dominant ethnicity in the country of residence .037 * (.018)
Citizen of the county of residence .015 (.026)
Born in the county of residence -.129 *** (.025)
Ethnic nationalism .133 *** (.005)
Political knowledge -.024 *** (.006)
Interest in politics -.042 *** (.006)
Media exposure .014 *** (.002)
Social trust .-012 *** (.002)
Political trust -.030 *** (.002)
Three or more friends of other ethnicity/race Ref. Ref.
Two friends of other ethnicity/race .143 *** (.013)
One friend of other ethnicity/race .067 *** (.016)
No friends of other ethnicity/race .080 *** (.016)
Contextual predictors: Ref. Ref.
GDP growth during the crisis (2008-2011) .002 (.004)
% of families in the area experiencing financial difficulties .007 ** (.002)
% of young people born abroad -.002 (.004)
MYPLACE August 2014
MYPLACE: FP7-266831 www.fp7-myplace.eu Deliverable 4.6 Europe wide thematic report Page 313 of 431
% of young people of non-majority ethnicity -.002 (.002)
Net immigration rates .006 (.017)
Size of the area (thousands) .004 (.003)
Liberal Ref. Ref.
Post-socialist .165 (.154)
Nordic .101 (.151)
Conservative -.176 (.146)
Mediterranean -.203 (.144)
Constant 1.365 *** (.176)
***p<0.001, **p<0.01, *p<0.05, ~p<0.1, two-tailed tests.
In line with the ‘cultural affinity thesis’, the analysis confirms that negative attitudes
towards minorities are more common among the dominant ethnic group than among those
who belong to minorities themselves, regardless of citizenship status. However, controlled
for ethnic group, those born outside the country tend to have more negative attitudes
towards minorities. This relationship is intriguing, and there could be several explanations to
it, such as cultural differences or perceived inter-group conflict or competition.
The analysis confirms the role of information in lessening prejudice towards minority
groups: those who are more interested in, and better informed about, politics are less likely
to hold negative attitudes towards minorities. Among the strongest predictors of anti-
minority attitudes are also political distrust and, interestingly, media exposure, with those
who watch different media channels more frequently having more negative attitudes
towards minorities. It shows that media are at least partly responsible for the recent spread
of populism and anti-minority sentiments across Europe.
Attitudes towards all kinds of minorities are more tolerant if people have more contact with
minorities themselves. In line with the ‘contact hypothesis’, we find that those who have
friends of another race or ethnicity are much less likely to have negative attitudes towards
minorities. However, one must acknowledge that there is a problem of endo-geneity. The
model also does not allow us to disentangle the causal relationships of the two variables – it
is possible than people have more friends of other ethnicity, because they have more
positive attitudes towards minorities. We also find that people who distrust others in
general are more likely to have negative attitudes towards minorities – they might feel that
minorities are ‘different’, more unlike themselves, and thus they can be trusted less. If
overall trust in people will increase, the attitudes towards minorities will improve too.
We also find strong support for the ‘realistic group conflict’ theory. As mentioned earlier,
those who are poor tend to have more negative attitudes towards minorities, and the
overall situation in the area seems to matter too. The number of families in the area facing
financial difficulties is the strongest contextual level predictor of negative attitudes towards
minorities, and the only one that is statistically significant. These attitudes are likely to be
driven by resource stress and competition. Other contextual level factors such as the
welfare state type are not significant predictors of negative attitudes towards minorities.

MYPLACE August 2014
MYPLACE: FP7-266831 www.fp7-myplace.eu Deliverable 4.6 Europe wide thematic report Page 314 of 431
Model B: Negative attitudes towards Roma, Jews and Muslims separately (Q40_1, 2; Q40_3,
4; Q40_5, 6)
In this chapter, we look at determinants of negative attitudes towards different minority
groups – Roma, Jews and Muslims – separately.
First, the analysis of variance components reveals that while attitudes towards Jews can
largely be explained by differences between individuals, attitudes towards Muslims are to a
significant extent influenced by context: accordingly, 14% and 23% of variance in negative
attitudes towards these groups lies at the level of localities (Table 12.6.3).
Inclusion of the previously described individual level variables resulted in an 5 (Roma) to 8
(Muslims) percent decrease of residual, individual level variance, meaning that many more
individual factors than those included in the model affect these perceptions. Although the
reduction might seem small, the chi-square test of deviances, confirms that it is statistically
significant. Interestingly, adding individual level variables led to an even larger – 35 (Roma)
to about 50 percent (Muslims, Jews) reduction in intercept variance. It means that much of
the observed differences between localities are due to the composition effect, i.e., differing
individual characteristics of their young residents. In the next step, we added a number of
contextual variables, which helped to achieve a massive 74 percent reduction of intercept
variance compared to the model containing only the individual level predictors as regards to
attitudes towards Jews, 42 percent – Muslims, and only 35 percent – Roma. This means that
our selected contextual variables are capable of explaining a huge portion of the
unexplained variation in negative attitudes towards Jews between localities, yet there are
more important contextual factors responsible towards negative attitude towards Roma
and Muslims that are not included in the model. Only 2% of unexplained variance in
attitudes towards Jews remains at the level of localities, although one must note that it is
still significant (at 0.01 level).
Table 12.6.3. Variance components of regression models explaining negative attitudes
towards Roma, Jews and Muslims Empty
model
(random
intercept
only)
With
individual
level
explanatory
var’s
With
country
level
explanatory
var’s
σ (individual level) .648 .614 .614
Negative attitudes towards
Roma
σ (country level) .130 .085 .055
-loglikelihood 32807.97 31427.81 31486.5
σ (individual level) .495 .465 .465
Negative attitudes towards
Jews
σ (country level) .079 .038 .009
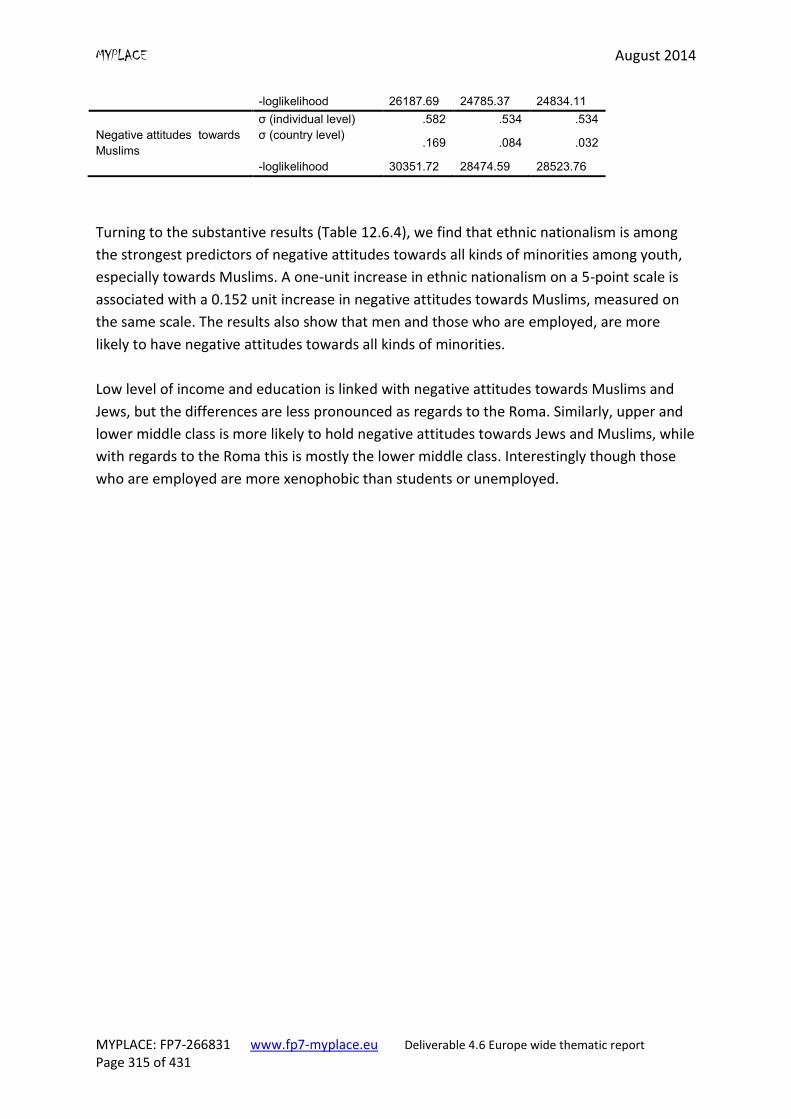
MYPLACE August 2014
MYPLACE: FP7-266831 www.fp7-myplace.eu Deliverable 4.6 Europe wide thematic report Page 315 of 431
-loglikelihood 26187.69 24785.37 24834.11
σ (individual level) .582 .534 .534
Negative attitudes towards
Muslims
σ (country level) .169 .084 .032
-loglikelihood 30351.72 28474.59 28523.76
Turning to the substantive results (Table 12.6.4), we find that ethnic nationalism is among
the strongest predictors of negative attitudes towards all kinds of minorities among youth,
especially towards Muslims. A one-unit increase in ethnic nationalism on a 5-point scale is
associated with a 0.152 unit increase in negative attitudes towards Muslims, measured on
the same scale. The results also show that men and those who are employed, are more
likely to have negative attitudes towards all kinds of minorities.
Low level of income and education is linked with negative attitudes towards Muslims and
Jews, but the differences are less pronounced as regards to the Roma. Similarly, upper and
lower middle class is more likely to hold negative attitudes towards Jews and Muslims, while
with regards to the Roma this is mostly the lower middle class. Interestingly though those
who are employed are more xenophobic than students or unemployed.
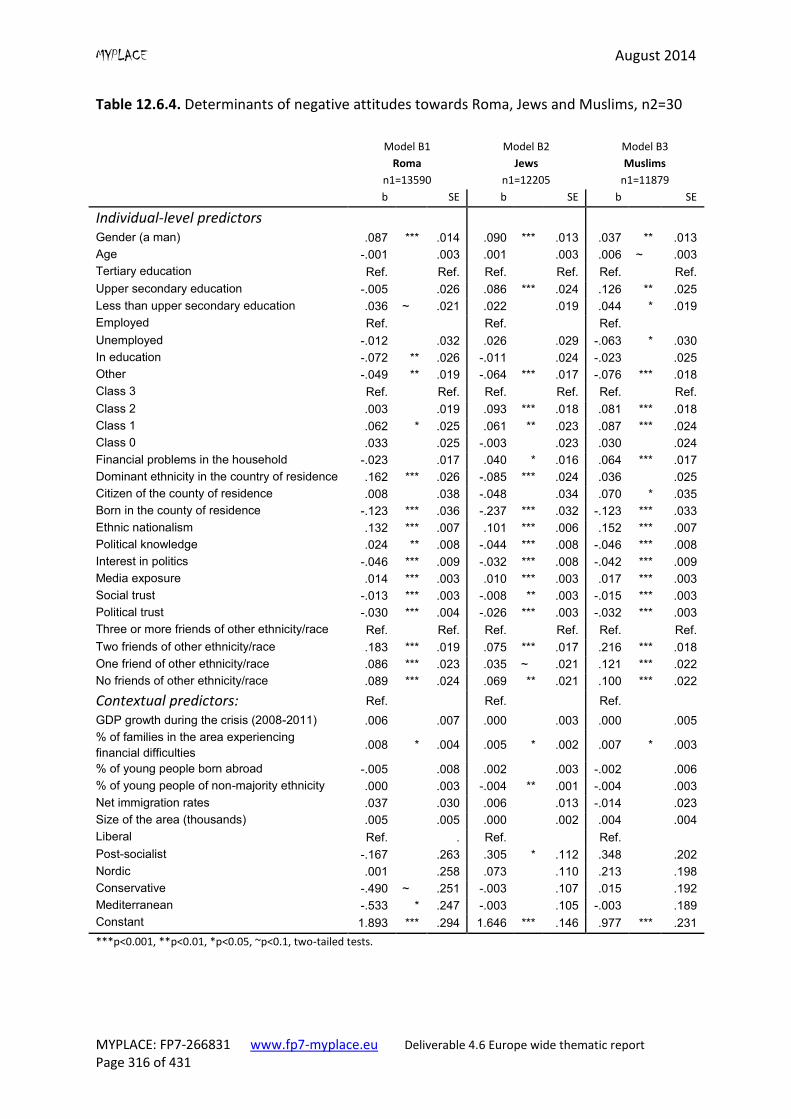
MYPLACE August 2014
MYPLACE: FP7-266831 www.fp7-myplace.eu Deliverable 4.6 Europe wide thematic report Page 316 of 431
Table 12.6.4. Determinants of negative attitudes towards Roma, Jews and Muslims, n2=30
Model B1
Roma
n1=13590
Model B2
Jews
n1=12205
Model B3
Muslims
n1=11879
b SE b SE b SE
Individual-level predictors
Gender (a man) .087 *** .014 .090 *** .013 .037 ** .013
Age -.001 .003 .001 .003 .006 ~ .003
Tertiary education Ref. Ref. Ref. Ref. Ref. Ref.
Upper secondary education -.005 .026 .086 *** .024 .126 ** .025
Less than upper secondary education .036 ~ .021 .022 .019 .044 * .019
Employed Ref. Ref. Ref.
Unemployed -.012 .032 .026 .029 -.063 * .030
In education -.072 ** .026 -.011 .024 -.023 .025
Other -.049 ** .019 -.064 *** .017 -.076 *** .018
Class 3 Ref. Ref. Ref. Ref. Ref. Ref.
Class 2 .003 .019 .093 *** .018 .081 *** .018
Class 1 .062 * .025 .061 ** .023 .087 *** .024
Class 0 .033 .025 -.003 .023 .030 .024
Financial problems in the household -.023 .017 .040 * .016 .064 *** .017
Dominant ethnicity in the country of residence .162 *** .026 -.085 *** .024 .036 .025
Citizen of the county of residence .008 .038 -.048 .034 .070 * .035
Born in the county of residence -.123 *** .036 -.237 *** .032 -.123 *** .033
Ethnic nationalism .132 *** .007 .101 *** .006 .152 *** .007
Political knowledge .024 ** .008 -.044 *** .008 -.046 *** .008
Interest in politics -.046 *** .009 -.032 *** .008 -.042 *** .009
Media exposure .014 *** .003 .010 *** .003 .017 *** .003
Social trust -.013 *** .003 -.008 ** .003 -.015 *** .003
Political trust -.030 *** .004 -.026 *** .003 -.032 *** .003
Three or more friends of other ethnicity/race Ref. Ref. Ref. Ref. Ref. Ref.
Two friends of other ethnicity/race .183 *** .019 .075 *** .017 .216 *** .018
One friend of other ethnicity/race .086 *** .023 .035 ~ .021 .121 *** .022
No friends of other ethnicity/race .089 *** .024 .069 ** .021 .100 *** .022
Contextual predictors: Ref. Ref. Ref.
GDP growth during the crisis (2008-2011) .006 .007 .000 .003 .000 .005
% of families in the area experiencing
financial difficulties .008 * .004 .005 * .002 .007 * .003
% of young people born abroad -.005 .008 .002 .003 -.002 .006
% of young people of non-majority ethnicity .000 .003 -.004 ** .001 -.004 .003
Net immigration rates .037 .030 .006 .013 -.014 .023
Size of the area (thousands) .005 .005 .000 .002 .004 .004
Liberal Ref. . Ref. Ref.
Post-socialist -.167 .263 .305 * .112 .348 .202
Nordic .001 .258 .073 .110 .213 .198
Conservative -.490 ~ .251 -.003 .107 .015 .192
Mediterranean -.533 * .247 -.003 .105 -.003 .189
Constant 1.893 *** .294 1.646 *** .146 .977 *** .231
***p<0.001, **p<0.01, *p<0.05, ~p<0.1, two-tailed tests.
MYPLACE August 2014
MYPLACE: FP7-266831 www.fp7-myplace.eu Deliverable 4.6 Europe wide thematic report Page 317 of 431
As regards the ‘cultural affinity thesis’, the analysis shows that majority ethnic group is more
likely to have negative attitudes towards the Roma, and less negative - towards Jews,
whereas citizenship status mostly worsens attitudes towards Muslims. Considering that
most Roma and Jews are residing in the country for a long time, one can conclude that in
the latter case the negativism is directed towards recent immigrants –extra-group
representatives who do not have country citizenship. In all cases, those born outside the
country bear more negative attitudes towards all kinds of minority groups. It is possible that
they try to distance themselves from them, yet there are also other psychological
mechanisms that could be responsible for that.
Those who are more interested in, and better informed about, politics, and watch different
media channels less frequently are less likely to hold negative attitudes towards all kinds of
minorities. Negative attitudes towards all minorities are also strongly linked to social and
political distrust, showing that overall suspiciousness and mistrust facilitates prejudice and
hatred of other ethnic groups.
Attitudes towards all kinds of minorities are more tolerant if people have more contact with
minorities themselves. In line with the ‘contact hypothesis’, we find that those who have
friends of another race or ethnicity are much less likely to have negative attitudes towards
any minorities, although, as mentioned before, it is possible that people who have more
friends of other ethnicities, do so because they have more positive attitudes. Young people
in localities where there are more people of ethnic minorities around tend to have less
negative attitudes towards Jews, yet it has no effect on attitudes towards the Roma or
Muslims.
Again, we find support for the ‘realistic group conflict’ theory in regards to all minorities: the
number of families in the area facing financial difficulties is among the strongest contextual
level predictors of negative attitudes.
Attitudes towards different minorities vary depending on the type of countries. Attitudes
towards the Roma are much more negative in the liberal regime type (the UK) than in
conservative (Germany) or Mediterranean countries. Attitudes towards Jews and Muslims
are the most negative among young people in post-socialist countries (although in the latter
case the difference from liberal regimes, i.e., the reference category is not statistically
significant). It confirms that cultural context significantly affects which groups will be
discriminated against.
Model C: Xenophobia (Q41_1)
Our dependent variable is ‘xenophobia’, measured in the MYPLACE survey by ‘[country]
should have stricter border controls and visa restrictions to prevent further immigration’.
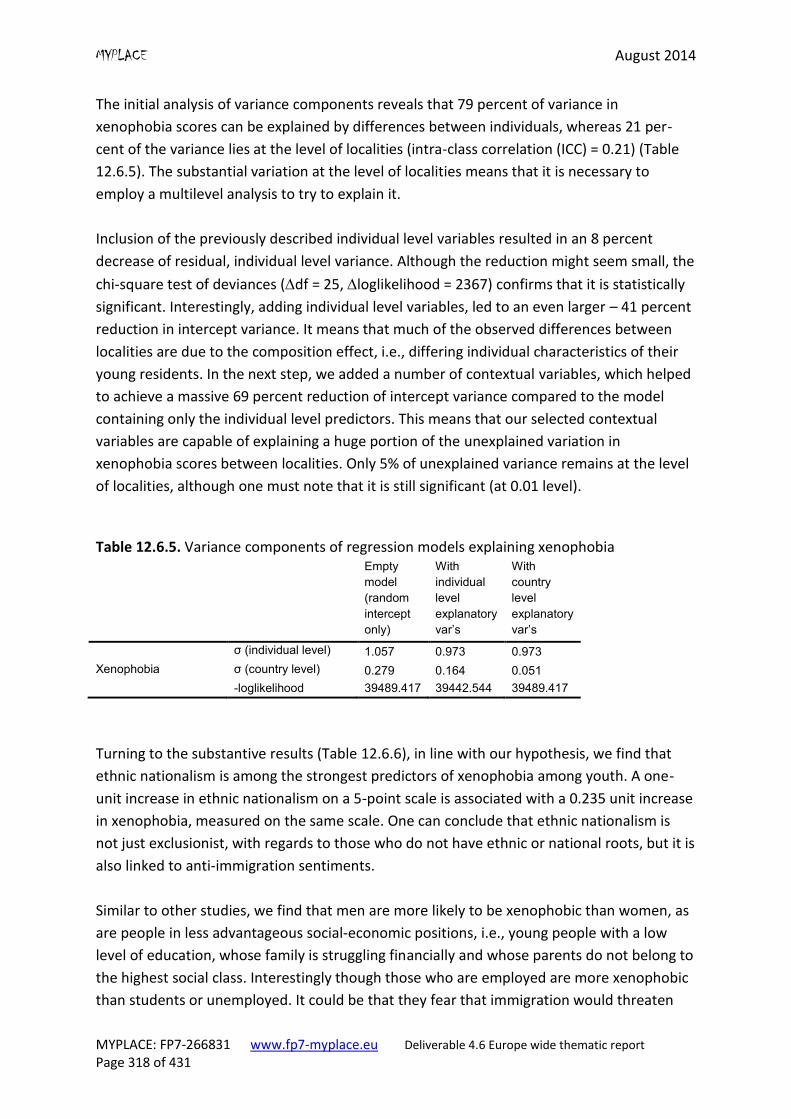
MYPLACE August 2014
MYPLACE: FP7-266831 www.fp7-myplace.eu Deliverable 4.6 Europe wide thematic report Page 318 of 431
The initial analysis of variance components reveals that 79 percent of variance in
xenophobia scores can be explained by differences between individuals, whereas 21 per-
cent of the variance lies at the level of localities (intra-class correlation (ICC) = 0.21) (Table
12.6.5). The substantial variation at the level of localities means that it is necessary to
employ a multilevel analysis to try to explain it.
Inclusion of the previously described individual level variables resulted in an 8 percent
decrease of residual, individual level variance. Although the reduction might seem small, the
chi-square test of deviances (df = 25, loglikelihood = 2367) confirms that it is statistically
significant. Interestingly, adding individual level variables, led to an even larger – 41 percent
reduction in intercept variance. It means that much of the observed differences between
localities are due to the composition effect, i.e., differing individual characteristics of their
young residents. In the next step, we added a number of contextual variables, which helped
to achieve a massive 69 percent reduction of intercept variance compared to the model
containing only the individual level predictors. This means that our selected contextual
variables are capable of explaining a huge portion of the unexplained variation in
xenophobia scores between localities. Only 5% of unexplained variance remains at the level
of localities, although one must note that it is still significant (at 0.01 level).
Table 12.6.5. Variance components of regression models explaining xenophobia Empty
model
(random
intercept
only)
With
individual
level
explanatory
var’s
With
country
level
explanatory
var’s
σ (individual level) 1.057 0.973 0.973
Xenophobia σ (country level) 0.279 0.164 0.051
-loglikelihood 39489.417 39442.544 39489.417
Turning to the substantive results (Table 12.6.6), in line with our hypothesis, we find that
ethnic nationalism is among the strongest predictors of xenophobia among youth. A one-
unit increase in ethnic nationalism on a 5-point scale is associated with a 0.235 unit increase
in xenophobia, measured on the same scale. One can conclude that ethnic nationalism is
not just exclusionist, with regards to those who do not have ethnic or national roots, but it is
also linked to anti-immigration sentiments.
Similar to other studies, we find that men are more likely to be xenophobic than women, as
are people in less advantageous social-economic positions, i.e., young people with a low
level of education, whose family is struggling financially and whose parents do not belong to
the highest social class. Interestingly though those who are employed are more xenophobic
than students or unemployed. It could be that they fear that immigration would threaten
MYPLACE August 2014
MYPLACE: FP7-266831 www.fp7-myplace.eu Deliverable 4.6 Europe wide thematic report Page 319 of 431
their position in the labour market. At the same time, our results do not confirm the
assumptions of psychological theories regarding the psychological susceptibility of youth to
populist far right ideology. Age is not a significant predictor of xenophobia among youth,
i.e., adolescents are as likely to hold xenophobic views as those who are older.
As regards the ‘cultural affinity thesis’, the analysis confirms the hypothesis only partly.
Xenophobia is, indeed, linked to citizenship status, which is not surprising considering that
those who are citizens can be said to have most to fear and to protect in terms of status.
However, xenophobia does not depend on whether the person is a member of a majority or
minority group, as well as on his or her country of birth (Sig.<0.05). There is no extra
empathy from the minority ethnic groups towards potential future immigrants.
In line with the ‘populist thesis’, the analysis confirms our expectations: those people more
interested in and better informed about politics are less likely to hold xenophobic attitudes.
Xenophobia is also strongly linked to political distrust and, interestingly, media exposure is
an important predictor of anti-immigrant attitudes: those who watch different media
channels more frequently, are more likely to hold xenophobic attitudes. It shows that media
are at least partly responsible for the recent spread of xenophobia across Europe.
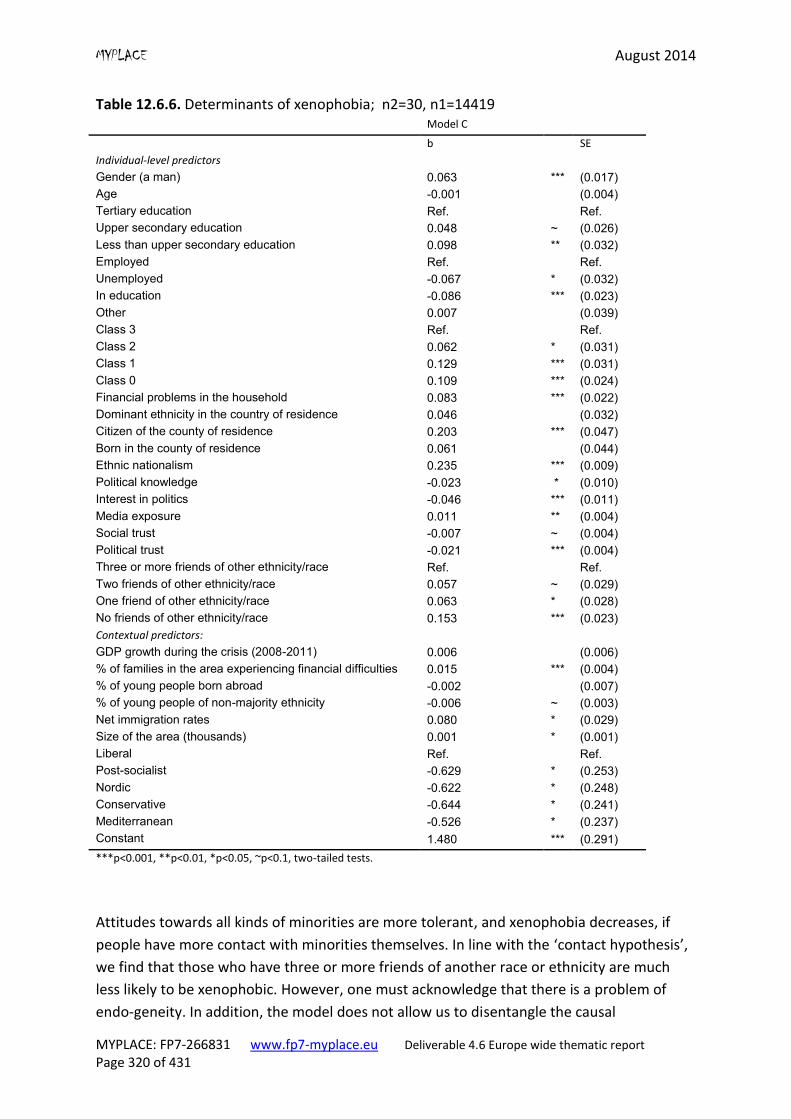
MYPLACE August 2014
MYPLACE: FP7-266831 www.fp7-myplace.eu Deliverable 4.6 Europe wide thematic report Page 320 of 431
Table 12.6.6. Determinants of xenophobia; n2=30, n1=14419 Model C
b SE
Individual-level predictors
Gender (a man) 0.063 *** (0.017)
Age -0.001 (0.004)
Tertiary education Ref. Ref.
Upper secondary education 0.048 ~ (0.026)
Less than upper secondary education 0.098 ** (0.032)
Employed Ref. Ref.
Unemployed -0.067 * (0.032)
In education -0.086 *** (0.023)
Other 0.007 (0.039)
Class 3 Ref. Ref.
Class 2 0.062 * (0.031)
Class 1 0.129 *** (0.031)
Class 0 0.109 *** (0.024)
Financial problems in the household 0.083 *** (0.022)
Dominant ethnicity in the country of residence 0.046 (0.032)
Citizen of the county of residence 0.203 *** (0.047)
Born in the county of residence 0.061 (0.044)
Ethnic nationalism 0.235 *** (0.009)
Political knowledge -0.023 * (0.010)
Interest in politics -0.046 *** (0.011)
Media exposure 0.011 ** (0.004)
Social trust -0.007 ~ (0.004)
Political trust -0.021 *** (0.004)
Three or more friends of other ethnicity/race Ref. Ref.
Two friends of other ethnicity/race 0.057 ~ (0.029)
One friend of other ethnicity/race 0.063 * (0.028)
No friends of other ethnicity/race 0.153 *** (0.023)
Contextual predictors:
GDP growth during the crisis (2008-2011) 0.006 (0.006)
% of families in the area experiencing financial difficulties 0.015 *** (0.004)
% of young people born abroad -0.002 (0.007)
% of young people of non-majority ethnicity -0.006 ~ (0.003)
Net immigration rates 0.080 * (0.029)
Size of the area (thousands) 0.001 * (0.001)
Liberal Ref. Ref.
Post-socialist -0.629 * (0.253)
Nordic -0.622 * (0.248)
Conservative -0.644 * (0.241)
Mediterranean -0.526 * (0.237)
Constant 1.480 *** (0.291)
***p<0.001, **p<0.01, *p<0.05, ~p<0.1, two-tailed tests.
Attitudes towards all kinds of minorities are more tolerant, and xenophobia decreases, if
people have more contact with minorities themselves. In line with the ‘contact hypothesis’,
we find that those who have three or more friends of another race or ethnicity are much
less likely to be xenophobic. However, one must acknowledge that there is a problem of
endo-geneity. In addition, the model does not allow us to disentangle the causal
MYPLACE August 2014
MYPLACE: FP7-266831 www.fp7-myplace.eu Deliverable 4.6 Europe wide thematic report Page 321 of 431
relationships of the two variables – it is possible than people have more friends of other
ethnicity because they are less anti-immigrant. However, the ‘contact hypothesis’ is also
supported by the fact that xenophobia is lower in localities where there are more people of
ethnic minorities around (although the significance slightly misses the conventional 0.5
level).
We also find strong support for the ‘realistic group conflict’ theory. Not only are those who
are poor more xenophobic, but the overall situation in the area seems to matter too. The
number of families in the area facing financial difficulties is among the strongest contextual
level predictors of xenophobia: if the number of poor families in the area increased by 20
percent it would mean a 0.3 units increase in xenophobia. At the same time, the effect of
GDP growth during the crisis is insignificant. It shows that resource stress is mainly
experienced because of the economic conditions young people see around them, not
general macro-economic developments.
As expected, xenophobia is higher where the net immigration rates are higher, especially in
the bigger cities where immigrants often settle. At the same time, the analysis does not
confirm that post-socialist status would be linked to increased xenophobia. This means that
other factors, rather than post-socialist status, are responsible for high rates of xenophobia
in post-communist countries in East-Central Europe, such as resource stress, low quality of
media, and little social and political trust, combined with little contact with people from
other ethnic groups. In line with our expectations, we find that the liberal welfare state
type, such as observed in the UK, is more likely to produce xenophobia than other types of
welfare regimes. A potential explanation might be that people in less liberal countries that
provide more social security feel more secure and less threatened by the effect of
immigration on their life chances. From this point-of-view, the dismantling of the European
Social Model observed during the recent economic crisis risks facilitating the spread of anti-
immigrant attitudes across European youth.
Model D: Exclusionism (Q41_2, Q41_4, Q41_5)
The initial analysis of variance components reveals that 66 percent of variance in
exclusionism scores can be explained by differences between individuals, whereas 34
percent of the variance lies at the level of localities (intra-class correlation (ICC) = 0.34)
(Table 12.6.7). The substantial variation at the level of localities means that it is necessary to
employ a multilevel analysis to try to explain it.
Inclusion of the previously described individual level variables resulted in a 12 percent
decrease of residual, individual level variance. The chi-square test of deviances (df = 25,
loglikelihood = 2454) confirms that it is statistically significant. Interestingly, adding
individual level variables led to an even larger – 50 percent reduction in intercept variance.
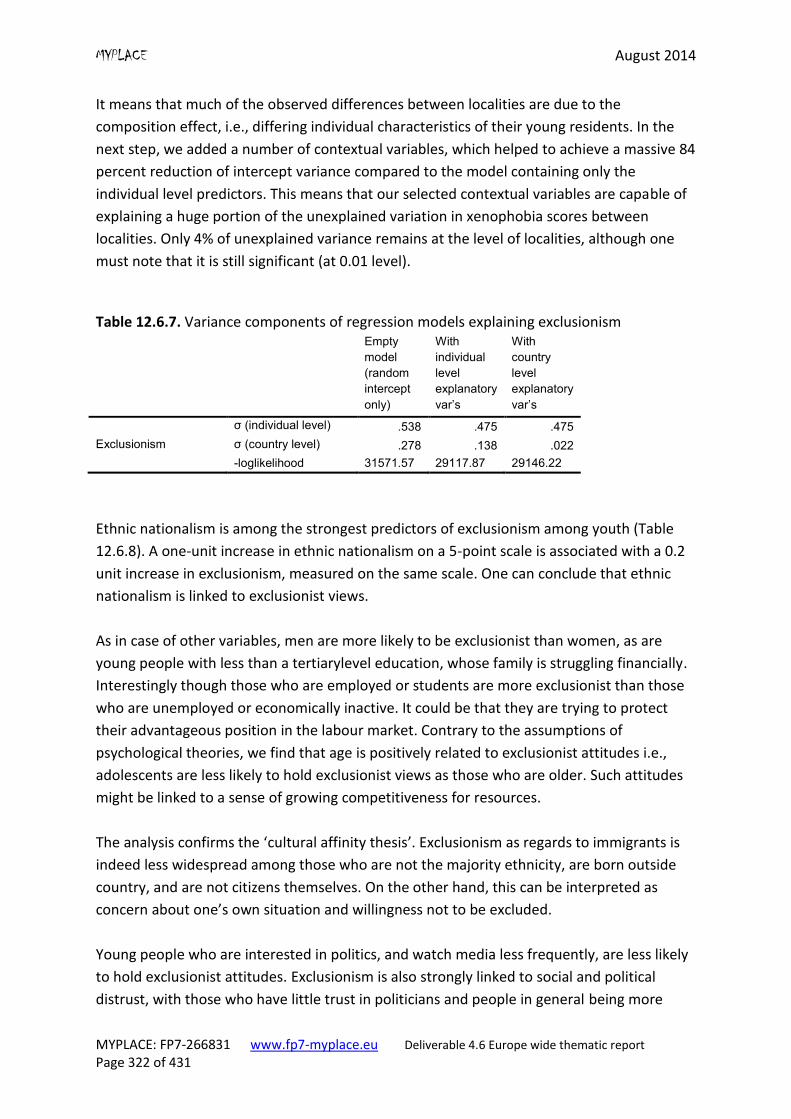
MYPLACE August 2014
MYPLACE: FP7-266831 www.fp7-myplace.eu Deliverable 4.6 Europe wide thematic report Page 322 of 431
It means that much of the observed differences between localities are due to the
composition effect, i.e., differing individual characteristics of their young residents. In the
next step, we added a number of contextual variables, which helped to achieve a massive 84
percent reduction of intercept variance compared to the model containing only the
individual level predictors. This means that our selected contextual variables are capable of
explaining a huge portion of the unexplained variation in xenophobia scores between
localities. Only 4% of unexplained variance remains at the level of localities, although one
must note that it is still significant (at 0.01 level).
Table 12.6.7. Variance components of regression models explaining exclusionism Empty
model
(random
intercept
only)
With
individual
level
explanatory
var’s
With
country
level
explanatory
var’s
σ (individual level) .538 .475 .475
Exclusionism σ (country level) .278 .138 .022
-loglikelihood 31571.57 29117.87 29146.22
Ethnic nationalism is among the strongest predictors of exclusionism among youth (Table
12.6.8). A one-unit increase in ethnic nationalism on a 5-point scale is associated with a 0.2
unit increase in exclusionism, measured on the same scale. One can conclude that ethnic
nationalism is linked to exclusionist views.
As in case of other variables, men are more likely to be exclusionist than women, as are
young people with less than a tertiarylevel education, whose family is struggling financially.
Interestingly though those who are employed or students are more exclusionist than those
who are unemployed or economically inactive. It could be that they are trying to protect
their advantageous position in the labour market. Contrary to the assumptions of
psychological theories, we find that age is positively related to exclusionist attitudes i.e.,
adolescents are less likely to hold exclusionist views as those who are older. Such attitudes
might be linked to a sense of growing competitiveness for resources.
The analysis confirms the ‘cultural affinity thesis’. Exclusionism as regards to immigrants is
indeed less widespread among those who are not the majority ethnicity, are born outside
country, and are not citizens themselves. On the other hand, this can be interpreted as
concern about one’s own situation and willingness not to be excluded.
Young people who are interested in politics, and watch media less frequently, are less likely
to hold exclusionist attitudes. Exclusionism is also strongly linked to social and political
distrust, with those who have little trust in politicians and people in general being more
MYPLACE August 2014
MYPLACE: FP7-266831 www.fp7-myplace.eu Deliverable 4.6 Europe wide thematic report Page 323 of 431
exclusionist. Perhaps they fear that immigrants could abuse the system in a dishonest
manner.
Like overall negative attitudes towards minorities and immigrants, exclusionism decreases if
people have more contact with minorities themselves. In line with the ‘contact hypothesis’,
we find that those who have friends of another race or ethnicity are much less likely to be
exclusionist. The ‘contact hypothesis’ is also supported by the fact that exclusionism is lower
in localities where there are more people around who were born abroad.
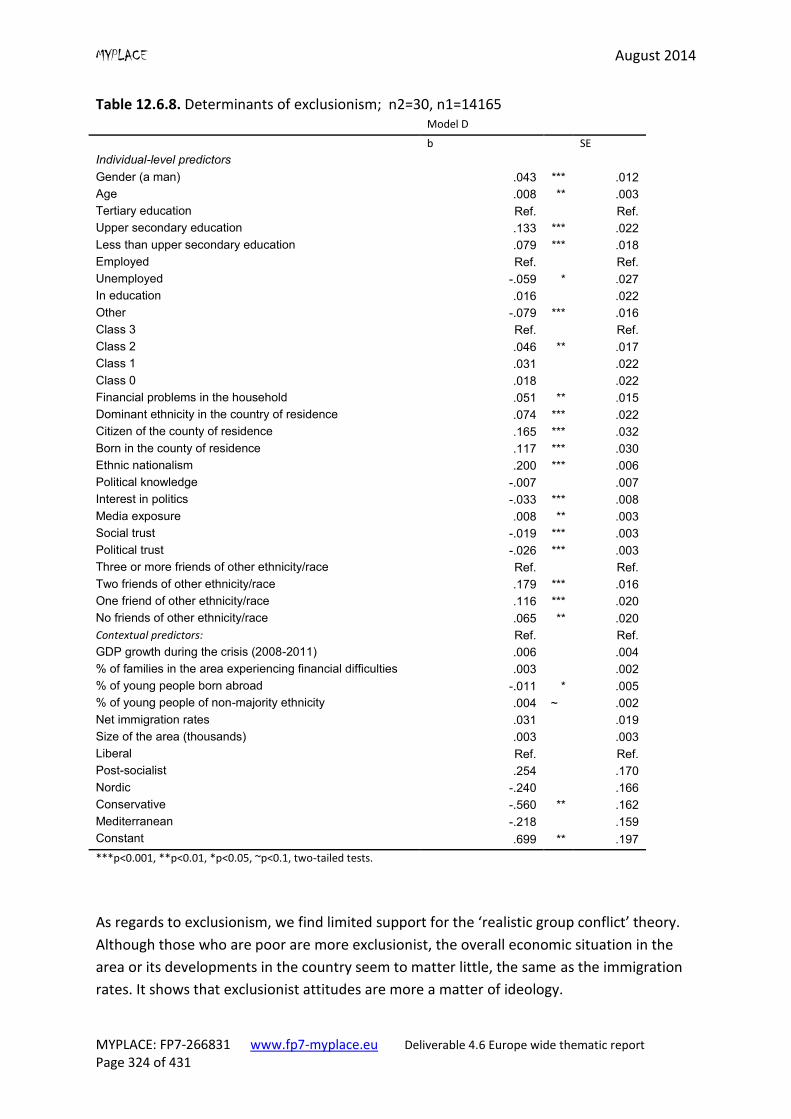
MYPLACE August 2014
MYPLACE: FP7-266831 www.fp7-myplace.eu Deliverable 4.6 Europe wide thematic report Page 324 of 431
Table 12.6.8. Determinants of exclusionism; n2=30, n1=14165 Model D
b SE
Individual-level predictors
Gender (a man) .043 *** .012
Age .008 ** .003
Tertiary education Ref. Ref.
Upper secondary education .133 *** .022
Less than upper secondary education .079 *** .018
Employed Ref. Ref.
Unemployed -.059 * .027
In education .016 .022
Other -.079 *** .016
Class 3 Ref. Ref.
Class 2 .046 ** .017
Class 1 .031 .022
Class 0 .018 .022
Financial problems in the household .051 ** .015
Dominant ethnicity in the country of residence .074 *** .022
Citizen of the county of residence .165 *** .032
Born in the county of residence .117 *** .030
Ethnic nationalism .200 *** .006
Political knowledge -.007 .007
Interest in politics -.033 *** .008
Media exposure .008 ** .003
Social trust -.019 *** .003
Political trust -.026 *** .003
Three or more friends of other ethnicity/race Ref. Ref.
Two friends of other ethnicity/race .179 *** .016
One friend of other ethnicity/race .116 *** .020
No friends of other ethnicity/race .065 ** .020
Contextual predictors: Ref. Ref.
GDP growth during the crisis (2008-2011) .006 .004
% of families in the area experiencing financial difficulties .003 .002
% of young people born abroad -.011 * .005
% of young people of non-majority ethnicity .004 ~ .002
Net immigration rates .031 .019
Size of the area (thousands) .003 .003
Liberal Ref. Ref.
Post-socialist .254 .170
Nordic -.240 .166
Conservative -.560 ** .162
Mediterranean -.218 .159
Constant .699 ** .197
***p<0.001, **p<0.01, *p<0.05, ~p<0.1, two-tailed tests.
As regards to exclusionism, we find limited support for the ‘realistic group conflict’ theory.
Although those who are poor are more exclusionist, the overall economic situation in the
area or its developments in the country seem to matter little, the same as the immigration
rates. It shows that exclusionist attitudes are more a matter of ideology.
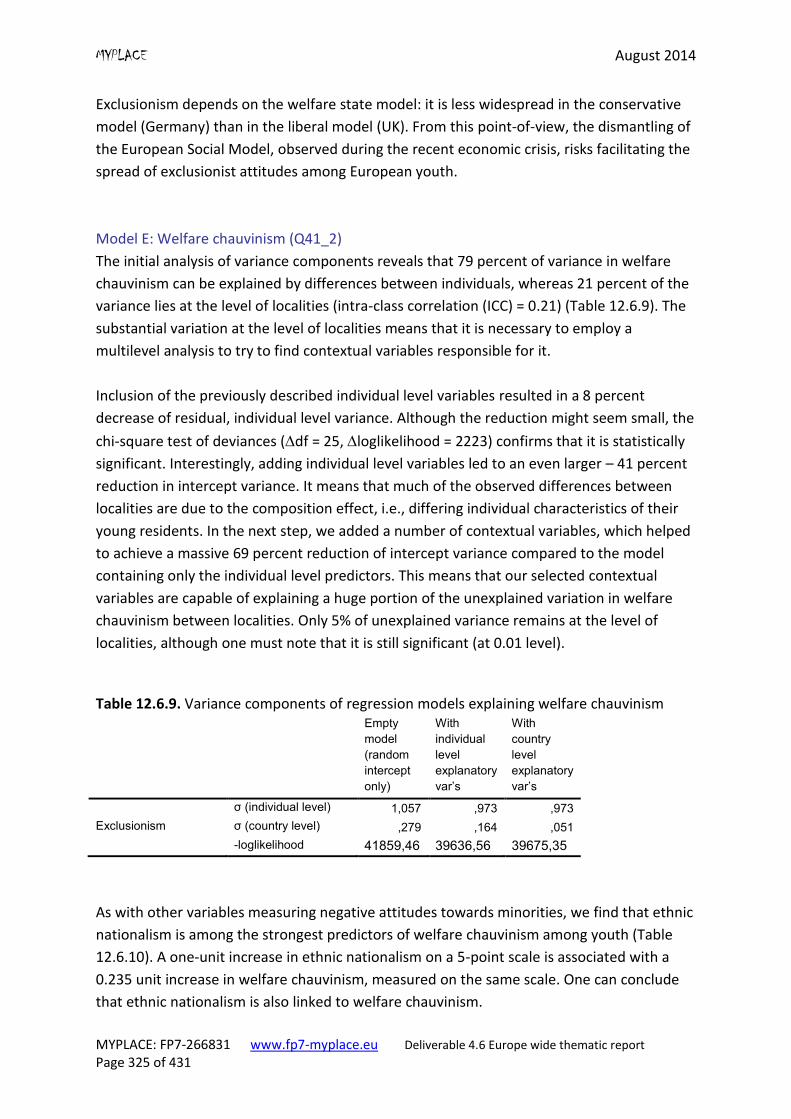
MYPLACE August 2014
MYPLACE: FP7-266831 www.fp7-myplace.eu Deliverable 4.6 Europe wide thematic report Page 325 of 431
Exclusionism depends on the welfare state model: it is less widespread in the conservative
model (Germany) than in the liberal model (UK). From this point-of-view, the dismantling of
the European Social Model, observed during the recent economic crisis, risks facilitating the
spread of exclusionist attitudes among European youth.
Model E: Welfare chauvinism (Q41_2)
The initial analysis of variance components reveals that 79 percent of variance in welfare
chauvinism can be explained by differences between individuals, whereas 21 percent of the
variance lies at the level of localities (intra-class correlation (ICC) = 0.21) (Table 12.6.9). The
substantial variation at the level of localities means that it is necessary to employ a
multilevel analysis to try to find contextual variables responsible for it.
Inclusion of the previously described individual level variables resulted in a 8 percent
decrease of residual, individual level variance. Although the reduction might seem small, the
chi-square test of deviances (df = 25, loglikelihood = 2223) confirms that it is statistically
significant. Interestingly, adding individual level variables led to an even larger – 41 percent
reduction in intercept variance. It means that much of the observed differences between
localities are due to the composition effect, i.e., differing individual characteristics of their
young residents. In the next step, we added a number of contextual variables, which helped
to achieve a massive 69 percent reduction of intercept variance compared to the model
containing only the individual level predictors. This means that our selected contextual
variables are capable of explaining a huge portion of the unexplained variation in welfare
chauvinism between localities. Only 5% of unexplained variance remains at the level of
localities, although one must note that it is still significant (at 0.01 level).
Table 12.6.9. Variance components of regression models explaining welfare chauvinism Empty
model
(random
intercept
only)
With
individual
level
explanatory
var’s
With
country
level
explanatory
var’s
σ (individual level) 1,057 ,973 ,973
Exclusionism σ (country level) ,279 ,164 ,051
-loglikelihood 41859,46 39636,56 39675,35
As with other variables measuring negative attitudes towards minorities, we find that ethnic
nationalism is among the strongest predictors of welfare chauvinism among youth (Table
12.6.10). A one-unit increase in ethnic nationalism on a 5-point scale is associated with a
0.235 unit increase in welfare chauvinism, measured on the same scale. One can conclude
that ethnic nationalism is also linked to welfare chauvinism.
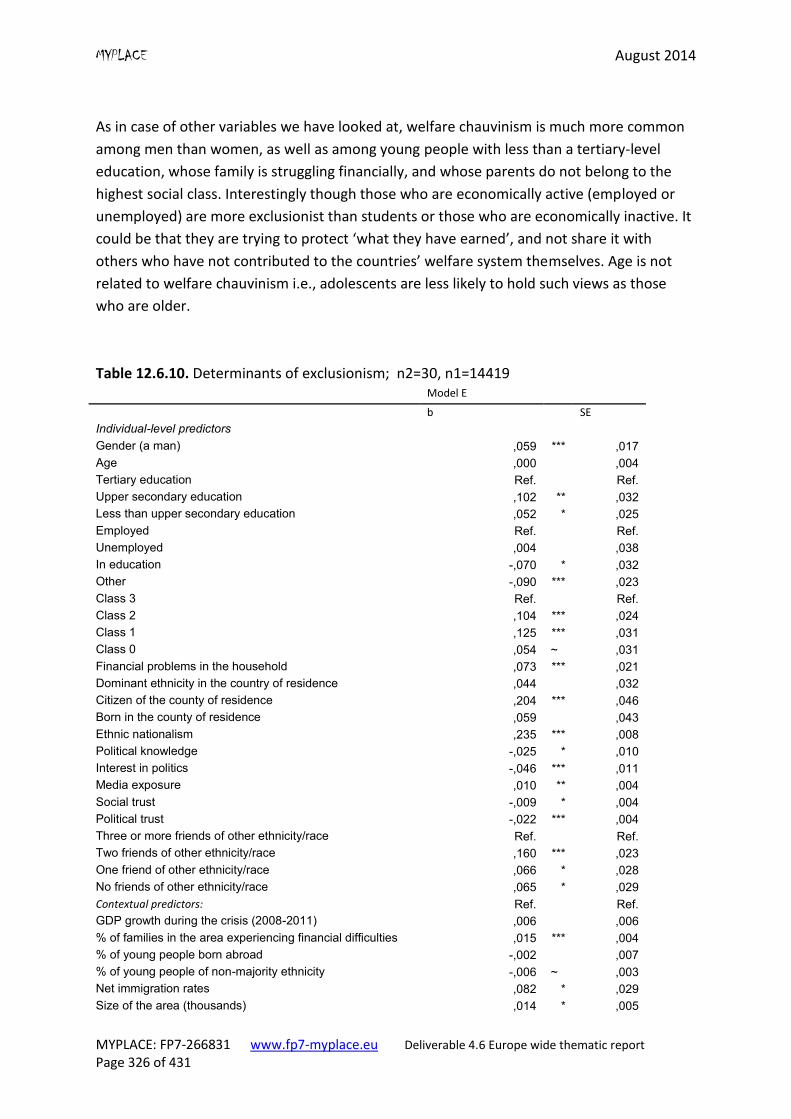
MYPLACE August 2014
MYPLACE: FP7-266831 www.fp7-myplace.eu Deliverable 4.6 Europe wide thematic report Page 326 of 431
As in case of other variables we have looked at, welfare chauvinism is much more common
among men than women, as well as among young people with less than a tertiary-level
education, whose family is struggling financially, and whose parents do not belong to the
highest social class. Interestingly though those who are economically active (employed or
unemployed) are more exclusionist than students or those who are economically inactive. It
could be that they are trying to protect ‘what they have earned’, and not share it with
others who have not contributed to the countries’ welfare system themselves. Age is not
related to welfare chauvinism i.e., adolescents are less likely to hold such views as those
who are older.
Table 12.6.10. Determinants of exclusionism; n2=30, n1=14419 Model E
b SE
Individual-level predictors
Gender (a man) ,059 *** ,017
Age ,000 ,004
Tertiary education Ref. Ref.
Upper secondary education ,102 ** ,032
Less than upper secondary education ,052 * ,025
Employed Ref. Ref.
Unemployed ,004 ,038
In education -,070 * ,032
Other -,090 *** ,023
Class 3 Ref. Ref.
Class 2 ,104 *** ,024
Class 1 ,125 *** ,031
Class 0 ,054 ~ ,031
Financial problems in the household ,073 *** ,021
Dominant ethnicity in the country of residence ,044 ,032
Citizen of the county of residence ,204 *** ,046
Born in the county of residence ,059 ,043
Ethnic nationalism ,235 *** ,008
Political knowledge -,025 * ,010
Interest in politics -,046 *** ,011
Media exposure ,010 ** ,004
Social trust -,009 * ,004
Political trust -,022 *** ,004
Three or more friends of other ethnicity/race Ref. Ref.
Two friends of other ethnicity/race ,160 *** ,023
One friend of other ethnicity/race ,066 * ,028
No friends of other ethnicity/race ,065 * ,029
Contextual predictors: Ref. Ref.
GDP growth during the crisis (2008-2011) ,006 ,006
% of families in the area experiencing financial difficulties ,015 *** ,004
% of young people born abroad -,002 ,007
% of young people of non-majority ethnicity -,006 ~ ,003
Net immigration rates ,082 * ,029
Size of the area (thousands) ,014 * ,005
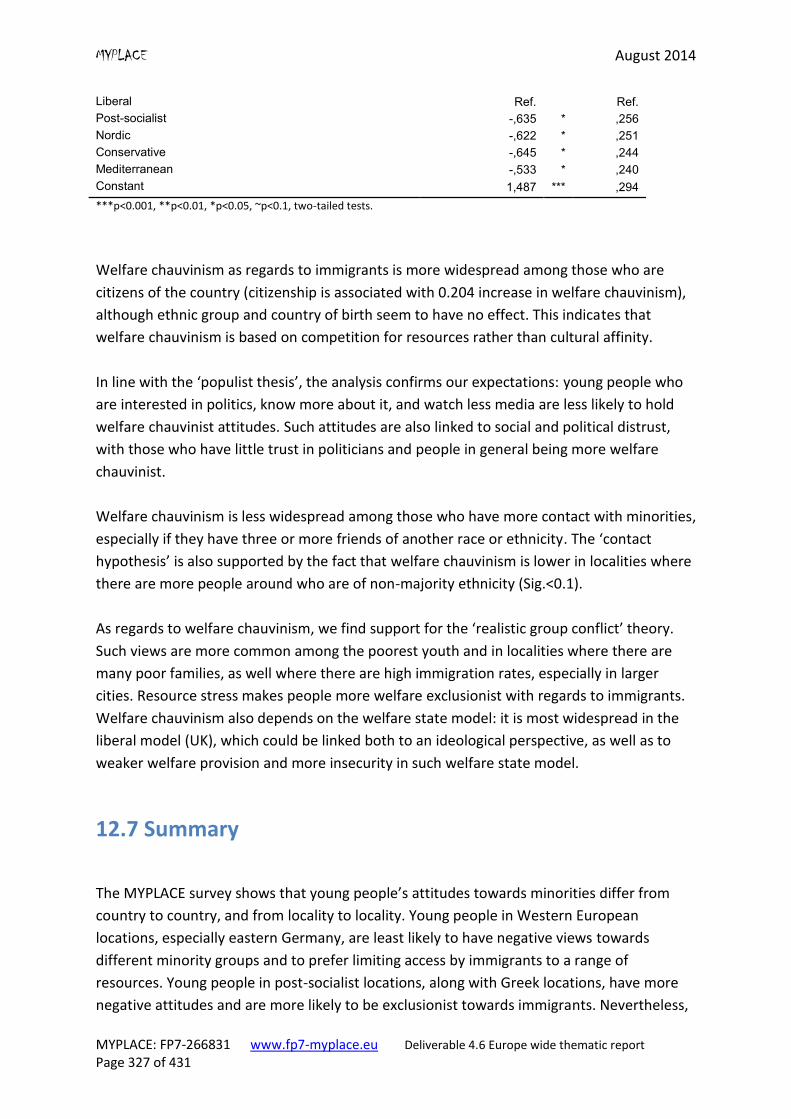
MYPLACE August 2014
MYPLACE: FP7-266831 www.fp7-myplace.eu Deliverable 4.6 Europe wide thematic report Page 327 of 431
Liberal Ref. Ref.
Post-socialist -,635 * ,256
Nordic -,622 * ,251
Conservative -,645 * ,244
Mediterranean -,533 * ,240
Constant 1,487 *** ,294
***p<0.001, **p<0.01, *p<0.05, ~p<0.1, two-tailed tests.
Welfare chauvinism as regards to immigrants is more widespread among those who are
citizens of the country (citizenship is associated with 0.204 increase in welfare chauvinism),
although ethnic group and country of birth seem to have no effect. This indicates that
welfare chauvinism is based on competition for resources rather than cultural affinity.
In line with the ‘populist thesis’, the analysis confirms our expectations: young people who
are interested in politics, know more about it, and watch less media are less likely to hold
welfare chauvinist attitudes. Such attitudes are also linked to social and political distrust,
with those who have little trust in politicians and people in general being more welfare
chauvinist.
Welfare chauvinism is less widespread among those who have more contact with minorities,
especially if they have three or more friends of another race or ethnicity. The ‘contact
hypothesis’ is also supported by the fact that welfare chauvinism is lower in localities where
there are more people around who are of non-majority ethnicity (Sig.<0.1).
As regards to welfare chauvinism, we find support for the ‘realistic group conflict’ theory.
Such views are more common among the poorest youth and in localities where there are
many poor families, as well where there are high immigration rates, especially in larger
cities. Resource stress makes people more welfare exclusionist with regards to immigrants.
Welfare chauvinism also depends on the welfare state model: it is most widespread in the
liberal model (UK), which could be linked both to an ideological perspective, as well as to
weaker welfare provision and more insecurity in such welfare state model.
12.7 Summary
The MYPLACE survey shows that young people’s attitudes towards minorities differ from
country to country, and from locality to locality. Young people in Western European
locations, especially eastern Germany, are least likely to have negative views towards
different minority groups and to prefer limiting access by immigrants to a range of
resources. Young people in post-socialist locations, along with Greek locations, have more
negative attitudes and are more likely to be exclusionist towards immigrants. Nevertheless,
MYPLACE August 2014
MYPLACE: FP7-266831 www.fp7-myplace.eu Deliverable 4.6 Europe wide thematic report Page 328 of 431
in some countries there are large differences between localities, for example, in Latvia and
Finland.
The most negative attitudes are towards the Roma, particularly in in Hungary, Slovakia,
Greece and Russia where there is a considerable Roma minority, as well as Lieksa and
Nurmes (Finland). Attitudes towards Jews are more positive than negative. The most
negative young people can be found in Ozd (Hungary), Trnava (Slovakia), Aegyroupouli
(Greece), and Vyborg (Russia). Attitudes towards Muslims are similarly positive; however
there are localities where negative views towards them are quite widespread: Vyborg
(Russia), Trnava (Slovakia) and Sopron (Hungary).
Young people in Greek locations are much more likely than others to have xenophobic
attitudes; this should be seen in the context of Greece having taken a large proportion
those fleeing unrest from the ‘Arab Spring’. Limiting immigration would also be supported
by young people in Vyborg (Russia), Bareiro (Portugal), Trnava (Slovakia), and Nuneaton
(UK), whereas German locations are clustered at the bottom of the xenophobia scale.
Hungary, Russia and Georgia are at the top of the welfare chauvinism and exclusion scale;
here young people favour limiting access by immigrants to various resources. Interestingly,
Nuneaton youth in the UK tend to be much more xenophobic, welfare chauvinist and
exclusionist than youth in Coventry.
One of the strongest predictors of negative attitudes towards minorities, xenophobia,
welfare chauvinism and exclusionism is ethnic nationalism. Like other studies, we also find
that all these negative attitudes are more widespread among men, and among those who
are less educated, whose families are struggling financially and whose parents do not belong
to the highest social class. This can be linked to a higher level of insecurity and perceived
competition. Moreover, perhaps linked to that, we find that young people who are
employed are more likely to have such attitudes rather than those who are not employed.
Age, on the other hand, does not help to explain negative attitudes towards minorities;
contrary to psychological theories, we find that young people are not more likely to have
such negative views as those who are older.
In line with the ‘cultural affinity thesis’, the analysis confirms that negative attitudes
towards minorities are more common among the dominant ethnic group than among those
who belong to minorities themselves, regardless of citizenship status. However, controlled
for ethnic group, those born outside the country tend to have more negative attitudes
towards minorities. This relationship is intriguing, and there could be several explanations
for it, such as cultural differences or perceived inter-group conflict or competition.
The analysis confirms the role of information in lessening prejudice towards minority
groups: those who are more interested in, and better informed about, politics are less likely
MYPLACE August 2014
MYPLACE: FP7-266831 www.fp7-myplace.eu Deliverable 4.6 Europe wide thematic report Page 329 of 431
to hold negative attitudes towards minorities. A frequent use of different media channels is,
however, strongly linked to negative attitudes towards minorities, xenophobia, welfare
chauvinism and exclusionism, which shows that the media are at least partly responsible for
the recent spread of populism and far right attitudes in Europe.
The data also confirms the ‘contact hypothesis’; personal contact with minorities decreases
negative attitudes towards minorities and immigrants. Similarly, overall distrust in people
and the government facilitates all kinds of negative attitudes towards minorities and
immigrants.
We also find strong support for the ‘realistic group conflict’ theory. Not only are those who
are poor also more xenophobic and likvely to have more negative attitudes towards
minorities, but the overall situation in the area matters too; in poorer areas such views are
more widespread. At the same time, the effect of GDP growth during the crisis is
insignificant. It shows that resource stress is mainly experienced based on the economic
conditions young people see around them, not general macro-economic developments.
Xenophobia and welfare chauvinism is more widespread where immigration rates are
higher, lending further support for resource stress and competition thesis. Finally, liberal
regimes are more likely to produce such attitudes. Thus the dismantling of the European
Social Model observed during the recent economic crisis risks facilitating the spread of anti-
immigrant attitudes across European youth.
MYPLACE August 2014
MYPLACE: FP7-266831 www.fp7-myplace.eu Deliverable 4.6 Europe wide thematic report Page 330 of 431
References
Allport, G. W. (1954) The Nature of Prejudice. Cambridge, Mass.: Addison-Wesley.
Binder, N. E., Polinard, J. L., Wrinkle, R. D. (1997) Mexican American and Anglo attitudes
toward immigration reform: a view from the border, Social Science Quarterly 78 (2): 324–37.
Fetzer, J. S. (2000) Public Attitudes toward Immigration in the United States, France, and
Germany. New York: Cambridge University Press.
Hewstone, M., Rubin, M., Willis, H. (2002). Intergroup bias, Annual Review of Psychology 53:
575–604.
Hox, J.(2010) Multilevel Analysis, Techniques and Applications. Second edition. New York:
Routledge.
Mares, M. (2013) The extreme right's relationship with Islam and Islamism in East-Central
Europe: From allies to enemies, East European Politics and Societies, Online first: 1-20, DOI:
10.1177/0888325413502073
Yilmaz, F. (2012) Right-wing hegemony and immigration: How the populist far-right achieved
hegemony through the immigration debate in Europe, Current Sociology 60(3): 368– 381
Kääriäinen, J., Lehtonen, H. (2006). The variety of social capital in welfare state regimes – a
comparative study of 21 countries, European Societies 8 (1): 27–57.
Lewin-Epstein, N., Levanon, A. (2005) National identity and xenophobia in an ethnically
divided society, International Journal on Multicultural Societies 7(2):90-118.
Mau, S., Mewes, J., Schöneck, M. (2012) What determines subjective socio-economic
insecurity? Context and class in comparative perspective, Socio-Economic Review 10, 655–
682
Mudde, C. (2005) Racist Extremism in Central and Eastern Europe, East European Politics
and Societies 19 (2), 161–184.
Pettigrew, T. F. (1971) Racially Separate or Together? New York: McGraw-Hill.
Sherif, M., Sherif, C.W. (1953). Groups in Harmony and Tension. New York: Harper and
Brothers.
MYPLACE August 2014
MYPLACE: FP7-266831 www.fp7-myplace.eu Deliverable 4.6 Europe wide thematic report Page 331 of 431
Chapter 13: Democracy
Introduction
Respondents’ attitudes to democracy was measured using a range of questions covering
specific questions on satisfaction with democracy, types of political regime, through to the
legitimacy of violence, respect for human rights, experience of discrimination and attitudes
to social and economic issues.
Summary of National Reports
Country specific analyses were conducted as part of deliverable 4.5. This section briefly
summaries the key findings on understanding of democracy from these reports. To
generalise, most young people support democracy as a political system, but are less
satisfied with the way democracy works.
When asked questions about attitudes to various forms of political systems, most
respondents stated that, they were pro-democratic, supporting multi-party systems, with an
opposition that can freely express its views. A number of locations (Croatia, Georgia and to a
lesser extent the UK) had stronger autocratic views, including supporting having a strong
leader who is not constrained by parliament.
Satisfaction with democracy varied from country to country, ranging from a general
satisfaction with democracy (Denmark and western Germany) to dissatisfaction with
democracy (Greece, Spain and Portugal). Country specific analysis found that females were
more satisfied with democracy than males (Estonia, Finland, Latvia and Portugal),
satisfaction with democracy increased with social class (Denmark, Estonia, Finland and
Slovakia) and young people with higher education were more satisfied (Demark and western
Germany). Non-nationals were more satisfied with democracy than nationals (Spain and the
UK).
There was general disapproval for attitudes towards violence, with most young people
stating that it is rarely justified. Females are more against violence than males. A slightly
higher proportion of young people in a few countries (Croatia, Slovakia and the UK) stated
violence would be justified to protect human rights.
In general, there were low levels of self-perceived discrimination measured across
locations. There were higher levels of discrimination if the respondent was female (Finland,
MYPLACE August 2014
MYPLACE: FP7-266831 www.fp7-myplace.eu Deliverable 4.6 Europe wide thematic report Page 332 of 431
eastern and western Germany and Russia), were of an ethnic minority (Denmark, Estonia,
Finland, eastern Germany, Latvia and the UK), belonged to a particular religious minority
(Denmark, Latvia and UK). In certain countries, it was also perceived that specific
subcultures (Croatia and Russia) had higher levels of discrimination.
There were mixed views on the respect for Human rights. There is a general satisfaction
with human rights in Denmark, Finland and Germany (western and eastern), a polarised
view in Russia and a lack of respect in Greece and Georgia. There were also different
opinions between countries on the death penalty, with certain countries strongly
supporting the death penalty (Georgia). There are also polarised views (Estonia) and
generally more support from males than females.
Literature
Democracy is one of a number of types of regimes or systems of governance (Schmitter and
Karl, 1991). There is no consensus on what democracy is, and it is an essentially contested
concept (Coppedge, 2005). Democracy, understood in a very general way, means ‘rule by
the people’ (Coppedge et al., 2011), or ‘government by and for the people’ (Lijphart, 2012).
There are a number of forms of modern democracies, which, are sensitive to the historical
context from which they developed (Lijphart, 1999; Vatter and Bernauer, 2009).
Dahl (1971) states that there are essentially two attributes to a democracy, consisting of
contestation and participation. Supporting these are rights and laws, therefore, a
democracy system of government includes a number of key elements;
a) A system for choosing and replacing the government, through free and fair elections.
b) The active participation of the people, as citizens, in politics and civic life.
c) Protection of the human rights of all citizens.
d) A rule of law, in which the laws and procedures, apply equally to all citizens.
The two main types of democracy are ‘consensual’ and ‘majoritarian’; in majoritarian
systems, the majority rule, and exclude minority opinions in the decision making process,
whereas in a consensual system a broad range opinions or as many people as possible are
considered in decision making (Lijphart, 1999). Free and fair elections are held at regular
intervals on the basis of universal, equal and secret suffrage in all democratic systems
(Goodwin-Gill, 2006). Elections take place on matters that affect the lives of citizens (van der
Eijk and Franklin, 2009) and are contested on a range of economic, social and
communitarian issues (Coppedge, 2005). Democracies allow citizens to choose their leaders.
When a winning political party (or coalition of parties) takes office and are mandated to run
the country and when political decisions are made they, are supposed to ultimately to
reflect the wishes of a country’s citizens (van der Eijk and Franklin, 2009). Although there is
MYPLACE August 2014
MYPLACE: FP7-266831 www.fp7-myplace.eu Deliverable 4.6 Europe wide thematic report Page 333 of 431
a degree of uncertainty as to who will be elected and which policies will be pursued
(Schmitter and Karl, 1991). Governments may pursue either a socialist (social democratic) or
liberal (free-market) approach. Losing parties form the opposition, and on behalf of the
people, provide a challenge as part of an open and transparent political system. Within a
democracy, elections should provide an adequate representation, in terms of the spectrum
of views and policies (der Eijk and Franklin, 2009), from the left to the right, and should
provide openness and equity, with new entrants free to form new parties. Governments and
political parties (elites), are held to accountable by the people (citizens), between elections,
and through the electoral process they can either be re-elected or removed from office. This
process legitimises governments within democracies (Bogdanor, 2007). There have been a
number of waves of democracy (Schmitter and Karl, 1991), including the fall of the Berlin
Wall, in 1989, with Eastern European countries adopting democracies over communist
regimes.
Citizens are a key component within a democracy. For a democracy to work there must be
free, active participation of the people. This can take several forms, from the civic duty of
voting in elections, to voluntary participation in the ‘civil society’ (Schmitter and Karl, 1991)
which are non-governmental organisations and institutions, which involves freedom of
speech and expression, including protesting. A free and transparent media plays an
important role in communicating messages between the government, political parties
including the opposition and citizens.
Trust in government is a mainstay of democracy (Christensen and Laegreid, 2003) and
central to political trust is a positive appraisal of the performance of governments, parties
and leaders (Dermody et al., 2010). Government is assumed to possess the tools and
abilities to ‘solve’ social problems (Anderson and Gillory, 1997:68) and over recent years,
especially since the start of the economic recession, government effectiveness and output is
debated. Negative press coverage of political integrity and performance has led to a
negative orientation towards government and politicians, leading to cynicism and distrust
(Dermody et al., 2010:423). Over the last five years, trust in national governments (of the
EU) has fallen from 34% in autumn 2008, to 23% in autumn 2013; and trust in the European
Union has fallen from 47% to 31% over the same time period (European Commission, 2013).
In recent surveys, there has also been declining support for the broader European project
(Pew Research Center, 2013). There has been a fall in voter turnout for elections at national
and European levels; European election turnout has fallen from 62% participation in 1979,
to a disappointing 43% in 2009 (Nacarino et al., 2012). This together with a decline in
political efficacy or ’the feeling that individual political action does have, or can have an
impact on the political process‘ (Campbell et al., 1954:187) has led to what is described as a
‘democratic deficit’ (Norris, 2011, Kohler-Kohl, 2010, Bogdanor, 2007). The ‘democratic
deficit’ is when the perceived democratic performance diverges from public expectations
(Norris, 2011) with consequences leading to a crisis of legitimacy.
MYPLACE August 2014
MYPLACE: FP7-266831 www.fp7-myplace.eu Deliverable 4.6 Europe wide thematic report Page 334 of 431
Easton (1957) presents an approach to the analysis of political system, which is adopted by
Norris (2011), to develop a conceptual framework in an attempt to examine ‘democratic
deficit’. These including indicators of system support Norris (2011:24) which range from
diffuse (nation-state) to specific (incumbents) indicators;
1. Attitudes towards belonging to the nation-state e.g. national pride, citizenship
and identity
2. Agreement with core principles and normative values upon the regime is based
including support for democratic ideals and rejection of autocratic principles
3. Evaluations of the overall performance of the regime
4. Confidence in regime institutions
5. Approval of incumbent officeholders e.g. government leader, politicians
There are a number of methods for measuring democracies which are explored by Munck
and Verkuilen (2002), Coppedge (2005) and Coppedge et al. (2011), including Freedom
House Index (Freedom House, 2014), Economist Intelligence Unit Democracy Index
(Economist Intelligence Unit, 2013) and the Demos EU Democracy Index (Birdwell et al.,
2013). Each uses a range of variables to categorise a country’s political regimes into a series
of types. Likewise, there are similar indexes for Human Rights (Cingranelli and Richards,
2010) and Press Freedom (RSF, 2014), which complement broader democracy indices.
13.1 Satisfaction with democracy (Q42)
General satisfaction with the way that democracy works in each country is measured using
an eleven-point scale where high values indicate satisfaction with how well it is working.
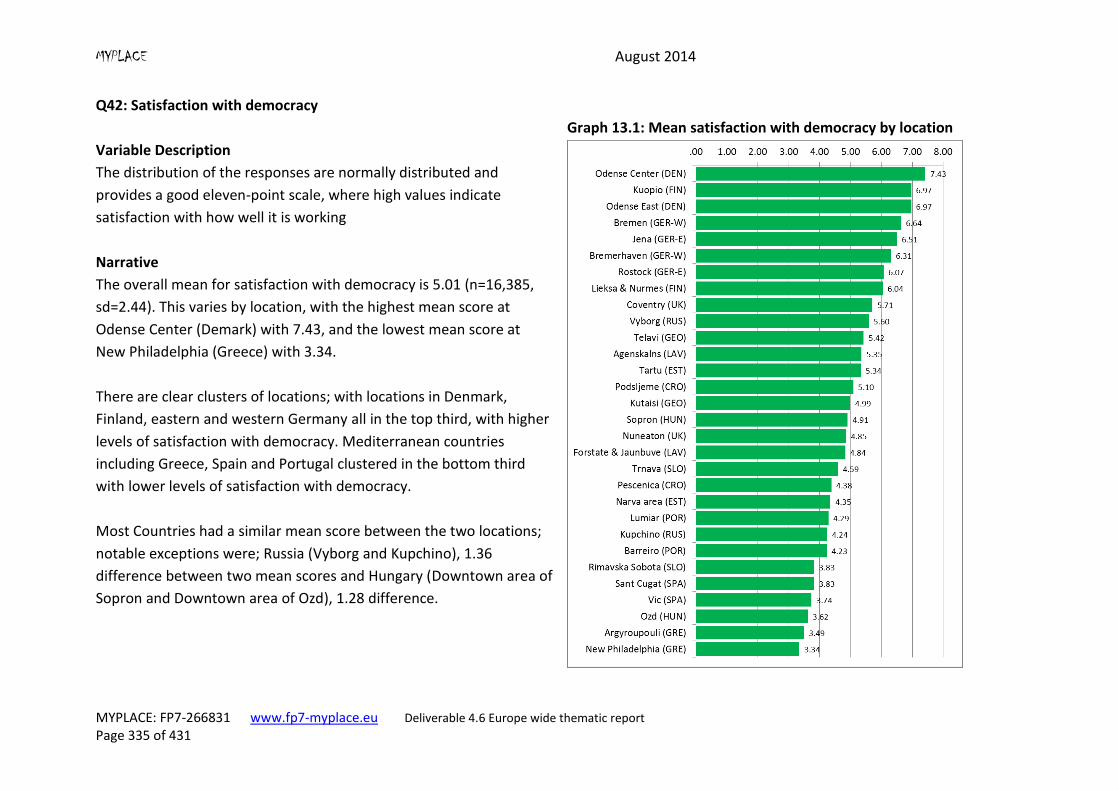
MYPLACE August 2014
MYPLACE: FP7-266831 www.fp7-myplace.eu Deliverable 4.6 Europe wide thematic report Page 335 of 431
Q42: Satisfaction with democracy
Variable Description
The distribution of the responses are normally distributed and
provides a good eleven-point scale, where high values indicate
satisfaction with how well it is working
Graph 13.1: Mean satisfaction with democracy by location
Narrative
The overall mean for satisfaction with democracy is 5.01 (n=16,385,
sd=2.44). This varies by location, with the highest mean score at
Odense Center (Demark) with 7.43, and the lowest mean score at
New Philadelphia (Greece) with 3.34.
There are clear clusters of locations; with locations in Denmark,
Finland, eastern and western Germany all in the top third, with higher
levels of satisfaction with democracy. Mediterranean countries
including Greece, Spain and Portugal clustered in the bottom third
with lower levels of satisfaction with democracy.
Most Countries had a similar mean score between the two locations;
notable exceptions were; Russia (Vyborg and Kupchino), 1.36
difference between two mean scores and Hungary (Downtown area of
Sopron and Downtown area of Ozd), 1.28 difference.
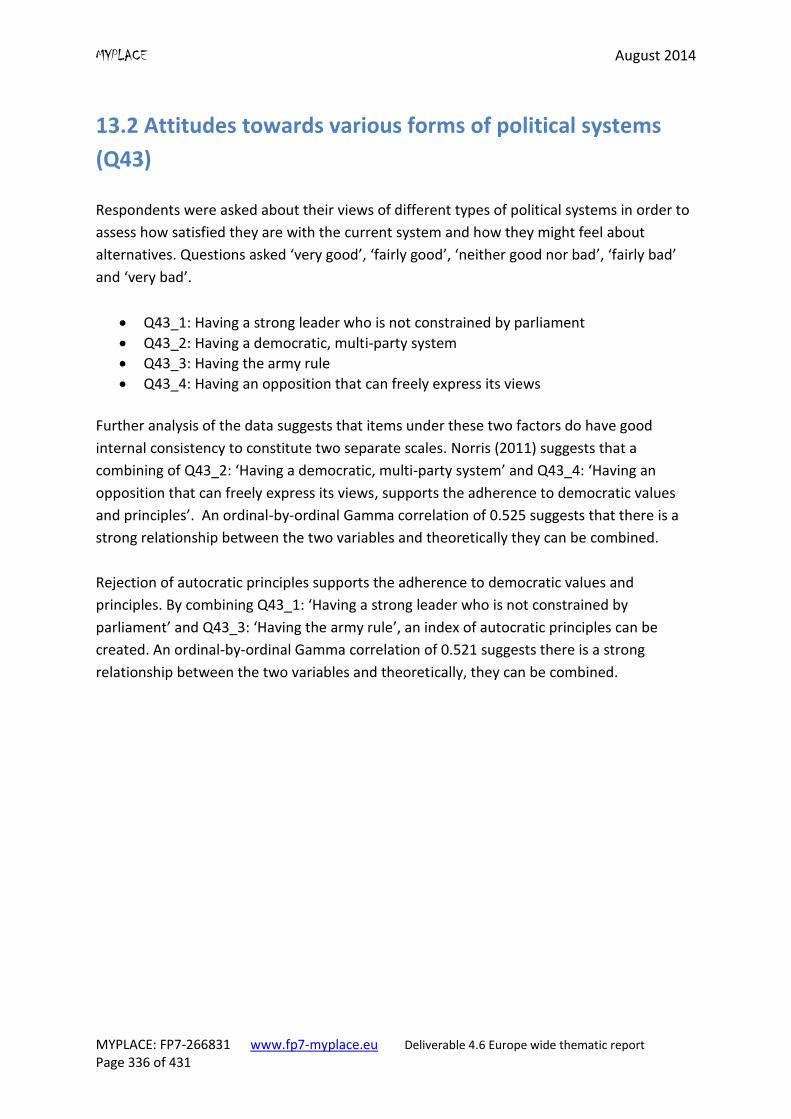
MYPLACE August 2014
MYPLACE: FP7-266831 www.fp7-myplace.eu Deliverable 4.6 Europe wide thematic report Page 336 of 431
13.2 Attitudes towards various forms of political systems
(Q43)
Respondents were asked about their views of different types of political systems in order to
assess how satisfied they are with the current system and how they might feel about
alternatives. Questions asked ‘very good’, ‘fairly good’, ‘neither good nor bad’, ‘fairly bad’
and ‘very bad’.
Q43_1: Having a strong leader who is not constrained by parliament
Q43_2: Having a democratic, multi-party system
Q43_3: Having the army rule
Q43_4: Having an opposition that can freely express its views
Further analysis of the data suggests that items under these two factors do have good
internal consistency to constitute two separate scales. Norris (2011) suggests that a
combining of Q43_2: ‘Having a democratic, multi-party system’ and Q43_4: ‘Having an
opposition that can freely express its views, supports the adherence to democratic values
and principles’. An ordinal-by-ordinal Gamma correlation of 0.525 suggests that there is a
strong relationship between the two variables and theoretically they can be combined.
Rejection of autocratic principles supports the adherence to democratic values and
principles. By combining Q43_1: ‘Having a strong leader who is not constrained by
parliament’ and Q43_3: ‘Having the army rule’, an index of autocratic principles can be
created. An ordinal-by-ordinal Gamma correlation of 0.521 suggests there is a strong
relationship between the two variables and theoretically, they can be combined.
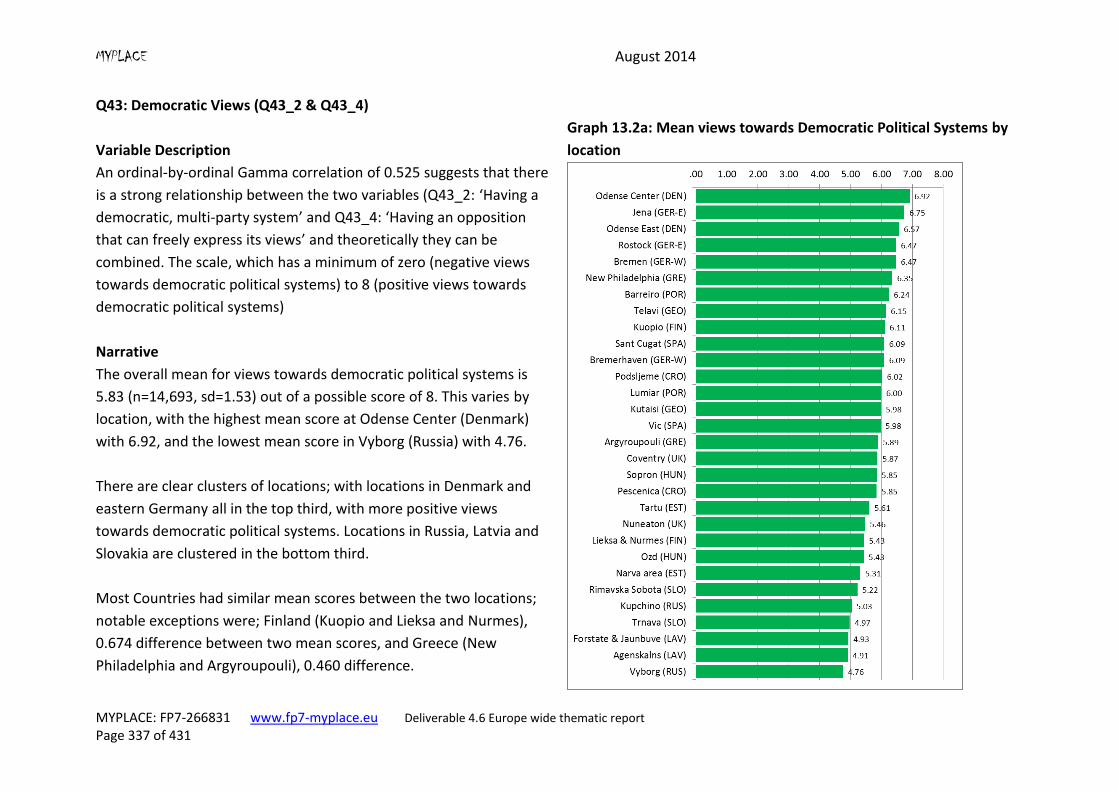
MYPLACE August 2014
MYPLACE: FP7-266831 www.fp7-myplace.eu Deliverable 4.6 Europe wide thematic report Page 337 of 431
Q43: Democratic Views (Q43_2 & Q43_4)
Variable Description
An ordinal-by-ordinal Gamma correlation of 0.525 suggests that there
is a strong relationship between the two variables (Q43_2: ‘Having a
democratic, multi-party system’ and Q43_4: ‘Having an opposition
that can freely express its views’ and theoretically they can be
combined. The scale, which has a minimum of zero (negative views
towards democratic political systems) to 8 (positive views towards
democratic political systems)
Graph 13.2a: Mean views towards Democratic Political Systems by
location
Narrative
The overall mean for views towards democratic political systems is
5.83 (n=14,693, sd=1.53) out of a possible score of 8. This varies by
location, with the highest mean score at Odense Center (Denmark)
with 6.92, and the lowest mean score in Vyborg (Russia) with 4.76.
There are clear clusters of locations; with locations in Denmark and
eastern Germany all in the top third, with more positive views
towards democratic political systems. Locations in Russia, Latvia and
Slovakia are clustered in the bottom third.
Most Countries had similar mean scores between the two locations;
notable exceptions were; Finland (Kuopio and Lieksa and Nurmes),
0.674 difference between two mean scores, and Greece (New
Philadelphia and Argyroupouli), 0.460 difference.
MYPLACE August 2014
MYPLACE: FP7-266831 www.fp7-myplace.eu Deliverable 4.6 Europe wide thematic report Page 338 of 431
Q43: Autocratic Principles (Q43_1 & Q43_3)
Variable Description
An ordinal-by-ordinal Gamma correlation of 0.521 suggests that there
is a strong relationship between the two variables (Q43_1: ‘Having a
strong leader who is not constrained by parliament’ and Q43_3:
‘Having the army rule’) and theoretically they can be combined. The
scale, which has a minimum of zero (negative autocratic principles) to
8 (positive autocratic principles).
Graph 13.2b: Mean views towards Autocratic principles by location
Narrative
The overall mean for views towards democratic political systems is
4.70 (n=15,377, sd=1.49) out of a possible score of 8. This varies by
location, with the highest mean score at Kutaisi (Georgian) with 5.75,
and the lowest mean score in Bremen (western Germany) with 3.76.
There are clear clusters of locations; with locations in Georgia,
Croatia, UK and Portugal all in the top third, with more positive views
towards autocratic principles. Locations in Germany (western and
eastern), Finland and Spain are clustered in the bottom third with
negative views towards autocratic principles.
Most Countries had similar mean scores between the two locations;
notable exceptions were; Hungary (Ozd and Sopron), 0.584 difference
between two mean scores, Greece (New Philadelphia and
Argyroupouli), 0.490 difference, and Estonia (Narva area and Tartu),
0.455 difference.

MYPLACE August 2014
MYPLACE: FP7-266831 www.fp7-myplace.eu Deliverable 4.6 Europe wide thematic report Page 339 of 431
13.3 Attitude towards violence (Q44)
Respondents were asked in which of the following cases do you believe violence can be or
cannot be justified?’ with the following options; ‘always justified’, ‘mostly justified’, ‘neither
justified or unjustified, mostly unjustified and never justified
To protect jobs from being cut
To protect human rights
To prevent global warming
To end poverty
To protect your ethnic / racial group
To sustain a stable government
To overthrow a government
To respect and protect animal rights
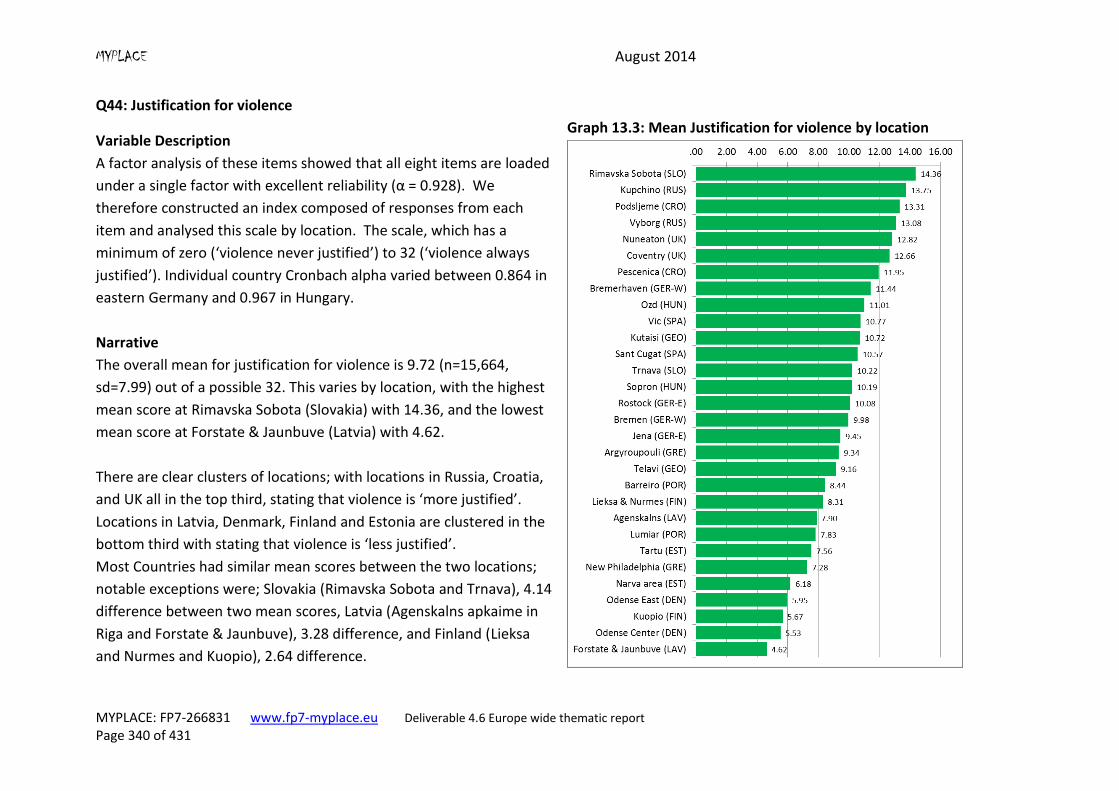
MYPLACE August 2014
MYPLACE: FP7-266831 www.fp7-myplace.eu Deliverable 4.6 Europe wide thematic report Page 340 of 431
Q44: Justification for violence
Variable Description
A factor analysis of these items showed that all eight items are loaded
under a single factor with excellent reliability (α = 0.928). We
therefore constructed an index composed of responses from each
item and analysed this scale by location. The scale, which has a
minimum of zero (‘violence never justified’) to 32 (‘violence always
justified’). Individual country Cronbach alpha varied between 0.864 in
eastern Germany and 0.967 in Hungary.
Graph 13.3: Mean Justification for violence by location
Narrative
The overall mean for justification for violence is 9.72 (n=15,664,
sd=7.99) out of a possible 32. This varies by location, with the highest
mean score at Rimavska Sobota (Slovakia) with 14.36, and the lowest
mean score at Forstate & Jaunbuve (Latvia) with 4.62.
There are clear clusters of locations; with locations in Russia, Croatia,
and UK all in the top third, stating that violence is ‘more justified’.
Locations in Latvia, Denmark, Finland and Estonia are clustered in the
bottom third with stating that violence is ‘less justified’.
Most Countries had similar mean scores between the two locations;
notable exceptions were; Slovakia (Rimavska Sobota and Trnava), 4.14
difference between two mean scores, Latvia (Agenskalns apkaime in
Riga and Forstate & Jaunbuve), 3.28 difference, and Finland (Lieksa
and Nurmes and Kuopio), 2.64 difference.

MYPLACE August 2014
MYPLACE: FP7-266831 www.fp7-myplace.eu Deliverable 4.6 Europe wide thematic report Page 341 of 431
13.4 Attitude towards social justice and the economy (Q45)
Respondents’ attitudes towards social justice and the economy were measured by a four-
item question, which measures differing views on the economy from a variety of
perspectives. The items are balanced with two which are ideologically closer to socialist
principles (items 2 and 3), and two which are closer to free-market principles (items 1 and
4). This structure allows us to explore the individual ideological positions held and the
extent to which they can be mapped onto an ideological spectrum.
Q45_1 The unemployed should have to take any job available or lose their unemployment benefits
Q45_2 Competition is harmful, it brings out the worst in people
Q45_3 Incomes should be made more equal
Q45_4 Private ownership of business and industry should be increased
The factor analysis of these four items showed there to be two distinct factors, which
mapped directly onto the item pairing described above. However, the reliability of these
factors was low with Cronbach α values less than 0.4. For this reason, we did not produce
indices and analyse each of the items separately.
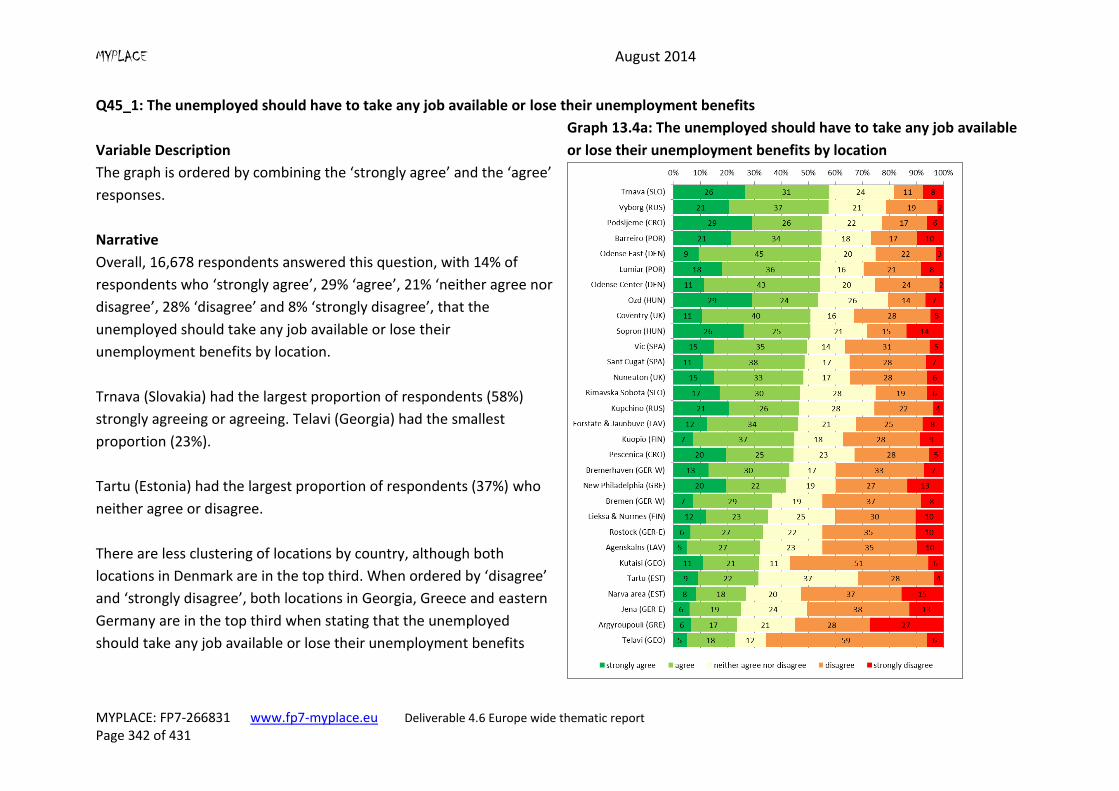
MYPLACE August 2014
MYPLACE: FP7-266831 www.fp7-myplace.eu Deliverable 4.6 Europe wide thematic report Page 342 of 431
Q45_1: The unemployed should have to take any job available or lose their unemployment benefits
Variable Description
The graph is ordered by combining the ‘strongly agree’ and the ‘agree’
responses.
Graph 13.4a: The unemployed should have to take any job available
or lose their unemployment benefits by location
Narrative
Overall, 16,678 respondents answered this question, with 14% of
respondents who ‘strongly agree’, 29% ‘agree’, 21% ‘neither agree nor
disagree’, 28% ‘disagree’ and 8% ‘strongly disagree’, that the
unemployed should take any job available or lose their
unemployment benefits by location.
Trnava (Slovakia) had the largest proportion of respondents (58%)
strongly agreeing or agreeing. Telavi (Georgia) had the smallest
proportion (23%).
Tartu (Estonia) had the largest proportion of respondents (37%) who
neither agree or disagree.
There are less clustering of locations by country, although both
locations in Denmark are in the top third. When ordered by ‘disagree’
and ‘strongly disagree’, both locations in Georgia, Greece and eastern
Germany are in the top third when stating that the unemployed
should take any job available or lose their unemployment benefits
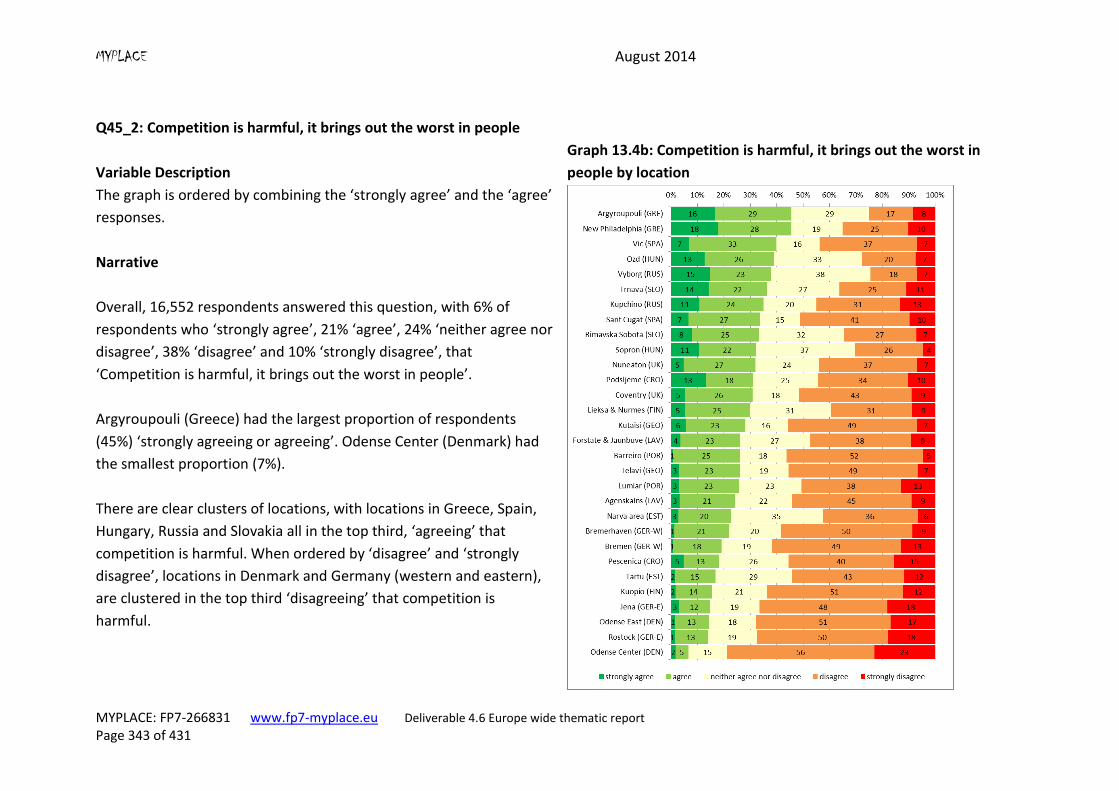
MYPLACE August 2014
MYPLACE: FP7-266831 www.fp7-myplace.eu Deliverable 4.6 Europe wide thematic report Page 343 of 431
Q45_2: Competition is harmful, it brings out the worst in people
Variable Description
The graph is ordered by combining the ‘strongly agree’ and the ‘agree’
responses.
Graph 13.4b: Competition is harmful, it brings out the worst in
people by location
Narrative
Overall, 16,552 respondents answered this question, with 6% of
respondents who ‘strongly agree’, 21% ‘agree’, 24% ‘neither agree nor
disagree’, 38% ‘disagree’ and 10% ‘strongly disagree’, that
‘Competition is harmful, it brings out the worst in people’.
Argyroupouli (Greece) had the largest proportion of respondents
(45%) ‘strongly agreeing or agreeing’. Odense Center (Denmark) had
the smallest proportion (7%).
There are clear clusters of locations, with locations in Greece, Spain,
Hungary, Russia and Slovakia all in the top third, ‘agreeing’ that
competition is harmful. When ordered by ‘disagree’ and ‘strongly
disagree’, locations in Denmark and Germany (western and eastern),
are clustered in the top third ‘disagreeing’ that competition is
harmful.
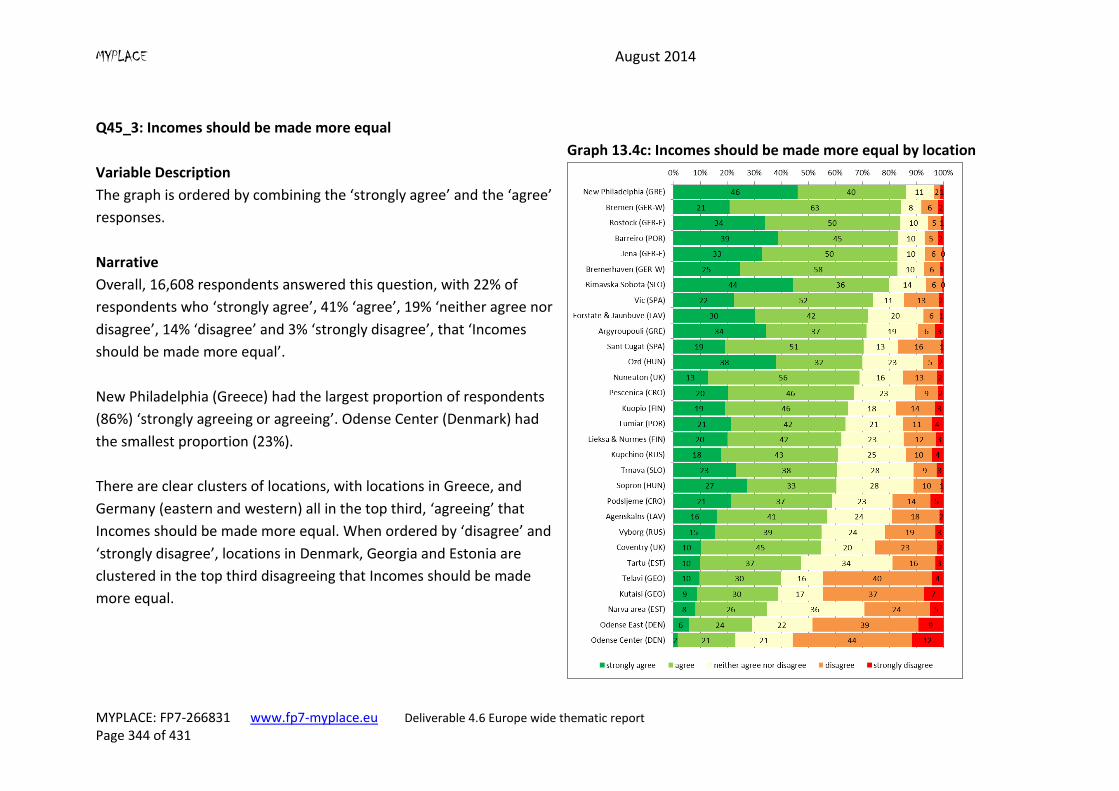
MYPLACE August 2014
MYPLACE: FP7-266831 www.fp7-myplace.eu Deliverable 4.6 Europe wide thematic report Page 344 of 431
Q45_3: Incomes should be made more equal
Variable Description
The graph is ordered by combining the ‘strongly agree’ and the ‘agree’
responses.
Graph 13.4c: Incomes should be made more equal by location
Narrative
Overall, 16,608 respondents answered this question, with 22% of
respondents who ‘strongly agree’, 41% ‘agree’, 19% ‘neither agree nor
disagree’, 14% ‘disagree’ and 3% ‘strongly disagree’, that ‘Incomes
should be made more equal’.
New Philadelphia (Greece) had the largest proportion of respondents
(86%) ‘strongly agreeing or agreeing’. Odense Center (Denmark) had
the smallest proportion (23%).
There are clear clusters of locations, with locations in Greece, and
Germany (eastern and western) all in the top third, ‘agreeing’ that
Incomes should be made more equal. When ordered by ‘disagree’ and
‘strongly disagree’, locations in Denmark, Georgia and Estonia are
clustered in the top third disagreeing that Incomes should be made
more equal.
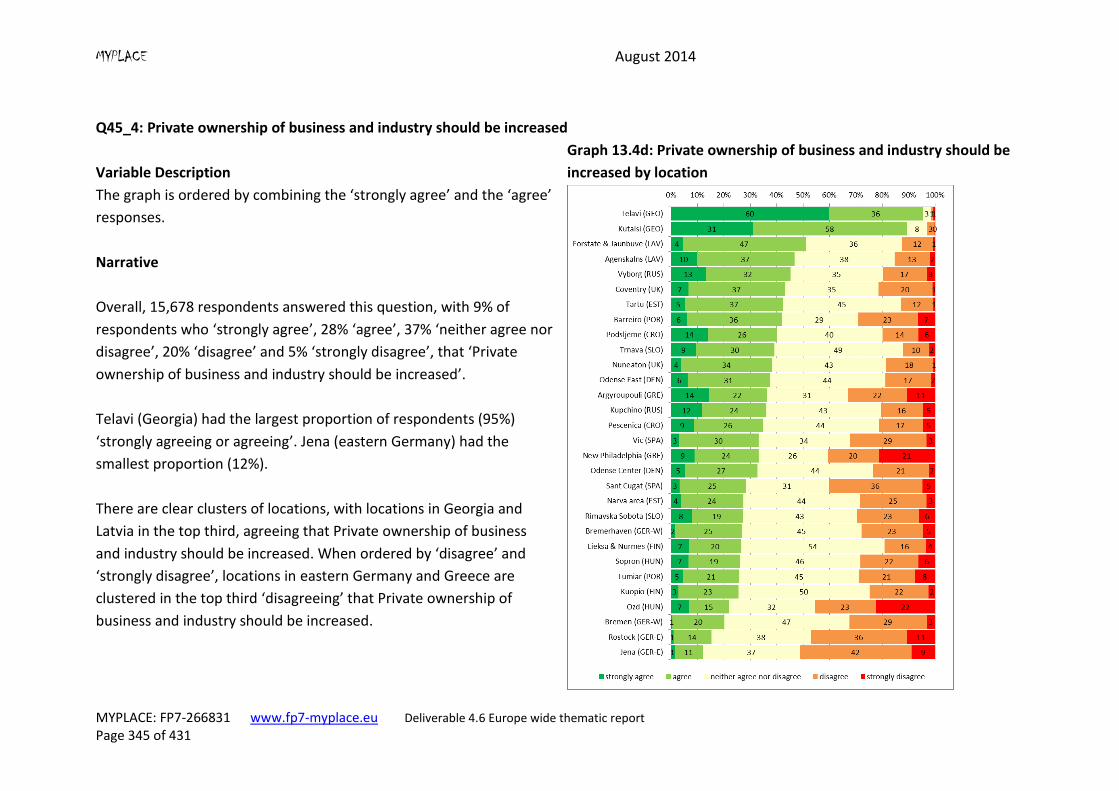
MYPLACE August 2014
MYPLACE: FP7-266831 www.fp7-myplace.eu Deliverable 4.6 Europe wide thematic report Page 345 of 431
Q45_4: Private ownership of business and industry should be increased
Variable Description
The graph is ordered by combining the ‘strongly agree’ and the ‘agree’
responses.
Graph 13.4d: Private ownership of business and industry should be
increased by location
Narrative
Overall, 15,678 respondents answered this question, with 9% of
respondents who ‘strongly agree’, 28% ‘agree’, 37% ‘neither agree nor
disagree’, 20% ‘disagree’ and 5% ‘strongly disagree’, that ‘Private
ownership of business and industry should be increased’.
Telavi (Georgia) had the largest proportion of respondents (95%)
‘strongly agreeing or agreeing’. Jena (eastern Germany) had the
smallest proportion (12%).
There are clear clusters of locations, with locations in Georgia and
Latvia in the top third, agreeing that Private ownership of business
and industry should be increased. When ordered by ‘disagree’ and
‘strongly disagree’, locations in eastern Germany and Greece are
clustered in the top third ‘disagreeing’ that Private ownership of
business and industry should be increased.
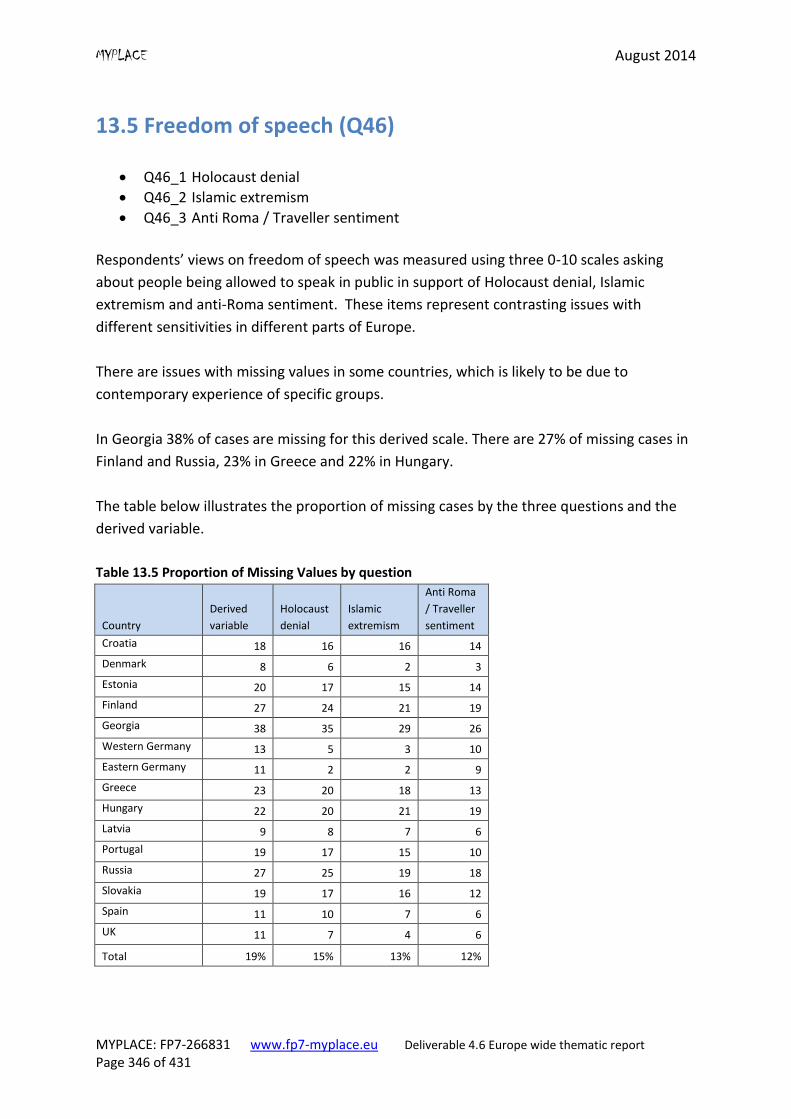
MYPLACE August 2014
MYPLACE: FP7-266831 www.fp7-myplace.eu Deliverable 4.6 Europe wide thematic report Page 346 of 431
13.5 Freedom of speech (Q46)
Q46_1 Holocaust denial
Q46_2 Islamic extremism
Q46_3 Anti Roma / Traveller sentiment
Respondents’ views on freedom of speech was measured using three 0-10 scales asking
about people being allowed to speak in public in support of Holocaust denial, Islamic
extremism and anti-Roma sentiment. These items represent contrasting issues with
different sensitivities in different parts of Europe.
There are issues with missing values in some countries, which is likely to be due to
contemporary experience of specific groups.
In Georgia 38% of cases are missing for this derived scale. There are 27% of missing cases in
Finland and Russia, 23% in Greece and 22% in Hungary.
The table below illustrates the proportion of missing cases by the three questions and the
derived variable.
Table 13.5 Proportion of Missing Values by question
Country
Derived
variable
Holocaust
denial
Islamic
extremism
Anti Roma
/ Traveller
sentiment
Croatia 18 16 16 14
Denmark 8 6 2 3
Estonia 20 17 15 14
Finland 27 24 21 19
Georgia 38 35 29 26
Western Germany 13 5 3 10
Eastern Germany 11 2 2 9
Greece 23 20 18 13
Hungary 22 20 21 19
Latvia 9 8 7 6
Portugal 19 17 15 10
Russia 27 25 19 18
Slovakia 19 17 16 12
Spain 11 10 7 6
UK 11 7 4 6
Total 19% 15% 13% 12%
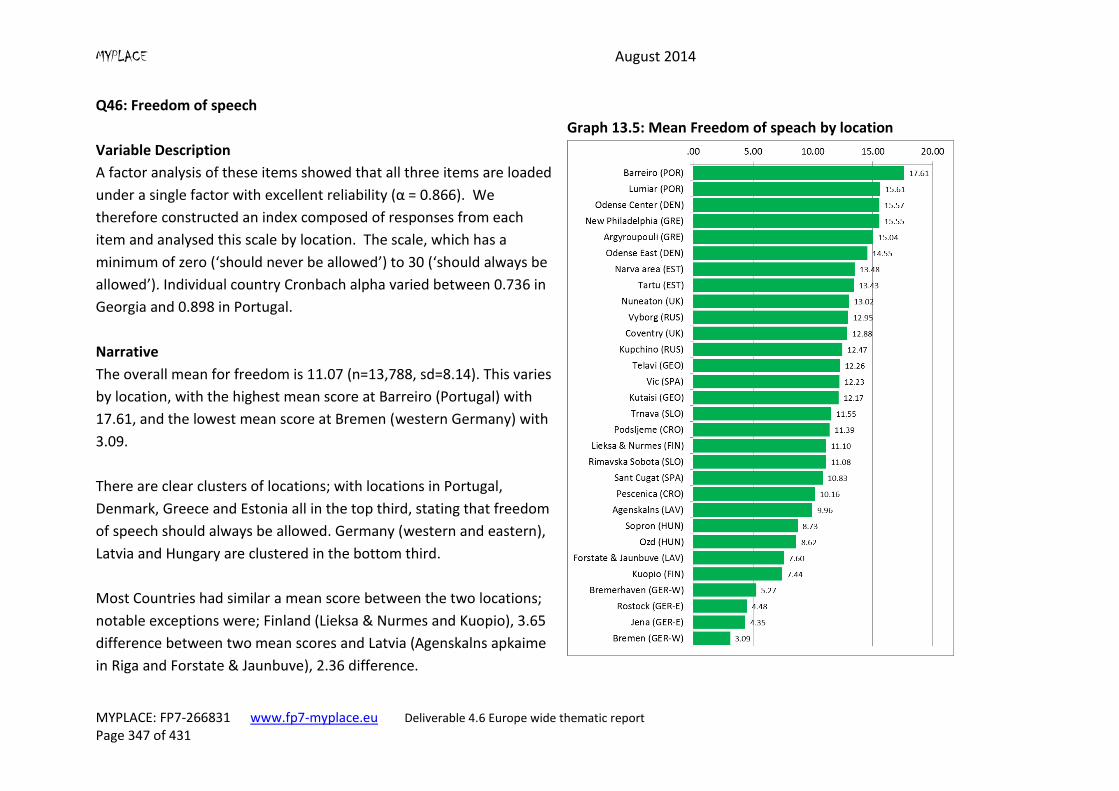
MYPLACE August 2014
MYPLACE: FP7-266831 www.fp7-myplace.eu Deliverable 4.6 Europe wide thematic report Page 347 of 431
Q46: Freedom of speech
Variable Description
A factor analysis of these items showed that all three items are loaded
under a single factor with excellent reliability (α = 0.866). We
therefore constructed an index composed of responses from each
item and analysed this scale by location. The scale, which has a
minimum of zero (‘should never be allowed’) to 30 (‘should always be
allowed’). Individual country Cronbach alpha varied between 0.736 in
Georgia and 0.898 in Portugal.
Graph 13.5: Mean Freedom of speach by location
Narrative
The overall mean for freedom is 11.07 (n=13,788, sd=8.14). This varies
by location, with the highest mean score at Barreiro (Portugal) with
17.61, and the lowest mean score at Bremen (western Germany) with
3.09.
There are clear clusters of locations; with locations in Portugal,
Denmark, Greece and Estonia all in the top third, stating that freedom
of speech should always be allowed. Germany (western and eastern),
Latvia and Hungary are clustered in the bottom third.
Most Countries had similar a mean score between the two locations;
notable exceptions were; Finland (Lieksa & Nurmes and Kuopio), 3.65
difference between two mean scores and Latvia (Agenskalns apkaime
in Riga and Forstate & Jaunbuve), 2.36 difference.

MYPLACE August 2014
MYPLACE: FP7-266831 www.fp7-myplace.eu Deliverable 4.6 Europe wide thematic report Page 348 of 431
13.6 Respect for human rights (Q47)
Respondents were asked for their views on how much respect is there for individual human
rights in their country; with the following options; ‘a great deal of respect’, ‘a fair degree of
respect’, ‘not much respect’ and ‘no respect at all’.
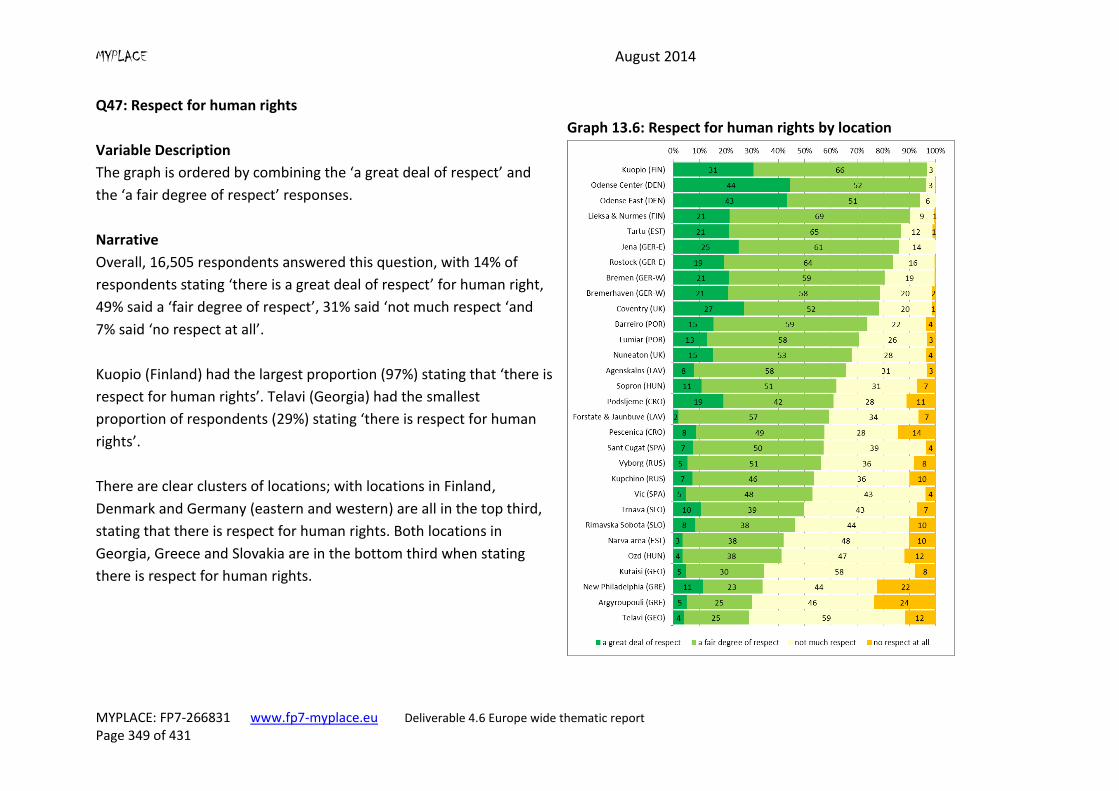
MYPLACE August 2014
MYPLACE: FP7-266831 www.fp7-myplace.eu Deliverable 4.6 Europe wide thematic report Page 349 of 431
Q47: Respect for human rights
Variable Description
The graph is ordered by combining the ‘a great deal of respect’ and
the ‘a fair degree of respect’ responses.
Graph 13.6: Respect for human rights by location
Narrative
Overall, 16,505 respondents answered this question, with 14% of
respondents stating ‘there is a great deal of respect’ for human right,
49% said a ‘fair degree of respect’, 31% said ‘not much respect ‘and
7% said ‘no respect at all’.
Kuopio (Finland) had the largest proportion (97%) stating that ‘there is
respect for human rights’. Telavi (Georgia) had the smallest
proportion of respondents (29%) stating ‘there is respect for human
rights’.
There are clear clusters of locations; with locations in Finland,
Denmark and Germany (eastern and western) are all in the top third,
stating that there is respect for human rights. Both locations in
Georgia, Greece and Slovakia are in the bottom third when stating
there is respect for human rights.
MYPLACE August 2014
MYPLACE: FP7-266831 www.fp7-myplace.eu Deliverable 4.6 Europe wide thematic report Page 350 of 431
13.7 Self-perceived discrimination (Q48)
Self-perceived discrimination or Sense of Insecurity in Society (Q48) contains the following
variables;
Q48_1: you support a particular political movement
Q48_2: you are a member of an ethnic or religious minority
Q48_3: of your sexual orientation
Q48_4: you belong to a subculture (punk / skinhead / EMO / Goth etc.)
Q48_5: of your gender
These five items were used for measuring self-perceived discrimination/Sense of Insecurity
in Society index. Young people responded to each item (representing a particular aspect of
discrimination) on a three-point scale: ‘never’, ‘occasionally’, and ‘regularly’. In constructing
an index, respondents who either reported ‘occasionally’ or ‘regularly’ for each item are
counted, which resulted in an index ranging from zero to five. Higher scores in the index
indicates greater levels of discrimination.
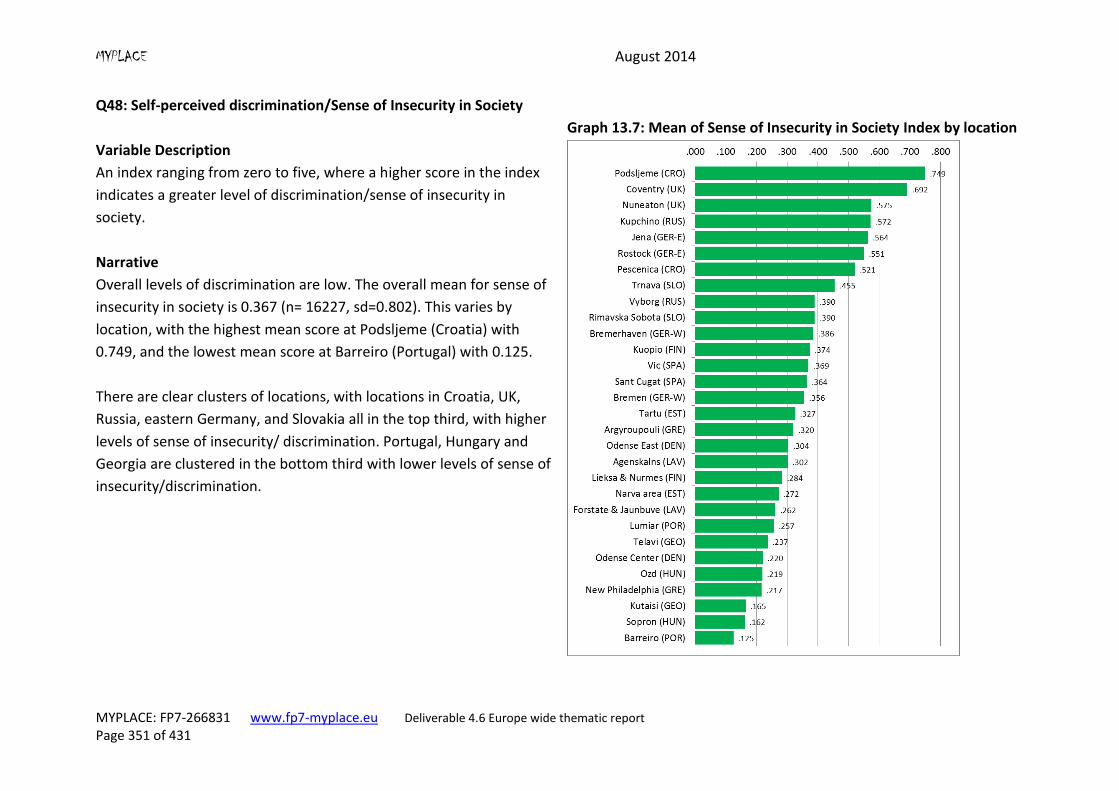
MYPLACE August 2014
MYPLACE: FP7-266831 www.fp7-myplace.eu Deliverable 4.6 Europe wide thematic report Page 351 of 431
Q48: Self-perceived discrimination/Sense of Insecurity in Society
Variable Description
An index ranging from zero to five, where a higher score in the index
indicates a greater level of discrimination/sense of insecurity in
society.
Graph 13.7: Mean of Sense of Insecurity in Society Index by location
Narrative
Overall levels of discrimination are low. The overall mean for sense of
insecurity in society is 0.367 (n= 16227, sd=0.802). This varies by
location, with the highest mean score at Podsljeme (Croatia) with
0.749, and the lowest mean score at Barreiro (Portugal) with 0.125.
There are clear clusters of locations, with locations in Croatia, UK,
Russia, eastern Germany, and Slovakia all in the top third, with higher
levels of sense of insecurity/ discrimination. Portugal, Hungary and
Georgia are clustered in the bottom third with lower levels of sense of
insecurity/discrimination.

MYPLACE August 2014
MYPLACE: FP7-266831 www.fp7-myplace.eu Deliverable 4.6 Europe wide thematic report Page 352 of 431
13.8 Opinion on death penalty (Q49)
Young People were asked is they ‘think that the death penalty can sometimes be justified or
do you believe that the death penalty can never be justified?’ with measured using an
eleven-point scale where high values indicate that the death penalty can never be justified.
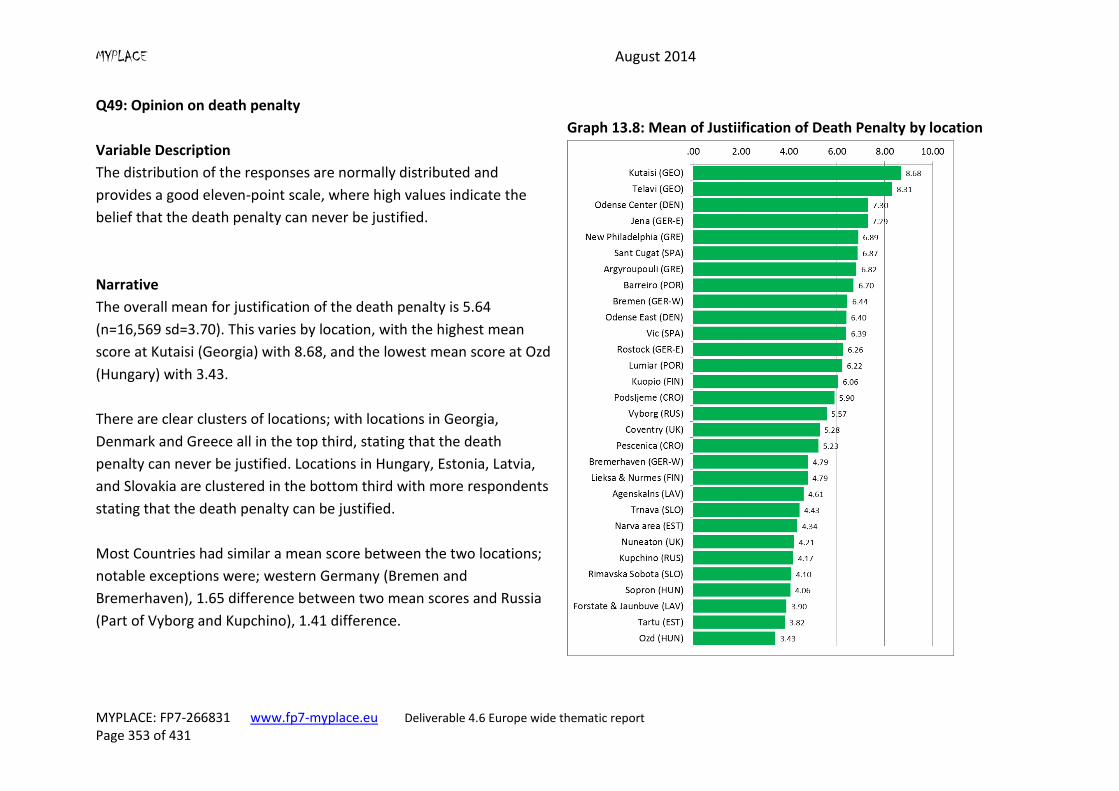
MYPLACE August 2014
MYPLACE: FP7-266831 www.fp7-myplace.eu Deliverable 4.6 Europe wide thematic report Page 353 of 431
Q49: Opinion on death penalty
Variable Description
The distribution of the responses are normally distributed and
provides a good eleven-point scale, where high values indicate the
belief that the death penalty can never be justified.
Graph 13.8: Mean of Justiification of Death Penalty by location
Narrative
The overall mean for justification of the death penalty is 5.64
(n=16,569 sd=3.70). This varies by location, with the highest mean
score at Kutaisi (Georgia) with 8.68, and the lowest mean score at Ozd
(Hungary) with 3.43.
There are clear clusters of locations; with locations in Georgia,
Denmark and Greece all in the top third, stating that the death
penalty can never be justified. Locations in Hungary, Estonia, Latvia,
and Slovakia are clustered in the bottom third with more respondents
stating that the death penalty can be justified.
Most Countries had similar a mean score between the two locations;
notable exceptions were; western Germany (Bremen and
Bremerhaven), 1.65 difference between two mean scores and Russia
(Part of Vyborg and Kupchino), 1.41 difference.
MYPLACE August 2014
MYPLACE: FP7-266831 www.fp7-myplace.eu Deliverable 4.6 Europe wide thematic report
Page 354 of 431
13.8 Multi-level Modelling
This section presents the results of multi-level modelling. Multi-level modelling (MLM) was
used to take into account the nested structure (respondents within locations within
countries) in our dataset.
Model: Satisfaction with democracy
Dependent variable
The dependent variable used is the ‘satisfaction with democracy’ scale from question 42. As
this variable is an almost normally distributed scale variable, a linear mixed model was used.
Independent variables
Our selection of independent variables, in the model, is guided by existing theories and/or
previous studies on ‘satisfaction’ with democracy. The literature review identified two
dominant theories on people's satisfaction with the way democracy works: (a) Cultural and
historical theories, and (b) system performance theories. Cultural and historical theories
argue that the differences in ‘satisfaction’ with democracy can be explained by the relative
presence or absence of a civic (or democratic political) culture (Almond and Verba, 1965;
Inglehart, 1988; Weil, 1989). They consider that a democratic political culture is the result of
distinct national heritages, traditions and historical legacies, at the level of countries, and
distinct socialisation experiences at the level of individual citizens (Inglehart, 1990). Guided
by these theories, we include two independent variables (one contextual and one individual
level) in our model on satisfaction with democracy: the Welfare State type (Kaariainen and
Lehtonen 2006) [contextual variable at level 2] : five categories (i) Post-socialist, (ii) Nordic,
(iii) Conservative, (iv) Mediterranean and (v) Liberal, and Interpersonal trust. In order to
measure whether a democratic political culture exists at the level of individual citizens and
how firmly it has been entrenched, we have used interpersonal trust as an individual level
indicator of the civic culture syndrome (Anderson, 2001).
On the other hand, system performance theorists argue that people's satisfaction with
democracy depend on what kind of outputs it produces (Easton, 1975). They have identified
apparent performance-related weaknesses, as important influences on citizen
dissatisfaction with democracies (Brittan, 1975; Huntington, 1974; Barnes and Kaase 1979;
Jennings and van Deth, 1989). Influenced by theory, Anderson (2001) focused on political
and economic performance in explaining satisfaction with democracy. In our analysis, we
also include these two variables. To measure political performance of a country [level 1
variable], young people's views, regarding the country's level of respect for individual
human rights, were gathered on a four-point scale ranging from 0 (‘no respect’) to 3 (‘a
MYPLACE August 2014
MYPLACE: FP7-266831 www.fp7-myplace.eu Deliverable 4.6 Europe wide thematic report
Page 355 of 431
great deal of respect’ for individual human rights). To measure economic performance
related weakness of a country (level 2 variable), percentage of young people unemployed
in the country is used in this study.
Apart from these variables, literature on satisfaction with democracy identifies a number of
other variables as correlates. For example, Klingemann (1999) finds that satisfaction with
democracy goes along with higher levels of support for democracy. Therefore, young
people's views on 'having a democratic, multi-party system' as a form of government
(political system)’ is included in the analysis. This question had five response options: ‘very
bad’ (0), ‘fairly bad’ (1), ‘neither good nor bad’ (2), ‘fairly good’ (3), and ‘very good’ (4). A
higher score indicates greater support for democracy.
Previous studies also found trust in political institutions as a significant correlate of citizens'
satisfaction with democracy (Zmerli et al.,2007). For measuring trust in political institutions,
we asked young people’s level of trust in parliament in an eleven-point scale ranging from
zero (‘do not trust at all’) to 10 (‘complete trust’). Trust in political actors (Norris 1999) is
also linked with people's satisfaction with democracy (Schafer, 2013; Nevitte and Kanji,
2002). In order to measure young people's level of trust for politicians, we used the
statement 'Politicians are corrupt'. Respondents expressed their views on this statement in
a five-point scale ranging from 0 (‘strongly agree’) to 4 (‘strongly disagree’). A higher score
indicates greater level of trust for politicians.
In relation to interest in politics, literature has demonstrated that it is related to political
efficacy and political support (Almond and Verba 1965; Lambert et al., 1986; Weatherford,
1991). Interest in politics is also found to be associated with satisfaction with democracy
(Schafer, 2013; Anderson and Guillory, 1997). Young people's level of interest in politics is
measured in a four-point scale ranging from 0 (‘not at all interested’) to 3 (‘very interested’).
In addition, citizens who are knowledgeable about the political process are likely to have a
more optimistic view of democratic governance. Political knowledge is measured in the
study by counting the correct responses (correct/incorrect) to each political knowledge
question (‘who is…head of government, foreign minister, ruling party’). Putnam (1993,
1995, 2000) argues that weak social capital is linked with lower satisfaction with democracy.
Participation is now widely recognised as a measure of social capital (Nevitte and Kanji,
2002). For measuring participation, we have developed a Political activism Index by
counting those activities (from a list of 20, including volunteering in an election campaign,
signing a petition, wearing a badge with a political message, etc.) which the young people
were involved in at least once during the last 12 months.
Democratic theory argues that democracy enhances the quality of life for citizens in
fundamental ways, because the very freedoms that make democratic contestation and
participation possible, also enable citizens to pursue various private goals directly and
MYPLACE August 2014
MYPLACE: FP7-266831 www.fp7-myplace.eu Deliverable 4.6 Europe wide thematic report
Page 356 of 431
indirectly (Dahl, 1989; Pateman, 1970). Furthermore, responsive democracy is likely to
implement social policies that enhance the well-being, or at least the security of large
numbers of people. As Esping-Anderson (1990) notes, a democratic state is by necessity
preoccupied with the production and distribution of social well-being. Frey and Stutzer
(2000) examine the link between happiness and direct democracy in Switzerland from 1992-
1994. They find that direct democracy has a statistically significant, positive effect on
happiness. Moreover, as the level of direct democracy increases, in the 26 Swiss cantons,
levels of happiness correspondingly increase. In our model, we include satisfaction with life
as a correlate of ‘satisfaction’ with democracy. In relation to minority groups who live in
multi-ethnic countries, Ruiz-Rufino (2013) identified that the regime from which individuals
originate, will condition their attitudes about democracy even if the regime alters. This may
also be applied if they migrate to a new country. Therefore we include identity measured as
0 (‘minority in country’) and 1 (‘majority in country’) in the model.
Socio-economic resource theory (Schafer, 2013) maintains that satisfaction with democracy
is positively linked with socio-economic resources. Influenced by this theory, we include
subjective assessment of household income, unemployment status, and parental class as
three correlates of satisfaction with democracy. Among other socio-demographic
characteristics, Schafer (2013) found gender and age as two significant correlates of
satisfaction with democracy. Sanders et al. (2014) identified that specific types of religion
were significant in their model, with Catholic and Protestants more satisfied with democracy
than their non-religious counterparts were. Therefore we include religion measured as 0
(‘not religious’) and 1 (‘religious’) in the model.
Results
The initial analysis of variance components in the ‘empty’ model in Table 13.8a reveals that
77.5% of the variance in young people’s ‘satisfaction’ with democracy can be explained by
differences between individuals. Furthermore, an intra-class correlation of 0.225 suggests
that 22.5 percent of the overall variance in the ‘satisfaction’ with democracy lies at the level
of localities. The substantial variation at local level justifies the reason for using multilevel
analysis in our data.
The inclusion of the described individual variables (in Model 1 in Table 13.8.1) resulted in a
28.3% decrease of residual, individual level variance. Chi-square test of deviances
(loglikelihood = 4336.484; df = 13) confirms that this is a significant difference. Adding
individual level variables, led to a 43.3% reduction in the intercept variance, indicating that
the amount of variance of ‘satisfaction’ with democracy between localities can be attributed
to individual level predictors.
In the next model (Model 2 in Table 13.8.a), we included contextual variables which led to a
73.5% reduction of intercept variance, compared to the model containing only individual
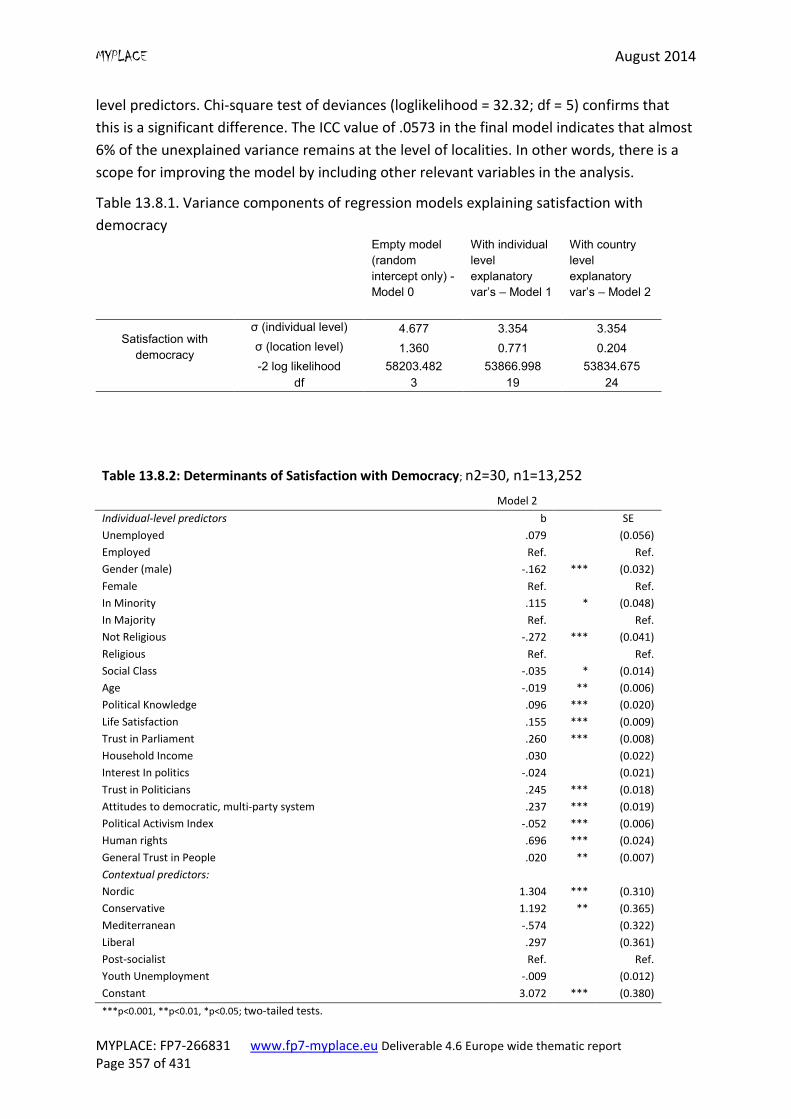
MYPLACE August 2014
MYPLACE: FP7-266831 www.fp7-myplace.eu Deliverable 4.6 Europe wide thematic report
Page 357 of 431
level predictors. Chi-square test of deviances (loglikelihood = 32.32; df = 5) confirms that
this is a significant difference. The ICC value of .0573 in the final model indicates that almost
6% of the unexplained variance remains at the level of localities. In other words, there is a
scope for improving the model by including other relevant variables in the analysis.
Table 13.8.1. Variance components of regression models explaining satisfaction with
democracy Empty model
(random
intercept only) -
Model 0
With individual
level
explanatory
var’s – Model 1
With country
level
explanatory
var’s – Model 2
Satisfaction with
democracy
σ (individual level) 4.677 3.354 3.354
σ (location level) 1.360 0.771 0.204
-2 log likelihood 58203.482 53866.998 53834.675
df 3 19 24
Table 13.8.2: Determinants of Satisfaction with Democracy; n2=30, n1=13,252
Model 2
Individual-level predictors b
SE
Unemployed .079 (0.056)
Employed Ref. Ref.
Gender (male) -.162 *** (0.032)
Female Ref. Ref.
In Minority .115 * (0.048)
In Majority Ref. Ref.
Not Religious -.272 *** (0.041)
Religious Ref. Ref.
Social Class -.035 * (0.014)
Age -.019 ** (0.006)
Political Knowledge .096 *** (0.020)
Life Satisfaction .155 *** (0.009)
Trust in Parliament .260 *** (0.008)
Household Income .030 (0.022)
Interest In politics -.024 (0.021)
Trust in Politicians .245 *** (0.018)
Attitudes to democratic, multi-party system .237 *** (0.019)
Political Activism Index -.052 *** (0.006)
Human rights .696 *** (0.024)
General Trust in People .020 ** (0.007)
Contextual predictors:
Nordic 1.304 *** (0.310)
Conservative 1.192 ** (0.365)
Mediterranean -.574 (0.322)
Liberal .297 (0.361)
Post-socialist Ref. Ref.
Youth Unemployment -.009 (0.012)
Constant 3.072 *** (0.380)
***p<0.001, **p<0.01, *p<0.05; two-tailed tests.
MYPLACE August 2014
MYPLACE: FP7-266831 www.fp7-myplace.eu Deliverable 4.6 Europe wide thematic report
Page 358 of 431
Table 13.8.2 presents results on the relationships of all individual and contextual level
variables with young people’s ‘satisfaction’ with democracy. Among 16 individual level
variables, included in the model, unemployment status, household income situation, and
interest in politics, were not significantly associated with young people’s ‘satisfaction’ with
democracy. However, controlling the effects of both individual and contextual variables in
the model, young males, those with greater involvement with political activities, older
young people, those having parents from upper social class, and those ‘not religious’,
appeared to have statistically lower ‘satisfaction’ with democracy. In addition, young people
reporting greater political knowledge, satisfaction with life, trust in parliament, trust in
politicians, general trust in people, and positive evaluation of country’s human rights
situation have statistically significant higher level of ‘satisfaction’ with democracy.
Compared to their majority counterparts, young people from minority backgrounds are also
reported to have greater ‘satisfaction’ with democracy in the country.
Controlling the effects of those individual level variables, and welfare state type in the
model (Table 13.8.2); youth unemployment of the country did not appear to have a
statistically significant relation with young people’s ‘satisfaction’ with democracy. However,
welfare state type did have a significant association with ‘satisfaction’ with democracy.
Compared to those from post-socialist countries, young people from Nordic and
Conservative type countries appeared to have significantly greater ‘satisfaction’ with
democracy.
13.9 Summary
In this chapter, we reported the findings of cross-country analyses of the MYPLACE survey,
in which young people’s understandings of democracy are analysed.
A descriptive analysis of Satisfaction with democracy shows that the overall mean across all
30 locations is exactly in the middle of the scale (5.0), but satisfaction varies from country to
country and between locations. There were clear clusters of locations; with locations in
Denmark, Finland, eastern and western Germany all having higher levels of satisfaction with
democracy. Mediterranean countries including Greece, Spain and Portugal have lower levels
of satisfaction with democracy.
An ordinal by ordinal Gamma correlation of Attitudes towards various forms of political
systems (Q43) suggested that two separate scales were formed, one which focused on
Democratic Political System and another which focused on Autocratic principles. Results
showed that young people in locations in Denmark and eastern Germany had more positive
views towards democratic political systems. Respondents in locations in Russia, Latvia and
MYPLACE August 2014
MYPLACE: FP7-266831 www.fp7-myplace.eu Deliverable 4.6 Europe wide thematic report
Page 359 of 431
Slovakia were less positive towards democratic political systems. Both locations in Georgia,
Croatia, the UK and Portugal have more positive opinions towards a non-democratic form of
political system (with autocratic principles ). Both locations in Germany (western and
eastern), Finland and Spain were more negative towards autocratic principles.
A factor analysis showed that all eight items for question 44: Justification for violence are
loaded under a single factor with excellent reliability (α = 0.928). The overall mean for
justification for violence was generally low (9.7 out of a possible 32). Both locations in
Russia, Croatia, and the UK were in the top third, stating that violence is ‘more justified’,
with locations in Latvia, Denmark, Finland and Estonia stating that violence is ‘less justified’.
Items in question 45: Attitude towards social justice and the economy were analysed
individually, because when combined the reliability of these factors was low, with Cronbach
alpha values less than 0.4. This suggests that there are contradictions between respondents’
ideological views in terms of socialist principles (items 2 and 3), and free-market principles
(items 1 and 4). Both locations in Georgia, Greece and eastern Germany stated that they
disagreed that the unemployed should have to take any job available or lose their
unemployment benefits. Both locations in Portugal, Denmark and Hungary are in the top
third and stated that they should. Most young people in the two Georgian locations stated
that Private ownership of business and industry should be increased. Both locations in
eastern Germany and Greece are clustered in the top third disagreeing that Private
ownership of business and industry should be increased. There are clusters of locations,
with locations in Greece, Spain, Hungary, Russia and Slovakia all in the top third, agreeing
that Competition is harmful, it brings out the worst in people. When ordered by ‘disagree’
and ‘strongly disagree’, locations in Denmark and Germany (western and eastern) are
clustered in the top third disagreeing that competition is harmful. There are clear clusters of
locations, with young people’s views on Incomes should be made more equal, with
locations in Greece, and Germany (eastern and western) all in the top third, agreeing that
incomes should be made more equal. When ordered by ‘disagree’ and ‘strongly disagree’,
locations in Denmark, Georgia and Estonia are clustered in the top third disagreeing that
Incomes should be made more equal.
A factor analysis of these items showed that all three items are loaded under a single factor
with excellent reliability (α = 0.866) for Freedom of speech. Both locations in Portugal,
Denmark, Greece and Estonia all in the top third, stating that freedom of speech should
always be allowed. Germany (western and eastern), Latvia and Hungary are clustered in the
bottom third.
There is a large variation of views regarding respect for human rights. Both locations in
Finland, Denmark and Germany (eastern and western) are all ranked in the top third, stating
that there is respect for human rights. Both locations in Georgia, Greece and Slovakia are in
MYPLACE August 2014
MYPLACE: FP7-266831 www.fp7-myplace.eu Deliverable 4.6 Europe wide thematic report
Page 360 of 431
the bottom third when stating there is no respect for human rights. Both locations in Greece
had the highest proportion of young people stating there is ‘no respect at all’ (22% and
24%).
An index ranging from zero to five, where a higher score in the index indicates greater level
of discrimination/sense of insecurity in society, were constructed for the five items in the
question on Self-perceived discrimination (Q48). Overall levels of discrimination are low;
with a mean for sense of insecurity in society of 0.4. When ranked, locations in Croatia, the
UK, Russia, eastern Germany, and Slovakia are all in the top third, with higher levels of sense
of insecurity/ discrimination. Portugal, Hungary and Georgia are clustered in the bottom
third with lower levels of sense of insecurity/discrimination.
Opinions on the death penalty (Q49) vary from country to country, with locations in
Georgia, Denmark and Greece all in the top third, stating that the death penalty can ‘never
be justified’. However, Locations in Hungary, Estonia, Latvia, and Slovakia are clustered in
the bottom third with more respondents stating that the death penalty ‘can be justified’.
In order to explore multivariate determinants of Satisfaction with democracy, taking into
account the nested structure in our data set, locations within countries, we employed
multilevel modelling (MLM). The initial analysis of variance components in the ‘empty’
model revealed that 78% of the variance in young people’s ‘satisfaction’ with democracy
can be explained by differences between individuals and that 23% of the overall variance, in
the ‘satisfaction’ with democracy, lies at the level of localities. The substantial variation at
local level justifies the reason for using multilevel analysis in our data. The model confirmed
that young people reporting greater political knowledge, satisfaction with life, trust in
parliament, trust in politicians, general trust in people, and positive evaluation of the
country’s human rights situation have a statistically significant higher level of ‘satisfaction’
with democracy. Young males, those with greater involvement with political activities, older
young people, those having parents from upper social class, and those ‘not religious’
appeared to have a statistically lower level of satisfaction with democracy. At a contextual
level, the youth unemployment rate of a country did not appear to have a statistically
significant relationship to young people’s ‘satisfaction’ with democracy, but welfare state
type did have a significant association with ‘satisfaction’ with democracy. Compared to
those from post-socialist countries, young people from Nordic and Conservative type
countries appeared to have significantly greater ‘satisfaction’ with democracy.
MYPLACE August 2014
MYPLACE: FP7-266831 www.fp7-myplace.eu Deliverable 4.6 Europe wide thematic report
Page 361 of 431
References
Almond, G. A., and Verba, S. (1965). The Civic Culture. Boston: Little, Brown.
Anderson, C. J. (2001). Political Satisfaction in Old and New Democracies. Binghamton: NY:
Binghamton University. Centre on Democratic Performance. Working Paper No. 102.
Anderson, C. J., and Guillory, C. A. (1997). Political Institutions and Satisfaction with
Democracy: A Cross-National Analysis of Consensus and Majoritarian Systems. The American
Political Science Review. 91 (1): pp. 66-81.
Barnes, S., and Kaase, M. eds. (1979). Political Action: Mass Participation in Five Western
Democracies. Beverly Hills, CA: Sage.
Birdwell, J., Feve, S., Tryhorn, C. and Vibla, N. (2013) Backsliders: Measuring Democracy in
the EU. Demos
Brittan, S. (1975). The Economic Contradictions of Democracy. British Journal of Political
Science. 5 (April):129-59.
Bogdanor, V. (2007) Legitimacy, Accountability and Democracy in the European Union. A
Federal Trust report
Christensen, T. and Laegreid, P. (2003) Trust in Government – the Significance of Attitudes
Towards Democracy, the Public Sector and Public Sector Reforms.
Cingranelli, D. L. and Richards, D. L. (2010) The Cingranelli and Richards (CIRI) Human Rights
Data Project. Human Rights Quarterly 32: pp. 395-418
Coppedge, M. (2005) Defining and Measuring Democracy. Political Concepts Committee on
Concepts and Methods Working Paper Series 2 pp. 1-57
Coppedge, M. and Gerring, J. with Altman, D., Bernhard, M., Fish, S., Hicken, A., Kroenig,
M., Lindberg, S. I., McMann, K., Paxton, P., Semetko, H. A., Skaaning, S-E., Staton, J. and
Teorell, J. (2011) Conceptualizing and Measuring Democracy: A New Approach Perspective
on Politics (9)2: pp. 247-267
Dahl, R. A. (1971) Polyarchy: Participation and Opposition. New Haven: Vale University
Press.
Dahl, R. A. (1989). Democracy and its Critics. New Haven/London: Yale University Press.
Dermody, J., Hanmer-Lloyd, S. and Scullion, R. (2010) Young people and voting behaviour:
alienated youth and (or) an interested and critical citizenry? European Journal of Marketing
44 (3/4): pp. 421-435
Easton, D. (1957) An Approach to the Analysis of Political Systems. World Politics 9(3): pp.
383-400
MYPLACE August 2014
MYPLACE: FP7-266831 www.fp7-myplace.eu Deliverable 4.6 Europe wide thematic report
Page 362 of 431
Easton, D. (1975). A Re-Assessment of the Concept of Political Support. British Journal of
Political Science. 5 (October) pp. 435-37.
Economist Intelligence Unit (2013) Democracy index 2012: Democracy at a standstill
http://www.eiu.com/public/topical_report.aspx?campaignid=DemocracyIndex12
Esping-Anderson, G. (1990). The Three Worlds of Welfare Capitalism. Princeton: Princeton
University Press.
European Commission (2013) Standard Euroabarometer 80: Public Opinion in the European
Union
Freedom House (2014) Freedom in the World 2014
Frey, B. and Stutzer, A. (2000). “What are the Sources of Happiness?” A working paper
available on-line at http://www.economics.uni-linz.ac.a.
Goodwin-Gill, G. S. (2006) Free and Fair Elections. Geneva: Inter-Parliamentary Union
Huntington, S. (1974). Postindustrial Politics: How Benign Will It Be? Comparative Politics, 6
(January) pp. 163-91.
Inglehart, R. (1988). The Renaissance of Political Culture. American Political Science Review.
82 (December) pp. 1203-1232.
Inglehart, R. (1990). Culture Shift in Advanced Industrial Society. Princeton, NJ: Princeton
University Press.
Jennings, M. Kent, and van Deth, J. eds. (1989). Continuities in Political Action. New York: de
Gruyter.
Kääriäinen, J., Lehtonen, H. (2006). The variety of social capital in welfare state regimes – a
comparative study of 21 countries, European Societies 8 (1) pp. 27–57.
Klingemann, Hans-Dieter. (1999). Mapping Political Support in the 1990s: A Global Analysis.
In: Pippa Norris (ed.) Critical Citizens. Global Support for Democratic Government (pp. 31-
56). Oxford: Oxford University Press.
Kohler-Koch, B. (2010) Civil society and EU democracy: ‘astroturf’ representation? Journal
of European Public Policy 17(1): pp. 100-116
Lambert, R. D., Curtis, J. E., Brown, S.D., Kay, B. J. (1986). Effects of Identification with
Governing Parties on Feelings of Political Efficacy and Trust. Canadian Journals Political
Science. 19 (December) pp. 705-28.
Lijphart, A. (1999) Patterns of Democracy. New Haven/London: Yale University Press
Munck, G.L. and Verkuilen, J. (2002) Conceptualizing and Measuring Democracy: Evaluating
Alternative Indices. Comparative Political Studies 35(1): pp. 5-34
MYPLACE August 2014
MYPLACE: FP7-266831 www.fp7-myplace.eu Deliverable 4.6 Europe wide thematic report
Page 363 of 431
Nacarino, R. C., De Corte S. and Freudenstein R. (2012) Democracy and Legitimacy in an
Economic Union: Policy Brief. Centre for European Studies
Nevitte, N., and Kanji, M. (2002).Authority Orientations and Political Support: A Cross-
national Analysis of Satisfaction with Governments and Democracy. Comparative Sociology
1 (2002): 387-412. Reprinted in Ronald Inglehart (ed) Human Values and Social Change:
Findings from the World Values Surveys. Leiden-Boston: Brill. 2003.
Norris, P. (1999). Critical Citizens: Global Support for Democratic Governance. Oxford:
Oxford University Press.
Norris, P. (2011) Democratic Deficit: Critical Citizens Revisited. Cambridge University Press:
New York
Pateman, C. (1970). Participation and Democracy Theory. Cambridge: Cambridge University
Press.
Pew Research Center (2013) The New Sick Man of Europe: the European
Unionhttp://www.pewglobal.org/2013/05/13/the-new-sick-man-of-europe-the-european-
union/
Putnam, R. (2000). Bowling Alone: The Collapse and Revival of American Community. New
York: Simon and Schuster.
Putnam, R. (1995). Bowling Alone: America's Declining Social Capital. Journal of Democracy.
6 ( 1): pp. 65-78.
Putnam, R. (1993). Making Democracy Work: Civic Traditions in Modern Italy. Princeton:
Princeton University Press.
Roth, F. Nowak-Lehmann, F. D. and Otter T. (2013), “Crisis and Trust in National and
European Union Institutions – Panel Evidence for the EU, 1999 to 2012”, RSCAS Working
Paper Series 2013/31, European University Institute, Florence, May
http://cadmus.eui.eu/bitstream/handle/1814/26975/RSCAS_2013_31.pdf?sequence=1 RSF
(2014) World Press Freedom Index http://en.rsf.org/
Ruiz-Rufino, R. (2013) Satisfaction with Democracy in Multi-ethnic Countries: The Effect of
Representative Political Institutions on Ethnic Minorities. Political Studies. 61, pp. 101-118.
Sanders, D., Clarke, H., Stewart, M. and Whiteley, P. (2014) Output Oriented Legitimacy:
Individual and System-level Influences on Democracy Satisfaction in Thomassen J. (ed)
Elections and Representative Democracy: Representation and Accountability. (pp. XX-XX)
Oxford: Oxford University Press
Schafer, A. (2013). Affluence, Inequality and Stratification with Democracy. In S. I. Keil and
O. W. Gabriel (Eds.), Society and Democracy in Europe (pp 139-161). London: Routledge.
Schmitter P. C., and Karl T. L. (1991) “What Democracy Is . . . and Is Not,” Journal of
Democracy 2: pp. 76-80
MYPLACE August 2014
MYPLACE: FP7-266831 www.fp7-myplace.eu Deliverable 4.6 Europe wide thematic report
Page 364 of 431
Vatter, A. and Bernauer, J. (2009) The missing dimension of democracy. European Union
Politics 10(3): pp. 335-359
Van der Eijk, C. and Franklin, M. N. (2009) Election and Voters. Palgrave Macmillan: New
York
Weatherford, M. S. (1991).Mapping the Ties that Bind: Legitimacy, Representation and
Alienation. Western Political Quarterly. 44 (June) pp. 251-76.
Weil, F. (1989). The Sources and Structure of Legitimation in Western Democracies: A
Consolidated Madel Tested with Time-Series Data in Six Countries Since World War II.
American Sociological Review. 54 (October) pp. 682-706.
Zmerli, S., Newton, K., Montero, J. R. ( 2007). Trust in People, Confidence in Political
Institutions, and Satisfaction with Democracy. In Jan W. van Deth/José Ramón
Montero/Anders Westholm (eds.). Citizenship and Involvement in European Democracies. A
Comparative Analysis (pp. 35-65). London/New York: Routledge.
MYPLACE August 2014
MYPLACE: FP7-266831 www.fp7-myplace.eu Deliverable 4.6 Europe wide thematic report
Page 365 of 431
Chapter 14: History and Memory
Here we present the cross-country analysis of four questions (Q50, Q51, Q52, Q53) of the
History and Memory block of the MYPLACE survey questionnaire by using merged data sets.
We examine the findings of the 30 data collection locations.
In the first section, we review the literature on collective memory. Then we analyse the
country-level and location-based data of the scales (Q51: Significance of historical events,
Q53: Importance commemorating the past), the Q52: Level of activity in historical
dimensions index and the Q50: Interest in recent history variable that were constructed
based on the four questions. In the last section, we analyse the way and degree of how
respondents’ location, socio-demographic and political characteristics determine their
relation to the three dimensions of history.
It is important to note that of the four questions, the first two (Q51 and Q53) refer to
country history and commemorating the country, while the other two (Q50 and Q52)
involved respondents’ interest in history and history-related activities. Responses to Q51
and Q53 are, obviously determined by respondents’ subjective relation to history and
historical commemoration as well.
According to our hypothesis, all the three variable sets shape respondents’ relation to
memory and history. The impact of location is, determined by the various historical
traditions of European regions; we expect to see a higher impact of education levels and
parental status among socio-demographic variables, while we suppose a determinant effect
of cognitive-type variables (political knowledge, relation to politics) among political
characteristics.
Literature The pioneering French social theorist Maurice Halbwachs (1980; 1992) has argued that
history and memory were contradictory ways of dealing with the past. He valued history
over memory, because he saw history to be a universal scholarship, unlike memory which he
considered to be limited to the lifetime and perspective of a particular community. He saw
history as a reasoned reconstruction of the past rooted in research; a scientific discipline that
tends to be critical and skeptical of human motive and action, and therefore more secular
than what people commonly call memory. In his view history, being more relative, and
contingent on place, chronology, and the scale can be read by or belong to everyone.
His view was both shared and opposed by the theorist Pierre Nora (1984; 1989), who also
saw the two as contradictory, but valued the importance of memory over history. In contrast
MYPLACE August 2014
MYPLACE: FP7-266831 www.fp7-myplace.eu Deliverable 4.6 Europe wide thematic report
Page 366 of 431
to Halbwachs, he argued that while memory is truthful, history is a flawed reconstruction of
the past.
In more recent times, by using the term “collective memory” theorists have challenged the
split between history and memory, seeing them as being complementary (Olick and
Robbins, 1998; Erll, 2005; Till, 2006). The term “collective memory”, however, has been
used as a loosely defined notion when examining issues such as the Holocaust rather than
as a construct that deserves focused attention in its own right (Nora, 1989; Brubaker and
Feischmidt, 2002).
Over the past few decades, collective memory has become a topic of renewed interest in
the humanities and social sciences and is now a key part of emerging interdisciplinary
activity in “memory studies” (Roediger and Wertsch, 2008; Klein, 2000). However, it has
almost as many definitions as investigators writing about it. Perhaps the only generally
agreed-upon feature is that collective memory is a form of memory that transcends
individuals and is shared by a group.
One of the reasons for the problems in defining collective memory is that it is not a topic
that fits neatly within the confines of a single academic discipline. The concept (or
concepts) has been examined by sociologists (e.g., Zerubavel, 2003), anthropologists (e.g.,
Cole, 2001), psychologists (e.g., Middleton and Brown, 2005; Pennebaker et al., 1997),
historians (e.g., Bodnar, 1992), literary analysts (e.g., Young, 1993), and others, but there
has been little contact, let alone coordination, among these efforts. More recently, Yadin
Dudai has argued that “the term ‘collective memory’ actually refers to three entities: a
body of knowledge, an attribute, and a process” (2002: 51). The body of knowledge is a
feature of the culture of the individuals who share some similarity, and individuals may
participate in various different groups (with different collective memories) defined by
generation, countries of origin, locale (e.g., Hungarians), and so on. The attribute is “the
distinctive holistic image of the past in the group” (e.g., World War II veterans in the US
who are referred to as “the greatest generation” by some). The process is the continual
evolution of understanding between the individual and the group, as individuals may
influence and change the collective memory of the group, and the group can change the
individual’s understanding and consciousness of being a member of the group. In Dudai’s
view these three entities capture some (but not all) of the various senses of collective
memory used by scholars in different academic disciplines.
Given the fragmented state of the discussion about collective memory, however, up to the
present day no single, generally accepted definition of the term has emerged. Indeed, the
very term is often used almost interchangeably with others such as “public memory”,
“social memory”, “communicative memory” and “cultural memory” (Assmann, 1992). In
attempting to provide a more precise definition of the term Wertsch and Roediger (2008)
MYPLACE August 2014
MYPLACE: FP7-266831 www.fp7-myplace.eu Deliverable 4.6 Europe wide thematic report
Page 367 of 431
has argued for the need of differentiating between collective memory versus collective
remembering. They contrast collective memory as a static base of knowledge with
collective remembering, which involves the repeated reconstruction of representations of
the past, a process that is often quite contentious. Earlier, Bodnar (1992) saw collective
memory to be more like a space of contestation than a body of knowledge - a space in
which local groups engage in an ongoing struggle against elites and state authorities to
control the understanding of the past. As Reese and Fivus (2008) pointed out, the sites of
the contestation over collective remembering include family discussions museums,
monuments and memorials, history textbooks, and national holidays.
In the Nineteenth Century, Renan (1990; 1882) viewed serious historical research as often
posing a threat to popular efforts at collective remembering. The contradiction between
history and collective memory is central to the argument Nora (1989) makes that ‘‘real
memory’’ has been largely pushed aside, if not eradicated, by the practices of creating
critical historical accounts. He argued that representations of the past based on traditional
practices such as rituals. A similar opposition between history and collective memory can
be found in the account Assmann (1997:23) provided, when he argued that “the past is not
simply ‘received’ by the present. The present is ‘haunted’ by the past and the past is
modelled, invented, reinvented, and reconstructed by the present.’’ (Assmann, 1997:9).
Historians routinely warn against practices of inventing, reinventing, and reconstructing the
past in the service of the present, but this is precisely what is encouraged - indeed
celebrated - in the case of collective remembering. As Novick (1999:3-4) pointed out, the
processes involved are usually tied to schematisation and simplification that stand in
contrast to the aspirations of analytic history.
Some scholars have also drawn a stark opposition between individual and collective
remembering, going so far as to assert that only one or the other exists. Bartlett
(1932;1995), for example, raised the issue of whether collective remembering exists, at
least in the “strong” sense that a group, qua group, “can be usefully characterised as having
some sort of memory in its own right” (Wertsch, 2002:22). In contrast to this, scholars such
as Schudson (1995:347) have questioned whether memory can be anything but collective.
While sharing this view other scholars (Yates, 1966; Bruner, 1990) also argue that
collectives use cultural tools which are items such as written symbols, information storage
in computers, and “mnemotechnics” (Yates, 1966), and what makes collective
remembering collective is that members of a group share the same “cultural tool kit”.
Arguing that memory is “distributed” and relies extensively on semiotic means provided by
cultural, historical, and institutional contexts Hutchins (1995) emphasised that human
agents and the cultural tools they employ must be viewed as integral components of a
memory system.
MYPLACE August 2014
MYPLACE: FP7-266831 www.fp7-myplace.eu Deliverable 4.6 Europe wide thematic report
Page 368 of 431
Contrary to the scholarly study of national identity construction in Europe, which has
always highlighted the essential role played by consensual icons of collective memory for
nation-building on the continent, research on the collective memory of Europeans has
traditionally focused on the conflictual, painful side of memory. The following works are
good examples for this kind of approach:
Ricoeur (2000) La mémoire, l'histoire, l'oubli. Paris: Seuil;
Alexander, et al. (2004): Cultural Trauma and Collective Identity. Berkeley: University of California Press;
Giesen (2004) Triumph and Trauma. Boulder: Paradigm;
Leggewie and Lang (2011). Der Kampf um die europäische Erinnerung (The battle for the European remembrance). Munich: C. H. Beck Verlag;
Pakier and Str th (2013) A European Memory? : Contested Histories and Politics of Remembrance . Berghahn Books
For these authors, collective memory on the European level can hardly be a source of a
positive narrative, as perceptions and interpretations differ widely between the nations
that make up the European patchwork.
Memory in Eastern Europe very often equals trauma because of its experience of 20th
century totalitarianism, genocide, displacement and border changes, while research on
memory requires particular skills and sensitivity. Thus, Eastern Europe is a fertile ground for
memory studies for a number of reasons. This is the only region world-wide to have been
consecutively ruled by Nazism and Communism. Imperial legacies of territorial
dismemberment, belated state-building, and massive forced migration were compounded
by the unique material devastation and disastrous psychological consequences of World
War II. The destruction of social elites, urban spaces, and ethnic groups caused divided
memories of victimhood but also desires for vengeance and retribution. The diversity of
national self-images, cultural policies, and international relations across Eastern Europe can
be largely explained by different beliefs about historic events involving large-scale human
suffering. The public memory of these Twentieth-Century traumas mediates the variety of
ways in which nations develop in the post-socialist space.
Unlike Western Europe, where the initial post-World War II repression of memory has been
transformed into political recognition of victims and has contributed to the politics of
regret, much of Eastern Europe is in the grip of a ‘presence of the past’. After the
breakdown of communism, post-socialist societies such as Russia have launched new
attempts at ‘organised forgetting’ by constructing patriotic master narratives and silencing
the complexity of the past. The memories of Twentieth-Century tragedies travel onto
political agendas by mass media, literature, film, the visual arts, and new Internet media.
More recently several researchers made an attempt to explore this historically unique
phenomenon:
MYPLACE August 2014
MYPLACE: FP7-266831 www.fp7-myplace.eu Deliverable 4.6 Europe wide thematic report
Page 369 of 431
Mink and Neumayer (eds.) (2013) History, Memory and Politics in Central and Eastern Europe : Memory Games . Palgrave Macmillan;
Blacker et al. (2013) Memory and Theory in Eastern Europe. Palgrave Macmillan;
Rutten et al. (2013) Memory, Conflict and Social Media : Web Wars in Post-Socialist States . Routledge;
Kattago (2013) Memory and Representation in Contemporary Europe : The Persistence of the Past , Ashgate Publishing, Ltd.
Maggia et al. (2010) Contemporary Photography from Eastern Europe : History, Memory, Identity. Skira
14.1 Interest in recent history (Q50)
The distribution of responses for Q50 (Would you say that you are interested in the recent
history (last 100 years) of [COUNTRY]?) is the following regarding the entire sample (N=
16.935): not at all: 14.3 %, a little: 55.8 %, very interested: 29.0 %, missing:1.8%
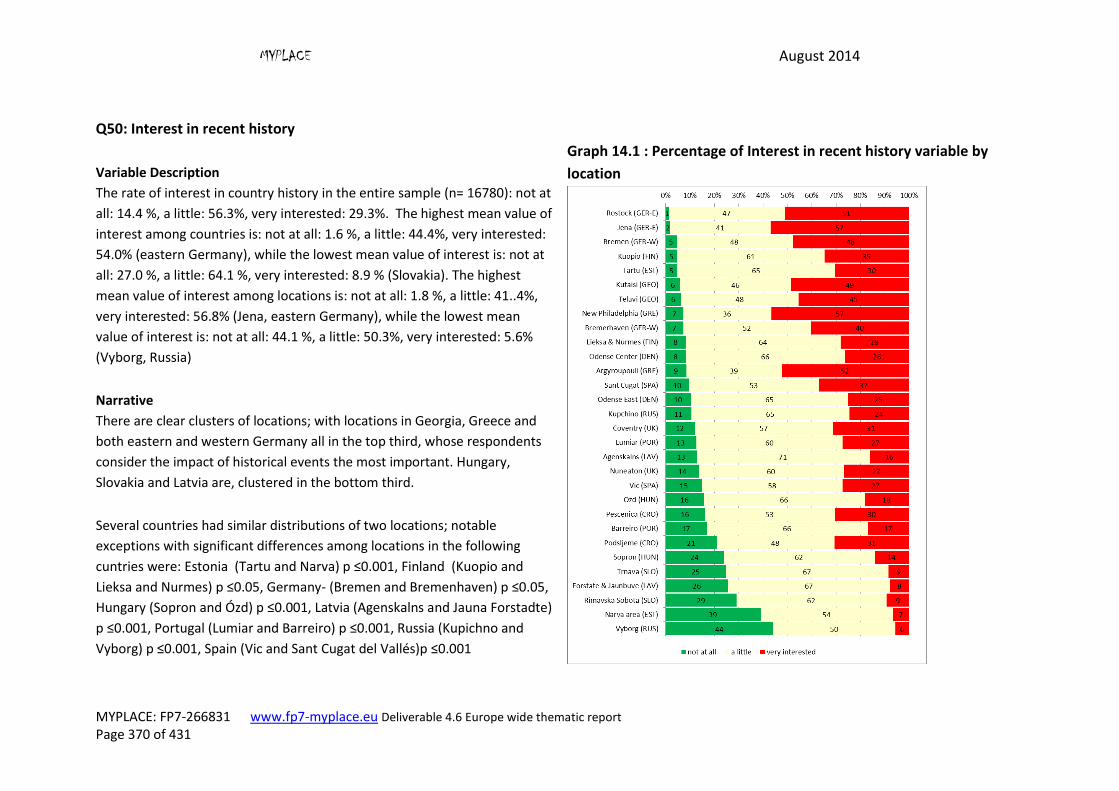
MYPLACE August 2014
MYPLACE: FP7-266831 www.fp7-myplace.eu Deliverable 4.6 Europe wide thematic report
Page 370 of 431
Q50: Interest in recent history
Variable Description
The rate of interest in country history in the entire sample (n= 16780): not at
all: 14.4 %, a little: 56.3%, very interested: 29.3%. The highest mean value of
interest among countries is: not at all: 1.6 %, a little: 44.4%, very interested:
54.0% (eastern Germany), while the lowest mean value of interest is: not at
all: 27.0 %, a little: 64.1 %, very interested: 8.9 % (Slovakia). The highest
mean value of interest among locations is: not at all: 1.8 %, a little: 41..4%,
very interested: 56.8% (Jena, eastern Germany), while the lowest mean
value of interest is: not at all: 44.1 %, a little: 50.3%, very interested: 5.6%
(Vyborg, Russia)
Graph 14.1 : Percentage of Interest in recent history variable by
location
Narrative
There are clear clusters of locations; with locations in Georgia, Greece and
both eastern and western Germany all in the top third, whose respondents
consider the impact of historical events the most important. Hungary,
Slovakia and Latvia are, clustered in the bottom third.
Several countries had similar distributions of two locations; notable
exceptions with significant differences among locations in the following
cuntries were: Estonia (Tartu and Narva) p ≤0.001, Finland (Kuopio and
Lieksa and Nurmes) p ≤0.05, Germany- (Bremen and Bremenhaven) p ≤0.05,
Hungary (Sopron and Ózd) p ≤0.001, Latvia (Agenskalns and Jauna Forstadte)
p ≤0.001, Portugal (Lumiar and Barreiro) p ≤0.001, Russia (Kupichno and
Vyborg) p ≤0.001, Spain (Vic and Sant Cugat del Vallés)p ≤0.001
MYPLACE August 2014
MYPLACE: FP7-266831 www.fp7-myplace.eu Deliverable 4.6 Europe wide thematic report
Page 371 of 431
14.2 Significance of historical events (Q51)
Respondents’ views on the significance of historical events for the country were gathered by
asking the following nine events. Respondents rated each on a five point scale ranging from
‘not important at all’ to ‘very important. (the mean values for items: Q51_1. World War I
(1914 - 1918) mean: 2.94; Q51_2. World War II (1939 - 1945) mean: 3.21; Q51_3. Cold War
(1945 - 1989) mean: 2.58; Q51_4. Fall of the Berlin Wall and the end of socialist regimes
(1989-1991) mean: 2.68; Q51_5. The Holocaust, mean: 2.44; Q51_6. Fascism, mean: 2.72;
Q51_7. Communism, mean: 2.76; Q51_8 The NY terrorist attacks on September 9th 2001.,
mean: 2.07; Q51_9. Membership in the European Union) mean: 3.18.)
Based on the order of mean values, respondents consider World War II and membership in
the European Union the most important from their countries’ perspectives among the listed
events and periods, and NY terrorist attacks September 9th 2011 and the Holocaust the least
important.
The results of the factor analysis (Extraction Method: Maximum Likelihood, Rotation
Method: Direct Oblimin) were two factors. If more than one factor is derived and the
correlation among those factors is less than .32, we have used varimax rotation for the
analysis. We excluded two variables (Q5.8, Q5.9) from the next factor analysis as
communality was less than 0.2.
Seven items load under one factor explaining 44.5 % of the total variance. These seven
items constitute a good scale ranging from zero to 28. Higher score in the scale indicates
greater significance of historical events. (Mean: 19.48, std. dev. = 5.045, n=14214).
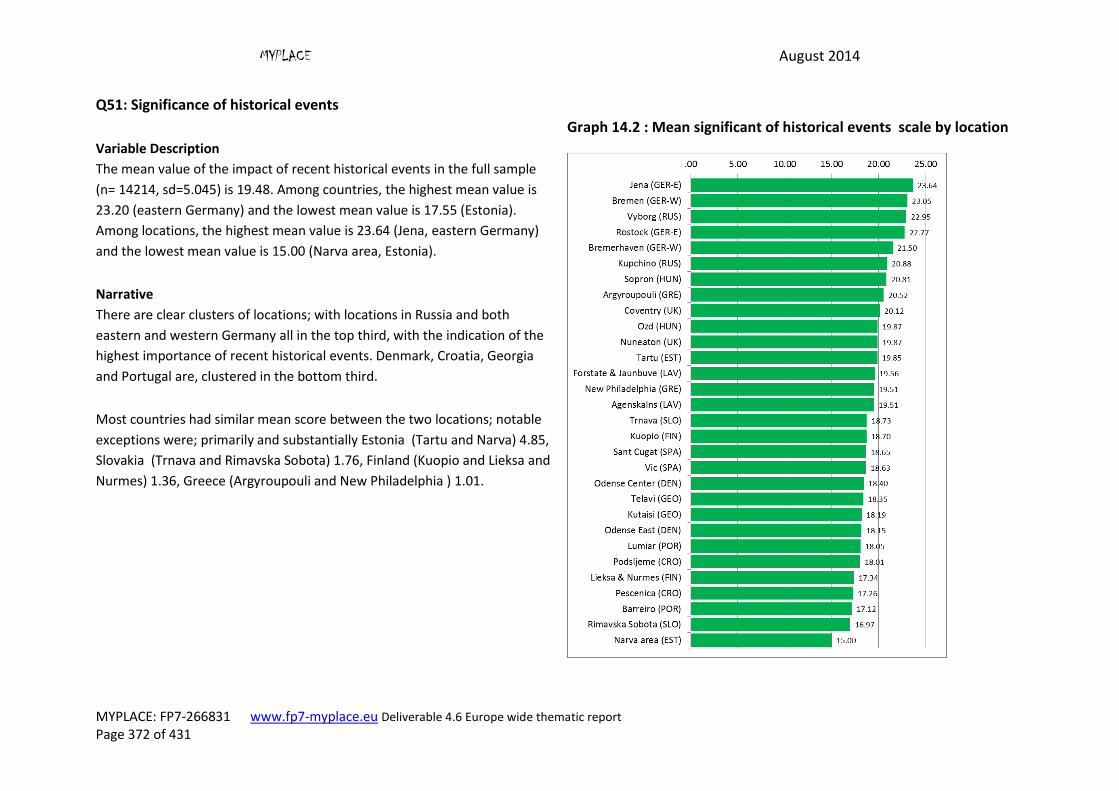
MYPLACE August 2014
MYPLACE: FP7-266831 www.fp7-myplace.eu Deliverable 4.6 Europe wide thematic report
Page 372 of 431
Q51: Significance of historical events
Variable Description
The mean value of the impact of recent historical events in the full sample
(n= 14214, sd=5.045) is 19.48. Among countries, the highest mean value is
23.20 (eastern Germany) and the lowest mean value is 17.55 (Estonia).
Among locations, the highest mean value is 23.64 (Jena, eastern Germany)
and the lowest mean value is 15.00 (Narva area, Estonia).
Graph 14.2 : Mean significant of historical events scale by location
Narrative
There are clear clusters of locations; with locations in Russia and both
eastern and western Germany all in the top third, with the indication of the
highest importance of recent historical events. Denmark, Croatia, Georgia
and Portugal are, clustered in the bottom third.
Most countries had similar mean score between the two locations; notable
exceptions were; primarily and substantially Estonia (Tartu and Narva) 4.85,
Slovakia (Trnava and Rimavska Sobota) 1.76, Finland (Kuopio and Lieksa and
Nurmes) 1.36, Greece (Argyroupouli and New Philadelphia ) 1.01.
MYPLACE August 2014
MYPLACE: FP7-266831 www.fp7-myplace.eu Deliverable 4.6 Europe wide thematic report
Page 373 of 431
14.3 Interest in history index (Q52)
In order to measure how interested the respondents were in history, they were asked how
frequently they did the following 12 things in the last 12 months.
The distribution of responses for the 12 items of Q52 is the following regarding the total
sample:
The distribution of responses per item (%), n: never, o: occasionally, r: regularly. Q52_1:
Played a video game that re-enacts events in the 20th century (n:67.1 o:24.9 r:8.1 ), Q52_2:
Watched a film that was set in recent historical circumstances(n: 22.8, o:58.2, r: 19.0 ),
Q52_3: Watched a documentary about events in the 20th century (n:28.7, o:55.9, r:15.3 ),
Q52_4: Read a novel set in recent historical circumstances (n: 60.8, o:32.3, r:6.9), Q52_5:
Read a non-fiction publication about the recent past (n: 62.3, o: 30.9, r: 6.8), Q52_6: Visited
a museum with an exhibition about the recent past (n: 56.4, o: 39.1, r:4.5), Q52_7:
Participated in a discussion about history at school or in college (n:54.0, o:34.0, r:12.0 ),
Q52_8: Talked with your parents about the past (n: 27.0, o: 57.4, r:15.6), Q52_9: Talked with
your grandparents about the past (n: 41.7, o: 44.1 r:14.2 ), Q52_10: Attended a veterans’
parade or showed support during a remembrance day (n: 75.9, o:18.5, r:5.6), Q52_11:
Researched family history (n: 54.2, o:38.0, r: 7.9), Q52_12: Visited a webpage with historic
content / discussions( n:54.6, o: 36.4, r:9.0 )
Based on the responses on the 12 listed activities, youths performed the following activities
the most frequently over the last 12 months: 1. Watched a film that was set in recent
historical circumstances, 2. Talked with their parents about the past, 3. Watched a
documentary about events in the 20th century. The least frequently performed activities
involved the following: 1. Attended a veterans’ parade or showed support during a
remembrance day, 2. Read a novel set in recent historical circumstances, 3. Played a video
game that re-enacts events in the 20th century, 4. Read a non-fiction publication about the
recent past.
The fact that more than one-fifth (22.8%) of the respondents has not even watched films
that were set in recent historical circumstances, which is the most frequent activity among
them, implies the low intensity of past-related actions among youths. Another characteristic
of the order set by respondents is that for youths, films are the most likely and books are
the least likely resources for learning past events, although we have to emphasise the
relatively frequent communication with parents.
We constructed an index based on the 12 variables related to these questions.
MYPLACE August 2014
MYPLACE: FP7-266831 www.fp7-myplace.eu Deliverable 4.6 Europe wide thematic report
Page 374 of 431
Originally, responses were recorded under one of the three categories: never, occasionally,
regularly. In constructing the index, respondents who reported ‘occasionally’ or ‘regularly’
for each aspect was counted. The index ranges from 0-12 in which highest score indicates
greater interest in history (Mean=5.87, Std.Dev: 3.172,n=15236).
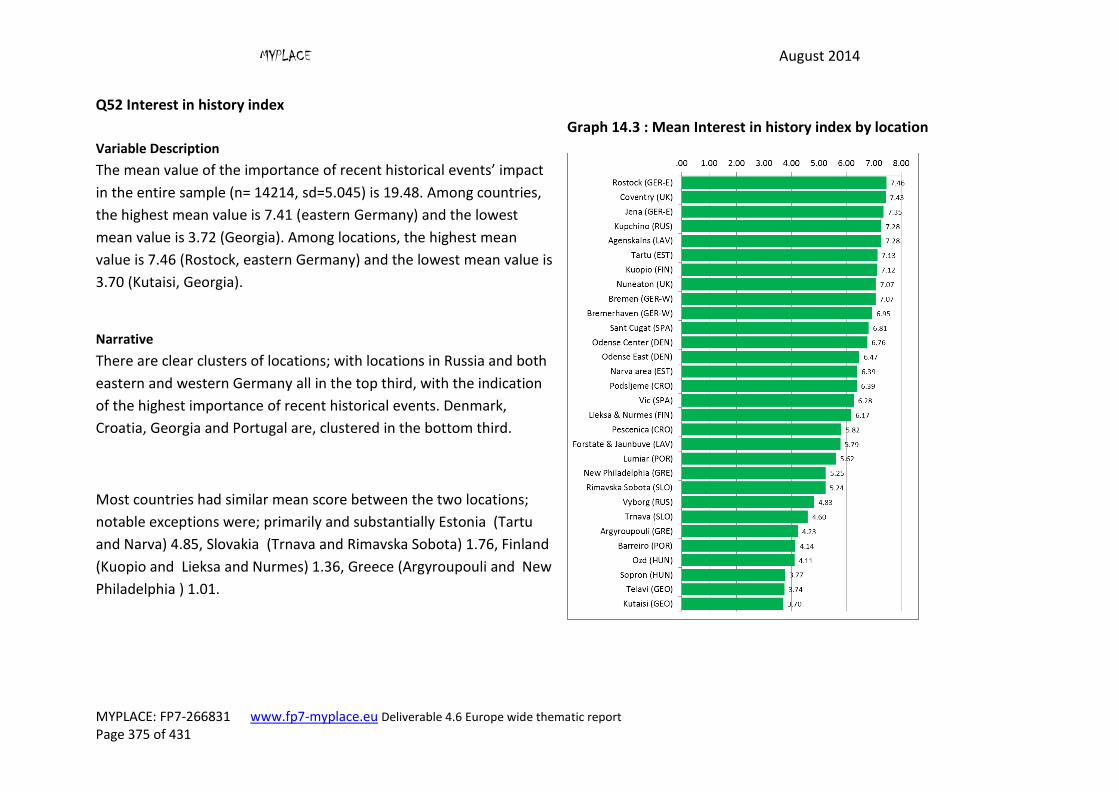
MYPLACE August 2014
MYPLACE: FP7-266831 www.fp7-myplace.eu Deliverable 4.6 Europe wide thematic report
Page 375 of 431
Q52 Interest in history index
Variable Description
The mean value of the importance of recent historical events’ impact
in the entire sample (n= 14214, sd=5.045) is 19.48. Among countries,
the highest mean value is 7.41 (eastern Germany) and the lowest
mean value is 3.72 (Georgia). Among locations, the highest mean
value is 7.46 (Rostock, eastern Germany) and the lowest mean value is
3.70 (Kutaisi, Georgia).
Graph 14.3 : Mean Interest in history index by location
Narrative
There are clear clusters of locations; with locations in Russia and both
eastern and western Germany all in the top third, with the indication
of the highest importance of recent historical events. Denmark,
Croatia, Georgia and Portugal are, clustered in the bottom third.
Most countries had similar mean score between the two locations;
notable exceptions were; primarily and substantially Estonia (Tartu
and Narva) 4.85, Slovakia (Trnava and Rimavska Sobota) 1.76, Finland
(Kuopio and Lieksa and Nurmes) 1.36, Greece (Argyroupouli and New
Philadelphia ) 1.01.
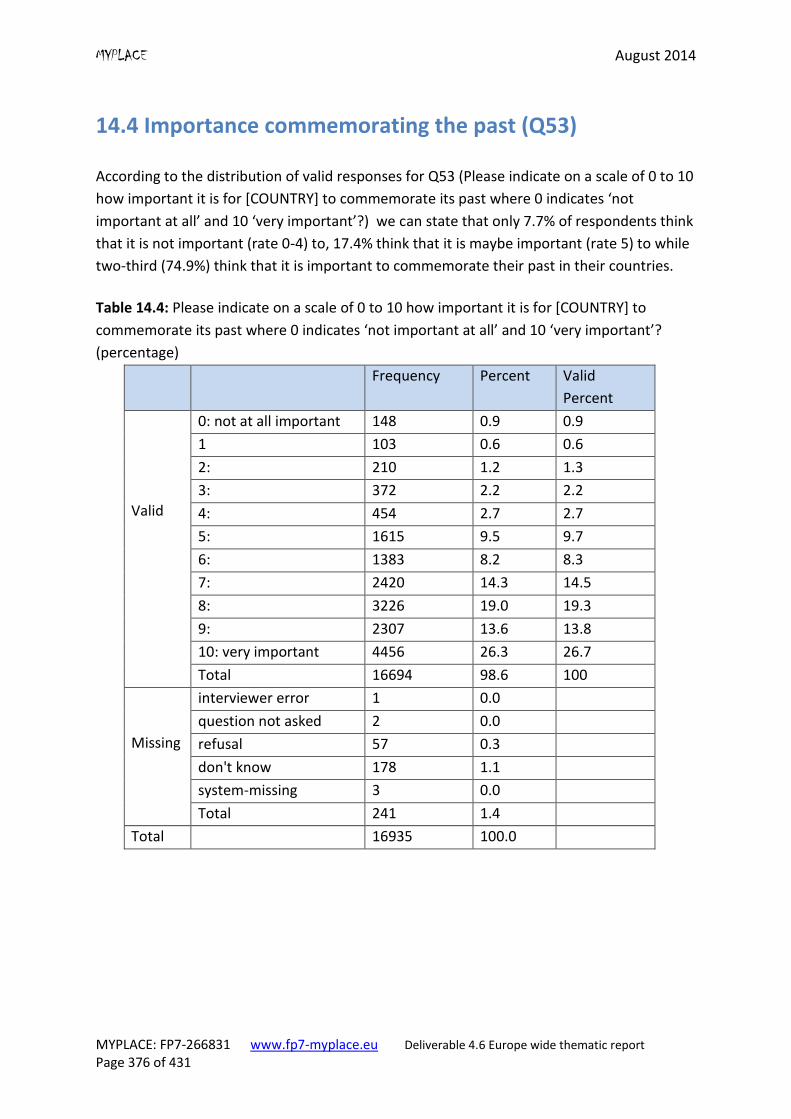
MYPLACE August 2014
MYPLACE: FP7-266831 www.fp7-myplace.eu Deliverable 4.6 Europe wide thematic report Page 376 of 431
14.4 Importance commemorating the past (Q53)
According to the distribution of valid responses for Q53 (Please indicate on a scale of 0 to 10
how important it is for [COUNTRY] to commemorate its past where 0 indicates ‘not
important at all’ and 10 ‘very important’?) we can state that only 7.7% of respondents think
that it is not important (rate 0-4) to, 17.4% think that it is maybe important (rate 5) to while
two-third (74.9%) think that it is important to commemorate their past in their countries.
Table 14.4: Please indicate on a scale of 0 to 10 how important it is for [COUNTRY] to
commemorate its past where 0 indicates ‘not important at all’ and 10 ‘very important’?
(percentage)
Frequency Percent Valid
Percent
Valid
0: not at all important 148 0.9 0.9
1 103 0.6 0.6
2: 210 1.2 1.3
3: 372 2.2 2.2
4: 454 2.7 2.7
5: 1615 9.5 9.7
6: 1383 8.2 8.3
7: 2420 14.3 14.5
8: 3226 19.0 19.3
9: 2307 13.6 13.8
10: very important 4456 26.3 26.7
Total 16694 98.6 100
Missing
interviewer error 1 0.0
question not asked 2 0.0
refusal 57 0.3
don't know 178 1.1
system-missing 3 0.0
Total 241 1.4
Total 16935 100.0
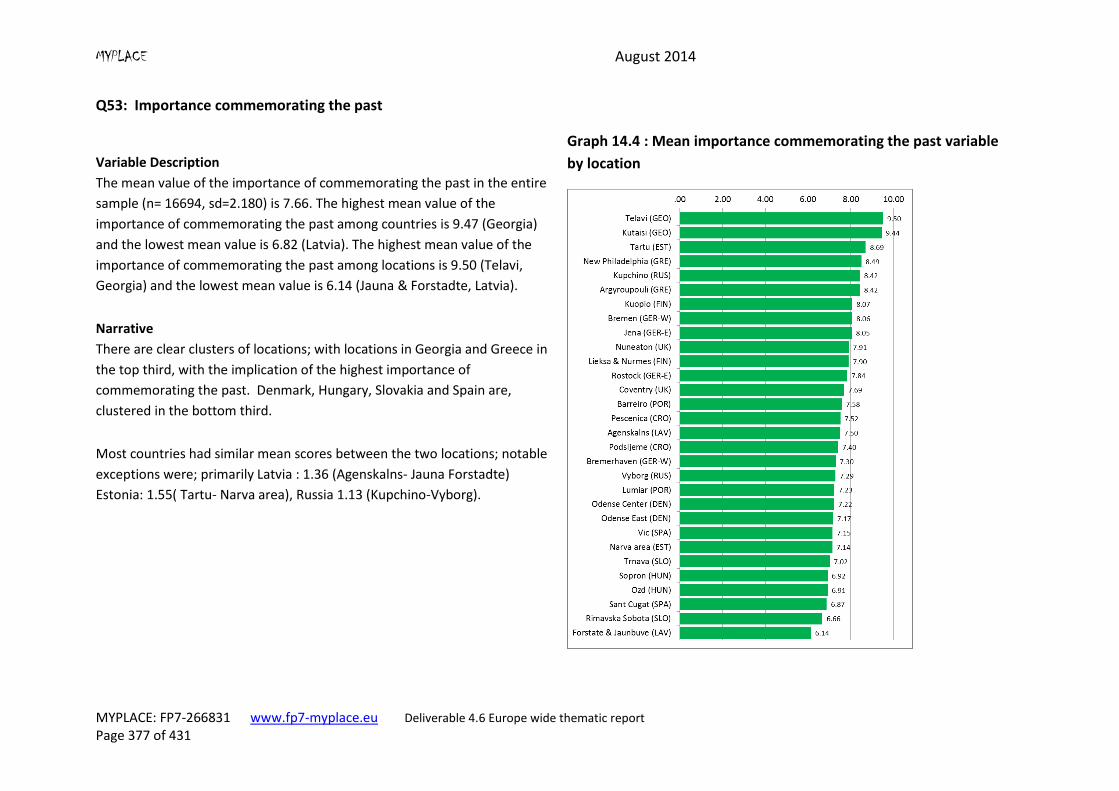
MYPLACE August 2014
MYPLACE: FP7-266831 www.fp7-myplace.eu Deliverable 4.6 Europe wide thematic report Page 377 of 431
Q53: Importance commemorating the past
Variable Description
The mean value of the importance of commemorating the past in the entire
sample (n= 16694, sd=2.180) is 7.66. The highest mean value of the
importance of commemorating the past among countries is 9.47 (Georgia)
and the lowest mean value is 6.82 (Latvia). The highest mean value of the
importance of commemorating the past among locations is 9.50 (Telavi,
Georgia) and the lowest mean value is 6.14 (Jauna & Forstadte, Latvia).
Graph 14.4 : Mean importance commemorating the past variable
by location
Narrative
There are clear clusters of locations; with locations in Georgia and Greece in
the top third, with the implication of the highest importance of
commemorating the past. Denmark, Hungary, Slovakia and Spain are,
clustered in the bottom third.
Most countries had similar mean scores between the two locations; notable
exceptions were; primarily Latvia : 1.36 (Agenskalns- Jauna Forstadte)
Estonia: 1.55( Tartu- Narva area), Russia 1.13 (Kupchino-Vyborg).
MYPLACE August 2014
MYPLACE: FP7-266831 www.fp7-myplace.eu Deliverable 4.6 Europe wide thematic report Page 378 of 431
14.5 Multivariate analysis
The relationship of the ordinal-level Q50 variable (Interest in recent history variable) and the
other three interval-level variables (Q53: Importance commemorating the past variable,
Q51: Significance of historical events scale, Q52: Level of activity in historical dimensions
index) in the History and Memory topic is inevitable, the more respondents are interested in
recent history, the more important they consider it to commemorate historical events, the
more frequently they perform history-related activities and the higher impact they imply for
these on country history. Relationships are significant statistically (Independent-Samples
Kruskal-Wallis Test): (1. Q50 - Q51 scale (Test stat.: 807.037, df: 2, Sig. (2-sided test): 0.000),
2. Q50 - Q52 index (Test stat.: 1781.841, df: 2, Sig. (2-sided test): 0.000), 3. Q50 - Q53
variable (Test stat.: 1752.738, df: 2, Sig. (2-sided test): 0.000).
Table 14.5.1 The relation of variable Q50 with the Q51, Q53 scales and the Q52 index
(means)
Interest in recent history (Q50) Q51 Q52 Q53
not at all 17.04 3.68 6.24
a little 19.19 5.79 7.59
very interested 21.05 7.19 8.50
The further examination of the three variables (Q51 scale, Q52 index, Q53 variable) –
besides the strong relation among them – is justified by the fact that with the application of
the same method, the outcomes of the multi-variable analyses are comparative.
In the following section, we study the relation of respondents’ relation to, history and
historical memory, the degree to which respondents’ perception of historical past and
history-related activities are, determined by their locations, socio-demographic and political
characteristics.
The dependent variables of the multiple linear regression-ordinary least squares, enter
method are the following: Model 1: Q51: Significance of historical events scale, Model2:
Q52: Level of activity in historical dimensions index, Model3: Q53: Importance
commemorating the past variable. The independent variables for all the three models are
constituted by the same variable set: 1. Locations, 2. Socio- demographic characteristics, 3.
Political characteristics. The description of the independent variables is the following:
1. Location variables. We created 29 dummy variables based on the 30 categories of the
Locations variable. The variable with the smallest mean and standard deviation – as
compared to the standard deviation of the dependent variable – serves as the reference
category.
MYPLACE August 2014
MYPLACE: FP7-266831 www.fp7-myplace.eu Deliverable 4.6 Europe wide thematic report Page 379 of 431
2. Socio-demographic variables: Age (number of years), Gender (1: male, 0: female),
Parental social class (scores on social class from Q73, Q77,Q76 and Q80), Identity (1:
majority, 0: minority), Employment status1 (1: education, 0: not), Employment status2
(1:employed, 0: not), Employment status3 (1: unemployed, 0: not), Religion (1: religious, 0:
not religious).
3. Political characteristics variables
3.1 Satisfaction with democracy (Q42). The percentage distribution of responses for Q42
(On the whole, how satisfied are you with the way democracy works in [country]?) is the
following regarding the total sample (N= 16.935): 0 (extremely dissatisfied): 6.0 %, 1: 3.6 %,
2: 6.4 %, 3: 9.5 %, 4: 9.9 %, 5:19.9 %, 6: 12.2 %, 7: 13.8 %, 8:9.7 %, 9: 3.6 %, 10: 2.0 %,
missing: 3.2 %, mean: 5.01, std.dev: 2.438.
3.2 Left-right scale (Q21). The percentage distribution of responses for Q21 (On a scale of 0
to 10, where 0 is left and 10 is right, would you say that you personally are left or right-
wing?) is the following regarding the total sample (N= 16.935): 0 (left): 3.7 %, 1: 2.6 %, 2:
6.0 %, 3: 8.8 %, 4: 8.1 %, 5: 25.4 %, 6: 6.6 %, 7: 6.2 %, 8: 5.0 %, 9: 2.3 %, 10: 3.4 %, missing:
21.7 %, (do not know: 16.5) mean: 4.84, std.dev: 2.344.
3.3 Political knowledge (Q28S). We constructed the variable based on the responses of
questions Q28.1-Q28.3. The values of the constructed scale range from 0 (all wrong or DK)
to 3 (all correct).
3.4 Interest in politics (Q2). Question Q2 referred to the interest in politics among
respondents’ direct personal environment (father, mother, brother or sister, grandparent,
boyfriend/ girlfriend/partner, best friend). Following seven items, each measuring degree of
interest (from ‘not at all interested’ to ‘very interested’) scored in four points.
The factor analysis resulted in only one factor, so we used principal component analysis. All
items load under one factor (principal component) explaining almost 47.43 % of the total
variance. These seven items constitute a good scale (Cronbach Alpha: 0.812) ranging from
zero to 21. Higher score in the scale indicates more frequent discussion on political issues
with primary group members.
3.5 Effectiveness of the "soft" action scale ( Q19/9), Effectiveness of "hard" action scale (
Q19/2). Question Q19 involved the perception of 11 activities, that is, to what degree do
these activities influence politics according to respondents. In the factor analysis, we have
first used oblimin rotation. The result of the factor analysis were, two factors derived and
the correlation among those factors is -0.371, so we have used varimax rotation for the
analysis. The two factors are derived from the following items: factor 1 (9 items) and factor
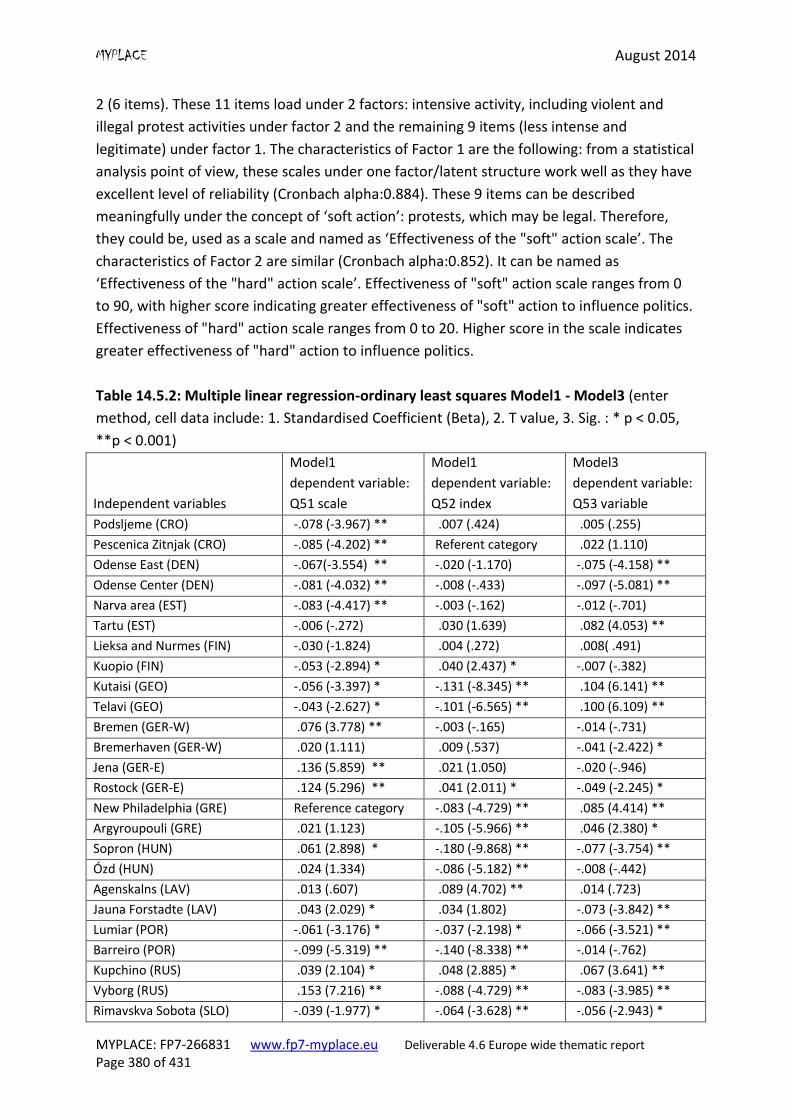
MYPLACE August 2014
MYPLACE: FP7-266831 www.fp7-myplace.eu Deliverable 4.6 Europe wide thematic report Page 380 of 431
2 (6 items). These 11 items load under 2 factors: intensive activity, including violent and
illegal protest activities under factor 2 and the remaining 9 items (less intense and
legitimate) under factor 1. The characteristics of Factor 1 are the following: from a statistical
analysis point of view, these scales under one factor/latent structure work well as they have
excellent level of reliability (Cronbach alpha:0.884). These 9 items can be described
meaningfully under the concept of ‘soft action’: protests, which may be legal. Therefore,
they could be, used as a scale and named as ‘Effectiveness of the "soft" action scale’. The
characteristics of Factor 2 are similar (Cronbach alpha:0.852). It can be named as
‘Effectiveness of the "hard" action scale’. Effectiveness of "soft" action scale ranges from 0
to 90, with higher score indicating greater effectiveness of "soft" action to influence politics.
Effectiveness of "hard" action scale ranges from 0 to 20. Higher score in the scale indicates
greater effectiveness of "hard" action to influence politics.
Table 14.5.2: Multiple linear regression-ordinary least squares Model1 - Model3 (enter
method, cell data include: 1. Standardised Coefficient (Beta), 2. T value, 3. Sig. : * p < 0.05,
**p < 0.001)
Independent variables
Model1
dependent variable:
Q51 scale
Model1
dependent variable:
Q52 index
Model3
dependent variable:
Q53 variable
Podsljeme (CRO) -.078 (-3.967) ** .007 (.424) .005 (.255)
Pescenica Zitnjak (CRO) -.085 (-4.202) ** Referent category .022 (1.110)
Odense East (DEN) -.067(-3.554) ** -.020 (-1.170) -.075 (-4.158) **
Odense Center (DEN) -.081 (-4.032) ** -.008 (-.433) -.097 (-5.081) **
Narva area (EST) -.083 (-4.417) ** -.003 (-.162) -.012 (-.701)
Tartu (EST) -.006 (-.272) .030 (1.639) .082 (4.053) **
Lieksa and Nurmes (FIN) -.030 (-1.824) .004 (.272) .008( .491)
Kuopio (FIN) -.053 (-2.894) * .040 (2.437) * -.007 (-.382)
Kutaisi (GEO) -.056 (-3.397) * -.131 (-8.345) ** .104 (6.141) **
Telavi (GEO) -.043 (-2.627) * -.101 (-6.565) ** .100 (6.109) **
Bremen (GER-W) .076 (3.778) ** -.003 (-.165) -.014 (-.731)
Bremerhaven (GER-W) .020 (1.111) .009 (.537) -.041 (-2.422) *
Jena (GER-E) .136 (5.859) ** .021 (1.050) -.020 (-.946)
Rostock (GER-E) .124 (5.296) ** .041 (2.011) * -.049 (-2.245) *
New Philadelphia (GRE) Reference category -.083 (-4.729) ** .085 (4.414) **
Argyroupouli (GRE) .021 (1.123) -.105 (-5.966) ** .046 (2.380) *
Sopron (HUN) .061 (2.898) * -.180 (-9.868) ** -.077 (-3.754) **
Ózd (HUN) .024 (1.334) -.086 (-5.182) ** -.008 (-.442)
Agenskalns (LAV) .013 (.607) .089 (4.702) ** .014 (.723)
Jauna Forstadte (LAV) .043 (2.029) * .034 (1.802) -.073 (-3.842) **
Lumiar (POR) -.061 (-3.176) * -.037 (-2.198) * -.066 (-3.521) **
Barreiro (POR) -.099 (-5.319) ** -.140 (-8.338) ** -.014 (-.762)
Kupchino (RUS) .039 (2.104) * .048 (2.885) * .067 (3.641) **
Vyborg (RUS) .153 (7.216) ** -.088 (-4.729) ** -.083 (-3.985) **
Rimavskva Sobota (SLO) -.039 (-1.977) * -.064 (-3.628) ** -.056 (-2.943) *
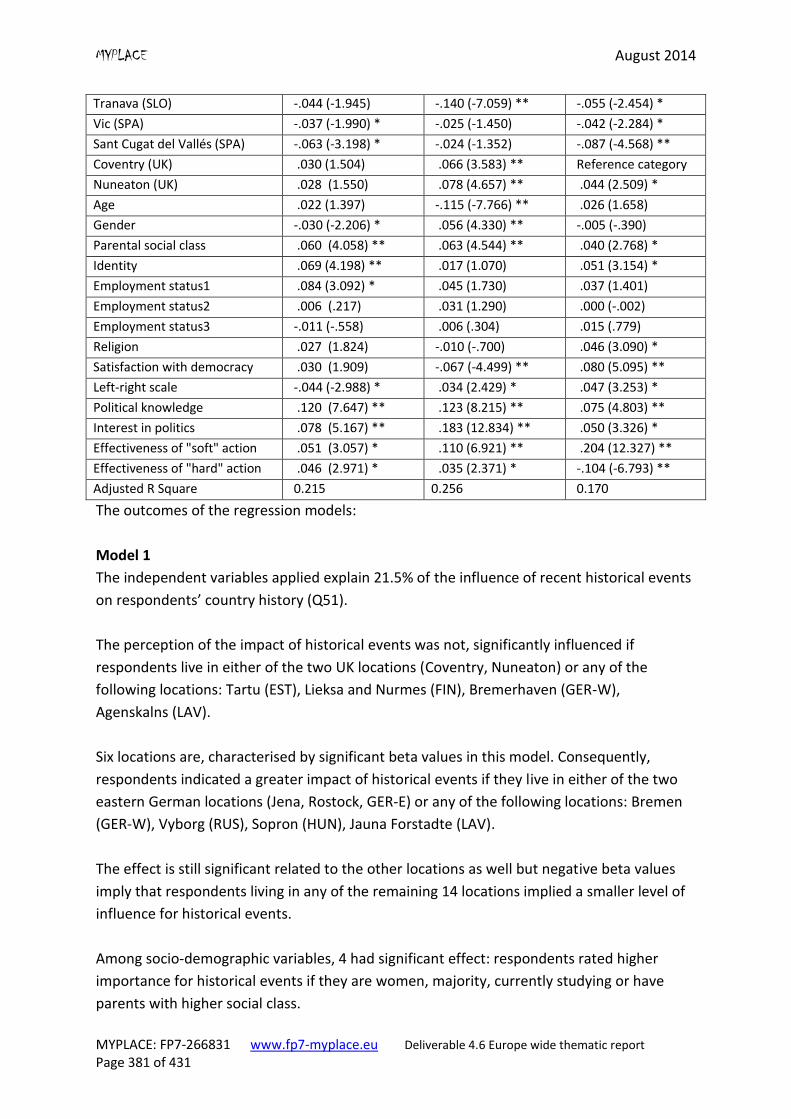
MYPLACE August 2014
MYPLACE: FP7-266831 www.fp7-myplace.eu Deliverable 4.6 Europe wide thematic report Page 381 of 431
Tranava (SLO) -.044 (-1.945) -.140 (-7.059) ** -.055 (-2.454) *
Vic (SPA) -.037 (-1.990) * -.025 (-1.450) -.042 (-2.284) *
Sant Cugat del Vallés (SPA) -.063 (-3.198) * -.024 (-1.352) -.087 (-4.568) **
Coventry (UK) .030 (1.504) .066 (3.583) ** Reference category
Nuneaton (UK) .028 (1.550) .078 (4.657) ** .044 (2.509) *
Age .022 (1.397) -.115 (-7.766) ** .026 (1.658)
Gender -.030 (-2.206) * .056 (4.330) ** -.005 (-.390)
Parental social class .060 (4.058) ** .063 (4.544) ** .040 (2.768) *
Identity .069 (4.198) ** .017 (1.070) .051 (3.154) *
Employment status1 .084 (3.092) * .045 (1.730) .037 (1.401)
Employment status2 .006 (.217) .031 (1.290) .000 (-.002)
Employment status3 -.011 (-.558) .006 (.304) .015 (.779)
Religion .027 (1.824) -.010 (-.700) .046 (3.090) *
Satisfaction with democracy .030 (1.909) -.067 (-4.499) ** .080 (5.095) **
Left-right scale -.044 (-2.988) * .034 (2.429) * .047 (3.253) *
Political knowledge .120 (7.647) ** .123 (8.215) ** .075 (4.803) **
Interest in politics .078 (5.167) ** .183 (12.834) ** .050 (3.326) *
Effectiveness of "soft" action .051 (3.057) * .110 (6.921) ** .204 (12.327) **
Effectiveness of "hard" action .046 (2.971) * .035 (2.371) * -.104 (-6.793) **
Adjusted R Square 0.215 0.256 0.170
The outcomes of the regression models:
Model 1
The independent variables applied explain 21.5% of the influence of recent historical events
on respondents’ country history (Q51).
The perception of the impact of historical events was not, significantly influenced if
respondents live in either of the two UK locations (Coventry, Nuneaton) or any of the
following locations: Tartu (EST), Lieksa and Nurmes (FIN), Bremerhaven (GER-W),
Agenskalns (LAV).
Six locations are, characterised by significant beta values in this model. Consequently,
respondents indicated a greater impact of historical events if they live in either of the two
eastern German locations (Jena, Rostock, GER-E) or any of the following locations: Bremen
(GER-W), Vyborg (RUS), Sopron (HUN), Jauna Forstadte (LAV).
The effect is still significant related to the other locations as well but negative beta values
imply that respondents living in any of the remaining 14 locations implied a smaller level of
influence for historical events.
Among socio-demographic variables, 4 had significant effect: respondents rated higher
importance for historical events if they are women, majority, currently studying or have
parents with higher social class.
MYPLACE August 2014
MYPLACE: FP7-266831 www.fp7-myplace.eu Deliverable 4.6 Europe wide thematic report Page 382 of 431
Of the third set of independent variables, political knowledge had the greatest influence
with the highest beta value among significant variables. By taking into consideration the
other significant variables we can state that the higher level of political knowledge and
interest in politics they have, the more they think that politics can be influenced with
different activities, respondents implied a higher level of influence of historical events.
Respondents’ political self-assessment also, impacts, significantly the perception of
historical events: being left-wing involves a greater likelihood for implying historical events’
greater impact on country history.
Model 2
The independent variables applied explain 25.6% of the influence of respondents’ frequency
for performing past-related activities and thus their interest in history (Q52).
Interest in history, that is, the frequency of performing past-related activities are not
influenced significantly if respondents live in either of the two Danish (Odense East, Odense
Center), Estonian (Narva area, Tartu), Spanish (Vic, Sant Cugat del Vallés) or western-
German (Bremen, Bremenhaven) locations or any of the following locations: Podsljeme
(CRO), Lieksa and Nurmes (FIN), Jena (GER-E), Jauna Forstadte (LAV).
Six locations are, characterised by significant positive beta values in the model.
Consequently, performing past-related activities is more likely if respondents live in either of
the UK locations (Coventry, Nuneaton) or any of the following: Kuopio (FIN), Rostock (GER-
E), Agenskalns (LAV), Kupchino (RUS).
The effect is still significantly related to the other locations as well but negative beta values
imply that respondents living in any of the remaining 11 locations implied a smaller level of
influence for historical events.
Among socio-demographic variables, 3 had significant effect: respondents rated higher
frequency for performing past-related activities if they are male, younger or have parents
with higher social class.
Of the third set of independent variables, interest in politics had the greatest influence with
the highest beta value among significant variables. By taking into consideration the other
significant variables we can state that the higher level of political knowledge and interest in
politics they have, the more they think that politics can be, influenced with different
activities (mostly soft political actions); respondents implied a higher frequency for
performing past-related activities. Respondents’ political self-assessment and satisfaction
with democracy also, impact significantly the frequency of performing past-related
MYPLACE August 2014
MYPLACE: FP7-266831 www.fp7-myplace.eu Deliverable 4.6 Europe wide thematic report Page 383 of 431
activities: being right-wing or more satisfied with democracy in the given country involve a
greater likelihood for implying more frequently performed past-related activities.
Model 3
The independent variables applied explain 17.0% of the importance of commemorating the
past (Q53).
The importance of commemorating the past is not influenced significantly if respondents
live in either of the two Finnish (Lieksa and Nurmes, Kuopio), Croatian (Podsljeme, Pescenica
Zitnjak) locations or any of the following locations: Narva area (EST), Bremen (GER-W), Jena
(GER-E), Ózd (HUN), Agenskalns (LAV), Barreiro (POR) .
Seven locations are, characterised by significant positive beta values in the model.
Consequently, respondents indicate a higher level of importance for commemorating the
past if they live in either of the Georgian (Kutaisi, Telavi, GEO) or Greek (New Philadelphia,
Argyroupouli, GRE) locations or any of the following: Tartu (EST), Kupchino (RUS), Nuneaton
(UK).
The effect is still significantly related to the other locations as well but negative beta values
imply that respondents living in any of the remaining 12 locations implied a smaller level of
importance for commemorating the past.
Among socio-demographic variables, 3 had significant effect: respondents rated higher
importance for commemorating the past if they are the majority, religious or have parents
with higher social class.
Of the third set of independent variables, all the three political characteristic variables have
a significant effect. The support of influencing politics with soft political actions had the
strongest significant effect as the Effectiveness of “soft” scale had the highest beta value. By
taking into consideration the other significant variables, we can state that the higher level of
political knowledge and interest in politics they have, the more they think that politics can
be influenced soft political activities, respondents implied higher importance for
commemorating the past. Respondents’ political self-assessment and satisfaction with
democracy also, impact significantly the importance of commemorating the past: being left-
wing or more satisfied with democracy in the given country involve a greater likelihood for
implying higher importance for commemorating the past.
MYPLACE August 2014
MYPLACE: FP7-266831 www.fp7-myplace.eu Deliverable 4.6 Europe wide thematic report Page 384 of 431
14.6 Summary
Young people are interested in recent history, with 29% stating that they are very interested
and 56% a little interested . Respondents consider World War II and membership in the
European Union the most important from their countries’ perspectives among the listed
events and periods, and NY terrorist attacks September 9th 2011 and the Holocaust the
least important.
The reported importance of different historical events shows that respondents consider
World War II (85%) and membership in the European Union (84%) to be ranked highest
from their countries’ perspectives among the listed events and periods. The NY terrorist
attacks of September 9th 2011 (41%) and the Holocaust (52%) are less likely to be seen as
important. There is, however, massive location variance in these figures, for example the
importance of the holocaust varies from a low of 18% in Lieksa/Nurmes (Finland) to 91% in
Jena (eastern Germany). Locations where the importance of the holocaust is greater than
60% are: Nuneaton and Coventry (both in the UK), Vyborg (Russia), Sopron (Hungary),
Rostock, Jena, Bremerhaven and Bremen, i.e. all four German locations.
Our hypotheses concerning the independent variables detailed in the introductory section
are verified by the outcomes of regression models.
The locations, socio-demographic and political characteristics variable’s impact politics-
related activities the most (22%) and the importance for commemorating the past the least
(17%).
Among locations, the Lieksa/Nurmes Finnish location did not have significant effect in any
of the three models. The impact of Tartu (EST) and Bremerhaven (GER-W) was not
significant in the first two models, and the same applies to the Narva area (EST), Bremen
(GER-W), Podsljeme (CRO) and Jena (GER-E) with regard to Model 2 and Model 3, while
Agensalns (LAV) was not significant in Model 1 and Model 3. We can state that the
perception of history and the past is, influenced the least in the Finnish, Estonian and
western German locations (non significant effect).
Three locations had significant roles: Rostock (GER-E) had significant positive beta values in
Model 1 and Model 2 and the same applies to Nuneaton (UK) and Kupchino (RUS) with
regard to Model 2 and Model 3. We can conclude that we are more likely to find a higher
level of importance attached to historical events and commemorating the past if
respondents live in any of these three locations.
According to our results, two socio-demographic variables determine respondents’ relation
to the historical past. Parental social class and belonging to the majority society significantly
MYPLACE August 2014
MYPLACE: FP7-266831 www.fp7-myplace.eu Deliverable 4.6 Europe wide thematic report Page 385 of 431
increase the importance of historical events and commemorating the past. The sex variable
had a significant effect in Model 1 and Model 2 but women tend to attache importance to
historical events while men favour history-related activities.
The perception of the importance of history, the past and historical
memory/commemoration is clearly influenced by political relations; the level of political
knowledge, interest in politics and the support of mainly soft political actions as a means for
influencing politics had significant effects in all three models. A major finding is that past-
related activities participated in characterise those the most who are dissatisfied with
democracy and are right-wing. In contrast being left-wing increases the likelihood of
attaching a higher level of importance to history and commemoration.
References
Assmann, J. (2008) Of God and Gods: Egypt, Israel, and the Rise of Monotheism (2008)
The University of Wisconsin Press.
Assmann, J. (2007). Cultural memories and national narratives: With some relation to the
case of Georgia. White paper report prepared for the Georgian Ministry of Education.
Based on the working meeting ‘‘Negotiating a new national narrative in Georgia’’.
Caucasus Context, 3(1), 40-41.
Assmann, J. (1992) Das kulturelle Gedächtnis. Schrift, Erinnerung und politische Identität
in frühen Hochkulturen. Munich.
Bartlett, F. C. (1995). Remembering: A study in experimental and social psychology.
Cambridge, UK: Cambridge University Press. (Original work published 1932)
Bodnar, J. (1992). Remaking America: Public Memory, Commemoration, and Patriotism in
the Twentieth Century. Princeton, NJ: Princeton University Press
Brubaker, R. and Feischmidt, M. (2002): 1848 in 1998: The Politics of Commemoration in
Hungary, Romania, and Slovakia: Comparative Studies in Society and History, Vol. 44, No.
4 (Oct.,), pp. 700-744.
Ciobanu, M. (2009). Criminalising the Past and Reconstructing Collective Memory: The
Romanian Truth Commission. Europe-Asia Studies, 61, 313-336.
Cole, J. (2001). Forget colonialism? Sacrifice and the art of memory in Madagascar.
Berkeley, CA: University of California Press.
Dudai, Y. (2002). Memory from A to Z: Keywords, concepts and beyond. Oxford, UK:
Oxford University Press
MYPLACE August 2014
MYPLACE: FP7-266831 www.fp7-myplace.eu Deliverable 4.6 Europe wide thematic report Page 386 of 431
Erll, A., (2005). Kollektives Gedächtnis und Erinnerungskulturen (Stuttgart and Weimar)
Fine, G. (2001). Difficult Reputations: Collective Memories of the Evil, Inept and
Controversial. Chicago: University of Chicago Press.
Halbwachs, M. (1980). The collective memory [trans- lated by Francis J. Didder, Jr. and
Vida Yazdi Ditter]. New York: Harper and Row.
Halbwachs, M. (1992). On collective memory [edited, translated, and with an
introduction by Lewis A. Coser]. Chicago. University of Chicago Press.
Hutchins, E. (1995). How a cockpit remembers its speed. Cognitive Science, 19, 265-288.
Klein, K. L. (2000).`On the emergence of 'memory' in historical discourse’ Representations
69.
Middleton, D., and S. D. Brown. (2005). The social psychology of experience: Studies in
remembering and forgetting. San Francisco, CA: Sage.
Nora, P. (1989). Between memory and history: Les lieux de me´ moire. Representations,
26, 7-25.
Novick, P. (1999). The Holocaust in American life. Boston: Houghton Mifflin Company.
Olick, J. (2007). The Politics of Regret: On Collective Memory and Historical Responsibility.
London: Routledge.
Olick, J. K. and Robbins J., (1998); `Social memory studies. From 'collective memory' to
the historical sociology of mnemonic practices’, Annual review of sociology 24.
Pennebaker, J. W., Paez, D., and Rime´ , J. (Eds.). (1997). Collective memory of political
events: Social psycho- logical perspectives. Mahwah, NJ: Lawrence Erlbaum Associates
Inc.
Reese, E., and Fivush, R. (2008). The development of collective remembering. Memory,
16, 201-212.
Renan, E. (1990). What is a nation? In H. K. Bhabha (Ed.), Nation and narration. London:
Routledge. (Original work published 1882)
Ricoeur, P. (2000). La mémoire, l'histoire, l'oubli. Paris: Seuil.
Roediger, H. L., and Wertsch, J. V. (2008). Creating a new discipline of memory studies.
Memory Studies 1(1), 5-17.
Rowe, S., Wertsch, J., and Kosyaeva, T. (2002). Linking Little Narratives to Big Ones:
Narrative and Public Memory in History Museums. Culture and Psychology, 8, 96-112.
Schudson, M. (1995). Dynamics of distortion in collec- tive memory. In D. Schacter (Ed.),
Memory distor- tion: How minds, brains, and societies reconstruct the past (pp. 346-364).
Cambridge, MA: Harvard University Press.
Till, K. E., `(2006) Memory studies,` History workshop journal 62.
MYPLACE August 2014
MYPLACE: FP7-266831 www.fp7-myplace.eu Deliverable 4.6 Europe wide thematic report Page 387 of 431
Wertsch, J. (2002). Voices of Collective Remembering. Cambridge: Cambridge University
Press.
Wertsch, J. (2007). Collective Memory. In J. Valsiner and A. Rosa (Eds.) The Cambridge
Handbook of Sociocultural Psychology. Cambridge: Cambridge University Press, pp. 645-
660.
Wertsch, J. (2008). Collective Memory and Narrative Templates, Social Research, 75, 133-
156.
Yates, F. (1966). The art of memory. Chicago: University of Chicago Press.
Young, J. (1993). The texture of memory: Holocaust memorials and meaning. New Haven,
CT: Yale University Press.
Zerubavel, E. (2003). Time maps: Collective memory and the social shape of the past.
Chicago: University of Chicago Press.
MYPLACE August 2014
MYPLACE: FP7-266831 www.fp7-myplace.eu Deliverable 4.6 Europe wide thematic report Page 388 of 431
Chapter 15: European Issues
This chapter examines questions, which specifically relate to Europe. These questions are
also analysed in other chapters, and individually, or as part of a constructed index.
Respondents’ attitudes to European Issues were measured using a range of questions,
including respondents’ level of interest in issues to do with Europe and their level of interest
in the European Union. Other questions explored the level of trust in the European
Commission and the historical importance of having membership in the European Union.
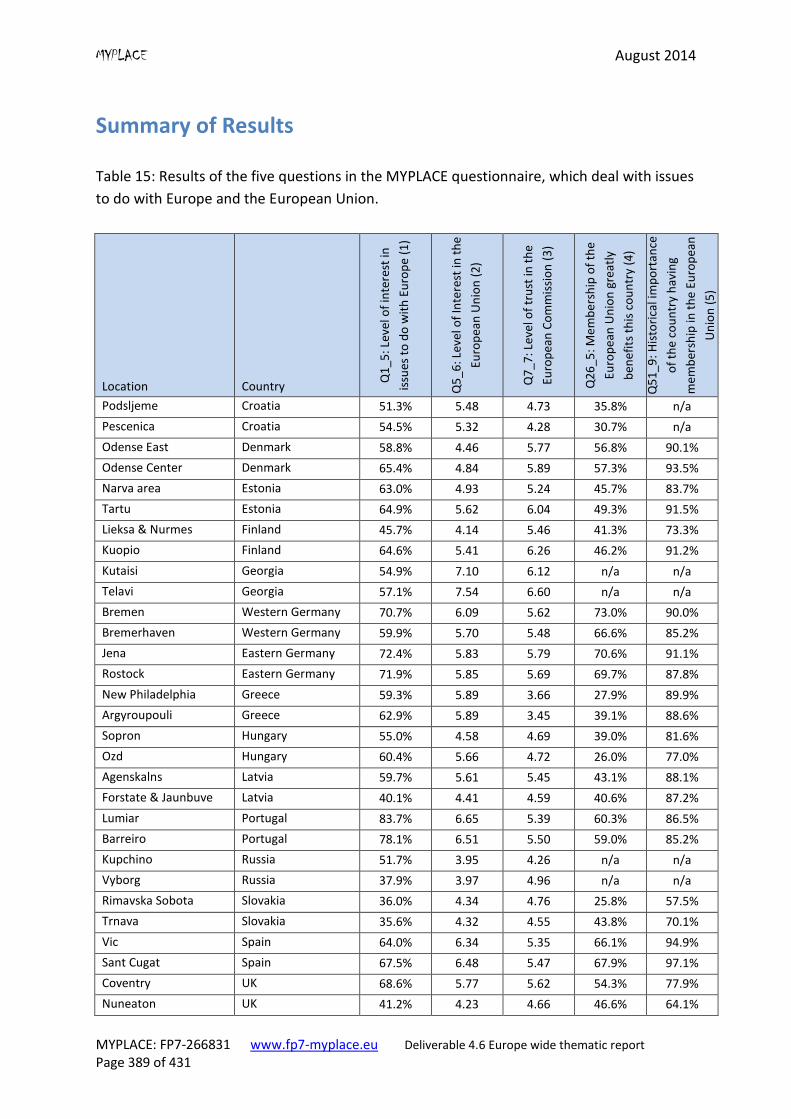
MYPLACE August 2014
MYPLACE: FP7-266831 www.fp7-myplace.eu Deliverable 4.6 Europe wide thematic report Page 389 of 431
Summary of Results
Table 15: Results of the five questions in the MYPLACE questionnaire, which deal with issues
to do with Europe and the European Union.
Location Country Q
1_5
: Lev
el o
f in
tere
st in
issu
es t
o d
o w
ith
Eu
rop
e (
1)
Q5
_6: L
evel
of
Inte
rest
in t
he
Euro
pea
n U
nio
n (
2)
Q7
_7: L
evel
of
tru
st in
th
e
Euro
pea
n C
om
mis
sio
n (
3)
Q2
6_5
: Me
mb
ersh
ip o
f th
e
Euro
pea
n U
nio
n g
reat
ly
ben
efit
s th
is c
ou
ntr
y (4
)
Q5
1_9
: His
tori
cal i
mp
ort
ance
of
the
cou
ntr
y h
avin
g
me
mb
ersh
ip in
th
e Eu
rop
ean
Un
ion
(5
)
Podsljeme Croatia 51.3% 5.48 4.73 35.8% n/a
Pescenica Croatia 54.5% 5.32 4.28 30.7% n/a
Odense East Denmark 58.8% 4.46 5.77 56.8% 90.1%
Odense Center Denmark 65.4% 4.84 5.89 57.3% 93.5%
Narva area Estonia 63.0% 4.93 5.24 45.7% 83.7%
Tartu Estonia 64.9% 5.62 6.04 49.3% 91.5%
Lieksa & Nurmes Finland 45.7% 4.14 5.46 41.3% 73.3%
Kuopio Finland 64.6% 5.41 6.26 46.2% 91.2%
Kutaisi Georgia 54.9% 7.10 6.12 n/a n/a
Telavi Georgia 57.1% 7.54 6.60 n/a n/a
Bremen Western Germany 70.7% 6.09 5.62 73.0% 90.0%
Bremerhaven Western Germany 59.9% 5.70 5.48 66.6% 85.2%
Jena Eastern Germany 72.4% 5.83 5.79 70.6% 91.1%
Rostock Eastern Germany 71.9% 5.85 5.69 69.7% 87.8%
New Philadelphia Greece 59.3% 5.89 3.66 27.9% 89.9%
Argyroupouli Greece 62.9% 5.89 3.45 39.1% 88.6%
Sopron Hungary 55.0% 4.58 4.69 39.0% 81.6%
Ozd Hungary 60.4% 5.66 4.72 26.0% 77.0%
Agenskalns Latvia 59.7% 5.61 5.45 43.1% 88.1%
Forstate & Jaunbuve Latvia 40.1% 4.41 4.59 40.6% 87.2%
Lumiar Portugal 83.7% 6.65 5.39 60.3% 86.5%
Barreiro Portugal 78.1% 6.51 5.50 59.0% 85.2%
Kupchino Russia 51.7% 3.95 4.26 n/a n/a
Vyborg Russia 37.9% 3.97 4.96 n/a n/a
Rimavska Sobota Slovakia 36.0% 4.34 4.76 25.8% 57.5%
Trnava Slovakia 35.6% 4.32 4.55 43.8% 70.1%
Vic Spain 64.0% 6.34 5.35 66.1% 94.9%
Sant Cugat Spain 67.5% 6.48 5.47 67.9% 97.1%
Coventry UK 68.6% 5.77 5.62 54.3% 77.9%
Nuneaton UK 41.2% 4.23 4.66 46.6% 64.1%
MYPLACE August 2014
MYPLACE: FP7-266831 www.fp7-myplace.eu Deliverable 4.6 Europe wide thematic report Page 390 of 431
1 = proportion of respondents stating ‘very interested’ or ‘interested’
2 & 3 = mean value for each location
4 = proportion of respondents stating ‘strongly agree’ or ‘agree’
5 = proportion of respondents stating ‘very important’ or ‘important’
Questions regarding membership of the European Union were not asked in Georgia and
Russia due to non-membership. Croatia joined the EU in 2013, therefore the historical
importance question was not asked.
In general, locations in Spain, Portugal and Germany, have higher levels of interest in
European issues, and respondents in those nations have more positive views of EU
membership. Russia and Slovakia, in general, are less interested in European Issues. There
are contrasting views in the two locations in both the UK and Finland. Coventry (UK) and
Kuopio (Finland) are generally more positive about European issues compared with
Nuneaton (UK) and Lieksa & Nurmes (Finland).
Literature
European integration began in the 1950s with the Schuman Plan and the formation of the
European Coal and Steel Community (ECSC) (Alter and Steinburg, 2007). A common market
for coal, iron-ore and scrap-metal established in 1953 was successful and started the move
for more ambitious goals economic integration including agriculture, and in 1958 the
European Economic Community (EEC) was launched (Alter and Steinburg, 2007). Since its
inception in the mid-1980s, the European Union (EU), together with its member states, has
undergone a major process of transformation (Schmidt and Radaelli, 2004). The EU has
taken momentous steps, with the development of the ‘single market’ in 1992, the European
Monetary Union (EMU) in 1999, and the continued enlargement, expanding to 28 Member
states when Croatia joined in 2013. New policies and practices have led to social and
economic benefits as well as a developing polity. For all the benefits, there are significant
tensions between the national and EU levels (Schmitt, 2009), there are questions about
legitimacy, accountability and democracy within the EU (Schmitt, 2009; Bogdanor, 2007;
Nacarino et al., 2012) and more recently the euro crisis has meant that the ‘European
Project’ has significant challenges (Pew Research Center, 2013). These challenges have
disproportionately affected young people, with rising youth unemployment or cuts in
education budgets (Horvath and Paolini, 2014).
Each member state have their own view and perspective on the purpose and future role of
the EU. There are a number of ‘visions’ of the EU, which have emerged from these views
and perspectives. Schmidt (2009:24) identified four basic non-mutually exclusive discourse;
MYPLACE August 2014
MYPLACE: FP7-266831 www.fp7-myplace.eu Deliverable 4.6 Europe wide thematic report Page 391 of 431
a pragmatic discourse about the EU as a borderless problem-solving entity ensuring
free markets and regional security
a normative discourse about the EU as a bordered values-based community
a principled discourse about the EU as a border-free, rights-based post-national
union
a strategic discourse about the EU as global actor ‘doing international relations
differently’ through multilateralism, humanitarian aid and peace-keeping.
European countries benefit significantly both economically and politically from EU
membership. EU membership provides access to a single market with more than 500 million
people and the EU size enables lucrative trade deals with other partners from around the
world. Free movement of labour has changed patterns of socialisation of young people and
increased the diversity of European countries (Horvath and Paolini, 2014).
The European Union consists of the European Parliament (EP), the Council of Ministers and
the Commission. This complicated structure differs for national polity and citizens have
expressed concerns that the EU is too technocratic and ineffective (Bogdanor, 2007:14),
questioning the legitimacy of the EU, because of pressure put on national politics due to EU
decision making ‘for the people’ is characterised by ‘policy without politics’ (Schmidt,
2009:14). These issues had led to increasing tensions between the national and EU levels,
with “economic decision-making has increasingly moved upwards towards the EU level
while politics and identity have largely remained national, along with the mechanisms of
electoral sanctions” (Schmitt, 2009:). In the current climate, national politicians are less and
less able to address problems and influence policies in the national context due to
internationalisation (Horvath and Paolini, 2013:4). Member states continue to turn to the
EU when seeking solutions to problems that cannot be solved nationally (Micossi, 2008).
The European parliament are elected democratically. Over the years there has been falling
turnout for elections at a time when the EP powers have been expanding (Bogdanor, 2007),
leading to a Democratic Deficit (Norris, 2011, Kohler-Kohl, 2010, Bogdanor, 2007). The
‘democratic deficit’ is when the perceived democratic performance diverges from public
expectations (Norris, 2011) with consequences leading to a crisis of legitimacy. The turnout
for the May 2014 elections was 43.09%, but this varied between 13% (in Slovakia) and
58.2% (in Greece), amongst the MYPLACE countries. “Elections to the European Parliament
are often used by voters to punish the party in power in their particular member state.
Sometimes they are used to cast a protest vote, and so antisystem and extremist parties
tend to perform well in these elections”. (Bogdanor, 2007:8) This was the case in the 2014
European elections saw an increase in the vote for the Eurosceptic parties.
Young people have grown-up in times of European integration, and the free movement of
labour has led to social and economic changes. This has assisted the position that young
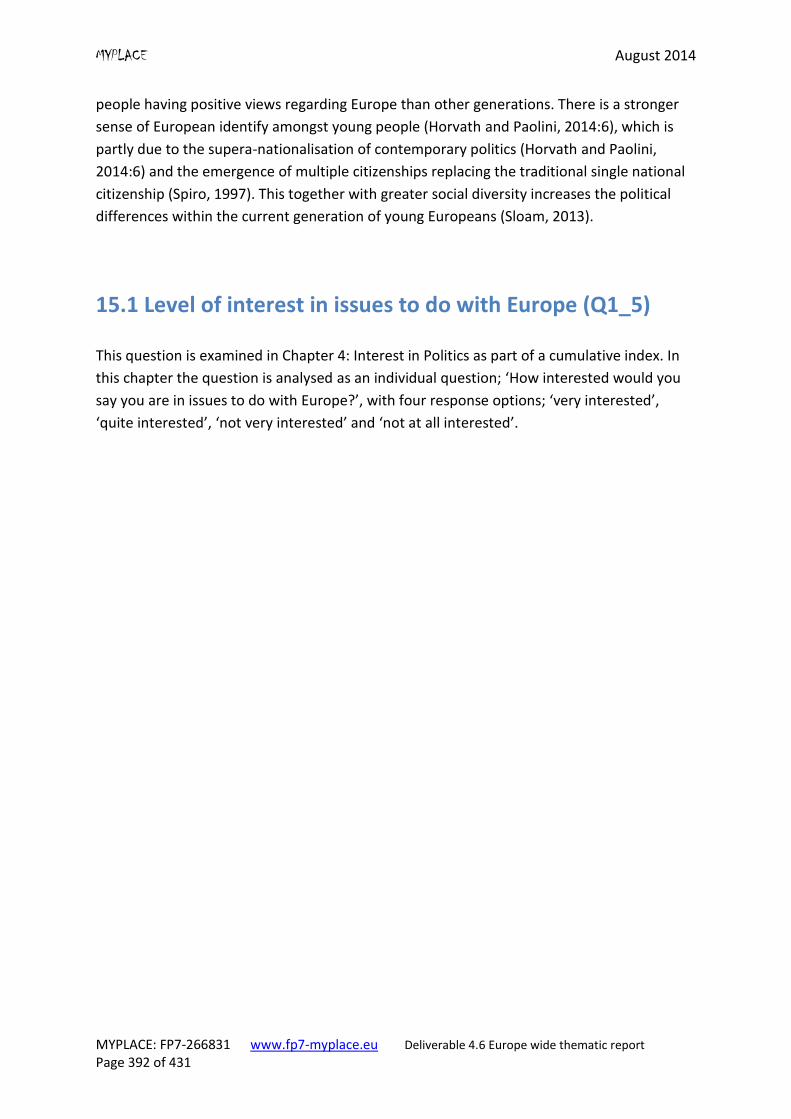
MYPLACE August 2014
MYPLACE: FP7-266831 www.fp7-myplace.eu Deliverable 4.6 Europe wide thematic report Page 392 of 431
people having positive views regarding Europe than other generations. There is a stronger
sense of European identify amongst young people (Horvath and Paolini, 2014:6), which is
partly due to the supera-nationalisation of contemporary politics (Horvath and Paolini,
2014:6) and the emergence of multiple citizenships replacing the traditional single national
citizenship (Spiro, 1997). This together with greater social diversity increases the political
differences within the current generation of young Europeans (Sloam, 2013).
15.1 Level of interest in issues to do with Europe (Q1_5)
This question is examined in Chapter 4: Interest in Politics as part of a cumulative index. In
this chapter the question is analysed as an individual question; ‘How interested would you
say you are in issues to do with Europe?’, with four response options; ‘very interested’,
‘quite interested’, ‘not very interested’ and ‘not at all interested’.
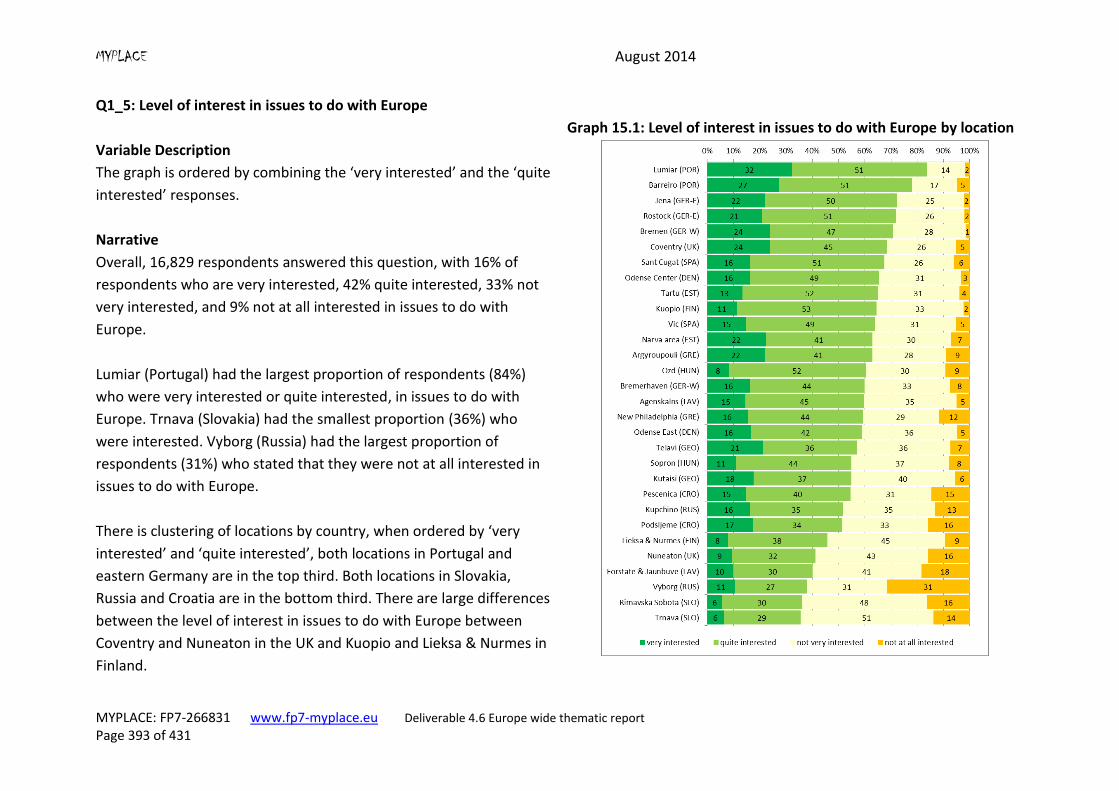
MYPLACE August 2014
MYPLACE: FP7-266831 www.fp7-myplace.eu Deliverable 4.6 Europe wide thematic report Page 393 of 431
Q1_5: Level of interest in issues to do with Europe
Variable Description
The graph is ordered by combining the ‘very interested’ and the ‘quite
interested’ responses.
Graph 15.1: Level of interest in issues to do with Europe by location
Narrative
Overall, 16,829 respondents answered this question, with 16% of
respondents who are very interested, 42% quite interested, 33% not
very interested, and 9% not at all interested in issues to do with
Europe.
Lumiar (Portugal) had the largest proportion of respondents (84%)
who were very interested or quite interested, in issues to do with
Europe. Trnava (Slovakia) had the smallest proportion (36%) who
were interested. Vyborg (Russia) had the largest proportion of
respondents (31%) who stated that they were not at all interested in
issues to do with Europe.
There is clustering of locations by country, when ordered by ‘very
interested’ and ‘quite interested’, both locations in Portugal and
eastern Germany are in the top third. Both locations in Slovakia,
Russia and Croatia are in the bottom third. There are large differences
between the level of interest in issues to do with Europe between
Coventry and Nuneaton in the UK and Kuopio and Lieksa & Nurmes in
Finland.
MYPLACE August 2014
MYPLACE: FP7-266831 www.fp7-myplace.eu Deliverable 4.6 Europe wide thematic report Page 394 of 431
15.2 Level of Interest in the European Union (Q5_6)
This question is examined in Chapter 4: Interest in Politics and as part of an index. In this
chapter the question is analysed as an individual question, using an eleven-point scale
where high values indicate higher degree of interest in the European Union.
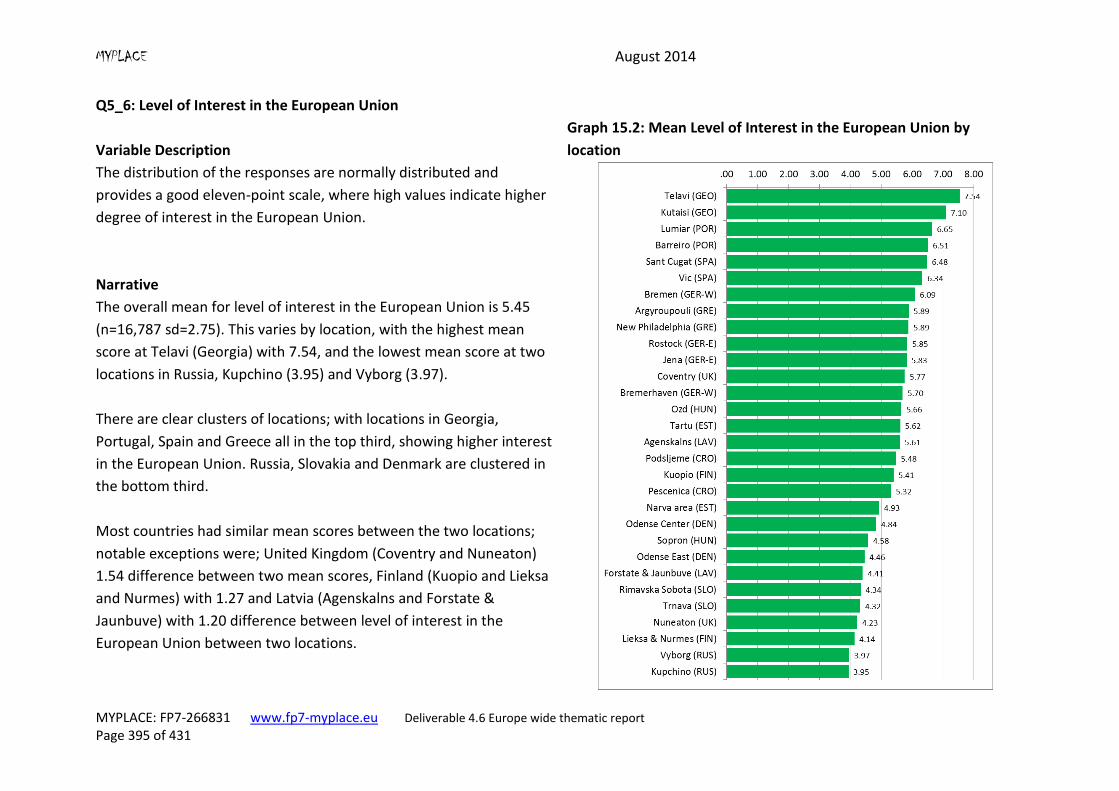
MYPLACE August 2014
MYPLACE: FP7-266831 www.fp7-myplace.eu Deliverable 4.6 Europe wide thematic report Page 395 of 431
Q5_6: Level of Interest in the European Union
Variable Description
The distribution of the responses are normally distributed and
provides a good eleven-point scale, where high values indicate higher
degree of interest in the European Union.
Graph 15.2: Mean Level of Interest in the European Union by
location
Narrative
The overall mean for level of interest in the European Union is 5.45
(n=16,787 sd=2.75). This varies by location, with the highest mean
score at Telavi (Georgia) with 7.54, and the lowest mean score at two
locations in Russia, Kupchino (3.95) and Vyborg (3.97).
There are clear clusters of locations; with locations in Georgia,
Portugal, Spain and Greece all in the top third, showing higher interest
in the European Union. Russia, Slovakia and Denmark are clustered in
the bottom third.
Most countries had similar mean scores between the two locations;
notable exceptions were; United Kingdom (Coventry and Nuneaton)
1.54 difference between two mean scores, Finland (Kuopio and Lieksa
and Nurmes) with 1.27 and Latvia (Agenskalns and Forstate &
Jaunbuve) with 1.20 difference between level of interest in the
European Union between two locations.
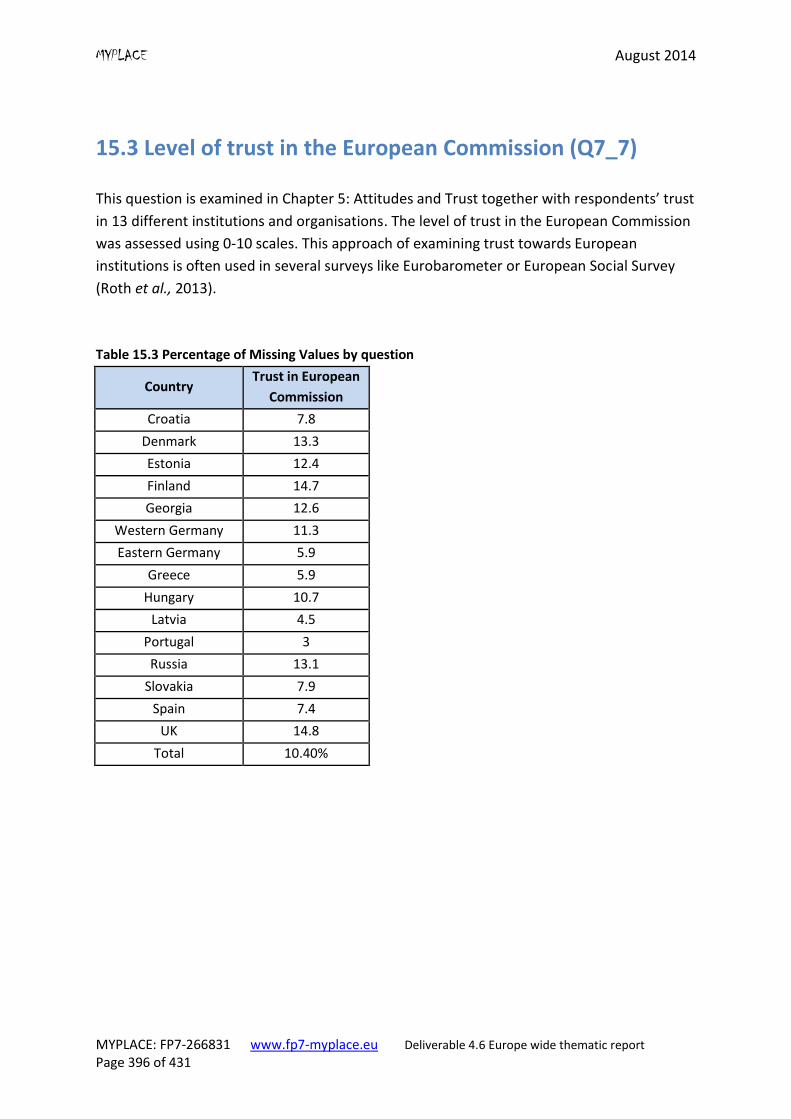
MYPLACE August 2014
MYPLACE: FP7-266831 www.fp7-myplace.eu Deliverable 4.6 Europe wide thematic report Page 396 of 431
15.3 Level of trust in the European Commission (Q7_7)
This question is examined in Chapter 5: Attitudes and Trust together with respondents’ trust
in 13 different institutions and organisations. The level of trust in the European Commission
was assessed using 0-10 scales. This approach of examining trust towards European
institutions is often used in several surveys like Eurobarometer or European Social Survey
(Roth et al., 2013).
Table 15.3 Percentage of Missing Values by question
Country Trust in European
Commission
Croatia 7.8
Denmark 13.3
Estonia 12.4
Finland 14.7
Georgia 12.6
Western Germany 11.3
Eastern Germany 5.9
Greece 5.9
Hungary 10.7
Latvia 4.5
Portugal 3
Russia 13.1
Slovakia 7.9
Spain 7.4
UK 14.8
Total 10.40%
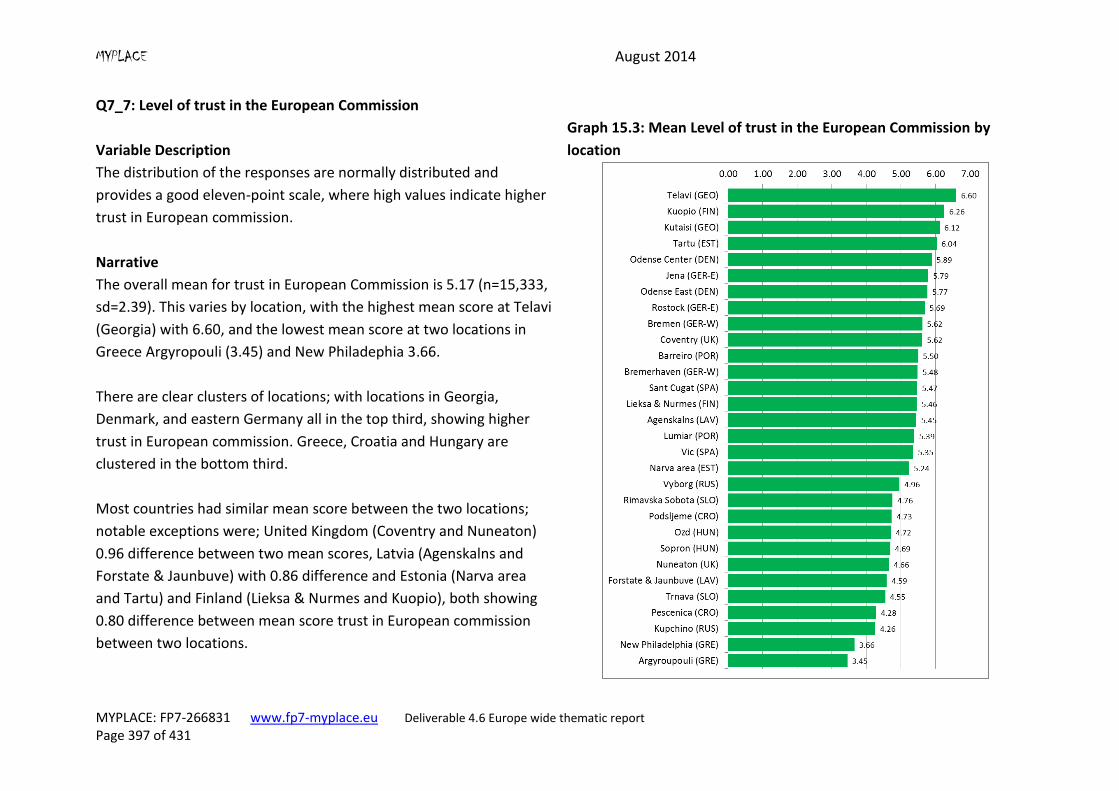
MYPLACE August 2014
MYPLACE: FP7-266831 www.fp7-myplace.eu Deliverable 4.6 Europe wide thematic report Page 397 of 431
Q7_7: Level of trust in the European Commission
Variable Description
The distribution of the responses are normally distributed and
provides a good eleven-point scale, where high values indicate higher
trust in European commission.
Graph 15.3: Mean Level of trust in the European Commission by
location
Narrative
The overall mean for trust in European Commission is 5.17 (n=15,333,
sd=2.39). This varies by location, with the highest mean score at Telavi
(Georgia) with 6.60, and the lowest mean score at two locations in
Greece Argyropouli (3.45) and New Philadephia 3.66.
There are clear clusters of locations; with locations in Georgia,
Denmark, and eastern Germany all in the top third, showing higher
trust in European commission. Greece, Croatia and Hungary are
clustered in the bottom third.
Most countries had similar mean score between the two locations;
notable exceptions were; United Kingdom (Coventry and Nuneaton)
0.96 difference between two mean scores, Latvia (Agenskalns and
Forstate & Jaunbuve) with 0.86 difference and Estonia (Narva area
and Tartu) and Finland (Lieksa & Nurmes and Kuopio), both showing
0.80 difference between mean score trust in European commission
between two locations.
MYPLACE August 2014
MYPLACE: FP7-266831 www.fp7-myplace.eu Deliverable 4.6 Europe wide thematic report Page 398 of 431
15.4 Membership of the European Union greatly benefits
this country (Q26_5)
This question is examined in Chapter 9:Citizenship. Respondents were asked if they agree or
disagree to the statement, ‘Membership of the European Union greatly benefits this country
(where applicable)?’ Respondents had five options; ‘strongly agree’, ‘agree’, ‘neither agree
nor disagree’, ‘disagree’ and ‘strongly disagree’ when answering this question.
Respondents from 13 countries answered this question (excluding Russia and Georgia).
Respondents in Croatia were asked this question in the period leading up to becoming EU
members in 2013.
MYPLACE August 2014
MYPLACE: FP7-266831 www.fp7-myplace.eu Deliverable 4.6 Europe wide thematic report Page 399 of 431
Q26_5: Membership of the European Union greatly benefits this country
Variable Description
The graph is ordered by combining the ‘strongly agree’ and the ‘agree’
responses.
Graph 15.4: Membership of the European Union greatly benefits this
country by location
Narrative
Overall, 12,361 respondents answered this question, with 7% of
respondents who ‘strongly agree’, 47% ‘agree’, 32%’ neither agree or
disagree’, 11% ‘disagree’ and 2% ‘strongly disagree’ that membership
of the European Union greatly benefits this country.
Bremen (western Germany) had the largest proportion of
respondents (73%) who ‘strongly agree’ or ‘agree’ that membership of
the European Union greatly benefits their country.
Rimavska Sobota (Slovakia) had the smallest proportion (26%), who
‘strongly agree and agree’. New Philadelphia (Greece) had the largest
proportion of respondents (39%) who stated they ’strongly disagree
or disagree’ that membership of the European Union greatly benefits
their country.
There is clustering of locations by country, when ordered by ‘strongly
agree’ and ‘agree’, both locations in eastern Germany, western
Germany, Spain and Portugal are in the top third. Both locations in
Hungary, Greece and Croatia are in the bottom third.
MYPLACE August 2014
MYPLACE: FP7-266831 www.fp7-myplace.eu Deliverable 4.6 Europe wide thematic report Page 400 of 431
13.5 Historical importance of the country having
membership in the European Union (Q51_9)
This question is examined in Chapter 14: History and Memory, together with a number of
other historical events. This question was asked in relation to historical significant events
and was measured on a five-point scale; ‘very important’, ‘important’, ‘neither important
nor unimportant’, ‘not very important’ and ‘not important at all’.
Not all countries are members of the European Union, therefore respondents from Croatia
(who joined in 2013, but did not have an historical context), Georgia and Russia were not
asked this question. Responses are based on 12 countries and 24 locations.
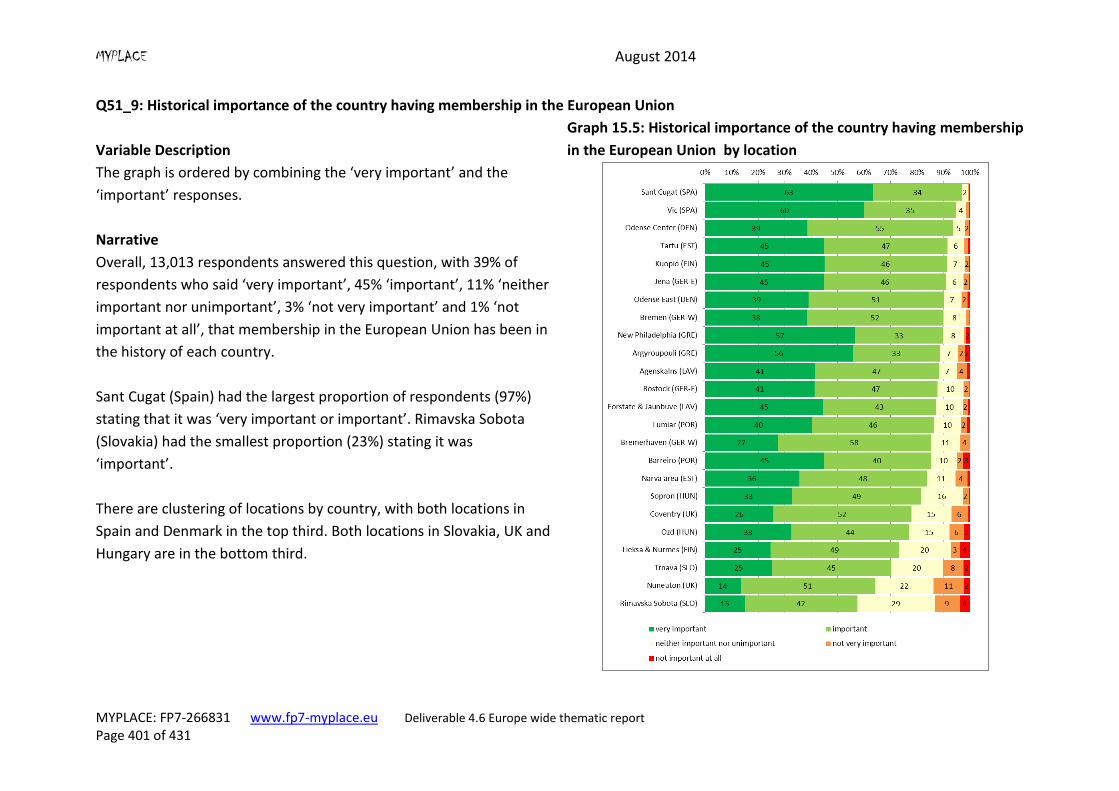
MYPLACE August 2014
MYPLACE: FP7-266831 www.fp7-myplace.eu Deliverable 4.6 Europe wide thematic report Page 401 of 431
Q51_9: Historical importance of the country having membership in the European Union
Variable Description
The graph is ordered by combining the ‘very important’ and the
‘important’ responses.
Graph 15.5: Historical importance of the country having membership
in the European Union by location
Narrative
Overall, 13,013 respondents answered this question, with 39% of
respondents who said ‘very important’, 45% ‘important’, 11% ‘neither
important nor unimportant’, 3% ‘not very important’ and 1% ‘not
important at all’, that membership in the European Union has been in
the history of each country.
Sant Cugat (Spain) had the largest proportion of respondents (97%)
stating that it was ‘very important or important’. Rimavska Sobota
(Slovakia) had the smallest proportion (23%) stating it was
‘important’.
There are clustering of locations by country, with both locations in
Spain and Denmark in the top third. Both locations in Slovakia, UK and
Hungary are in the bottom third.
MYPLACE August 2014
MYPLACE: FP7-266831 www.fp7-myplace.eu Deliverable 4.6 Europe wide thematic report Page 402 of 431
15.6 Multi-level Modelling
Multi-level models dealing with European issues can be found in the following chapters;
Chapter 5: Attitudes and Trust includes a multi-level model ‘Model B: Trust in European commission’
Chapter 9: Citizenship includes a multi-level model ‘Model В – Membership of the European Union greatly benefits this country’
15.7 Summary
In this chapter, we reported the findings of cross-country analysis of respondents’ attitudes
towards European Issues.
Young people are interested in issues to do with Europe with 58% of young people stating
they are either ‘very interested’ or ‘quite interested’ in European Issues. Young people in
Portugal had the largest proportion of respondents (Lumiar = 84%, Barreiro = 78%) who
were ‘interested’, followed by eastern Germany (Jena and Rostock).
The average level of Interest in the European Union across the respondents was 5.45 (on a
scale from 0 to 10), which is slightly below the mid-point of the scale. The highest mean
score was in Telavi (Georgia) at 7.5 followed by Kutaisi (Georgia) at 7.1. Mediterranean
countries of Portugal, Spain and Greece, together with Germany (both eastern and western)
all have interest levels higher than the mid-point of the scale.
The Average level of trust in the European Commission is slightly higher than in national
parliaments (5.2 on a scale from 0 to 10), although still moderate, with the highest mean
score in Telavi (Georgia, M=6.6) and the lowest mean score in the two locations in Greece
(Argyroupouli, mean=3.5 and New Philadelphia mean=3.7). However, more than half of
MYPLACE countries showed trust in the European Commission at levels above the midpoint
of the scale (Denmark, Finland, Georgia, eastern and western Germany, and Spain and
Portugal). The lowest level of trust in the European Commission is characteristic for youth in
locations within Greece, Croatia, Slovakia and Hungary. Significant differences in young
people’s levels of trust in national parliaments as well as in the European Commission
between locations within countries were more the exception than the rule. In the case of
national parliaments, differences were revealed in three countries (Latvia, Russia and the
MYPLACE August 2014
MYPLACE: FP7-266831 www.fp7-myplace.eu Deliverable 4.6 Europe wide thematic report Page 403 of 431
UK), while in case of the European Commission, differences were revealed in four countries
(United Kingdom, Latvia, Estonia and Finland).
The respondents from the MYPLACE countries who are members of the European Union (all
except Croatia (at the time of survey), Georgia and Russia), 84% stated that it was either
‘very important’ or ‘important’ for the country having membership in the European Union.
References Alter K. J. and Steinburg, D. (2007) “The Theory and Reality of the European Coal and Steel Community” in Meunier, S. and McNamara, K. R . (Eds.) Making History: European Integration and Institutional Change at Fifty. vol. 8 of The State of the European Union, pp. 89–104, Oxford University Press, Oxford; New York.
Bogdanor, V. (2007) Legitimacy, Accountability and Democracy in the European Union. A
Federal Trust report
European Commission (2013) Standard Euroabarometer 80: Public Opinion in the European
Union
Horvath, A.and Paolini, G. (2014). “Political Participation and EU Citizenship: Perceptions
and Behaviors of Young People.”
http://eacea.ec.europa.eu/youth/tools/documents/perception-behaviours.pdf
Kohler-Koch, B. (2010) Civil society and EU democracy: ‘astroturf’ representation? Journal
of European Public Policy 17(1): pp. 100-116
Micossi, S. (2008). “Democracy in the European Union.” CEPS Working Document No. 286,
Nacarino, R. C., De Corte S. and Freudenstein R. (2012) Democracy and Legitimacy in an
Economic Union: Policy Brief. Centre for European Studies
Norris, P. (2011) Democratic Deficit: Critical Citizens Revisited. Cambridge University Press:
New York
Pew Research Center (2013) The New Sick Man of Europe: the European Union
http://www.pewglobal.org/2013/05/13/the-new-sick-man-of-europe-the-european-union/
Schmidt, V. A., and Radaelli, C. M. (2004). Policy change and discourse in Europe: Conceptual
and methodological issues. West European Politics, 27(2), 183-210.
Schmidt, V, (2009) Re-Envisioning the European Union: Identity, Democracy, Economy. JCMS
Annual Review. 47: pp. 17–42
Sloam, J. (2013) ‘Voice and Equality’: Young People’s Politics in the European Union, West European Politics, (36)4: pp. 836-858
Spiro, P. J. (1997). Dual nationality and the meaning of citizenship. Emory Law Journal, 46(4):
pp. 141-1485.
MYPLACE August 2014
MYPLACE: FP7-266831 www.fp7-myplace.eu Deliverable 4.6 Europe wide thematic report Page 404 of 431
Chapter 16: Summary
This chapter provides a summary of each of the individual empirical chapters.
16.1 Political Interest: Summary
Following the dominant approach in the literature, which focuses on attitudinal as opposed
to behavioural aspects of political interest, the following definition of political interest was
adopted here: political interest is ‘curiosity, relation, attention and vigilance to political
issues and public affairs‘ (Schmid, 2004).
Political interest has been researched mainly within the framework of political activism. It
has been analysed as a factor, which influences a range of political attitudes, opinions and
forms of political activism. Political interest as a dependent variable, as a phenomenon in its
own right, has received relatively little research attention. There is no thorough
understanding of how it forms and what determines its levels. However, it is clear that the
level of political interest is very stable over the individual lifecourse and that, it forms to a
significant extent in quite early years, being strongly influenced by one’s parents and family.
Later in life, it fluctuates only as a result of very significant social disturbances and changes
such as the fall of Berlin Wall and the collapse of the Eastern Bloc in the late 1980s. Less
significant social and political events do not have sufficient weight to alter its levels
significantly.
MYPLACE data showed that the political interest of young people is divided. Across all
countries, more people reported that they were ‘not interested’ in politics than those who
reported that they were ‘interested’ in politics (58%:42%). The level varied across countries;
young people were interested in politics in some locations (in eastern Germany, Greece and
Spain) while, in other countries, they were not very interested (Croatia, Latvia, Finland and
Estonia). Youth was most interested in politics related to the country they lived in and the
municipality, they lived in. Interest was lowest towards countries neighbouring their
country. Europe and the immediate surroundings were of medium interest.
Employment, housing and environment were the three issues that were of interest for the
highest percentage of young people. The European Union, immigration and LGBT rights, in
contrast, scored lowest on the scale of political interest. Television and the Internet were
the two information channels used by young people to obtain information about politics
and public affairs. Radio and newspapers were far less popular. Levels of different aspects of
political interest vary across sites, but differences usually are not large. When sites are
ordered from highest to lowest then the differences between immediate neighbours are
incremental. In the case of most questions, no single research locations are characterised

MYPLACE August 2014
MYPLACE: FP7-266831 www.fp7-myplace.eu Deliverable 4.6 Europe wide thematic report Page 405 of 431
by exceptionally high or low values of political interest. Neither are there concrete clusters
of sites.
Across all five questions on political interest, certain sites tend to report systematically
lower or higher values. The pattern is far from deterministic and contains exceptions but
one can distinguish between sites where political interest tends to be higher and where it
tends to be lower. To give a very ‘broad brush’ ranking of sites, a cumulative scale summing
responses from the entire five question block was developed and sites were ordered
according to mean value of the index. The following 10 sites tended to have relatively high
political interest:
11. Coventry (the highest average political interest)
12. Odense East
13. Jena
14. Odense Center
15. Vic
16. Bremen
17. Sant Cugat del Vallès
18. Lumiar
19. Rostock
20. Telavi
Among the sites where political interest tends to be low, are:
11. Pescenica Zitnjak
12. Lieksa and Nurmes
13. Nuneaton
14. Narva
15. Vyborg
16. Ozd
17. Trnava
18. Rimavska Sobota
19. Sopron
20. Forstate and Jaunbuve (the lowest average political interest)
This ordering of sites was obtained from summarising responses to all items in the five
questions. This index was not used earlier and thus the ranking of sites might vary from that
presented above. When using separate questions (Q1 to Q5) for ordering the sites, there is
some variation in rankings of the places. However, sites that scored high on one of the
questions, and appeared in the group of sites with high political interest, did not score so
low on any other question such that it also appeared in the group of sites with low political
interest. The opposite was also true. To conclude, despite some variation, the sites tended
MYPLACE August 2014
MYPLACE: FP7-266831 www.fp7-myplace.eu Deliverable 4.6 Europe wide thematic report Page 406 of 431
to group in categories of low and high political interest. Detailed information is presented in
the graphs and tables above.
For multilevel analysis, the cumulative index built of responses to the first question (interest
in five different administrative/political/geographical units) was used. The level of political
interest was to a large extent explained by individual level variables (90%) and the role of
localities is small (10%). The variables, which significantly co-vary with the index of political
interest, are the following:
Level of education: higher educational attainment means also higher political
interest.
Age: higher age means also higher political interest.
Majority/minority group membership: belonging to a minority group means also
higher political interest.
Political knowledge: higher score on the political knowledge scale means also higher
political interest.
Mother’s frequency of voting: higher frequency means also higher political interest.
Father’s political interest: higher interest means also higher political interest.
Mother’s political interest: higher interest means also higher political interest.
The findings from the MYPLACE data corroborate earlier research findings about political
interest. Interest in politics is positively associated with the level of education. Education is
believed to provide an individual with the skills and knowledge that are necessary for
making sense of political situations and developments and locating oneself in relation to
them. This line of reasoning is confirmed also by the finding that people scoring higher on
the political knowledge index also scored higher on the political interest index. Age too has a
positive association with political interest. This, however, is likely to a large extent to be a
product of education – in this age group, education and age are positively correlated. The
presence of parents’ influence is in line with earlier research, which indicates the influence
of family to be of crucial importance. However, since the level of parents’ political interest
is respondent-assessed, the validity of this measure is hard to ascertain. Reasons for higher
political interest among minority groups need further research. At the present stage, it can
be hypothesised that minorities are somewhat more interested in politics and public affairs.
In this section, we analysed the level of coincidence between the political ideas of young
people and their families and peers. Through this, we can gain an idea of the role of the
environment in the political socialisation process. By measuring the declared closeness of
political views with family and peers, it was shown that, while differences are not very high,
young people tend to feel closer to their peers than their family.
The MYPLACE data set – drawing on 30 different European locations – provides the
opportunity to analyse the role of context in shaping different phenomena. In this case,
however,it seems that context does not have an important role to play in explaining how
MYPLACE August 2014
MYPLACE: FP7-266831 www.fp7-myplace.eu Deliverable 4.6 Europe wide thematic report Page 407 of 431
close or distant the political ideas and values of young people are from their families and
peers.
The analysis of the effect of different variables in defining the closeness of political ideas to
those of family and peers has shown interesting results concerning the role of political
activism. As young people participate more in political actions, they tend to share more
political views with their peers and less with their families. Thus, it seems that political
engagement facilitates the establishment of new political preferences, which are
independent of the family background.
16.2 Attitudes and Trust: Summary
In this chapter, we reported the findings of a cross-country analysis of youth attitudes
towards politicians and politics as well as trust ininstitutions.
Young people feel very much detached from politicians and tend to have a negative view of
them. Only 22% of our respondents agree with the statement: ‘politicians are interested in
young people like me’ whereas 60% agree with the statement ‘politicians are corrupt’ and
69% agree with the statement ‘the rich have too much influence in politics’. When
examined regionally, a majority of the Danish respondents actually agree that politicians are
interested in them whereas over 80% of our Greek respondents disagree.
On a 0 to 10 scale, young people tend not to trust the Prime Minister with an average value
of 4.3, parliament (4.5) and political parties (3.8) in their countries although the findings also
reveal country and regionally based patterns. The least trusting responses were
characteristic for young people from Greece, Croatia, Spain and Hungary, whereas Finland,
Georgia, Denmark, eastern and western Germany have levels of trust at the midpoint of the
scale.
The construction and testing of composite variables based on cross-country merged data
sets revealed that three items related to youth attitudes towards politics and politicians
constitute a one-dimensional scale of acceptable reliability. However, in order to reduce the
share of missing values we used only two items (Q6_2 and Q6_3) for the construction of the
‘Attitude towards politicians and politics’ scale, which also has higher reliability than the
three item scale.
Descriptive analyses revealed that young people in general have very negative attitudes
towards politicians and politics (mean=2.5, on scale from 0 to 8), whereas means scores by
locations range from 1.1 (in New Philadelphia Greece) to 4.6 in Odense Center (Denmark).
Thus, youth in almost all locations on average has negative attitudes towards politics and
politicians (with the exception of locations in Denmark and Finland where the average
MYPLACE August 2014
MYPLACE: FP7-266831 www.fp7-myplace.eu Deliverable 4.6 Europe wide thematic report Page 408 of 431
attitude is neutral). The most negative attitudes towards politicians and politics were
characteristic for youth in Croatia, Slovakia, Portugal, Spain and Greece. Descriptive analyses
did not reveal significant differences in youth attitudes towards politics by locations within
countries.
With respect to analyses related to the construction and testing of composite variables
based on cross-country merged data about youth trust in 13 different institutions and
organisations we calculated two composite scores: overall trust in institutions (9 items) and
trust in national political institutions (3 items), both of which represent good scales.
Besides these composite results we also used one item measures towards specific
institutions: trust in national parliament and trust in European Commission depending on
the topic of further analysis.
Descriptive analyses revealed that young people are, characterised by a low level of trust in
institutions. The overall mean for trust in institutions and organisations is 43.6 (on a scale
from 0 to 90), while the overall mean for trust in national political institutions is 12.5 (on a
scale from 0 to 30). In both cases only in five out of 14 MYPLACE countries do young people
in both locations show trust levels above the midpoint of the scale (in Finland, Georgia,
Denmark, and Germany (eastern and western)). The lowest levels of overall trust towards
institutions as well trust in national political institutions were characteristic for youth in
Greece, Croatia, Spain and Hungary (and Portugal in the case of trust in national political
institutions). The descriptive analyses did not reveal significant differences in young people’s
general level of trust in institutions or their level of trust in national political institutions by
locations within countries.
Regarding the trust in national parliament the results were similar, youth expressed on
average medium levels of trust in national parliaments (mean=4.5 on a scale from 0 to 10),
which varies by location ranging from 2.6 in Pescenica (Croatia) to 6.5 in Odense Center
(Denmark). At the country level, only five of the MYPLACE countries show a level of trust in
the national parliament above the midpoint of the scale (Denmark, Finland, Georgia and
both eastern and western Germany), while the lowest level of trust in the national
parliament is characteristic for youth in both locations within Croatia, Greece and Hungary.
Average levels of trust in the European Commission is slightly higher than in national
parliament (5.2 on a scale from 0 to 10), although still moderate, with the highest mean
score in Telavi ( Georgia, mean=6.6) and the lowest mean score at two locations in Greece
(Argyroupouli, M=3.5 and New Philadelphia, mean=3.7). However, more than half of the
MYPLACE countries showed levels of trust in the European Commission above the midpoint
of the scale (Denmark, Finland, Georgia, eastern and western Germany, Spain and Portugal).
The lowest level of trust in the European Commission is characteristic for youth in locations
within Greece, Croatia, Slovakia and Hungary. Significant differences between locations
within countries in young people’s level of trust in national parliaments, as well as in the
MYPLACE August 2014
MYPLACE: FP7-266831 www.fp7-myplace.eu Deliverable 4.6 Europe wide thematic report Page 409 of 431
European Commission, were more an exception than the rule. In the case of national
parliaments, differences were evident in three countries (Latvia, Russia and UK) while in the
case of the European Commission differences were found in four countries (UK, Latvia,
Estonia and Finland).
In order to explore the multivariate determinants of trust in national parliaments as well
trust in the European Commission, taking into account the nested structure of our data set,
we employed multilevel modelling. Initial results confirmed the justification of multilevel
analyses since it was demonstrated that 17% of the variance of trust in national parliaments,
and 7% of the variance of trust in the European Commission can be explained at the level of
countries. The percentage of variance which could be explained at the level of locations
within countries was much lower: 2% in case of trust in national parliaments; and 2% of the
variance in the case of trust in the European Commission. Such findings are in accordance
with the above and suggest relatively rare significant differences in youth levels of trust in
institutions between the two contrasting locations within countries. Thus, regarding the first
hypothesis according to which youth trust in national parliaments and trust in the European
Commission are differentiated by individual level characteristics as well as location and
country level characteristics, the above findings demonstrate that country level
characteristics are more important determinants of youth trust in national parliaments and
the European Commission than location level characteristics. Additionally they indicate
country level characteristics are more important determinants of trust in national
parliaments than trust in the European Commission. In further analyses we tested several
individual and country level characteristics as potential determinants of trust in national
parliaments as well as trust in the European Commission. Both regression analysis at the
individual level included the main socio-demographic variables (gender, age and social
class) and additional individual level variables, which represent more general dispositions
relevant in the context of trust in institutions such as social trust and life satisfaction, as well
as more politically relevant attitudes such as interest in politics (composite measure) and
satisfaction with democracy. Additionally, analyses of trust towards national parliaments
included a variable on ‘lack of care’ operationalised as agreement with the statement
Politicians are interested in young people like me. These individual level variables explained
29% of variance in trust in national parliaments within countries, and 19% of variance in
trust in the European Commission. This difference probably could be attributed to the fact
that the model with trust in the national parliament contained one more individual level
variable than the model with trust in the European Commission as a dependent variable,
which is, moreover, confirmed as the most important predictor of trust in the national
parliament (the variable concerning politicians’ ‘care’ about ‘young people like me’).
As the individual level determinants of trust in the national parliament analysis revealed, all
socio-demographic variables were significant29; higher trust in national parliament is more
characteristic for females as well as youth with higher and highest social class and younger
29
Due to the large N we are taking into account only variables which are significant on p<0.01
MYPLACE August 2014
MYPLACE: FP7-266831 www.fp7-myplace.eu Deliverable 4.6 Europe wide thematic report Page 410 of 431
youth. In the case of trust in the European Commission the results were similar with regard
to gender and social class; however, age was not confirmed as an important independent
predictor of trust in the European Commission. Among other individual level variables, life
satisfaction, satisfaction with democracy and interest in politics are confirmed as significant
independent predictors of trust in national parliaments as well as trust in the European
Commission. This indicates that young people who are more satisfied with life in general,
and with democracy in their country, are particularly characterised by higher levels of trust
in national parliaments as well as in the European Commission. However, it seems that the
role of interest in politics is different for the case of trust in national parliament and the
European Commission. Namely, in the case of trust in national parliaments higher levels of
trust were more characteristic for those who have greater interest in politics, while, in the
case of trust in the European Commission. those who have greater interest in politics
showed lower levels of trust. These findings might be verified by employing other
operationalisations of interest in politics such as one based not only on self-reported
political interest but also a measure of following politics in the media. Additionally, these
findings could be a result of the presence of an additional individual level variable in the
individual level model of trust in national parliaments (whether politicians are interested in
‘young people like me’).
In the second model we tested the effect of country level variables: welfare state,
corruption perception index and rule of law estimate in the case of trust towards national
parliaments; and welfare state, corruption perception index, government effectiveness and
GDP per capita in analyses of trust in the European Commission. We did not confirm
significant (p<.01) effects for these variables in the case of trust in national parliaments. In
case of the European Commission, only the effect of GDP was significant (p<.01), but this
was negligible.
Finally, in the third model we tested the interaction between one individual level variable
and one country level variable in order to test the hypothesis that the relationship between
individual level determinants of trust in national parliaments and the European Commission
depends on context (specific location or country). In the case of trust in national parliament
our hypothesis was that the effect of an individual’s perception of politicians’ interest in
young people (care about young people like me) as an individual level determinant of trust
in national parliament could depend on a country’s level of corruption (CPI). In the case of
trust in the European Commission our hypothesis was that the effect of left-right political
ideology as an individual level variable could depend on the type of welfare state. However,
we did not confirm these expectations. Thus, it might be concluded, that we did not confirm
the general hypothesis according to which the relationship between individual level
determinants of trust towards national parliament and the European Commission depends
on context (specific location or country). However, it should be stressed that this does not
mean that this general hypothesis is not correct; it only means that it is not confirmed by
those combinations of variables included in the models tested here.
MYPLACE August 2014
MYPLACE: FP7-266831 www.fp7-myplace.eu Deliverable 4.6 Europe wide thematic report Page 411 of 431
16.3 Political Activism: Summary
Of those young people eligible to vote in national elections, 71% actually did at the last
opportunity and 17% made a conscious decision not to vote. The remaining 11% reported
that they would have voted but were unable to. Locations with voting levels in excess of
80% were Podsljeme, both Danish locations, Kuopio (Finland), both eastern German
locations, Agenskalns (Latvia) and Vic (Spain). By far the lowest level of voting was in
Nuneaton (UK) where only 39% of eligible voters chose to do so, with 43% of eligible voters
deliberately choosing to stay away from the polls.
More than half of respondents (59%) declared that they did not feel close to any political
party.
In this chapter we analysed potential predictor variables of youth political activism. In order
to address this issue we opted to use multilevel regression analysis as MYPLACE data is
organised in a hierarchical structure. Individuals are nested in localities and localities are
nested in countries. One important dimension of political activism is voting behaviour. From
the multilevel analysis performed it was observed that it is in national elections that there is
a higher level of variance between localities, compared to local elections. In other words,
contextual variables have more impact in national elections than in local elections.
The results of variable coefficients allowed us to conclude that predictor variables follow
very similar patterns in the two types of elections. Older voters have higher log odds of
voting. Religion also has an influence on voting behaviour. Those who declared higher levels
of religious identity tend to demonstrate higher levels of participation in local and national
elections.
As seen in previous studies, lower levels of education, belonging to a lower social class and
minority groups decrease the log odds of voting when compared to more privileged groups,
such as those with higher education, higher social class and integrated in the ethnic
majority. Gender is one of the few predictors that appears to behave differently with
respect to national or local elections. Males have higher log odds of voting in national
elections than females, but this difference is not statistically significant regarding local
elections.
According to the literature on political efficacy, political involvement has a positive impact
on turnout rates. Our results support this statement. The increasing of political efficacy and
political involvement levels also increases the log odds of voting. Regarding contextual
variables, we can see that different political systems have different effects on voting
MYPLACE August 2014
MYPLACE: FP7-266831 www.fp7-myplace.eu Deliverable 4.6 Europe wide thematic report Page 412 of 431
behaviour. Liberal welfare state regimes tend to discourage turnout. Bicameral regimes and
proportional representation parliaments increase the log odds of participation in elections.
We have also analysed closeness to political parties among young people. According to the
data, 10% of the variance of youth closeness to political parties is explained by the
differences between localities. A more detailed analysis shows a lower predictive ability of
socio-demographic variables such as employment status, educational attainment or ethnic
belonging; none of these variables has statistically significant capability to predict the
closeness of the participants to a specific political party. However, the same is not true of
social class, it was observed, that belonging to the higher social class increases the log odds
of proximity to a political party.
Political efficacy, political involvement and trust in the political system also have an
influence on party identity; increasing levels of efficacy, political involvement and trust in
the political system result in higher log odds of feeling close to a political party. Regarding
contextual variables only cameral regimes and type of parliament representation influence
the closeness to political parties. Results suggest that living in countries with unicameral
regimes and proportional representation parliaments promote closeness to politics and
decision making and, in this way, to political parties.
The MYPLACE survey allows for extended analysis of non-electoral political actions. This is
crucial when analysing young peoples’ participation since a number of published studies
point to the diversification of the political repertoires of young people (Soler-i-Martí, 2013).
In addition, the MYPLACE data permit the study of the impact of factors at the individual
and the contextual level. This is very interesting given the huge variation in the level of
political activismacross Europe. In order to capture diversity in forms of participation, we
first have to identify different dimensions in the participation repertoires of young
Europeans. It is interesting to note that the first dimension in a factorial analysis identifies a
private and individual form of participation in which the use of the Internet or political
consumerism play important roles. This is the form of participation more prevalent among
young people. It is also the form of participation that is less demanding in time and other
costs such as exposure to the public since it usually occurs in the private sphere. The other
two dimensions of political participation that are identified capture some more classical
dimensions of political participation: traditional, and more institutional, participation (that
we have called public traditional participation); and protest actions (both legal and non-
legal). It is a minority of young people who carry out these two forms of political action.
Nevertheless, especially in the case of protest, there is great variation across countries and
locations.
Consequently, the focus of this chapter has been the explanation of differences across
locations in levels of participation. When we look at the global level of non-electoral
participation, the differences between the 30 locations in the study are huge. As an
MYPLACE August 2014
MYPLACE: FP7-266831 www.fp7-myplace.eu Deliverable 4.6 Europe wide thematic report Page 413 of 431
example, the two locations in Hungary present a level of participation 25 times lower than
some locations in eastern Germany or Spain. Some of these differences are caused by what
is called the compositional effect. That is that the different locations have different
compositions of individuals. However we have also analysed the effect of contextual
variables. We have seen that welfare regimes have an impact on participation and that the
level of membership in organisations improves the participation level of young people in a
location. We also wanted to see the effect of the economic crisis on the participation
patterns of young people. The results for the global indicator of non-electoral participation
show that the impact of the crisis in youth unemployment has a negative effect. However, it
is interesting to highlight that when we analysed protest actions specifically, the opposite
effect is found. Therefore in locations that have experienced a greater impact of the crisis,
young people participate less in global terms but tend to participate more through protest
actions. In these contexts, where the dissatisfaction with institutions is higher, young people
opt for a more confrontational form of participation.
16.4 Civic Engagement: Summary
Consistent with previous studies, our study of young Europeans aged 16-25, has shown that
there is considerable variation across countries and the variation is greater than the
variation between different locations in each of the countries. Similarities with previous
studies are also evident in terms of how the countries are ranked in relation to each other.
Young people from the Nordic countries (Denmark and Finland), clearly have the highest
levels of membership of political associations, while young people from Mediterranean
(Portugal, Spain and Greece) and post-communist countries (Hungary, Slovakia, Georgia and
Latvia) have the lowest levels.
Based on institutional theory, and consistent with previous studies, we suggest that these
differences can be explained best by the ways in which states cooperate and support
political organisations. In the Nordic countries, especially Denmark, many voluntary
associations and organisations receive direct and indirect public subsidies with the purpose
of developing associations and civic engagement. Part of the conditions for receiving
economic funding is that these associations must comply with basic rules regarding
democratic organisation and economy. This also applies to political parties. Also labour
unions are encouraged through the tax deduction that members receive for their
membership.
From an institutional perspective, it is also important how the relationship between the
state and unions has evolved historically. In former communist countries political
associations, which were in opposition to the established regime, weres banned and
citizens’ political participation was only accepted if it supported the communist regime.
MYPLACE August 2014
MYPLACE: FP7-266831 www.fp7-myplace.eu Deliverable 4.6 Europe wide thematic report Page 414 of 431
In relation to individual level variables, a surprising finding was that young women seem to
have a higher rate of membership than their male counterparts. While previous studies
have indicated a trend towards decreasing gender inequality, our research provides
empirical evidence that young women are about to overtake men in terms of their
membership of political organisations.
16.5 Effective Political Action: Summary
This chapter presents analysis conducted on the Q19 items of the MYPLACE survey, which
asks respondents to rate their perceptions of the effectiveness of a series of political
activities in influencing politics in their countries.
On a 0 to 10 scale, voting in elections received the highest mean score for effectiveness of
political action (6.9), followed by gaining publicity through media exposure (5.9) and being
active in a political party (5.4). Participating in violent and illegal protest activities are
universally regarded as the least effective with scores of 2.9 and 3.5 respectively.
The analysis proceeded in three main stages. First, we conducted a factor analysis to reduce
the number of indicators to underlying latent variables. The factor analysis produced a two-
factor solution, with Q19 items tracking on to two separate scales: perceptions of the
effectiveness of legal or nonviolent political activity; and perceptions of the effectiveness of
illegal or violent political activity. We constructed both scales accordingly for use in future
analysis. Second, we conducted a descriptive analysis of all Q19 items and scales by survey
location. Individual items and scales did exhibit clustering by locations, although it is difficult
to identify patterns without statistical tests. In general, voting in elections received the
highest mean response for effectiveness of political action, followed by gaining publicity
through media exposure and being active in a political party. Participating in violent and
illegal protest activities are the least effective.In particular, the two Georgian locations
tended to rate all Q19 items as relatively effective while Russia and the Central European
countries (including Hungary, Croatia and Slovakia) tended to be relatively pessimistic about
the effectiveness of Q19 activities. Third, we conducted a multilevel regression analysis to
explore individual-level and group-level determinants of variation in the effectiveness of
legal or nonviolent activity scale. The results of the model suggest some support for the
hypotheses that the use of the internet for information and political knowledge were
associated with increased perceptions of effectiveness of legal or nonviolent activity.
However, the model provided little support, although did not conclusively falsify, major
hypotheses about youth political activity, including those derived from economic
modernisation theory, and the hypothesis that supranational political and economic change
may lead young people to be more pessimistic about the effectiveness of constructive
political participation. In terms of the goals of the MYPLACE project, this result seems to
MYPLACE August 2014
MYPLACE: FP7-266831 www.fp7-myplace.eu Deliverable 4.6 Europe wide thematic report Page 415 of 431
indicate that accession to supranational political and economic institutions like the EU has
not had any significant effect, either positive or negative, on young people’s attitudes
toward the effectiveness of legal or nonviolent political activity. However, given the
concerns about the model elaborated above, further research is necessary to bring
additional evidence to bear on this hypothesis.
16.6 Citizenship: Summary
Global transformations of contemporary society, the formation of transnational and
multicultural flows and migration processes are changing the traditional understanding of
citizenship as the formal belonging of an individual to the nation state. In this regard, in our
study we focused on various forms of contemporary citizenship, including certain values and
experience of self-determination. Taking into account the whole variety of interpretations
and meanings, we focused on the value assets of national identity, and young people’s
views on global and local state relations in cultural, economic and political dimensions.
Formation of one’s own civic views and position, is inextricably connected with the values of
young people and perception of oneself as a citizen of one’s country. Those who are most
proud of their citizenship status30 are the young people from locations in Georgia, Finland,
Denmark and the UK with levels of pride around 90%. Approximately 60% of the young
people from Vic and Sant Cugat (both locations are in Catalonia) state that they are not
proud of their citizenship. Other locations where levels of pride in citizenship were less than
70% are: the Narva area (Estonia), Bremen (western Germany) Jena and Rostock (both in
eastern Germany), and Forstate & Jaunbuve (Latvia).
In general, in both western and eastern Germany, Denmark and Spain, young people placed
low importance on ascriptive indicators of citizenship. The strongest meaning of ethnic
citizenship was found in Vyborg (Russia). The ethnic role of citizenship is also strongly
supported in all the localities in Georgia and Greece. However, there is a strong difference
between localities in the following countries: Latvia (Agenskalns and Forstate and
Jaunbuve), Finland (Kuopio and Lieksa/Nurmes), Estonia (Narva and Tartu) and Slovenia
30 Our analysis is sensitive to nuances across our research locations where nationality, ethnicity and citizenship
have specific local connotations. The large ethnically Russian population in the Narva area in Estonia as well as
the Forstate and Jaunbuve districts in Latvia are particularly important in this respect. In addition, Coventry in
the UK is particularly ethnically diverse. Our analysis therefore uses a measure of ‘identity’ based on citizen,
nationality and ethnic status. Overall 80% of respondents can be attributed to the dominant majority30
of the
country, i.e. not belonging to any minority citizen, national or ethnic group within the country though this
varies significantly, in Estonia for example, in the Narva area only 9% are classified as part of the majority
whereas in Tartu the figure is 96%.
MYPLACE August 2014
MYPLACE: FP7-266831 www.fp7-myplace.eu Deliverable 4.6 Europe wide thematic report Page 416 of 431
(Trnava and Rimavska Sobota). In these countries, indicators of support for ethnic
nationalism between the two different localities are significantly different.
In our study there are the two opposing groups of countries: one in which a significant
majority of young respondents fully, or partially, support the policy of protectionism
(Greece, Croatia , Slovakia and Portugal); and a second comprising those who do not agree
with it (eastern and western Germany, Denmark). For example, 77-79% of respondents in
the two localities in Greece support the idea that the state should protect its national
economy by limiting imported goods. In contrast, for example, in eastern Germany, the
proportion was only 12%. Support for the protection of sovereignty ranges from 19% in
Narva (Estonia) to 80% in New Philadelphia (Greece). The idea that the ‘country should
follow its own interests even if this leads to conflicts with other nations’, is supported by the
majority of respondents in locations in Georgia, Greece, Hungary and Portugal.A significant
majority do not agree with this position in Spain, eastern and western Germany.
The highest percentage of those who support restrictions for foreigners, for example, on
their right to purchase land, is in Hungary (from 58% to 64% of the respondents in both
localities). A similar view is supported in Georgia and Slovakia. In general, throughout the
whole dataset, this view is supported by 29% of young people. Thus, for example in eastern
Germany, in Jena, only 1% of people support this view. In eastern and western Germany,
Denmark and Spain, a significant majority did not agree with it.
Finally, an important factor in the understanding of citizenship is the evaluation of
membership of the EU. The overall results of the study demonstrated young people’s
support for such integration (the total percentage of the full or partial agreement was 72%).
The highest rate was found in Bremen (westernern Germany), the lowest - in Ozd (Hungary)
and Rimavska Sobota (Slovakia) - 27%. A significant majority of young respondents positively
evaluate EU membership in eastern Germany, western Germany and Spain. However, in
Greece, Croatia and Hungary young people mostly disagree with it.
If we sum up these trends, we can identify a cluster of countries where most young people
share the idea of the nation state in its classical sense: Greece, Hungary, Slovakia, Portugal,
Georgia. There is also a group of countries where young people prefer other state
formations that are not rooted in the protection of "national interests”.
The availability of foreign films, music and books contributes to the development of national
culture received the greatest support in Coventry (UK). Again, there is a clear difference
between countries where a significant majority of young people see the positive impact of
foreign cultural models on the development of national culture (Portugal, eastern and
western Germany, UK) and countries, where young people do not support this view (Russia
and Georgia).
MYPLACE August 2014
MYPLACE: FP7-266831 www.fp7-myplace.eu Deliverable 4.6 Europe wide thematic report Page 417 of 431
In our further analysis, using Multilevel Modeling, we analysed three models, which, in our
opinion, have the strongest differentiating impact on the approach to citizenship: support
for ‘ethnic nationalism‘; ’the importance of the country’s membership in the EU‘; and ‘the
importance of the protection of national sovereignty’.
The first model was based on the analysis of social factors that lead to young people’s
support for ethnic nationalism. It should first be noted that there is an intersection of
ethnic, civil and cultural indicators of citizenship. Thus, the ability to speak the national
language and its relevance for civic nationalism, is associated with ethnic nationalism.
Contextual characteristics of the position of the country and its well-being increase or
decrease the probability of ethnic nationalism. Of the contextual variables included in our
model, the country's GDP per capita has the highest impact on the importance of ethnic
citizenship: the higher the GDP, the higher the support for ethnic nationalism.
Being a citizen of the country and belonging to the dominant ethnic group increases the
probability of ethnic nationalism. The importance of the status of citizenship for a young
person is in a significant linear relationship with support for the concept of ethnic
nationalism. The lower it is, the lower the importance of ethnic characteristics of citizenship.
There is also a direct relationship between negative attitudes towards minorities and
preference for the ’ethnic concept‘ of citizenship. In contrast, the positive experience of
inter-ethnic interaction and wider inter-ethnic networks reduces the relevance of the ethnic
concept of citizenship.
Young people’s support for a closed image of the nation state, strict control of migration,
protection of the national economy against global economic flows and segregation of
migrants increase the probability of ethnic nationalism. Contrary to our expectations, the
post-socialist status of the country was not significant. However, support for totalitarian or
autocratic state forms reinforces ethnic nationalism.
The socio-demographic characteristics of the respondents (education, gender, age,
employment, social class) have no significant effect on the adoption of the ethnic concept of
citizenship.
The second model was based on the assessment of the importance of EU membership.
Confidence in pan-European or supra-national political institutions has an interesting effect
on the evaluation of membership of the EU. Trust in the European Commission leads to
support for EU membership. However, the same trend is found in relation to the national
political institutions (government, parliament, political parties).
MYPLACE August 2014
MYPLACE: FP7-266831 www.fp7-myplace.eu Deliverable 4.6 Europe wide thematic report Page 418 of 431
Violation of human rights in the nation state only reduces positive attitudes towards
membership of the EU. This may occur due to the general loss of confidence in social
institutions as providers of human rights. A positive attitude towards EU membership not
only increases social capital (employment, social class), but also a subjective view
onmaterial well-being and the overall level of satisfaction with life.
The importance of both civic and ethnic nationalism increases the positive attitude towards
EU membership. Again this confirms the importance of both ’ethnic‘ and ‘civic’ components
in the understanding of citizenship.
At the same time, support for a democratic political system and the lack of anti-migrant
sentiments also leads to the positive assessment of membership of the EU. This may create
the basis for the further construction of transnational identity.
The third model is based on the understanding of the prioritisation of national sovereignty.
Support for the idea of sovereignty is directly related to the xenophobic attitudes of our
respondents. Strong anti-migration sentiment leads to stronger support for the protection
of the ‘national interests‘, such as the need to be guided by public interest despite possible
conflicts with other countries (and this applies both to the political and economic
sovereignty). At the same time, belonging to the dominant ‘group’ and satisfaction with the
status of a citizen of the country increase respondents’ agreement with the dominance of
state interests. The level of trust in the national political institutions also has an interesting
effect; a low level of trust increases the will for political and economic sovereignty
In contrast, the factor of the country's financial well-being is very significant; the more
financially successful the state, the less support for the idea of the national sovereignty.
Moreover, it is macro-economic indicators that are important here - individual poverty or
wealth do not play a key role. Similarly, an increasing level of satisfaction with life in general
reduces the importance of the protection of the sovereign rights of the state.
16.7 Social networks, gender relationships and sexuality:
Summary
The scale expressing the level of trust in society indicated highest levels of trust in Finnish,
western German and Portuguese locations, while Greece, Russia, Slovakia and Georgia had
the lowest mean values for level of trust in society. This scale was also used as a dependent
variable in the multi-level model, which identified respondents from Mediterranean
countries as more likely to develop a high level of trust in society. However, Greece was
located in the bottom third of all participating countries when it comes to mean trust
MYPLACE August 2014
MYPLACE: FP7-266831 www.fp7-myplace.eu Deliverable 4.6 Europe wide thematic report Page 419 of 431
scores. As the survey was conducted in a period when Greece was hit particularly hard by
the Euro crisis and the stability of the government and market were undermined the low
level of trust measured is comprehensible.
When it comes to the frequency of meeting friends in person, the Mediterranean countries
as well as Portugal had the highest rates. However, in all locations the majority reported
meeting their friends at least once a week.
Media technologies were used with higher duration in the UK, Georgia, Russia and Croatia,
while Latvian and eastern German field sites had more respondents using technologies for
shorter periods. However, the survey asked for the duration of technology usage for social
contacts, not for frequency, which might produce different results.
The question battery Q34 was added to a scale indicating the diversity of respondents’
network of friends. Portugal, the UK and Germany (eastern and western) had the highest
mean values. The UK and Germany have a high share of migrants, this might be one reason
for more heterogeneous social networks. Georgian and Hungarian respondents had the
most homogeneous circles of friends.
The most positive attitudes towards women`s role in society and homosexuals were
expressed in the Nordic countries (Denmark, Finland) as well as Spain and Germany.
In Georgia, Greece, Slovakia and Russia, gender based inequality tends to be supported by
the interviewed youths. Rejecting equality for homosexuals was, most often expressed in
Greece, Latvia and Georgia.
Women`s access to abortion is most supported in eastern Germany, Spain and Estonia.
Young people in locations in Russia, Greece and Georgia were the most likely to disapprove
of women’s access to abortion.
The multi-level model testing influences on trust in society revealed that 17% of variance
could be explained at the level of locations. Thus, the context variables were of special
interest. In sum, a country`s welfare state system, the rigidity of the regulation of its market
and juridicial system are decisive aspects when it comes to shaping people`s trust in society.
Additionally, individual economic aspects as well as age play an important role.
16.8 Religion: Summary
Measuring religiosity is a difficult task due to the variety of components that it includes. In
the present survey we used an eleven-point scale where respondents categorised
themselves based on whether they believed they were religious or not. From the
comparative analysis of results, different clusters of countries appeared according to their
MYPLACE August 2014
MYPLACE: FP7-266831 www.fp7-myplace.eu Deliverable 4.6 Europe wide thematic report Page 420 of 431
level of religiosity. Georgia, Greece, Croatia and Russia were part of the cluster which
exhibited high scores on religiosity, whereas eastern Germany, Spain and Denmark
constituted the cluster with low levels of religiosity.
Regarding the frequency of attending religious services, Georgia, Croatia and Greece were
again those countries characterised by high levels of frequency of attending religious
services, whereas Finland, Estonia and Denmark belonged to the cluster exhibiting low
levels of frequency.
Georgia and Greece were the countries in which, overall, higher levels of agreement with
the statement that there is only one true religion were encountered; eastern Germany
demonstrated the lowest levels of agreement. Along the same lines, New Philadelphia in
Greece scored highly in ‘strongly agreeing/agreeing’ with the the statement that good
politicians believe in God. The results of the analysis of responses to that statement showed
that there was significant differences both within and between countries. Eighty three per-
cent of the respondents from Sant Cugat, Spain, ‘strongly agreed or agreed’ that religious
leaders should have no influence on government decisions, whereas 34% of the
respondents in Nuneaton, UK ‘strongly agreed or agreed’ to the aforementioned statement.
Again, three clear clusters of locations were identified, with locations in Spain, Greece and
western Germany agreeing that religious leaders should have no influence on government
decisions. Locations in the UK were in the top third disagreeing with the statement.
Fifty three per-cent of the respondents in Sant Cugat in Spain, ‘strongly agreed or disagreed’
with the statement that none of the major religions have any truths to offer while only 4% of
the respondents in Telavi in Georgia ‘strongly agreed or agreed’ with this statement. Spain,
Finland and Latvia constituted the cluster of countries that agreed more with that
statement, whereas Georgia and UK presented high scores of disagreement.
Regarding the most significant determinants of religiosity, the analysis verified our original
hypotheses. More specifically, gender turned out to be a variable that affects levels of
religiosity, as women appeared more religious than men. Numerous surveys have
repeatedly argued that women are characterised by high levels of religiosity and this
explains the fact that in every piece of quantitative research the gender variable is included
(Stark, 2002:496).
As expected and stated in our original hypotheses, Muslim respondents appear more
religious. Orthodox Christians follow, along with Catholic and Jewish respondents.
Protestant respondents expressed religiousness to a somewhat lesser extent than others
declaring belonging to a faith group, although their religiosity was still significant.
Finally, being a part of a minority group increases one’s level of religiosity. This mainly
applies to immigrants who are equipped with different social and cultural capital compared

MYPLACE August 2014
MYPLACE: FP7-266831 www.fp7-myplace.eu Deliverable 4.6 Europe wide thematic report Page 421 of 431
to the native population and thus try to preserve it and to communicate it to the next
generations in order to maintain their collective memory and identity. Religion in this
process of assimilation plays a crucial role and is vital in the process of crafting an identity.
Religion is not a trait or a characteristic that is strongly associated with a country or a certain
place, and thus helps the people in a country to overcome isolation and marginalisation.
Furthermore being active in religious activities and organisations enables the process of
socialisation and provides people with opportunities for civic engagement and social action.
Finally, when religion is a prominent component of a person’s identity and much of
everyday life is organised around these needs, then it is possible that other differences that
mark an individual’s marginalised place in society, are less pronounced.
16.9 Attitudes towards Minority Groups: Summary
The MYPLACE survey shows that young people’s attitudes towards minorities differ from
country to country, and from locality to locality. Young people in Western European
locations, especially eastern Germany, are least likely to have negative views towards
different minority groups and to prefer limiting access by immigrants to a range of
resources. Young people in post-socialist locations, along with Greek locations, have more
negative attitudes and are more likely to be exclusionist towards immigrants. Nevertheless,
in some countries there are large differences between localities, for example, in Latvia and
Finland.
The most negative attitudes are towards the Roma, particularly in in Hungary, Slovakia,
Greece and Russia where there is a considerable Roma minority, as well as Lieksa and
Nurmes (Finland). Attitudes towards Jews are more positive than negative. The most
negative young people can be found in Ozd (Hungary), Trnava (Slovakia), Aegyroupouli
(Greece), and Vyborg (Russia). Attitudes towards Muslims are similarly positive; however
there are localities where negative views towards them are quite widespread: Vyborg
(Russia), Trnava (Slovakia) and Sopron (Hungary).
Young people in Greek locations are much more likely than others to have xenophobic
attitudes; this should be seen in the context of Greece having taken a large proportion
those fleeing unrest from the ‘Arab Spring’. Limiting immigration would also be supported
by young people in Vyborg (Russia), Bareiro (Portugal), Trnava (Slovakia), and Nuneaton
(UK), whereas German locations are clustered at the bottom of the xenophobia scale.
Hungary, Russia and Georgia are at the top of the welfare chauvinism and exclusion scale;
here young people favour limiting access by immigrants to various resources. Interestingly,
Nuneaton youth in the UK tend to be much more xenophobic, welfare chauvinist and
exclusionist than youth in Coventry.
MYPLACE August 2014
MYPLACE: FP7-266831 www.fp7-myplace.eu Deliverable 4.6 Europe wide thematic report Page 422 of 431
One of the strongest predictors of negative attitudes towards minorities, xenophobia,
welfare chauvinism and exclusionism is ethnic nationalism. Like other studies, we also find
that all these negative attitudes are more widespread among men, and among those who
are less educated, whose families are struggling financially and whose parents do not belong
to the highest social class. This can be linked to a higher level of insecurity and perceived
competition. Moreover, perhaps linked to that, we find that young people who are
employed are more likely to have such attitudes rather than those who are not employed.
Age, on the other hand, does not help to explain negative attitudes towards minorities;
contrary to psychological theories, we find that young people are not more likely to have
such negative views as those who are older.
In line with the ‘cultural affinity thesis’, the analysis confirms that negative attitudes
towards minorities are more common among the dominant ethnic group than among those
who belong to minorities themselves, regardless of citizenship status. However, controlled
for ethnic group, those born outside the country tend to have more negative attitudes
towards minorities. This relationship is intriguing, and there could be several explanations
for it, such as cultural differences or perceived inter-group conflict or competition.
The analysis confirms the role of information in lessening prejudice towards minority
groups: those who are more interested in, and better informed about, politics are less likely
to hold negative attitudes towards minorities. A frequent use of different media channels is,
however, strongly linked to negative attitudes towards minorities, xenophobia, welfare
chauvinism and exclusionism, which shows that the media are at least partly responsible for
the recent spread of populism and far right attitudes in Europe.
The data also confirms the ‘contact hypothesis’; personal contact with minorities decreases
negative attitudes towards minorities and immigrants. Similarly, overall distrust in people
and the government facilitates all kinds of negative attitudes towards minorities and
immigrants.
We also find strong support for the ‘realistic group conflict’ theory. Not only are those who
are poor also more xenophobic and likvely to have more negative attitudes towards
minorities, but the overall situation in the area matters too; in poorer areas such views are
more widespread. At the same time, the effect of GDP growth during the crisis is
insignificant. It shows that resource stress is mainly experienced based on the economic
conditions young people see around them, not general macro-economic developments.
Xenophobia and welfare chauvinism is more widespread where immigration rates are
higher, lending further support for resource stress and competition thesis. Finally, liberal
regimes are more likely to produce such attitudes. Thus the dismantling of the European
Social Model observed during the recent economic crisis risks facilitating the spread of anti-
immigrant attitudes across European youth.
MYPLACE August 2014
MYPLACE: FP7-266831 www.fp7-myplace.eu Deliverable 4.6 Europe wide thematic report Page 423 of 431
16.10 Democracy: Summary
In this chapter, we reported the findings of cross-country analyses of the MYPLACE survey,
in which young people’s understandings of democracy are analysed.
A descriptive analysis of Satisfaction with democracy shows that the overall mean across all
30 locations is exactly in the middle of the scale (5.0), but satisfaction varies from country to
country and between locations. There were clear clusters of locations; with locations in
Denmark, Finland, eastern and western Germany all having higher levels of satisfaction with
democracy. Mediterranean countries including Greece, Spain and Portugal have lower levels
of satisfaction with democracy.
An ordinal by ordinal Gamma correlation of Attitudes towards various forms of political
systems (Q43) suggested that two separate scales were formed, one which focused on
Democratic Political System and another which focused on Autocratic principles. Results
showed that young people in locations in Denmark and eastern Germany had more positive
views towards democratic political systems. Respondents in locations in Russia, Latvia and
Slovakia were less positive towards democratic political systems. Both locations in Georgia,
Croatia, the UK and Portugal have more positive opinions towards a non-democratic form of
political system (with autocratic principles ). Both locations in Germany (western and
eastern), Finland and Spain were more negative towards autocratic principles.
A factor analysis showed that all eight items for question 44: Justification for violence are
loaded under a single factor with excellent reliability (α = 0.928). The overall mean for
justification for violence was generally low (9.7 out of a possible 32). Both locations in
Russia, Croatia, and the UK were in the top third, stating that violence is ‘more justified’,
with locations in Latvia, Denmark, Finland and Estonia stating that violence is ‘less justified’.
Items in question 45: Attitude towards social justice and the economy were analysed
individually, because when combined the reliability of these factors was low, with Cronbach
alpha values less than 0.4. This suggests that there are contradictions between respondents’
ideological views in terms of socialist principles (items 2 and 3), and free-market principles
(items 1 and 4). Both locations in Georgia, Greece and eastern Germany stated that they
disagreed that the unemployed should have to take any job available or lose their
unemployment benefits. Both locations in Portugal, Denmark and Hungary are in the top
third and stated that they should. Most young people in the two Georgian locations stated
that Private ownership of business and industry should be increased. Both locations in
eastern Germany and Greece are clustered in the top third disagreeing that Private
ownership of business and industry should be increased. There are clusters of locations,
with locations in Greece, Spain, Hungary, Russia and Slovakia all in the top third, agreeing
MYPLACE August 2014
MYPLACE: FP7-266831 www.fp7-myplace.eu Deliverable 4.6 Europe wide thematic report Page 424 of 431
that Competition is harmful, it brings out the worst in people. When ordered by ‘disagree’
and ‘strongly disagree’, locations in Denmark and Germany (western and eastern) are
clustered in the top third disagreeing that competition is harmful. There are clear clusters of
locations, with young people’s views on Incomes should be made more equal, with
locations in Greece, and Germany (eastern and western) all in the top third, agreeing that
incomes should be made more equal. When ordered by ‘disagree’ and ‘strongly disagree’,
locations in Denmark, Georgia and Estonia are clustered in the top third disagreeing that
Incomes should be made more equal.
A factor analysis of these items showed that all three items are loaded under a single factor
with excellent reliability (α = 0.866) for Freedom of speech. Both locations in Portugal,
Denmark, Greece and Estonia all in the top third, stating that freedom of speech should
always be allowed. Germany (western and eastern), Latvia and Hungary are clustered in the
bottom third.
There is a large variation of views regarding respect for human rights. Both locations in
Finland, Denmark and Germany (eastern and western) are all ranked in the top third, stating
that there is respect for human rights. Both locations in Georgia, Greece and Slovakia are in
the bottom third when stating there is no respect for human rights. Both locations in Greece
had the highest proportion of young people stating there is ‘no respect at all’ (22% and
24%).
An index ranging from zero to five, where a higher score in the index indicates greater level
of discrimination/sense of insecurity in society, were constructed for the five items in the
question on Self-perceived discrimination (Q48). Overall levels of discrimination are low;
with a mean for sense of insecurity in society of 0.4. When ranked, locations in Croatia, the
UK, Russia, eastern Germany, and Slovakia are all in the top third, with higher levels of sense
of insecurity/ discrimination. Portugal, Hungary and Georgia are clustered in the bottom
third with lower levels of sense of insecurity/discrimination.
Opinions on the death penalty (Q49) vary from country to country, with locations in
Georgia, Denmark and Greece all in the top third, stating that the death penalty can ‘never
be justified’. However, Locations in Hungary, Estonia, Latvia, and Slovakia are clustered in
the bottom third with more respondents stating that the death penalty ‘can be justified’.
In order to explore multivariate determinants of Satisfaction with democracy, taking into
account the nested structure in our data set, locations within countries, we employed
multilevel modelling (MLM). The initial analysis of variance components in the ‘empty’
model revealed that 78% of the variance in young people’s ‘satisfaction’ with democracy
can be explained by differences between individuals and that 23% of the overall variance, in
the ‘satisfaction’ with democracy, lies at the level of localities. The substantial variation at
local level justifies the reason for using multilevel analysis in our data. The model confirmed
MYPLACE August 2014
MYPLACE: FP7-266831 www.fp7-myplace.eu Deliverable 4.6 Europe wide thematic report Page 425 of 431
that young people reporting greater political knowledge, satisfaction with life, trust in
parliament, trust in politicians, general trust in people, and positive evaluation of the
country’s human rights situation have a statistically significant higher level of ‘satisfaction’
with democracy. Young males, those with greater involvement with political activities, older
young people, those having parents from upper social class, and those ‘not religious’
appeared to have a statistically lower level of satisfaction with democracy. At a contextual
level, the youth unemployment rate of a country did not appear to have a statistically
significant relationship to young people’s ‘satisfaction’ with democracy, but welfare state
type did have a significant association with ‘satisfaction’ with democracy. Compared to
those from post-socialist countries, young people from Nordic and Conservative type
countries appeared to have significantly greater ‘satisfaction’ with democracy.
16.11 History and Memory: Summary
Young people are interested in recent history, with 29% stating that they are very interested
and 56% a little interested . Respondents consider World War II and membership in the
European Union the most important from their countries’ perspectives among the listed
events and periods, and NY terrorist attacks September 9th 2011 and the Holocaust the
least important.
The reported importance of different historical events shows that respondents consider
World War II (85%) and membership in the European Union (84%) to be ranked highest
from their countries’ perspectives among the listed events and periods. The NY terrorist
attacks of September 9th 2011 (41%) and the Holocaust (52%) are less likely to be seen as
important. There is, however, massive location variance in these figures, for example the
importance of the holocaust varies from a low of 18% in Lieksa/Nurmes (Finland) to 91% in
Jena (eastern Germany). Locations where the importance of the holocaust is greater than
60% are: Nuneaton and Coventry (both in the UK), Vyborg (Russia), Sopron (Hungary),
Rostock, Jena, Bremerhaven and Bremen, i.e. all four German locations.
Our hypotheses concerning the independent variables detailed in the introductory section
are verified by the outcomes of regression models.
The locations, socio-demographic and political characteristics variable’s impact politics-
related activities the most (22%) and the importance for commemorating the past the least
(17%).
Among locations, the Lieksa/Nurmes Finnish location did not have significant effect in any
of the three models. The impact of Tartu (EST) and Bremerhaven (GER-W) was not
significant in the first two models, and the same applies to the Narva area (EST), Bremen
(GER-W), Podsljeme (CRO) and Jena (GER-E) with regard to Model 2 and Model 3, while
MYPLACE August 2014
MYPLACE: FP7-266831 www.fp7-myplace.eu Deliverable 4.6 Europe wide thematic report Page 426 of 431
Agensalns (LAV) was not significant in Model 1 and Model 3. We can state that the
perception of history and the past is, influenced the least in the Finnish, Estonian and
western German locations (non significant effect).
Three locations had significant roles: Rostock (GER-E) had significant positive beta values in
Model 1 and Model 2 and the same applies to Nuneaton (UK) and Kupchino (RUS) with
regard to Model 2 and Model 3. We can conclude that we are more likely to find a higher
level of importance attached to historical events and commemorating the past if
respondents live in any of these three locations.
According to our results, two socio-demographic variables determine respondents’ relation
to the historical past. Parental social class and belonging to the majority society significantly
increase the importance of historical events and commemorating the past. The sex variable
had a significant effect in Model 1 and Model 2 but women tend to attache importance to
historical events while men favour history-related activities.
The perception of the importance of history, the past and historical
memory/commemoration is clearly influenced by political relations; the level of political
knowledge, interest in politics and the support of mainly soft political actions as a means for
influencing politics had significant effects in all three models. A major finding is that past-
related activities participated in characterise those the most who are dissatisfied with
democracy and are right-wing. In contrast being left-wing increases the likelihood of
attaching a higher level of importance to history and commemoration.
16.12 European Issues: Summary
In this chapter, we reported the findings of cross-country analysis of respondents’ attitudes
towards European Issues.
Young people are interested in issues to do with Europe with 58% of young people stating
they are either ‘very interested’ or ‘quite interested’ in European Issues. Young people in
Portugal had the largest proportion of respondents (Lumiar = 84%, Barreiro = 78%) who
were ‘interested’, followed by eastern Germany (Jena and Rostock).
The average level of Interest in the European Union across the respondents was 5.45 (on a
scale from 0 to 10), which is slightly below the mid-point of the scale. The highest mean
score was in Telavi (Georgia) at 7.5 followed by Kutaisi (Georgia) at 7.1. Mediterranean
countries of Portugal, Spain and Greece, together with Germany (both eastern and western)
all have interest levels higher than the mid-point of the scale.
MYPLACE August 2014
MYPLACE: FP7-266831 www.fp7-myplace.eu Deliverable 4.6 Europe wide thematic report Page 427 of 431
The Average level of trust in the European Commission is slightly higher than in national
parliaments (5.2 on a scale from 0 to 10), although still moderate, with the highest mean
score in Telavi (Georgia, M=6.6) and the lowest mean score in the two locations in Greece
(Argyroupouli, mean=3.5 and New Philadelphia mean=3.7). However, more than half of
MYPLACE countries showed trust in the European Commission at levels above the midpoint
of the scale (Denmark, Finland, Georgia, eastern and western Germany, and Spain and
Portugal). The lowest level of trust in the European Commission is characteristic for youth in
locations within Greece, Croatia, Slovakia and Hungary. Significant differences in young
people’s levels of trust in national parliaments as well as in the European Commission
between locations within countries were more the exception than the rule. In the case of
national parliaments, differences were revealed in three countries (Latvia, Russia and the
UK), while in case of the European Commission, differences were revealed in four countries
(United Kingdom, Latvia, Estonia and Finland).
The respondents from the MYPLACE countries who are members of the European Union (all
except Croatia (at the time of survey), Georgia and Russia), 84% stated that it was either
‘very important’ or ‘important’ for the country having membership in the European Union.
MYPLACE August 2014
MYPLACE: FP7-266831 www.fp7-myplace.eu Deliverable 4.6 Europe wide thematic report Page 428 of 431
Appendix A: Guidance Document (preparing combined data
for the thematic report)
MYPLACE
MYPLACE WP4 D4.6: Europe wide thematic reports
Guidance Doc (preparing combined data for the thematic report)
1. Background
This document is related to the Deliverable 4.6 (the last deliverable under WP4) for which
we need to produce a Europe wide thematic report. Each team has been allocated a theme
(including the variables associated with that theme) in our meeting at Slovakia. Each team
needs to work on the assigned theme by using the combined survey dataset. Since this
deliverable requires us to use all data across the participating countries, we need to pay
some special attention in terms of data preparation and analysis.
The purpose of this brief document is to describe the basic procedures we need to follow to
prepare the data before carrying out statistical analysis on each assigned theme. Here we
would like to emphasis the following two aspects:
This doc does not suggest the kind of statistical analysis (univariate, bi-variate, and
multivariate) each partner undertakes for their particular theme.
We anticipate that where teams have the statistical expertise that they will
undertake multivariate modelling, particularly in such a way as to use the case
study aspect of the research design. They may not need help from this guidance
doc as they routinely follow these procedures (and others) as part of standard
practice for cross-country/location wise data analysis. This doc is prepared for less
advanced users. For that reason, we have kept the procedures as simple as possible
and in some cases we have kept it to the minimum.
2. Three-step procedure for preparing data
In this section, we describe a three-step procedure that we can follow as part of preparing
data for cross-European analysis on each theme.

MYPLACE August 2014
MYPLACE: FP7-266831 www.fp7-myplace.eu Deliverable 4.6 Europe wide thematic report Page 429 of 431
Step-1
Although the combined dataset all partners receive will contain harmonised variables, it will
be useful to do a quick check on the following aspects in the combined dataset. In this
regard, partners do not need to examine all variables in the dataset. Instead, they need to
focus only on those variables which they will use in their analysis for the assigned theme.
Coding: Codes for a variable are consistent across all countries in the combined
dataset
Missing values: Missing values are consistent and defined accordingly across all
countries in the combined dataset
Code range: There is no out of range code (as per the code plan) for a variable across
all countries in the combined dataset
What to do if problem exist?
It is to be emphasised that we all have checked those aspects before as part of cleaning data
(Deliverable 4.5) for individual country. We have followed a common strategy for that
purpose and therefore, we normally do not expect these issues to arise in the combined
dataset. However, if we notice any inconsistency in the combined dataset, we need to
identify the country, contact them, and resolve these issues with them before carrying out
any analysis. It might be useful to let CRRC know these issues and the solutions you are
taking so that Tina can amend them (if required) in the ‘master copy’ of the combined
dataset.
Step-2
We know that most of the questions in the survey are commonly asked to all countries.
However, there are some situations where national variance was allowed (for example,
items 7 and 8 from Q40). As part of preparing combined data for cross-national analysis, we
need to identify (if any) those variables (under a particular theme) which are applicable to a
specific country. As per the decision taken in the meeting in Slovakia, the partners need to
drop (if any) these variables from the analysis of data.
Step-3
Partners are encouraged to check the potential for developing scales/indices from the
variables they will be analysing under the assigned theme. This will help reduce the number
of variables they require in the final analysis. It is noted here that in the analysis of data for
the country specific report (Deliverable 4.5), all partners have examined this aspect and
developed scales/indices from their own country data. Partners need to do the same here.
MYPLACE August 2014
MYPLACE: FP7-266831 www.fp7-myplace.eu Deliverable 4.6 Europe wide thematic report Page 430 of 431
The only difference is that now they need to develop scales/indices on the combined
dataset. For this purpose, partners are suggested to consult the guidance doc titled
['Construction of scales/indices' (Background doc—UK Data Analysis)] which we circulated
to them as part of the guidance for Deliverable 4.5.
For a quick reference, we highlight below the main points for constructing Likert scales (see
the guidance doc for further detail):
Checking uniformity of the code for an item under a potential scale across all
countries. This should not be a problem as we all have maintain a common coding
scheme. If problem exists, coding for scale items needs to be done uniformly on
combined dataset.
Making sure all positively and negatively worked items under a potential scale are
coded correctly (see previous guidance doc for further info) and uniformly across all
countries. If problem exists, coding for scale items needs to be done uniformly on
combined dataset.
Running factor analysis on the combined dataset to examine factor structure and
checking internal consistency of items under a factor by Cronbach Alpha. In this
regard, we may have three different situations:
a) Items under a factor can be described meaningfully (by a name/concept) and
items have good internal consistency (measured by Cronbach Alpha with a
minimum value of 0.70). In this situation, we create a summated scale (by
adding scores for all items under a factor). We use this scale in the
subsequent cross-European analysis.
b) Items loaded under a factor can be described by a meaningful concept but
internal consistency of the items are not satisfactory (Cronbach Alpha value
less than 0.70). In this situation, we can think about three possible solutions:
drop those items from the subsequent analysis (if too many variables for
the team to consider under a theme, this option might work better),
use individual item in the subsequent analysis (may be a good strategy if
it relates to an important variable in the study and/or teams have only a
few variables under their assigned theme), or
calculate factor scores (can be obtained by choosing an option available
whilst running factor analysis) and use these scores in the subsequent
analysis. It is to be noted that although factor scores are very useful for
MYPLACE August 2014
MYPLACE: FP7-266831 www.fp7-myplace.eu Deliverable 4.6 Europe wide thematic report Page 431 of 431
running multivariate analysis, they may not be as informative as the
summated scale if they are to be used for calculating measures of central
tendency (e.g. mean) for comparing countries.
c) Items loaded under a factor (or just one item under a factor) cannot be
described meaningfully (irrespective of the level of internal consistency).
Two possible solutions: (a) drop those items from the subsequent analysis (if
too many variables under a theme, this option might work better), or (b) use
individual item in the subsequent analysis (may be good strategy if it relates
to an important variable in the study and/or only a few variables available to
explore under a particular theme).
In addition, as part of analysing data for country specific report (Deliverable 4.5), partners
have constructed a number of indices. For the thematic Europe wide analysis, partners are
also suggested to consult the same guidance doc and construct similar type of indices (from
variables under their assigned theme where possible) from the combined dataset.
3. Main points and future analysis
The steps described above will help preparing data, which will be required for conducting
statistical analysis of variables (under a theme) at a later stage in the combined dataset.
However, we need to acknowledge that the development of a scale (and/or examining its
psychometric properties)/indices is not as simple and straightforward as we have described
above. More sophisticated analysis including the testing of validity may be required for
publishing results in referred journals. More specifically, the analysis suggested here for
examining factor structure and reliability of scales could be extended to individual country
(including two locations in a country) level data. This would allow us to examine how and to
what extent factor structure and reliability of a scale obtained from the combined data
varies from the country or location specific dataset. Therefore, anybody interested to
develop more robust scales/indices by further extending the analysis are most welcome.
However, taking into account a range of factors (audience of this report, time, resource
etc.); we set a minimum threshold described in this doc, which we all aim to achieve for
maintaining quality of analysis in this report.