The use of Magnetic Resonance Imaging to Model Breast Compression in X-ray Mammography for MR/X-ray...
11
The use of Magnetic Resonance Imaging to Model Breast Compression in X-ray Mammography for MR/X-ray Data Fusion Christian P. Behrenbruch 1* , Kostas Marias 1,2 , Margaret Yam 1 , J. Michael Brady 1 , Ruth E. English 3 : {cpb,jmb}@robots.ox.ac.uk 1 Medical Vision Laboratory (Robotics), Oxford University, Parks Rd, Oxford OX1 3PJ, United Kingdom 2 Department of Surgery, Royal Free and University College Medical School, UCL, London NW3 2QG, UK 3 Breast Care Unit, Churchill Hospital, Oxford OX3 7LJ, UK 1. Introduction X-ray mammography and contrast-enhanced Magnetic Resonance Imaging (MRI) provide complementary pathological information for breast cancer diagnosis and surgical/treatment planning. MRI provides good tissue specificity (whether or not the breast is compressed) via a pharmacokinetic model of contrast enhancement, whilst X-ray mammography has spatial resolution and image formation physics capable of providing information about curvilinear structures, tumour spiculation and microcalcifications. In this paper we present a method for data fusion between MRI and X-ray for the purposes of surgical planning. The objective is to register cranio-caudal (CC) and medio-lateral (ML - oblique) mammograms to equivalent geometric projections of a contrast-enhanced MRI (Gadolinium-DTPA) volume to enable feature correspondence to be made between modalities. However, rather than use a simple intensity-based projection, we exploit voxel gadolinium uptake (Hoffman et. al. 1995) to produce a pharmacokinetic projection of the tissues. The result is effectively an uncompressed “pseudo X-ray” that features functional, rather than structural information about breast tissues. An example of such a projection is
Transcript of The use of Magnetic Resonance Imaging to Model Breast Compression in X-ray Mammography for MR/X-ray...
The use of Magnetic Resonance Imaging to Model Breast Compression in X-ray Mammography for MR/X-ray Data Fusion
Christian P. Behrenbruch1*, Kostas Marias1,2, Margaret Yam1, J. Michael Brady1, Ruth E. English3: {cpb,jmb}@robots.ox.ac.uk
1Medical Vision Laboratory (Robotics), Oxford University, Parks Rd, Oxford OX1 3PJ,
United Kingdom
2Department of Surgery, Royal Free and University College Medical School, UCL, London NW3 2QG, UK
3Breast Care Unit, Churchill Hospital, Oxford OX3 7LJ, UK
1. Introduction
X-ray mammography and contrast-enhanced Magnetic Resonance Imaging (MRI) provide
complementary pathological information for breast cancer diagnosis and surgical/treatment
planning. MRI provides good tissue specificity (whether or not the breast is compressed) via
a pharmacokinetic model of contrast enhancement, whilst X-ray mammography has spatial
resolution and image formation physics capable of providing information about curvilinear
structures, tumour spiculation and microcalcifications.
In this paper we present a method for data fusion between MRI and X-ray for the purposes of
surgical planning. The objective is to register cranio-caudal (CC) and medio-lateral (ML -
oblique) mammograms to equivalent geometric projections of a contrast-enhanced MRI
(Gadolinium-DTPA) volume to enable feature correspondence to be made between
modalities. However, rather than use a simple intensity-based projection, we exploit voxel
gadolinium uptake (Hoffman et. al. 1995) to produce a pharmacokinetic projection of the
tissues. The result is effectively an uncompressed “pseudo X-ray” that features functional,
rather than structural information about breast tissues. An example of such a projection is
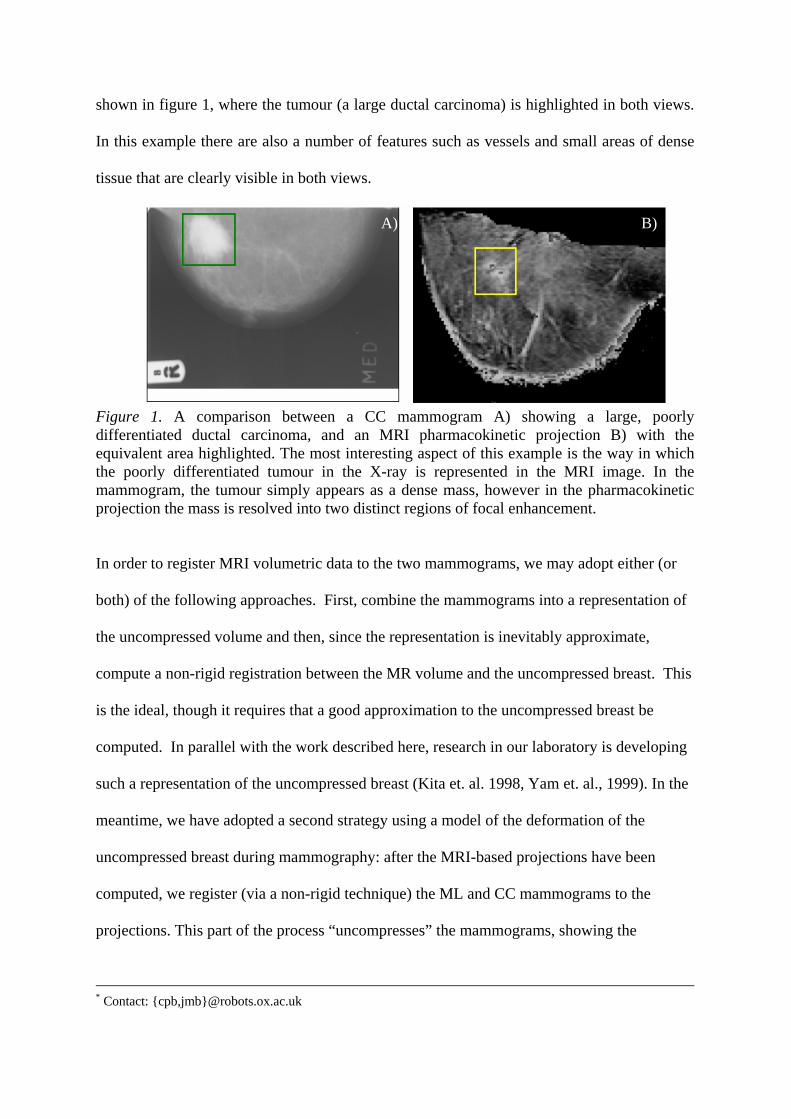
shown in figure 1, where the tumour (a large ductal carcinoma) is highlighted in both views.
In this example there are also a number of features such as vessels and small areas of dense
tissue that are clearly visible in both views.
A) B)
Figure 1. A comparison between a CC mammogram A) showing a large, poorly differentiated ductal carcinoma, and an MRI pharmacokinetic projection B) with the equivalent area highlighted. The most interesting aspect of this example is the way in which the poorly differentiated tumour in the X-ray is represented in the MRI image. In the mammogram, the tumour simply appears as a dense mass, however in the pharmacokinetic projection the mass is resolved into two distinct regions of focal enhancement. In order to register MRI volumetric data to the two mammograms, we may adopt either (or
both) of the following approaches. First, combine the mammograms into a representation of
the uncompressed volume and then, since the representation is inevitably approximate,
compute a non-rigid registration between the MR volume and the uncompressed breast. This
is the ideal, though it requires that a good approximation to the uncompressed breast be
computed. In parallel with the work described here, research in our laboratory is developing
such a representation of the uncompressed breast (Kita et. al. 1998, Yam et. al., 1999). In the
meantime, we have adopted a second strategy using a model of the deformation of the
uncompressed breast during mammography: after the MRI-based projections have been
computed, we register (via a non-rigid technique) the ML and CC mammograms to the
projections. This part of the process “uncompresses” the mammograms, showing the
* Contact: {cpb,jmb}@robots.ox.ac.uk
distribution of breast tissue (including pathology) in a manner consistent with prone MRI.
The registration process is discussed more thoroughly in the next section.
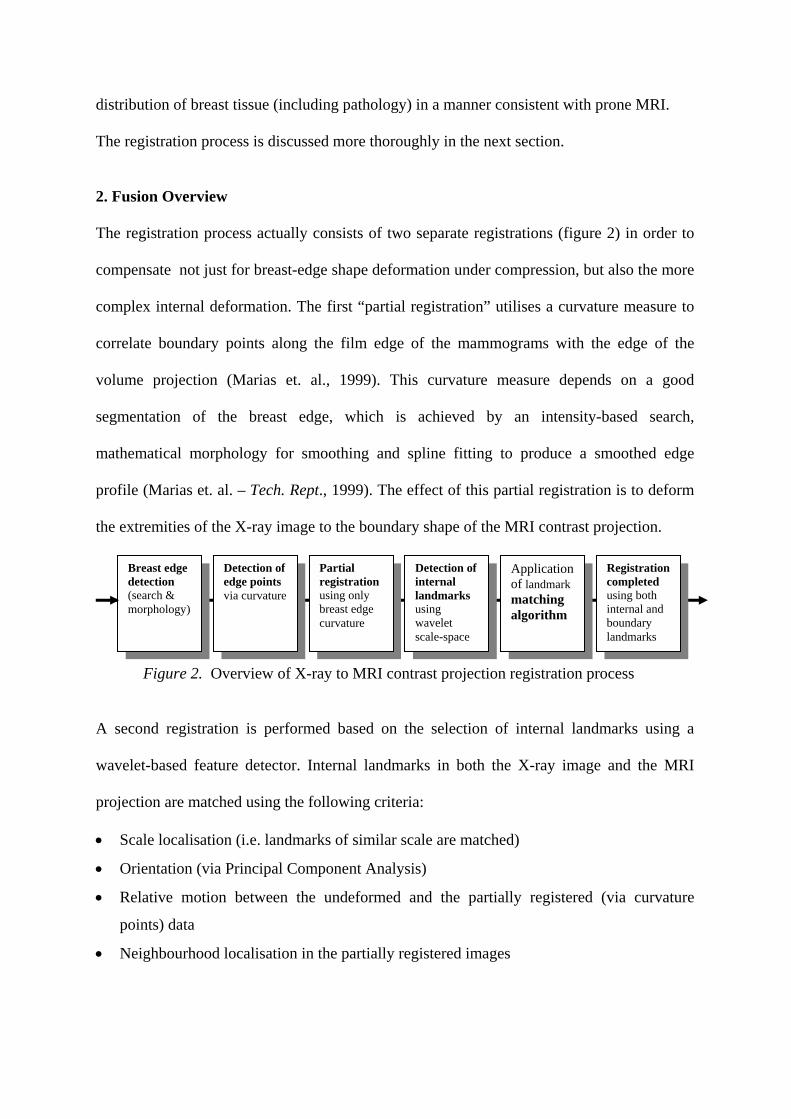
2. Fusion Overview The registration process actually consists of two separate registrations (figure 2) in order to
compensate not just for breast-edge shape deformation under compression, but also the more
complex internal deformation. The first “partial registration” utilises a curvature measure to
correlate boundary points along the film edge of the mammograms with the edge of the
volume projection (Marias et. al., 1999). This curvature measure depends on a good
segmentation of the breast edge, which is achieved by an intensity-based search,
mathematical morphology for smoothing and spline fitting to produce a smoothed edge
profile (Marias et. al. – Tech. Rept., 1999). The effect of this partial registration is to deform
the extremities of the X-ray image to the boundary shape of the MRI contrast projection.
Detection of internal landmarks using wavelet scale-space
Detection of edge points via curvature
Partial registration using only breast edge curvature
Breast edge detection (search & morphology)
Application of landmark matching algorithm
Registration completed using both internal and boundary landmarks
Figure 2. Overview of X-ray to MRI contrast projection registration process A second registration is performed based on the selection of internal landmarks using a
wavelet-based feature detector. Internal landmarks in both the X-ray image and the MRI
projection are matched using the following criteria:
• Scale localisation (i.e. landmarks of similar scale are matched)
• Orientation (via Principal Component Analysis)
• Relative motion between the undeformed and the partially registered (via curvature
points) data
• Neighbourhood localisation in the partially registered images
This second step uses both the matched internal landmarks and boundary points (selected on
the basis of curvature) to complete the registration. To date, we have used thin plate spline
warping for registration (Bookstein, 1989). This landmark-based approach is appropriate for
applications such as ours, where we do not necessarily have an intensity correlation between
the MRI contrast projection and the X-ray data. It also enables us to perform the partial
registration using only boundary points, which is particularly important in cases such as
when the breast has undergone significant involution and there may be few, even no,
landmarks or intensities suitable for controlling the internal deformation of the registration
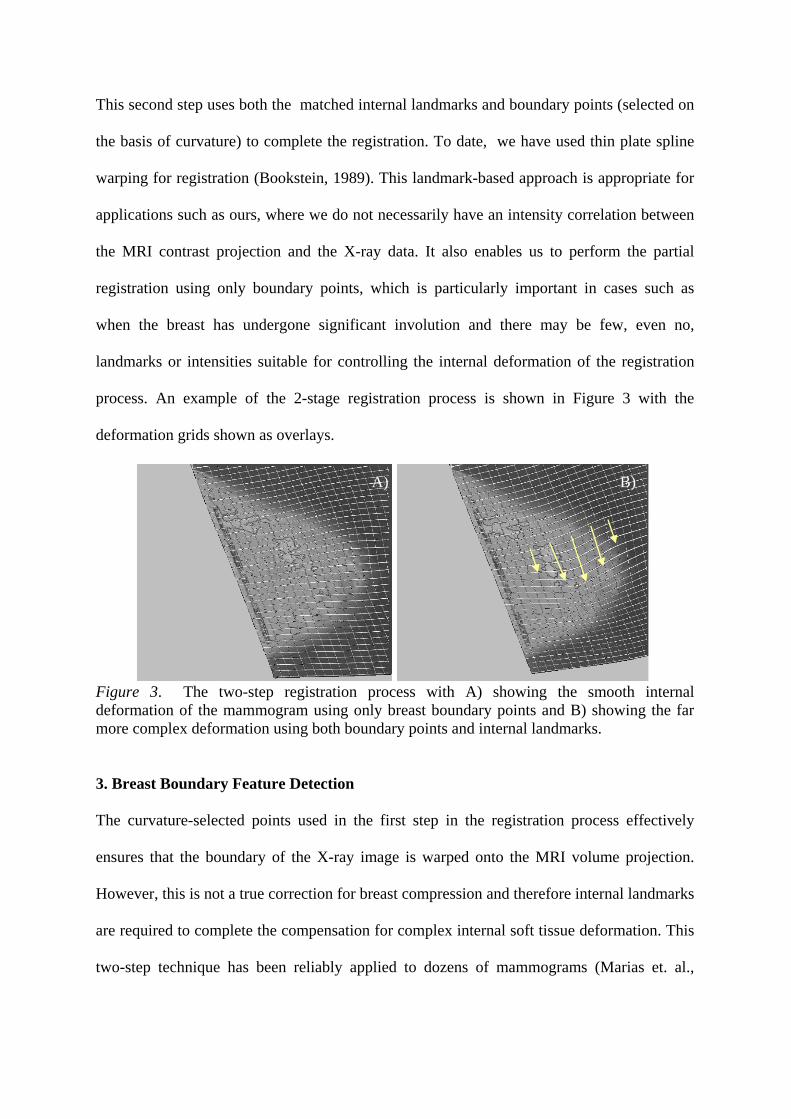
process. An example of the 2-stage registration process is shown in Figure 3 with the
deformation grids shown as overlays.
A) B)
Figure 3. The two-step registration process with A) showing the smooth internal deformation of the mammogram using only breast boundary points and B) showing the far more complex deformation using both boundary points and internal landmarks.
3. Breast Boundary Feature Detection
The curvature-selected points used in the first step in the registration process effectively
ensures that the boundary of the X-ray image is warped onto the MRI volume projection.
However, this is not a true correction for breast compression and therefore internal landmarks
are required to complete the compensation for complex internal soft tissue deformation. This
two-step technique has been reliably applied to dozens of mammograms (Marias et. al.,

1999/2000) and is a sensible approach because while there may be slight changes of
compression in successive mammograms (particularly around the time of the menopause),
the breast outline shape remains consistent.
4. Partial Registration
Given the edge-localised curvature landmarks, the first registration step is performed (refer to
Figure 3) using thin-plate spline interpolation. In this approach, a set of n landmarks (pi, qi) is
used, where pi = (xi1, yi1) are the co-ordinates of the landmarks of the first image and qi = (xi2,
yi2) of the second. The interpolation problem is to find the transformation f that fulfils the
condition f(pi) = qi for i=1,…,n. and minimises a suitable functional J(f). J(f) can be
separated in d=2 (where d is the dimension of the images) problems for each component f of
f. Thus for d=2 and m=2 (the order of derivatives used) we find:
(1) dydx
yxf
yf
xffJ
R∫∫ ⎪⎭
⎪⎬⎫
⎪⎩
⎪⎨⎧
⎟⎟⎠
⎞⎜⎜⎝
⎛∂⋅∂
∂⋅+⎟⎟
⎠
⎞⎜⎜⎝
⎛∂∂
+⎟⎟⎠
⎞⎜⎜⎝
⎛∂∂
=2
222
2
22
2
222 2)(
This functional is also known as the bending energy of the deformation. In thin-plate spline
theory, the desired function f is the solution of the biharmonic equation Δ2f=0. It can be
deformed in certain parts obeying the function f(x, y), as long as the displacements are small
and conforms to the minimum bending energy configuration of f(x, y).
5. Wavelet-Based Feature Detection
To complete the registration internal landmarks are required to compensate for the
complexity of the soft-tissue deformations. A scale-space approach was chosen, based on
tensor wavelet packets (Coifman et. al., 1992, Meyer & Roques, 1992). Wavelet packet
decompositions are particularly useful linear superpositions of wavelets that result in large
“libraries” of functions that have specific frequency and spatial localisations (Daubechies,

1994). To date, we have used the Coiflet wavelet bases as they feature good spatial
localisation (i.e. edge preserving), have compact support (Daubechies, 1998) and are
morphologically relevant to detecting small regions of high intensity.
After wavelet decomposition, the scale-space is completed by using an information cost
function in the context of a “best basis” algorithm (Coifman & Wickerhauser, 1992) to order
wavelet coefficients in such a way that the various subspaces used for the decomposition are
ranked by information content:
ggf IL λ+− )(2
2 (2) evaluated as:
2/12
)(2 )()(2 ⎟⎟
⎠
⎞⎜⎜⎝
⎛−=− ∫
Δ
I
IL dxpgpfgf (3)
where f(p) is the original image pixel vector and g(p) is the reconstructed image pixel vector
for a given wavelet subspace (packet) in L2 with respect to the chosen cost function. In this
case, we use a second-order approximation to entropy that we have found to be relatively
invariant to image noise statistics (Parker et. al., 1998). Each wavelet subspace (filter
superposition) is then cumulatively adjointly convolved, in order, with respect to the best-
basis assessment of the decomposition. The result is a “stack” of reconstructions from
minimum to maximum information content (dependent on the cost function). This analysis is
used as the basis of segmentation, similar to the “extremum stack concept” (Koenderink,
1984), in conjunction with some contour refinement to compensate for smoothing (Zhu &
Yuille, 1996). The use of wavelets as the basis for a multi-scale approach to registration is a
fundamental aspect of our current research emphasis.
6. Final Registration The last step in the registration process is to include both the boundary curvature-based
landmarks and detected internal landmarks in the registration process (as outlined in part 3).
In addition to the matching criteria discussed previously, the scale localisation information
for each internal landmark is used to control the σi2 terms in equation (4). This has the effect
of applying a confidence measure to a landmark and adjusting the corresponding level of
local deformation caused by each feature point. In this way, features with low-levels of
saliency influence the internal deformation to a lesser extent. The implementation involves
minimizing the functional (Rohr et. al., 1996):
(4) )(
)f(p-q)( 2
2i ffJ ∑ ⋅+= λ 2
12
i Jn
i i= σλ
where λ is the regularisation parameter that controls the amount of smoothness in the
deformation and σi2 are the uncertainty terms which are driven by scale information from the
wavelet analysis.
7. Compression Compensation Previous work related to modelling breast compression has used a cross-section approach to
uncompress the breast to enable point correspondence between ML and CC views (Kita et.
al., 1998, Yam et. al., 1999). In our approach, the objective is to uncompress the
mammograms into the reference frame of prone-acquired 3D MRI volumes. This not only
facilitates a framework for point correspondence between mammograms, but also enables
pathology to be compared between MRI and X-ray mammography. As a consequence, the
uncompressed shape is very different to the of Kita et. al. as the reconstruction shape
resembles the prone MRI breast, rather than the idealised upright shape of the breast. This is
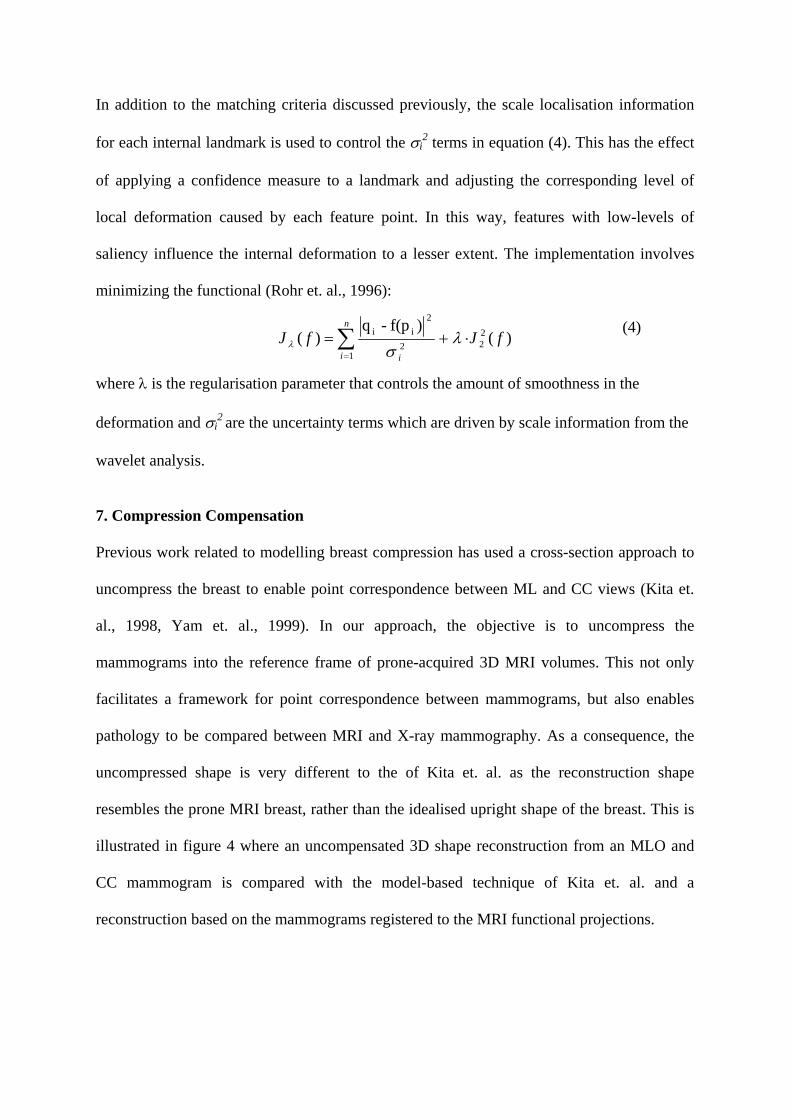
illustrated in figure 4 where an uncompensated 3D shape reconstruction from an MLO and
CC mammogram is compared with the model-based technique of Kita et. al. and a
reconstruction based on the mammograms registered to the MRI functional projections.
A) B) C)
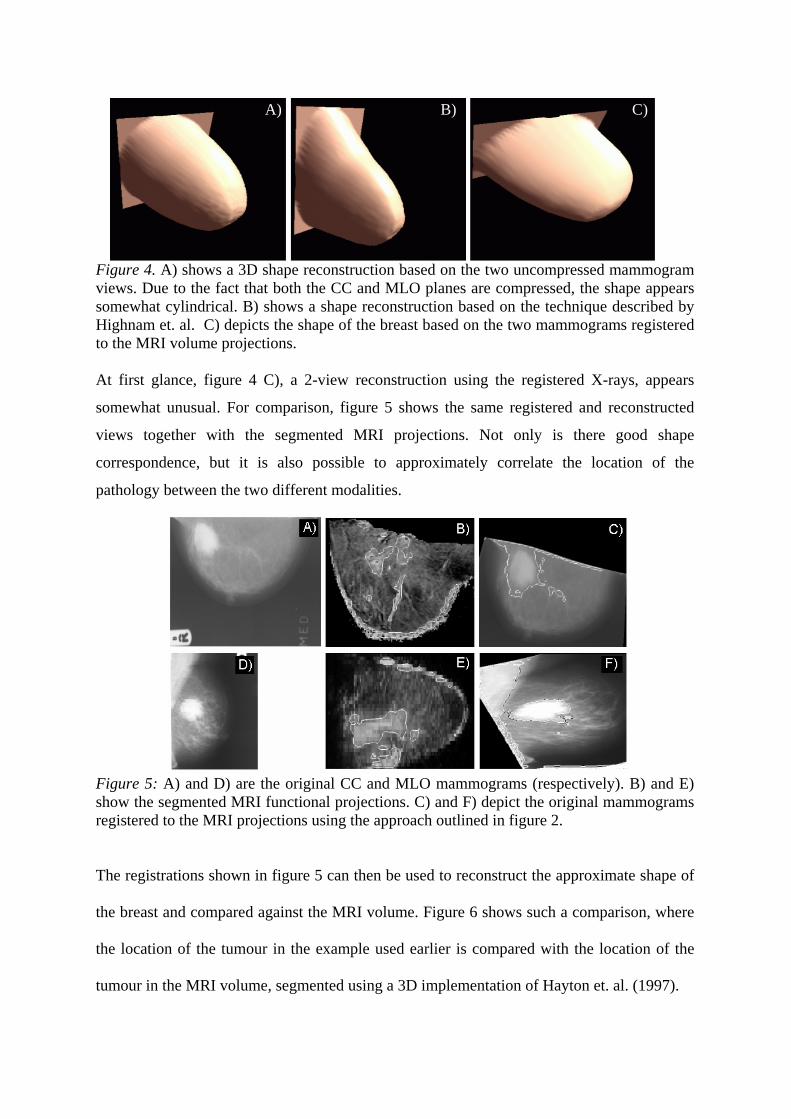
Figure 4. A) shows a 3D shape reconstruction based on the two uncompressed mammogram views. Due to the fact that both the CC and MLO planes are compressed, the shape appears somewhat cylindrical. B) shows a shape reconstruction based on the technique described by Highnam et. al. C) depicts the shape of the breast based on the two mammograms registered to the MRI volume projections.
A) B) C)
At first glance, figure 4 C), a 2-view reconstruction using the registered X-rays, appears
somewhat unusual. For comparison, figure 5 shows the same registered and reconstructed
views together with the segmented MRI projections. Not only is there good shape
correspondence, but it is also possible to approximately correlate the location of the
pathology between the two different modalities.
Figure 5: A) and D) are the original CC and MLO mammograms (respectively). B) and E) show the segmented MRI functional projections. C) and F) depict the original mammograms registered to the MRI projections using the approach outlined in figure 2.
The registrations shown in figure 5 can then be used to reconstruct the approximate shape of
the breast and compared against the MRI volume. Figure 6 shows such a comparison, where
the location of the tumour in the example used earlier is compared with the location of the
tumour in the MRI volume, segmented using a 3D implementation of Hayton et. al. (1997).
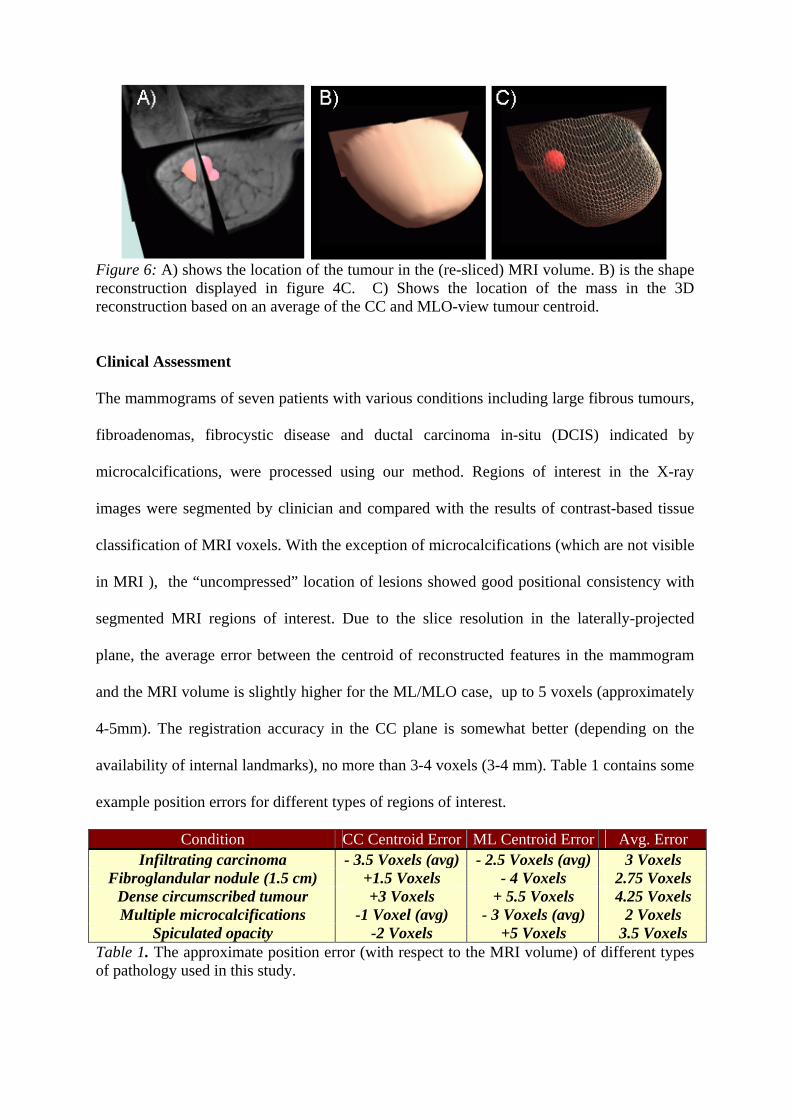
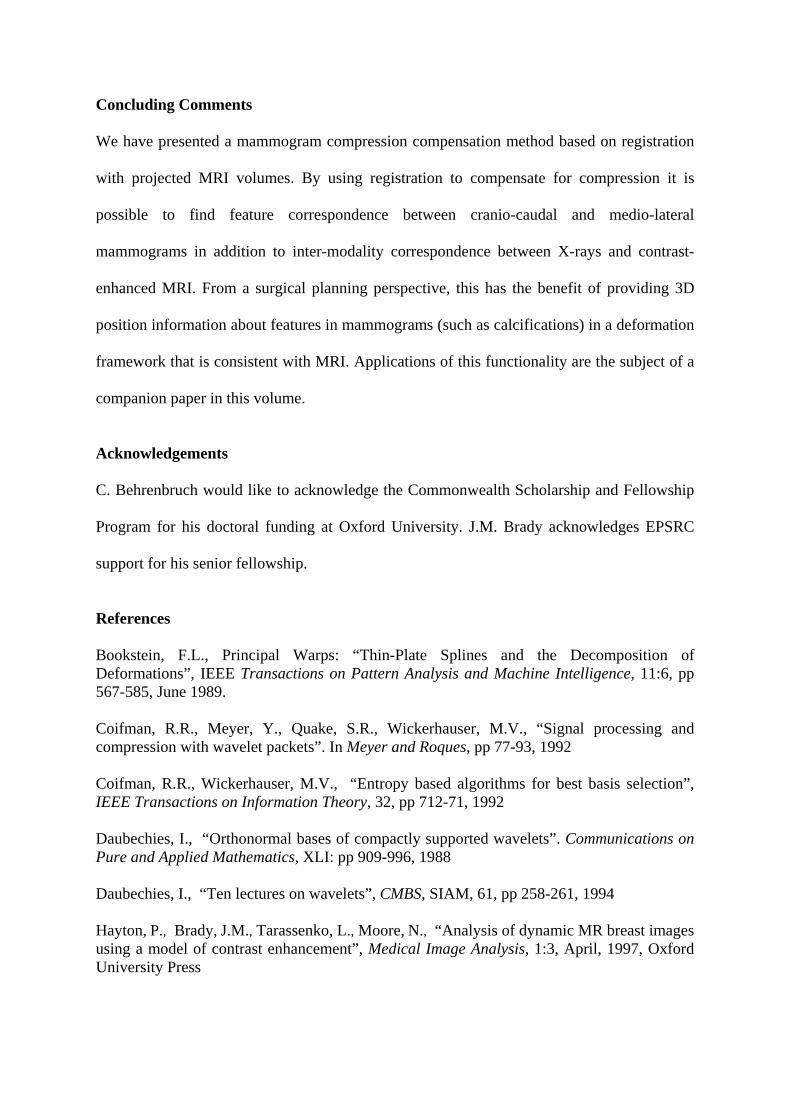
Figure 6: A) shows the location of the tumour in the (re-sliced) MRI volume. B) is the shape reconstruction displayed in figure 4C. C) Shows the location of the mass in the 3D reconstruction based on an average of the CC and MLO-view tumour centroid. Clinical Assessment The mammograms of seven patients with various conditions including large fibrous tumours,
fibroadenomas, fibrocystic disease and ductal carcinoma in-situ (DCIS) indicated by
microcalcifications, were processed using our method. Regions of interest in the X-ray
images were segmented by clinician and compared with the results of contrast-based tissue
classification of MRI voxels. With the exception of microcalcifications (which are not visible
in MRI ), the “uncompressed” location of lesions showed good positional consistency with
segmented MRI regions of interest. Due to the slice resolution in the laterally-projected
plane, the average error between the centroid of reconstructed features in the mammogram
and the MRI volume is slightly higher for the ML/MLO case, up to 5 voxels (approximately
4-5mm). The registration accuracy in the CC plane is somewhat better (depending on the
availability of internal landmarks), no more than 3-4 voxels (3-4 mm). Table 1 contains some
example position errors for different types of regions of interest.
Condition CC Centroid Error ML Centroid Error Avg. Error Infiltrating carcinoma - 3.5 Voxels (avg) - 2.5 Voxels (avg) 3 Voxels
Fibroglandular nodule (1.5 cm) +1.5 Voxels - 4 Voxels 2.75 Voxels Dense circumscribed tumour +3 Voxels + 5.5 Voxels 4.25 Voxels Multiple microcalcifications -1 Voxel (avg) - 3 Voxels (avg) 2 Voxels
Spiculated opacity -2 Voxels +5 Voxels 3.5 Voxels Table 1. The approximate position error (with respect to the MRI volume) of different types of pathology used in this study.
Concluding Comments We have presented a mammogram compression compensation method based on registration
with projected MRI volumes. By using registration to compensate for compression it is
possible to find feature correspondence between cranio-caudal and medio-lateral
mammograms in addition to inter-modality correspondence between X-rays and contrast-
enhanced MRI. From a surgical planning perspective, this has the benefit of providing 3D
position information about features in mammograms (such as calcifications) in a deformation
framework that is consistent with MRI. Applications of this functionality are the subject of a
companion paper in this volume.
Acknowledgements C. Behrenbruch would like to acknowledge the Commonwealth Scholarship and Fellowship
Program for his doctoral funding at Oxford University. J.M. Brady acknowledges EPSRC
support for his senior fellowship.
References
Bookstein, F.L., Principal Warps: “Thin-Plate Splines and the Decomposition of Deformations”, IEEE Transactions on Pattern Analysis and Machine Intelligence, 11:6, pp 567-585, June 1989. Coifman, R.R., Meyer, Y., Quake, S.R., Wickerhauser, M.V., “Signal processing and compression with wavelet packets”. In Meyer and Roques, pp 77-93, 1992 Coifman, R.R., Wickerhauser, M.V., “Entropy based algorithms for best basis selection”, IEEE Transactions on Information Theory, 32, pp 712-71, 1992 Daubechies, I., “Orthonormal bases of compactly supported wavelets”. Communications on Pure and Applied Mathematics, XLI: pp 909-996, 1988 Daubechies, I., “Ten lectures on wavelets”, CMBS, SIAM, 61, pp 258-261, 1994 Hayton, P., Brady, J.M., Tarassenko, L., Moore, N., “Analysis of dynamic MR breast images using a model of contrast enhancement”, Medical Image Analysis, 1:3, April, 1997, Oxford University Press
Hoffman, U., Brix, G., Knopp, M.V., Hess, T., Lorentz, W.J., “Pharmacokinetic mapping of the breast: A new method for dynamic MR mammography”, Magnetic Resonance in Medicine 33, pp 506-514, 1995 Kita, Y., Highnam, R., Brady, M., “Correspondence between different view breast X-rays using a simulation of breast deformation” IEEE Computer Society Conference on Computer Vision and Pattern Recognition, pp. 700-7, 1998 Koenderink, J., “The structure of images”, Biological Cybernetics, vol. 50, pp 363-370, 1984 Marias, K., Brady, J.M, Parbhoo, S., Seifalian, A.M., “Registration and matching of temporal mammograms for detecting abnormalities”, Medical Imaging Understanding and Analysis, Oxford 1999 Marias, K., Behrenbruch, C.P., Brady, J.M., “Robust Breast Edge Segmentation in Mammography”, Engineering Science Technical Report 19990805#2, Oxford University, 1999 Marias, K., Behrenbruch, C.P., Brady, J.M., Parbhoo, S., Seifalian, “Multi-scale Landmark Selection for Improved Registration of Temporal Mammograms”, IWDM (International Workshop in Digital Mammography) 2000, Toronto, Canada, Medical Physics, June 2000 Meyer, Y., Roques, S., (editors), “Progress in Wavelet Analysis and Applications”. Proceedings of the International Conference “Wavelets and Applications”, Toulouse, France, 8-13 June 1992. Observatoire Parker, G.J.M., Schnabel, J.A., Barker, G.J., “Nonlinear Smoothing of MR Images Using Approximate Entropy – A Local Measure of Signal Intensity Irregularity”. Technical Report, NMR Research Unit, Institute of Neurology, University College London, 1998
Rohr, K., Stiehl, H.S., Sprengel, R., Beil, W., Buzug, T.M., Weese, J., Kuhn, M.H., “Point-based elastic registration of medical image data using approximating thin-plate splines”, Lecture Notes in Computer Science 1131, Springer, pp. 297-306, 1996 Yam, M., Brady, J.M., Highnam, R.P., English, R.E., Kita, Y., “Reconstructing microcalcification clusters in 3-D using a parameterized breast compression model”, Computer Assisted Radiology and Surgery (CARS), Paris 1999. Zhu, S.C., Yuille, A., “Region Competition: Unifying Snakes, Region Growing, and Bayes/MDL for Multiband Image Segmentation”, PAMI 18:9, September 1996, pp. 884-900.