The use of e-government services and the Internet: the role of socio-demographic, economic and...
27
This is an electronic reprint of the original article. This reprint may differ from the original in pagination and typographic detail. Author(s): Title: Year: Version: Please cite the original version: All material supplied via JYX is protected by copyright and other intellectual property rights, and duplication or sale of all or part of any of the repository collections is not permitted, except that material may be duplicated by you for your research use or educational purposes in electronic or print form. You must obtain permission for any other use. Electronic or print copies may not be offered, whether for sale or otherwise to anyone who is not an authorised user. The use of e-government services and the Internet: the role of socio-demographic, economic and geographical predictors Taipale, Sakari Taipale, S. (2013). The use of e-government services and the Internet: the role of socio-demographic, economic and geographical predictors. Telecommunications Policy, 37 (4/5), 413-422. doi:10.1016/j.telpol.2012.05.005 2013 Final draft
Transcript of The use of e-government services and the Internet: the role of socio-demographic, economic and...

This is an electronic reprint of the original article. This reprint may differ from the original in pagination and typographic detail.
Author(s):
Title:
Year:
Version:
Please cite the original version:
All material supplied via JYX is protected by copyright and other intellectual property rights, and duplication or sale of all or part of any of the repository collections is not permitted, except that material may be duplicated by you for your research use or educational purposes in electronic or print form. You must obtain permission for any other use. Electronic or print copies may not be offered, whether for sale or otherwise to anyone who is not an authorised user.
The use of e-government services and the Internet: the role of socio-demographic,economic and geographical predictors
Taipale, Sakari
Taipale, S. (2013). The use of e-government services and the Internet: the role ofsocio-demographic, economic and geographical predictors. TelecommunicationsPolicy, 37 (4/5), 413-422. doi:10.1016/j.telpol.2012.05.005
2013
Final draft

1
Abstract
This article explores the use of e-government services from the perspective of digital
divides. First, it aims to find out which socio-demographic, economic and geographical
factors predict the use of e-government services. Second, the article aims to show whether
these factors moderate the way in which the time spent on the Internet is associated with the
use of e-government services. The article is based on survey data (N=612) collected in
Finland in May–June 2011 and is analysed by using a logistic regression modelling. Results
show that gender and income moderate the link between the Internet and e-government
service use. The more that women use the Internet, the more they use the government’s
electronic services. However, among men, the use of e-services does not increase similarly
with the use of the Internet. Regarding income indicators, results imply that e-service use
increases with Internet use but only among the respondents with low income levels.
Additionally, the article shows that education, children, income and the size of the place of
residence have major effects on the use of the government’s e-services. Lastly, the
empirical results are briefly discussed in relation to the digital divide discussion and some
policy implications are presented.
Keywords
e-government, service, the Internet, users, adoption, Finland

2
1.Introduction
The future of the modern welfare state is subject to the successful digitisation of
public services and administration. The term ‘e-government’ has been extensively applied
to refer to the potential for information and communication technologies (ICTs) to help in
network building and service delivery, and to increase the interactivity, transparency and
efficiency of government (Yildiz, 2007). This potential is much needed in all industrialised
countries, which have difficulties in providing a variety of public services (e.g. social
benefits and tax counselling) in an economically suitable manner to their rapidly aging
populations. In the face of these challenges, governments have been forced to close their
offices and replace them with electronic service platforms. However, from the perspective
of digital divide studies it remains unclear whether industrialised countries are able to
combine a more balanced economy and socially equitable development of their respective
information societies. The technocratic approaches to digital divides argue that social
inequalities are temporary by nature and that time will level them out with the
simultaneously increasing access to new ICTs. This approach is contrasted with three other
perspectives. The social structure approaches see inequalities as structural and not
conditional on technological development. The information structure and exclusion
approaches acknowledge the connection between ICTs and growing social disparities. The
modernization and capitalism approach takes a step further by arguing that inequalities are
highly structural and that ICTs are not only sustaining them but also creating completely
new ones (Sassi, 2005, p. 694). It is against this backcloth that the article aims to produce
empirical-based information about the predictors of e-government service use and to

3
contribute to the digital divide studies from the perspective of the use government’s
electronic services.
These aims form the basis for the following two research questions. First, the article
seeks answers to the question: ‘To what extent are socio-demographic, economic and
geographical factors associated with e-government service use?’ Second, the article aims to
find out: ‘Do these factors moderate the way in which the time spent on the Internet is
associated with the use of public e-services?’ The study is premised on survey data
(N=612) collected in Finland in 2011. The data is analysed by using logistic regression
analysis. As the survey contains only information collected from citizens, this study is not
able to look at e-government services targeted at enterprises. The chosen perspective, where
citizens’ interaction with government is explored, is also known as a ‘demand perspective’.
Many previous research projects have investigated the supply side by analysing the services
that central and local governments provide over the Internet (Reddick, 2005).
The article begins with a literature review that is carried out to formulate the exact
literature-based hypotheses for the study. Next, the research method, data and measurement
instruments are described. After this, the findings of the study are reported one hypothesis
at a time. Discussion and the limitations of the study are presented before the article ends
with conclusions and policy implications.
2.Literature
2.1ElectronicgovernmentinFinland

4
Finland was one of the early-adopters of e-government. Its general atmosphere has
been open to change, modernisation and technological innovations, as its citizens have
been, on average, well-educated and technologically savvy (OECD, 2010). At the political
level, investments in technological innovations have been considered as a way to sustain
competitiveness in the economy. However, Finland has simultaneously suffered from the
fragmentised and multilayered structure of its e-government, where a set of central-
government, regional and municipal actors have built incompatible platforms for state–
citizen interaction (National Audit Office of Finland, 2008; Turkki, 2009).
Nevertheless, recent statistics show that Finland is still among the top European
information societies, although, other Nordic countries in particular rank higher than
Finland regarding e-government use and services. In 2010, 58 per cent of 16 to 74 year-old
Finns had used the Internet in the last 3 months for interaction with public authorities1
(60% men, 56% women), while in 2005 the same figure was 47 per cent (no gender
differences). The corresponding figure in 2010 for the EU25 was 33 per cent (35% men,
31% women). It is also worth mentioning that the availability of e-government services2 in
Finland has increased between 2005 and 2010 from 69 to 95 per cent (EuroStat, 2011).
In recent years, several policy measures have been made to boost the development
of e-government infrastructure in Finland. In 2010, a new information society strategy was
published and it was compiled to be in line with the national innovation strategy and the
European Union’s digital strategy (Ministry of Transport and Communications, 2010, p. 8;
COM, 2010). These strategies underline, among many other things, interoperable e-
1 In EuroStat (2011) statistics, e-government is measured as a proportion of those who have used the Internet for one or more of the following activities: obtaining information from public authorities’ web sites, downloading official forms, submitting completed forms. 2 A proportion of 20 basic services which are fully available online (for more information see EuroStat 2011.
5
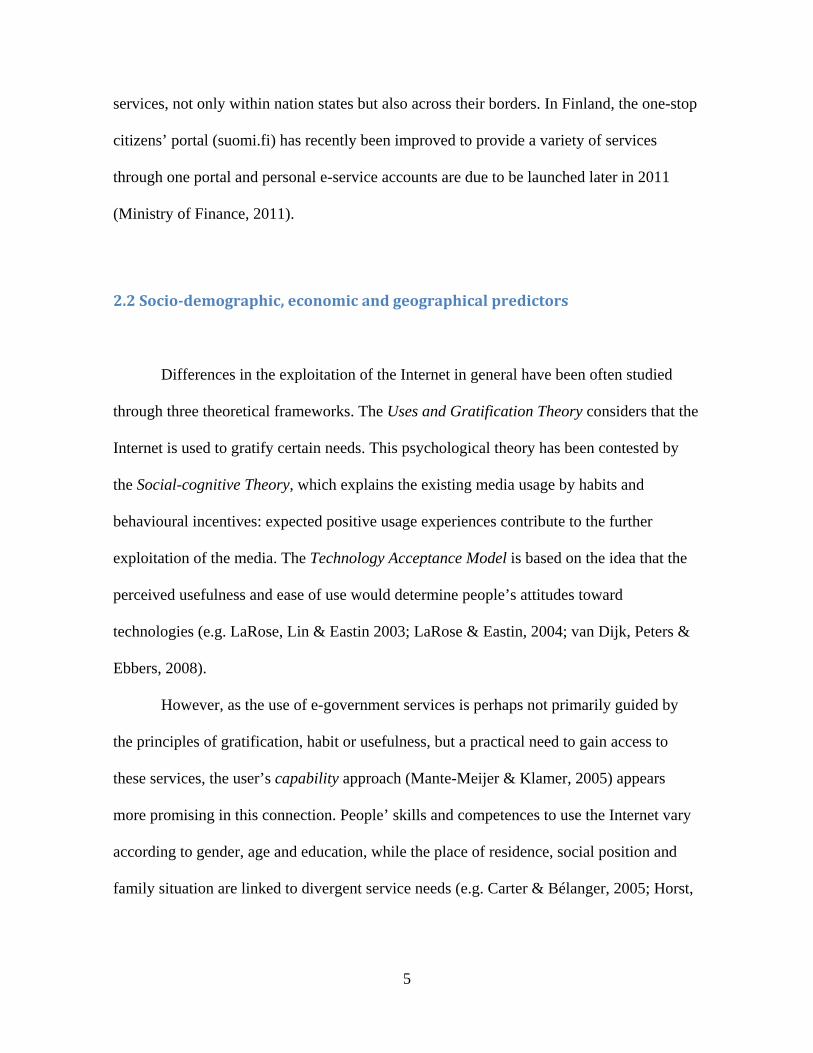
services, not only within nation states but also across their borders. In Finland, the one-stop
citizens’ portal (suomi.fi) has recently been improved to provide a variety of services
through one portal and personal e-service accounts are due to be launched later in 2011
(Ministry of Finance, 2011).
2.2Socio‐demographic,economicandgeographicalpredictors
Differences in the exploitation of the Internet in general have been often studied
through three theoretical frameworks. The Uses and Gratification Theory considers that the
Internet is used to gratify certain needs. This psychological theory has been contested by
the Social-cognitive Theory, which explains the existing media usage by habits and
behavioural incentives: expected positive usage experiences contribute to the further
exploitation of the media. The Technology Acceptance Model is based on the idea that the
perceived usefulness and ease of use would determine people’s attitudes toward
technologies (e.g. LaRose, Lin & Eastin 2003; LaRose & Eastin, 2004; van Dijk, Peters &
Ebbers, 2008).
However, as the use of e-government services is perhaps not primarily guided by
the principles of gratification, habit or usefulness, but a practical need to gain access to
these services, the user’s capability approach (Mante-Meijer & Klamer, 2005) appears
more promising in this connection. People’ skills and competences to use the Internet vary
according to gender, age and education, while the place of residence, social position and
family situation are linked to divergent service needs (e.g. Carter & Bélanger, 2005; Horst,

6
Kuttschreuter & Gutteling, 2007; van Dijk, Pieterson, van Deuren & Ebbers, 2007; Colesca
& Dobrica, 2008; Colesca, 2008; Carter, 2008).
Earlier studies present some contradictory results on the effects of gender on public
e-service use. Choudrie and Dwivedi (2005, p. 6) found that in the UK men were more
likely users of the government’s electronic services than women. The majority of studies,
however, have not found gender differences in the use of and attitudes towards e-
government services (Reddick, 2005, p. 52; van Dijk et al., 2007, p. 161; Colesca &
Dobrica, 2008, p. 213; Bélanger & Carter, 2009, p. 134). Age is much more clearly
associated with e-government service use as far as previous studies are concerned. Younger
citizens are more likely to be users than older ones (Colesca & Dobrica, 2008, p. 213;
Bélanger & Carter, 2009, p. 134). Two separate studies provide even more specific
evidence arguing that the age of 55 is a dividing line in this respect (Choudrie & Dwivedi,
2005, p. 8; Reddick, 2005, p. 52).
There is also evidence that education is the most powerful single predictor for the
use of and attitudes towards e-government services; adoption rates become higher and
attitudes more positive with increased levels of education (van Dijk et al., 2007, p. 161;
Colesca & Dobrica, 2008, p. 213; Bélanger & Carter, 2009, p. 134). Considerably less is
known about household combinations and the ways they are related to the use of public e-
services. Van Dijk et al. (2007, p. 164) conclude that, in the Netherlands, parents aged 30–
45 years are likely to belong to group demonstrating high-use of e-government services.
Also, the study by Hung, Chang and Yu (2006, p.106) hints that married people are more
likely to be the adopters of the government’s online tax filing and payments systems in
Taiwan. On these grounds, it can be assumed that people living in a household with
7
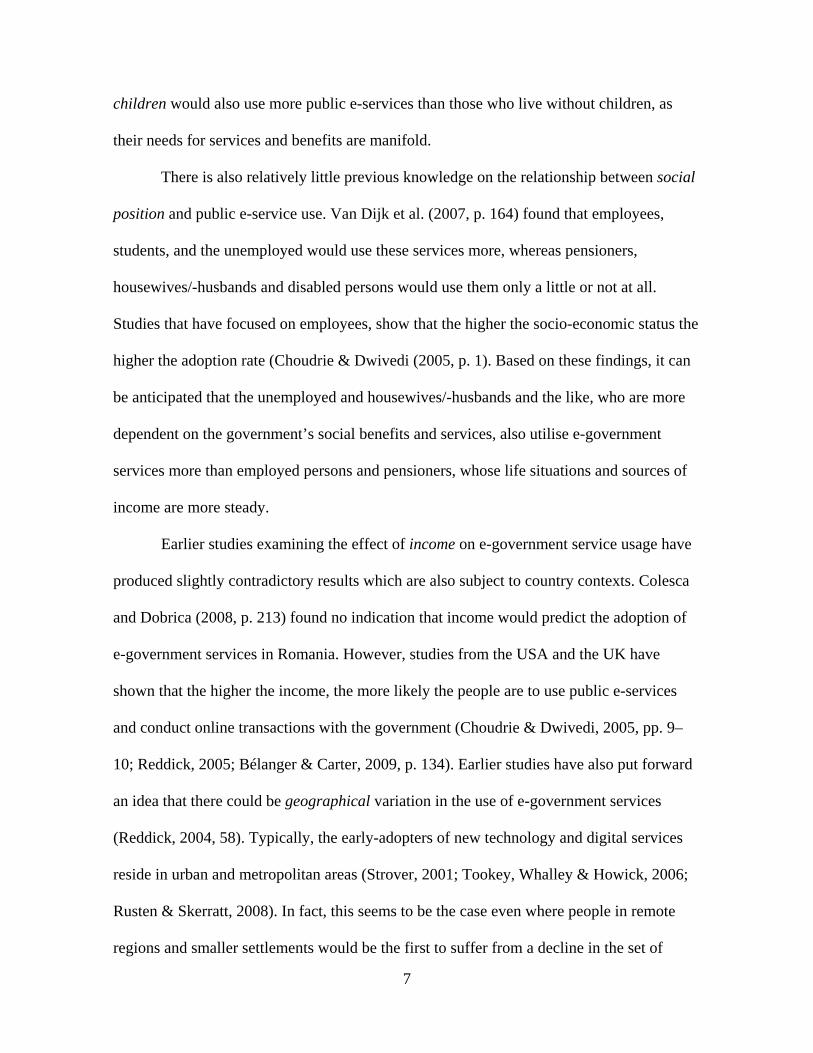
children would also use more public e-services than those who live without children, as
their needs for services and benefits are manifold.
There is also relatively little previous knowledge on the relationship between social
position and public e-service use. Van Dijk et al. (2007, p. 164) found that employees,
students, and the unemployed would use these services more, whereas pensioners,
housewives/-husbands and disabled persons would use them only a little or not at all.
Studies that have focused on employees, show that the higher the socio-economic status the
higher the adoption rate (Choudrie & Dwivedi (2005, p. 1). Based on these findings, it can
be anticipated that the unemployed and housewives/-husbands and the like, who are more
dependent on the government’s social benefits and services, also utilise e-government
services more than employed persons and pensioners, whose life situations and sources of
income are more steady.
Earlier studies examining the effect of income on e-government service usage have
produced slightly contradictory results which are also subject to country contexts. Colesca
and Dobrica (2008, p. 213) found no indication that income would predict the adoption of
e-government services in Romania. However, studies from the USA and the UK have
shown that the higher the income, the more likely the people are to use public e-services
and conduct online transactions with the government (Choudrie & Dwivedi, 2005, pp. 9–
10; Reddick, 2005; Bélanger & Carter, 2009, p. 134). Earlier studies have also put forward
an idea that there could be geographical variation in the use of e-government services
(Reddick, 2004, 58). Typically, the early-adopters of new technology and digital services
reside in urban and metropolitan areas (Strover, 2001; Tookey, Whalley & Howick, 2006;
Rusten & Skerratt, 2008). In fact, this seems to be the case even where people in remote
regions and smaller settlements would be the first to suffer from a decline in the set of

8
‘offline’ services and, as a result, would be more dependent on the provision of online
services. Finally, in various studies conducted in the USA, citizens’ ethnic backgrounds
have been linked to the take up of public e-services (e.g. Reddick, 2004, p. 51, Bélanger &
Carter, 2009, p. 134). Due to a lack of relevant measure and the fact that the target group of
the exploited survey is still relatively homogeneous in terms of their ethnic backgrounds,
this factor is not included in empirical analysis.
The above-reviewed literature shows that it is only the main effects of the numerous
predicting variables that have been previously explored. Potential interaction effects
between two or more predictors on e-government service use have so far remained largely
unexplored. Based on the above-reviewed literature, the following hypotheses can,
however, be set for the study:
H1a: Gender is not related to the use of e-government services.
H1b: Older persons are less likely to use e-government services than younger ones.
H1c: Highly educated people are more liable to use public e-services than less
educated people.
H1d: Unemployed persons, housewives/-husbands use e-government services more
than employed persons, students and pensioners.
H1e: Persons living with children use more government e-services than those living
without children.
H1f: Persons with a high household income are more likely to use public e-services
than those with a low household income.
H1g: Persons living in larger cities use public e-services more typically than those
living in smaller towns and villages.

9
2.3InteractioneffectswithInternetuse
According to previous research (Bélanger & Carter, 2009, p. 134; Reddick, 2005, p.
52), the frequency of Internet use, like the amount of online experience (e.g. years of
using), are also connected to e-government service usage. The more people spend time on
the Internet and the longer people have been using the Internet, the more likely they are to
deploy e-services supplied by the government. For instance, Reddick (2005, p. 51) has
pointed out that e-citizens, those acquiring information from and conducting transactions
with the government on the web, are likely to have a greater number of years of online
experience and to be more frequent consumers of government web sites.
Further, there are reasons to believe that various background variables modify the
way in which time spent on the Internet (hereafter referred to as ‘online time’) is associated
with the use of e-government services. As the previous literature lacks an analysis of such
interaction effects, a more pragmatic reasoning is needed to identify potential interaction
effects. First, as the quality and nature of Internet use have remained heavily gendered (e.g.
Selwyn, Gorard & Furlonget, 2005, p. 20; Wasserman & Richmond-Abbott, 2005) –
women’s usage is characterised by their domestic responsibilities, such as online banking
and communication between the home and schools (Waiser, 2000; Statistics Finland, 2011,
p. 26), whereas men play more online games, and download and listen to music etc. (Jones,
Johnson-Yale, Millermaier & Perez Jones, 2009, p. 246–47; Lucas & Sherry, 2004) – it can
be expected that, with the increase in overall online time, the probability for women to be
government e-service users will increase more than that of men. Second, as young people
are, on an average, more technologically savvy than older people, they use e-government

10
services more actively, regardless of their overall online time. Among older people, the use
of e-government services is more dependent on the time devoted to the Internet. Age-based
differences in the use of public e-services could be expected to become smaller as the time
spent on the Internet increases. Third, it is often the case that children add to the need for
people to interact with the government in order to receive various forms of family benefits,
services, and parental leave. With the growing scarcity of face-to-face service provision,
people with children are more and more explicitly forced to use government e-services,
even if they would prefer not to do so. Among heavy-users of the Internet, the difference
between people with and without children can be expected to be smaller or non-existent.
Fourth, it can be anticipated that the likelihood of being a government e-service user
increases more substantially with the overall online time for people with low incomes
compared to people with high incomes. This is related to their more versatile and regular
need to interact with the government in order to obtain financial support and housing
benefits. Lastly, here it is considered less likely that the online time would be differently
linked to the use of public e-services according to respondents’ levels of education, social
positions or the size of the place of residence. Thus, only the following four hypotheses
dealing with moderating effects are set for the study:
H2a: With the increase in online time, women are more likely to use e-government
services than men.
H2b: The difference in the use of e-government services between younger and older
people becomes smaller with the increase in online time.
H2c: People living with children probably use more e-government services than
those living without children but this difference becomes smaller with the increase
in online time.

11
H2d: With the increase in online time, people with a low household income use
more e-services than those with a high household income
3.Method
3.1Procedure The article is premised on a logistic regression analysis (LRA). LRA was conducted
with a hierarchical procedure at five steps, where the use of e-government services worked
as a dependent variable (see Section 3.1.1). At the first step, personal background variables
(gender, age, education, and social position) were entered in the model. At the second step,
household level variables (income and children) were added to the analysis. Then, the size
of the place of residence was included in the model at the third step, and a variable
measuring online time was added at the fourth step. Lastly, two-way interaction effect
terms were incorporated into the LRA model.
All predicting variables were standardised for the regression analysis to ensure that
the interaction terms could be appropriately tested and illustrated. The Hosmer-Lemeshow
test was used to indicate the goodness-of-fit of the LRA model. To identify the overall
proportion of the variance explained by the model, Nagelkerke-statistics were referred to
(Tabachnick & Fidell, 2007, pp. 459–461). Furthermore, the total percentages of correctly
predicted cases were analysed to assess the predicting capacity of the model.
3.2Data

12
The data (N=612) was collected from Finland in May–June 2011. The mode of data
collection was a structured postal survey. The nationally representative sampling was
carried out by the Population Register Centre of Finland. The sampling frame consisted of
15–65 year-old Finnish speaking citizens covering all geographical regions of the country.
The survey was pre-tested with ten persons.
The design of the questionnaire benefited from two earlier survey studies. The
majority of the questions was adopted from the ‘Telecommunication and Society in
Europe’ telephone survey that was carried out in Italy, Spain, Germany, France and the UK
in 2009. This survey is a partial replica of another survey conducted in the same countries
in 1996 (Fortunati & Manganelli, 1998). Another survey exploited was ‘On the Move: The
Role of Cellular Communications in American Life’, that was conducted at the University
of Michigan in 2005 by Mike Traugott, Thomas Wheeler and Richard Ling (On the Move,
2006).
The main characteristics of the data are presented in Table 1. It shows that women
are overrepresented in the data. Furthermore, the table shows that lowly educated
respondents are more likely to be non-users of e-government services than the highly
educated. Regarding respondents’ social positions, pensioners seem to stand out from the
rest, being more typically non-users. The data characteristics also indicate that, on the one
hand, the respondents living in the smallest settlements and, on the other, the respondents,
who spend one hour or less per a day on the Internet, would be more typically non-users
than others.
– Insert Table 1 here –

13
3.3Measurementinstruments
3.3.1Dependentvariable
The use of e-government services was measured by the responses ‘yes’ (81%) or
‘no’ (19%) to the following question: ‘When using the Internet from home, which of the
following activities do you practice at least sometimes?’ The question was followed by a
list of 25 activities of which one was ‘e-government services’. This activity was
accompanied with two prompts: ‘Kela, Vero.fi’. The first refers to the online platform of
the Social Insurance Institution of Finland and the latter to the web portal of the Finnish
Tax Administration. These are two major e-government service platforms in Finland.
3.3.2Independentvariables
To measure gender, fixed answering categories, 1 = ‘Man’ and 2 = ‘Woman’, were
supplied. Age was ascertained by asking for the year of birth, which was then recoded into
full years (M=44.45, SD=15.07, Range=15–743). Education level was measured as the
highest completed level of education in accordance with The International Standard
Classification of Education (ISCED97). The ISCED scale was recoded in three new
categories to ensure the sufficient number of cases in each category: 1 = ‘Low education’
(ISCED levels 1–2), 2 = ‘Medium education’ (ISCED levels 3, 4 and 5b), and 3 = ‘High
education’ (ISCED levels 5a and 6). The indicator for social position was recoded from the
3 Descriptive statistics (range, mean and standard deviation) are provided only for continuous variables. Table 1 provides descriptive information about the categorical and ordinal scale variables exploited in the study.
14
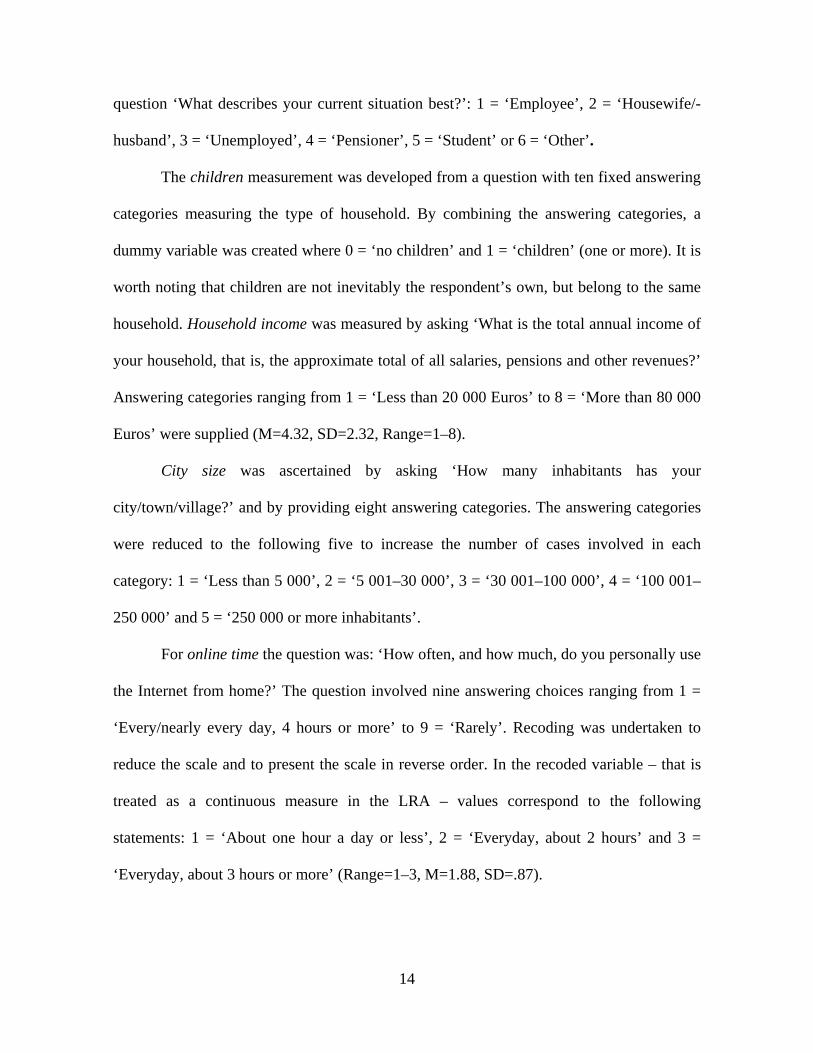
question ‘What describes your current situation best?’: 1 = ‘Employee’, 2 = ‘Housewife/-
husband’, 3 = ‘Unemployed’, 4 = ‘Pensioner’, 5 = ‘Student’ or 6 = ‘Other’.
The children measurement was developed from a question with ten fixed answering
categories measuring the type of household. By combining the answering categories, a
dummy variable was created where 0 = ‘no children’ and 1 = ‘children’ (one or more). It is
worth noting that children are not inevitably the respondent’s own, but belong to the same
household. Household income was measured by asking ‘What is the total annual income of
your household, that is, the approximate total of all salaries, pensions and other revenues?’
Answering categories ranging from 1 = ‘Less than 20 000 Euros’ to 8 = ‘More than 80 000
Euros’ were supplied (M=4.32, SD=2.32, Range=1–8).
City size was ascertained by asking ‘How many inhabitants has your
city/town/village?’ and by providing eight answering categories. The answering categories
were reduced to the following five to increase the number of cases involved in each
category: 1 = ‘Less than 5 000’, 2 = ‘5 001–30 000’, 3 = ‘30 001–100 000’, 4 = ‘100 001–
250 000’ and 5 = ‘250 000 or more inhabitants’.
For online time the question was: ‘How often, and how much, do you personally use
the Internet from home?’ The question involved nine answering choices ranging from 1 =
‘Every/nearly every day, 4 hours or more’ to 9 = ‘Rarely’. Recoding was undertaken to
reduce the scale and to present the scale in reverse order. In the recoded variable – that is
treated as a continuous measure in the LRA – values correspond to the following
statements: 1 = ‘About one hour a day or less’, 2 = ‘Everyday, about 2 hours’ and 3 =
‘Everyday, about 3 hours or more’ (Range=1–3, M=1.88, SD=.87).

15
4.Results
The results of the LRA testing of the hypotheses are presented in Table 2. The table
shows that the full regression model, which involves 418 valid cases, is able to predict
correctly 82 per cent of all cases with Nagelkerke’s pseudo R squared of 26 per cent. The
model also passed the Hosmer-Lemeshow test for goodness-of-fit.
First, the LRA model provides support for H1a as no differences were found
between men and women regarding the use of e-government services when the main effect
of gender was tested. Second, the model elicits results contradictory to H1b, which argued
that older people would be less likely to use these services. In fact, the results indicate that
age does not play a role in the use of public e-services in Finland. Third, the LRA model
gives support to H1c as highly educated people are much more likely to use public e-
services than their less educated counterparts. Compared with lowly educated respondents,
the highly educated and respondents with a medium level education are about six times and
3.5 times, respectively, as likely to use the e-services in question. Fourth, the regression
analysis does not provide support for the anticipated (H1d) relation that unemployed people
and housewives/-husbands would more typically use e-government services than employed
persons, students and pensioners. Fifth, the results give weak support for H1e, dealing with
the effect of children on the use of e-government services. According to the analysis, it
appears that respondents who live in a household with children are more likely to use e-
government services than those living in households with no children. Sixth, the LRA
model provides opposite results (albeit relatively weak) to H1f, concerning the effect of
income. Contrary to the presumption, it seems that respondents with a low household

16
income would be more likely to use government e-services than respondents from high
income families. Seventh, H1g, concerning the effect of city size on the use of public e-
services, receives support from the data: it really seems that people living in bigger cities
more typically use public e-services than those residing in smaller settlements. For instance,
respondents living in cities of 250 000 or more inhabitants are four times as likely as
respondents from the smallest villages (less than 5 000 inhabitants) to exploit public e-
services. Nevertheless, the probability of increased e-government use is perhaps not
completely straightforward as those who live in settlements of 30 001–100 000 inhabitants
use services slightly more often than the residents of cities with 100 001–250 000
inhabitants. This might reflect the fact that families made up of well-trained adults, with
children and middle or low income levels, and who are thus heavy users of government
services, are also forced to move from big cities to surrounding middle-size and small
municipalities in a search of lower-priced houses and larger properties. This finding
suggests that digital equalities should be understood more as digital continuums or
spectrums than as dualistic phenomena (e.g. the rural-urban distinction) (Lenhart &
Horrigan, 2003).
– Insert Table 2 here –
As Table 2 shows, the LRA model produces statistically significant results with
regard to the interaction effects as well. First, the model shows that H2b and H2c are
rejected as the interaction effect between online time and age and that between online time
and children are not significant. Second, the table reveals a significant interaction effect

17
between online time and gender and that between online time and household income. Fig.1
and 2 were created to illustrate these interactions.
In response to H2a, Fig. 1 shows that, with the increase in online time, women are
more likely to use e-government services than men. Even if this finding provides support
for the hypothesis, Fig. 1 also shows that among those who spend only a little time on the
Internet, men are actually slightly ahead of women as the users of e-services. Among those
who spend a lot of time on the web, women are clearly more likely to use these than men.
The probability of men using these services does not increase at all with the increase in
their daily online time.
Fig. 2 is illustrative of the interaction between online time and household income.
As was anticipated in H2d, the respondents with a low household income use more e-
services than those with a high income level when the overall online time is high. However,
when only a little time is devoted to the Internet, there is basically no difference at all
between people with low and high household incomes in the probability of using e-
government services.
– Insert Fig. 1 and 2 here –
Figure titles:
Fig. 1. The interaction effect of online time and gender
Fig. 2. The interaction effect of online time and household income
18
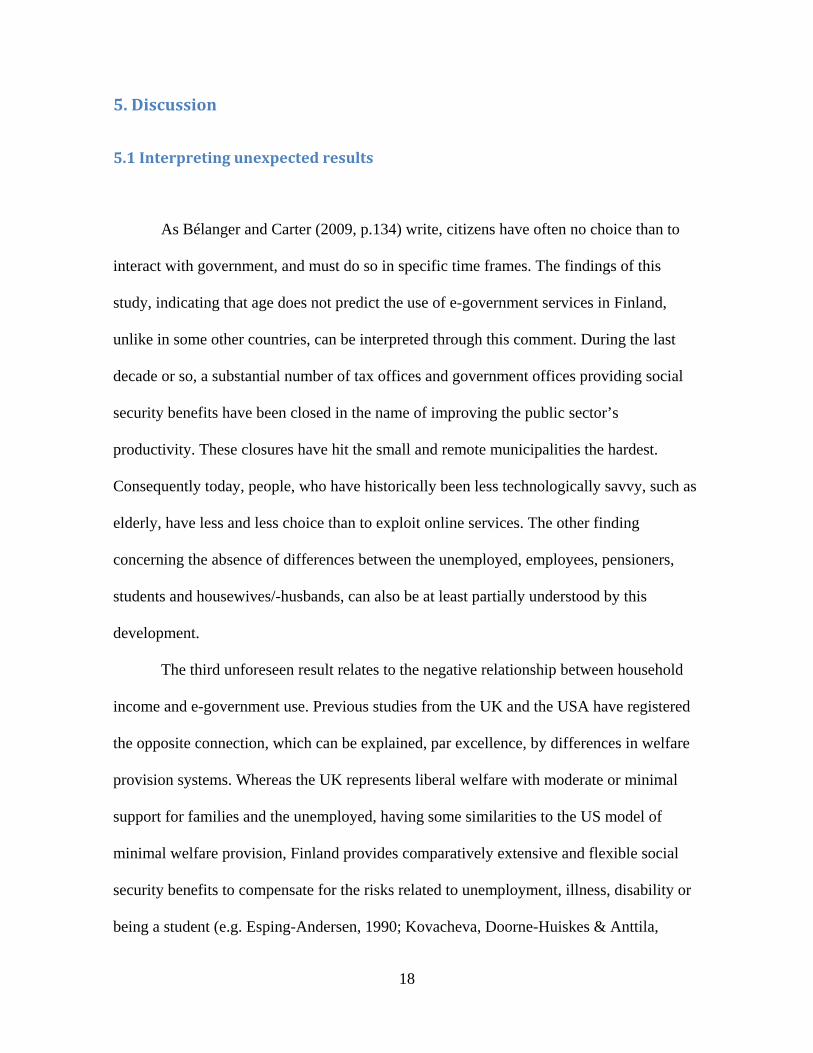
5.Discussion
5.1Interpretingunexpectedresults
As Bélanger and Carter (2009, p.134) write, citizens have often no choice than to
interact with government, and must do so in specific time frames. The findings of this
study, indicating that age does not predict the use of e-government services in Finland,
unlike in some other countries, can be interpreted through this comment. During the last
decade or so, a substantial number of tax offices and government offices providing social
security benefits have been closed in the name of improving the public sector’s
productivity. These closures have hit the small and remote municipalities the hardest.
Consequently today, people, who have historically been less technologically savvy, such as
elderly, have less and less choice than to exploit online services. The other finding
concerning the absence of differences between the unemployed, employees, pensioners,
students and housewives/-husbands, can also be at least partially understood by this
development.
The third unforeseen result relates to the negative relationship between household
income and e-government use. Previous studies from the UK and the USA have registered
the opposite connection, which can be explained, par excellence, by differences in welfare
provision systems. Whereas the UK represents liberal welfare with moderate or minimal
support for families and the unemployed, having some similarities to the US model of
minimal welfare provision, Finland provides comparatively extensive and flexible social
security benefits to compensate for the risks related to unemployment, illness, disability or
being a student (e.g. Esping-Andersen, 1990; Kovacheva, Doorne-Huiskes & Anttila,

19
2011). In fact, a low income level is typically a consequence of the realisation of these
risks, and, to access the benefit, low income people are increasingly dependent on
government e-services in Finland. The results dealing with the interaction effects also show
that if a person with a low household income is already an active Internet user in Finland,
that person is already likely to be a user of e-government services. But among those who
have a low household income and who use the Internet only occasionally, e-government
service use is also at a low level.
Lastly, interaction effects also revealed that even if gender does not directly predict
e-government service use in Finland, it modifies the way in which online time is linked to
usage. In fact, this outcome seems to be in line with the traditional division of labour in the
domestic sphere of life. It seems that the online time of women is also more strongly
connected to the domestic responsibilities such as handling of social benefits and services
on the web than that of men. In general, the discovered interaction effects support the idea
of multidimensional and complexly shaped digital inequalities as opposed to digital divides
as clear distinctions, for example, between men and women or the youth and the elderly.
Actually, the situation looks quite hopeless in terms of digital inequalities. Rural
people who would benefit most from government e-services are not using them, while in
cities that have been able to maintain office services people use also e-services. Education
that adds to people’s capability to cope in an ever more technology-mediated society seems
to be a key to increase the use of government’s e-services, although the most educated
people already live in the largest cities. All in all, the results of this study are clearly against
the technocratic approaches to digital divides. The results speak for opposite theories which
argue that existing educational and geographical disparities cannot be easily solved by
20
introducing new technology, and that new ICTs may, in the worst case, end up to serve
those who already are in an advanced position.
5.2Limitationsofthestudy
First, it is also possible that the odd ratios are slightly overestimated owing to the
modest size of the data (Nemes, Jonasson, Genell & Steineck, 2009). A larger data might
have had confirmed the statistical significance of certain effects, especially those of age and
gender. Second, the study was built upon the analysis of only one dependent variable that
was used as an indicator for the overall utilisation of public e-services. A larger variety of
indicators, separately measuring different e-services, would have made a more meticulous
picture of e-government service use possible. Third, as the study produced some findings
that departed from previous research projects conducted in other countries, cross-national
data would be needed to clarify these differences in the future.
6.Conclusionsandpolicyimplications
In conclusion, the study provided answers to both research questions. With regard
to the first question, it was revealed that not only the level of education, but also two
household level indicators, children and income, and city size, predict the use of e-
government services in Finland. Age and social position had no main effects on the usage.
In response to the second question, it was shown that gender and income moderate the
21
effect of online time on e-government service use, while other background variables had no
moderating effects. These and others findings reported in the article also have policy
implications of which the most important are as follows:
1. Practical measures are required to encourage people with a low income to use
the Internet more as this is likely to increase their interaction with the
government.
2. To promote gender equity in the handling of domestic responsibilities over the
Internet, it is pivotal to encourage males who are heavy users of the Internet to
undertake a larger share of these tasks.
3. Raising awareness and developing skills related to the use of e-government
services should be targeted especially at people who reside in remote regions
and have a low level of education. This target group also includes older citizens,
who would likewise benefit from these targeted measures to alleviate digital
inequalities.
References
Belanger, F., & Carter, L. (2009). The impact of the digital divide on e-government use.
Communications of the AC, 52(4), 132–135.
Carter, L., & Belanger, F. (2005). The utilization of e-government services: Citizens trust,
innovation and acceptance factors. Information Systems, 15, 5–25.
Carter, L. (2008). E-government diffusion: A comparison of adoption constructs.
Transforming Government: People, Process and Policy, 2, 147–161.

22
Chourdie, J., & Dwivedi, Y. (2005). A survey of citizens’ awareness and adoption of e-
government initiatives, the ‘Government Gateway’: A United Kingdom perspective.
In Z. Irani, T. Elliman & O. D. Sarikas (Eds.), Proceedings of the eGovernment
Workshop '05 (eGOV05) (pp. 1–13) London: Brunel University.
Colesca, S.E., & Dobrica, L. (2008). Adoption and use of e-government services: The case
of Romania. Journal of Applied Research and Technology, 6(2), 204–217.
Colesca, S. E. (2008). Increasing e-trust: A solution to minimize risk in e-government
adoption. Journal of Applied Quantitative Methods, 4(1), 31–44.
COM (2011). A digital agenda for Europe. Retrieved September 27, 2011, from http://eur-
lex.europa.eu/LexUriServ/LexUriServ.do?uri=COM:2010:0245:FIN:EN:PDF.
Esping-Anderssen, G. (1990). The three worlds of welfare capitalism. Cambridge: Polity
Press.
EuroStat. (2011). Information society statistics. Retrieved September 23, 2011, from
http://epp.eurostat.ec.europa.eu/portal/page/portal/information_society/data/main_ta
bles
Fortunati, L., & Manganelli. A.-M. (1998). La comunicazione tecnologica: comportamenti,
opinioni ed emozioni degli Europei [Technologhical communication behaviour,
opinions and emotions in Europe]. In L. Fortunati (Ed.), Telecomunicando in
Europa (pp. 125–94). Milan: Angeli.
Horst, M., Kuttschreuter, M., & Gutteling, J. M. (2007). Perceived usefulness, personal
experiences, risk perception and trust as determinants of adoption of e-government
services in the Netherlands. Computers in Human Behavior, 23, 1838–1852.

23
Hung, S.-Y., Chang, C.-M., & Yu, T.-J. (2006). Determinants of user acceptance of the e-
Government services: The case of online tax filing and payment system.
Government Information Quarterly, 23, 97–122.
Jones, S., Johnson-Yale, C., Millermaier, S., & Seoane Perez, F. (2009). U.S. college
students’ internet use: Race, gender and digital divides. Journal of Computer-
Mediated Communication, 14, 244–264.
Kovacheva, S., Doorne-Huiskes, A., & Anttila, T. (2011). The institutional context of the
quality of life. In M. Bäck-Wiklund, T. van der Lippe, L. den Dulk, & A. Doorne-
Huiskes (Eds.). Quality of life and work in Europe (pp. 32–54). Houndmills:
Palgrave Macmillan.
LaRose, R., Lin, C., & Eastin, M. (2003). Unregulated internet usage: Addiction, habit, or
deficient self-regulation? Media Psychology, 5, 225–253.
LaRose, R., & Eastin, M. (2004). A social cognitive theory of internet uses and
gratifications: Towards a new model of media attendance. Journal of Broadcasting
& Electronic Media, 48, 358–377.
Lenhart, A. & Horrigan, J. B. (2003). Re-visualizing the digital divide as a digital spectrum.
IT & Society, 1(5), 23–39.
Lucas, K., & Sherry J. L. (2004). Sex differences in video game play: A communication-
based explanation. Communication Research, 31, 499–523.
Mante-Meijer, E., & Klamer, L. (Eds.). (2005). ICT capabilities in action: What people do.
Luxemburg: Office for Official Publications of the European Communities.
Ministry of Finance. (2010). One-stop public administration services online: Ministry of
Finance and State Treasury announce launch of upgraded citizens' portal Suomi.fi.
Retrieved September 26, 2011, from

24
http://www.vm.fi/vm/en/03_press_releases_and_speeches/01_press_releases/20101
027Onesto/name.jsp
Ministry of Transport and Communications. (2010). Productive and inventive Finland:
Digital agenda for 2011–2020. Retrieved March 10, 2011, from
http://www.arjentietoyhteiskunta.fi/files/322/Digitaalinen_agenda_eng.pdf.
National Audit Office of Finland. (2008). Alueellisten tietoyhteiskuntahankkeiden toteutus
[Implementation of Regional Information Society Projects]. Retrieved March 3,
2011, from
http://www.vtv.fi/files/130/1582008_Alueellisten_tietoyhteiskuntahankkeiden_tote
utus_NETTI.pdf
Nemes, S., Jonasson, J., Genell, A., & Steineck, G. (2009). Bias in odds ratios by logistic
regression modelling and sample size. BMC Medical Research Methodology, 9, 56–
61.
OECD. (2010). Finland: Working together to sustain success. Paris: OECD.
On the Move: The Role of Cellular Communications in American Life. (2006). Michigan:
University of Michigan, Department of Communication Studies. Retrieved August
9, 2011, from http://itudcmc.files.wordpress.com/2010/03/onthemove1.pdf
Reddick, C. G. (2004). A two stage model of e-government growth: Theories and empirical
evidence for U.S. cities. Government Information Quarterly, 21, 51–64.
Reddick, C. G. (2005). Citizens interaction with e-government: From the streets to server?
Government Information Quarterly, 22, 38–57.
Rusten, G., & Skerratt, S. (Eds.). (2008). Information and communication technologies in
rural society: Being rural in a digital age. Oxford: Routledge.
25
Sassi, S. (2005) Cultural differentiation or social segregation? Four approaches to the
digital divide. New Media & Society, 7, 684–700.
Selwyn, N., Gorard, S., & Furlong, J. (2005). Whose Internet is it anyway? Exploring
adults’ (non)use of the Internet in everyday life. European Journal of
Communication, 20, 5–26.
Statistics Finland. (2011). Ajankäyttötutkimus 2009 [Time use survey 2009]. Helsinki:
Statistics Finland.
Strover, S. (2001). Rural internet connectivity. Telecommunications Policy, 25, 331–347.
Tabachnick, B., & Fidell, L. (2007). Using multivariate statistics (5th ed). Boston, MA:
Pearson.
Tookey, A., Whalley, J., & Howick, S. (2006). Broadband diffusion in remote and rural
Scotland. Telecommunications Policy, 30, 481–495.
Turkki, T. (2009). Nykyaikaa etsimässä: Suomen digitaalinen tulevaisuus [In search
of modern times: The digital future of Finland]. Retrieved March 13, 2010, from
http://www.eva.fi/wp-content/uploads/files/2573_nykyaikaa_etsimassa.pdf
van Dijk, J., Pieterson, W., van Deuren, A., & Ebbers, W. (2007). Services for citizens: The
Dutch usage case. In M.A. Wimmer, H.J. Scholl, & A. Grönlund (Eds.),
International Conference on Electronic Government (pp. 155–166). Berlin
Heidelberg: Springer-Verlag.
van Dijk, J., Peters, O., & Ebbers, W. (2008). Explaining the acceptance and use of
government internet services: a multivariate analysis of 2006 survey data in
Netherlands. Government Information Quarterly, 25, 379–399.
Wasserman, I. M., & Richmond-Abbott, M. (2005). Gender and the Internet: Causes of
variation in access, level, and scope of use. Social Science Quarterly, 86, 252–270.

26
Weiser, E. B. (2000). Gender differences in internet use patterns and internet application
preferences: A two-sample comparison. CyberPsychology & Behavior, 3, 167–178.
Yildiz, M. (2007). E-government research: Reviewing the literature, limitations and ways
forward. Government Information Quarterly, 24, 646–665.