The Upper Limb Functional Index: Development and Determination of Reliability, Validity, and...
22
JHT READ FOR CREDIT #039 The Upper Limb Functional Index: Development and Determination of Reliability, Validity, and Responsiveness C. Philip Gabel, MSc, PT Lori A. Michener, PhD, PT, ATC Virginia Commonwealth University Medical College of Virginia Richmond, Virginia Brendan Burkett, PhD Anne Neller, PhD University of the Sunshine Coast Queensland, Australia ABSTRACT: Purpose. Current upper limb regional self-report outcome measures are criticized for poor clinical utility, including length, ease, and time to complete and score, missing responses, and poor psychometric properties. To address these concerns a new measure, the Upper Limb Functional Index (ULFI), was devel- oped with reliability, validity, and responsiveness being deter- mined in a prospective study. Methods. Patients from nine Australian outpatient settings com- pleted the ULFI and two established scales, the Disabilities of the Arm, Shoulder, and Hand (DASH) (n ¼ 214) and the Upper Ex- tremity Functional Scale (UEFS) (n ¼ 64) concurrently to enable construct and criterion validity to be assessed. Two subgroups were used to assess test–retest reliability at 48-hour intervals (n ¼ 46) and responsiveness through distribution-based methods (n ¼ 29). Internal consistency, change scores, and missing re- sponses were calculated. Practical characteristics of the scale were assessed. Results. The ULFI correlated with the DASH (r ¼ 0.85; 95% CI) and UEFS (r ¼ 0.78; 95% confidence interval [CI]), demonstrated test– retest reliability (intraclass correlation coefficient ¼ 0.96; 95% CI) and internal consistency (Cronbach alpha ¼ 0.89). The change scores of the ULFI with standard error of the measurement was 4.5% or 1.13 ULFI-points and minimal detectable change at the 90% CI was 10.4% or 2.6 ULFI-points. Responsiveness indices were standardized response mean at 1.87 and effect size at 1.28. The ULFI demonstrated an impairment range of 0–100%, with no missing responses and a combined patient completion and thera- pist scoring time of less than 3 minutes. Conclusions. The ULFI demonstrated sound psychometric prop- erties, practical characteristics, and clinical utility thereby making it a viable clinical outcome tool for the determination of upper limb status and impairment. The ULFI is suggested as the pre- ferred upper limb regional tool due to its superior practical charac- teristics and clinical utility, and comparable psychometric properties without a tendency toward item redundancy. J HAND THER. 2006;19:328–49. The use of standardized Self-report Outcome Measures (SROMs) for the determination of func- tional impairment and the monitoring of change over time has gained increasing favor over the last decade. They are defined as ‘‘. a questionnaire completed by the patient to indicate the status of functional loss in a specific area or condition ..’’ 1–6 Musculoskeletal SROMs include condition-specific tools for the various joints and diseases and more recently, region-specific tools have emerged as the preferred option due to their greater application across a variety of clinical and research situations. 7–11 Region-specific tools con- sider the body in single kinetic chains of the spine and upper and lower extremities 8,9 and provide a means of clarifying clinical status and any subse- quent changes that may result from treatment or intervention. They are more practical and easier to implement and administer than objective clinical measures, 7,12,13 responsive to significant improve- ments over time, 10,11 and require fewer patient num- bers to detect an effect. 14 Evidence indicates that only SCIENTIFIC/CLINICAL ARTICLES Correspondence and reprint requests to C. Philip Gabel, MSc, PT, PO Box 760, Coolum, Queensland 4573, Australia; e-mail: <[email protected]>. 0894-1130/$ – see front matter Ó 2006 Hanley & Belfus, an imprint of Elsevier Inc. All rights reserved. doi:10.1197/j.jht.2006.04.001 328 JOURNAL OF HAND THERAPY
Transcript of The Upper Limb Functional Index: Development and Determination of Reliability, Validity, and...
JHT READ FOR CREDIT #039
SCIENTIFIC/CLINICAL ARTICLES
The Upper Limb Functional Index:Development and Determination of Reliability,
Validity, and Responsiveness
C. Philip Gabel, MSc, PTLori A. Michener, PhD, PT, ATC
Virginia Commonwealth UniversityMedical College of VirginiaRichmond, Virginia
Brendan Burkett, PhDAnne Neller, PhD
University of the Sunshine CoastQueensland, Australia
The use of standardized Self-report OutcomeMeasures (SROMs) for the determination of func-tional impairment and the monitoring of change overtime has gained increasing favor over the last decade.They are defined as ‘‘. a questionnaire completed bythe patient to indicate the status of functional loss in aspecific area or condition ..’’1–6 Musculoskeletal
Correspondence and reprint requests to C. Philip Gabel, MSc, PT,PO Box 760, Coolum, Queensland 4573, Australia; e-mail:<[email protected]>.
0894-1130/$ – see front matter � 2006 Hanley & Belfus, an imprintof Elsevier Inc. All rights reserved.
doi:10.1197/j.jht.2006.04.001
328 JOURNAL OF HAND THERAPY
ABSTRACT: Purpose. Current upper limb regional self-reportoutcome measures are criticized for poor clinical utility, includinglength, ease, and time to complete and score, missing responses,and poor psychometric properties. To address these concerns anew measure, the Upper Limb Functional Index (ULFI), was devel-oped with reliability, validity, and responsiveness being deter-mined in a prospective study.Methods. Patients from nine Australian outpatient settings com-pleted the ULFI and two established scales, the Disabilities of theArm, Shoulder, and Hand (DASH) (n¼ 214) and the Upper Ex-tremity Functional Scale (UEFS) (n¼ 64) concurrently to enableconstruct and criterion validity to be assessed. Two subgroupswere used to assess test–retest reliability at 48-hour intervals(n¼ 46) and responsiveness through distribution-based methods(n¼ 29). Internal consistency, change scores, and missing re-sponses were calculated. Practical characteristics of the scalewere assessed.Results. The ULFI correlated with the DASH (r¼ 0.85; 95% CI) andUEFS (r¼ 0.78; 95% confidence interval [CI]), demonstrated test–retest reliability (intraclass correlation coefficient¼ 0.96; 95% CI)and internal consistency (Cronbach alpha¼ 0.89). The changescores of the ULFI with standard error of the measurement was4.5% or 1.13 ULFI-points and minimal detectable change at the90% CI was 10.4% or 2.6 ULFI-points. Responsiveness indiceswere standardized response mean at 1.87 and effect size at 1.28.The ULFI demonstrated an impairment range of 0–100%, with nomissing responses and a combined patient completion and thera-pist scoring time of less than 3 minutes.Conclusions. The ULFI demonstrated sound psychometric prop-erties, practical characteristics, and clinical utility thereby makingit a viable clinical outcome tool for the determination of upperlimb status and impairment. The ULFI is suggested as the pre-ferred upper limb regional tool due to its superior practical charac-teristics and clinical utility, and comparable psychometricproperties without a tendency toward item redundancy.
J HAND THER. 2006;19:328–49.
SROMs include condition-specific tools for the variousjoints and diseases and more recently, region-specifictools have emerged as the preferred option due totheir greater application across a variety of clinicaland research situations.7–11 Region-specific tools con-sider the body in single kinetic chains of the spineand upper and lower extremities8,9 and provide ameans of clarifying clinical status and any subse-quent changes that may result from treatment orintervention. They are more practical and easier toimplement and administer than objective clinicalmeasures,7,12,13 responsive to significant improve-ments over time,10,11 and require fewer patient num-bers to detect an effect.14 Evidence indicates that only

a modest correlation exists between impairment status,functional loss, and subsequent participation.15–19
highlighting the importance of SROM tool use.Professional organizations and third-party insurancepayers emphasize the need for tools that are bothvalid and clinically relevant.8,16,20,21
Only four region-specific upper limb tools devel-oped for use in general populations were found in theliterature: the Disabilities of the Arm, Shoulder, andHand (DASH),9 the Upper Extremity FunctionalScale (UEFS),14 the Upper Extremity FunctionalIndex (UEFI),10 and the Neck and Upper LimbIndex (NULI).22 Each of these tools uses item state-ments to test different constructs that can be broadlycategorized into four themes: upper limb specificfunction—such as writing, holding, using utensils,and over head activity; general function—such asdriving, work, hobbies, and house chores; health-related quality of life (HRQOL)—such as sleeping,social contact, anxiety, and irritability; and pain spe-cific—such as intensity, duration, and ease ofprovocation.
Specific deficiencies have been identified in eachof these tools that limit their adoption within theclinical setting. These involve four areas. First,‘‘comprehensiveness,’’ relating to both adequacy ofthe item domains covered by the tool7,23–25 and gen-eralization from a specific sample population, suchas workers in the UEFS and NULI.14,26,27 Second,‘‘relevance,’’ pertaining to small samples with ahigh average age as in development of theUEFI.10,25 Third, ‘‘practical characteristics,’’ limitingclinical utility due to excessive time or errors incompletion and scoring, particularly missing re-sponses (items not marked or not applicable) asnoted for each of the four published tools, as aLikert scale is used,7,8,14,25 or redundancy (the pres-ence of several similar items) as in the DASH andNULI.7,25 Finally, ‘‘psychometric properties,’’ in-cluding the reliability or stability a tool has andwhether it can measure change, as is the case withthe UEFS7,10 and significant variations in the levelof responsiveness, as found with the DASH.7,28,29
Since the effectiveness of any intervention strategycan be demonstrated best by accurate measurement,the tools used to assess outcome must consequentlyreflect this by being valid, reliable, responsive, andrepresentative of the target population.30–34 In deter-mining if there is a genuine need for a new tool, threefactors must be considered: the goals of the intendedmeasure, whether existing measures meet thesegoals, and if they have deficiencies in either theirpractical characteristics or psychometric proper-ties.10,35 These fundamental requirements for anySROM tool have been supported by numerous publi-cations over the past two decades.7,35–38 The inade-quacies of the existing tools noted above indicatethe need for a SROM that is clinically utile with
brevity and ease of completion; is simple to scorewith no serious floor or ceiling effects in general clin-ical populations; has minimal missing responses; anddemonstrates the essential psychometric propertiesthrough validity, reliability, and responsiveness.7,11
If the decision to develop a new tool is made, thensuch a tool should be consistent with the accepteddefinition of activity limitation defined by theWorld Health Organization’s InternationalClassification of Impairments, Activities, andParticipation as ‘‘. difficulties an individual mayhave in executing activities.’’39 This definition placesemphasis on neutral or positive terms and the avoid-ance of negative terms such as disability and handi-cap present in the original definition.
The present study has three aims. First, to developand validate the initial core quantitative componentof the Upper Limb Functional Index (ULFI) through asingle-page, three-part SROM with an initial quanti-tative 25 items focused on assessing HRQOL andupper extremity dysfunction, a subsequent PatientSpecific Index (PSI) section for interpreting qualita-tive information,40,41 and an 11-point VisualAnalogue Scale (VAS) for current ‘‘overall status’’compared to the preinjury or ‘‘normal’’ level (seeAppendix A). Second, to concurrently compare theperformance of the ULFI with the criteria standardsof the DASH and UEFS in terms of psychometricproperties and practical characteristics. The DASHand UEFS were chosen as they represent advocatedand established standards from the peer reviewed lit-erature,8,9,42 their measurement properties have beenformally demonstrated and independently vali-dated,10,14,29 and they represent both ends of the prac-ticality scale in terms of length, ease of administrationand scoring during patient interaction.43 The UEFIand NULI were not selected as both lacked publishedindependent investigation at the initiation of this re-search and were developed from specific populationsamples that lacked broad demographics in termsof age and occupation, respectively. Third, to makerecommendations on a preferred clinical tool andrequirements for subsequent investigations.
MATERIALS AND METHODS
Study Design
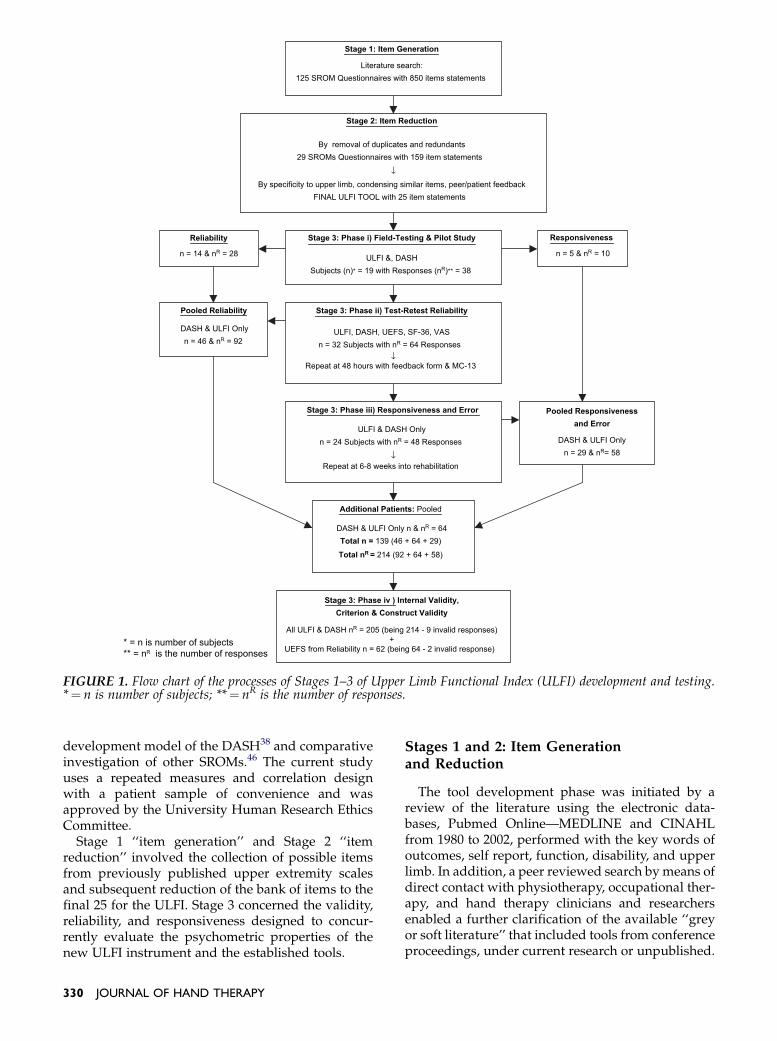
The development, construction, and final valida-tion of a new regional upper limb questionnairerequire a methodological process that is systematicand follows established protocols. The ‘‘GuyattModel’’ of questionnaire development30,44,45 achievesthis through its systematic three-stage processas demonstrated in Figure 1. This model and processincorporate the literature search and review strategyinstituted by Michener and Leggins7 and mirror the
July–September 2006 329
Stage 3: Phase i) Field-Testing & Pilot Study
ULFI &, DASHSubjects (n)* = 19 with Responses (nR)** = 38
Pooled Responsiveness
and Error
DASH & ULFI Onlyn = 29 & nR= 58
Stage 2: Item Reduction
By removal of duplicates and redundants29 SROMs Questionnaires with 159 item statements
↓
By specificity to upper limb, condensing similar items, peer/patient feedbackFINAL ULFI TOOL with 25 item statements
Reliability
n = 14 & nR = 28
Responsiveness
n = 5 & nR = 10
Stage 3: Phase ii) Test-Retest Reliability
ULFI, DASH, UEFS, SF-36, VASn = 32 Subjects with nR = 64 Responses
↓Repeat at 48 hours with feedback form & MC-13
Pooled Reliability
DASH & ULFI Onlyn = 46 & nR = 92
Stage 3: Phase iii) Responsiveness and Error
ULFI & DASH Onlyn = 24 Subjects with nR = 48 Responses
↓Repeat at 6-8 weeks into rehabilitation
Additional Patients: Pooled
DASH & ULFI Only n & nR = 64Total n = 139 (46 + 64 + 29)
Total nR
= 214 (92 + 64 + 58)
Stage 1: Item Generation
Literature search:125 SROM Questionnaires with 850 items statements
Stage 3: Phase iv ) Internal Validity,
Criterion & Construct Validity
All ULFI & DASH nR = 205 (being 214 - 9 invalid responses)+
UEFS from Reliability n = 62 (being 64 - 2 invalid response) * = n is number of subjects** = nR is the number of responses
FIGURE 1. Flow chart of the processes of Stages 1–3 of Upper Limb Functional Index (ULFI) development and testing.*¼ n is number of subjects; **¼ nR is the number of responses.
development model of the DASH38 and comparativeinvestigation of other SROMs.46 The current studyuses a repeated measures and correlation designwith a patient sample of convenience and wasapproved by the University Human Research EthicsCommittee.
Stage 1 ‘‘item generation’’ and Stage 2 ‘‘itemreduction’’ involved the collection of possible itemsfrom previously published upper extremity scalesand subsequent reduction of the bank of items to thefinal 25 for the ULFI. Stage 3 concerned the validity,reliability, and responsiveness designed to concur-rently evaluate the psychometric properties of thenew ULFI instrument and the established tools.
330 JOURNAL OF HAND THERAPY
Stages 1 and 2: Item Generationand Reduction
The tool development phase was initiated by areview of the literature using the electronic data-bases, Pubmed Online—MEDLINE and CINAHLfrom 1980 to 2002, performed with the key words ofoutcomes, self report, function, disability, and upperlimb. In addition, a peer reviewed search by means ofdirect contact with physiotherapy, occupational ther-apy, and hand therapy clinicians and researchersenabled a further clarification of the available ‘‘greyor soft literature’’ that included tools from conferenceproceedings, under current research or unpublished.

Stage 1 ‘‘item generation’’ produced a total of 71SROMs that provided 850 potential items for anupper limb questionnaire tool. Stage 2 ‘‘item reduc-tion’’ reduced the list to 29 SROMs and 159 itemsthrough removal of duplications and redundancies.These were in turn reduced to the final 25 items forStage 3 by item exclusion based on specificity to theupper limb or HRQOL, condensing similar items intoa single item10,38 and peer and patient feedback. Theprocess also determined the tool format for the essen-tial quantitative item statements plus the qualitativeand VAS status sections, thereby ensuring that bothface and content validity were accounted for in thedevelopment phase.9,34,47,48
Stage 3: Reliability and Validity Testing
Subjects
Stage 3 involved four phases: Phase i—an initialpilot investigation (n¼ 19 subjects providing 38 re-sponses), for preliminary assessment of reliability, re-sponsiveness, and the presence of floor capacity andceiling effect. Phases ii–iv of Stage 3 were designed toassess the psychometric properties of the SROMs us-ing a further 120 subjects to provide 176 responses.Specifically, Phase ii, test–retest reliability (n¼ 32with 64 responses); Phase iii, responsiveness (n¼ 24with 48 responses); and Phase iv, the internal consis-tency, criterion, and construct validity (n¼ 64 with 64responses), see Figure 1 and Table 1. All phases inStage 3 involved a total of 139 different subjects pro-viding 214 responses sampled from nine locations inthree Australian states and Territories representingpublic health, private health (medical, rehabilitation,and physiotherapy), and Department of Defenceestablishments. Subject inclusion criteria were anypatients, at least 18 years old, with upper limbsymptoms under medical or allied health manage-ment. Exclusion criteria were inability to readEnglish or respond to the questionnaire. All subjects
completed an intake form for demographic data,the newly developed ULFI and the DASH. Varyingsubsamples of subjects in Stage 3 completed an 11-point VAS for status, the Short-Form 36 (SF-36) gen-eral health measure,49 and the Marlowe–CrowneShort-Form 13 (MC-13) psychological screening toolfor social desirability and the UEFS.
The DASH is a SROM with three parts. The firstsection consists of instructions, the second containsthe essential 30 items, and the third is an optionalmodule for the assessment of sports and performingarts. A 1–5 Likert scale is used for each item with asubsequent score range of 30–150. This raw score isrecalculated for expression on a 100-point scale bysubtracting 30 then dividing by 1.2 and allows forup to three missing responses by adding the numberof missing factors multiplied by the average of theinitial score per item. The DASH was developed us-ing the previously described three-stage model,38
validated,29 then published with supporting researchon its test–retest reliability, construct validity, andresponsiveness.9
The UEFS is a practical SROM, with one sectioncontaining eight items using a 0–10 Likert scale for-mat. This provides a potential summated score rangefrom 0 to 80 and multiplied by 1.25 to be converted toa 100-point scale. One missing response is permittedand accounted for by interpolation into the final scoreas the average of the other responses. The UEFS wasspecifically developed to measure the impact of up-per extremity disorders on function in a workers’compensation population. The item list was selectedfrom an original set of 12 obtained by means of dis-cussion groups using physicians, occupational thera-pists, and patients. This tool has a functional focuswith only one item being oriented to HRQOL.7,8,10,14
Phase i of Stage 3: The pilot investigation of theULFI and DASH was performed to determine a pre-liminary assessment of reliability (n¼ 14 subjectswith 28 responses) and responsiveness (n¼ 5 subjectswith 10 responses). In addition, the capacity to
TABLE 1. Patient Numbers and Types of Data Collected in Stage 3
Patients (n) Responses (nR) ULFI DASH UEFS
Pilot test–retest 19 38 Yes Yes NoMain test–retest 32 64 Yes Yes YesResponsiveness 24 48 Yes Yes NoAdditional patients
for comparison64 64 Yes Yes No
Total 139 214
Missing responses 58 78 0 72 (33.6%) 6 (9.4%)Invalid responses 4 4 1 (0.5%) 3 (1.4%) 2 (3.1%)Others excluded 5 5 5 from
use of ½ marks0 0
Data analysis total 130* 205* 208 211 63y
ULFI¼Upper Limb Functional Index; DASH¼Disabilities of the Arm, Shoulder, and Hand; UEFS¼Upper Extremity Functional Scale.*Total n¼ 130 and nR¼ 205 for ULFI and DASH criterion and construct comparison as nine patients and their responses were excluded.yTotal n¼ 31 and nR¼ 62 for UEFS as one patient’s repeated responses were excluded.
July–September 2006 331
measure floor response was determined in a test sam-ple of asymptomatic ‘‘normal’’ subjects (n¼ 8). Thefloor response is ‘‘0,’’ the lowest possible score, whilethe ceiling response is ‘‘100,’’ the highest possiblescore. This pilot investigation was also designed toascertain the practicality of the intended samplingmethodology and provide data for calculating therequired minimum sample size. To account for thepotential of missing response items within a dichoto-mous tool with a single response option and no con-firmatory negative, participants in the pilot studywere asked to use a ‘‘U’’ or ‘‘X’’ to, respectively, indi-cate their positive or negative response. No missingresponses were found.
Sample size required for the reliability phase wasdetermined by calculating the ‘‘power of the sample’’using the Dawson and Trapp Method50 whererequired sample size (n) is:
n ¼ fðZa� ZbÞ3 SDg2
fU1�U0g
(U1�U0) ¼ clinically important difference betweenthe means; SD ¼ standard deviation in the popula-tion; Za¼ two tailed; and Zb¼ lower tail as definedfrom Tables of significance levels.
The minimum required sample size for reliabilitywas n¼ 28 patients to ensure an 80% confidence levelin determining actual change. This estimate convertsto a minimum n¼ 32 when an attrition rate of 12.5%is anticipated to provide a pooled sample of n¼ 46with the pilot sample included. The values comparefavorably with the sample size used by Stratfordet al.10 in developing the UEFI where n¼ 28 was esti-mated for test–retest reliability and n¼ 47 for cross-sectional and longitudinal validity. In determiningthe required total sample Stratford et al.10 estimateda minimum of 196 responses for criterion investiga-tion as calculated using Meng’s test of significanceand solving for n.51,52 This number compares favor-ably with the total of 214 responses in this study forcomparative investigation of the ULFI and DASH.
Phase ii of Stage 3: the assessment of test–retest re-liability of the ULFI, DASH, and UEFS involved asubgroup of subjects (n¼ 32) who completed all threeSROMs at baseline then again after 48 hours. Notreatment was administered between the two datacollection times. A VAS of functional status wasused to evaluate if any change occurred betweenthe data collection days53 with a permitted limit of ei-ther ‘‘change¼ 0,’’ or ‘‘0þ/� 1’’ as the bounds of ac-ceptance for inclusion.9 For the DASH and ULFI, thedata were combined with the pilot study for the finaldetermination of test–retest reliability.
Phase iii of Stage 3: the assessment of responsive-ness and error was determined only for the ULFI andDASH using a subgroup of subjects (n¼ 24) whowere retrospectively combined with those of the pilot
332 JOURNAL OF HAND THERAPY
study (n¼ 5) to provide a pooled sample (n¼ 29).The UEFS was not tested in this phase as test–retestreliability and construct validity indicated that thepsychometric properties of the DASH were consis-tently more favorable, supporting previous upperextremity SROM research.7,10,54 Responsivenessevaluation requires that some sort of change hasoccurred and can be verified in some way so that apatient’s score on any SROM can be tested againstthis change to determine if a true response hasoccurred.7,9,11 In this study, the model proposed byBeaton et al.9 for the DASH was followed as the stan-dard where the external inclusion criterion of‘‘known group difference’’ was natural healing timesfrom the initial to final test periods. These naturaltimes included baseline measures of upper limb sta-tus that were postoperative, acute posttrauma withfracture or grade 2þ ligament sprain, or initial reha-bilitation commencement with a VAS as the criterionmeasure for overall status. After the completion of asix- to eight-week rehabilitation program the subjectsagain completed the measures. In addition, the use ofa distribution-based method was selected with theknown and accepted minimal detectable change(MDC) for the DASH of 10.7% being thecriterion.8,9,29,42,55
Phase iv of stage 3: the assessment of criterion va-lidity (with the DASH as the criterion measure), con-struct validity (through distributional analysis,‘‘known group’’ difference and ‘‘response severity or-der’’), and internal consistency required additionalsubjects (n¼ 64) to ensure adequate sample size.These subjects completed the ULFI and the DASHconcurrently on one occasion to give the final pooledsample (n¼ 214).
The data collected from Stage 3 were analyzed forpractical characteristics and the accepted psychomet-ric properties described previously.8–10,42,43 Datadistribution was also analyzed using within-limbgrouping9 where each tool’s responses were groupedinto 10 categories that included the floor and ceilingscore and eight even whole number groups withanalysis made for all data, the whole limb, and thethree within-limb categories. The practical character-istics analyzed include being self-administered, brev-ity in terms of length as well as time for completionand scoring, application across a variety of conditionsand disease severity levels, ease of understandingand relevance to specific populations and condi-tions.8,10,35,43 To present a summarized overview ofall characteristics a newly formed ‘‘measurement ofoutcome measures’’ dichotomous tool is introducedthat provides an indicator of a SROM’s potentialvalue through a ‘‘rule of thumb’’ method from a sum-mated percentage score.25
Test–retest reliability was assessed for all threeSROMs using Type 2,1 intraclass correlation co-efficients (ICCs) and the corresponding two-sided
95% confidence interval (CI)56 to provide an estimateof how closely the numeric scores were to each other(concordance), considered a stronger statistic for thedescription of reliability.57–59 Data were analyzedfrom the respective subgroup participants who com-pleted two separate measures 48 hours apart during aperiod of no treatment. All subjects completed a par-ticipants’ details form, the ULFI, DASH, UEFS, theSF-36, and an 11-point VAS for functional status oninitial testing. This was repeated on the second occa-sion with the details form replaced with the MC-13and a further 11-point VAS scale for feedback infour areas: completion ease, confusion, explanation,and the SROM’s reflection of their condition. To com-pensate for any change between the test times, scoreswere analyzed with respect to the VAS overall statusscale.53 The values on each occasion were categorizedinto a permitted limit of either ‘‘change¼ 0,’’ or ‘‘0þ/� 1’’ as the bounds of acceptance for inclusion9 withanalysis made based upon the sample size exceedingthat required for power.50
Measurement error was determined by calculatingthe standard error of the measurement (SEM) andMDC at the 90% and 95% CI levels. There are twomethods to achieve these values that are dependenton the use of either the Cronbach alpha (CA) coeffi-cient for internal consistency or the test–retest relia-bility coefficient (Rxx) with both coefficients havinga range capacity of 0 through 1. It is argued that theCA method is preferred for a sample size less than300 where research is clinically based because theCA value moves away from longitudinal stability asthe source of the variance and favors a cross-sectionalstrength analysis for an instrument where high corre-lation is present between items.57,60–62 However,since the test–retest sample size exceeded the re-quired n¼ 28 minimum for power and the total sam-ple size for criterion comparison was n¼ 214, whichapproaches the estimated size of 300 where Rxx willapproximate CA, the former was selected as the crit-ical variable for calculating SEM. This method wasthe same as that advocated by Michener andLeggins7 and used by Beaton et al.9 and Stratfordet al.10 in development of their upper limb toolsand further supported in SROM investigations ofthe lumbar spine by Davidson and Keating11 andthe lower limb by Binkley et al.63 where
SEM ¼ SD100ðat base lineÞ3Oð1� RxxÞ
SEM subsequently provides MDC90 and MDC95
where the tabled Z values are, respectively, 1.65 and1.96 at the 90% and 95% CI levels. This calculationcan be interpreted as the magnitude of change, ex-pressed in either scale points or on a percentage basis,required to be 90% or 95% confident that the ob-served change is real and not measurement error.64
MDC ¼ Z value 3 O2 3 SEM
Criterion validity was determined by concurrentcomparison of the respective questionnaires for thesampled group with the total available data poolminus any incomplete responses. A Pearson coeffi-cient was used to determine the correlation betweenthe total score of each tool.
Construct validity was investigated by threemethods.
The distributional analysis of responses was per-formed to determine the presence of a Gaussian or‘‘bell shape’’ curve, skew or bias toward a floor orceiling effect that included within-limb componentsand a comparison of proximal versus distal means,the latter expected to be higher thus showing greaterfunctional loss.7,9 The responses were considered in10 categories with a single category for each of floorand ceiling scores, respectively, Categories 1 and 10.The remaining eight categories were whole numbergroups from the individual scales: DASH, groups of15 points and a final group of 14 points; ULFI, groupsof three points; and UEFS, groups of eight points anda final group of seven points. In this way distributioncan be related to an approximated normal or ‘‘bellcurve’’ indicating Gaussian distribution. Data re-sponse and distribution within the four kinetic chaincomponents of the limb were also investigated: 1) dis-tal being the wrist and hand, 2) central being the fore-arm and elbow, 3) proximal being the shoulder andupper arm, and 4) general being those conditionsthat affected the whole limb, e.g., complex regionalpain syndrome and lymphedema. This method indi-cates the presence or potential for skew or bias to acomponent of the limb via comparison of the distri-bution, both range and type, as well as the proximalversus distal means.
The ‘‘known group’’ method compared initial andfinal scores from a period of known natural healingwith expected improvement. A simple difference t-test at a CI of 0.95 comparing these prospectivesubgroup measurements was used.9
Response severity order is a new concept, whichranks the mean item score to reflect the order ofseverity or incidence of impairment, and is deter-mined by calculating the mean score for the individ-ual items within the total data pool. If an item wasmarked as a maximum score by every respondent,then it would score a ‘‘floor effect’’ (1.0). Conversely,an item never marked would score ‘‘ceiling effect’’(0.0) with item redundancy present in either case. Forthe ULFI, the score is the mean of all scores as themaximum value for the scale is 1. For the DASH, thescore is calculated by obtaining the mean, subtracting‘‘1,’’ as the true measure is on a scale of four beingfrom 1 to 5, then dividing by four. For the UEFS, thescore is achieved by dividing the mean by the item
July–September 2006 333

scale range of 10. Analysis can be made from rankingof the mean score for each item, which reflectsseverity order rather than simply the order in whichit occurs; the total range of the item means as apercentage value calculated from ‘‘1—mean value;’’and the number of 20% increment categories that arerepresented.65 Severity scores will indicate the pro-portion of responses of the total data pool that weremade for any item. Items with lower mean values, be-ing a higher percentage score will indicate higher im-pairment and be the last items indicated, while thosewith lower percentage scores will be first and demon-strate sensitivity to initial impairments in functionand HRQOL.
Missing responses are anticipated in all SROMsbeing noted as ‘‘not applicable’’ or left blank inLikert format tools.7,9,29 There is an acceptable limitof up to 10% of the total available question items. Ifthe number of missing responses exceeds this limitthe questionnaire is considered invalid.43,65 The miss-ing response score is accounted for by the addition ofthe mean of the remaining item scores for eachmissed response and is used to calculate the finalscore—as is the case for both the DASH and UEFS.In dichotomous tools two response boxes may beused to account for a confirmatory negative, butwith a single response option the incidence of miss-ing responses should be accounted for in either thedevelopment and validation stage or by furtherinvestigation using the negative response option.
Responsiveness, defined as ‘‘the ability to detectmeaningful change over time when it has oc-curred’’66,67 has also been referred to as ‘‘sensitivityto change.’’45 It is not a fixed property of an instru-ment and consequently argued as not always beingthe most critical.9 The essential statistics used arestandard response mean (SRM) and effect size(ES).43,68–70 These are defined as:
1. SRM: mean change divided by the SD of changescores.33,71,72
2. ES: the mean change divided by the SD of baselinescores.32,73
Internal consistency was assessed through the useof CA for the full available sample of SROMs.
Practical characteristics are considered within thecontext of four of the eight essential areas35 as notedin Table 7. Each tool considered in this study alreadyhad four of these requirements established, these be-ing self-administered, applicable across a variety ofconditions, disease severity levels, and relevant tospecific designated populations. Of the remainingfour characteristics, consideration of tool length wasevident from face validity while completion and scor-ing times were assessed by measuring elapsed timefor each tool in a subsample of n¼ 20 subjects. Theease of understanding was determined from thefour aspects of the 11-point VAS evaluation scale
334 JOURNAL OF HAND THERAPY
questionnaire administered during test–retest relia-bility assessment.
A summarized consideration of the 25 essentialmethodological, practical, distributional, and generalcharacteristics of each tool, with two additional sup-plementary characteristics identified, has been madeand represented in the ‘‘measurement of outcomemeasures’’ dichotomous tool in Table 7. This toolcan be used by the clinician and researcher to quicklyascertain if the required characteristics of any SROMare represented. The summated score, a percentagevalue, is used for direct comparison to assist deter-mining the recommendations of this study.
RESULTS
The study sample provided 214 responses from139 subjects for both the ULFI and DASH with ninesubjects and their responses being excluded provid-ing a final total of 205 responses from 130 subjects.The UEFS had 64 responses from 32 subjects withone subject and his or her responses excluded to pro-vide a total of 62 responses from 31 subjects (Table 1).The demographic data on all subjects are detailed inTable 2.
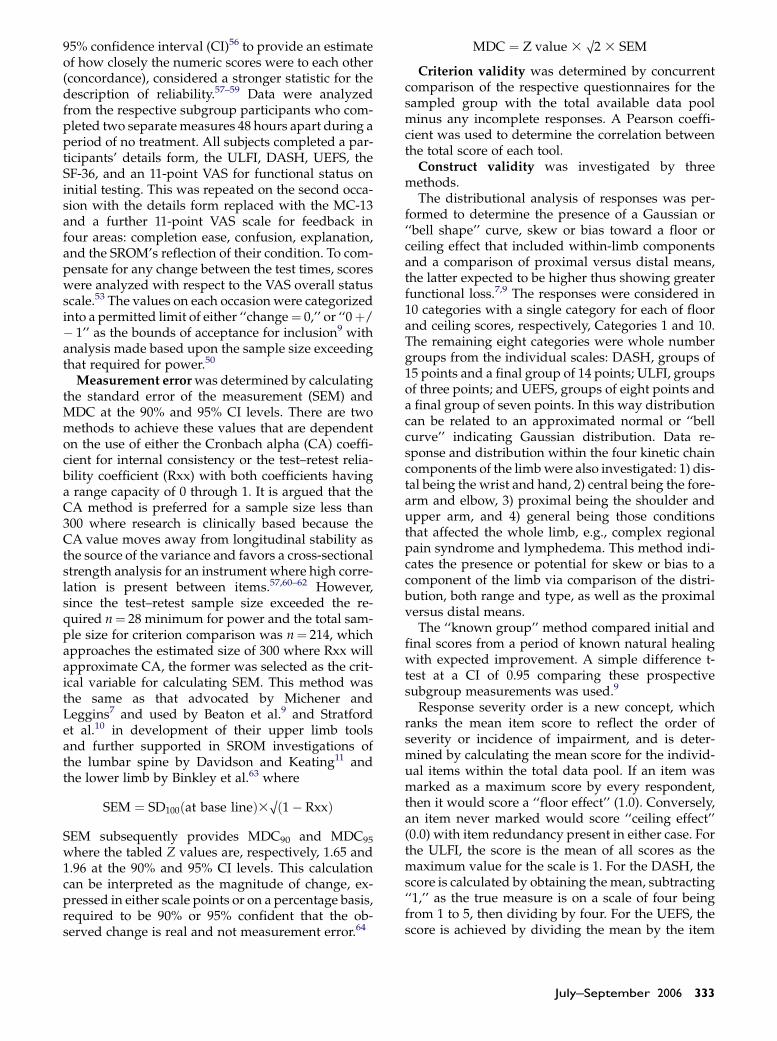
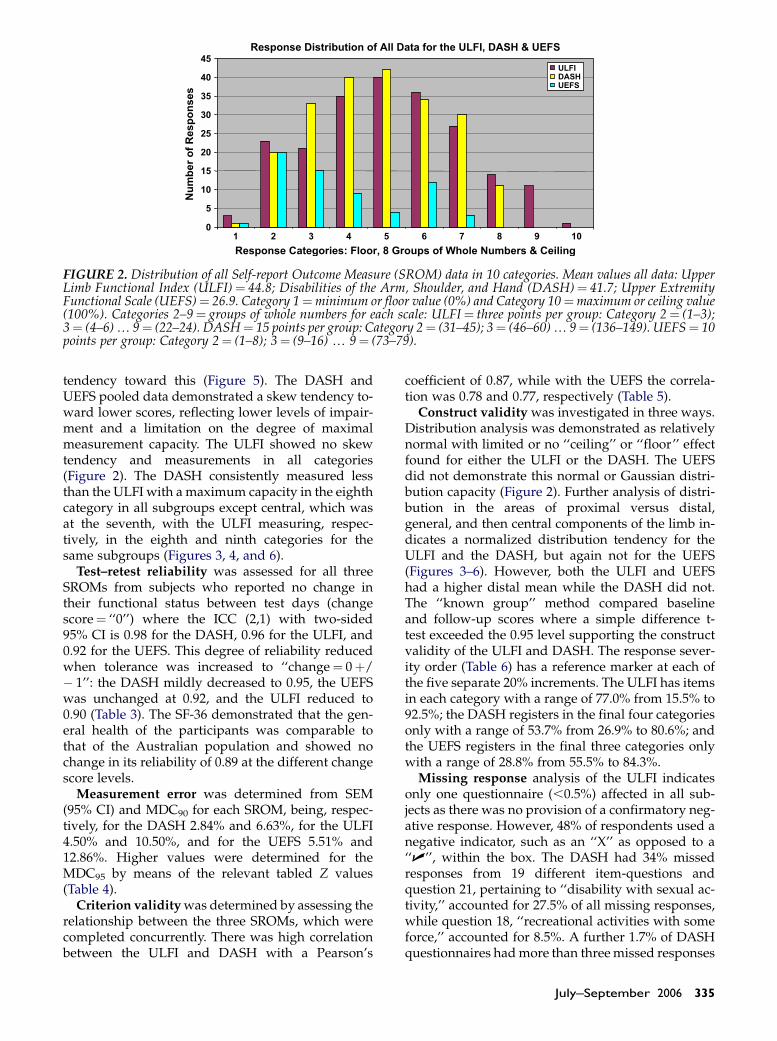
Data distribution demonstrated substantial vari-ance in all values for the three SROMs. The DASHand UEFS demonstrated a floor response for one sub-ject but no ceiling response. The ULFI demonstrated afloor response for three subjects and ceiling responsefor one subject. Maximum scores were 84.5% for theDASH, 73.7% for the UEFS, and 100% or ceiling forthe ULFI (Figure 2). The ULFI and DASH demon-strated relatively normal distribution for the datapool as well as for the categories of proximal, central,and general upper extremity injuries. The UEFS dem-onstrated relatively normal distribution for the cen-tral category, but was inconsistent in distribution inthe other subcategories and for the pooled data. Notool demonstrated a normalized distribution for thedistal region, though the ULFI and DASH showed a
TABLE 2. Subject Demographics
Subjects n¼ 139
Age 48.36 yrs, SD 15.60 yrsGender Male 46%, female 54%Employer Government 9.9%, private
sector 67.7%, military 11.1%, notstated 2.4%, retired 8.9%
Condition duration All data: 114.2 wks SD¼ 415.2; withremoval of threeoutliers: 24.5 wks, SD¼ 28.8
Dominance Left hand 21%, righthand 77%, nondominant 2%
Work status Employed 60.8%, unemployed 39.2%Injury at work Yes 40%, No 56%, Unsure 4%Workers’ comp Yes 19.5%, No 80.5%
SD¼ standard deviation.
ULFI
DASH
UEFS
Response Distribution of All Data for the ULFI, DASH & UEFS
Response Categories: Floor, 8 Groups of Whole Numbers & Ceiling
40
45
35
15
20
25
30
Nu
mb
er o
f R
esp
on
ses
10
5
0
1 2 3 4 5 6 7 8 9 10
FIGURE 2. Distribution of all Self-report Outcome Measure (SROM) data in 10 categories. Mean values all data: UpperLimb Functional Index (ULFI)¼ 44.8; Disabilities of the Arm, Shoulder, and Hand (DASH)¼ 41.7; Upper ExtremityFunctional Scale (UEFS)¼ 26.9. Category 1¼minimum or floor value (0%) and Category 10¼maximum or ceiling value(100%). Categories 2–9¼ groups of whole numbers for each scale: ULFI¼ three points per group: Category 2¼ (1–3);3¼ (4–6) . 9¼ (22–24). DASH¼ 15 points per group: Category 2¼ (31–45); 3¼ (46–60) . 9¼ (136–149). UEFS¼ 10points per group: Category 2¼ (1–8); 3¼ (9–16) . 9¼ (73–79).
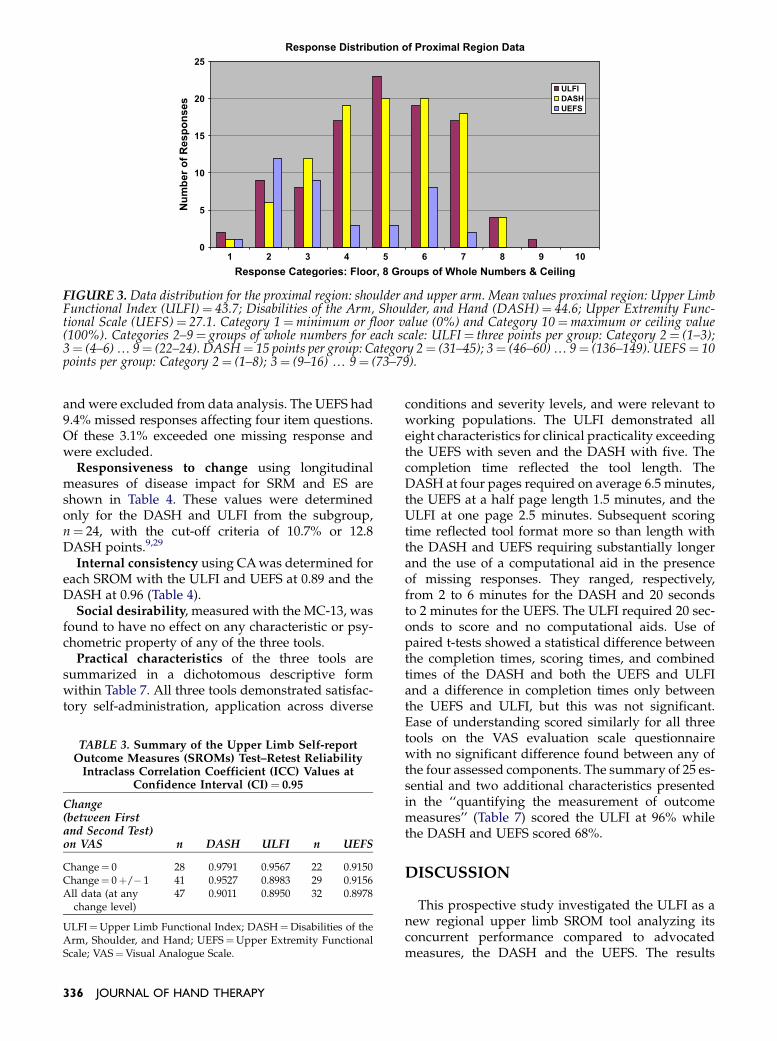
tendency toward this (Figure 5). The DASH andUEFS pooled data demonstrated a skew tendency to-ward lower scores, reflecting lower levels of impair-ment and a limitation on the degree of maximalmeasurement capacity. The ULFI showed no skewtendency and measurements in all categories(Figure 2). The DASH consistently measured lessthan the ULFI with a maximum capacity in the eighthcategory in all subgroups except central, which wasat the seventh, with the ULFI measuring, respec-tively, in the eighth and ninth categories for thesame subgroups (Figures 3, 4, and 6).
Test–retest reliability was assessed for all threeSROMs from subjects who reported no change intheir functional status between test days (changescore¼ ‘‘0’’) where the ICC (2,1) with two-sided95% CI is 0.98 for the DASH, 0.96 for the ULFI, and0.92 for the UEFS. This degree of reliability reducedwhen tolerance was increased to ‘‘change¼ 0þ/� 1’’: the DASH mildly decreased to 0.95, the UEFSwas unchanged at 0.92, and the ULFI reduced to0.90 (Table 3). The SF-36 demonstrated that the gen-eral health of the participants was comparable tothat of the Australian population and showed nochange in its reliability of 0.89 at the different changescore levels.
Measurement error was determined from SEM(95% CI) and MDC90 for each SROM, being, respec-tively, for the DASH 2.84% and 6.63%, for the ULFI4.50% and 10.50%, and for the UEFS 5.51% and12.86%. Higher values were determined for theMDC95 by means of the relevant tabled Z values(Table 4).
Criterion validity was determined by assessing therelationship between the three SROMs, which werecompleted concurrently. There was high correlationbetween the ULFI and DASH with a Pearson’s
coefficient of 0.87, while with the UEFS the correla-tion was 0.78 and 0.77, respectively (Table 5).
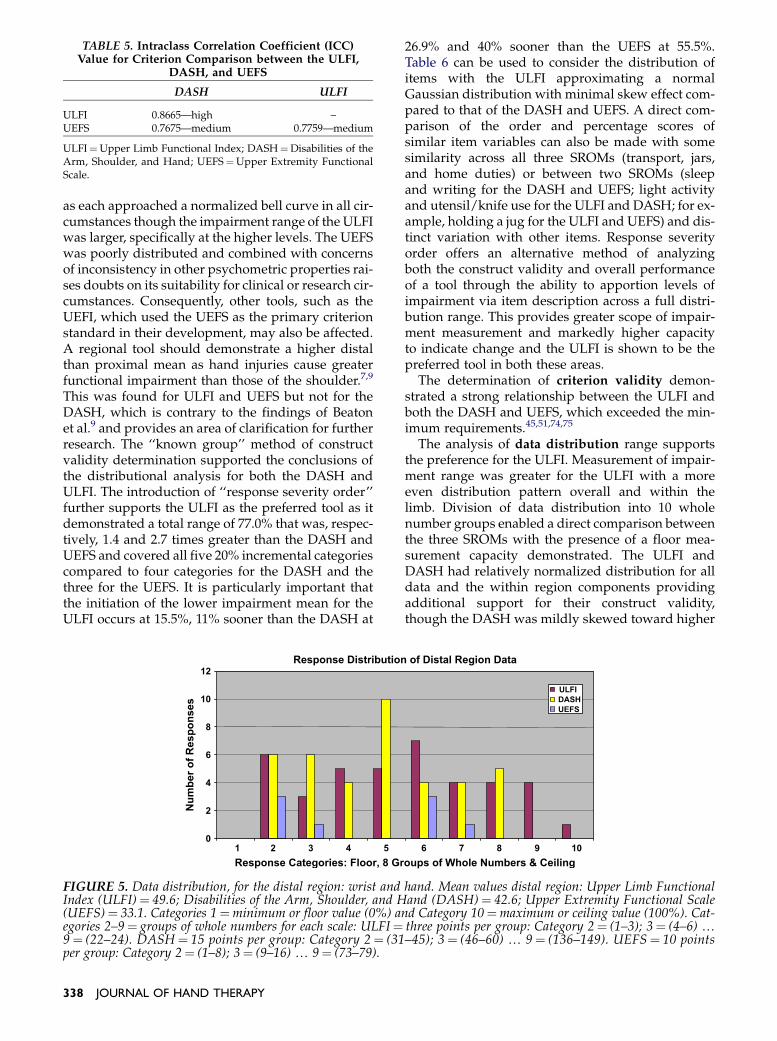
Construct validity was investigated in three ways.Distribution analysis was demonstrated as relativelynormal with limited or no ‘‘ceiling’’ or ‘‘floor’’ effectfound for either the ULFI or the DASH. The UEFSdid not demonstrate this normal or Gaussian distri-bution capacity (Figure 2). Further analysis of distri-bution in the areas of proximal versus distal,general, and then central components of the limb in-dicates a normalized distribution tendency for theULFI and the DASH, but again not for the UEFS(Figures 3–6). However, both the ULFI and UEFShad a higher distal mean while the DASH did not.The ‘‘known group’’ method compared baselineand follow-up scores where a simple difference t-test exceeded the 0.95 level supporting the constructvalidity of the ULFI and DASH. The response sever-ity order (Table 6) has a reference marker at each ofthe five separate 20% increments. The ULFI has itemsin each category with a range of 77.0% from 15.5% to92.5%; the DASH registers in the final four categoriesonly with a range of 53.7% from 26.9% to 80.6%; andthe UEFS registers in the final three categories onlywith a range of 28.8% from 55.5% to 84.3%.
Missing response analysis of the ULFI indicatesonly one questionnaire (,0.5%) affected in all sub-jects as there was no provision of a confirmatory neg-ative response. However, 48% of respondents used anegative indicator, such as an ‘‘X’’ as opposed to a‘‘U’’, within the box. The DASH had 34% missedresponses from 19 different item-questions andquestion 21, pertaining to ‘‘disability with sexual ac-tivity,’’ accounted for 27.5% of all missing responses,while question 18, ‘‘recreational activities with someforce,’’ accounted for 8.5%. A further 1.7% of DASHquestionnaires had more than three missed responses
July–September 2006 335
Response Distribution of Proximal Region Data
Response Categories: Floor, 8 Groups of Whole Numbers & Ceiling
0
5
10
15
Nu
mb
er o
f R
esp
on
ses 20
25
1 2 3 4 5 6 7 8 9 10
ULFI
DASH
UEFS
FIGURE 3. Data distribution for the proximal region: shoulder and upper arm. Mean values proximal region: Upper LimbFunctional Index (ULFI)¼ 43.7; Disabilities of the Arm, Shoulder, and Hand (DASH)¼ 44.6; Upper Extremity Func-tional Scale (UEFS)¼ 27.1. Category 1¼minimum or floor value (0%) and Category 10¼maximum or ceiling value(100%). Categories 2–9¼ groups of whole numbers for each scale: ULFI¼ three points per group: Category 2¼ (1–3);3¼ (4–6) . 9¼ (22–24). DASH¼ 15 points per group: Category 2¼ (31–45); 3¼ (46–60) . 9¼ (136–149). UEFS¼ 10points per group: Category 2¼ (1–8); 3¼ (9–16) . 9¼ (73–79).
and were excluded from data analysis. The UEFS had9.4% missed responses affecting four item questions.Of these 3.1% exceeded one missing response andwere excluded.
Responsiveness to change using longitudinalmeasures of disease impact for SRM and ES areshown in Table 4. These values were determinedonly for the DASH and ULFI from the subgroup,n¼ 24, with the cut-off criteria of 10.7% or 12.8DASH points.9,29
Internal consistency using CA was determined foreach SROM with the ULFI and UEFS at 0.89 and theDASH at 0.96 (Table 4).
Social desirability, measured with the MC-13, wasfound to have no effect on any characteristic or psy-chometric property of any of the three tools.
Practical characteristics of the three tools aresummarized in a dichotomous descriptive formwithin Table 7. All three tools demonstrated satisfac-tory self-administration, application across diverse
TABLE 3. Summary of the Upper Limb Self-reportOutcome Measures (SROMs) Test–Retest Reliability
Intraclass Correlation Coefficient (ICC) Values atConfidence Interval (CI)¼ 0.95
Change(between Firstand Second Test)on VAS n DASH ULFI n UEFS
Change¼ 0 28 0.9791 0.9567 22 0.9150Change¼ 0þ/� 1 41 0.9527 0.8983 29 0.9156All data (at any
change level)47 0.9011 0.8950 32 0.8978
ULFI¼Upper Limb Functional Index; DASH¼Disabilities of theArm, Shoulder, and Hand; UEFS¼Upper Extremity FunctionalScale; VAS¼Visual Analogue Scale.
336 JOURNAL OF HAND THERAPY
conditions and severity levels, and were relevant toworking populations. The ULFI demonstrated alleight characteristics for clinical practicality exceedingthe UEFS with seven and the DASH with five. Thecompletion time reflected the tool length. TheDASH at four pages required on average 6.5 minutes,the UEFS at a half page length 1.5 minutes, and theULFI at one page 2.5 minutes. Subsequent scoringtime reflected tool format more so than length withthe DASH and UEFS requiring substantially longerand the use of a computational aid in the presenceof missing responses. They ranged, respectively,from 2 to 6 minutes for the DASH and 20 secondsto 2 minutes for the UEFS. The ULFI required 20 sec-onds to score and no computational aids. Use ofpaired t-tests showed a statistical difference betweenthe completion times, scoring times, and combinedtimes of the DASH and both the UEFS and ULFIand a difference in completion times only betweenthe UEFS and ULFI, but this was not significant.Ease of understanding scored similarly for all threetools on the VAS evaluation scale questionnairewith no significant difference found between any ofthe four assessed components. The summary of 25 es-sential and two additional characteristics presentedin the ‘‘quantifying the measurement of outcomemeasures’’ (Table 7) scored the ULFI at 96% whilethe DASH and UEFS scored 68%.
DISCUSSION
This prospective study investigated the ULFI as anew regional upper limb SROM tool analyzing itsconcurrent performance compared to advocatedmeasures, the DASH and the UEFS. The results

Response Distribution of Central Region Data
Response Categories: Floor, 8 Groups of Whole Numbers & Ceiling
0
1
2
3
4
5
Nu
mb
er o
f R
esp
on
ses
6
7
8
1 2 3 4 5 6 7 8 9 10
ULFI
DASH
UEFS
FIGURE 4. Data distribution, for the central region: forearm and elbow. Mean values central region: Upper Limb Func-tional Index (ULFI)¼ 37.4; Disabilities of the Arm, Shoulder, and Hand (DASH)¼ 32.8; Upper Extremity FunctionalScale (UEFS) ¼ 18.4. Category 1 ¼minimum or floor value (0%) and Category 10 ¼maximum or ceiling value(100%). Categories 2–9¼ groups of whole numbers for each scale: ULFI¼ three points per group: Category 2¼ (1–3);3¼ (4–6) . 9¼ (22–24). DASH¼ 15 points per group: Category 2¼ (31–45); 3¼ (46–60) . 9¼ (136–149). UEFS¼ 10points per group: Category 2¼ (1–8); 3¼ (9–16) . 9¼ (73–79).
demonstrated that the ULFI has both methodologicaland practical characteristic advantages for measuringupper extremity disorders. Reliability, internal con-sistency, criterion and construct validity, sample size,error measurement, and responsiveness have beendemonstrated to be comparable to the properties ofthe DASH and UEFS. The ULFI exceeds the distribu-tion range, has a lower missing response rate, and hasan improved response severity range and distribu-tion as compared to the DASH and UEFS. Theimproved practical aspects of tool use in a clinicalsetting through speed of completion and scoring arefurther demonstrated. The summation of these im-portant factors, as shown in Table 7, support and val-idate these advantages, which, along with thestrengths of the study and the ULFI’s future potentialto integrate with other similarly designed regionaltools, are discussed in further detail.
The sample size in each aspect of the investigationis justified from the power analysis and compares fa-vorably with that of Beaton et al.9 at n¼ 200 partici-pants and n¼ 56 for test–retest, and the projectednumbers calculated by Stratford et al.10 of n¼ 196for a statistically valid investigation of psychometric
properties for a new upper limb tool and n¼ 47subjects for test–retest reliability.
Test–retest reliability demonstrated by the ULFIindicates that this tool can consistently monitor phys-ical function and symptoms in proximal, central, anddistal disorders and in conditions that affect the en-tire limb as demonstrated by the multiple musculo-skeletal conditions represented in the sample.Furthermore, the increased focus on a reduced toler-ance at the change level of ‘‘0’’ resulted in small or noreliability improvement, respectively, for the DASHand UEFS compared to the marked increase for theULFI from 0.90 to 0.96.
Validity investigated for each tool provides partic-ularly useful data as all SROMs were completed si-multaneously and supplements the existing body ofknowledge on DASH and UEFS characteristics aswell as the comparative performance of the ULFI.
Face and content validity were satisfactorily deter-mined within the initial item generation and reduc-tion stages of tool development.
Construct validity for both the ULFI and DASHwere supported by the distributional analysis ofboth the full data set and the within region subgroups
TABLE 4. Methodological Characteristics for DASH, ULFI, and UEFS
Tool SD100 ICC SEM MDC90 MDC95 ES SRM ES/SRM % C-Alpha
DASH100 19.67% 0.9791 2.84% 6.63% 7.87% 1.4077 2.1820 35.48 0.9633ULFI100 21.61% 0.9567 4.50% 10.50% 12.47% 1.2841 1.8674 31.24 0.8893UEFS100 18.97% 0.9156 5.51% 12.86% 15.27% Unavailable Unavailable Unavailable 0.8891
SD¼ standard deviation at baseline score on a 100% scale; ICC¼ intraclass correlation coefficient for test–retest reliability (one-way randomeffects model at a 95% CI); SEM¼ standard error of the measurement; MDC90¼minimal detectable change at a 90% CI; MDC95¼minimaldetectable change at a 95% CI; ES¼ effect size to measure responsiveness; SRM¼ standard response mean to measure responsiveness; ES/SRM %¼ percentage difference between SRM and ES for the same change measurement on the same subjects; C-Alpha¼Cronbach’s alphato measure internal consistency; ULFI¼Upper Limb Functional Index; DASH¼Disabilities of the Arm, Shoulder, and Hand; UEFS¼Upper Extremity Functional Scale.
July–September 2006 337
as each approached a normalized bell curve in all cir-cumstances though the impairment range of the ULFIwas larger, specifically at the higher levels. The UEFSwas poorly distributed and combined with concernsof inconsistency in other psychometric properties rai-ses doubts on its suitability for clinical or research cir-cumstances. Consequently, other tools, such as theUEFI, which used the UEFS as the primary criterionstandard in their development, may also be affected.A regional tool should demonstrate a higher distalthan proximal mean as hand injuries cause greaterfunctional impairment than those of the shoulder.7,9
This was found for ULFI and UEFS but not for theDASH, which is contrary to the findings of Beatonet al.9 and provides an area of clarification for furtherresearch. The ‘‘known group’’ method of constructvalidity determination supported the conclusions ofthe distributional analysis for both the DASH andULFI. The introduction of ‘‘response severity order’’further supports the ULFI as the preferred tool as itdemonstrated a total range of 77.0% that was, respec-tively, 1.4 and 2.7 times greater than the DASH andUEFS and covered all five 20% incremental categoriescompared to four categories for the DASH and thethree for the UEFS. It is particularly important thatthe initiation of the lower impairment mean for theULFI occurs at 15.5%, 11% sooner than the DASH at
TABLE 5. Intraclass Correlation Coefficient (ICC)Value for Criterion Comparison between the ULFI,
DASH, and UEFS
DASH ULFI
ULFI 0.8665—high –UEFS 0.7675—medium 0.7759—medium
ULFI¼Upper Limb Functional Index; DASH¼Disabilities of theArm, Shoulder, and Hand; UEFS¼Upper Extremity FunctionalScale.
338 JOURNAL OF HAND THERAPY
26.9% and 40% sooner than the UEFS at 55.5%.Table 6 can be used to consider the distribution ofitems with the ULFI approximating a normalGaussian distribution with minimal skew effect com-pared to that of the DASH and UEFS. A direct com-parison of the order and percentage scores ofsimilar item variables can also be made with somesimilarity across all three SROMs (transport, jars,and home duties) or between two SROMs (sleepand writing for the DASH and UEFS; light activityand utensil/knife use for the ULFI and DASH; for ex-ample, holding a jug for the ULFI and UEFS) and dis-tinct variation with other items. Response severityorder offers an alternative method of analyzingboth the construct validity and overall performanceof a tool through the ability to apportion levels ofimpairment via item description across a full distri-bution range. This provides greater scope of impair-ment measurement and markedly higher capacityto indicate change and the ULFI is shown to be thepreferred tool in both these areas.
The determination of criterion validity demon-strated a strong relationship between the ULFI andboth the DASH and UEFS, which exceeded the min-imum requirements.45,51,74,75
The analysis of data distribution range supportsthe preference for the ULFI. Measurement of impair-ment range was greater for the ULFI with a moreeven distribution pattern overall and within thelimb. Division of data distribution into 10 wholenumber groups enabled a direct comparison betweenthe three SROMs with the presence of a floor mea-surement capacity demonstrated. The ULFI andDASH had relatively normalized distribution for alldata and the within region components providingadditional support for their construct validity,though the DASH was mildly skewed toward higher
Response Distribution of Distal Region Data
Response Categories: Floor, 8 Groups of Whole Numbers & Ceiling
0
2
4
6
8
10
12
1 2 3 4 5 6 7 8 9 10
Nu
mb
er o
f R
esp
on
ses
ULFI
DASH
UEFS
FIGURE 5. Data distribution, for the distal region: wrist and hand. Mean values distal region: Upper Limb FunctionalIndex (ULFI)¼ 49.6; Disabilities of the Arm, Shoulder, and Hand (DASH)¼ 42.6; Upper Extremity Functional Scale(UEFS)¼ 33.1. Categories 1¼minimum or floor value (0%) and Category 10¼maximum or ceiling value (100%). Cat-egories 2–9¼ groups of whole numbers for each scale: ULFI¼ three points per group: Category 2¼ (1–3); 3¼ (4–6) .9¼ (22–24). DASH¼ 15 points per group: Category 2¼ (31–45); 3¼ (46–60) . 9¼ (136–149). UEFS¼ 10 pointsper group: Category 2¼ (1–8); 3¼ (9–16) . 9¼ (73–79).
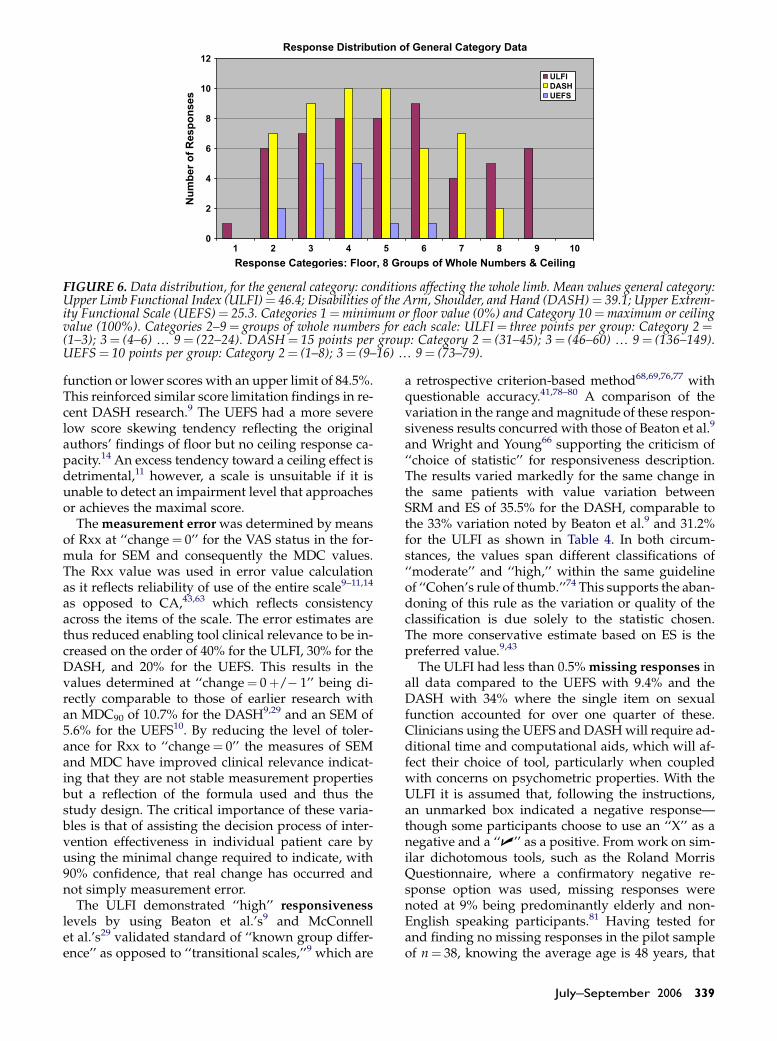
Response Distribution of General Category Data
Response Categories: Floor, 8 Groups of Whole Numbers & Ceiling
0
2
4
6
Nu
mb
er o
f R
esp
on
ses
8
10
12
1 2 3 4 5 6 7 8 9 10
ULFI
DASH
UEFS
FIGURE 6. Data distribution, for the general category: conditions affecting the whole limb. Mean values general category:Upper Limb Functional Index (ULFI)¼ 46.4; Disabilities of the Arm, Shoulder, and Hand (DASH)¼ 39.1; Upper Extrem-ity Functional Scale (UEFS)¼ 25.3. Categories 1¼minimum or floor value (0%) and Category 10¼maximum or ceilingvalue (100%). Categories 2–9¼ groups of whole numbers for each scale: ULFI¼ three points per group: Category 2¼(1–3); 3¼ (4–6) . 9¼ (22–24). DASH¼ 15 points per group: Category 2¼ (31–45); 3¼ (46–60) . 9¼ (136–149).UEFS¼ 10 points per group: Category 2¼ (1–8); 3¼ (9–16) . 9¼ (73–79).
function or lower scores with an upper limit of 84.5%.This reinforced similar score limitation findings in re-cent DASH research.9 The UEFS had a more severelow score skewing tendency reflecting the originalauthors’ findings of floor but no ceiling response ca-pacity.14 An excess tendency toward a ceiling effect isdetrimental,11 however, a scale is unsuitable if it isunable to detect an impairment level that approachesor achieves the maximal score.
The measurement error was determined by meansof Rxx at ‘‘change¼ 0’’ for the VAS status in the for-mula for SEM and consequently the MDC values.The Rxx value was used in error value calculationas it reflects reliability of use of the entire scale9–11,14
as opposed to CA,43,63 which reflects consistencyacross the items of the scale. The error estimates arethus reduced enabling tool clinical relevance to be in-creased on the order of 40% for the ULFI, 30% for theDASH, and 20% for the UEFS. This results in thevalues determined at ‘‘change¼ 0þ/� 1’’ being di-rectly comparable to those of earlier research withan MDC90 of 10.7% for the DASH9,29 and an SEM of5.6% for the UEFS10. By reducing the level of toler-ance for Rxx to ‘‘change¼ 0’’ the measures of SEMand MDC have improved clinical relevance indicat-ing that they are not stable measurement propertiesbut a reflection of the formula used and thus thestudy design. The critical importance of these varia-bles is that of assisting the decision process of inter-vention effectiveness in individual patient care byusing the minimal change required to indicate, with90% confidence, that real change has occurred andnot simply measurement error.
The ULFI demonstrated ‘‘high’’ responsivenesslevels by using Beaton et al.’s9 and McConnellet al.’s29 validated standard of ‘‘known group differ-ence’’ as opposed to ‘‘transitional scales,’’9 which are
a retrospective criterion-based method68,69,76,77 withquestionable accuracy.41,78–80 A comparison of thevariation in the range and magnitude of these respon-siveness results concurred with those of Beaton et al.9
and Wright and Young66 supporting the criticism of‘‘choice of statistic’’ for responsiveness description.The results varied markedly for the same change inthe same patients with value variation betweenSRM and ES of 35.5% for the DASH, comparable tothe 33% variation noted by Beaton et al.9 and 31.2%for the ULFI as shown in Table 4. In both circum-stances, the values span different classifications of‘‘moderate’’ and ‘‘high,’’ within the same guidelineof ‘‘Cohen’s rule of thumb.’’74 This supports the aban-doning of this rule as the variation or quality of theclassification is due solely to the statistic chosen.The more conservative estimate based on ES is thepreferred value.9,43
The ULFI had less than 0.5% missing responses inall data compared to the UEFS with 9.4% and theDASH with 34% where the single item on sexualfunction accounted for over one quarter of these.Clinicians using the UEFS and DASH will require ad-ditional time and computational aids, which will af-fect their choice of tool, particularly when coupledwith concerns on psychometric properties. With theULFI it is assumed that, following the instructions,an unmarked box indicated a negative response—though some participants choose to use an ‘‘X’’ as anegative and a ‘‘U’’ as a positive. From work on sim-ilar dichotomous tools, such as the Roland MorrisQuestionnaire, where a confirmatory negative re-sponse option was used, missing responses werenoted at 9% being predominantly elderly and non-English speaking participants.81 Having tested forand finding no missing responses in the pilot sampleof n¼ 38, knowing the average age is 48 years, that
July–September 2006 339

d UEFS
% # UEFS Items Mean % #
12 Pickup small objectswith fingers
84.3% D
8 Writing 80.3 B1
20 Washing dishes 74.0% H22 Driving . 30 minutes 72.5% E16 Carry jug from fridge 71.4% G9 Opening a door 67.3% F
17 Sleeping 66.6% A1821146
10
4 Opening jars 55.5% C5
241119
21325157
23
3
nt required and are determined by {(1�mean) 3 100}. Itemsttom of the list indicate less impairment and are more oftenunctional Scale.
340JO
URNALOFHAND
THER
APY
TABLE 6. Comparison of Item Average Severity for the DASH, ULFI, an
Percent Markers Mean % # DASH Items ULFI Items Mean
80.6% 2 Write Assistance with washing, hygiene 92.5%
Appetite affected 87.6%Stay at home most of time 81%
80%79.8% 3 Turn a key Eating: using utensils 79.3%78.4% 17 Recreation activity little effort Drop things—minor accidents 70.7%75.8% 16 Knife use to cut food Transport independence 69.8%75.8% 20 Transport needs Walking/normal recreation/sport 69.5%74.5% 4 Prepare a meal Arm in shirt sleeve/dressing 67.2%72.4% 26 Pins and needles Writing/using keyboard or mouse 67.2%71.3% 21 Sexual activity Hold or moving dense objects 66.1%69.2% 13 Wash, blow dry hair More irritable/bad tempered 63.5%68.0% 9 Make a bed Painful almost all the time 62.1%63.5% 15 Put on a pullover or sweater Home/family duties and chores 61.5%60.9% 29 Sleeping in the last week
60%58.0% 10 Carry shopping bag/briefcase Tend to rest more often 58.1%57.2% 5 Push open a heavy door Try get others to do things 54%55.7% 28 Stiffness Difficult button key coins taps 50%54.2% 22 Interferes social/family activity Sleep less well 42.5%52.5% 6 Object to shelf above head Do things at/above shoulder 40.8%51.0% 1 Open a tight or new jar50.8% 14 Wash your back48.6% 24 Pain46.6% 12 Change a light-bulb overhead46.3% 27 Weakness45.9% 23 Interferes work/daily activity45.5% 8 Garden or yard work43.1% 7 Heavy household chores40.1% 25 Pain on doing specific activity
40%38.5% 11 Carry a heavy object (.5 kg) Change positions frequently 35.6%35.5% 30 Feel less capable or useful Regular daily activity work/social 32.2%33.7% 19 Recreation activityþ free arm mvt Open, hold, press, or push 32.2%26.9% 18 Recreation activityþ force/impact Feel weaker or stiffer 24.1%
Lifting and carrying 23.6%Use other arm more often 20.7%
20%Avoid heavy jobs 15.5%
Mean scores are represented as percentage values to indicate item average scores. The percentage values reflect the degree of impairmeat the top of the list have a higher percent value being marked less often and consequently indicate greater impairment. Items at the bomarked first. ULFI¼Upper Limb Functional Index; DASH¼Disabilities of the Arm, Shoulder, and Hand; UEFS¼Upper Extremity F

48% of respondents used a negative indicator andnone of these had missing responses, it would be as-sumed that missing responses for this tool would below. The decision not to include a confirmatory neg-ative option was made from peer and patient feed-back and ergonomist’s advice. The single boxresponse option improved tool efficiency and patientreceptivity while additional boxes or altering designto provide this option made the tool appear obtru-sive. However, without the inclusion of a confirma-tory negative option the assumption of minimal
missing responses cannot be confirmed and willrequire clarification through further investigation.
The presence of internal consistency was deter-mined as satisfactory by the use of the CA coefficientwith identical values of 0.89 for both the ULFI and theUEFS. This is marginally higher than the 0.85 foundby Pransky et al.14 and mid-range of 0.83–0.93 fromsubsequent UEFS researchers.10 However, theDASH, with a CA of 0.96 exceeds the recognized0.95 upper limit indicating that too many items aretoo similar or testing the same construct,82 which
TABLE 7. Quantifying the Measurement of Outcome Measures
Number# Factors Considered
PreferredResponse
ULFI(Gabel, 2006)
DASH(Beaton et al.9)
UEFS(Pransky et al.14)
Methodological
1 Reliability Yes Yes Yes Yes2 Error or change
scores (MDC, SEM)Yes Yes Yes Yes
3 Validity Yes Yes Yes Yes4 Responsiveness Yes Yes Yes Yes5 Internal consistency (a¼
0.80–0.95)Yes Yes No Yes
6 Adequate samplepower and size
Yes Yes Yes No
Practical7 Self-administered Yes Yes Yes Yes8 Brevity in length Yes Yes No Yes9 Short completion time Yes Yes No Yes
10 Short scoring time Yes Yes No No11 Application across conditions Yes Yes Yes Yes12 Diseases severity range Yes Yes Yes Yes13 Easy to understand Yes Yes Yes Yes14 Relevant to working populations Yes Yes Yes Yes
Distributional
15 All categories 0–100% Yes Yes No No16 Even or normalized
for all dataYes Yes Yes No
17 Even distributionfor each area
Yes Yes Yes No
18 Different distalmean (i.e., hand 6¼ shoulder)
Yes Yes No Yes
19 No markedceiling or floor effect
Yes Yes Yes Yes
20 No floor/ceilingskew tendency
Yes Yes No No
General21 Quantitative data obtained Yes Yes Yes Yes22 Qualitative data obtained Yes Yes No No23 Represents function
and HRQOLYes Yes Yes No
24 Independently researched Yes No Yes Yes25 Independent statistical analysis Yes Yes Yes Yes
Total 25 24 17 17Percentage rating 100% 96% 68% 68%
Other Future implications
A Other regional SROMconsistency
Yes Yes No No
B Global assessment integration Yes Yes No No
A summary of 25 important factors in regional SROMs as applied to upper limb tools. ULFI¼Upper Limb Functional Index; DASH¼Dis-abilities of the Arm, Shoulder, and Hand; UEFS ¼Upper Extremity Functional Scale; SROM ¼ Self-report Outcome Measure;HRQOL¼ health-related quality of life; MDC¼minimal detectable change; SEM¼ standard error of the measurement.
July–September 2006 341
implies item redundancy.7 The developers of theDASH also found the same high value of 0.969,29
with other researchers approximating this83 whichis a likely contributor, along with length, completion,and scoring time for the more recent development ofthe 11-item ‘‘quick DASH.’’8,84
The practical characteristics of the three tools,summarized in descriptive form in the initial sectionof Table 7, indicate the ULFI as the preferred option.Tool format improves clinical utility through easeand consistency of use due to brevity, speed of com-pletion, a raw score of 25 being rapidly convertedto a 100-point scale without computational aids, min-imal missing responses, and subsequent reducedscoring time. The ULFI has the additional benefit ofthe ‘‘PSI’’ individual qualitative component and aVAS of overall status on the one page.
The spontaneous use of the ‘‘½’’ mark on the ULFIby 3.6% of patients (see Table 1) suggests that allow-ance for this response option should be considered infuture investigations of existing regional SROMs andthe development of new tools. This is supported bythe findings of Chansirinukor85 who showed that‘‘three category options,’’ effectively a dichotomoustool with a ‘‘½ mark’’ option, provided optimal psy-chometric results compared to either the Likert orDichotomous version of the Roland MorrisQuestionnaire. Such a format would cause minimalcompromise to the practical characteristics advan-tages and provide definitive ordinal data.
Regional SROMs are the preferred choice for cur-rent and future musculoskeletal measurement, butthe choice of format and tool template design is anarea lacking consensus as highlighted in this study.The practical advantages of the ULFI support the useof dichotomous or three-point Likert scales as advo-cated by several authors.69,85–87 Longer Likert scaleformat is often chosen for new tool developmentdue to either assumption9,23 or previous comparativestudies11,88 that these scales have higher responsive-ness. However, this study has shown that the smallreduction in responsiveness is outweighed by the in-creased practicality without loss of the essential psy-chometric properties. These practical characteristicsare necessary in contributing to improved efficiencyin an occupational and therapeutic setting. Treatingprofessionals and their patients have less discretion-ary time compared to researchers in large centerswhere patient groups are often students, retirees,and the chronically disabled, who are not reflectiveof the future users of the developed SROM tools.37
These considerations are particularly important astools with low practicality will not be readily ac-cepted by clinicians and integrated into daily clinicalpractice.7,77,89 The summarized essential and addi-tional characteristics identified and listed in the‘‘measurement of outcome measures’’ in Table 7 sup-port this premise by providing a quantitative ‘‘rule of
342 JOURNAL OF HAND THERAPY
thumb’’ template for researchers and clinicians to an-alyze and judge any SROM tool’s performance. Thedetermined values of 96% for the ULFI compared to68% for the DASH and UEFS lend further supportto the UEFI as the preferred tool.
This study shows that the ULFI is directly compa-rable to the DASH and UEFS in its methodologicalproperties but its practicality is higher. Both theDASH and UEFS have demonstrated direct compar-ison capability with condition-specific scales of dis-ease9,14,90,91 and joint measurement.8,28,54,55,92–94
These upper limb SROMs traits imply transferabilityof the ULFI to these established criteria, however, thiswill require comparative validation with the condi-tion-specific tools in the designated populationgroups.
Despite the acceptance and support of the DASHand UEFS, criticisms remain. This study indepen-dently established the psychometric properties forthe DASH. The values for validity and reliabilitywere in agreement with previous studies9,83 whileperformance capacity in error measurement and re-sponsiveness were improved,29 which may be attrib-uted to the younger, healthier, and less chronicnoninstitutional population in the study. The short-comings of the DASH remain its length, complexity,error in scoring, missing responses, and excess inter-nal consistency. These factors weigh strongly andcause guarded use of the tool due to poor clinical util-ity and item redundancy.
Criticisms of the UEFS include its development,lack of population diversity (using predominantlyinjured workers), and the large variations in scoresfor different groups and different test occasions. Thecurrent study had greater population diversity, butalso demonstrated large variation in the essentialpsychometric properties of the UEFS when comparedto earlier research. It showed range limitation andthat the test–retest reliability and internal consistencywere only confirmed in the mid-range of previouslyreported values.10,14 The variation and lack of consis-tency between studies reinforce the guarded use ofthe UEFS due to underlying methodologicalinsufficiency.
Limitations of the Study
The limitations of statistical power due to samplesize must be taken into account by future users of thisnew tool. It is a study of an Australian populationanalyzing 205 responses from 130 subjects, 75 ofwhom were included in subgroups to provide sub-sequent responses on reliability, error scores, andresponsiveness. The conclusions from this studycannot be directly considered to have global impli-cations, though sample diversity from the subjects’geographical areas and ethnic background do mini-mize this. Similarly, this study did not provide

satisfactory indications of population-based normalvalues by the demographic areas of gender, age, oroccupation, nor did it indicate discriminant validityfor different levels of work status, personal activity,or symptom duration. As a regional measure, theimplications for the application to individual joint ordisease conditions can be made due to the criterionvalidity with the DASH and UEFS that have had suchstudies completed. However, without specific vali-dation this remains uncertain being an area of furtherinvestigation along with specific discriminantvalidity relating condition-specific variables and thedetermination of minimal clinically importantdifference. Furthermore, this tool has notdemonstrated the ability to be predictive of futureimpairment levels or treatment effectiveness leavingthe potential for further investigative research.
Strengths of the Study
The use of concurrent completion of the question-naires enables their direct performance comparison.The positive results for all three tools as regionalmeasures support the ‘‘single kinetic chain’’ model.This study confirms and improves existing method-ological characteristics for the DASH and UEFS,specifically in the area of test–retest reliability andthe subsequent reduction in the error estimate valuesof SEM and MDC. The assertions that a standardizedsingle method approach for responsiveness calcula-tion should be used9,11,66 are confirmed supportingthe contention that Cohen’s ‘‘rule of thumb’’ shouldbe abandoned. It also confirms that the personalitytrait of social desirability has no influence on the re-sponse capacity of regional SROMs supporting thecurrent practice of not accounting for this variablein daily clinical outcome tool use.
Future Research Implications
This study provides a precedent for future inves-tigations of regional outcome tools, for the lower limband spine as well as generic tools that consider anymusculoskeletal area. The balance must be consid-ered between a tool’s clinical utility and the quanti-tative and qualitative focus using predominantlyHRQOL item questions and a patient-centered ap-proach. The new emphasis on outcome SROMs willbe investigating tool performance in clinical trialsand studies through collaborative investigations forthe purposes of database formation, including theongoing creation of population-based normal valuesand the integration of Item Response Theory. Thisprocess will involve researchers from clinical, aca-demic, and institutional areas as well as the healthand medical practitioner to provide a base fromwhich comparative data can be further used.13,38
Existing format patient surveys as well as newly
developed SROM tools, with an appropriate researchsupport base that are peer advocated, will becomethe primary mechanisms for this process of informa-tion and e-format collection for databases and stor-age.8,16,49,95,96 The information will be used forevidence-based practice (EBP), validation of inter-vention to third-party payers, clinical reasoning,and intervention implementation as well as in newways such as global health management. The futurefor the field of outcome measures and instrumentevaluation is extensive and these tools will continueto play an important role in evaluating the differentresults, interventions, and outcomes achieved in pa-tient treatments. Traditional users of upper limbSROMs will remain the clinician and researcher,both evaluating the effectiveness of interventions toprovide EBP and achieve the best possible outcomesfor their patients. However, new users such as gov-ernments, professional groups, and insurers arelikely to be the strongest advocates for their future re-quirement as a standard component of clinical care.
CONCLUSIONS
This study achieved its two primary objectives. Itvalidated the ULFI and demonstrated that its essentialpsychometric properties of reliability, validity, re-sponsiveness, error measurement, and internalconsistency approximate or exceed those of theDASH and UEFS. The latter advocated tools areshown to be self-limiting in determining maximumimpairment and have practical restraints that affectclinical utility, limitations that may also by implicationbe present in the UEFI. The ULFI’s practical charac-teristics of brevity, ready transferability to a 100-pointscale, ease and rapidity of completion and scoringreinforce methodological consistence while the inclu-sion of a VAS for functional status and a ‘‘PSI’’ increasecollected information diversity. The summary quan-tification of all characteristics supports these advan-tages. Consequently, the ULFI is advocated over theDASH and UEFS as the preferred regional tool forupper extremity outcome measurement.
REFERENCES
1. Roland M, Morris R. A study of the natural history of backpain. Part I: development of a reliable and sensitive measureof disability in low back pain. Spine. 1983;8:141–4.
2. Wiechman SA, Smith RE, Smoll FL, Ptacek JT. Masking effectsof social desirability response on relations between psychoso-cial factors and sport injuries: a methodological note. J SciMed Sport. 2000;3:194–202.
3. Reynolds WN. Development of reliable and valid short formsof the Marlowe–Crowne Social Desirability Scale. J Clin Psy-chol. 1982;38:119–25.
4. Denniston OL, Jette A. A functional status assessment instru-ment: validation in an elderly population. Health Serv Res.1980;15:21–34.
July–September 2006 343

5. Friedsam HJ, Martin HW. A comparison of self and physi-cian’s health ratings in an older population. J Health HumanBehav. 1963;4.
6. Williams RGA, Johnston M, Willis LA, Bennet AE. Disability:a model and measurement technique. Br J Prev Soc Med.1976;30:71–8.
7. Michener LA, Leggins BG. A review of self-report scales forthe assessment of functional limitation and disability of theshoulder. J Hand Ther. 2001;14:68–76.
8. Amadio PC. Outcome assessment in hand surgery and handtherapy: an update. J Hand Ther. 2001;14:63–7.
9. Beaton DE, Katz NK, Fossel AH, Wright JG, Tarasuk V, Bom-bardier C. Measuring the whole of the parts? Validity, reliabil-ity, and responsiveness of Disabilities of the Arm Shoulderand Hand outcome measure in different regions of the upperlimb. J Hand Ther. 2001;14:128–46.
10. Stratford PW, Binkley JM, Stratford D. Development and ini-tial validation of the Upper Extremity Functional Index. Phys-iother Can. 2001;52:259–67, 281.
11. Davidson M, Keating JL. A comparison of five low back dis-ability questionnaires: reliability and responsiveness. PhysTher. 2002;82:8–24.
12. Fries J, Spitz P, Young DW. The dimensions of health out-comes: the health assessment questionnaire, disability andpain scales. Rheumatology. 1982;9:789–93.
13. MacDermid JC. Editorial—the outcome issue. J Hand Ther.2001;14:61–2.
14. Pransky G, Feuerstein M, Himmelstein J, Kratz JN, Vickers-Lahti M. Measuring functional outcomes in work-related upperextremity disorders. J Occup Environ Med. 1997;39:1195–202.
15. Sullivan MS, Shoaf LD, Riddle DL. The relationship of lumbarflexion to disability in patients with low back pain. Phys Ther.2000;80:240–50.
16. Deyo R. Measuring outcomes of low back pain. In: Musculo-skeletal Physiotherapy Australia, 13th Biennial Conference,Sydney; 2003.
17. Hazard RG, Haugh LD, Green PA, Jones PL. Chronic low backpain the Relationship between patient satisfaction and pain,impairment, and disability outcomes. Spine. 1994;19:881–7.
18. Levine DW, Simmons BP, Koris MJ. A self-administeredquestionnaire for the assessment of severity of symptomsin carpal tunnel syndrome. J Bone Joint Surg Am. 1993;75A:1585–1592.
19. Katz JN, Fossel KK, Simons BP, Swartz RA, Fossel AH, KorrisMJ. Symptoms, functional status and neuromuscular impair-ment following carpal tunnel release. J Hand Surg. 1995;20:549–55.
20. Schonstein E, Kenny DT, Maher CG. Workcover’s physiother-apy forms: purpose beyond paperwork? Aust J Physiother.2002;48:221–5.
21. Rogerson S, Workcover NSW. Evidence based guidance mate-rial for exercise and activity programs in post acute non-redflag musculoskeletal injuries. In: Musculoskeletal Physiother-apy Australia 13th Biennial Conference, Sydney, Australia;2003.
22. Stock SR, Streiner D, Reardon R, et al. The impact of neck andupper limb musculoskeletal disorders on the lives of affectedworkers: development of a new functional status index. QualLife Res. 1995;4:491.
23. Feise RJ, Menke JM. Functional Rating Index. A new validand reliable instrument to measure the magnitude of clinicalchange in spinal conditions. Spine. 2001;26:78–86.
24. Stock SR, Cole DC, Tugwell P, Streiner D. Review of applica-bility of existing functional status measures to the study ofworkers with musculoskeletal disorders of the neck andupper limb. Am J Ind Med. 1996;29.
25. Gabel CP. Development and initial validation of a new re-gional outcome measure: the Upper Limb Disability Ques-tionnaire (ULDQ). Masters by Research Thesis, CharlesDarwin University, Faculty of Health Science. Darwin:Charles Darwin University, 2003:200.
26. Salerno DF, Copley-Merriman C, Taylor TN, Shinogle J,Schulz RM. A review of functional status measures for
344 JOURNAL OF HAND THERAPY
workers with upper extremity disorders. Occup EnvironMed. 2002;59:664–70.
27. Devereux JJ, Vlachonikolis IG, Buckle PW. Epidemiologicalstudy to investigate potential interaction between physicaland psychosocial factors at work that may increase the riskof symptoms of musculoskeletal disorder of the neck andupper limb. Occup Environ Med. 2002;59:269–77.
28. Kirkley A, Griffith S, McLintock H, Ng L. The developmentand evaluation of a disease-specific quality of life measure-ment tool for shoulder instability: the Western Ontario Shoul-der Instability Index (WOSI). Am J Sports Med. 1998;26:764–72.
29. McConnell S, Beaton DE, Bombardier C. The DASH OutcomeMeasure User’s Manual. Toronto, Canada: Institute for Workand Health, 1999.
30. Kirshner B, Guyatt GH. A methodological framework forassessing health indices. J Chronic Dis. 1985;38:27–36.
31. Maklan CW, Greene R, Cummings MA. Methodological chal-lenges and innovations in patient outcomes research. MedCare. 1994;32(suppl):JS13–21.
32. Liang MH, Larson MG, Cullen KE, Schwartz JA. Comparativemeasurement efficiency and sensitivity of five health statusinstruments for arthritis research. Arthritis Rheum. 1985;28:542–7.
33. Liang MH, Fossel AH, Larson MG. Comparison of five healthstatus instruments for orthopaedic evaluation. Med Care.1990;28:632–42.
34. George K, Batterham A, Sullivan I. Validity in clinicalresearch: a review of basic concepts and definitions. PhysTher Sport. 2000;1:19–27.
35. Liang MH, Jerre AM. Measuring functional ability in chronicarthritis: a critical review. Arthritis Rheum. 1981;24:80–6.
36. Patrick DL, Deyo RA. Generic and disease specific measuresin assessing health status and quality of life. Med Care. 1989;27:S217–32.
37. Greenfield S, Nelson EC. Recent developments and future is-sues in the use of health status assessment measures in clini-cal settings. Med Care. 1992;30:MS23–41.
38. Hudak PL, Amadio PC, Bombardier C. Upper Extremity Col-laborative Group (UECG). Development of an upper extrem-ity outcome measure: the DASH (Disabilities of the Arm,Shoulder, and Head). Am J Ind Med. 1996;29:602–8.
39. World Health Organisation (WHO). ICIDH-2: InternationalClassification of Impairments, Activities and Participation.vol. 2004. Geneva: World Health Organisation, 2001.
40. Stratford P, Gill C, Westaway M, Brinkley J. Assessing disabil-ity and change on individual patients: a report of a patientspecific measure. Physiother Can. 1995;47:258–63.
41. Westaway MD, Stratford PW, Binkley JM. The Patient SpecificFunctional Scale: validation of its use in persons with neckdysfunction. J Orthop Sports Phys Ther. 1998;27:331–8.
42. Macdermid J. Support for the DASH. In: Proceedings of theFall Conference of the American Hand Therapy Association2001; 2001.
43. Michener L, McClure PW, Sennett BJ. American Shoulder andElbow Surgeons Standardized Shoulder Assessment Form,patient self-report section: reliability, validity and responsive-ness. J Shoulder Elbow Surg. 2002;11:587–94.
44. Guyatt GW, Bombardier C, Tugwell PX. Measuring disease-specific quality of life in clinical trials. CMAJ. 1986;134:889–95.
45. Streiner DL, Norman GR. Health Measurement Scales: APractical Guide to Their Development and Use. New York:Oxford Medical Press, 1995.
46. Bennell K, Bartam S, Crossley K, Green S. Outcome measuresin patellofemoral pain syndrome: test retest reliability andinter-relationships. Phys Ther Sport. 2000;1:32–41.
47. Vernon H, Mior S. The Neck Disability Index: a study of reli-ability and validity. J Manipulative Physiol Ther. 1991;14:409–15.
48. Bolton JE, Breen AC. The Bournemouth Questionnaire: ashort-form comprehensive outcome measure. I. Psychometricproperties in back pain patients. J Manipulative Physiol Ther.1999;2:503–10.
49. Ware JE, Snow KK, Kosinski MM, Gandek B. SF-36 HealthSurvey: Manual and Interpretation Guide. The Health Insti-tute, New England Medical Centre, 1993.
50. Dawson B, Trapp R. Basic and Clinical Biostatistics. Sydney:McGraw-Hill, 2001.
51. Meng X, Rosenthal R, Rubin DB. Comparing correlated corre-lation coefficients. Psychol Bull. 1992;111:172–5.
52. Stratford PW. Calculation of sample size estimation for depen-dent samples. In: Gabel CP, ed. Coolum, Qld., Australia; 2002.
53. Jacobsen NS, Follette WC, Revensdorf D. Psychotherapy out-comes research: methods for reporting variability and evalu-ating clinical significance. Behav Ther. 1984;15:336–52.
54. MacDermid JC. Outcome evaluation in patients with elbowpathology: issues in instrument development and evaluation.J Hand Ther. 2001;14:105–14.
55. MacDermid JC, Richards RR, Donner A, Bellamy N, Roth JH.Responsiveness of the Short Form 36, Disabilities of the Arm,Shoulder and Hand Questionnaire, patient-related wrist eval-uation and physical impairment measurements in evaluatingrecovery after a distal radius fracture. J Hand Surg. 2000;25A:330–40.
56. Shrout PE, Fleiss JL. Intraclass correlations: uses in assessingrater reliability. Psychol Bull. 1979;86:420–8.
57. McHorney CA, Taylor AR. Individual patient monitoring inclinical practice: are available health status surveys adequate?Qual Life Res. 1995;4:293–8.
58. Dabbagh T, Leaver A, Young S. Musculo-skeletal outcomesmeasures course: New South Wales Branch of the PrivatePractitioners Group of the Australian Physiotherapy Associa-tion, 2000.
59. Deyo RA, Diehr P, Patrick DL. Reproducibility and respon-siveness of health status measures. Control Clin Trials. 1991;12:142S–58S.
60. Nunnally JC, Bernstein IH. Psychometric Theory. New York:McGraw-Hill, 1994.
61. Wyrwich KW, Nienaber MA, Tierney WM, Wolinsky FD.Linking clinical relevance and statistical significance in eval-uating intra-individual changes in health-related quality oflife. Med Care. 1999;37:469–78.
62. Wyrwich KW, Tierney WM, Wolinsky FD. Further evidencesupporting standard error of measurement based criterionfor identifying meaningful intra-individual change in healthrelated quality of life. J Clin Epidemiol. 1999;52:861–73.
63. Binkley JM, Stratford PW, Lott SA, Riddle DL. The Lower Ex-tremity Functional Scale (LEFS): scale development, measure-ment properties, and clinical application. Phys Ther. 1999;79:371–83.
64. Stratford PW, Binkley J, Solomon P, Finch E, Gill C, MorelandJ. Defining the minimum level of detectable change for theRoland–Morris Questionnaire. Phys Ther. 1996;76:359–65.
65. Fairbank JCT, Couper J, Davies JB, O’Brien JP. The Oswestrylow back pain disability questionnaire. Physiotherapy. 1980;66:271–3.
66. Wright JG, Young NL. A comparison of different indices ofresponsiveness. J Clin Epidemiol. 1998;50:239–46.
67. De Bruin AF, Diederiks JPM, De Witte LP, Stevens FCJ, Phili-psen H. Assessing the responsiveness of a functional statusmeasure: the Sickness Impact Profile versus the SIP68.J Clin Epidemiol. 1997;50:529–40.
68. Kopec JA, Esdaile JM, Abrahamowicz M, Abenhaim L, Wood-Dauphinee S, Lamping DL. The Quebec Back Pain DisabilityScale: measurement properties. Spine. 1995;20:341–52.
69. Beurskens AJHM, de Vet HCW, Koke AJA. Responsiveness offunctional status in low back pain: a comparison of differentinstruments. Pain. 1996;65:71–6.
70. Stratford PW, Binkley JM, Riddle DL. Health status measures:strategies and analytic methods for assessing change scores.Phys Ther. 1996;76:1109–23.
71. Katz JN, Larson MG, Phillips CB, Fossel AH, Liang MH.Comparative measurement sensitivity of shorter and longerhealth status instruments. Med Care. 1992;30.
72. Katz JN, Gelberman RH, Wright EA, Lew RA, Liang MH.Responsiveness of self-reported and objective measures of
disease severity in carpal tunnel syndrome. Med Care. 1994;32:1127–33.
73. Kazis LE, Anderson JJ, Meenon RF. Effect sizes for interpret-ing changes in health status. Med Care. 1989;27:S178.
74. Cohen J. Applied Multiple Regression/Correlation Analysisfor the Behavioural Sciences. Hillsdale, NJ: Lawrence Erl-baum, 1983.
75. Deyo RA. Comparative validity of the SIP, Sickness ImpactProfile, and shorter scales for functional assessment in lowback pain. Spine. 1986;11:951–4.
76. Stratford PW, Binkley J, Solomon P, Gill C, Finch E. Assessingchange over time in patients with low back pain. Phys Ther.1994;74:528–33.
77. Stratford PW, Finch E, Solomon P, Binkley J, Gill C, MorelandJ. Using the Roland–Morris Questionnaire to make decisionsabout individual patients. Physiother Can. 1996.
78. Linton SJ, Melin L. The accuracy of remembering chronicpain. Pain. 1982;13:281–5.
79. Ross M. Relation of implicit theories to the construction ofpersonal histories. Psychol Rev. 1989;96:341–57.
80. Norman GR, Stratford PW, Regehr G. Methodological prob-lems in the retrospective computation of responsiveness tochange: the lesson of Cronbach. J Clin Epidemiol. 1997;50.
81. Desousa L, Miles C, Frank AO. Back pain disability: are welearning what we should from the Roland Morris DisabilityQuestionnaire (RMDQ). 11th World Congress on Pain, Syd-ney. IASP Press, Seattle, 2005 [Abstract 901–P143, P5325 pp.].
82. Cronbach LJ. Coefficient alpha and the internal structure oftests. Psychometrika. 1951;16:297–334.
83. Veehof MM, Sleegers EJ, van Veldhoven NH, Schuurman AH,van Meeteren NL. Psychometric qualities of the Dutch lan-guage version of the disabilities of the arm, shoulder, andhand questionnaire (DASH-DLV). J Hand Ther. 2002;15:347–54.
84. Institute for Work and Health. Development and Testing ofthe DASH and Quick-DASH Outcome Measure Instrumentsand the DASH User’s Manual. IWH Measurement of Health& Function Projects. Ontario: Institute for Work and HealthOntario Canada, 2003.
85. Chansirinukor W. Development and measurement propertiesof the multi-level RM24: a modified version of the Roland–Morris Disability Questionnaire. In: Musculoskeletal Physio-therapy Australia: 13th Biennial Conference, Sydney; 2003.
86. Jacobson GP, Newman CW. The development of the Dizzi-ness Handicap Inventory. Arch Otolaryngol Head NeckSurg. 1990;116:424–7.
87. Croft P, Pope D, Zonca M, O’Neill T, Silman A. Measurementof shoulder related disability: results of a validation study.Annu Rheum Dis. 1994;53:525–8.
88. Leclaire R, Blier F, Fortin L, Proulx R. A cross-sectional studycomparing the Oswestry and Roland–Morris functional disa-bility scales in two populations of patients with low back painof different levels of severity. Spine. 1997;22:68–71.
89. Roland M, Morris R. A study of the natural history of backpain. Part II. Development of guidelines for trials of treatmentin primary care. Spine. 1983;8:145–50.
90. Navsarikar A, Gladman DD, Husted JA, Cook RJ. Validity as-sessment of disabilities of arm shoulder and hand question-naire (DASH) for patients with psoriatic arthritis.J Rheumatol. 1999;26:2191–4.
91. Shutek M, Fremerey RW, Zeichen J, Bosch U. Outcome anal-ysis following open rotator cuff repair: early effectiveness val-idated using four different shoulder assessment scales. ArchOrthop Trauma. 2000;120:432–6.
92. Turchin DC, Beaton DE, Richards RR. Validity of observer basedaggregate scoring systems as descriptors of elbow pain, func-tion and disability. J Bone Joint Surg. 1998;80A:154–62.
93. Jain R, Hudak PL, Bowen CVA. Validity of health status mea-sures in patients with ulnar wrist disorders. J Hand Ther.2001;14:147–53.
94. Beaton DE, Richards RR. Assessing the reliability and respon-siveness of five shoulder questionnaires. J Shoulder ElbowSurg. 1998;7:565–72.
July–September 2006 345
95. Beattie P, Maher C. The role of functional status ques-tionnaires for low back pain. Aust J Physiother. 1997;43:29–35.
96. Ritchie JE. Using qualitative research to enhance the evi-dence-based practice of health care providers. Aust J Physi-other. 1999;45:251–6.
97. Zimmerman D. Mimicking properties of nonparametric ranktests using scores that are not ranks. J Gen Psychol. 1993;120:509–16.
346 JOURNAL OF HAND THERAPY
98. Tabachnick BG, Fiddell LS. Using Multivariate Statistics. NewYork: Harper Collins, 1996.
99. Roland M, Fairbank JCT. The Roland–Morris Disability Ques-tionnaire and the Oswestry Disability Questionnaire. Spine.2000;25:3115–24.
100. Reneman MF, Jorritsma W, Schellekens JM, Goeken LN. Con-current validity of questionnaire and performance-based dis-ability measurements in patients with chronic nonspecific lowback pain. J Occup Rehabil. 2002;12:119–29.

APPENDIX A: THE UPPER LIMB FUNCTIONAL INDEX (ULFI)
(Print on YELLOW Paper) UPPER LIMB FUNCTIONAL INDEX (ULFI) DATE:
NAME: INJURY LEFT ARM RIGHT ARMYour upper limb (arm) may make it difficult to do some of the things you normally do. This list contains sentences people
often use to describe themselves when they have such problems. Think of yourself over the last few days.If an item describes you, mark the box. If not, leave the box blank.
DUE TO MY ARM:
1 I stay at home most of the time.2 I change position frequently for comfort. 3 I avoid heavy jobs eg. cleaning, lifting more than 5kg or 10lbs, gardening etc.
4. I rest more often. 5. I get others to do things for me. 6. I have pain almost all the time. 7. I have difficulty lifting and carrying (eg bags, shopping up to 5kg or 10lbs). 8. My appetite is now different.
9. My walking or normal recreation activity is affected. 10. I have difficulty with normal home or family duties and chores. 11. I sleep less well.12.I need assistance with personal care eg. washing and hygiene.
13. My regular daily activities (work, social contact) are affected. 14. I am more irritable and / or bad tempered. 15. I feel weaker and / or stiffer. 16. My transport independence is affected (driving, public transport). 17. I have difficulty putting my arm into a shirt sleeves or need assistance dressing.
18. I have difficulty writing or using a key board and / or "mouse". 19. I am unable to do things at or above shoulder height. 20. I have difficulty eating and /or using utensils (eg knife, fork, spoon, chop sticks). 21. I have difficulty holding and moving dense objects (eg mugs, jars, cans). 22. I tend to drop things and/or have minor accidents more frequently. 23. I use the other arm more often. 24. I have difficulty with buttons, keys, coins, taps/faucets, containers or screw-top lids. 25. I have difficulty opening, holding, pushing or pressing (eg triggers, lever, heavy doors).
ULFI SCORE: To Score the Upper Part – Add the Marked Boxes:TOTAL ULFI Points = 100 Scale (x 4) =
Patient Specific Index (PSI): Note 5 activities that are important to you and affected by your arm problem. If you cannotthink of 5, choose from the ones you have marked above.
Score each activity on a scale range as follows, you may use Half (½) marks if you wish: 0 = BEST: Never affected / Can do activity normally 5 = WORST: Always affected / Can’t do activity at all
ACTIVITY Score1.2.3.4.5.
PSI Total = ________
% Score = (Total x 4) = _______
MDC (90% Confidence): 10.5 % or 2.6 ULFI points. Change < this may be due to error
Think of yourself over the last few days and due to your arm - assess your Overall Status compared to your normal or pre-injury level? 0 1 2 3 4 5 6 7 8 9 10
Pre-Injury or Normal Worst Possible
July–September 2006 347

APPENDIX B: JUSTIFICATIONS OF USED PROCEDURES AND DATA STATISTICAL ANALYSES
Parametric tests were used as all data demon-strated or approached a Gaussian or ‘‘bell shape’’distribution. In addition it has been demonstratedthat the results of statistical tests are minimallyaffected by either severely abnormal distributionsor violation of the homogeneity of variance assump-tion, provided the samples are, respectively, from thesame population with the same sample size.97
Consequently, when the ‘‘quality’’ of SROM scalesis considered using ‘‘Stephen’s Typology,’’ whetherthe format is ‘‘Likert’’ (with multiple responseoptions) or ‘‘dichotomous’’ (with two options of‘‘yes’’ or ‘‘no’’), data should be considered ‘‘ordinal.’’This is because the values on the dichotomous scaleare not arbitrary or ‘‘nominal’’ as the responses areordered with a ‘‘yes’’ defining the presence of
348 JOURNAL OF HAND THERAPY
impairment.98 Since the individual item statementsare then summated to produce the total score forthe respondent the data are determined as being in-terval or ratio quality. These assumptions and statis-tical analyses are supported by previous authorswho compared data from both Likert andDichotomous format SROMs.11,64,99,100 They arefurther supported by research that analyzed theperformance of a standard dichotomous SROMthat was modified to a ‘‘Likert’’ format and foundthat three ascending categories of 0–3, 4–7, and8–10 provided optimal psychometric properties inpreference to either the original Dichotomous orthe modified Likert format, effectively the originaldichotomous choice with the addition of a half (½)mark option.85
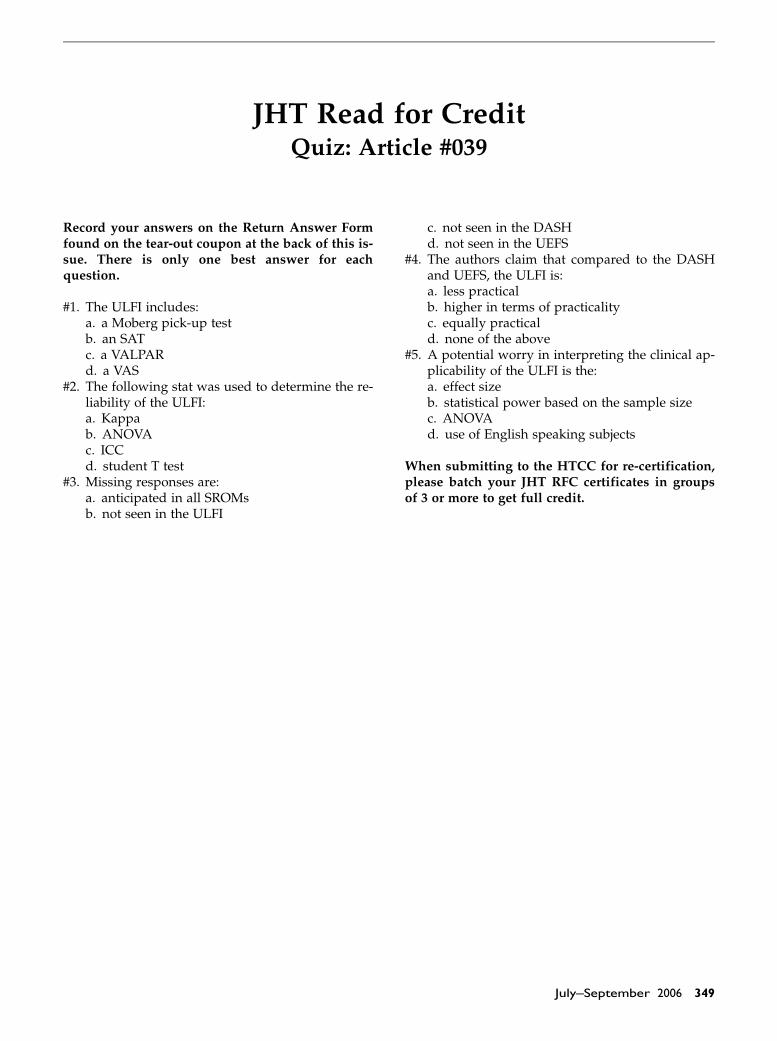
JHT Read for CreditQuiz: Article #039
Record your answers on the Return Answer Formfound on the tear-out coupon at the back of this is-sue. There is only one best answer for eachquestion.
#1. The ULFI includes:a. a Moberg pick-up testb. an SATc. a VALPARd. a VAS
#2. The following stat was used to determine the re-liability of the ULFI:a. Kappab. ANOVAc. ICCd. student T test
#3. Missing responses are:a. anticipated in all SROMsb. not seen in the ULFI
c. not seen in the DASHd. not seen in the UEFS
#4. The authors claim that compared to the DASHand UEFS, the ULFI is:a. less practicalb. higher in terms of practicalityc. equally practicald. none of the above
#5. A potential worry in interpreting the clinical ap-plicability of the ULFI is the:a. effect sizeb. statistical power based on the sample sizec. ANOVAd. use of English speaking subjects
When submitting to the HTCC for re-certification,please batch your JHT RFC certificates in groupsof 3 or more to get full credit.
July–September 2006 349