A Recipe for Responsiveness - DiVA-Portal
47
A Recipe for Responsiveness Strategies for Improving Performance in Android Applications Elin Nilsson Elin Nilsson Spring 2016 Master Thesis, 30 hp Supervisor: Håkan Gulliksson External Supervisors: Marcus Forsell Stahre, Keith Mitchell Examiner: Thomas Mejtoft M.Sc Interaction Technology and Design, 300 hp
-
Upload
khangminh22 -
Category
Documents
-
view
3 -
download
0
Transcript of A Recipe for Responsiveness - DiVA-Portal

A Recipe for ResponsivenessStrategies for Improving Performance in Android Applications
Elin Nilsson
Elin NilssonSpring 2016Master Thesis, 30 hpSupervisor: Håkan GullikssonExternal Supervisors: Marcus Forsell Stahre, Keith MitchellExaminer: Thomas MejtoftM.Sc Interaction Technology and Design, 300 hp

Abstract
Mobile applications are expected to be fast and responsive to userinteraction, despite challenges mobile platforms and devices facein terms of limited computational power, battery, memory, etc.Ensuring that applications are performant is however not trivial,as performance bugs are difficult to detect, fix, and verify. In orderfor mobile applications and devices to appear perfectly responsiveto the user, they need to meet a 60 frames per second frame rate,and keep load times preferably between 0-300 ms. Meeting theseexpectations means that there is no room for performance bugs,so there is a need for improving and developing better testingtools and strategies in order to help mobile developers improveperformance in their applications.
This thesis investigates strategies for testing and improving per-formance in Android applications by conducting a literary study,and a case study with the Spotify Android application. Some ofthe key findings of this thesis include promising results from toolsthat visualise sources of performance bugs in the user interfaceof applications, as well as proposed strategies and tools aimed tohelp developers profile and improve performance in their Androidapplications.

Acknowledgements
For their aid and encouragement throughout this thesis, and for ensuring that thisreport is as enjoyable, educational, and exciting as it ever could be, I would like toextend my gratitude;
To Marcus Forsell Stahre, for sharing your knowledge, and for your encouragement;To Sergey Basheleyshvili and Alexander Osmanov, for providing laughs preciselywhen I need it, and teaching me about your Russian ways; To Keith Mitchell, foryour support of this project; To the GLUE Team, for taking me in with open arms;To Andreas Grünewald, for sharing this journey with me; To Arvid Bräne, VictorWinnhed, and Albin Hübsch, for your invaluable feedback and for taking the blamefor any grammatical error that resides within these pages.
For the guidance, mentorship, friendship, and inspiration the following individualshave given me through the years;
To my mother and father, for supporting and loving me despite of me; To my brother,for being exactly you; To my family, for the never-ending support and for keeping megrounded; To Håkan Lenneby, for your enthusiasm and contagious love for educationand science; To Thomas Mejtoft and Håkan Gulliksson, for your dedication to ourprogram, and for your belief in what we do; To ID11, for everything that I cannotexpress in words; To ID, through and through, for being the best bunch of people.
And finally, to you, dear reader, for your interest. I wish you a pleasant read.
Have a lovely day.

Contents
1 Introduction 1
1.1 Spotify 2
1.2 Objective 2
1.3 Outline 2
2 Performance Research 4
2.1 Performance Bugs 4
2.2 Strategies for Testing and Fixing Performance Bugs 5
2.3 Strategies for Visualising and Understanding Performance Bugs 5
3 Android 7
3.1 Fundamentals of the Android Platform 7
3.1.1 Graphics and User Interface 8
3.2 Performance in Android Applications 9
3.2.1 Performance Characteristics 9
3.2.2 Performance Bug Patterns for Android Applications 11
3.3 Summary 13
4 Spotify Debug Tools 14
4.1 Performance Tools 14
4.2 Design Tools 16
5 Method 19
5.1 Literary Study 19
5.2 Evaluation of Existing Tools 19
5.3 Case Study with the Spotify Application 20
5.4 Development of a New Tool 23
6 Results 24

6.1 Results from Tool Evaluation 24
6.2 Results from the Case Study 25
6.3 View Hierarchy Traversing Tool 29
7 Discussion 31
7.1 Results and Findings 31
7.2 Answering the Research Questions 32
7.3 Limitations 32
7.4 Proposed Guidelines 33
7.4.1 Go Looking for Problems 33
7.4.2 Understand What It All Means 33
7.4.3 Do Your Best To Fix Things 33
7.4.4 Make Sure It Works 33
7.4.5 Repeat And Get Involved 34
7.5 Future Work 34
7.6 Conclusions 35
References 36
A Tool Evaluation Survey 41

1
1 Introduction
When smartphones first appeared on the market, they introduced new challenges fordevelopers to consider: limited computational power, limited power supplies, fluc-tuating access to networks, limited screen size, portability, etc. Mobile applicationsare despite these challenges expected to be fast, responsive, and performant: slow-ness often gets brought up in application reviews and bug reports [40]. Generally,anything slower than 100-200 ms can be perceived by the human brain as explicitslowness or lag [17], which is a challenge for mobile developers since performance isa key aspect in a good user experience [51].
Software performance, in terms of code efficiency, execution speed, and perceivedresponsiveness, is one of the more abstract parts of computer science. Often, per-formance is in the eye of the beholder, and research has shown that performancebugs are more difficult to detect, test, reproduce, and fix than non-performance orfunctional bugs [47, 28, 36, 55, 45]. Mobile platforms pose new challenges where thecontext of use can greatly affect performance, making detection and reproduction ofbugs even more difficult. What is making the application slow? Is it implementedinefficiently, is it running on an old device, does the user have poor reception ora bad network connection, or is there some other application draining all the re-sources of the device in the background? Although software performance is a richresearch area, it is unclear whether that research is applicable for mobile softwareperformance [45]. The new constraints introduced by mobile platforms require newresearch efforts to understand implications regarding performance, and there is alsoa clear need for more research about tools, guides, strategies, and support for mobiledevelopers to improve performance [54, 49, 44, 45].
Android is since 2010 the biggest mobile platform in the world [35], with more thanone million new devices being activated every day [9]. Part of the success of theAndroid platform is likely due to its open nature: the Android operating systemis an open source project, and all the tools needed to develop applications for theplatform, e.g. the Android SDK (Software Development Kit) and Android Studio,the official IDE (Integrated Development Environment) for Android development,can be downloaded for free on the Android developer website1. Due to the opennature of the platform, developers can use, override, or modify almost all systemcomponents, protocols, and APIs (Application Programming Interfaces), more sothan on more closed platforms, such as Apple’s iOS. This openness makes the An-droid platform a good research object, as the readily available source code enablesdevelopers and researchers to understand the platform better.
1http://developer.android.com/sdk
2 CHAPTER 1. INTRODUCTION
1.1 Spotify
Spotify is a music streaming company founded in 2006 by Daniel Ek and MartinLorentzon. Spotify has over 100 million users, over 30 million of which are premiumusers, meaning they pay a monthly subscription rate. Spotify is available on multipledevices, including desktop, web, mobile, chromecast, smart TVs, as well as integratedin some cars and sound systems. The service is split into a free tier and a premiumtier, where the free tier has limited functionalities and is supported by ad revenueand upsell to the premium tier. As of June 2015, Spotify had paid over $3 billionto right-holders, record labels, and artists, the platform hosts over 30 million songs,and the service is available in 59 different markets [52].
During the summer of 2015, the author of this thesis was an intern at the Spo-tify headquarters in Stockholm, and worked as an Android developer. During theinternship, she developed tools integrated in the internal versions of the Spotify An-droid application. These tools could be used to debug user interfaces, both from adesign perspective, and a performance perspective. These tools are introduced anddescribed in chapter 4. This thesis is inspired by aspects of that work, and focusesfurther on strategies for improving performance.
1.2 Objective
The objective of this thesis is to research performance on the Android platform,and investigate the possibilities to contribute with tools and guidelines for Androiddevelopers to detect performance bugs in their applications. The scope of the thesisincludes a literary study, an exploration of the Android platform, a case study withthe Spotify Android application (hereafter referred to as the Spotify application),as well as evaluating and developing tools integrated in it.
This thesis aims to answer the following research questions.
• What are performance bugs, and how do they impact mobile development andplatforms?
• What causes performance bugs in Android applications?
• Can causes of performance bugs be detected visually? Can visualisation be avalid strategy for performance testing and tooling?
1.3 Outline
The report continues with a chapter about related research, which introduces thetopics of mobile software performance, and strategies for testing and fixing per-formance bugs. This is followed by a chapter about the Android platform, whichintroduces characteristics that affect performance. The next chapter presents thetools developed prior to this thesis, followed by a presentation of the methodology ofthe thesis work, which in turn is followed by a presentation of results and findings.

1.3. OUTLINE 3
The report concludes with a discussion about the results, the thesis work, challenges,limitations, and future work.

4 CHAPTER 2. PERFORMANCE RESEARCH
2 Performance Research
This chapter introduces research areas related to this thesis, reviewed as a part ofa literary study that will be presented in section 5.1. Notably, some of the mostrelevant and useful articles cited below stated that their research and studies were thefirst of their kind, to the best of their knowledge [47, 28, 45, 38, 44, 36, 46], indicatingthat this is an interesting albeit sparse area of research in need of contribution.
2.1 Performance Bugs
A software bug is an error or mistake in a program or system that causes it tocrash, behave in unintended ways, or produce incorrect results. A performancebug is a type of software bug that causes execution times to be longer than theycould be, and fixing the bug can significantly speed up software without alteringits functionality [36]. Compared to non-performance bugs, which usually causedeterministic problems or failures, performance bugs are much more difficult todetect, fix, and test [47, 55, 36, 45]. Nistor et al. [47] found that fixes for performancebugs were generally larger, took longer, and needed more developers than those fornon-performance bugs, and that any supplementary fixes to the bugs usually furtherimproves performance, indicating that it is difficult to verify fixes as well as bugs.Zaman et al. [55] found that some performance bugs are intentionally left unfixeddue to trade-offs between tolerable performance decrease and the difficulty level offixing the bug.
Despite being difficult to detect, there are many studies about causes for performancebugs. There are several patterns for potential causes, for instance those identifiedby Jin et al. [36]: inefficient call sequences, functions doing unnecessary work, andsynchronisation issues, the latter of which has been found to occur even if there isjust one or two threads running [46]. Patterns specifically related to the Androidplatform were found by Liu et al. [45]: heavy operations on the main thread,computations for GUI (graphical user interface) elements that are not visible, andfrequent, heavyweight callbacks, especially callbacks invoked by user interaction orchanges in the activity lifecycle. For Android, there are four categories of APIcalls that are known to be heavy operations: network access, flash storage access,database access, and bitmap processing [54, 49]. If any of these operations are runon the main thread, they are likely to block UI (user interface) updates, causingstutters or “jank”.

2.2. STRATEGIES FOR TESTING AND FIXING PERFORMANCE BUGS 5
2.2 Strategies for Testing and Fixing Performance Bugs
The main problem with detecting performance bugs is usually not that potentialcauses are unknown, rather it is the lack of testing strategies, especially for Android[54]. In general, there exist many testing tools and strategies for mobile develop-ment [42], as well as research and development of more such tools and strategies[25, 34, 2, 1, 3, 29, 30], although almost all are focused around non-performancebugs. This is natural considering the differences in nature between these typesof bugs; non-performance bugs will usually cause an application to either crash orthrow exceptions, which can be detected fairly easily through monitoring applicationbehaviour, or analysing logs and stack traces.
However, studies like Liu et al’s [45], where they found that over 11,000 out of 60,000Android applications had suffered or were suffering from performance bugs, have in-spired new strides in research around mobile performance bugs and testing strategies[48, 44, 54, 49]. One strategy focuses on detecting usages of code patterns knownto cause performance problems, and developing tools to do just that. This strategyis based on the widely used concept of static analysis and rule based detection ofknown bug patterns [33, 37], used in tools like FindBugs [31], which analyses codeand warns about usages of patterns that are known to cause bugs. Liu et al. [45],Jin et al. [36], Ongkosit et al. [49], and Jovic et al. [39] have all developed toolsbased on this strategy, all of which were found to show real promise in detectingperformance bugs. Another strategy is to add artificial pauses to known blockingoperations to reveal if those operations are actually causing blockages or not, whichhas been explored by Nistor et al. [48], and Yang et al. [54]. There are also tools andguidelines developed by Android and Google to help developers build performantapplications, some of which will be presented in chapters 3 and 5.
Although promising, there are challenges with mobile development practices thatmight hinder the success of such tools and practices. There have been several studiesidentifying such challenges [50, 27, 43], as well as how developers work with testing[38, 41] and improving performance [44]. The findings of these studies includeschallenges with cumbersome tools, poor documentation, time constraints, and lackof expertise [41], which causes many developers to prefer manual testing [38, 41, 44].Johnson et al. [37] found that this was also the case for static analysis tools, onereason being their tendency to produce false positives. For new tools and strategiesto be successful, they would need to take such challenges into account: be efficientto use, and easy to learn and set up, without adding too much overhead for newusers.
2.3 Strategies for Visualising and Understanding Performance Bugs
Researchers have identified the need for improved detection measures for perfor-mance bugs, without producing false negatives, as well as support for fixing them[44, 45, 54]. Interesting measures towards meeting such needs include a tool devel-oped by Beck et al. [26], which used in situ visualisation to augment performancedata into code editors. The tool aimed to improve psychological motivation andavoid split-attention effects. Another interesting measure is a feature in the tool that

6 CHAPTER 2. PERFORMANCE RESEARCH
Jin et al. [36] developed, which in addition to warning about performance problems,false positives, and bad practises, also identifies good performance practices. Theseapproaches could not only make it easier for developers to detect performance bugs,but also to understand causes for them, making it easier to fix them.
These approaches have inspired this thesis work, which aims to find strategies fordetecting performance bugs that can help developers to better understand the causesof such bugs.

7
3 Android
This chapter introduces core concepts and components of the Android platform,focused on facets of the platform that affect performance. Most of the material cov-ered is provided by Google through the Google Developer website1, and in recordedtalks and videos from the Google Developer YouTube channel2.
3.1 Fundamentals of the Android Platform
Android is a mobile operating system based on the Linux kernel, and is mainly de-veloped by Google [7]. The first version of the Android SDK (Software DevelopmentKit) was released in 2008. The Android source code is released under open sourcelicenses, and is written mainly in C, C++, and Java. The software stack consistsof the Linux kernel, a Hardware Abstraction Layer, libraries like OpenGL|ES andSQLite, the Android Runtime, which consists of core libraries and the virtual run-time, the Android application framework, and then applications on top, as illustratedby Figure 1.
Figure 1: An illustration of the Android software stack, which includes the Linuxkernel, a Hardware Abstraction Layer, third party and core libraries,the Android application framework, and the application layer [8].
Android applications are built using four different application components, namelyactivities, services, content providers, and broadcast receivers. Activities are usuallythe main building block of any application, as it is the sole component that can
1http://developer.android.com2http://youtube.com/GoogleDevelopers

8 CHAPTER 3. ANDROID
provide a UI (user interface) [4]. An activity follows a lifecycle: it is paused andresumed if operations outside the application occurs but the activity is still visible,stopped and started as the user is switching between applications, and destroyed andrecreated if the system needs resources elsewhere. Services run in the background,independent of whether the application is in focus [23]. Content providers manageshared application data [11], and broadcast receivers allow for broadcasting eventswithin or across applications [10]. All components are run by default on the mainthread of the application.
3.1.1 Graphics and User Interface
The Android platform is normally based on a direct manipulation system, meaningthat a touch screen is the main input for user interactions. Most devices have somehardware buttons as well, but generally, applications will rely on interactions withthe UI. This section will introduce how the Android UI system works and how it isrendered.
UI Components
Figure 2: An example of a view hierarchy, where the ViewRoot is the root node,and other nodes are either Views or ViewGroups.
On Android, the GUI (graphical UI) consists of objects called views, which extendthe View class, a class that implements logic for how the view is rendered anddisplayed on the screen. A view is a graphical object that controls a certain areaof the screen, and can respond to user interaction. A view can either be a widget:a visual element such as a button, an image, or a text field, or it can be a layout:a container for other views. Layouts, which extend both the ViewGroup class andthe View class, implement logic as to how its children are displayed and ordered.Layouts can be nested in other layouts, in which case they act both as views relativeto their parent layout, and as layouts relative to their child views. The Androidplatform provides a UI Toolkit with a set of common layouts and widgets, suchas buttons, text fields, images, grid layouts, list layouts, etc. Custom layouts andwidgets can be created by subclassing a View or ViewGroup class, or any other

3.2. PERFORMANCE IN ANDROID APPLICATIONS 9
class that subclasses those. The UI can be declared through XML elements, orinstantiated programmatically [18]. Figure 2 depicts an example of how widgetsand layouts can be ordered in a view hierarchy.
UI Rendering
When an activity receives focus, it is requested to draw its view hierarchy, startingfrom the root node [16]. Drawing the layout has two passes: the measuring passand the layout pass, both of which are top-down traversals of the view hierarchy. Inthe measure pass, each view calculates and stores its preferred measurements, withrespect to any constraints set by its parent. In the layout pass, each ViewGrouppositions its child views using its preferred or imposed measurements, and then allviews are drawn to the screen according to their drawing logic.
When an application needs to update its UI, it will invalidate the view that needs toupdate [6]. The invalidation propagates through the view hierarchy to compute theregion of the screen that needs to be redrawn, known as the “dirty region”. How thehierarchy is redrawn depends on whether or not drawing is hardware accelerated.The software based drawing model invalidates the view hierarchy and then redrawsany view that intersects with the dirty region, whether or not those views have actu-ally changed. The hardware accelerated drawing model records drawing commandsin display lists. When a view is invalidated, only the display list of that view isinvalidated. The system then draws from the display lists, and if a display list hasnot been invalidated, it will simply be redrawn without any additional computation.Hardware acceleration was introduced in Android version 3.0 (Honeycomb), and isthe default drawing model starting in version 4.0 (Ice Cream Sandwich).
3.2 Performance in Android Applications
Performance on Android is affected by several factors, some of which are softwarerelated, and some that are dependent on the specific Android device and its hard-ware, e.g. CPU (Central Processing Unit), GPU (Graphical Processing Unit), etc.,as well as the version of Android the device is running. This section will introducethe main characteristics of the Android platform and Android devices that can causeperformance problems, as well as common performance bug patterns.
3.2.1 Performance Characteristics
Below, some of the main characteristics of the Android platform that impact per-formance are introduced.
Single Threaded System
When an application is launched, the Linux kernel creates a new process for it, witha single thread for execution [20]. By default, application components will run onthis single thread, which is the only thread from which the UI can be manipulated,

10 CHAPTER 3. ANDROID
and where user interaction events can be handled. For this reason, the main threadis often referred to as the UI thread.
Display Refresh Rate and VSync
Each Android device has a certain device and display refresh rate, at which opera-tions and executions are synced to ensure that graphics are rendered correctly andnot displayed or updated before they have finished rendering [32]. The standardrefresh rate is about 60 frames per seconds, or 16.667 ms per frame. The displaysends a signal called VSync every time it is ready to update, at which point thesystem will search for any changes to the UI that will need updating.
Mobile CPU
The CPUs in mobile devices differ from CPUs in other computers, both in capacityand construction [51]. Although some newer devices can have equally powerful CPUsas some personal computers, mobile CPUs very rarely run on full capacity. Mobiledevices have different CPUs used for different tasks: they have low-powered, efficientCPUs that are used for most tasks to save energy, and high performance CPUs thatare only used for heavy graphics rendering in e.g. games, or videos. Running thehigh performance CPU for an extended period of time will cause battery drain, andthe device will heat up.
Device Performance
Applications are run as users on the Linux kernel, which share the available resourcesof the device, including for instance memory and CPU [19]. This means that theperformance of an application can impact the performance of the whole device. Forinstance, an application that uses a lot of memory can cause other applications thatare running in the background to be killed in order to free up memory. This canmake the entire device appear slow and non-performant to the user when switchingapplications, because recreating an application takes more time than just restartingor resuming it.
Platform Fragmentation
Android is a very fragmented ecosystem, and there are many devices that are stillbeing sold and used that are running older versions of Android. Figure 3 shows thedistribution and usage of Android versions. There have been numerous updates inthe newer versions that improve performance, such as the introduction of hardwareacceleration (in Android 3.0 Honeycomb), an update of the runtime (in Android5.0 Lollipop), and the introduction of updating views with VSync (in Android 4.1Jelly Bean). To ensure that an application can be performant for as many usersas possible, developers need to ensure that applications can run smoothly on olderdevices and older versions of Android as well.

3.2. PERFORMANCE IN ANDROID APPLICATIONS 11
Figure 3: Android version numbers, code names and distribution rates as of April2016 [12].
3.2.2 Performance Bug Patterns for Android Applications
As discussed in chapter 2, researchers have found patterns for Android performancebugs, such as heavy operations on the main thread, computation for invisible views,etc. [45]. These are discussed below, along with best practices for improving per-formance as presented in the Android developer guidelines3.
Dropped Frames and Frame Rates
As mentioned, Android applications have 16.667 ms to update the UI to meet the60 fps refresh rate of the device. If a frame takes longer than that to render, thatframe is “dropped”, meaning the system will not update the UI. This causes theframe rate to drop to 30 fps or less, since the next frame will take 32 ms or more toupdate. A drop in frame rate is noticeable and jarring for the user.
Blocking the UI Thread
As applications by default have a single thread that is responsible for the UI, anyoperation that is not responsible for UI updates or handling user input is run on themain thread can be considered a blocking operation. Blocking operations, like theaforementioned examples of network access, bitmap processing, and storage access,could be negligible, but most often they are not. According to Sillars [51], updatesbetween 0-100 ms will be perceived as instantaneous, 100-300 ms might feel a bit
3http://developer.android.com/guide

12 CHAPTER 3. ANDROID
slow, 300-1000 ms will cause the user to assume that something is updating in thebackground, and anything longer than 1000 ms will likely be interpreted as a freezein the application. On Android, if an application freezes and stops responding toinput for more than 5 seconds, an “Application Not Responding” (ANR) dialogueis displayed (Figure 4). To avoid this, all blocking operations should be performedoutside of the UI thread.
Figure 4: An “Application Not Responding” dialogue, which is shown if the mainthread of an application is blocked for more than 5 seconds [17].
Complex View Hierarchies
As evident from section 3.1.1, rendering UI components is a process involving manyparts of the system, and UI computations are prone to get very heavy. A complexor poorly implemented UI is likely to lead to poor performance. Updating a deepand complicated view hierarchy will increase the computation needed for the CPUand GPU when updating and rendering display lists, since there is more measuring,layouting, and drawing needed than for a simpler, more shallow view hierarchy [32].
Overdraw
As mentioned, the system updates the UI by drawing each view of the view hierarchy,starting with the root view. The system will draw views on top of each other,ordering children views in front of their parents. This could potentially lead todrawing opaque views on top of other opaque views, effectively drawing the pixelsmultiple times. This is known as overdraw, and causes unnecessary computation anddrawing operations, which can be especially bad for performance during animations[13].
Garbage Collection
The Garbage Collector (GC) removes allocated memory that is no longer beingreferenced, which clears up memory. GC runs are expensive, especially on olderdevices. On devices running Android version 5.0 or later (Lollipop), a GC runusually takes about 2-4 ms, and on devices running older versions of Android, a GCrun will normally take about 10-20 ms on a fast device [14]. The difference is due tothe newer versions using an “ahead-of-time” runtime compiler called ART (AndroidRunTime), while the older versions uses a “just-in-time” runtime called Dalvik,and these perform GC runs differently. GC runs can be triggered by allocating alot of temporary objects at the same time, in a loop for instance. They can also

3.3. SUMMARY 13
be triggered by memory leaks, which is when unused objects are still referencedsomewhere in the system, meaning it will not be deallocated by the GC. Memoryleaks mean that there is less memory to use, which will likely increase the rate ofGC runs.
3.3 Summary
The Android platform is heavily reliant on the responsiveness of the GUI, whichneeds to meet a frame rate of 60 fps and an update time of between 0-300 ms toappear smooth and responsive to its users. This means that the UI has about 16ms to update, which can be difficult as the view rendering process is quite heavy.Any operations that might block the update time, or add complexity to the render-ing process in the form of complex view hierarchies or overdraw, will likely causeperformance bugs and poor responsiveness.

14 CHAPTER 4. SPOTIFY DEBUG TOOLS
4 Spotify Debug Tools
During the summer of 2015, the author of this thesis was an Android developerintern at Spotify in Stockholm. During the internship, nine different tools weredeveloped to aid Android designers and developers in their work. This section willintroduce those tools, which can be toggled on and off in a menu that slides in on theright hand side of internal versions of the Spotify application, see Figure 5. Thesetools were evaluated during this thesis work, as explained in section 5.2.
Figure 5: Menu that slides in from the right hand side of the application. Here,all tools are listed along with descriptions, and toggles to enable anddisable them.
4.1 Performance Tools
Three of the tools were developed to detect performance bugs in the application.These will be discussed further in the context of this thesis in chapter 7.
4.1. PERFORMANCE TOOLS 15
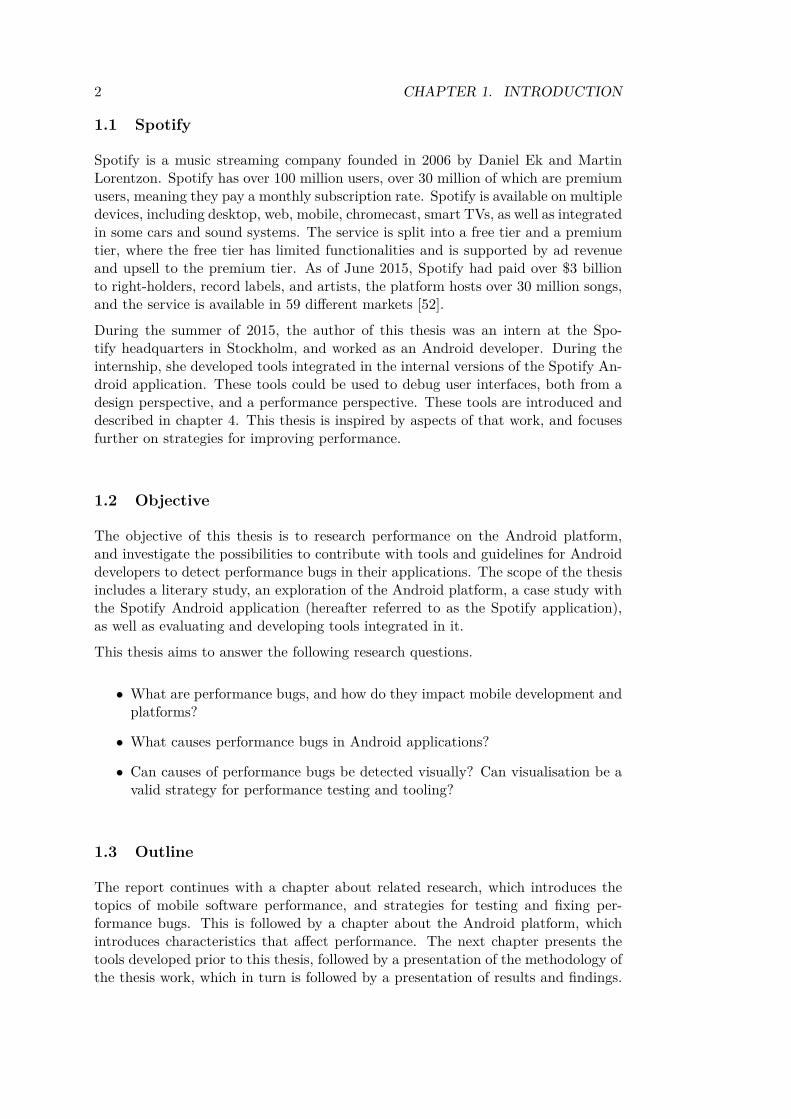
Relayout Tracker
This tool detects global relayouts in the application. A relayout is a callback thatis triggered when the view hierarchy goes through a phase of measuring and layout,which can be an expensive operation, as explained in section 3.1.1. The tool displaysbars on the screen that indicate how many relayouts are triggered every 0.5 second:the taller the bar, the more relayouts are triggered. The number of relayouts arealso stated on the screen. See Figure 6a.
Deep View Highlighter
This tool overlays a translucent red box on all views that are nested deeper than 10levels in the view hierarchy, as seen in Figure 6b. This makes it easier for developersand testers to find deep and complex view hierarchies, which as previously mentionedmight be bad for performance.
(a) Tool that displays the frequency of globalrelayouts in the application. The tallerthe red bars are, the more relayouts aretriggered.
(b) Tool that overlays views that are deeperthan 10 levels in the view hierarchy witha red tint.
Figure 6
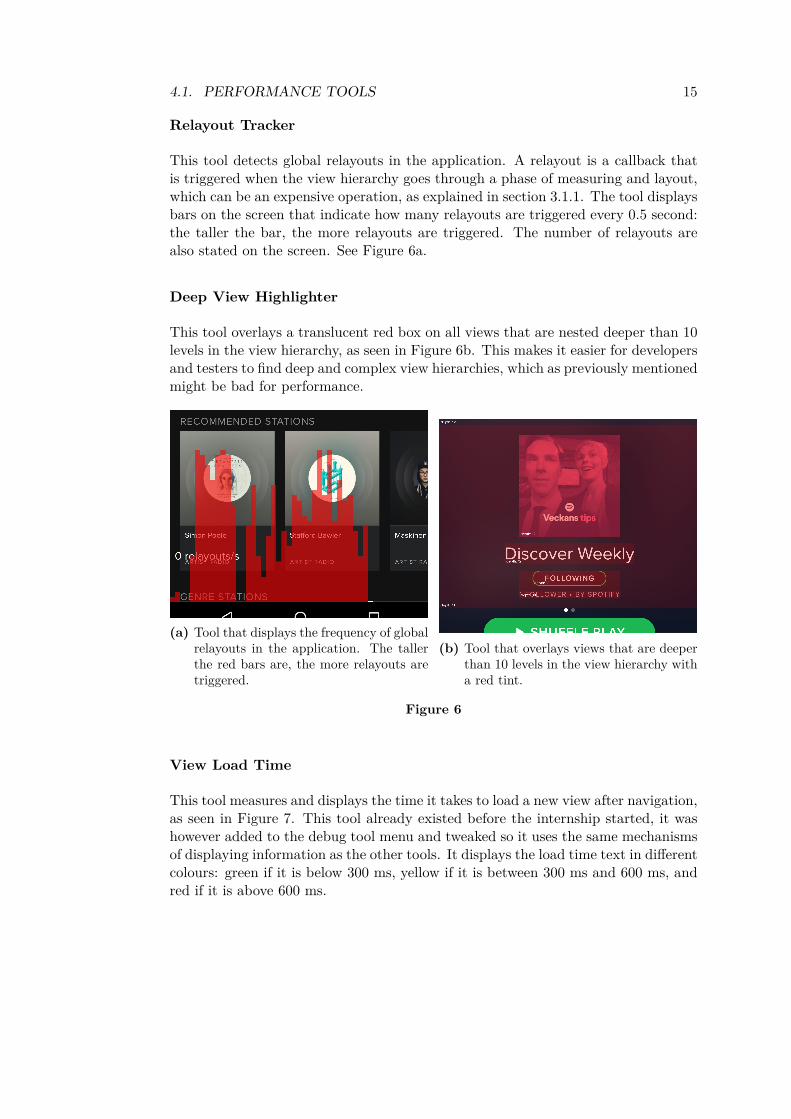
View Load Time
This tool measures and displays the time it takes to load a new view after navigation,as seen in Figure 7. This tool already existed before the internship started, it washowever added to the debug tool menu and tweaked so it uses the same mechanismsof displaying information as the other tools. It displays the load time text in differentcolours: green if it is below 300 ms, yellow if it is between 300 ms and 600 ms, andred if it is above 600 ms.

16 CHAPTER 4. SPOTIFY DEBUG TOOLS
Figure 7: Tool that displays the loading time for the current view, as well as theroute name of the view that is currently showing. The green text colourindicates that the view load time is below 300 ms, which is desirable.
4.2 Design Tools
The following tools were designed to make it easier for designers and QA (qualityassurance) to discover design related bugs in the application. Although these toolsare not of further interest in the context of this thesis, they are introduced to givecontext to the tool evaluation explained in section 5.2.
View Statistics
This tool shows some descriptive statistics about the views currently on the screen.It displays the total number of views currently on screen (visible and otherwise),how many of those views that are ViewGroups, the average view depth, and themaximum view depth. See Figure 8a.
Component Identification
This tool overlays a translucent blue box on any component that is a custom compo-nent, rather than one of the system components that the Android toolkit provides,as seen in Figure 8b.
(a) Descriptive statistics about the viewscurrently on screen, such as the num-ber of views and viewgroups, the averageview depth, etc.
(b) Tool that identifies custom componentsin the application. Here, the image andthe dots are identified as custom views.
Figure 8

4.2. DESIGN TOOLS 17
Grid Overlay
Android design guidelines are based on the so called 8 dp grid, where dp, or dip,stands for density independent pixel. This unit is used so that views are displayedthe same on low or high density display. This tool overlays the application with an8 dp grid to simplify the detection of whether or not views are properly aligned toeach other and to the grid. See Figure 9a.
Alignment Crosshairs
This tool overlays crosshairs consisting of two lines on the screen, one horizontaland one vertical, which can be moved across the screen to check alignment of views.The crosshairs can be moved freely, or be set to snap to an 8 dp grid or a 4 dp grid.See Figure 9b.
(a) Tool that displays an 8 dp grid in theapplication, to make it easier for devel-opers and designers to ensure that theUI is properly aligned.
(b) Tool that displays alignment crosshairsfor verifying view alignment in the ap-plication.
Figure 9
Typeface Identification
This tool overlays TextViews, i.e. text elements, with a translucent green box, alongwith a description of the font it uses. It displays the font family, the font size, theHEX value of the text colour, the alpha value (transparency value) of the text, andwhether or not it has a set style, such as bold or italic. See Figure 10a.

18 CHAPTER 4. SPOTIFY DEBUG TOOLS
Colour Pipette Tool
This tool displays a circle that can be moved across the screen, and that acts as amagnifying glass: the circle displays the area beneath it with a 10x magnification. Italso extracts the colour code of the pixel in the middle of the magnification, which ismarked with small crosshairs for the user, as shown in Figure 10b. The tool displaysthe HEX value of that colour, and if it matches any of the defined theme colours,the name of that colour resource is shown as well.
(a) Tool that displays information abouttypeface, such as the font family used,the font size, etc., for text views by over-laying it with a green tint.
(b) Colour pipette tool that can be used toextract colour information from the UI.The circle acts as a magnifying glass, andextracts information from pixel in themiddle of the circle.
Figure 10
Incorrect Typeface Detection
This tool works similarly to the typeface identification tool described above, but willonly highlight text elements that does not use the correct typeface as specified bySpotify’s design guidelines. The overlays of the tool are similar to those in Figure10a, except that they include the text “Incorrect Typeface”.
19
5 Method
This chapter presents the work methodology used during this thesis. The areasdescribed below include a two-tiered literary study, an evaluation of existing tools,a case study conducted on the Spotify application, and the development of a newtool. The literary study has been conducted throughout the thesis work, and theother tasks have been carried out in parallel during different periods.
5.1 Literary Study
To understand the context of this thesis work, an extensive literary study was carriedout. Initially, the study focused on related research about software performance andtopics related to that, including mobile development, testing practices, practices forfixing bugs, etc. The reviewed research mainly consisted of articles and conferencepapers found through Google Scholar1. Some of the keywords and phrases usedto find the research included “Android performance”, “buggy interfaces”, “debuginterfaces”, “measure performance”, “performance bugs”, etc. Papers and articlesreviewed were also found through the reference lists of other papers and articles.The reviewed material and the results gained from this phase of the literary studyare summarised in chapter 2.
A separate facet of the literary study included research about Android, in order tounderstand how the platform works, mainly regarding performance. Material andinformation consumed for this work was predominately produced by Google, mainlyon their Android developer website2, through recordings from conference talks givenby Google employees, or through videos on the Google Developer YouTube channel3.The book “High Performance Android Applications” [51] was also an importantsource for this research. A summary of the gained insights is presented in chapter3.
5.2 Evaluation of Existing Tools
To understand how the tools presented in chapter 4 have been performing after theauthor’s internship ended, whether they have been effective in detecting bugs andverifying bug fixes, and to get comparative data to evaluate, a survey was created.The survey consisted of 11 questions:
1https://scholar.google.com/2http://developer.android.com3https://youtube.com/GoogleDevelopers

20 CHAPTER 5. METHOD
• One demographic question.
• Five close-ended questions regarding knowledge and usage of the tools.
• Three open-ended questions about possible improvements, additional tools, orcomments about the tools.
• One open-ended motivation.
• One open-ended question about whether the respondent would like to be offurther help to the thesis.
The survey was created using Google Forms, and was sent out via email and internalcommunication channels to Android developers, testers and designers across Spotify.The survey along with an introductory text is listed in Appendix A.
5.3 Case Study with the Spotify Application
In order to apply the findings from the literary study, and to get practical knowl-edge of different tools that exist for measuring and improving performance, a casestudy was carried out. The case study included measuring and profiling the Spotifyapplication using different tools, and exploring how the Spotify application is builtwith regards to common performance bug patterns and practices. The main goalwas to get a sense of the performance profile of the Spotify application, and identifyareas where the performance could be improved.
Profiling Device
To get consistent measurements, and to eliminate as many contextual factors (suchas other applications using resources in the background, device storage differences,different technical specifications, etc.) as possible while measuring, a single devicewas used. Some requirements were set on the profile device in order to get measure-ments as representative of an average Spotify user as possible, including that thedevice could realistically run the Spotify application smoothly, but not be perfor-mant enough to disguise any eventual performance bugs. The device used for theprofile was a Samsung Galaxy S3 (GT-I9305) running Android version 4.3 (Jelly-bean). It was chosen with the help of a QA (quality assurance) at Spotify as thebest device available to fit the requirements mentioned. The S3 was released as ahigh-end device in 2012 with a quad-core 1.4GHz CPU. The device had 16 GB ofstorage, no external SD card, and was connected to WiFi during the profiling. TheInternet connection had an upload and download speed of about 40 MBit/s, andthe device was connected to a computer at all times, both to enable debugging andmonitoring using different desktop tools, as well keeping any battery inconsistenciesto a minimum.

5.3. CASE STUDY WITH THE SPOTIFY APPLICATION 21
GPU Overdraw Profiler
One of the on-device developer tools4 that the Android platform provides is anoverdraw detection tool, which overlays the UI with different colours based on theamount of overdraw [13], as illustrated by Figure 11. Blue tint means 1x overdraw,or that the pixels have been drawn twice, green tint means 2x overdraw, lighter redtint means 3x, and deeper red is 4x overdraw, meaning the pixels have been drawn5 times or more. For measuring overdraw in the Spotify application, this tool wasenabled during exploration of the UI.
Figure 11: The tint colours used in the “Debug GPU Overdraw” tool that theAndroid platform provides. Blue tint means 1x overdraw, or that thepixels tinted with blue have been drawn twice, green that they aredrawn three times, etc. [13].
GPU Usage Profiler
The GPU usage profiler is another tool that the Android platform provides, and canbe run on-device or from Android Studio [21]. The tool displays stacked bars on thescreen or in a graph monitor in Android Studio, and shows real-time GPU usage forUI updates. The stacked bars show how much time is spent on different operations,such as measuring, layout, drawing, etc. The tool also displays a green, horizontalline that represents the 16 ms frame update limit, which makes it easy to detect anydropped frames. Profiling the application with this tool was done by enabling thetool and exploring the UI, to detect any areas where the GPU usage would exceedthe 16 ms limit, causing the bars to exceed the line, and also result in stutters inanimations.
4These tools are available in the hidden “Developer Options” in the device settings. Theseoptions are displayed if the “Build number” field in the “About phone” section is tapped 7 times.

22 CHAPTER 5. METHOD
Profiling Application Startup Time
To measure the start up time of the application, the view load time tool described insection 4.1 was used. The results from this tool are not fully representational for theactual startup time of the application, as the tool itself is not initialised at the verybeginning of the startup process, but it still provides descriptive and comparabledata.
AndroidDevMetrics
AndroidDevMetrics [53] is an open source tool that was initially released on GitHubin March of 2016. It measures activity lifecycle metrics and dropped frames, as wellas the frame rate during the frame drop. The lifecycle metrics includes the averagetime for how long the activity takes to perform lifecycle callbacks like onCreate,onStart, and onResume, as well as the time taken to perform a layout of the activityUI. This tool was added to the Spotify application and was run during explorationof the UI.
HierarchyViewer
HierarchyViewer is a tool that can be run as a standalone desktop application, or aspart of the Android Studio Device Monitor [15]. An overview of the tool is shownin Figure 12. The tool displays each view in the view hierarchy as a box, and theboxes are connected in a tree like structure. The user can choose to profile the viewhierarchy, or subsets of it, to evaluate the time it takes to measure, layout, and drawthe view hierarchy. The results from the profiling are visualised on the boxes withthree dots, each corresponding to the view rendering phases. A green dot indicatesthat it was faster than at least half of the other views, a yellow dot that it was fasterthan the bottom half of the other views, and red that it is in the slowest half ofthe views. The result can also be viewed as explicit load times by inspecting theboxes. The HierarchyViewer tool was used to inspect and profile different views inthe Spotify application.

5.4. DEVELOPMENT OF A NEW TOOL 23
Figure 12: A screenshot of the HierarchyViewer tool, where each of the boxes rep-resents a view in an activity. The measure, layout, and draw sequencesof the views can be profiled in the tool, and the results are visualisedas dots on the boxes [15].
Best Practice Evaluation of the Spotify Application
To explore how the Spotify application is architectured and implemented with re-gards to known performance bug patterns and best practices (as discussed in chapter3), an investigation was carried out. The code base was inspected, as well as toolsand practices used for developing and testing the application, with the guidance ofsome Android developers at Spotify.
5.4 Development of a New Tool
During the thesis, a new tool for simplifying the removal of overdraw was developed.The idea for the tool emerged from measuring overdraw during the case study. Itwas integrated as a part of the Spotify application, like the tools described in chapter4. The tool was developed with Java using the Android framework, using Git5 asa version control system. A version control system makes is possible for multipledevelopers to work on the same code base, and Git is the version control systemthat developers at Spotify use to manage their code bases.
5https://git-scm.com

24 CHAPTER 6. RESULTS
6 Results
This section presents the results obtained during the thesis work, which includesthe results from the evaluation survey, results from the case study with the Androidapplication, and a presentation of the new tool.
6.1 Results from Tool Evaluation
The tool evaluation survey had in total 19 respondents (out of about 100 activecontributors to the Android code base at Spotify, as well as designers and QAs(quality assurance)). The results of the close-ended questions are displayed in Table1.
Question ResultsWhat’s your occupationat Spotify?
16 Android developers and managers, 2 designers, and1 QA.
Were you aware of the ex-istence of the debug tooldrawer?
19 yes.
Have you used any of thetools in the drawer?
14 yes, rest no or N/A.
If yes, which toolhas been most help-ful/useful?
3 relayout tool, 2 grid tool, 2 deep view highlighter,2 incorrect typeface tool, 1 view statistics, 1 colourpipette tool, 1 view load time tool, 1 alignmentcrosshairs.
What do you use thetools for?
12 development purposes, 2 design purposes, 1QA/testing purposes.
How often would you sayyou use the tools or thedrawer?
7 weekly, 4 monthly, 3 every few month, 3 “never re-ally...”.
Table 1: The questions and answers from the close-ended questions in the toolevaluation survey presented in section 5.2.
Motivations for choosing the most useful tool included that the relayout tool hadproved useful for finding performance issues, the deep view highlighter had discov-ered unnecessary depth, the view load time tool ensured load time quality, the gridtool was useful for checking sizes, the incorrect typeface tool for discovering errorsin typeface component usage, and the pipette tool since that was the only tool thatparticular respondent had used.
As for suggestions for tool improvements and additions, there were wishes for more

6.2. RESULTS FROM THE CASE STUDY 25
sophisticated component identification, a tool to show what the application is doingif it is frozen, and methods for comparing performance between versions and codechanges.
There were also some thoughts about communication with regards to the tools:when to use them, how to use them, how to make them difficult to ignore or avoid,etc. As one respondent put it:
“The approach with having tools and visualisations within the app isgreat but also easy to miss/ignore. Doing some checks and stats on newadditions during the build and test phase will probably be very useful [ifand only if] they can be stable enough to be trusted.”
Another respondent answered:
“The drawer seems to consist of many useful tools now that I actuallylooked through them. To me personally, the issue is really to know whento use what tool.”
Some of the tools, mainly the relayout tool, the incorrect typeface tool, and thedeep view highlighter, have been used to detect and verify fixes for bugs since theywere introduced. As an example, the relayout tool used to peak at 60 relayouts persecond during some interactions, e.g. scrolling in certain lists. Now, it rarely exceeds2-4 relayouts per second. Likewise, the deepest view hierarchies were around 16 or17 levels deep, and are now around 11 or 12 levels deep.
6.2 Results from the Case Study
The performance profile was gathered over a few weeks from a Samsung Galaxy S3as described in section 5.3.
GPU Overdraw
Results from the GPU Overdraw tool showed that the Spotify application was suf-fering from overdraw throughout the application. Figures 13a and 13b shows screen-shots from the Home view and the Library view with the overdraw tool enabled,where Home (Figure 13a) has 2x and 4x overdraw, as visualised by the green andred tint, and Library (Figure 13b) has between 1x and 4x overdraw. Other ex-plored parts of the application were also suffering from at least 1x overdraw, withthe exception of one view that displays queued music.

26 CHAPTER 6. RESULTS
(a) Overdraw for the Home viewwith 2x (green tint) to 4x (redtint) overdraw.
(b) Overdraw for the Library viewwith between 1x (blue tint), 2x(green tint), and 4x (red tint)overdraw
Figure 13
GPU Usage Profiler
The GPU usage profiler was used throughout the application, and testing includedrigorous user interactions, e.g. scrolling through lists very fast, and performingextensive dragging operations, in order to detect as many problematic areas as pos-sible. Views in the application where the GPU profiler repeatedly exceeded the 16ms rendering limit, resulting in dropped frames and stutters in animations, were:
• Home view - While scrolling.
• Running category - While scrolling.
• List views, e.g. playlists, artists - When scrolling to the top of the list.
• Now Playing View/Player - When skipping songs, and when track titles werelooping.
• Library view - While scrolling.
• Party tuner view - While loading and updating.

6.2. RESULTS FROM THE CASE STUDY 27
In general, it appeared as if updating placeholders to loaded images was the maincause of the exceeding rendering times. Upon an informal inspection of logcat, a toolin Android Studio that displays logs of system messages, it was found that loadingimages for thumbnails etc. caused frequent GC runs.
Application Startup Times
In total, there were 129 measurements, whereof 110 were measured from backingout of the application, and then resuming it again, and 19 were measured afterthe application was force stopped via the Android settings menu, ensuring a “coldstart” (complete reset of resources and processes) of the application. The results arepresented in Table 2.
Resume/restart Cold startMean load time 687.74 ms 1608.53 msStandard deviation 470.90 ms 149.51 msMedian load time 526 ms 1587 ms
Table 2: The mean load time, the standard deviation, and the median load timefor the startup time measurements.
AndroidDevMetrics Results
The results from using the AndroidDevMetrics tool can be seen in Table 3. Asmentioned, the results from the AndroidDevMetrics tool are averaged based on thenumber of activity instances, and these results are further averaged over the numberof measurements, denoted as tries.
Activity Tries onCreate(ms)
onStart(ms)
onResume(ms)
Layout(ms)
Instances Droppedframes
MainActivity 11 135.82 77.58 39.33 555 79 727PlayerActivity 6 11 19.29 30.43 156.17 29 379EditablePlayQueueActivity 5 112.60 12.40 26 164.4 7 28LoginActivity 1 28 18 20 337 1 1DeviceActivity 2 9.50 49 27 144 2 21ManualTempoActivity 1 50 6 20 134 1 1
Table 3: The results from using the AndroidDevMetrics tool in the Spotify appli-cation.
Results from HierarchyViewer
One result from using the HierarchyViewer can be seen in Figure 14. The inspectedview hierarchy is from the PlayerActivity, or “Now Playing view”, shown in Figure14a, and Figure 14b displays the view tree in HierarchyViewer. Worth noting is thatthe first 4 nodes are rendered from the system rather than the Spotify application.

28 CHAPTER 6. RESULTS
(a) A screenshot from the Play-erActivity in the Spotify ap-plication.
(b) A screenshot from HierarchyViewer of the Player-Activity view hierarchy.
Figure 14
Results from Best Practice Evaluation
There are some measures taken against the common bug patterns discussed in chap-ters 2 and 3. There are several testing tools used during development at Spotify,including static analysis tools (Lint1, FindBugs2, and CheckStyle3). These performchecks for performance bug patterns, e.g. non-UI operations on the main thread,and warnings about opaque views that might introduce overdraw. Other tools, suchas LeakCanary4, are used for detecting memory leaks.
To ensure application performance across the platform fragmentation, QAs at Spo-tify have an extensive suite of testing devices, including older devices, lower enddevices, and devices running older versions of Android. Best practices regarding UIperformance, such as deep and complex view hierarchies, and overdraw avoidance,have historically not been considered as much, although this thesis work as well asprior work by the author are measures to improve that.
1https://developer.android.com/studio/write/lint.html2http://findbugs.sourceforge.net3http://checkstyle.sourceforge.net4https://github.com/square/leakcanary

6.3. VIEW HIERARCHY TRAVERSING TOOL 29
6.3 View Hierarchy Traversing Tool
This tool was developed to simplify the process of removing overdraw in an applica-tion, as a result of the results from the overdraw profiling. The main functionalityof the tool is to acquire the current view hierarchy of the application, hide all visibleviews, and stepping through them view by view, displaying them again. When ahidden view is displayed, the tool highlights the view with a white border, displaysthe component name, and the view ID if there is one. When the tool is enabled,there are two buttons in the bottom right corner of the application, as shown inFigure 15a. The “Step Through Layout” button allows the user to step through thelayout view by view with two other buttons, both backwards (hiding views again)and forwards. The “Animate Layout” button will animate the layout, displaying anew view every 250 ms. While animating, the user can choose to pause and resumethe animation to inspect any single view.
(a) A screenshot of the Home view withthe new tool enabled. The buttons inthe bottom right corner let the usereither step through a layout view byview, or animate it.
(b) A screenshot from the Spotify appli-cation while the step-through func-tionality of the new tool is enabled.Here, the play button has just beendisplayed, indicated by the squarewhite border.
Figure 15
With the Android overdraw detection tool enabled, the tool can be used to identifywhich view is causing the overdraw, as the overlay tool will tint the views as they

30 CHAPTER 6. RESULTS
are shown while stepping through the hierarchy. The traversing tool was used toremove overdraw throughout the Spotify application when it had been developed,as it made it easier to detect which views and layouts introduced the overdraw. Itwas found that the majority of the existing overdraw was introduced by fragmentsthat had opaque backgrounds in the same colour as the window background of theapplication, and when these fragments were set to have transparent backgroundinstead, almost all of the detected overdraw was removed.

31
7 Discussion
The following sections include discussions about the results of this thesis work, an-swers to the research questions asked in the introduction of the report, any limita-tions, problems, and uncertainties in thesis work, proposed guidelines for improvingperformance in Android applications, as well as ideas for future work in this area.
7.1 Results and Findings
When the previously developed tools were introduced in the summer of 2015, theyreceived praise from other developers at Spotify. Especially the performance tools,e.g. the relayout tool, and the deep view highlighter, detected and visualised bugsthat were completely unknown to the developers at the time. The results fromthe tool evaluation supported the fact that these tools have shown potential, andthat the seemingly simple action of visualising something by tinting or flashing itis an effective approach to finding performance bugs. The performance tools wereamongst the most popular tools, and suggestions given in the evaluation have beenuseful for gathering ideas to explore during the thesis work.
The overall goal of this thesis was to research mobile performance, and use prac-tices and strategies to understand how developers can and should work with regardsto performance. The case study that was carried out proved valuable in meetingthat goal. The results gained from the study, for instance the data on startuptimes, and from AndroidDevMetrics, are interesting indicators for areas where theSpotify application still has work to do. Some of the activities measured with An-droidDevMetrics instantiated above the recommended 0-200 ms range for appearinginstantaneous to the user, especially MainActivity. Such is also the case for therecorded startup times. Even though the Spotify application fares well with regardsto best practices, such as avoiding blocking operations on the main thread, andmanaging memory to avoid GC runs, it still faces challenges with other aspects ofperformance, for instance working well across the platform fragmentation.
By profiling and measuring performance data, one acquires results which can then beacted upon accordingly. For instance, during the thesis, the findings about overdrawled to the development of a tool to find the sources of the overdraw, and ultimatelyin fixing and removing most of it. Likewise, the usage of the GPU profiler tool hasuncovered that there are multiple GC runs when updating placeholders to loadedimages while scrolling, which can be an action point for further work. This thesisonly scratched the surface on performing an extensive performance profile of an An-droid application, but has nonetheless identified problematic areas, and attemptedto take action to remedy them.
32 CHAPTER 7. DISCUSSION
7.2 Answering the Research Questions
In order to focus the scope of the thesis, the following research questions wereformulated.
• What are performance bugs, and how do they impact mobile development andplatforms?
• What causes performance bugs in Android applications?
• Can causes of performance bugs be detected visually? Can visualisation be avalid strategy for performance testing and tooling?
The first two research questions were the basis of the literary study. The resultinganswers to these questions are presented in chapter 2 and 3 respectively. In sum-mery, performance bugs are defined by causing slow execution times rather thandeterministic errors, and are affected by many aspects of the mobile context, suchas limited hardware capabilities, and of the Android operating system as well. Thethird research question is more interesting, and it was initially derived from theresults of the tools developed prior to this thesis. The view hierarchy traversal toolpresented in section 6.3, along with some of the previously developed tools presentedin chapter 4, have shown that visualisation can be used to both find and understandnew performance bugs, as well as show new ways of fixing and validating them.For the Android platform, there is much going on underneath the hood, and withvisualisation tools, it could be possible to get a deeper understanding for how thingsreally work. As found, understanding common causes for performance bugs willnot necessarily be helpful for performance debugging, if there is no feasible way ofverifying them.
This thesis has focused mainly on performance bugs introduced by UI components.Using visualisation to detect UI bugs is quite natural, seeing as it is already the onlyvisual part of the application. In that sense, detecting hidden views or deep viewhierarchies is fairly straight forward. Another interesting approach is to attemptto visualise non-UI parts of the application, like callbacks, triggers, broadcasts, etc.This approach is used in the relayout tool for instance, which counts and visu-alises relayout callbacks in the application. Examples of other candidates for suchvisualisation are garbage collection events, and blocking operations. Visualisationis definitely a valid strategy for detecting sources for performance bugs, as demon-strated by the tools discussed in this thesis, and there are more areas still that mightbenefit from such a strategy.
7.3 Limitations
Spotify implements continuous delivery, which means that code is developed anddeployed continuously. The Spotify application is updated every other week, andthere are always new changes to the code base. In the context of this thesis, thismeans that there is no real stable testing environment, and changes that mightimprove performance could be reset by changes that lower the performance in the

7.4. PROPOSED GUIDELINES 33
next update. Performance testing is difficult enough without the added error sourceof constant change. The results from the case study might not be comparable orrepresentative of the application as it is today, and it could potentially have beenskewed as it was measured as well. Even if the code for the Spotify application initself was not updated, changes to the backend might still impact performance. Thisis one reason as to why the thesis has focused more on UI related performance, asthe UI logic is one of the more stable parts of the code base, and is not subjectedto frequent change.
7.4 Proposed Guidelines
This section proposes some guidelines based on the results of this thesis work, andthe discussion above. Many of them echo guidelines set forth by the Android teamas well as by researchers in the field.
7.4.1 Go Looking for Problems
Where there is code, there are bugs, including performance bugs. Given that thereare bugs, in order to fix them, one first needs to find them, so go looking. There aretools, best practices, and bug patterns for performance bugs which are great placesfrom which to start, and using tools to profile and measure application performancewill produce data that can be used as benchmarks for comparison later on.
7.4.2 Understand What It All Means
When a problem is located, it needs to be understood. Not knowing what a problemmeans or entails will make it impossible to solve it. Use tools to gain knowledgeabout the problem, visualise if possible, and again, looking to best practices mightbe a good place to start.
7.4.3 Do Your Best To Fix Things
Understanding the problem will hopefully also give some insights as to how theproblem can be solved. In that case, do it. In other cases, you might need to trynew things. If your toolbox does not include the tools needed to fix the problemgiven what you know about it, maybe introducing a new tool could help. Try tounderstand the problem with the help of the new tool, and iterate if necessary.
7.4.4 Make Sure It Works
When you think you have solved the problem, prove it. Compare the results to theprevious results, and verify your solution. Data very rarely lies, but as this is aboutperformance, testing it out for yourself and getting a sense of whether or not it feelsbetter is also a valid approach. Objective data is however always better.

34 CHAPTER 7. DISCUSSION
7.4.5 Repeat And Get Involved
This is a cycle that never ends, as there will always be new code, and there willalways be new bugs. With a focus on performance bugs, it is a good approach toinvolve others in the process, as it is futile to patch performance bugs if anotherdeveloper is busy adding new ones. Tools are again a good approach here, as theycan make it easier for everyone to find and verify changes. So take what you havelearned, and go looking again.
7.5 Future Work
This section discusses ideas that could not be explored properly during the thesis,but would be interesting to explore in further work in this area.
Other Tools
There are other tools provided by the Android platform that can be helpful inlocating performance bugs, such as Systrace, Traceview, and StrictMode. Thesetools were outside the scope of this thesis, but this section will briefly introducethem as tools of interest. Systrace is a tool that records a trace of execution timesfor all processes and CPUs [5]. Inspecting the trace can show in detail what causesframes to be dropped, or what operations might block other updates. Traceviewis a tool that gathers information about method calls, and can be used to locateheavy operations [22]. StrictMode is a tool that detects violations of different pre-defined policies, and reports these either via logs, or via an on-device tool that flashesthe screen [24]. Common policies are set up around slow and blocking operations,memory leaks, etc., and the usage of visualisation in this tool makes it interestingin the context of this thesis.
Ideas for Visualisation
As this thesis and the tools developed before and during the thesis focus mainly onvisualisation, some ideas for other visualisation tools that could detect performancebugs are:
• Visualising empty viewgroups and views that for some reason do not affect thefinal GUI experience.
• Visualising frequent measuring and redrawing of views.
• Visualise warnings about usage of RelativeLayouts in the root of the viewhierarchy, or LinearLayouts with weights. These layouts will measure theirchildren at least twice in order to position them correctly, which means that ameasuring phase with a RelativeLayout as a root view will increase executiontimes for the measuring phase exponentially.
• Visualise GC runs by flashing the screen.

7.6. CONCLUSIONS 35
• Implementing an FPS counter, in order to visually track frame rate drops onscreen.
• TTI-meter (Time To Interaction), to ensure that pauses are kept to a mini-mum, and maintaining a responsive experience for the user.
Performance Profiling Model
An idea that was considered during the thesis work was to visualise the perfor-mance profile in a polar chart, as in Figure 16. Each pie slice could represent oneperformance aspect, such as memory usage, view hierarchy complexity, overdraw,etc., each with its own scale of values that can be used to grade the performance.This model could either be manually filled out by hand, but it could also potentiallywork as an automated integration tool, which can show and test the application ina much more deterministic fashion than with manual measurement. In that case, itcould provide a performance score based on the statistics derived from the mean ormedian of the obtained values.
Figure 16: An concept for a tool which uses a polar chart to visualise a perfor-mance profile. Each pie slice in the polar chart represents an aspect ofperformance.
7.6 Conclusions
This thesis has explored performance of Android applications, and the numerousaspects that impact it. As found in chapter 2, the research area of software per-formance is an interesting and growing field of study, especially for software perfor-mance on mobile platforms as they also face challenges with regards to the mobilecontext. The Android platform in particular has many characteristics that affectperformance, as presented in chapter 3, but researchers and developers alike are

36 CHAPTER 7. DISCUSSION
working to develop tools, best practices, and strategies to help themselves and oth-ers to improve performance across Android applications and the platform itself.
Some of these tools and practices have been used and evaluated during the casestudy with the Spotify application, along with the tools developed prior to thisthesis. Key findings of this thesis are that although improving performance can be adifficult and tedious process, there are plenty of tools, best practices, guidelines, andresources for developers to use in the process. This thesis also highlights promisingresults for using visualisation for detecting sources for performance problems, whichcan simplify the process of detecting that which cannot be seen. This approachcould make it easier for developers to understand performance problems, as well asthe architecture of their own applications.

REFERENCES 37
References
[1] Domenico Amalfitano, Anna Rita Fasolino, and Porfirio Tramontana. A guicrawling-based technique for android mobile application texting. In ICSTW’11,pages 252–261, 2011.
[2] Domenico Amalfitano, Anna Rita Fasolino, Porfirio Tramontana, SalvatoreDe Carmine, and Gennaro Imparato. A toolset for gui testing of android ap-plications. In ICSM’12, pages 650–653, 2012.
[3] Domenico Amalfitano, Anna Rita Fasolino, Porfirio Tramontana, SalvatoreDe Carmine, and Atif M. Memon. Using gui ripping for automated testingof android applications. In ASE’12, pages 258–261, 2012.
[4] Android. Activities, 2016. http://developer.android.com/guide/components/activities.html, accessed 2016-04-12.
[5] Android. Analyzing ui performance with systrace, 2016. https://developer.android.com/studio/profile/systrace.html, accessed 2016-05-24.
[6] Android. Android drawing models, 2016. http://developer.android.com/guide/topics/graphics/hardware-accel.html#model, accessed 2016-04-13.
[7] Android. Android interfaces and architecture, 2016. https://source.android.com/devices/, accessed 2016-04-13.
[8] Android. The android source code, 2016. https://source.android.com/source/index.html, accessed 2016-05-02.
[9] Android. Android, the world’s most popular mobile platform, 2016. http://developer.android.com/about/android.html, accessed 2016-02-25.
[10] Android. Broadcast receivers, 2016. http://developer.android.com/reference/android/content/BroadcastReceiver.html, accessed 2016-04-12.
[11] Android. Content providers, 2016. http://developer.android.com/guide/topics/providers/content-providers.html, accessed 2016-04-12.
[12] Android. Dashboards, 2016. http://developer.android.com/intl/es/about/dashboards/index.html, accessed 2016-05-02.
[13] Android. Debug gpu overdraw walkthrough, 2016. http://developer.android.com/tools/performance/debug-gpu-overdraw/index.html, ac-cessed 2016-05-09.

38 REFERENCES
[14] Android. Debugging art garbage collection, 2016. https://source.android.com/devices/tech/dalvik/gc-debug.html, accessed 2016-04-13.
[15] Android. Hierarchy viewer walkthrough, 2016. https://developer.android.com/studio/profile/hierarchy-viewer-results-walkthru.html, accessedon 2016-05-24.
[16] Android. How android draws views, 2016. http://developer.android.com/guide/topics/ui/how-android-draws.html, accessed 2016-04-13.
[17] Android. Keeping your app responsive, 2016. http://developer.android.com/training/articles/perf-anr.html, accessed 2016-02-29.
[18] Android. Layouts, 2016. https://developer.android.com/guide/topics/ui/declaring-layout.html, accessed 2016-04-13.
[19] Android. Managing your app’s memory, 2016. http://developer.android.com/training/articles/memory.html, accessed 2016-04-13.
[20] Android. Processes and threads, 2016. http://developer.android.com/guide/components/processes-and-threads.html, accessed 2016-05-09.
[21] Android. Profiling gpu rendering walkthrough, 2016. http://developer.android.com/tools/performance/profile-gpu-rendering/index.html,accessed on 2016-05-10.
[22] Android. Profiling with traceview and dmtracedump, 2016. https://developer.android.com/studio/profile/traceview.html, accessed 2016-05-24.
[23] Android. Services, 2016. http://developer.android.com/guide/components/services.html, accessed 2016-04-12.
[24] Android. Strictmode, 2016. https://developer.android.com/reference/android/os/StrictMode.html, accessed 2016-05-24.
[25] Stephan Arlt, Andreas Podelski, Cristiano Bertolini, Martin Schäf, Ishan Baner-jee, and Atif M. Memon. Lightweight static analysis for gui testing. In IS-SRE’12, pages 301–310, 2012.
[26] Fabian Beck, Oliver Moseler, Stephan Diehl, and Günter Daniel Ray. In situunderstanding of performance bottlenecks through visually augmented code. InICPC’13, pages 63–72, 2013.
[27] Stefanie Beyer and Martin Pinzger. A manual categorization of android appdevelopment issues on stack overflow. In ICSME’14, pages 531–535, 2014.
[28] Pamela Bhattacharya, Liudmila Ulanova, Iulian Neamtiu, and Sai Charan Ko-duru. An empirical analysis of bug reports and bug fixing in open source androidapps. In CSMR’13, pages 133–143, 2013.
[29] Wontae Choi, George Necula, and Koushik Sen. Guided gui testing of androidapps with minimal restart and approximate learning. In OOPSLA’13, pages623–640, 2013.

REFERENCES 39
[30] Guilherme de Cleva Farto and Andre Takeshi Endo. Evaluating the model-basedtesting approach in the context of mobile applications. ENTCS, 314:3–21, 2015.
[31] FindBugs. FindbugsTM - find bugs in java programs, 2016. http://findbugs.sourceforge.net/, accessed 2016-02-18.
[32] Chet Haase and Romain Guy. For butter or worse: Smoothing out performancein android uis, 2012. https://www.youtube.com/watch?v=Q8m9sHdyXnE, ac-cessed 2016-04-13, uploaded 2012-06-29.
[33] David Hovemeyer and William Pugh. Finding bugs is easy. ACM SIGPLANNotices, pages 92–106, 2004.
[34] Cuixiong Hu and Iulian Neamtiu. Automating gui testing for android applica-tions. In AST’11, pages 77–83, 2011.
[35] IDC. Smartphone os market share 2015 q2, 2016. http://www.idc.com/prodserv/smartphone-os-market-share.jsp, accessed 2016-02-25.
[36] Guoliang Jin, Linhai Song, Xiaoming Shi, Joel Scherpelz, and Shan Lu. Under-standing and detecting real-world performance bugs. In PLDI’12, pages 77–88,2012.
[37] Brittany Johnson, Yoonki Song, Emerson Murphy-Hill, and Robert Bowdidge.Why don’t software developers use static analysis tools to find bugs? InICSE’13, pages 672–681, 2013.
[38] Mona Erfani Joorabchi, Ali Mesbah, and Philippe Kruchten. Real challengesin mobile app development. In ESEM’13, pages 15–24, 2013.
[39] Milan Jovic, Andrea Adamoli, and Matthias Mauswirth. Catch me if you can:Performance bug detection in the wild. In OOPSLA’11, pages 155–170, 2011.
[40] Hammad Khalid, Emad Shihab, Meiyappan Nagappan, and Ahmed E. Hassan.What do mobile app users complain about? Software, IEEE, pages 70–77,2015.
[41] Pavneet Singh Kochhar, Ferdian Thung, Nachiappan Nagappan, Thomas Zim-mermann, and David Lo. Understanding the test automation culture of appdevelopers. In ICST’15, pages 1–10, 2015.
[42] Mario Linares-Vásquez. Enabling testing of android apps. In ACM’15, pages763–765, 2015.
[43] Mario Linares-Vásquez, Bogdan Dit, and Denys Poshyvanyk. An exploratoryanalysis of mobile development issues using stack overflow. In MSR’13, pages93–96, 2013.
[44] Mario Linares-Vásquez, Christopher Vendome, Qi Luo, and Denys Poshywanyk.How developers detect and fix performance bottlenecks in android apps. InICSME’15, pages 352–361, 2015.

40 REFERENCES
[45] Yepang Liu, Chang Xu, and Shing-Chi Cheung. Characterizing and detectingperformance bugs for smartphone applications. In ICSE’14, pages 1013–1024,2014.
[46] Shan Lu, Soyeon Park, Eunsoo Seo, and Yuanyuan Zhou. Learning from mis-takes - a comprehensive study on real world concurrency bug characteristics.In ASPLOS’08, pages 329–339, 2008.
[47] Adrian Nistor, Tian Jiang, and Lin Tan. Discovering, reporting and fixingperformance bugs. In MSR’13, pages 237–246, 2013.
[48] Adrian Nistor and Lenin Ravindranath. Suncat: Helping developers understandand predict performance problems in smartphone applications. In ISSTA’14,pages 282–292, 2014.
[49] Thanaporn Ongkosit and Shingo Takada. Responsiveness analysis tool for an-droid application. In DeMobile’14, pages 1–4, 2014.
[50] Christoffer Rosen and Emad Shibab. What are mobile developers asking about?a large scale study using stack overflow. Empirical Software Engineering, pages1–32, 2015.
[51] Doug Sillars. High Performance Android Apps. O’Reilly Media, 2015.
[52] Spotify. About spotify, 2016. https://press.spotify.com/se/about/, ac-cessed 2016-06-30.
[53] Mirosław Stanek. Androiddevmetrics, 2016. https://github.com/frogermcs/AndroidDevMetrics, accessed 2016-05-09.
[54] Shengqian Yang, Dacong Yan, and Atanas Rountev. Testing for poor respon-siveness in android applications. In MOBS’13, pages 1–6, 2013.
[55] Shahed Zaman, Bram Adams, and Ahmed E. Hassan. A qualitative study onperformance bugs. In MSR’12, pages 199–208, 2012.
41
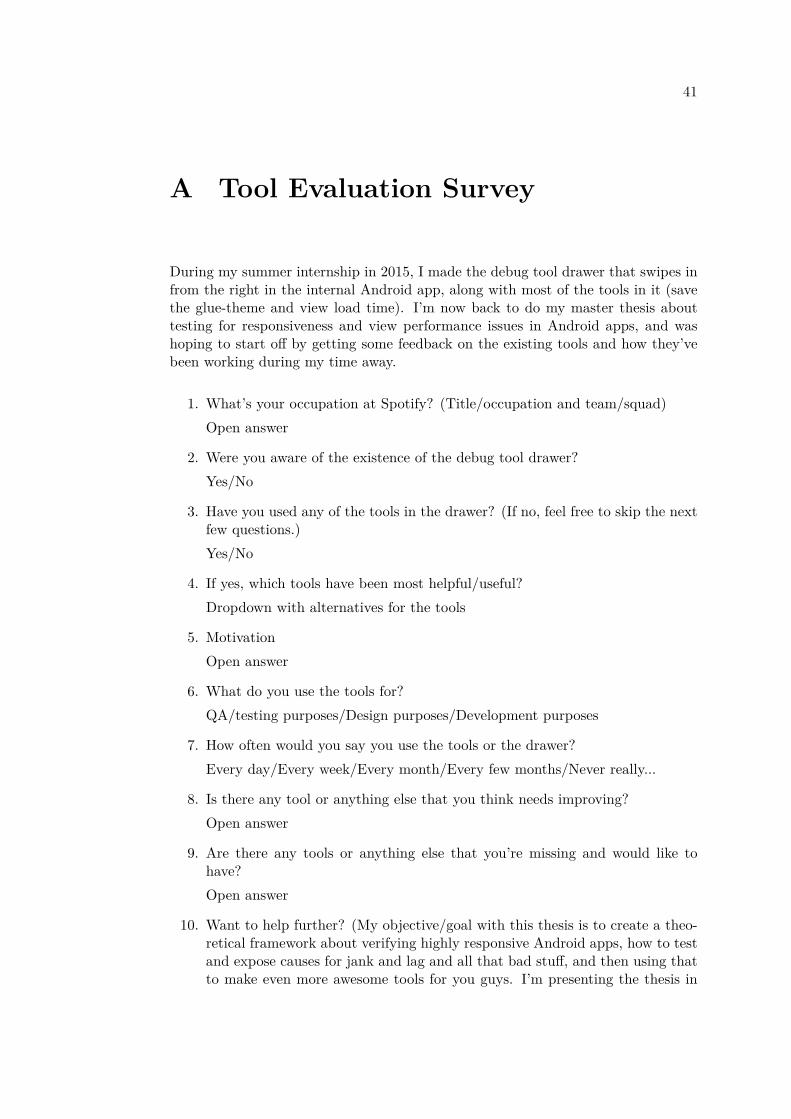
A Tool Evaluation Survey
During my summer internship in 2015, I made the debug tool drawer that swipes infrom the right in the internal Android app, along with most of the tools in it (savethe glue-theme and view load time). I’m now back to do my master thesis abouttesting for responsiveness and view performance issues in Android apps, and washoping to start off by getting some feedback on the existing tools and how they’vebeen working during my time away.
1. What’s your occupation at Spotify? (Title/occupation and team/squad)Open answer
2. Were you aware of the existence of the debug tool drawer?Yes/No
3. Have you used any of the tools in the drawer? (If no, feel free to skip the nextfew questions.)Yes/No
4. If yes, which tools have been most helpful/useful?Dropdown with alternatives for the tools
5. MotivationOpen answer
6. What do you use the tools for?QA/testing purposes/Design purposes/Development purposes
7. How often would you say you use the tools or the drawer?Every day/Every week/Every month/Every few months/Never really...
8. Is there any tool or anything else that you think needs improving?Open answer
9. Are there any tools or anything else that you’re missing and would like tohave?Open answer
10. Want to help further? (My objective/goal with this thesis is to create a theo-retical framework about verifying highly responsive Android apps, how to testand expose causes for jank and lag and all that bad stuff, and then using thatto make even more awesome tools for you guys. I’m presenting the thesis in

42 APPENDIX A. TOOL EVALUATION SURVEY
early June, so there’s plenty of time, for now. If you have any suggestionsor ideas, or would like to help along the way, please leave your username be-low and I’ll contact you. Or feel free to ping/email/schedule me for a fika,@elinnilsson!)Open answer
11. Comments or thoughts or anything else you want to add?Open answer