The transcriptome of syncytia induced by the cyst nematode Heterodera schachtii in Arabidopsis roots
14
The transcriptome of syncytia induced by the cyst nematode Heterodera schachtii in Arabidopsis roots Dagmar Szakasits 1 , Petra Heinen 1 , Krzysztof Wieczorek 1 , Julia Hofmann 1 , Florian Wagner 2,† , David P. Kreil 3 , Peter Sykacek 3 , Florian M. W. Grundler 1 and Holger Bohlmann 1,* 1 Institute of Plant Protection, Department of Applied Plant Sciences and Plant Biotechnology, University of Natural Resources and Applied Life Sciences, Vienna, Austria, 2 RZPD German Resource Center for Genome Research, Berlin, Germany, and 3 WWTF Chair of Bioinformatics, Department of Biotechnology, University of Natural Resources and Applied Life Sciences, Vienna, Austria Received 9 April 2008; revised 10 July 2008; accepted 23 September 2008; published online 9 December 2008. * For correspondence (fax: +43 1 47654 3359; e-mail [email protected]). † Present address: ATLAS Biolabs GmbH, Berlin, Germany. Summary Arabidopsis thaliana is a host for the sugar beet cyst nematode Heterodera schachtii. Juvenile nematodes invade the roots and induce the development of a syncytium, which functions as a feeding site for the nematode. Here, we report on the transcriptome of syncytia induced in the roots of Arabidopsis. Microaspiration was employed to harvest pure syncytium material, which was then used to prepare RNA for hybridization to Affymetrix GeneChips. Initial data analysis showed that the gene expression in syncytia at 5 and 15 days post-infection did not differ greatly, and so both time points were compared together with control roots. Out of a total of 21 138 genes, 18.4% (3893) had a higher expression level and 15.8% (3338) had a lower expression level in syncytia, as compared with control roots, using a multiple- testing corrected false discovery rate of below 5%. A gene ontology (GO) analysis of up- and downregulated genes showed that categories related to high metabolic activity were preferentially upregulated. A principal component analysis was applied to compare the transcriptome of syncytia with the transcriptome of different Arabidopsis organs (obtained by the AtGenExpress project), and with specific root tissues. This analysis revealed that syncytia are transcriptionally clearly different from roots (and all other organs), as well as from other root tissues. Keywords: Arabidopsis, plant pathogen, Heterodera schachtii, syncytium, transcriptome, Affymetrix GeneChip. Introduction Biotrophic plant parasites derive all of their nutrients from living plant tissues. Such a lifestyle has been developed by bacteria, fungi and oomycetes, and animals. All of them face similar problems: to be successful, they have to make inti- mate contact with their host while avoiding a resistance response, and they have to produce specific structures for the uptake of nutrients, such as the haustoria produced by powdery mildews. Plant parasitic nematodes of the family Heteroderidae induce the development of specialized feed- ing structures in the roots of their host plants, which consist of a syncytial fusion of hypertrophied cells. The syncytia are the only nutrient source for these nematodes, and are thus a severe nutrient sink for the host. The nematodes feed from the syncytium through a feeding tube that is produced at the tip of the stylet during each feeding cycle (Davis et al., 2004; Williamson and Kumar, 2006). The nematodes invade the roots with the help of their stylet, assisted by secretions produced from two subventral pharyngeal gland cells that have been shown to contain cell wall degrading enzymes, such as cellulases and pectinases, as well as a putative expansin (Kudla et al., 2005; Smant et al., 1998; Vanholme Re-use of this article is permitted in accordance with the Creative Commons Deed, Attribution 2.5, which does not permit commercial exploitation. ª 2008 The Authors 771 Journal compilation ª 2008 Blackwell Publishing Ltd The Plant Journal (2009) 57, 771–784 doi: 10.1111/j.1365-313X.2008.03727.x
Transcript of The transcriptome of syncytia induced by the cyst nematode Heterodera schachtii in Arabidopsis roots
The transcriptome of syncytia induced by the cyst nematodeHeterodera schachtii in Arabidopsis roots
Dagmar Szakasits1, Petra Heinen1, Krzysztof Wieczorek1, Julia Hofmann1, Florian Wagner2,†, David P. Kreil3, Peter Sykacek3,
Florian M. W. Grundler1 and Holger Bohlmann1,*
1Institute of Plant Protection, Department of Applied Plant Sciences and Plant Biotechnology, University of Natural Resources
and Applied Life Sciences, Vienna, Austria,2RZPD German Resource Center for Genome Research, Berlin, Germany, and3WWTF Chair of Bioinformatics, Department of Biotechnology, University of Natural Resources and Applied Life Sciences,
Vienna, Austria
Received 9 April 2008; revised 10 July 2008; accepted 23 September 2008; published online 9 December 2008.*For correspondence (fax: +43 1 47654 3359; e-mail [email protected]).†Present address: ATLAS Biolabs GmbH, Berlin, Germany.
Summary
Arabidopsis thaliana is a host for the sugar beet cyst nematode Heterodera schachtii. Juvenile nematodes
invade the roots and induce the development of a syncytium, which functions as a feeding site for the
nematode. Here, we report on the transcriptome of syncytia induced in the roots of Arabidopsis.
Microaspiration was employed to harvest pure syncytium material, which was then used to prepare RNA
for hybridization to Affymetrix GeneChips. Initial data analysis showed that the gene expression in
syncytia at 5 and 15 days post-infection did not differ greatly, and so both time points were compared
together with control roots. Out of a total of 21 138 genes, 18.4% (3893) had a higher expression level and
15.8% (3338) had a lower expression level in syncytia, as compared with control roots, using a multiple-
testing corrected false discovery rate of below 5%. A gene ontology (GO) analysis of up- and
downregulated genes showed that categories related to high metabolic activity were preferentially
upregulated. A principal component analysis was applied to compare the transcriptome of syncytia with
the transcriptome of different Arabidopsis organs (obtained by the AtGenExpress project), and with
specific root tissues. This analysis revealed that syncytia are transcriptionally clearly different from roots
(and all other organs), as well as from other root tissues.
Keywords: Arabidopsis, plant pathogen, Heterodera schachtii, syncytium, transcriptome, Affymetrix
GeneChip.
Introduction
Biotrophic plant parasites derive all of their nutrients from
living plant tissues. Such a lifestyle has been developed by
bacteria, fungi and oomycetes, and animals. All of them face
similar problems: to be successful, they have to make inti-
mate contact with their host while avoiding a resistance
response, and they have to produce specific structures for
the uptake of nutrients, such as the haustoria produced by
powdery mildews. Plant parasitic nematodes of the family
Heteroderidae induce the development of specialized feed-
ing structures in the roots of their host plants, which consist
of a syncytial fusion of hypertrophied cells. The syncytia are
the only nutrient source for these nematodes, and are thus a
severe nutrient sink for the host. The nematodes feed from
the syncytium through a feeding tube that is produced at the
tip of the stylet during each feeding cycle (Davis et al., 2004;
Williamson and Kumar, 2006). The nematodes invade the
roots with the help of their stylet, assisted by secretions
produced from two subventral pharyngeal gland cells that
have been shown to contain cell wall degrading enzymes,
such as cellulases and pectinases, as well as a putative
expansin (Kudla et al., 2005; Smant et al., 1998; VanholmeRe-use of this article is permitted in accordance with the Creative Commons
Deed, Attribution 2.5, which does not permit commercial exploitation.
ª 2008 The Authors 771Journal compilation ª 2008 Blackwell Publishing Ltd
The Plant Journal (2009) 57, 771–784 doi: 10.1111/j.1365-313X.2008.03727.x

et al., 2004). Having reached the central cylinder, the nem-
atode selects a single cell that is carefully pierced by the
stylet. In Arabidopsis, the initial syncytial cells are preferably
procambium or pericycle cells within the central cylinder
(Golinowski et al., 1996; Sobczak et al., 1997). From this cell
the development of the syncytium is initiated through
secretions of the nematode, and by a coordinated expres-
sion of plant genes. Such plant genes include, for instance,
expansins and cellulases, which are important for the deg-
radation of cell walls to incorporate new cells into the
growing syncytium (Goellner et al., 2001; Wieczorek et al.,
2006, 2008). Cells incorporated into the syncytium undergo
drastic changes in structure and activity. The central vacuole
is fragmented into many smaller ones and the cells become
metabolically active, as indicated by the dense granular
cytoplasm, large numbers of mitochondria, ribosomes, and
a proliferation of the endoplasmic reticulum (Golinowski
et al., 1996; Sobczak et al., 1997). To cope with this high
metabolic acivity, the nuclei and nucleoli are enlarged,
and contain endoreduplicated DNA (Niebel et al., 1996).
Although the syncytium is a plant-derived structure, it is
also dependent on the continuous activity of the nematode,
because death or artificial removal of the nematode leads to
a degradation of the syncytium. How exactly the nematode
induces the development of the syncytium is currently
unknown, although a few proteins that are produced by the
dorsal pharyngeal gland cell that might be involved in this
activity have been identified (Jaubert et al., 2002; Vanholme
et al., 2004).
The structurally visible drastic changes in cell morphology
imply an underlying global change in gene expression.
Indeed, a number of genes have been identified that are
particularly induced in syncytia or in giant cells, using a
variety of methods such as differential display and promoter
tagging, as reviewed by Gheysen and Fenoll (2002). During
recent years the methodology has shifted towards micro-
arrays and GeneChips, which allow a global view on the
changes in gene expression in feeding sites. As a first
approach, whole roots or dissected root segments of
Arabidopsis roots infected with Heterodera schachtii (Put-
hoff et al., 2003) and soybean roots infected with Heterodera
glycines (Alkharouf et al., 2006; Ithal et al., 2007a; Klink
et al., 2007a) were used. Recently, laser capture microdis-
section and Affymetrix GeneChips have been used to study
the transcriptome of syncytia induced in soybean roots by
H. glycines (Ithal et al., 2007b; Klink et al., 2007b).
The rather wide host range of the sugarbeet cyst nema-
tode H. schachtii has been exploited to use the interaction
with Arabidopsis thaliana roots as a model system. The
translucent roots growing on artificial media have made it
possible to study the behavior of this and other nematode
species inside the root (Wyss and Grundler, 1992).
H. schachtii can complete its whole life cycle on Arabidopsis
plants in vitro within 6 weeks (Sijmons et al., 1991). Now,
the availability of microarrays makes it possible to study the
transcriptome of feeding sites induced in Arabidopsis roots.
Puthoff et al. (2003) used the first-generation Affymetrix
Arabidopsis GeneChip, which covers �30% of the genome.
They compared whole roots infected with H. schachtii or
H. glycines at 3 days post-infection (dpi) with control roots
(Puthoff et al., 2003), and identified 128 and 12 genes,
respectively, with altered steady-state mRNA levels after
nematode infection.
The second-generation ATH1 Arabidopsis GeneChip,
which contains probes covering �75% of the genome, was
used by Hammes et al. to study Meloidogyne incognita galls
on Arabidopsis roots, but only the expression of 1400 genes
coding for transport proteins was reported (Hammes et al.,
2005). Similarly, Jammes et al. studied M. incognita galls
using the CATMA microarrays, which contain probes for
22 089 genes (Jammes et al., 2005).
Previous reports concerning studies of gene expression
in Arabidopsis feeding sites were hampered by the fact
that the material used contained not only material from the
feeding cells, but also included surrounding tissue. It is
thus difficult to differentiate between gene expression in
feeding cells and in the surrounding tissue. In studies that
used the whole-root system, these expression patterns
were even overlain with systemic expression from else-
where in the root system. To avoid these problems, our
approach has been to isolate pure syncytium material by
microaspiration, thereby enabling a transcriptome analysis
of syncytia alone. In this way, we were able to monitor and
analyze the expression of 21 138 genes at different time
points during the interaction of H. schachtii with Arabid-
opsis roots. Our results reveal the transcriptome of syncy-
tia, and show that they are clearly different from roots and
all other organs.
Results
Syncytia that develop inside the roots can be microaspirated
to obtain pure syncytium material, without contaminating
root tissues (Juergensen et al., 2003). We have used this
technique to obtain material for a transcriptome analysis of
syncytia at 5 and 15 dpi.
The development of the syncytium starts from an initial
syncytial cell in the central cylinder of the root, selected by
the nematode (Golinowski et al., 1996; Wyss and Grundler,
1992). Therefore, the preferred control would have been
material from such cells before induction. This was, how-
ever, technically impossible. We have therefore used root
segments from 12-day-old plants (0 dpi), corresponding to
the elongation zone, and have excluded root tips and
secondary root primordia.
Total RNA was isolated, amplified, and hybridized to
Affymetrix ATH1 GeneChips (as described in detail in
Experimental procedures).
772 Dagmar Szakasits et al.
ª 2008 The AuthorsJournal compilation ª 2008 Blackwell Publishing Ltd, The Plant Journal, (2009), 57, 771–784
Our initial strategy was to analyze the development of the
syncytium over time. However, in line with analysis results
showing that only a few transcripts were significantly
different between syncytia at 5 and 15 dpi, instead of
treating the data as a time series, we used a linear model
of effects, with one contrast giving the differences between
both (combined) syncytia tissues and the controls, and
another contrast examining the remaining differences
between syncytia at 5 and 15 dpi.
Broad trends in gene expression, in comparison with
previously published data sets, were visualized using
principal component analysis (PCA).
In an analysis of differential expression, the transcriptome
of syncytia was observed to be very different from the
control root samples. Table S1 presents the complete
results from comparing the syncytium samples (at both 5
and 15 dpi) with controls. A total of 7231 genes (34.2%) were
differentially expressed for a false discovery rate cut-off of
q < 5%, after correction for the multiple testing of 21 138
genes. Compared with the control, in syncytia 18.4% (3893)
of all genes had a higher expression level, and 15.8% (3338)
had a lower expression level. The average expression levels,
and differences between syncytia and controls, for the 100
most significantly differentially expressed genes, are shown
in Figure S1.
Upregulated genes
Table S2 takes an alternative view, showing the list of 100
genes that have the highest increase in expression com-
pared with the controls. Among these upregulated genes,
several genes encode proteins that are probably involved in
the degradation of cell walls, a process that is important for
the expansion of the syncytium: pectate lyase family pro-
teins At3g27400 and At4g24780, as well as expansins AT-
EXPA6 (At2g28950) and ATEXPA1 (At1g69530) (Wieczorek
et al., 2006). Several other genes code for chloroplast pro-
teins such as glyceraldehyde 3-phosphate dehydrogenase A
(At3g26650), cytochrome B6-F complex iron-sulfur subunit
(At4g03280) and several chlorophyll a–b binding proteins
(At3g54890, At5g54270, At2g40100, At4g10340, At1g15820
and At5g01530).
Downregulated genes
On the other hand, if we look at the list of genes that showed
a strong decrease in expression level, we find two prominent
groups of genes (Table S3). One strongly over-represented
group comprises genes coding for peroxidases. Among the
3338 downregulated genes were 35 peroxidases, repre-
senting an odds ratio of 4.6 (95% confidence interval, CI,
2.8–7.3), P < 10)9, Fisher’s exact test, compared with the
number of peroxidase genes assessed on the chip. The
effect was even more pronounced when we focussed on
the 100 differentially expressed genes with the strongest
decrease in expression. These include 14 peroxidases,
corresponding to an odds ratio of 47 (CI 24–89), P < 10)15. In
contrast, only one gene coding for a (chloroplast) peroxi-
dase was found among the 100 genes with the strongest
significant increase in expression (Table S2), a number
compatible with the representation of peroxidases on the
chip. The second prominent group of genes over-repre-
sented are those that code for major intrinsic proteins
(MIPs), which include aquaporins (Wallace and Roberts,
2004). Arabidopsis has 35 MIP genes, and nine of them were
among the list of 100 genes with a strong decrease in
expression level, corresponding to an odds ratio of 73 (CI 29–
164), P < 10)12. Contingency tables for all tests are provided
in the Table S4(a,b).
Highly expressed genes
Genes can also be viewed according to their expression level
in the syncytium (Table S5). The most strongly expressed
genes typically had only slightly higher expression levels in
the syncytia, compared with the control roots. As we go
down the list, more and more genes show no significant
differences. The genes most strongly expressed included
those coding for proteins involved in primary metabolism,
such as ribosomal proteins.
Differences between 5- and 15-day-old syncytia
In a comparison of 5- and 15-day-old syncytia, only 22 genes
were differentially expressed with a false discovery rate cut-
off of q < 5%, after correction for multiple testing. Of these,
19 genes were more highly expressed in 15-dpi syncytia, as
compared with 5-dpi syncytia, whereas only three genes
were more highly expressed in 5-dpi syncytia than in 15-dpi
syncytia (Table S6). Results for all genes are shown in
Table S7, and the high degree of similarity of 5- and 15-dpi
samples is also reflected in MA plots (Figure S2). Whereas
many of the differentially expressed genes have no known
function, two of the genes that were more highly expressed
in 15-dpi syncytia code for phytosulfokines (Yang et al.,
2001).
Validation of GeneChip data
We have already published a detailed expression analysis of
expansins (Wieczorek et al., 2006) and endo-1,4-b-glucan-
ases (Wieczorek et al., 2008), in relation to the formation of
syncytia induced in Arabidopsis roots by H. schachtii. In
these studies, the differential expression of 29 and 25 genes,
respectively, was validated using in situ RT-PCR, RT-PCR,
and promoter:gus lines. Furthermore, several genes
involved in starch metabolism in syncytia have also been
validated recently (Hofmann et al., 2008). Therefore, we
The transcriptome of syncytia 773
ª 2008 The AuthorsJournal compilation ª 2008 Blackwell Publishing Ltd, The Plant Journal, (2009), 57, 771–784
have only selected three additional genes for further analy-
sis using qPCR and in situ RT-PCR in the present study:
At3g63140 codes for a putative mRNA binding protein (84-
fold upregulated, significance rank 40), At5g64080 codes for
a lipid transfer protein (30-fold upregulated, significance
rank 1159), and At1g10010 codes for an amino acid perme-
ase (AAP8, 23-fold upregulated, significance rank 259).
All three genes showed a strong upregulation in syncytia
as compared with roots. Of these, only expression of
At1g10010 was detectable in uninfected control root seg-
ments by real-time PCR, but transcripts for all three genes
were detected in syncytia (Table 1). As no expression was
detected for At3g63140 and At5g64080 in control root seg-
ments, it was not possible to formally calculate a fold
change value. The in situ RT-PCR revealed that all genes
showed a strong expression in syncytia. At3g63140 and
At5g64080, but not At1g10010, were found to be slightly
expressed in the surrounding tissue. For the last two genes,
specific staining was also detected in the phloem of unin-
fected roots, whereas in control reactions without poly-
merase only non-specific background staining was found
(Figure 1a–i).
Genes involved in syncytium formation and
maintenance
In analogy with the procedure described by Jammes et al.
(2005), we explored the regulation of ‘biological pro-
cesses’ and ‘molecular functions’, and their distribution
across ‘cellular components’, according to the gene
ontology classification (GO; http://www.geneontolo-
gy.org), by comparing their representations in signifi-
cantly up- and downregulated genes. To this end, for
each of the 4278 GO categories used, we compared the
prevalence in the 3885 GO annotated significantly upreg-
ulated genes, with the prevalence in the same number of
downregulated genes (Fisher’s exact test with Bonferroni
correction). Conversely, its prevalence in the 3331 GO
annotated significantly downregulated genes was com-
pared with its prevalence in the same number of upreg-
ulated genes (full results in Table S8a,b). Categories of
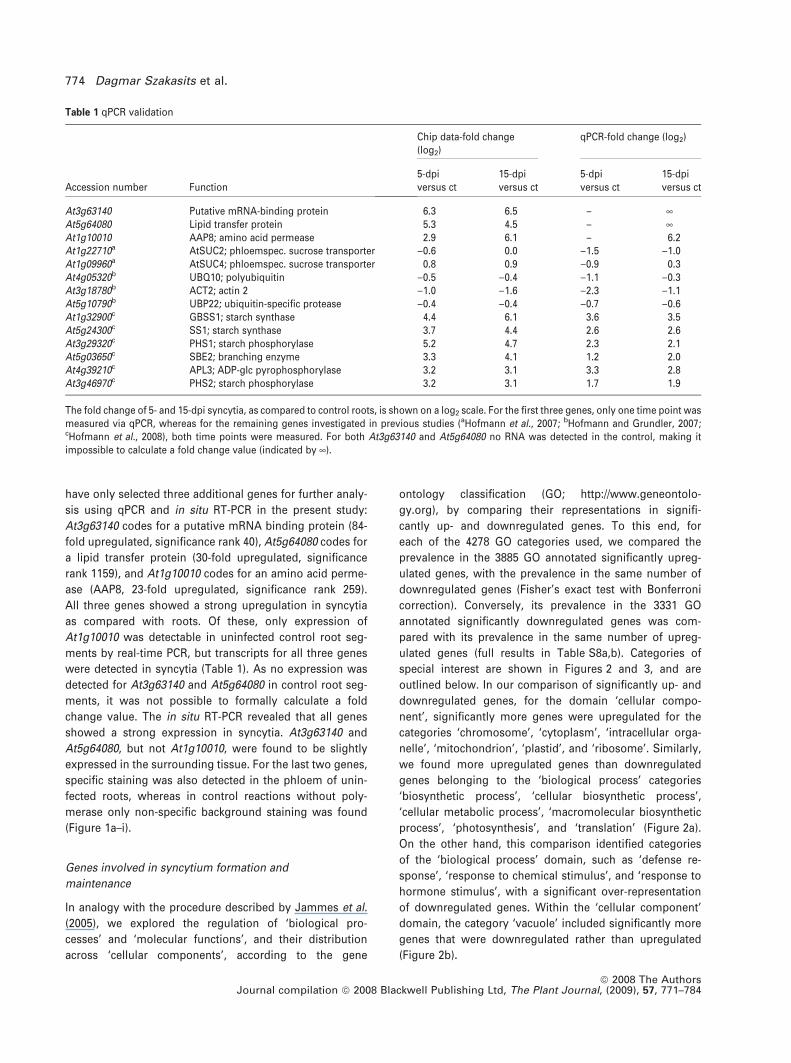
special interest are shown in Figures 2 and 3, and are
outlined below. In our comparison of significantly up- and
downregulated genes, for the domain ‘cellular compo-
nent’, significantly more genes were upregulated for the
categories ‘chromosome’, ‘cytoplasm’, ‘intracellular orga-
nelle’, ‘mitochondrion’, ‘plastid’, and ‘ribosome’. Similarly,
we found more upregulated genes than downregulated
genes belonging to the ‘biological process’ categories
‘biosynthetic process’, ‘cellular biosynthetic process’,
‘cellular metabolic process’, ‘macromolecular biosynthetic
process’, ‘photosynthesis’, and ‘translation’ (Figure 2a).
On the other hand, this comparison identified categories
of the ‘biological process’ domain, such as ‘defense re-
sponse’, ‘response to chemical stimulus’, and ‘response to
hormone stimulus’, with a significant over-representation
of downregulated genes. Within the ‘cellular component’
domain, the category ‘vacuole’ included significantly more
genes that were downregulated rather than upregulated
(Figure 2b).
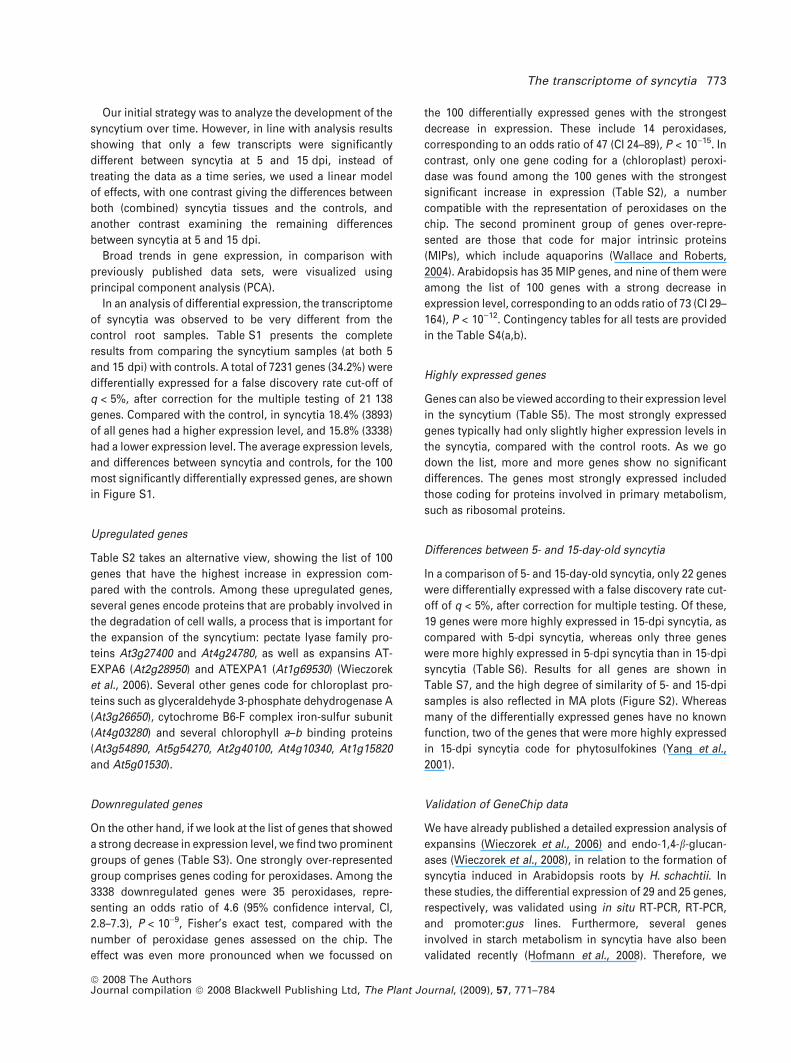
Table 1 qPCR validation
Accession number Function
Chip data-fold change(log2)
qPCR-fold change (log2)
5-dpiversus ct
15-dpiversus ct
5-dpiversus ct
15-dpiversus ct
At3g63140 Putative mRNA-binding protein 6.3 6.5 – ¥At5g64080 Lipid transfer protein 5.3 4.5 – ¥At1g10010 AAP8; amino acid permease 2.9 6.1 – 6.2At1g22710a AtSUC2; phloemspec. sucrose transporter )0.6 0.0 )1.5 )1.0At1g09960a AtSUC4; phloemspec. sucrose transporter 0.8 0.9 )0.9 0.3At4g05320b UBQ10; polyubiquitin )0.5 )0.4 )1.1 )0.3At3g18780b ACT2; actin 2 )1.0 )1.6 )2.3 )1.1At5g10790b UBP22; ubiquitin-specific protease )0.4 )0.4 )0.7 )0.6At1g32900c GBSS1; starch synthase 4.4 6.1 3.6 3.5At5g24300c SS1; starch synthase 3.7 4.4 2.6 2.6At3g29320c PHS1; starch phosphorylase 5.2 4.7 2.3 2.1At5g03650c SBE2; branching enzyme 3.3 4.1 1.2 2.0At4g39210c APL3; ADP-glc pyrophosphorylase 3.2 3.1 3.3 2.8At3g46970c PHS2; starch phosphorylase 3.2 3.1 1.7 1.9
The fold change of 5- and 15-dpi syncytia, as compared to control roots, is shown on a log2 scale. For the first three genes, only one time point wasmeasured via qPCR, whereas for the remaining genes investigated in previous studies (aHofmann et al., 2007; bHofmann and Grundler, 2007;cHofmann et al., 2008), both time points were measured. For both At3g63140 and At5g64080 no RNA was detected in the control, making itimpossible to calculate a fold change value (indicated by ¥).
774 Dagmar Szakasits et al.
ª 2008 The AuthorsJournal compilation ª 2008 Blackwell Publishing Ltd, The Plant Journal, (2009), 57, 771–784

The transcriptome of syncytia is distinct from that
of roots or other organs
We analyzed the tissue-specific expression of the one
hundred most strongly induced genes in Genevestigator
(Zimmermann et al., 2004) (Table S9), and noted that some
strongly induced genes are not root-specific, but are
instead expressed in seeds (such as Pdf2.1) or pollen
(MIOX4 and MIOX5). This is also reflected in a comparison
of up- and downregulated genes in the categories ‘repro-
(a) (b) (c)
(d) (e) (f)
(g) (h) (i)
Figure 1. In situ RT-PCR analysis of three induced genes.
The expression of At3g63140, At5g64080 and At1g10010 was analyzed on cross sections of infected (15-dpi syncytia) and uninfected control roots of Arabidopsis
(scale bar = 50 lm).
(a) Purple stained transcripts of At3g63140 are visible within the syncytium (S), and only visible to a small extent in the surrounding tissue outside of the vascular cylinder.
(b) A control reaction for (a) on a syncytium performed without Taq polymerase shows neither specific staining in the infected part of the root (S) nor staining in any other
root cells.
(c) Uninfected root sections show no staining of transcripts.
(d) Transcripts of At5g64080 are mainly stained within the syncytium (S), with some staining in small cells adjacent to the syncytium.
(e) A control reaction for (d) without Taq polymerase on another syncytium shows no specific (purple) staining.
(f) In an uninfected root there is some typical transcript staining visible in the phloem.
(g) For At1g10010-specific transcripts, an intensive staining is restricted to cells within the syncytium (S) only.
(h) In a control reaction for (g) excluding Taq polymerase the whole cross-section through a syncytium does not show any specific staining.
(i) In an uninfected root staining of At1g10010 is restricted to phloem cells.
The transcriptome of syncytia 775
ª 2008 The AuthorsJournal compilation ª 2008 Blackwell Publishing Ltd, The Plant Journal, (2009), 57, 771–784
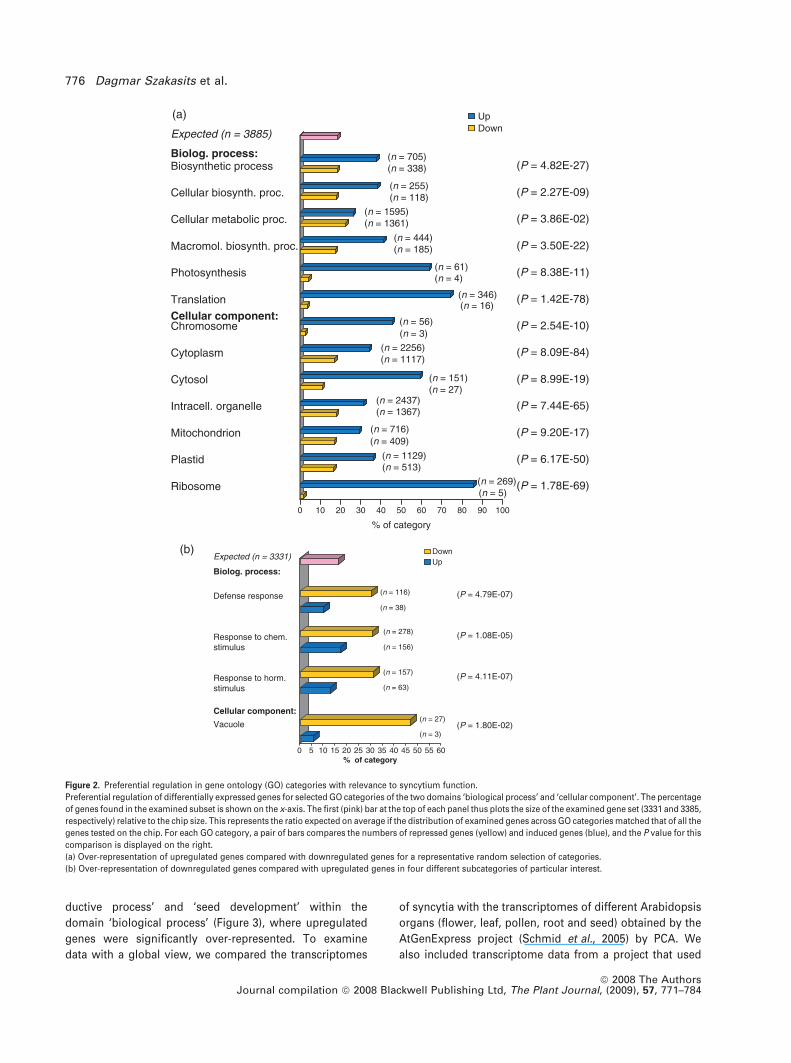
ductive process’ and ‘seed development’ within the
domain ‘biological process’ (Figure 3), where upregulated
genes were significantly over-represented. To examine
data with a global view, we compared the transcriptomes
of syncytia with the transcriptomes of different Arabidopsis
organs (flower, leaf, pollen, root and seed) obtained by the
AtGenExpress project (Schmid et al., 2005) by PCA. We
also included transcriptome data from a project that used
Expected (n = 3885)
Biolog. process:
Cytoplasm
(n = 705)
0 10 20 30 40 50 60 70 80 90 100
Biosynthetic process
Cellular biosynth. proc.
Cellular metabolic proc.
Macromol. biosynth. proc.
Photosynthesis
Translation
Chromosome
Cytosol
Intracell. organelle
Mitochondrion
Plastid
Ribosome
Cellular component:
(n = 338)
(n = 255)(n = 118)
(n = 1595)(n = 1361)
(n = 444)(n = 185)
(n = 61)(n = 4)
(n = 16)(n = 346)
(n = 56)(n = 3)
(n = 2256)(n = 1117)
(n = 151)(n = 27)
(n = 2437)(n = 1367)
(n = 716)(n = 409)
(n = 1129)(n = 513)
(n = 269)(n = 5)
(P = 4.82E-27)
(P = 2.27E-09)
(P = 3.86E-02)
(P = 3.50E-22)
(P = 8.38E-11)
(P = 1.42E-78)
(P = 2.54E-10)
(P = 8.09E-84)
(P = 8.99E-19)
(P = 7.44E-65)
(P = 9.20E-17)
(P = 6.17E-50)
(P = 1.78E-69)
UpDown
% of category
0 5 10 15 20 25 30 35 40 45 50 55 60% of category
(P = 4.79E-07)
(P = 1.08E-05)
(P = 4.11E-07)
(P = 1.80E-02)
(n = 116)
(n = 38)
(n = 278)
(n = 156)
(n = 157)
(n = 63)
(n = 27)
(n = 3)
Expected (n = 3331)
Defense response
(b)
(a)
Response to chem.stimulus
Response to horm.stimulus
Vacuole
Biolog. process:
Cellular component:
DownUp
Figure 2. Preferential regulation in gene ontology (GO) categories with relevance to syncytium function.
Preferential regulation of differentially expressed genes for selected GO categories of the two domains ‘biological process’ and ‘cellular component’. The percentage
of genes found in the examined subset is shown on the x-axis. The first (pink) bar at the top of each panel thus plots the size of the examined gene set (3331 and 3385,
respectively) relative to the chip size. This represents the ratio expected on average if the distribution of examined genes across GO categories matched that of all the
genes tested on the chip. For each GO category, a pair of bars compares the numbers of repressed genes (yellow) and induced genes (blue), and the P value for this
comparison is displayed on the right.
(a) Over-representation of upregulated genes compared with downregulated genes for a representative random selection of categories.
(b) Over-representation of downregulated genes compared with upregulated genes in four different subcategories of particular interest.
776 Dagmar Szakasits et al.
ª 2008 The AuthorsJournal compilation ª 2008 Blackwell Publishing Ltd, The Plant Journal, (2009), 57, 771–784
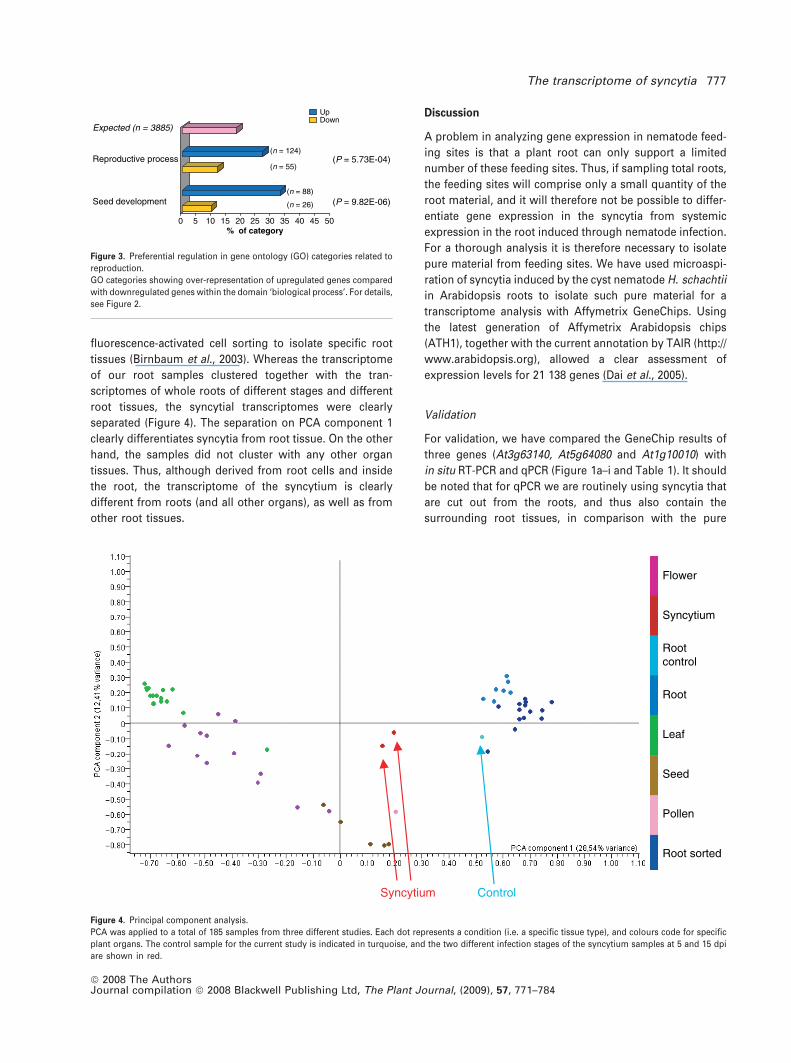
fluorescence-activated cell sorting to isolate specific root
tissues (Birnbaum et al., 2003). Whereas the transcriptome
of our root samples clustered together with the tran-
scriptomes of whole roots of different stages and different
root tissues, the syncytial transcriptomes were clearly
separated (Figure 4). The separation on PCA component 1
clearly differentiates syncytia from root tissue. On the other
hand, the samples did not cluster with any other organ
tissues. Thus, although derived from root cells and inside
the root, the transcriptome of the syncytium is clearly
different from roots (and all other organs), as well as from
other root tissues.
Discussion
A problem in analyzing gene expression in nematode feed-
ing sites is that a plant root can only support a limited
number of these feeding sites. Thus, if sampling total roots,
the feeding sites will comprise only a small quantity of the
root material, and it will therefore not be possible to differ-
entiate gene expression in the syncytia from systemic
expression in the root induced through nematode infection.
For a thorough analysis it is therefore necessary to isolate
pure material from feeding sites. We have used microaspi-
ration of syncytia induced by the cyst nematode H. schachtii
in Arabidopsis roots to isolate such pure material for a
transcriptome analysis with Affymetrix GeneChips. Using
the latest generation of Affymetrix Arabidopsis chips
(ATH1), together with the current annotation by TAIR (http://
www.arabidopsis.org), allowed a clear assessment of
expression levels for 21 138 genes (Dai et al., 2005).
Validation
For validation, we have compared the GeneChip results of
three genes (At3g63140, At5g64080 and At1g10010) with
in situ RT-PCR and qPCR (Figure 1a–i and Table 1). It should
be noted that for qPCR we are routinely using syncytia that
are cut out from the roots, and thus also contain the
surrounding root tissues, in comparison with the pure
Flower
Syncytium
Rootcontrol
Root
Leaf
Seed
Pollen
Root sorted
Syncytium Control
Figure 4. Principal component analysis.
PCA was applied to a total of 185 samples from three different studies. Each dot represents a condition (i.e. a specific tissue type), and colours code for specific
plant organs. The control sample for the current study is indicated in turquoise, and the two different infection stages of the syncytium samples at 5 and 15 dpi
are shown in red.
0 5 10 15 20 25 30 35 40 45 50% of category
Expected (n = 3885)
Reproductive process
Seed development
UpDown
(n = 124)
(n = 55)
(n = 88)
(n = 26)
(P = 5.73E-04)
(P = 9.82E-06)
Figure 3. Preferential regulation in gene ontology (GO) categories related to
reproduction.
GO categories showing over-representation of upregulated genes compared
with downregulated genes within the domain ‘biological process’. For details,
see Figure 2.
The transcriptome of syncytia 777
ª 2008 The AuthorsJournal compilation ª 2008 Blackwell Publishing Ltd, The Plant Journal, (2009), 57, 771–784
syncytium material that was obtained through microaspi-
ration for GeneChip analysis. Expression levels obtained by
these methods may therefore show quantitative differences,
but the time needed to obtain material through microaspi-
ration precludes their use as a routine method. In addition to
the three genes validated in this paper, we have recently
published a comprehensive analysis of expansin gene
expression in syncytia, in which we have also validated this
GeneChip dataset with in situ RT-PCR, promoter:gus lines,
and semi-quantitative RT-PCR (Wieczorek et al., 2006).
Furthermore, the expression of endo-1,4-b-glucanases
observed in this data set has been validated using in situ
RT-PCR and qPCR (Wieczorek et al., 2008). In addition, the
expression of genes involved in sugar transport and starch
metabolism has also been validated (Hofmann et al., 2007,
2008). In all cases examined, the results of the GeneChip
analysis were found to be reliable. For reference, we have
also included the published qPCR values for these other
genes in Table 1.
Cell wall degradation and synthesis in syncytia
Starting from a single initial cell, the syncytium expands by
incorporating surrounding cells. The cell walls between these
cells are partly degraded. It is known that nematodes produce
a range of cell wall degrading enzymes in their gland cells
(Vanholme et al., 2004, 2006), which can be secreted through
the stylet, but to what extent these enzymes might be in-
volved in the cell wall degradation within the syncytium is not
yet known. On the other hand, it is known that plant-derived
genes for cell wall degrading enzymes (Goellner et al., 2001),
as well as expansin genes (Wieczorek et al., 2006), are up-
regulated in syncytia. Analysis of the syncytial transcriptome
showed that several expansin genes were specifically up-
regulated (Wieczorek et al., 2006). Genes for putative cell wall
degrading enzymes were also upregulated, and some of
themwere among themost strongly induced (Table S2), such
as those coding for pectate lyases and for a b-glucanase
(Wieczorek et al., 2008). Thus, it is possible that the degra-
dation of cell walls within the syncytium is solely achieved
through endogenous plant proteins, and that the nematode-
specific enzymes are only responsible for cell wall degrada-
tion and loosening during the passage of the nematodes
through the plant root towards the central cylinder.
The formation of syncytia is, on the one hand, accompa-
nied by a degradation of cell walls; on the other hand, cell
wall synthesis is also needed, for instance, for producing
cell wall ingrowths (Jones and Northcote, 1972; Sobczak
et al., 1997) that are commonly found close to the xylem,
and for the thickening of the outer cell wall of the syncytium
(Golinowski et al., 1996). Cell wall ingrowths are also
characteristic for transfer cells, which are thought to
facilitate solute transport at the interface between the
apoplast and the symplast (Offler et al., 2002). In this
regard it is also noteworthy that genes coding for myo-
inositol oxygenase (MIOX) (Kanter et al., 2005) were
strongly expressed in syncytia. Three of the four Arabidop-
sis MIOX genes are represented on the GeneChip. Of these,
MIOX2 was approximately eightfold upregulated, and
MIOX4 and MIOX5 were among the most strongly upreg-
ulated genes in syncytia (Table S2). The function of these
genes in general is not totally clear, but MIOX4 and MIOX5
are otherwise highly expressed in pollen (Table S9). MIOX
genes are probably involved in the production of UDP-
glucuronic acid, an important precursor for several nucle-
otide sugars used in cell wall biosynthesis, but there are
also indications from overexpression studies that they
might be involved in the synthesis of ascorbate (Lorence
et al., 2004). UDP-glucuronic acid can also be produced
through a second pathway, which uses UDP-glucose dehy-
drogenase, but the corresponding genes are expressed at
the same level in syncytia and in control roots. Thus, the
MIOX genes seem to play an important role for the function
of syncytia. This issue is currently under further investiga-
tion in our laboratory.
Metabolic activity
For the host plant, the syncytia are sinks of nutrients. Other
particularly important sinks are seeds and pollen. It is
therefore interesting that genes of the GO categories ‘seed
development’ and ‘reproductive process’ were preferentially
upregulated in syncytia (Figure 3; Table S8a). Seeds and
pollen are also characterized by high metabolic activity, with
an overexpression of components of protein synthesis and
metabolism observed in seeds and pollen (Schmid et al.,
2005). The same holds true for syncytia, which are also
characterized by high metabolic activity. An examination of
gene regulation for the category ‘ribosome’ of the GO
domain ‘cellular component’ found a strong over-represen-
tation of upregulated genes (Figure 2a; Table S8a). High-
lighting the biological significance of this observation, many
ribosomal genes belong to the most strongly expressed
genes (Table S5). Moreover, genes of the GO category
‘translation’ were preferentially upregulated, indicating a
strong increase of protein biosynthesis. The high metabolic
activity of syncytia was also reflected in the preferential
upregulation of genes within the categories ‘biosynthetic
process’, ‘cellular biosynthetic process’, ‘cellular metabolic
process’, and ‘macromolecule biosynthetic process’ (Fig-
ure 2a). Although these are clear trends, many other GO
categories and gene families have both up- and downregu-
lated members. The expansin gene family is a nice example
of this (Wieczorek et al., 2006). High metabolic activity with
similar numbers of upregulated and downregulated genes
has also been observed for galls induced by the root-knot
nematode M. incognita in Arabidopsis roots (Jammes et al.,
2005).
778 Dagmar Szakasits et al.
ª 2008 The AuthorsJournal compilation ª 2008 Blackwell Publishing Ltd, The Plant Journal, (2009), 57, 771–784
Transport of nutrients into syncytia
Syncytia are the only source of nutrients for the cyst nem-
atodes throughout their life, and are therefore a severe
nutrient sink for the plant. Up to recently, it was thought
that syncytia are symplastically isolated, and that sucrose is
taken up by the sucrose transporter Suc2 (Juergensen et al.,
2003). Analysis of the transcriptome data presented here
gave no indication that the Suc2 gene was induced in syn-
cytia. Suc2 was expressed at low levels in both syncytia and
control roots. This is in agreement with recent data imply-
ing the existence of plasmodesmata between syncytia and
the phloem (Hofmann and Grundler, 2006; Hofmann et al.,
2007; Hoth et al., 2005). Similarly, many other sugar trans-
porters and sugar-metabolizing enzymes were not strongly
induced in our experiment (J. Hofmann, P. Hess, D. Szaka-
sits, A. Blochl, A. van Bell, H. Bohlmann and F. Grundler,
unpublished data).
Contrary to the moderate regulation of sugar transporters,
we found a strong upregulation of an amino acid transporter
(AAP6; Table S2). A second amino acid transporter of the
same group (AAP8) was also upregulated in syncytia, and
was among the few genes that were significantly more
strongly expressed in 15-dpi syncytia than in 5-dpi syncytia
(Table S6). These transporters are proton symporters, and
seem to be especially needed for the transport of acidic
amino acids (Okumoto et al., 2002). It is not yet known if
syncytia have a specific demand for acidic amino acids, or if
these transporters might have a different function. The gene
coding for AAP6 has been found to be only slightly
upregulated in gall segments of Arabidopsis roots infected
with M. incognita (Hammes et al., 2005). Whether this is
caused by a dilution effect of the giant cells with the
surrounding material, or if there are fundamental differ-
ences between the amino acid transport into syncytia and
giant cells, remains an open question. However, it once
again highlights the importance of using pure material for a
transcriptome analysis of nematode feeding sites.
Suppression of defense responses
Pathogens in general face the problem of coping with
defense reactions of their hosts. Bacteria, for instance, pro-
duce a variety of effectors for this purpose (Debroy et al.,
2004; Jamir et al., 2004). It has recently been shown that
these can be delivered through a kind of molecular injection
needle, the type-III secretion system, into the host cells
(Galan and Wolf-Watz, 2006). By analogy, it can be expected
that nematodes use their stylet to deliver effectors into
syncytia. A range of different proteins that might act as such
has been purified from nematodes in vitro (Vanholme et al.,
2004), but in most cases there is no clue yet as to their
possible functions. Microneedles have been used to dem-
onstrate that a mechanical stimulus comparable with the
piercing of the cell wall by a nematode stylet induces
defense reactions in plant cells (Gus-Mayer et al., 1998).
However, the transcriptome analysis of the syncytia pre-
sented in this paper shows that defense gene expression is
repressed (Figure 2b), similar to the results obtained for
galls induced by the root-knot nematode M. incognita
in Arabidopsis roots (Jammes et al., 2005). Whether the
peroxidase genes, which were among the most strongly
downregulated genes (Table S3), are also involved in
defense responses, remains an open question.
An exception is the expression of a group of plant
defensin genes (for a review see Thomma et al., 2002).
Pdf2.2 and Pdf2.3 were strongly expressed both in control
root segments and in syncytia, and Pdf2.1 was among the
most strongly upregulated genes in syncytia (Table S2). It is
not known whether these peptides are taken up by the
nematode, although their small size indicates that this might
be the case (Bockenhoff and Grundler, 1994). This would
imply that at least these defensins have no effect on
H. schachtii and, probably, other cyst nematodes.
Plastids in syncytia
Arabidopsis plants inoculated with nematodes are routinely
grown in Petri dishes in a dark/night cycle to assist the
observation and manipulation (such as microaspiration) of
the infected plants (Sijmons et al., 1991; Wyss and Grundler,
1992). It has been known for a long time that syncytia formed
under these conditions contain chloroplasts (Golinowski
et al., 1996; Sijmons et al., 1991). In accordance with these
observations, we found that genes coding for chloroplast
proteins were among the most strongly upregulated genes
(Table S2), and that genes in the GO category ‘plastid’ were
preferentially upregulated (Figure 2a). Furthermore, genes
assigned to the GO category ‘photosynthesis’ were also
preferentially upregulated (Figure 2a). Thus, at least under
these growth conditions, syncytia contain plastids that seem
to perform active photosynthesis. This would, of course, not
be possible under natural conditions. We have therefore
looked at syncytia from roots kept in the dark after infection.
These syncytia have a comparable number of plastids that
show a similar fluorescence in confocal microscopy as those
from plants kept under a light/dark cycle (D. Szakasits,
M. Sobczak and H. Bohlmann, unpublished data). Plastids
within the syncytia are known to be different from those
found in cells surrounding the syncytia (Golinowski et al.,
1996). Hence, our results corroborate that the differentiation
of plastids is influenced by the syncytium.
The syncytial transcriptome
We noted that among the most strongly upregulated genes
in syncytia were several that are otherwise specifically
expressed in pollen or seeds (Table S9). This motivated us
The transcriptome of syncytia 779
ª 2008 The AuthorsJournal compilation ª 2008 Blackwell Publishing Ltd, The Plant Journal, (2009), 57, 771–784
to perform a PCA (Figure 4) to compare the transcriptome
data from syncytia with those for different Arabidopsis
organs and tissues. A similar approach has been reported
for Arabidopsis organs (Schmid et al., 2005), and for Ara-
bidopsis root tissues obtained through cell sorting (Birn-
baum et al., 2003). Root tissues and root organs also
clustered together in our analysis. In addition, the root
control segments used in our work fell into the same clus-
ter. Syncytia, however, were clearly located outside the root
cluster, which also agreed with the global differences
between syncytium and control root sections (18.4% of all
genes analyzed were upregulated in syncytia, and 15.8%
were downregulated for q < 5%). Moreover, syncytia did
not cluster with any other tissue types, including samples
from flowers, leaves, pollen and seeds. This analysis
therefore indicated that syncytia, although formed within
the root, have a characteristic, unique transcriptional profile
that is different from that of any other organ, and also from
that of any other root tissue.
In a previous study (Puthoff et al., 2003), a comparison of
total roots infected with H. schachtii at 3 dpi with control
roots identified 116 differentially expressed genes (71 up-
regulated and 45 downregulated), using the first generation
Arabidopsis GeneChip, which covered approximately one
third of all genes. There are several possible explanations of
why that study has identified a much lower number of genes
than our analysis. First, the current GeneChip probes more
than twice the number of genes. Second, we have isolated
pure syncytium material, and have specifically analyzed the
changes within syncytia. Third, the differences in sampling
time points might also affect results: syncytium material for
this study was obtained at both 5 and 15 dpi. The expression
differences between 3- and 5-dpi time points, however, seem
to be only marginal (initial, sample count limited compari-
sons in this laboratory have identified only four genes
showing significantly different expression levels; D. Szaka-
sits, D. Kreil and H. Bohlmann, unpublished data).
If we compare the analyses of whole infected roots with
those of the aspirated syncytia performed for this study, we
find that 56 of the genes (34 up- and 22 downregulated)
identified by Puthoff et al. (2003) are also differentially
regulated in syncytia, for an agreement of almost 50%. The
genes only identified by Puthoff et al. (2003) are probably
genes that are systemically induced or repressed through
nematode infection. The fact that no genes coding for
ribosomal proteins were found in the Puthoff et al. (2003)
study provides evidence corroborating this interpretation.
Such genes have, however, been shown to be strongly
expressed in nematode feeding sites in our analysis, and in
other transcriptome studies (Ithal et al., 2007b; Jammes
et al., 2005), and are indicative of the high metabolic activity
in these feeding sites.
Other laboratories have also reported differences com-
paring excised infection sites versus syncytium material for
transcriptome analysis (Ithal et al., 2007b; Klink et al.,
2007b). The second study for instance found only two genes
in common between the 77 genes induced in syncytia and
the 502 genes induced in infected root samples at 3 dpi.
These data also suggest that the majority of induced genes
in infected whole root samples (Puthoff et al., 2003) proba-
bly represent systemically induced genes.
Recently, laser capture microdissection has been applied
to study syncytia induced by H. glycines in soybean roots,
using Affymetrix GeneChips containing 37 744 probe sets
(Ithal et al., 2007b; Klink et al., 2007b). In the first study, 1116
genes were induced at 2 dpi, and 649 genes were sup-
pressed. In the second study, 77 genes were induced and 210
were suppressed at 3 dpi in a compatible interaction,
whereas 206 were induced and 63 were suppressed at
8 dpi. Both studies used a –fold change cut-off of 1.5, and a
0.5 and 5% false discovery rate threshold, respectively. At
present, it is not clear why more induced and repressed
genes were identified in the first study. Whereas some small
differences could probably be explained by the difference
between the 2- and 3-dpi time points, the fact that the first
study identified so many more genes is unexpected, partic-
ularly as it used a more stringent statistical cut-off. In
addition, the second study identified three times more
suppressed than induced genes at 3 dpi, whereas the
relationship was completely different and reversed at
8 dpi. We currently have no explanation for this.
Ithal et al. identified 1116 upregulated and 649 down-
regulated genes in syncytia at 2 dpi. As expected, this
study also revealed a high metabolic activity in syncytia, as
shown by the upregulation of 35 genes coding for
ribosomal proteins. These authors also found both up-
and downregulated genes within gene families, matching
our observations in the present study. Of the 1765 differ-
entially regulated genes, 833 upregulated and 449 down-
regulated genes had homologs in Arabidopsis (collapsing
many-to-one mappings). Expecting few gene expression
differences between 3- and 5-dpi samples of syncytia
induced by H. schachtii in Arabidopsis roots (D. Szakasits,
D. Kreil and H. Bohlmann, unpublished data), we compared
the gene lists for upregulated or downregulated genes
from the Ithal et al. (2007b) study with our data. We found
that of the 833 Arabidopsis homologs of upregulated
soybean genes, 312 were also upregulated in syncytia
induced by H. schachtii in the Arabidopsis roots. Of the 449
Arabidopsis homologs of downregulated soybean genes,
146 were also downregulated in syncytia induced by
H. schachtii in Arabidopsis roots.
From a biological point of view, syncytia induced by
related nematodes in different hosts should be quite similar
in relation to their basic metabolism. This is reflected in the
comparison here. The list of homologous genes that were
upregulated in both systems includes, for instance, almost
all of the genes coding for ribosomal proteins (all except
780 Dagmar Szakasits et al.
ª 2008 The AuthorsJournal compilation ª 2008 Blackwell Publishing Ltd, The Plant Journal, (2009), 57, 771–784
two). In soybean, eight genes homologous to six Arabidop-
sis expansin genes were upregulated. Of these, four genes
were also upregulated in Arabidopsis syncytia (a 66–75%
agreement). A detailed gene-level comparison of the differ-
ences between data sets is also likely to highlight the subtle
effects of choice of sampling time point and differences
in statistical analysis, and would require a comprehensive
analysis of Arabidopsis and soybean homologs. Of course,
paralogs may have diverged in both function and transcrip-
tional regulation. Considering the many non-unique map-
pings, a reliable identification of orthologs would thus be
part of the challenge. (For instance, the present data bases
map seven soybean genes to the same putative peroxidase
At5g05340.)
Conclusion
Our analysis has identified syncytia as having a character-
istic, unique transcriptional profile. The expression of a large
range of genes is changed in syncytia, compared with con-
trol roots, and the fundamental question that remains to be
answered is how the formation of this organ is induced by
the nematode. It is generally agreed that proteins secreted
by the nematode are involved. Future work will be focused
on linking the genes that are up- and downregulated in the
syncytium to developmental pathways, and on linking these
to the activity of nematode-derived effectors.
Experimental procedures
Plant cultivation
Seeds of Arabidopsis (cv. Columbia) were surface-sterilized for10 min in 5% (w/v) calcium hypochlorite, submerged for 5 min in70% (v/v) ethanol and were then washed three times in sterile water(Sijmons et al., 1991). The sterilized seeds were then placed intosterile Petri dishes (B 9 cm) on a modified 0.2 concentrated Knopmedium supplemented with 2% sucrose (Sijmons et al., 1991).Seeds were kept at 4�C for 3 days prior to incubation in a growthchamber at 25�C, with a 16-h light and 8-h dark cycle.
Nematode infection
Heterodera schachtii was multiplied in vitro on mustard (Sinapsisalba cv. Albatros) roots growing on 0.2 concentrated Knop mediumsupplemented with 2% sucrose (Sijmons et al., 1991). Hatching ofL2 larvae was stimulated by soaking the cysts in sterile 3 mM ZnCl2.The juveniles were washed four times in sterile water and resus-pended in 0.5% (w/v) Gelrite for inoculation. Twelve-day-old roots ofA. thaliana plants were inoculated with about 30 juveniles underaxenic conditions.
RNA isolation
RNA was isolated from aspirated syncytia and root segmentsusing the RNeasy Mini Kit (Qiagen, http://www.qiagen.com).The quality of all RNA samples was controlled by an Agilent
2100 Bioanalyzer (Agilent Technologies, http://www.home.agilent.com).
qPCR
RNA was transcribed into cDNA using random primers [oligo(dN)6]and SuperScript III reverse transcriptase (Invitrogen, http://www.invitrogen.com), following the manufacturer’s instructions.Gene-specific primers were selected using PRIMER EXPRESS v2.0(Applied BioSystems, http://www.appliedbiosystems.com), andwere checked for gene specificity within the Arabidopsis genome bya Blast search of the Arabidopsis gene data base. Primer sequencescan be found in Appendix S1. 18S RNA and UBP22 were usedas internal references, as described previously (Hofmann andGrundler, 2007).
Quantitative real-time PCR was performed in an ABI PRISM 7300Sequence Detector (Applied BioSystems) using SYBR Green tomonitor double-stranded DNA synthesis. The final PCR reaction
(a)
(b)
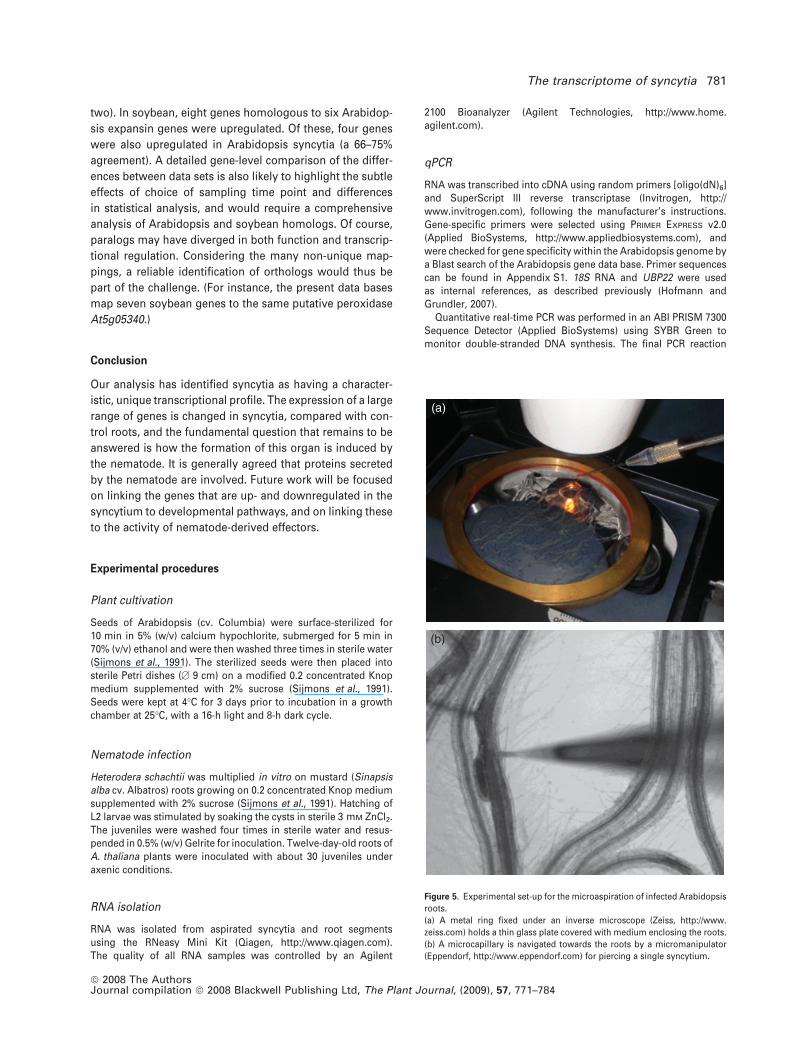
Figure 5. Experimental set-up for the microaspiration of infected Arabidopsis
roots.
(a) A metal ring fixed under an inverse microscope (Zeiss, http://www.
zeiss.com) holds a thin glass plate covered with medium enclosing the roots.
(b) A microcapillary is navigated towards the roots by a micromanipulator
(Eppendorf, http://www.eppendorf.com) for piercing a single syncytium.
The transcriptome of syncytia 781
ª 2008 The AuthorsJournal compilation ª 2008 Blackwell Publishing Ltd, The Plant Journal, (2009), 57, 771–784

volume was 25 ll, containing 12.5 ll 2· Platinum SYBR Green qPCRSuperMix (Invitrogen), with UDG and ROX as reference dyes,primers and MgCl2, dependent on primer pairs, water and 2 ll ofcDNA template. Primer efficiencies and PCR conditions can befound in Appendix S1. cDNA was diluted 1:100 for 18S RNA, and 1:2for all other primers. As a control, water was added instead of cDNA,resulting in no detectable fluorescent signal. PCR was carried out at50�C for 2 min and 95�C for 5 min, followed by 43 cycles at 95�C for15 sec, at 60�C for 30 sec and at 72�C for 60 sec. Data analysis wascarried out using the SEQUENCE DETECTION SOFTWARE (SDS) v2.0(Applied BioSystems). Changes in transcript levels were related tothe expression of 18S RNA and UBP22 using the formula (1+E))DDCt
(Livak and Schmittgen, 2001).
In situ RT-PCR
In situ RT-PCR was performed exactly as described previously(Wieczorek et al., 2006), using the same primers as for the real-timeRT-PCR analysis (see Appendix S1).
Affymetrix GeneChip analysis
Arabidopsis plants were grown in Knop medium on thin glassplates, which were kept in Petri dishes under the conditionsdescribed above. They were inoculated with H. schachtii larvae after12 days. The glass plates supporting the roots could then beremoved from the Petri dishes for microscopy (Figure 5a). Cyto-plasm from syncytia was obtained through microaspiration usingan inverse microscope equipped with a microinjector (Figure 5b).The number of syncytia microaspirated was 346 for 5-dpi syncytia,and 191 for 15-dpi syncytia. These syncytia were collected fromseven and five independent inoculations, respectively, but werepooled to obtain enough material for RNA amplification. Controlroot segments were cut from the elongation zone of uninfectedroots, which were grown under the same conditions as describedabove. Special care was taken to avoid any root tips or lateral rootprimordia. Similarly as for infected material, uninfected root seg-ments were collected as a pool from approximately 1000 plants thatwere grown in four independent batches.
RNA was isolated as described above. As the most variable part ofthe whole procedure is the amplification of the RNA using T7 RNApolymerase, we have performed at least three independent ampli-fication experiments for each RNA pool, and have used eachamplified copy RNA for the labeling and hybridization of oneGeneChip. We hybridized four chips for 5-dpi samples, three chipsfor 15-dpi samples and four chips for control samples, withindividual microarrays representing independent technical repli-cates. Biotin-labeled probes were prepared according to theAffymetrix protocol, with some modifications. For further detailssee Appendix S1.
Statistical analysis of microarray data
Affymetrix CEL files were read into the R statistical analysisenvironment (http://www.r-project.org) using the AFFY package ofthe BIOCONDUCTOR suite (http://www.bioconductor.org). As 10–40% of probe sets are affected by updated gene annotation, chipswere processed with the current TAIR v8 probe-set annotation(Dai et al., 2005). Probe sequence-specific ‘background correction’(Wu et al., 2004) was performed using routines available in theBioconductor gcrma package. Using the ‘affinity’ model, although‘MM’ probes were employed for the determination of affinity
parameters, only ‘PM’ probes were used for the probe-specificbackground correction. An inspection of exploratory pairwisescatter and ‘MA’ plots confirmed the need for inter-chip normal-ization. Thus, the explicit normalization steps required made asubtraction of the heuristic estimate for optical instrument back-ground, as offered in gcrma, unnecessary. Defaults were usedfor all other gcrma parameters. As an examination of pairwisequantile-quantile plots showed only random fluctuations, inter-chip normalization could be achieved using quantile-quantilenormalization (Bolstad et al., 2003). See the ‘Low-level microarrayanalysis and diagnostic plots’ section (Appendix S3) for diag-nostic plots and figures.
After normalization, robust summaries of probe-set signals wereobtained for each gene using an iterative weighted least-squares fitof a linear probe level model (Bolstad, 2004), through the fitPLMfunction of the Bioconductor package affyPLM. This process auto-matically identifies unreliable chip areas, and correspondinglydownweights outlier probes. See Appendix S2 and S3.
The normalized data on a log2 scale were then fitted gene by genewith a linear model including hybridization batch effects, using thelmFit function (Smyth, 2004) of the BIOCONDUCTOR package limma.The result tables also include q values as indicators of significanceof contrasts, after correction for multiple testing controlling the falsediscovery rate (Benjamini and Hochberg, 1995). For the statisticaltests, individual gene variances have been moderated using anEmpirical Bayes approach that draws strength from transferringvariance characteristics from the set of all genes to the test for eachindividual gene (Smyth, 2004).
Full GO annotation was downloaded from TAIR on 6 Jan 2007(http://www.arabidopsis.org). Annotation (including ‘unknown’assignments) was available for almost all genes on the chip(99.6%, 21 053). To permit analyses of arbitrary GO categories,GO-IDs were processed resolving obsolete IDs (http://www.geneontology.org; rev. 1.287, 6 Jan 2007), secondary IDs/aliases(rev. 1.48, 5 Jan 2007), and annotation was revised for consistencyby the fully recursive propagation of category membership toparent nodes. For each category, we then tested for relativeenrichment of genes in the test set by comparison with thedistribution of genes on the chip by Fisher’s exact test andBonferroni correction for multiple testing of the N = 4279 examinedcategories. This corresponds and is equivalent to the commonlyemployed tests using the hypergeometric distribution. Results areprovided in the ‘Analysis’ section of Appendix S1.
To further characterize the nature of regulatory changes, in thispaper we tested whether significantly regulated genes werepreferentially up- or downregulated. In an assessment of theover-representation of upregulated genes in comparison withdownregulated genes, we compared the distribution across GOcategories of the 3885 annotated genes that were upregulatedsignificantly for q < 5%, with that of an equal number of the mostsignificantly downregulated genes. Similarly, examining the over-representation of downregulated genes in comparison withupregulated genes, we compared the distribution across GOcategories of the 3331 annotated genes that were downregulatedsignificantly for q < 5% with that of an equal number of mostsignificantly upregulated genes. P values for a significanceassessment of the observed differences from the binomial distri-bution were Bonferroni corrected for testing of all GO categories(N = 4279), and are also provided in the ‘Analysis’ section ofAppendix S1. Results for selected categories are presented inFigures 2(a,b) and 3.
The additional online material providing large, comprehensivetables and plots, and detailed technical analysis is archived at http://bioinf.boku.ac.at/pub/Szakasits2008/.
782 Dagmar Szakasits et al.
ª 2008 The AuthorsJournal compilation ª 2008 Blackwell Publishing Ltd, The Plant Journal, (2009), 57, 771–784
Principal component analysis
In total, 185 Affymetrix.CEL files from three different studies (Birn-baum et al., 2003; Schmid et al., 2005, this work) were directly loa-ded from the Affymetrix GeneChip Operating Software (GCOS) intoGENESPRING v7.2 (Silicon Genetics; Agilent Technologies, http://www.home.agilent.com) applying the GENESPRING GCRMA probesummarization (robust multi-chip average, with GC-content back-ground correction algorithm). After preprocessing the files, thefollowing GENESPRING standard normalization steps for one-colourdata were performed: (i) data transformation (set measurementsfrom less than 0.01 to 0.01), (ii) per chip (normalized to the 50thpercentile) and (iii) per gene (normalized to median).
In order to compare expression patterns of different tissue types,we performed a Principal Components Analysis of log-ratios for all ofthe different tissue samples. The data were then visualized by plottingsamples in principal component space, utilizing the first two compo-nents, thereby explaining�41% of the total expression variance. Therelationship between the samples was then investigated by visuallyexamining clusters in this reduced two-dimensional space.
Acknowledgements
This research was supported by grant QLK-CT-1999-01501 (NO-NEMA) from the European Union within the 5th Framework, FWFgrant P16296-B06 and FWF grant P16897-B06. The WWTF Chair ofBioinformatics acknowledges funding by the Vienna Science andTechnology Fund (WWTF), the Austrian Centre of Biopharmaceuti-cal Technology (ACBT), Austrian Research Centres (ARC) Seibers-dorf and Baxter AG.
Supporting Information
Additional Supporting Information may be found on the author’sown website: http://bioinf.boku.ac.at/pub/Szakasits2008/:Figure S1. MA plot for the syncytium versus the root. The 100 mostsignificantly differentially expressed genes are marked.Figure S2. MA plot for 5-dpi syncytium versus 15-dpi syncytium. Allsignificantly differentially expressed genes are marked.Table S1. Syncytium versus root. Expression of all genes.Table S2. The 100 genes with the strongest significant increase inexpression level compared with control roots.Table S3. The 100 genes with the strongest significant decrease inexpression level compared with control roots.Table S4. Contingency tables and Fisher’s exact test for the over-representation of the downregulated transcripts of major intrinsicproteins (MIPs) genes (a), and peroxidase genes (b).Table S5. Syncytium versus root. Genes with a high expressionlevel in syncytia.Table S6. Genes with significant differences in expression levelbetween 5- and 15-day-old syncytia, showing up- (a) and downre-gulation (b).Table S7. 5- versus 15-dpi syncytium. Expression of all genes.Table S8. Preferentially up- (a) and downregulated (b) gene ontol-ogy categories.Table S9. Expression of the 100 strongest upregulated genes inArabidopsis organs, according to Genevestigator.Appendix S1. Methods.Appendix S2. Archive of data and sample description tables.Appendix S3. Low-level microarray analysis and diagnostic plots.Please note: Wiley-Blackwell are not responsible for the content orfunctionality of any supporting materials supplied by the authors.Any queries (other than missing material) should be directed to thecorresponding author for the article.
References
Alkharouf, N.W., Klink, V.P., Chouikha, I.B., Beard, H.S., MacDonald,
M.H., Meyer, S., Knap, H.T., Khan, R. and Matthews, B.F. (2006)Timecourse microarray analyses reveal global changes in geneexpression of susceptible Glycine max (soybean) roots duringinfection by Heterodera glycines (soybean cyst nematode).Planta, 224, 838–852.
Benjamini, Y. and Hochberg, Y. (1995) Controlling the false discov-eryrate: a practical and powerful approach to multiple testing.J. R. Stat. Soc. Ser. B, 57, 289–300.
Birnbaum, K., Shasha, D.E., Wang, J.Y., Jung, J.W., Lambert, G.M.,
Galbraith, D.W. and Benfey, P.N. (2003) A gene expression map ofthe Arabidopsis root. Science, 302, 1956–1960.
Bockenhoff, A. and Grundler, F.M.W. (1994) Studies on the nutrientuptake by the beet cyst nematode Heterodera schachtii by in situmicroinjection of fluorescent probes into the feeding structures inArabidopsis thaliana. Parasitology, 109, 249–254.
Bolstad, B.M. (2004) Low level analysis of high-density oligonu-cleotide array data: background, normalization and summariza-tion. PhD Dissertation. Berkeley: University of California.
Bolstad, B.M., Irizarry, R.A., Astrand, M. and Speed, T.P. (2003) Acomparison of normalization methods for high density oligonu-cleotide array data based on bias and variance. Bioinformatics,19, 185–193.
Dai, M., Wang, P., Boyd, A.D. et al. (2005) Evolving gene/transcriptdefinitions significantly alter the interpretation of GeneChip data.Nucleic Acids Res. 33, e175.
Davis, E.L., Hussey, R.S. and Baum, T.J. (2004) Getting to the rootsof parasitism by nematodes. Trends Parasitol. 20, 134–141.
Debroy, S., Thilmony, R., Kwack, Y.B., Nomura, K. and He, S.Y.
(2004) A family of conserved bacterial effectors inhibits salicylicacid-mediated basal immunity and promotes disease necrosis inplants. Proc. Natl Acad. Sci. USA, 101, 9927–9932.
Galan, J.E. and Wolf-Watz, H. (2006) Protein delivery into eukaryoticcells by type III secretion machines. Nature, 444, 567–573.
Gheysen, G. and Fenoll, C. (2002) Gene expression in nematodefeeding sites. Annu. Rev. Phytopathol. 40, 191–219.
Goellner, M., Wang, X. and Davis, E.L. (2001) Endo-beta-1,4-glu-canase expression in compatible plant-nematode interactions.Plant Cell, 13, 2241–2255.
Golinowski, W., Grundler, F.M.W. and Sobczak, M. (1996) Changesin the structure of Arabidopsis thaliana induced during develop-ment of females of the plant parasitic nematode Heteroderaschachtii. Protoplasma, 194, 103–116.
Gus-Mayer, S., Naton, B., Hahlbrock, K. and Schmelzer, E. (1998)Local mechanical stimulation induces components of the patho-gen defense response in parsley. Proc. Natl Acad. Sci. USA, 95,8398–8403.
Hammes, U.Z., Schachtman, D.P., Berg, R.H., Nielsen, E., Koch, W.,
McIntyre, L.M. and Taylor, C.G. (2005) Nematode-induced chan-ges of transporter gene expression in Arabidopsis roots. Mol.Plant Microbe Interact. 18, 1247–1257.
Hofmann, J. and Grundler, F.M.W. (2006) Females and males ofroot-parasitic cyst nematodes induce different symplasmic con-nections between their syncytial feeding cells and the phloem inArabidopsis thaliana. Plant Physiol. Biochem. 44, 430–433.
Hofmann, J. and Grundler, F.M.W. (2007) Identification of referencegenes for qRT-PCR studies of gene expression in giant cells andsyncytia induced in Arabidopsis thaliana by Meloidogyne incog-nita and Heterodera schachtii. Nematology, 9, 317–323.
Hofmann, J., Wieczorek, K., Blochl, A. and Grundler, F.M.W. (2007)Sucrose supply to nematode-induced syncytia depends on theapoplasmic and the symplasmic pathway. J. Exp. Bot. 58, 1591–1601.
The transcriptome of syncytia 783
ª 2008 The AuthorsJournal compilation ª 2008 Blackwell Publishing Ltd, The Plant Journal, (2009), 57, 771–784

Hofmann, J., Szakasits, D., Blochl, A., Sobczak, M., Daxbock-
Horvath, S., Golinowski, W., Bohlmann, H. and Grundler, F.M.W.
(2008) Starch serves as carbohydrate storage in nematode-induced syncytia. Plant Physiol. 146, 228–235.
Hoth, S., Schneidereit, A., Lauterbach, C., Scholz-Starke, J. and
Sauer, N. (2005) Nematode infection triggers the de novo for-mation of unloading phloem that allows macromolecular traf-ficking of green fluorescent protein into syncytia. Plant Physiol.138, 383–392.
Ithal, N., Recknor, J., Nettleton, D., Hearne, L., Maier, T., Baum, T.J.
and Mitchum, M.G. (2007a) Parallel genome-wide expressionprofiling of host and pathogen during soybean cyst nematodeinfection of soybean. Mol. Plant Microbe Interact. 20, 293–305.
Ithal, N., Recknor, J., Nettleton, D., Maier, T., Baum, T.J. and Mit-
chum, M.G. (2007b) Developmental transcript profiling of cystnematode feeding cells in soybean roots. Mol. Plant MicrobeInteract. 20, 510–525.
Jamir, Y., Guo, M., Oh, H.S., Petnicki-Ocwieja, T., Chen, S., Tang, X.,
Dickman, M.B., Collmer, A. and Alfano, J.R. (2004) Identificationof Pseudomonas syringae type III effectors that can suppressprogrammed cell death in plants and yeast. Plant J. 37, 554–565.
Jammes, F., Lecomte, P., Almeida-Engler, J., Bitton, F., Martin-
Magniette, M.L., Renou, J.P., Abad, P. and Favery, B. (2005)Genome-wide expression profiling of the host response to root-knot nematode infection in Arabidopsis. Plant J. 44, 447–458.
Jaubert, S., Ledger, T.N., Laffaire, J.B., Piotte, C., Abad, P. and
Rosso, M.N. (2002) Direct identification of stylet secreted proteinsfrom root-knot nematodes by a proteomic approach. Mol. Bio-chem. Parasitol. 121, 205–211.
Jones, M.G.K. and Northcote, D.H. (1972) Nematode-induced syn-cytium-A multinucleate transfer cell. J. Cell Sci. 10, 789–809.
Juergensen, K., Scholz-Starke, J., Sauer, N., Hess, P., van Bel, A.J.E.
and Grundler, F.M.W. (2003) The companion cell-specific Ara-bidopsis disaccharide carrier AtSUC2 is expressed in nematode-induced syncytia. Plant Physiol. 131, 61–69.
Kanter, U., Usadel, B., Guerineau, F., Li, Y., Pauly, M. and Tenhaken,
R. (2005) The inositol oxygenase gene family of Arabidopsis isinvolved in the biosynthesis of nucleotide sugar precursors forcell-wall matrix polysaccharides. Planta, 221, 243–254.
Klink, V.P., Overall, C.C., Alkharouf, N.W., MacDonald, M.H. and
Matthews, B.F. (2007a) A time-course comparative microarrayanalysis of an incompatible and compatible response by Glycinemax (soybean) to Heterodera glycines (soybean cyst nematode)infection. Planta, 226, 1423–1447.
Klink, V.P., Overall, C.C., Alkharouf, N.W., MacDonald, M.H. and
Matthews, B.F. (2007b) Laser capture microdissection (LCM) andcomparative microarray expression analysis of syncytial cellsisolated from incompatible and compatible soybean (Glycinemax) roots infected by the soybean cyst nematode (Heteroderaglycines). Planta, 226, 1389–1409.
Kudla, U., Qin, L., Milac, A. et al. (2005) Origin, distribution and 3D-modeling of Gr-EXPB1, an expansin from the potato cyst nema-tode Globodera rostochiensis. FEBS Lett. 579, 2451–2457.
Livak, K.J. and Schmittgen, T.D. (2001) Analysis of relative geneexpression data using real-time quantitative PCR and the 2(-DeltaDelta C(T)). Methods, 25, 402–408.
Lorence, A., Chevone, B.I., Mendes, P. and Nessler, C.L. (2004) myo-Inositol oxygenase offers a possible entry point into plantascorbate biosynthesis. Plant Physiol. 134, 1200–1205.
Niebel, A., De Almeida Engler, J., Hemerly, A., Ferreira, P., Inze, D.,
Van Montagu, M. and Gheysen, G. (1996) Induction of cdc2a andcyc1At expression in Arabidopsis thaliana during early phasesof nematode-induced feeding cell formation. Plant J. 10, 1037–1043.
Offler, C.E., McCurdy, D.W., Patrick, J.W. and Talbot, M.J. (2002)Transfer cells: cells specialized for a special purpose. Annu. Rev.Plant Biol. 54, 431–454.
Okumoto, S., Schmidt, R., Tegeder, M., Fischer, W.N., Rentsch, D.,
Frommer, W.B. and Koch, W. (2002) High affinity amino acidtransporters specifically expressed in xylem parenchyma anddeveloping seeds of Arabidopsis. J. Biol. Chem. 277, 45338–45346.
Puthoff, D.P., Nettleton, D., Rodermel, S.R. and Baum, T.J. (2003)Arabidopsis gene expression changes during cyst nematodeparasitism revealed by statistical analyses of microarray expres-sion profiles. Plant J. 33, 911–921.
Schmid, M., Davison, T.S., Henz, S.R., Pape, U.J., Demar, M.,
Vingron, M., Scholkopf, B., Weigel, D. and Lohmann, J.U. (2005)A gene expression map of Arabidopsis thaliana development.Nat. Genet. 37, 501–506.
Sijmons, P.C., Grundler, F.M.W., von Mende, N., Burrows, P. and
Wyss, U. (1991) Arabidopsis thaliana as a new model host forplant-parasitic nematodes. Plant J. 1, 245–254.
Smant, G., Stokkermans, J.P.W.G., Yan, Y. et al. (1998) Endogenouscellulases in animals: Isolation of beta-1,4-endoglucanase genesfrom two species of plant-parasitic cyst nematodes. Proc. NatlAcad. Sci. USA, 95, 4906–4911.
Smyth, G.K. (2004) Linear models and empirical Bayes methods forassessing differential expression in microarray experiments. Stat.Appl. Gene. Mol. Biol. 3, Article 3.
Sobczak, M., Golinowski, W. and Grundler, F.M.W. (1997) Changesin the structure of Arabidopsis thaliana roots induced duringdevelopment of males of the plant parasitic nematode Heteroderaschachtii. Eur. J. Plant Pathol. 103, 113–124.
Thomma, B.P., Cammue, B.P. and Thevissen, K. (2002) Plantdefensins. Planta, 216, 193–202.
Vanholme, B., De Meutter, J., Tytgat, T., Van Montagu, M., Coo-
mans, A. and Gheysen, G. (2004) Secretions of plant-parasiticnematodes: a molecular update. Gene, 332, 13–27.
Vanholme, B., Mitreva, M., Van Criekinge, W., Logghe, M., Bird, D.,
McCarter, J.P. and Gheysen, G. (2006) Detection of putativesecreted proteins in the plant-parasitic nematode Heteroderaschachtii. Parasitol. Res. 98, 414–424.
Wallace, I.S. and Roberts, D.M. (2004) Homology modeling of rep-resentative subfamilies of Arabidopsis major intrinsic proteins.Classification based on the aromatic/arginine selectivity filter.Plant Physiol. 135, 1059–1068.
Wieczorek, K., Golecki, B., Gerdes, L. et al. (2006) Expansins areinvolved in the formation of nematode-induced syncytia in rootsof Arabidopsis thaliana. Plant J. 48, 98–112.
Wieczorek, K., Hofmann, J., Blochl, A., Szakasits, D., Bohlmann, H.
and Grundler, F.M.W. (2008) Arabidopsis endo-1,4-beta-glucan-ases are involved in the formation of root syncytia induced byHeterodera schachtii. Plant J. 53, 336–351.
Williamson, V.M. and Kumar, A. (2006) Nematode resistance inplants: the battle underground. Trends Genet. 22, 396–403.
Wu, Z., Irizarry, R.A., Gentleman, R., Martinez-Murillo, F. and
Spencer, F. (2004) A model based background adjustment foroligonucleotide expression arrays. J. Am. Stat. Assoc. 99, 909–917.
Wyss, U. and Grundler, F.M.W. (1992) Heterodera schachtii andArabidopsis thaliana, a model host-parasite interaction. Nema-tologica, 38, 488–493.
Yang, H., Matsubayashi, Y., Nakamura, K. and Sakagami, Y. (2001)Diversity of Arabidopsis genes encoding precursors for phy-tosulfokine, a peptide growth factor. Plant Physiol. 127, 842–851.
Zimmermann, P., Hirsch-Hoffmann, M., Hennig, L. and Gruissem,
W. (2004) GENEVESTIGATOR. Arabidopsis microarray databaseand analysis toolbox. Plant Physiol. 136, 2621–2632.
784 Dagmar Szakasits et al.
ª 2008 The AuthorsJournal compilation ª 2008 Blackwell Publishing Ltd, The Plant Journal, (2009), 57, 771–784