Fatty acid composition of soybean/sunflower mix oil, fish oil
Upload
independentCategory
view
1download
0
Planta (2007) 226:1423–1447
DOI 10.1007/s00425-007-0581-4ORIGINAL ARTICLE
A time-course comparative microarray analysis of an incompatible and compatible response by Glycine max (soybean) to Heterodera glycines (soybean cyst nematode) infection
Vincent P. Klink · Christopher C. Overall · Nadim W. Alkharouf · Margaret H. MacDonald · Benjamin F. Matthews
Received: 14 April 2007 / Accepted: 25 June 2007 / Published online: 25 July 2007© Springer-Verlag 2007
Abstract The development of an infection in soybean[Glycine max L. cultivar (cv.) Peking] roots by incompati-ble (I) and compatible (C) populations of soybean cystnematode (SCN) (Heterodera glycines) was assayed usingan AVymetrix® soybean GeneChip®. This time-coursemicroarray analysis, using 37,744 probe sets, measuredtranscript abundance during I and C. These analyses revealthat infection by individual I and C H. glycines populationsinXuence the transcription of G. max genes diVerently. Asubstantial diVerence in gene expression is present betweenI and C at 12 h post infection. Thus, G. max can diVerenti-ate between I and C nematode populations even before theyhave begun to select their feeding sites. The microarrayanalysis identiWed genes induced earlier in infection during
I than C. MA also identiWed amplitude diVerences in tran-script abundance between I and C reactions. Some of theprobe sets measuring increased transcript levels during Irepresented no apical meristem (NAM) and WRKY tran-scription factors as well as NBS-LRR kinases. Later duringI, heat shock protein (HSPs) probe sets (i.e. HSP90,HSP70, ClpB/HSP101) measured increased transcriptabundance. These results demonstrate that G. max rootsrespond very diVerently to the diVerent H. glycines raceseven before their feeding site selection has occurred. Theability of G. max to engage an I reaction, thus, appears to bedependent on the ability of root cells to recognize the diVer-ent races of H. glycines because these experiments wereconducted in the identical G. max genetic background.
Keywords Soybean · Glycine max · Soybean cyst nematode (SCN) · Heterodera glycines · Microarray · Gene expression · Plant pathogen · Parasite · AVymetrix® · Microarray
AbbreviationsEST Expressed sequence taghpi Hours post inoculationdpi Days post inoculationSCN Soybean cyst nematodeJ2 Second stage juvenilecv. CultivarI IncompatibleC CompatibleNAM No apical meristemMA Microarray analysisCUC CUP-SHAPED COTYLEDONNAC NAM-ATAF-CUCHSP Heat shock proteinMRS Moisture replacement system
Vincent P. Klink and Christopher C. Overall have contributed equally to this work.
Electronic supplementary material The online version of this article (doi:10.1007/s00425-007-0581-4) contains supplementary material, which is available to authorized users.
V. P. Klink (&) · C. C. Overall · M. H. MacDonald · B. F. MatthewsUnited States Department of Agriculture, Soybean Genomics and Improvement Laboratory, 10300 Baltimore Ave. Bldg 006, Beltsville, MD 20705, USAe-mail: [email protected]
C. C. OverallDepartment of Bioinformatics and Computational Biology, George Mason University, Manassas, VA 20110, USA
N. W. AlkharoufJess and Mildred Fisher College of Science and Mathematics, Department of Computer and Information Sciences, Towson University, 7800 York Road, Towson, MD 21252, USA
123

1424 Planta (2007) 226:1423–1447
KTI Kunitz trypsin inhibitorOPR 12-Oxophytodienoate reductaseEDS1 Enhanced disease susceptibility 1SAG101 SENESCENCE-ASSOCIATED GENE101LOX LipoxygenaseNPR1 Non expressor of PR genes 1LTP Lipid transfer proteinPAD4 PHYTOALEXIN-DEFICIENT4PIP1C Plasma membrane intrinsic protein 1CGER Germin-like proteinHEL Hevein-like proteinFLA6 Fasciclin-like arabinogalactan-proteinMPA Median polish algorithmRCC1 Regulator of chromosome condensationPRR Pattern recognition receptorsPAMP Pathogen-associated molecular patternRKN Root knot nematode
Introduction
The infection of plants by parasitic nematodes is a majoragricultural problem that is poorly understood (reviewed inWilliamson and Kumar 2006; Klink et al. 2007a). The mostprominent of these interactions is Glycine max infection byHeterodera glycines because it accounts for an estimated$460–$818 million in production losses annually in the US(Wrather and Koenning 2006). Resistance loci to H. gly-cines are present in the germplasm of G. max and those locihave been physically mapped (Cregan et al. 1999; Mat-thews et al. 2001). However, G. max resistance to H. gly-cines is limited to varieties that are the poorest in terms ofproduction yield. Thus, identifying genes that could conferresistance are urgently needed. Resistance is also limited tospeciWc nematode populations within those resistant varie-ties (Riggs and Schmitt 1991; Niblack et al. 2002).
The H. glycines life cycle (Fig. 1) is approximately1 month in duration (reviewed in Jung and Wyss 1999;Klink et al. 2007a). Well-deWned H. glycines populationsthat accomplish resistant and susceptible reactions areavailable for examining G. max–H. glycines interactions(Riggs and Schmitt 1991; Niblack et al. 2002). Those histo-logical studies of the resistant and susceptible interactionsbetween G. max roots and H. glycines have been performed(Endo 1964, 1965, 1971, 1991; Endo and Veech 1970; Gip-son et al. 1971; Jones and Northcote 1972; Riggs et al.1973) and demonstrated the anatomical changes that occurin G. max roots during H. glycines invasion. Interestingly,nematodes burrow into the roots of both resistant and sus-ceptible G. max genotypes and subsequently migratetoward the vascular tissue. The nematode selects a celladjacent to the vascular tissue and pierces it with its styletto initiate the development of a feeding site. This occurs at
approximately 2 days after inoculation. Subsequently, syn-cytia are established during both resistant and susceptiblereactions. The cells adjacent to the feeding site thenbecome metabolically hyperactive (Endo and Veech 1970;Endo 1971). Then, the walls of the cells adjacent to theselected cell begin to dissolve. The infected plant cell incor-porates additional cells by fusion events with neighboring
Fig. 1 Life cycle of H. glycines. The eggs, within cysts, can lie dor-mant in the soil for years. Eggs hatch as second stage juveniles (J2s)that migrate toward and subsequently burrow into a root toward theroot stele. A stylet emerges from the anterior end of the nematode. Thenematode pierces a pericycle cell (green cell with nuclei [red circles])or neighboring root cell, presumably releasing substances that thencauses major changes in the physiology of the root cell. Those rootcells (yellow) then fuse with neighboring cells (light blue). Ultimately,this process produces a syncytium (orange), a structure that containsapproximately 200 merged root cells. The syncytium serves as the H.glycines feeding site. After the establishment of the syncytium, malenematodes feed for several days until the end of the J3 stage. Malesmeanwhile become sedentary. Subsequently, the males discontinuefeeding and molt into vermiform J4. Males burrow toward the femaleto copulate. In contrast, the female becomes and remains sedentary af-ter the establishment of their feeding site. The female nematodes thenexpand circumferentially while undergoing J3 and J4 molts. They thenmature into feeding adult females. The female ultimately becomes thecyst that encases the eggs. a Cysts that may remain dormant in the soilfor years. b Second stage juveniles (purple) hatch and migrate towardthe root of G. max. c J2 nematodes burrow into the root and migrate to-ward the root vasculature and select a cell for feeding site establish-ment. d J2 nematodes have molted into J3. They undergo a subsequentmolt into J4 nematodes. Meanwhile, the female continues to grow cir-cumferentially as it feeds. The male discontinues feeding at the end ofits J3 stage. Male and female J4 nematodes become adults and the ver-miform male (blue) migrates to the female to copulate. f After»30 days, the female with eggs is clearly visible and emerging fromthe root. Figure adapted from Klink et al. (2007)
123
Planta (2007) 226:1423–1447 1425
cells by 3 days post-infection. Eventually these recruitedcells merge to form a syncytium.
Diverse reactions of incompatibility (I resistance) andcompatibility (C susceptibility) become evident subse-quently. The susceptible response is characterized by vari-ous cellular events that are visible at the anatomical level.These changes include hypertrophy of the nuclei and nucle-oli, proliferation of cytoplasmic organelles, reduction ordissolution of the vacuole and expansion of the cell as itincorporates adjacent cells (Jones and Dropkin 1975; Endoand Veech 1970; Gipson et al. 1971; Riggs et al. 1973). Incontrast, during the resistance response of G. max cultivar‘Peking’ to H. glycines NL1-RHp, the syncytium both col-lapses and becomes necrotic. At 4 days after inoculation,cell wall depositions form and there is an increase in lipidglobules that occur before necrosis (Riggs et al. 1973).Concomitantly, degeneration of syncytia occurs. ‘Bedford’,a resistant cultivar, has a somewhat diVerent response. Inthat reaction, nuclei Wrst degrade. After the breakdown ofthe nuclei, the cytoplasm degrades (Kim et al. 1987). Even-tually, roots overcome infection at the site of infection(Endo 1965, 1991; Riggs et al. 1973; Kim et al. 1987).
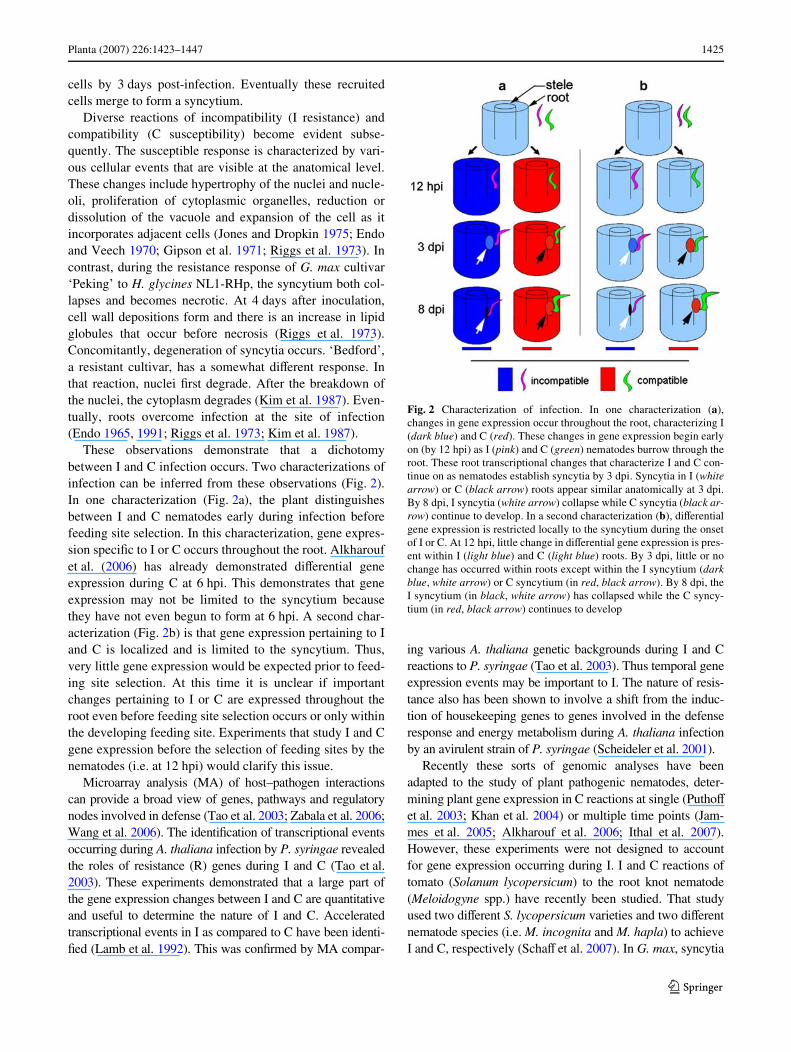
These observations demonstrate that a dichotomybetween I and C infection occurs. Two characterizations ofinfection can be inferred from these observations (Fig. 2).In one characterization (Fig. 2a), the plant distinguishesbetween I and C nematodes early during infection beforefeeding site selection. In this characterization, gene expres-sion speciWc to I or C occurs throughout the root. Alkharoufet al. (2006) has already demonstrated diVerential geneexpression during C at 6 hpi. This demonstrates that geneexpression may not be limited to the syncytium becausethey have not even begun to form at 6 hpi. A second char-acterization (Fig. 2b) is that gene expression pertaining to Iand C is localized and is limited to the syncytium. Thus,very little gene expression would be expected prior to feed-ing site selection. At this time it is unclear if importantchanges pertaining to I or C are expressed throughout theroot even before feeding site selection occurs or only withinthe developing feeding site. Experiments that study I and Cgene expression before the selection of feeding sites by thenematodes (i.e. at 12 hpi) would clarify this issue.
Microarray analysis (MA) of host–pathogen interactionscan provide a broad view of genes, pathways and regulatorynodes involved in defense (Tao et al. 2003; Zabala et al. 2006;Wang et al. 2006). The identiWcation of transcriptional eventsoccurring during A. thaliana infection by P. syringae revealedthe roles of resistance (R) genes during I and C (Tao et al.2003). These experiments demonstrated that a large part ofthe gene expression changes between I and C are quantitativeand useful to determine the nature of I and C. Acceleratedtranscriptional events in I as compared to C have been identi-Wed (Lamb et al. 1992). This was conWrmed by MA compar-
ing various A. thaliana genetic backgrounds during I and Creactions to P. syringae (Tao et al. 2003). Thus temporal geneexpression events may be important to I. The nature of resis-tance also has been shown to involve a shift from the induc-tion of housekeeping genes to genes involved in the defenseresponse and energy metabolism during A. thaliana infectionby an avirulent strain of P. syringae (Scheideler et al. 2001).
Recently these sorts of genomic analyses have beenadapted to the study of plant pathogenic nematodes, deter-mining plant gene expression in C reactions at single (PuthoVet al. 2003; Khan et al. 2004) or multiple time points (Jam-mes et al. 2005; Alkharouf et al. 2006; Ithal et al. 2007).However, these experiments were not designed to accountfor gene expression occurring during I. I and C reactions oftomato (Solanum lycopersicum) to the root knot nematode(Meloidogyne spp.) have recently been studied. That studyused two diVerent S. lycopersicum varieties and two diVerentnematode species (i.e. M. incognita and M. hapla) to achieveI and C, respectively (SchaV et al. 2007). In G. max, syncytia
Fig. 2 Characterization of infection. In one characterization (a),changes in gene expression occur throughout the root, characterizing I(dark blue) and C (red). These changes in gene expression begin earlyon (by 12 hpi) as I (pink) and C (green) nematodes burrow through theroot. These root transcriptional changes that characterize I and C con-tinue on as nematodes establish syncytia by 3 dpi. Syncytia in I (whitearrow) or C (black arrow) roots appear similar anatomically at 3 dpi.By 8 dpi, I syncytia (white arrow) collapse while C syncytia (black ar-row) continue to develop. In a second characterization (b), diVerentialgene expression is restricted locally to the syncytium during the onsetof I or C. At 12 hpi, little change in diVerential gene expression is pres-ent within I (light blue) and C (light blue) roots. By 3 dpi, little or nochange has occurred within roots except within the I syncytium (darkblue, white arrow) or C syncytium (in red, black arrow). By 8 dpi, theI syncytium (in black, white arrow) has collapsed while the C syncy-tium (in red, black arrow) continues to develop
123

1426 Planta (2007) 226:1423–1447
present in both I and C reactions at 3 dpi have recently beenisolated by laser capture microdissection (LCM) and used forMA (Klink et al. 2007b). Syncytia that were microdissectedfrom roots undergoing a C reaction at 3 and 8 dpi have alsobeen used for a time-course study (Klink et al. 2007b). Atthis time, no genomic information at the microarray levelexists on the temporal events pertaining to the developmentor establishment of I to H. glycines in whole root samples.
The diVerences in anatomy of G. max root cells undergo-ing I and C reactions imply that a number of diVerent genesare involved in these dissimilar reactions. We chose G. maxcv. Peking because it is highly resistant to one H. glycinespopulation (NL1-RHg) and is susceptible to a diVerent H.glycines population (TN8), allowing us to examine changesin global gene expression during the I and C reactions in thesame G. max cultivar. This was accomplished by simplychanging the H. glycines population and studying geneexpression with the AVymetrix® microarray platform. TheAVymetrix® GeneChip® technology used for microarrayinvestigations is an established platform for gene identiWca-tion (Lipshutz et al. 1999). The GeneChip® has been used inA. thaliana to study C reactions to the pathogen P. syringaeover time (Wang et al. 2006) and to compare I and C reac-tions over time in A. thaliana during P. syringae infection(Tao et al. 2003). The AVymetrix® soybean GeneChip® hasbeen used to study a time-course of infection in C (Ithal et al.2007). That three-time point study (Ithal et al. 2007) mir-rored a seven time point study by (Alkharouf et al. 2006).However, all of the time points selected in that analysis (Ithalet al. 2007) were after feeding site selection had occurred.We believed that the GeneChip® could be used to study atime-course comparing I and C. The G. max–H. glycines sys-tem is a good candidate system for comparing gene expres-sion occurring during the development of infection. This isdue to the obligate nature of H. glycines and the availabilityof populations that confer I or C reactions in the same G. maxcultivar (i.e. Peking) (Niblack et al. 2002). H. glycines is alsoa relevant, major pathogen of G. max (Wrather and Koenning2006). Lastly, the tractability for gene expression analyses(Cho et al. 2001; Zhang and Ghabrial 2006) make it a goodsystem because information on genes identiWed here can betranslated directly to improve resistance in an agriculturallyrelevant plant. We present here a microarray analysis of G.max cv. Peking whole root infection by H. glycines, compar-ing I and C responses using the AVymetrix® GeneChip®.
Materials and methods
Plant and nematode procurement
Glycine max and H. glycines were grown at the UnitedStates Department of Agriculture Soybean Genomics and
Improvement Laboratory, Beltsville, MD, USA. Two popu-lations of H. glycines, NL1-RHg (incompatible I), and TN8(compatible C), were maintained in the greenhouse usingthe moisture replacement system (MRS) (Sardanelli andKenworthy 1997). Seedlings were grown in sterile sand in20 £ 20 £ 10 cm Xats for a week. The seedlings were thengently removed from the sand and rinsed with sterile water.Seedlings were placed on moistened germination paper(Anchor Paper, St Paul, MN, USA) inside each20 £ 20 £ 10 cm Xat. Mature female nematodes were har-vested from the sand beakers of the MRS 3 days previ-ously, by massaging the roots in water and sieving thesolution through nested 850 and 150 �m sieves. Femaleswere puriWed further by sucrose Xotation (Matthews et al.2003), and the females were crushed gently with a rubberstopper in a 7.5 cm diameter, 250 �m sieve to release theeggs. The eggs Xowed through the sieve into a small plastictray. The debris smaller than the eggs was removed bywashing them in a 25 �m mesh sieve. The eggs were placedin a small plastic tray with 1 cm of water. (The tray wascovered with plastic wrap and placed on a rotary shaker at25 rpm. After 3 days, the second stage juvenile nematodes(J2s) were then separated from unhatched eggs by runningthem through a 41 �m mesh cloth. The J2s were concen-trated by centrifugation in an IEC clinical centrifuge for30 s at 1,720 rpm to 5,000 J2/ml. This represented the inoc-ulum. Two milliliters of inoculum was added directly onthe roots for a Wnal concentration of 2,000 J2/root. Controlmock-inoculated replicates received the same amount ofwater. The roots were covered with a moistened sheet ofgermination paper and placed in a 45 £ 50 £ 20 cm plastictray with a 1 cm of water in the bottom to add humidity. Asemi-transparent bag was wrapped around the tray, andplaced under Xuorescent lights of 16/8 h light/dark photo-period. Identical light intensities were used for each experi-ment. Infected roots were grown for 12 h post inoculation(hpi), 3 or 8 days post inoculation (dpi). The 12 hpi roots(infected and mock-infected, control) were washed andXash frozen in liquid nitrogen. The other two samples thateventually would become the 3 and 8 dpi samples were alsowashed to remove the extraneous nematodes that had notyet penetrated the root. This prevented additional nema-todes from entering the root. Lateral roots that were maxi-mally infected (as determined later by acid fucshinstaining) were harvested and Xash frozen in liquid nitrogen.This ensured that we were obtaining the tissue that was themost highly infected with nematodes (Alkharouf et al.2006). The tissue was ground to a Wne powder and stored at¡80°C. Total RNA extraction was performed using themethod of Mujer et al. (1996), typically yielding 300 �g oftotal RNA/g of wet tissue. This process was then repeated.Thus, two independent sets of samples, each composed ofsamples pooled from multiple plants, were generated. For
123

Planta (2007) 226:1423–1447 1427
all treatments, at the end of the experiment, representativeroot samples isolated from each root used in the analysisand used solely to determine the extent of nematode infec-tion was acid fuchsin stained (Byrd et al. 1983). Stereomi-croscopy of those acid fuschin-stained roots was performedwith a Nikon SMZ 1500 stereomicroscope (Nikon Corpora-tion, Tokyo, Japan). Stereomicroscope images were cap-tured with an Optronics MagnaFire model S99802 CCDcamera (Optronics, Goleta, CA, USA). A second set ofsamples was used for histological observation to conWrmnematodes were infecting the roots, selecting feeding sitesand creating syncytia (see below).
Histology
Glycine max roots were harvested, cut into 0.5 cm piecesand Wxed by vacuum inWltration with in Farmer’s solutioncomposed of 75% ethanol, 25% acetic acid for 12 h at 4°C(Sass 1958; Klink et al. 2005) Farmers solution wasremoved from the roots using a graded ethanol series (75,85, 100, 100%), 30 min each, then with 1:1 xylene:ethanolfor 30 min, followed by three, 100% xylene incubations(30 min each). Xylene was slowly replaced with Parap-last+® tissue embedding medium (Tyco Healthcare GroupLP, MansWeld, MA, USA) in a 58°C oven by inWltrating theroots sequentially in 3:1, 1:1, 1:3 xylene:Paraplast+ in eachstep for 3 h. Tissue was cast, mounted, and 10 �m serialsections of roots were made using an American Optical 820microtome (American Optical Co., BuValo, NY, USA;Klink et al. 2005). Sections were stained with Safranin O in50% ETOH, counter-stained using Fast Green and thenmounted in Permount (Klink et al. 2005).
Microarray analyses
Whole root microarray gene expression analyses were con-ducted using the GeneChip® Soybean Genome Array (Cat. #900526; AVymetrix®; Santa Clara, CA, USA) containing37,744 G. max probe sets (35,611 transcripts). Thus, someredundancy is present. This high-density array consists of an11-probe pair (25 bp per oligonucleotide) with an 11 �m fea-ture size. It provides multiple independent measurements foreach individual transcript. The G. max annotations werekindly provided by Brandon Le and Anhthu Bui of Dr. Rob-ert Goldberg’s lab (University of California-Los Angeles).The annotations were made by comparison to the A. thalianagene ontology (GO) database (The Gene Ontology Consor-tium 2004). These annotations are based on the best matchfrom their Blast searches (Altschul et al. 1997). Details of theGeneChip® soybean genome array are available at theAVymetrix® website (http://aVymetrix.com/index.aVx).
Microarrays were hybridized and scanned at the Labora-tory of Molecular Technology, SAIC-Frederick, National
Cancer Institute at Frederick, Frederick, MD 21701, USA.Details of the scanning procedure can be found at theAVymetrix website (http://www.aVymetrix.com/support/downloads/manuals/expression_s2_manual.pdf).
Bioconductor, a suite of genomics analysis tools(packages) primarily written in the R programming lan-guage, was used to analyze the microarray data (Gentlemanet al. 2004). R (http://www.r-project.org/) and Bioconduc-tor (http://www.bioconductor.org) are freely available. TheRobust Multichip Average (RMA) methodology (Irizarryet al. 2003a, b), as implemented in the AVymetrix® Biocon-ductor package, was used to extract the expression levels ofthe probe sets on each chip. The model parameters are esti-mated using the median polish algorithm (MPA). MPA is arobust procedure that protects against outlier probes. Thestandard t-test was not used for diVerential expression anal-ysis because two biological replicates were run for eachtime point. Instead, a moderated t-statistic was calculatedusing an Emperical Bayes approach as implemented in thelimma Bioconductor package (Gentleman et al. 2004;Smyth 2004). By this method, a more stable estimate ofgene-speciWc variance is calculated by considering the vari-ances of other genes on the microarray. This reduces thepossibility of obtaining large variance values. These stablevariance estimates were then used to calculate the moderatedt-statistic. Subsequently, the moderated t-statistics were used tocalculate P-values. DiVerentially expressed probe sets wereany probe set in the test samples (12 hpi, 3 and 8 dpi) havinga fold change with absolute value > +1.5 and also having aP-value ·0.05 as compared to the control (mock inocu-lated) (Alkharouf et al. 2006). The original data sets, thenormalized data sets, statistics and data supplemental toeach table and Wgure are available (http://www.towson.edu/nalkharo/SGMD/SupplementalSites/GmWholeRootIC/).
Results
Histological analysis of I and C responses in the whole root
Morphological and anatomical details of I and C diseaseresponses by G. max to H. glycines infection have beenpublished previously (Endo 1964, 1965, 1971, 1991, 1998;Endo and Veech 1970; Gipson et al. 1971; Jones andNorthcote 1972; Riggs et al. 1973; reviewed in Jung andWyss 1999; Klink et al. 2007a). We examined infection andpresent those data here for comparative purposes to demon-strate the extent and quality of infection in the tissues stud-ied. Our investigation focuses on the events occurringduring the Wrst eight days of infection. I or C roots infectedfor 12 hpi, 3 and 8 dpi were isolated from plants (Fig. 3).We deliberately selected the 12 hpi time point because ofour interest in examining whether G. max roots can distinguish
123

1428 Planta (2007) 226:1423–1447
between I and C nematodes before feeding site selectionoccurred. By 12 hpi, I (Fig. 3a) and C (Fig. 3b) nematodeshave penetrated the root. I (Fig. 3c) and C (Fig. 3d) nema-todes have selected and have begun establishing feedingsites (Fig. 3) by 3 dpi. By 8 dpi, I (Fig. 3e) and C (Fig. 3f)
nematodes have established syncytia (Fig. 4) and begintheir circumferential expansion that is due to their growthas they feed from syncytia. Roots from those same plantswere processed for histological observation to conWrm theextent of syncytium formation. Feeding site selection hadnot begun at 12 hpi (data not presented). Syncytia weredeveloping at 3 dpi during I (Fig. 4a) and C (Fig. 4b) reac-tions. Syncytia were collapsing at 8 dpi in I (Fig. 4c) butwere still developing at 8 dpi in C (Fig. 4d).
Single time point microarray analysis identiWes I and C probe sets
Our microarray analysis (MA) examining I and C were per-formed using the identical G. max genotype (cv. Peking).This eliminates the concern of I and C transcript expressionanomalies being caused by using diVerent G. max cultivars.An annotation of the G. max probe sets (Fig. 5) aided vari-ous aspects of our analysis.
Probe sets measured induced and suppressed transcriptabundance at 12 hpi (deWned here as the migration phase),3 and 8 dpi (Fig. 6a–d). The comparisons were madeagainst a mock-inoculated reference sample. Two classes oftime point comparisons were performed after the diVeren-tially expressed genes at each time point in the I and Ctime-series microarrays were identiWed. These two compar-isons are (1) intra-response that analyzes only I or C reac-tions (Fig. 6) and (2) inter-response that compare I and Creactions (Fig. 7). These analyses focus on two types ofdiVerentially expressed probe sets, (1) unique and (2) com-mon. Unique probe sets are deWned as those that are diVer-entially expressed and found in only one time point for aparticular comparison. Common probe sets are deWned as
Fig. 3 Glycine max cv. Peking seedlings were inoculated with I or CH. glycines J2 nematodes. Roots were harvested at 12 hpi, 3 and 8 dpi.a Image of Peking infected with I nematodes at 12 hpi. b Image of Pe-king infected with C nematodes at 12 hpi. c Image of Peking infectedwith I nematodes at 3 dpi. Region of syncytium formation is shown(white arrows). Details of developing syncytia are shown in Fig. 4a. dImage of Peking infected with C nematodes at 8 dpi. Region of syncy-tium formation is shown (white arrows). Details of developing syncy-tia are shown in Fig. 4b. e Image of Peking infected with I nematodesat 8 dpi. Region of syncytium formation is shown (white arrows). De-tails of developing syncytia are shown in Fig. 4c. f Image of Peking in-fected with C nematodes at 8 dpi. Region of syncytium formation isshown (white arrows). Details of developing syncytia are shown inFig. 4d. (Bar 500 �m)
Fig. 4 Glycine max cv. Peking seedlings were inoculated with I or C H. glycines J2 nematodes. Roots were harvested at 12 hpi, 3 and 8 dpi; a 3 dpi Peking in-fected with I, black arrow syn-cytium; white arrowhead nematode (bar 50 �m); b 3 dpi Peking infected with C, black arrow syncytium; white arrow-head nematode (bar 50 �m); c 8 dpi Peking infected with I, black arrow syncytium; white arrowhead nematode syncytium (bar 100 �m); d 8 dpi Peking infected with C, black arrow syncytium (bar 100 �m)
123

Planta (2007) 226:1423–1447 1429
those that are diVerentially expressed and overlap at multi-ple time points. Common probe sets can also overlapbetween I and C reactions, depending on the comparison.
Our analysis began with the intra-response analysis(Fig. 6a–d). The MA identiWed probe sets measuringinduced transcript abundance for the individual I (Fig. 6a)and C (Fig. 6b) time points. The MA also identiWed probe
sets measuring suppressed transcript abundance for theindividual I (Fig. 6c) and C (Fig. 6d) time points.
MA identiWed a change in the quantity of probe sets ateach time point during both I and C (Fig. 6). The singletime point MA presented in Fig. 6 was used to identifycommon probe sets diVerentially expressed at all timepoints in a single response. MA identiWed 339 probe setsmeasuring induced transcript levels in I at 12 hpi, 3 and8 dpi (Fig. 6a). Select induced genes common to I at 12 hpi,3 and 8 dpi (Fig. 6a) are enhanced disease resistance pro-tein 1 (EDS1), intracellular pathogenesis related protein 10(PR10-like protein), S-adenosyl-L-methionine:carboxylmethyltransferase family protein and hevein-like protein(HEL).
MA identiWed 740 probe sets measuring suppressed tran-script levels in I at 12 hpi, 3 and 8 dpi (Fig. 6b). Amongthese suppressed genes in I were genes encoding fasciclin-like arabinogalactan-protein (FLA6), multi-copper oxidasetype I family protein, peroxidase, lipid transfer protein(LTP) family protein and a pectinesterase family protein.
MA identiWed 181 probe sets measuring induced tran-script levels in C at 12 hpi, 3 and 8 dpi (Fig. 6c). Selectinduced genes common to C at 12 hpi, 3 and 8 dpi includedchitinase, PR10-like protein, germin, cytochrome P450 pro-tein, S-adenosyl-L-methionine and a carboxyl methyltrans-ferase family protein.
MA identiWed 491 probe sets measuring suppressed tran-script levels in C at 12 hpi, 3 and 8 dpi (Fig. 6d). Select
Fig. 5 Functional categorization of the probe sets present on theAVymetrix® Genechip® microarray
Fig. 6 Venn diagrams depicting the numbers of probe sets measuringdiVerential expression in G. max roots during I and C reactions. Thesize of the circles is not relative to of the quantity of probe sets, respec-tively. Overlapping areas represent probe sets common between timepoints. A fold change with absolute value > +1.5 and having a P-value · 0.05 was used for our analyses. Details can be found in thematerials section. a Probe sets measuring diVerentially expressed in-duced transcript abundance in I. b Probe sets measuring diVerentiallyexpressed suppressed transcript abundance in I. c Probe sets measuringdiVerentially expressed induced transcript abundance in C. d Probesets measuring diVerentially expressed suppressed transcript abun-dance in C
Fig. 7 Venn diagrams depicting the numbers of probe sets measuringdiVerentially expressed transcripts in G. max roots during I and C reac-tions at their respective time point. The size of the circles is not relativeto the quantity of probe sets, respectively. Overlapping areas representprobe sets common to the I and C reaction. A fold change with absolutevalue > +1.5 and having a P-value · 0.05 cutoV was used for our anal-yses. Details can be found in the materials section; a 12 hpi induced;b 12 hpi suppressed; c 3 dpi induced; d 3 dpi suppressed; e 8 dpiinduced; f 8 dpi suppressed
123

1430 Planta (2007) 226:1423–1447
suppressed genes common to C at 12 hpi, 3 and 8 dpiincluded those encoding a glutaredoxin family protein,oleosin, reticulon family protein, 2-oxoglutarate-dependentdioxygenase, zinc Wnger (CCCH-type) family protein and achloride channel protein.
We then compared the probe sets measuring inducedtranscript levels at 12 hpi, 3 and 8 dpi in I (N = 339)(Fig. 6a) with those induced in C at 12 hpi, 3 and 8 dpi(N = 181) (Fig. 6c). MA identiWed 62 probe sets measuringinduced transcript levels at 12 hpi, 3 and 8 dpi that werecommon to I and C. These probe sets represented genesencoding PR10, several peroxidases, several chalcone syn-thases, WRKY transcription factors and cytochrome P450.Notably absent in this common set of genes expressed inboth I and C were TIR-NBS-LRR protein kinases involvedin the defense response (Supplemental Table 1).
The relatively low quantity of induced probe sets com-mon between the 12 hpi, 3 and 8 dpi I and C reactions pre-sented above indicated that most of the probe sets wereunique to the I or C response. MA identiWed 277 probe sets(of the 339 Fig. 6a) measuring induced transcript levels at12 hpi, 3 and 8 dpi that were unique to I. These probe setsrepresented several TIR-NBS-LRR protein kinases, extra-cellular dermal glycoprotein, numerous WRKY transcrip-tion factors, cytochrome P450 protein and Kunitz trypsininhibitor (KTI) (Supplemental Table 2). MA identiWed 119probe sets (of the 181 Fig. 6c) measuring induced transcriptlevels at 12 hpi, 3 and 8 dpi that were unique to C. Theseprobe sets corresponded to genes encoding numerous per-oxidases, one WRKY transcription factor and 12-oxophyto-dienoate reductase (OPR) 3. Again, TIR-NBS-LRR proteinkinases were notably absent in C (Supplemental Table 3).The relatively low quantity of probe sets common betweenI and C and measuring induced diVerential expression isconsistent with shifts from one type (i.e. housekeeping) toanother type of gene expression (i.e. defense and energymetabolism) occurring during the course of infection(Scheideler et al. 2001). Complete probe set lists for analy-ses represented in Figs. 5 and 6 are provided as supplemen-tal data.
Probe sets measuring suppressed transcript levels werethe most prevalent in both I (N = 6,377, »17% of totalprobe sets on the microarray) and C (N = 8,061, »21.5% oftotal probe sets on the microarray). The quantity of sup-pressed probe sets unique to a single time point in I tendedto decrease over time (12 hpi, N = 1,660 probe sets; 3 dpi,N = 1,356 probe sets; 8 dpi, N = 804 probe sets). The quan-tity of suppressed probe sets unique to a single time point inC increased over time (12 hpi, N = 697 probe sets; 3 dpi,N = 1,041 probe sets; 8 dpi, N = 4,048 probe sets). Wenoted approximately Wvefold more suppressed probe sets(N = 4,048) that were unique to 8 dpi in C as compared to I(N = 804). Complete probe set lists for the analyses repre-
sented in Figs. 5, 6, 7, 8, 9, 10, 11, 12, 13 are provided assupplemental data.
Single time point MA compares probe sets unique to I and C reactions
Venn diagrams compare the quantity of probe sets thatmeasured diVerential expression for I and C at 12 hpi, 3 and8 dpi (Fig. 7a–f). The quantity of induced (Fig. 7a) and sup-pressed (Fig. 7b) I and C probe sets at 12 hpi are presented.MA identiWed probe sets measuring induced expressionthat is unique to I (N = 1,080) and C (N = 899) (Fig. 7a).MA identiWed probe sets measuring elevated transcript lev-els of components of the phenylpropanoid pathway in bothI and C at 12 hpi (Supplemental Table 4). MA also mea-sured elevated transcript levels of many genes associatedwith a response by plants to various pathogens. Theseprobe sets are PR1, ACC oxidase, KTI, EDS1, someWRKY transcription factors, one TIR-NBS LRR kinaseand some peroxidases. Probe sets measured elevatedexpression levels for transcripts unique to I at 12 hpi(Fig. 7a, Supplemental Table 5). These probe sets includednumerous NBS-LRR and LRR gene family members,numerous kinases, transcription factors related to the noapical meristem (NAM) gene family, a large group ofWRKY transcription factors, C2H2, C3H4, CCCH andFYVE-type transcription factors and regulator of chromo-some condensation (RCC1). Probe sets measured elevatedexpression levels for transcripts unique to C at 12 hpi(Fig. 7a, Supplemental Table 6). These probe sets that areunique to C at 12 hpi include cellulose synthase, glucan1,3-beta-glucosidase precursor, numerous peroxidases,OPR and several disease resistance dirigent proteins. TheseMA show that substantially more kinase probe sets measureinduced transcript levels in I than C at 12 hpi. Whilenumerous WRKY transcription factor probe sets were iden-tiWed in I, only one probe set unique to C was observed at12 hpi. Peroxidase probe sets that measured induced tran-script abundance were relatively scarce in I as compared toC. The analyses of suppressed probe sets present at 12 hpiin I and C reactions were also identiWed (Fig. 7b), identify-ing probe sets unique to I (N = 2,758) or C (N = 1,483).These MA results reveal diVerences in probe set abundanceas a result of infection by I and C nematodes by 12 hpi.
Comparative analyses of induced (Fig. 7c) and sup-pressed (Fig. 7d) probe sets at 3 dpi are presented. Wefocus on probe sets measuring induced transcript levels.MA identiWed »13.1 fold more probe sets with inducedtranscript expression levels present in I (N = 2,030) than C(N = 155) at 3 dpi (Fig. 7c). Many gene families would beexpected to be absent at 3 dpi in C because of the relativepaucity of probe sets measuring induced transcript levels atthat time point. Transcription factor probe sets measuring
123

Planta (2007) 226:1423–1447 1431
induced transcript levels at 12 hpi in I were also well repre-sented in I at 3 dpi. Those transcription factors includeWRKY, AP2, basic helix–loop–helix, myb and C2H2,C3HC4, CCCH, GATA-type zinc Wngers in addition toNAM and scarecrow-like transcription factors. Numerouskinase probe sets measured induced transcript levels in I at3 dpi. These probe sets include many TIR-NBS-LRR andother LRR receptor-like kinases that are not present in C at3 dpi (Supplemental Table 7). A substantial amount ofprobe sets measuring suppressed transcript levels werepresent in both I and C at 3 dpi (Fig. 7d). MA identiWednumerous probe sets measuring suppressed transcript levelsthat are unique to I (N = 3,149) or C (N = 2,290) at 3 dpi(Fig. 7d).
Comparative analyses of induced (Fig. 7e) and sup-pressed (Fig. 7f) probe sets at 8 dpi are presented. We Wrstfocus on probe sets measuring induced transcript levels.MA identiWed »3.1 fold more induced transcripts in I(N = 1,249) than C (N = 409) at 8 dpi (Fig. 7e). Many genefamilies would be expected to be absent in C at 8 dpibecause of the relative scarcity of probe sets measuringinduced transcript levels. Many of the kinase and transcrip-tion factor probe sets measuring induced transcript levels at12 hpi and 3 dpi in I, and not well represented in C at anytime point, measure induced transcript levels at 8 dpi in I.MA also identiWed probe sets measuring induced transcriptlevels at the 8 dpi time point that are not well represented at12 and 3 dpi I or in any time point in C. MA identiWedprobe sets measuring induced transcript levels of severalheat shock proteins (HSPs) and genes involved in energymetabolism at 8 dpi in I (Supplemental Table 8). Theseprobe sets did not measure induced transcript abundance inC and were not well represented in I at 12 hpi and 3 dpi.MA identiWed a substantial amount of probe sets that areunique to I (N = 1,922) or C (N = 5,209) at 8 dpi and mea-suring suppressed transcript levels (Fig. 7f).
Single time point MA compares probe sets common to I and C reactions
MA identiWed probe sets that are common to I and C at12 hpi (N = 378 Fig. 7a), 3 dpi (N = 349 Fig. 7c), and 8 dpi(N = 390 Fig. 7e) that measured induced transcript levels.These quantities are similar over time. MA identiWed probesets that are common to I and C at 12 hpi (N = 420 Fig. 7b),3 dpi (N = 515 Fig. 7d), and 8 dpi (N = 910 Fig. 7f) mea-suring suppressed transcript levels. These quantitiesincrease over time, especially between 3 and 8 dpi. Thesedata demonstrate that an underlying core response by G.max to H. glycines infection is present at each time pointduring I and C. The amplitude of many of the probe setsmeasuring suppressed transcript levels at 12 hpi is greaterin I than C. For example, the probe set measuring the most
suppressed transcript level at 12 hpi in I, a peroxidase(AW310249), exhibits a fold suppression of ¡57.11 (P-value of 0.000058) while in C it exhibits a fold suppressionof ¡1.72184 (P-value of 0.049162). We did not observeprobe sets measuring suppressed transcript levels of morethan tenfold in C at 12 hpi.
Categorization of probe sets identiWed in the single time point MA
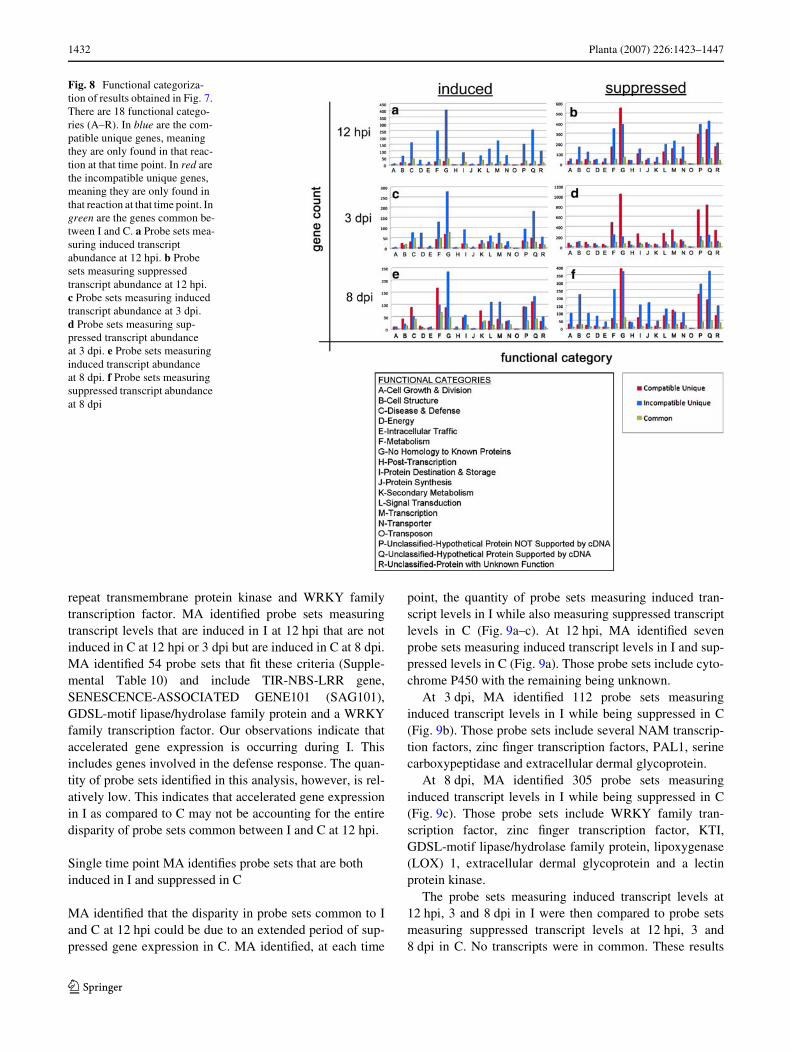
We further analyzed the probe sets previously identiWed inthe single time point analyses (Fig. 7a–f). Those categoriza-tions (Fig. 8a–f) are the companion to Fig. 7a–f and reveal,on a global scale, the genes experiencing diVerentialexpression as a consequence of an I or C reaction. Thoseanalyses revealed many diVerences between the types ofgenes expressed during an I or C reaction at diVerent stagesof infection. For example, we noted a substantial diVerencein the number of probe sets measuring increased transcriptabundance in I for the following categories; Disease andDefense, Metabolism, Protein Destination and Storage, Sig-nal Transduction and Transcription as compared to C in the12 hpi samples (Fig. 8a). DiVerences in the quantities ofvarious groups were also noted in probe sets measuringsuppressed transcript abundance at 12 hpi (Fig. 8b). DiVer-ences in the quantities of various groups were also noted inprobe sets measuring induced (Fig. 8c) and suppressed(Fig. 8d) transcript abundance at 3 dpi. We also observedrelatively more Metabolism probe sets in C that measuredincreased transcript abundance than I in the 8 dpi samples(Fig. 8e). However, we also observed relatively more probesets in I that measured suppressed transcript abundancethan C in the 8 dpi samples (Fig. 8f). The paucity of com-mon probe sets demonstrate the I and C reactions are verydiVerent as early as 12 hpi. The annotations of the probesets permitted us to identify numerous genes common to Iand C. Complete probe set lists for analyses represented inFigs. 7 and 8 are provided as supplemental data.
Single time point MA identify accelerated expression during I between time points
Both accelerated gene expression and shifts from the induc-tion of housekeeping genes to the induction of defense andenergy metabolism gene expression accounts for changes ingene expression over time. This means that genes importantto I experience enhanced transcriptional activity more rap-idly (earlier) during I than C. MA identiWed probe sets mea-suring induced transcript levels in I at 12 hpi that are notinduced in C at 12 hpi, but are induced in C at 72 hpi. Only32 probe sets Wt these criteria (Supplemental Table 9) andinclude a glycosyl hydrolase family 1 protein, class IVchitinase, KTI, cytochrome P450 family protein, leucine-rich
123
1432 Planta (2007) 226:1423–1447
repeat transmembrane protein kinase and WRKY familytranscription factor. MA identiWed probe sets measuringtranscript levels that are induced in I at 12 hpi that are notinduced in C at 12 hpi or 3 dpi but are induced in C at 8 dpi.MA identiWed 54 probe sets that Wt these criteria (Supple-mental Table 10) and include TIR-NBS-LRR gene,SENESCENCE-ASSOCIATED GENE101 (SAG101),GDSL-motif lipase/hydrolase family protein and a WRKYfamily transcription factor. Our observations indicate thataccelerated gene expression is occurring during I. Thisincludes genes involved in the defense response. The quan-tity of probe sets identiWed in this analysis, however, is rel-atively low. This indicates that accelerated gene expressionin I as compared to C may not be accounting for the entiredisparity of probe sets common between I and C at 12 hpi.
Single time point MA identiWes probe sets that are both induced in I and suppressed in C
MA identiWed that the disparity in probe sets common to Iand C at 12 hpi could be due to an extended period of sup-pressed gene expression in C. MA identiWed, at each time
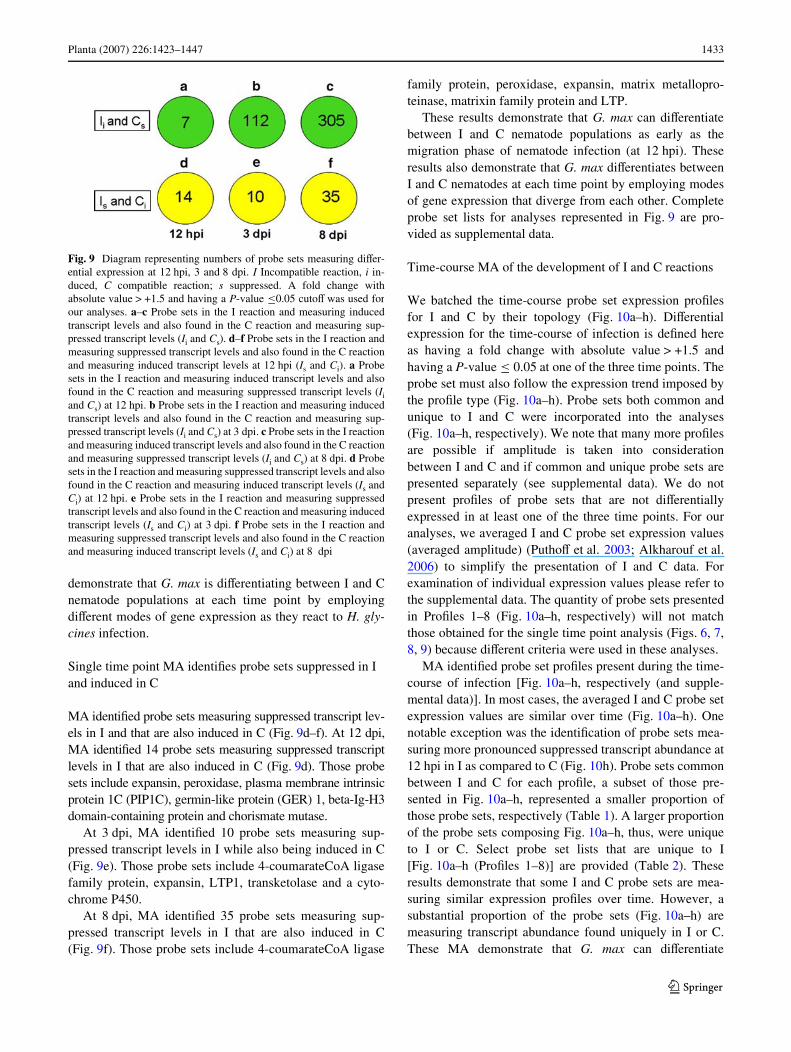
point, the quantity of probe sets measuring induced tran-script levels in I while also measuring suppressed transcriptlevels in C (Fig. 9a–c). At 12 hpi, MA identiWed sevenprobe sets measuring induced transcript levels in I and sup-pressed levels in C (Fig. 9a). Those probe sets include cyto-chrome P450 with the remaining being unknown.
At 3 dpi, MA identiWed 112 probe sets measuringinduced transcript levels in I while being suppressed in C(Fig. 9b). Those probe sets include several NAM transcrip-tion factors, zinc Wnger transcription factors, PAL1, serinecarboxypeptidase and extracellular dermal glycoprotein.
At 8 dpi, MA identiWed 305 probe sets measuringinduced transcript levels in I while being suppressed in C(Fig. 9c). Those probe sets include WRKY family tran-scription factor, zinc Wnger transcription factor, KTI,GDSL-motif lipase/hydrolase family protein, lipoxygenase(LOX) 1, extracellular dermal glycoprotein and a lectinprotein kinase.
The probe sets measuring induced transcript levels at12 hpi, 3 and 8 dpi in I were then compared to probe setsmeasuring suppressed transcript levels at 12 hpi, 3 and8 dpi in C. No transcripts were in common. These results
Fig. 8 Functional categoriza-tion of results obtained in Fig. 7. There are 18 functional catego-ries (A–R). In blue are the com-patible unique genes, meaning they are only found in that reac-tion at that time point. In red are the incompatible unique genes, meaning they are only found in that reaction at that time point. In green are the genes common be-tween I and C. a Probe sets mea-suring induced transcript abundance at 12 hpi. b Probe sets measuring suppressed transcript abundance at 12 hpi. c Probe sets measuring induced transcript abundance at 3 dpi. d Probe sets measuring sup-pressed transcript abundance at 3 dpi. e Probe sets measuring induced transcript abundance at 8 dpi. f Probe sets measuring suppressed transcript abundance at 8 dpi
123
Planta (2007) 226:1423–1447 1433
demonstrate that G. max is diVerentiating between I and Cnematode populations at each time point by employingdiVerent modes of gene expression as they react to H. gly-cines infection.
Single time point MA identiWes probe sets suppressed in I and induced in C
MA identiWed probe sets measuring suppressed transcript lev-els in I and that are also induced in C (Fig. 9d–f). At 12 dpi,MA identiWed 14 probe sets measuring suppressed transcriptlevels in I that are also induced in C (Fig. 9d). Those probesets include expansin, peroxidase, plasma membrane intrinsicprotein 1C (PIP1C), germin-like protein (GER) 1, beta-Ig-H3domain-containing protein and chorismate mutase.
At 3 dpi, MA identiWed 10 probe sets measuring sup-pressed transcript levels in I while also being induced in C(Fig. 9e). Those probe sets include 4-coumarateCoA ligasefamily protein, expansin, LTP1, transketolase and a cyto-chrome P450.
At 8 dpi, MA identiWed 35 probe sets measuring sup-pressed transcript levels in I that are also induced in C(Fig. 9f). Those probe sets include 4-coumarateCoA ligase
family protein, peroxidase, expansin, matrix metallopro-teinase, matrixin family protein and LTP.
These results demonstrate that G. max can diVerentiatebetween I and C nematode populations as early as themigration phase of nematode infection (at 12 hpi). Theseresults also demonstrate that G. max diVerentiates betweenI and C nematodes at each time point by employing modesof gene expression that diverge from each other. Completeprobe set lists for analyses represented in Fig. 9 are pro-vided as supplemental data.
Time-course MA of the development of I and C reactions
We batched the time-course probe set expression proWlesfor I and C by their topology (Fig. 10a–h). DiVerentialexpression for the time-course of infection is deWned hereas having a fold change with absolute value > +1.5 andhaving a P-value · 0.05 at one of the three time points. Theprobe set must also follow the expression trend imposed bythe proWle type (Fig. 10a–h). Probe sets both common andunique to I and C were incorporated into the analyses(Fig. 10a–h, respectively). We note that many more proWlesare possible if amplitude is taken into considerationbetween I and C and if common and unique probe sets arepresented separately (see supplemental data). We do notpresent proWles of probe sets that are not diVerentiallyexpressed in at least one of the three time points. For ouranalyses, we averaged I and C probe set expression values(averaged amplitude) (PuthoV et al. 2003; Alkharouf et al.2006) to simplify the presentation of I and C data. Forexamination of individual expression values please refer tothe supplemental data. The quantity of probe sets presentedin ProWles 1–8 (Fig. 10a–h, respectively) will not matchthose obtained for the single time point analysis (Figs. 6, 7,8, 9) because diVerent criteria were used in these analyses.
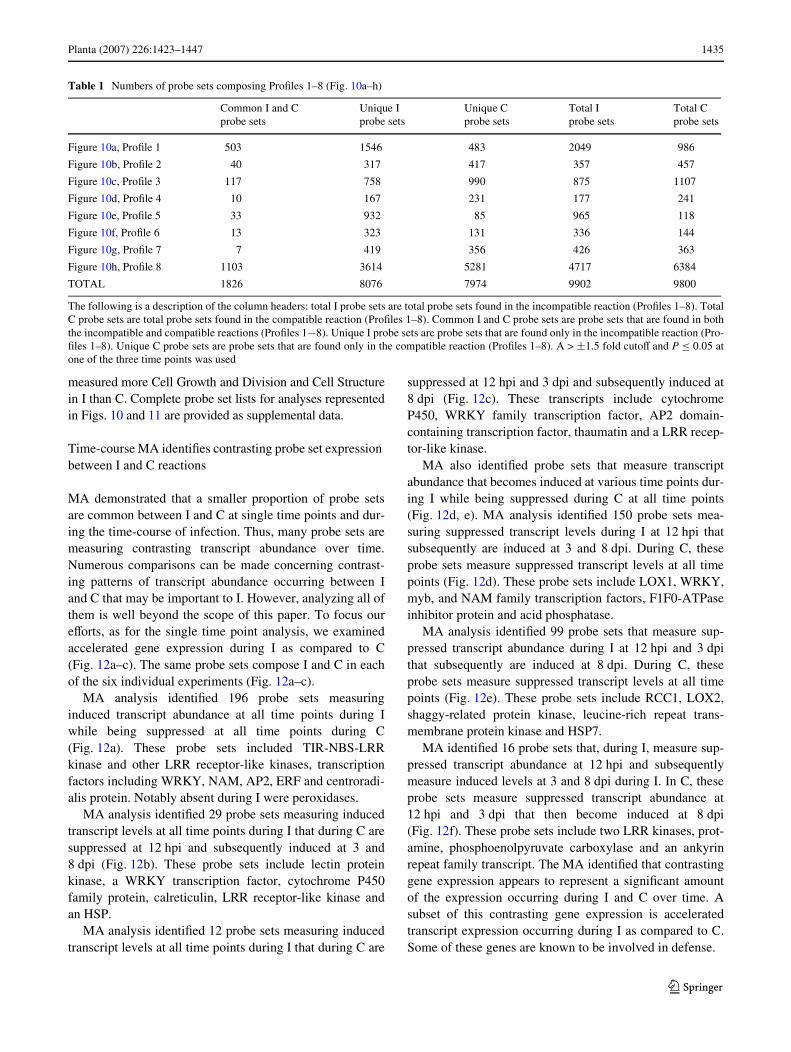
MA identiWed probe set proWles present during the time-course of infection [Fig. 10a–h, respectively (and supple-mental data)]. In most cases, the averaged I and C probe setexpression values are similar over time (Fig. 10a–h). Onenotable exception was the identiWcation of probe sets mea-suring more pronounced suppressed transcript abundance at12 hpi in I as compared to C (Fig. 10h). Probe sets commonbetween I and C for each proWle, a subset of those pre-sented in Fig. 10a–h, represented a smaller proportion ofthose probe sets, respectively (Table 1). A larger proportionof the probe sets composing Fig. 10a–h, thus, were uniqueto I or C. Select probe set lists that are unique to I[Fig. 10a–h (ProWles 1–8)] are provided (Table 2). Theseresults demonstrate that some I and C probe sets are mea-suring similar expression proWles over time. However, asubstantial proportion of the probe sets (Fig. 10a–h) aremeasuring transcript abundance found uniquely in I or C.These MA demonstrate that G. max can diVerentiate
Fig. 9 Diagram representing numbers of probe sets measuring diVer-ential expression at 12 hpi, 3 and 8 dpi. I Incompatible reaction, i in-duced, C compatible reaction; s suppressed. A fold change withabsolute value > +1.5 and having a P-value ·0.05 cutoV was used forour analyses. a–c Probe sets in the I reaction and measuring inducedtranscript levels and also found in the C reaction and measuring sup-pressed transcript levels (Ii and Cs). d–f Probe sets in the I reaction andmeasuring suppressed transcript levels and also found in the C reactionand measuring induced transcript levels at 12 hpi (Is and Ci). a Probesets in the I reaction and measuring induced transcript levels and alsofound in the C reaction and measuring suppressed transcript levels (Iiand Cs) at 12 hpi. b Probe sets in the I reaction and measuring inducedtranscript levels and also found in the C reaction and measuring sup-pressed transcript levels (Ii and Cs) at 3 dpi. c Probe sets in the I reactionand measuring induced transcript levels and also found in the C reactionand measuring suppressed transcript levels (Ii and Cs) at 8 dpi. d Probesets in the I reaction and measuring suppressed transcript levels and alsofound in the C reaction and measuring induced transcript levels (Is andCi) at 12 hpi. e Probe sets in the I reaction and measuring suppressedtranscript levels and also found in the C reaction and measuring inducedtranscript levels (Is and Ci) at 3 dpi. f Probe sets in the I reaction andmeasuring suppressed transcript levels and also found in the C reactionand measuring induced transcript levels (Is and Ci) at 8 dpi
123

1434 Planta (2007) 226:1423–1447
between I and C nematode populations during the time-course of infection.
Categorization of probe sets identiWed in the time-course MA
We further analyzed the probe sets identiWed in the time-course MA (Fig. 10a–h). Those categorizations (Fig. 11a–h)are the companion to Fig. 10a–h and reveal, on a global
scale, the genes experiencing diVerential expression as a con-sequence of an I or C reaction for ProWles 1–8. For example,ProWle 1 (Fig. 10a) shows a substantial diVerence in the num-ber of probe sets measuring induced transcript abundance atall time points for genes categorized in the Disease andDefense, Signal Transduction and Transcription bins(Fig. 11a). Those analyses revealed many other diVerencesbetween the types of genes expressed during an I or C reac-tion (Fig. 11b–h). Notably, for ProWle 7 (Fig. 11g), probe sets
Fig. 10 Probe sets having similar topologies between I and C overtime. Eight diVerential expression proWles for G. max probe sets iden-tiWed by MA of whole roots infected with I (in blue) or C (in red). Theexpression proWles depict trend over time. The time points selectedwere 12 hpi, 3 and 8 dpi. The probe sets presented are those measuringdiVerential expression for at least one of the three time points per pro-Wle. The time point is provided on the x-axis. The y-axis values are thefold change of the test sample versus the control (test/control). Theexpression proWles are presented as an average value of all probe setsWtting the expression criterion imposed by each proWle. The averagefold change is obtained by summing all of the fold change values forall of the transcripts and dividing by the number of probe sets presentin each proWle. The number (N) of probe sets common and unique to Iand C is provided in Table 2. The y-axis values are the fold change ofthe test sample versus the control (test/control). a (ProWle 1), probe setsmeasure induced transcript abundance at the 12 hpi, 3 and 8 dpi time
points. b (ProWle 2), probe sets measuring transcript abundance that isinduced at the 12 hpi and 3 dpi time points and suppressed at the 8 dpitime point. c (ProWle 3), probe sets measuring transcript abundance thatis induced at the 12 hpi time point and suppressed at the 3 and 8 dpitime points. d (ProWle 4), probe sets measuring transcript abundancethat is induced at the 12 hpi time point suppressed at the 3 dpi timepoint and induced at the 8 dpi time point. e (ProWle 5), probe sets mea-suring transcript abundance that is suppressed at the 12 hpi time pointand induced at the 3 and 8 dpi time points. f (ProWle 6), probe sets mea-suring transcript abundance that is suppressed at the 12 hpi and 3 dpitime points and induced at the 8 dpi time point. g (ProWle 7), probe setsmeasuring transcript abundance that is suppressed at the 12 hpi timepoint, induced at the 3 dpi time point and suppressed at the 8 dpi timepoint. h (ProWle 8), probe sets measuring transcript abundance that issuppressed at the 12 hpi, 3 and 8 dpi time points
123
Planta (2007) 226:1423–1447 1435
measured more Cell Growth and Division and Cell Structurein I than C. Complete probe set lists for analyses representedin Figs. 10 and 11 are provided as supplemental data.
Time-course MA identiWes contrasting probe set expression between I and C reactions
MA demonstrated that a smaller proportion of probe setsare common between I and C at single time points and dur-ing the time-course of infection. Thus, many probe sets aremeasuring contrasting transcript abundance over time.Numerous comparisons can be made concerning contrast-ing patterns of transcript abundance occurring between Iand C that may be important to I. However, analyzing all ofthem is well beyond the scope of this paper. To focus oureVorts, as for the single time point analysis, we examinedaccelerated gene expression during I as compared to C(Fig. 12a–c). The same probe sets compose I and C in eachof the six individual experiments (Fig. 12a–c).
MA analysis identiWed 196 probe sets measuringinduced transcript abundance at all time points during Iwhile being suppressed at all time points during C(Fig. 12a). These probe sets included TIR-NBS-LRRkinase and other LRR receptor-like kinases, transcriptionfactors including WRKY, NAM, AP2, ERF and centroradi-alis protein. Notably absent during I were peroxidases.
MA analysis identiWed 29 probe sets measuring inducedtranscript levels at all time points during I that during C aresuppressed at 12 hpi and subsequently induced at 3 and8 dpi (Fig. 12b). These probe sets include lectin proteinkinase, a WRKY transcription factor, cytochrome P450family protein, calreticulin, LRR receptor-like kinase andan HSP.
MA analysis identiWed 12 probe sets measuring inducedtranscript levels at all time points during I that during C are
suppressed at 12 hpi and 3 dpi and subsequently induced at8 dpi (Fig. 12c). These transcripts include cytochromeP450, WRKY family transcription factor, AP2 domain-containing transcription factor, thaumatin and a LRR recep-tor-like kinase.
MA also identiWed probe sets that measure transcriptabundance that becomes induced at various time points dur-ing I while being suppressed during C at all time points(Fig. 12d, e). MA analysis identiWed 150 probe sets mea-suring suppressed transcript levels during I at 12 hpi thatsubsequently are induced at 3 and 8 dpi. During C, theseprobe sets measure suppressed transcript levels at all timepoints (Fig. 12d). These probe sets include LOX1, WRKY,myb, and NAM family transcription factors, F1F0-ATPaseinhibitor protein and acid phosphatase.
MA analysis identiWed 99 probe sets that measure sup-pressed transcript abundance during I at 12 hpi and 3 dpithat subsequently are induced at 8 dpi. During C, theseprobe sets measure suppressed transcript levels at all timepoints (Fig. 12e). These probe sets include RCC1, LOX2,shaggy-related protein kinase, leucine-rich repeat trans-membrane protein kinase and HSP7.
MA identiWed 16 probe sets that, during I, measure sup-pressed transcript abundance at 12 hpi and subsequentlymeasure induced levels at 3 and 8 dpi during I. In C, theseprobe sets measure suppressed transcript abundance at12 hpi and 3 dpi that then become induced at 8 dpi(Fig. 12f). These probe sets include two LRR kinases, prot-amine, phosphoenolpyruvate carboxylase and an ankyrinrepeat family transcript. The MA identiWed that contrastinggene expression appears to represent a signiWcant amountof the expression occurring during I and C over time. Asubset of this contrasting gene expression is acceleratedtranscript expression occurring during I as compared to C.Some of these genes are known to be involved in defense.
Table 1 Numbers of probe sets composing ProWles 1–8 (Fig. 10a–h)
The following is a description of the column headers: total I probe sets are total probe sets found in the incompatible reaction (ProWles 1–8). TotalC probe sets are total probe sets found in the compatible reaction (ProWles 1–8). Common I and C probe sets are probe sets that are found in boththe incompatible and compatible reactions (ProWles 1¡8). Unique I probe sets are probe sets that are found only in the incompatible reaction (Pro-Wles 1–8). Unique C probe sets are probe sets that are found only in the compatible reaction (ProWles 1–8). A > §1.5 fold cutoV and P · 0.05 atone of the three time points was used
Common I and C probe sets
Unique I probe sets
Unique C probe sets
Total I probe sets
Total C probe sets
Figure 10a, ProWle 1 503 1546 483 2049 986
Figure 10b, ProWle 2 40 317 417 357 457
Figure 10c, ProWle 3 117 758 990 875 1107
Figure 10d, ProWle 4 10 167 231 177 241
Figure 10e, ProWle 5 33 932 85 965 118
Figure 10f, ProWle 6 13 323 131 336 144
Figure 10g, ProWle 7 7 419 356 426 363
Figure 10h, ProWle 8 1103 3614 5281 4717 6384
TOTAL 1826 8076 7974 9902 9800
123

1436 Planta (2007) 226:1423–1447
Tab
le2
Sele
ct p
robe
set
s li
sts
that
are
diV
eren
tiall
y ex
pres
sed
and
uniq
ue to
I f
or P
roW
les
1–8
(Fig
.10a
–h)
Hom
olog
Pu
blic
ID
FC-I
(12
hpi)
PV
-I (
12hp
i)FC
-I (
3dp
i)PV
-I (
3dp
i)FC
-I (
8dp
i)P
V-I
(8
dpi)
Fig
ure
10a,
ProW
le 1
TIR
-NB
S-L
RR
cla
ssB
F42
4069
2.92
6216
0.00
8181
567
2.10
2507
0.00
1060
669
1.63
7476
0.00
4363
456
Kun
itz f
amily
pro
tein
BQ
0800
418.
6061
020.
1053
6009
824
.769
755
1.00
E–0
076.
6699
271.
36E
–006
Cys
tein
e pr
otea
se in
hibi
tor
CD
4044
171.
5719
960.
2999
1555
22.
1763
90.
0112
2862
52.
8976
730.
0034
1716
5
Ext
race
llul
ar d
erm
al g
lyco
prot
ein
BM
1431
645.
3959
260.
0224
2142
124
.042
183
5.87
E–0
054.
6119
910.
0041
9710
5
Non
-rac
e sp
eciW
c di
seas
e re
sist
ance
pro
tein
(N
DR
1)B
U57
8044
3.03
8985
0.05
0654
435
4.24
1689
0.00
1289
695
1.52
5641
0.06
4817
954
Path
ogen
esis
-rel
ated
thau
mat
in f
amily
pro
tein
CF
8062
631.
3707
660.
3704
6648
43.
2637
580.
0002
6305
221
.844
413
1.36
E–0
06
Cyt
ochr
ome
P450
fam
ily
prot
ein
BU
5793
094.
7259
660.
0922
4685
25.
3831
710.
0001
8037
84.
8796
0.00
0440
374
No
apic
al m
eris
tem
(N
AM
) B
I892
702
2.71
2995
0.04
3328
904
2.17
7537
0.01
1963
489
1.52
9321
0.16
5975
663
WR
KY
fam
ily
tran
scri
ptio
n fa
ctor
BI9
6791
214
.263
156
0.00
0247
884
6.95
5795
0.00
2574
715
2.14
3659
0.00
8714
959
Bet
a-fr
ucto
sida
se (
BF
RU
CT
1)
CF
8058
963.
2763
530.
0108
4598
24.
7020
247.
53E
–007
1.36
8682
0.01
6087
814
Fig
ure
10b,
ProW
le 2
Pect
ines
tera
se f
amily
pro
tein
BF
0664
111.
4645
960.
4518
7643
12.
3134
550.
0034
2363
5¡
1.53
971
0.04
5513
762
Poly
gala
ctur
onas
e in
hibi
ting
pro
tein
1 (
PG
IP1)
CF
8062
494.
5847
230.
0263
0387
72.
0112
570.
0023
2014
3¡
1.48
699
0.00
9435
831
Ani
onic
per
oxid
ase,
put
ativ
eB
M13
9472
2.47
048
0.46
9884
835
4.86
508
0.00
3922
73¡
1.53
515
0.30
2018
873
Bra
nche
d-ch
ain
amin
o ac
id a
min
otra
nsfe
rase
2
AW
3509
221.
0866
720.
8691
4255
1.83
4284
0.00
2368
387
¡2.
0888
70.
0001
4570
9
L-a
spar
agin
ase
AI9
3072
83.
3598
190.
2704
1761
92.
4924
180.
0351
6630
3¡
2.02
920.
0855
5495
9
UD
P-g
luco
syl t
rans
fera
se
BQ
6105
683.
3727
770.
0175
8187
81.
6296
910.
0320
3319
5¡
1.64
177
0.10
9856
27
Bet
a-am
ylas
e (C
T-B
MY
) B
E05
8913
1.98
9846
0.07
4524
73.
3513
857.
43E
–006
¡1.
6016
70.
0054
2844
Lip
oxyg
enas
e (L
OX
1)C
F80
6819
5.12
2642
0.00
6709
1.27
7027
0.26
4351
318
¡1.
7103
90.
0815
3490
2
Prot
ein
kina
se-r
elat
edA
W70
7170
3.46
1478
0.01
7990
863
1.28
8461
0.03
0983
351
¡1.
5212
80.
0103
0556
5
FAD
-bin
ding
dom
ain-
cont
aini
ng p
rote
inB
M30
8215
1.97
6031
0.40
8725
471
1.68
4219
0.02
5695
339
¡1.
9955
80.
0071
5169
8
Fig
ure
10c,
ProW
le 3
Fasc
iclin
-lik
e ar
abin
ogal
acta
n-pr
otei
n (F
LA
11)
BF
0675
651.
7848
480.
0061
4316
4¡
1.56
951
0.04
5043
84¡
4.55
939
0.00
0495
467
AC
C O
xida
se
BE
4402
662.
5176
680.
1186
8016
9¡
1.51
901
0.03
9425
902
¡2.
9817
20.
0008
2162
2
Cop
per
amin
e ox
idas
e fa
mil
y pr
otei
nB
M88
6830
2.10
2784
0.04
9202
616
¡2.
2422
14.
42E
–005
¡2.
0899
88.
41E
–005
Rec
epto
r-li
ke p
rote
in k
inas
e 4,
put
ativ
e (R
LK
4)B
Q07
9684
3.06
0642
0.00
7751
794
¡1.
3755
0.09
6914
685
¡1.
7071
40.
0142
2951
2
PIT
SL
RE
isof
orm
PB
ET
A21
AW
2344
902.
4299
290.
0055
8465
1¡
1.24
654
0.06
1478
661
¡1.
4043
10.
0106
1778
8
Cal
cium
-bin
ding
pro
tein
, put
ativ
eA
I736
289
1.57
1986
0.01
8962
891
¡1.
3471
0.01
3005
258
¡1.
6926
50.
0008
7475
6
Tri
heli
x D
NA
-bin
ding
pro
tein
, put
ativ
eB
M51
9961
4.15
7761
0.20
8860
146
¡1.
5804
70.
0010
3490
2¡
1.43
541
0.00
3227
533
AB
C1
fam
ily p
rote
inB
F01
0090
2.90
1972
0.27
2009
017
¡1.
5036
60.
0056
0429
2¡
1.72
130.
0015
1287
8
Exp
ansi
n fa
mil
y pr
otei
n (E
XP
R3)
BM
0919
561.
8735
740.
5160
8405
7¡
1.10
532
0.37
8762
951
¡3.
2845
90.
0001
2583
3
Bas
ic h
elix
–loo
p–he
lix
(bH
LH
) pr
otei
n (R
AP¡
1)A
W10
0239
2.51
0786
0.00
5584
02¡
1.18
395
0.11
3649
824
¡1.
4855
50.
0040
8169
7
123

Planta (2007) 226:1423–1447 1437
Tab
le2
cont
inue
d
Hom
olog
Pu
blic
ID
FC-I
(12
hpi)
PV-I
(12
hpi)
FC
-I (
3dp
i)P
V-I
(3
dpi)
FC
-I (
8dp
i)P
V-I
(8
dpi)
Fig
ure
10d,
ProW
le 4
Pero
xida
se, p
utat
ive
CF8
0653
71.
7197
350.
0512
2017
4¡
3.37
424
0.00
0457
204
1.37
5837
0.06
4506
264
Cyt
ochr
ome
P450
fam
ily
prot
ein
BM
5228
262.
3479
570.
0915
9936
6¡
2.96
412
0.01
1125
443
1.51
7604
0.22
7018
75
Glu
tam
ate
synt
hase
(N
AD
H)
AW
3501
181.
2227
150.
1981
9613
9¡
1.58
489
0.00
0940
037
1.15
207
0.19
1868
28
Tet
rach
loro
-p-h
ydro
quin
one
redu
ctiv
e de
halo
gena
seB
U55
0755
1.32
9695
0.11
1078
763
¡1.
5410
60.
0034
6318
71.
1091
910.
4565
7936
4
Lec
tin-r
elat
edB
U54
5923
1.21
4467
0.64
7477
09¡
1.51
665
0.03
9821
587
1.35
1663
0.03
1558
928
Phos
phoe
nolp
yruv
ate
carb
oxyl
ase
kina
seA
Y14
3660
.21.
0273
290.
8096
9614
7¡
1.86
058
0.00
0317
176
2.10
0603
0.00
0372
94
Cry
ptoc
hrom
e 1
apop
rote
in (
CR
Y1)
B
U54
6708
1.22
8312
0.11
6301
599
¡1.
6189
50.
0333
6109
11.
0009
530.
9910
3532
7
MA
DS
-box
pro
tein
(A
GL
9)A
W45
9045
1.59
2059
0.28
5660
657
¡1.
5419
50.
0203
1704
61.
4766
840.
0325
6367
7
RW
P-R
K d
omai
n-co
ntai
ning
pro
tein
BI9
7151
51.
3930
390.
1581
0853
8¡
1.81
581
0.00
3485
282
1.05
9232
0.53
2246
914
Tra
nsm
embr
ane
fam
ily p
rote
inB
M95
4138
1.43
4697
0.19
0436
946
¡1.
4255
70.
0080
0725
51.
6488
910.
0017
2604
5
Fig
ure
10e,
ProW
le 5
Bet
a-ex
pans
in, p
utat
ive
(EX
BP2
)U
0386
0.1
¡6.
5058
20.
1335
9482
812
.182
669
3.61
E–0
063.
2241
237.
25E
–005
Osm
otin
-lik
e pr
otei
n (O
SM34
)B
Q62
8525
¡1.
6723
50.
5929
1305
28.
5766
351.
24E
–005
6.97
4237
7.88
E–0
07
Bas
ic e
ndoc
hiti
nase
AF2
0273
1.1
¡1.
1540
10.
8431
4359
97.
4664
237.
26E
–005
5.73
4369
5.59
E–0
05
Secr
etor
y pr
otei
n, p
utat
ive
CF8
0773
1¡
1.97
192
0.61
1332
782
4.74
5132
0.00
0166
633.
5299
35.
24E
–006
Aci
d ph
osph
atas
e, p
utat
ive
M37
530.
1¡
2.17
569
0.06
7516
047
9.45
9149
1.26
E–0
0710
.702
649
5.91
E–0
08
Shor
t-ch
ain
dehy
drog
enas
eB
U54
9612
¡1.
6053
10.
4624
7942
67.
3227
922.
25E
–005
3.85
7171
9.32
E–0
05
Lip
oxyg
enas
e (L
OX
1)C
F809
316
¡1.
7793
70.
4204
8391
55.
2862
872.
02E
–005
2.79
5063
0.00
1241
153
Pero
xida
seA
F007
211.
1¡
2.40
193
0.66
4057
444.
3456
480.
0056
5781
1.84
1362
0.18
1891
939
Hea
t sho
ck p
rote
in 8
1–1
(HSP
81–1
) B
U55
0606
¡2.
0571
90.
1268
6248
42.
2090
110.
0016
2364
35.
8863
162.
69E
–005
Shor
t-ch
ain
dehy
drog
enas
eB
E65
9080
¡1.
7773
70.
5965
5657
55.
8855
310.
0001
3654
81.
6724
60.
1107
9658
8
Fig
ure
10f,
ProW
le 6
Reg
ulat
or o
f ch
rom
osom
e co
nden
satio
n (R
CC
1)C
D40
1434
¡1.
5339
60.
2685
0520
5¡
1.12
139
0.35
5106
896
1.72
2904
0.00
2854
075
Exp
ansi
nA
I759
701
¡3.
2009
70.
0357
6640
8¡
2.52
954
0.00
5920
021
1.58
5988
0.09
7751
071
Supe
roxi
de d
ism
utas
e (F
e)M
6426
7.1
¡8.
7560
70.
0043
3890
9¡
3.01
564
0.00
7585
219
1.53
2057
0.24
2684
52
Pero
xida
seB
I970
492
¡2.
6110
30.
2395
6590
6¡
8.05
604
0.00
1255
396
3.42
8608
0.05
3647
598
Pero
xida
seB
I273
670
¡1.
2478
80.
6587
6363
1¡
3.01
035
0.01
8719
652
2.80
3128
0.10
7108
715
Gal
actin
ol s
ynth
ase
AW
3065
98¡
1.63
080.
2244
5035
¡1.
2492
20.
4224
3004
23.
0213
780.
0033
1986
3
17.6
kDa
clas
s II
hea
t sho
ck p
rote
in
BU
5500
58¡
4.33
339
0.00
0475
937
¡1.
2694
10.
0370
5334
42.
1043
930.
0009
5823
3
myb
fam
ily tr
ansc
ript
ion
fact
orB
E82
2901
¡3.
3705
0.27
7014
419
¡1.
2198
40.
0530
1563
31.
5549
650.
0014
8866
8
CC
AA
T-b
indi
ng tr
ansc
ript
ion
fact
or
CD
3983
84¡
5.68
588
0.28
8031
864
¡1.
5139
30.
0090
9242
21.
6111
070.
0023
4872
4
bZIP
tran
scri
ptio
n fa
ctor
C
D40
5935
¡3.
1203
10.
3624
1165
1¡
1.08
751
0.39
2404
691.
5469
410.
0020
5632
2
Gib
bere
llin-
regu
late
d fa
mily
pro
tein
CD
4035
81¡
1.98
626
0.03
6449
357
¡8.
0785
95.
22E
–005
1.87
4745
0.00
5011
388
BA
G d
omai
n-co
ntai
ning
pro
tein
BE
8236
52¡
1.67
338
0.04
1452
355
¡1.
5344
0.04
0844
044
1.30
2702
0.13
0990
11
123

1438 Planta (2007) 226:1423–1447
Tab
le2
cont
inue
d
FC
-I F
old
chan
ge-i
ncom
pati
ble
reac
tion,
FC
-C f
old
chan
ge-c
ompa
tibl
e re
actio
n, P
V-I
P-v
alue
-inc
ompa
tible
rea
ctio
n, P
V-C
P-v
alue
-com
patib
le r
eact
ion
Hom
olog
Pu
blic
ID
FC-I
(12
hpi)
PV
-I (
12hp
i)FC
-I (
3dp
i)PV
-I (
3dp
i)FC
-I (
8dp
i)PV
-I (
8dp
i)
Figu
re10
g, P
roW
le 7
Gly
cosy
l hyd
rola
se f
amil
y 3
prot
ein
BI9
7104
0¡
3.17
993
0.31
1228
188
1.85
5306
0.01
1008
543
¡1.
0676
70.
6396
5687
5
Aci
d ph
osph
atas
e su
rviv
al p
rote
in S
urE
BG
3523
58¡
1.84
999
0.00
8773
817
1.63
4245
0.00
1039
847
¡1.
1676
90.
0859
1830
8
Glu
tam
ate
dehy
drog
enas
e 1
(GD
H1)
CF8
0869
1¡
2.51
096
0.37
7326
261
1.67
6035
0.00
8431
061
¡1.
1355
10.
4749
0046
8
Bra
nche
d-ch
ain
amin
o ac
id a
min
otra
nsfe
rase
2
CF8
0797
7¡
2.36
032
0.46
2972
853
1.73
396
0.00
0360
363
¡2.
0451
70.
0001
3310
9
Cyt
idin
e/de
oxyc
ytid
ylat
e de
amin
ase
fam
ily
prot
ein
CF8
0855
9¡
3.14
464
0.39
4434
031.
8255
710.
0002
9383
8¡
1.05
128
0.61
8422
22
Am
inot
rans
fera
se, p
utat
ive
CD
4067
57¡
1.56
457
0.49
3426
518
2.89
6167
0.00
0587
806
¡1.
2497
70.
4140
9730
9
Tw
o-co
mpo
nent
res
pons
ive
regu
lato
rA
W39
5344
¡2.
4650
40.
0011
6134
72.
6369
510.
0001
9640
2¡
1.20
726
0.05
0863
184
No
apic
al m
eris
tem
(N
AM
) fa
mil
y pr
otei
nC
F807
343
¡2.
0003
20.
4761
7353
41.
5212
30.
0020
9737
7¡
1.24
974
0.02
9762
745
Bas
ic h
elix
–loo
p–he
lix (
bHL
H)
fam
ily p
rote
inB
G35
9491
¡2.
3497
60.
0110
8680
71.
5269
340.
0027
1682
7¡
1.06
030.
5848
1525
6
bZIP
tran
scri
ptio
n fa
ctor
fam
ily p
rote
inA
W10
0956
¡1.
6871
40.
6532
7115
21.
7245
780.
0007
5470
6¡
1.08
864
0.39
4731
583
Figu
re10
h, (
ProW
le 8
)
Pect
ines
tera
se f
amily
pro
tein
BI7
0109
3¡
18.8
642
0.00
0399
358
¡6.
6841
53.
04E
–005
¡2.
3888
30.
0022
7510
2
Pero
xida
se, p
utat
ive
BI9
7128
6¡
41.6
4803
0.00
1235
286
¡36
.782
431.
88E
–006
¡2.
2854
50.
0040
5360
7
Ann
exin
, put
ativ
eA
W16
4593
¡13
.360
220.
0097
6454
7¡
10.4
0794
0.00
0121
241
¡1.
9628
30.
0014
5156
1
RN
A r
ecog
niti
on m
otif
(R
RM
)-co
ntai
ning
pro
tein
BI9
6960
2–1
6.60
488
0.00
0289
479
¡14
.186
642.
83E
–005
¡2.
0879
40.
0001
5588
9
Cel
l elo
ngat
ion
prot
ein/
DW
AR
F1/D
IMIN
UT
O (
DIM
)B
M52
1730
¡9.
2669
50.
0090
7283
5¡
4.21
237
9.21
E–0
06¡
2.01
846
0.00
0429
967
Prot
ein
kina
se-r
elat
edB
E02
2051
¡25
.293
720.
0002
5265
¡17
.327
716.
03E
–006
¡1.
9072
70.
0088
5931
3
bHL
H f
amily
pro
tein
BI9
6985
9¡
14.8
4731
0.00
0435
099
¡20
.994
164.
24E
–005
¡2.
2165
77.
51E
–005
Plas
ma
mem
bran
e in
trin
sic
prot
ein
(SIM
IP)
BI9
6859
1¡
12.9
4287
0.00
0484
593
¡3.
5929
21.
02E
–005
¡1.
5958
70.
0016
5821
3
Plan
t def
ensi
n-fu
sion
pro
tein
, put
ativ
e (P
DF
2.5)
AW
3505
73¡
17.7
9202
0.00
2233
264
¡5.
7118
80.
0004
2017
1¡
2.28
667
0.00
0807
27
Rap
id a
lkal
iniz
atio
n fa
ctor
(R
AL
F) f
amily
pro
tein
BM
2713
61¡
25.5
7113
0.00
8016
775
¡2.
5506
32.
66E
–005
¡1.
6356
80.
0012
0963
3
123

Planta (2007) 226:1423–1447 1439
Categorization of contrasting probe set expression between I and C reactions
We further analyzed the probe sets identiWed in the contrast-ing probe set expression analyses (Fig. 12a–f). Those cate-gorizations (Fig. 13a–f) are the companion to Fig. 12a–f andreveal, on a global scale, the genes experiencing contrastingexpression as a consequence of an I and C reaction. Thesame probe sets compose I and C in each of the six experi-ments (Fig. 13a–f). For example, we noted a substantialnumber of probe sets induced at all time points in I that weresuppressed at all time points in C that belong to the Metabo-lism category (Fig. 13a). While low numbers of probe setswere present in Fig. 13b and c, MA did identify contrasting
expression for Energy and Metabolism probe sets thatoccurs between 12 hpi and 3 dpi in (Fig. 13d). Contrastinggene expression for Signal Transduction and Transcriptionprobe sets was also observed in I, occurring between 3 and8 dpi (Fig. 13e). Low numbers of Fig. 12f probe sets wereavailable for classiWcation (Fig. 13f), complicating analysis.Complete probe set lists for analyses represented in Figs. 12and 13 are provided as supplemental data.
Discussion
Our study focused on using well-deWned nematode popula-tions that yielded bona Wde I and C reactions (Niblack et al.
Fig. 11 Functional categoriza-tion of results obtained in Fig. 10. There are 18 functional categories. In red are the probe-sets present in the I reaction. In red are the probe-sets present in the C reaction. a (ProWle 1), functional categorization of Fig. 10a; b (ProWle 2), functional categorization of Fig. 10b; c (ProWle 3), functional categori-zation of Fig. 10c; d (ProWle 4), functional categorization of Fig. 10d; e (ProWle 5), functional categorization of Fig. 10e; f (ProWle 6), functional categori-zation of Fig. 10f; g (ProWle 7), functional categorization of Fig. 10g; h (ProWle 8), func-tional categorization of Fig. 10h
123

1440 Planta (2007) 226:1423–1447
2002) in the same G. max cultivar. We addressed severalbasic questions concerning the G. max–H. glycines interac-tion. These questions include: (1) does diVerential geneexpression occur prior to H. glycines feeding site selection?(2) Can G. max distinguish between H. glycines popula-tions before feeding site selection occurs by the nematodes?(3) How does diVerential expression diVer between I and Cover time? Our MA evaluated transcript abundance overtime, identifying genes both common and unique to I and Cand genes experiencing contrasting patterns of expression.
Glycine max exhibits diVerential expression priorto H. glycines feeding site selection
Damage trails caused by H. glycines as it migrates to itsfeeding site are clearly evident at the histological level at12 hpi. These observations indicated that changes in geneexpression in G. max probably were occurring as soon as J2
H. glycines entered the root. MA identiWcation of rapidchanges in gene expression during pathogen infection hasbeen demonstrated (Scheideler et al. 2001). Those experi-ments, using A. thaliana, demonstrated that P. syringaeinfection promoted the diVerential expression of »650genes within the Wrst 10 min of infection. Our MA identi-Wed transcriptional activity present at 12 hpi that was com-mon to I and C. This demonstrated that G. max has theability to sense the presence of I and C nematode popula-tions during the migration phase. These observations areconsistent with Alkharouf et al. (2006) who demonstrated achange in transcriptional activity in C as early as 6 hpi. OurMA identiWed very little change in the quantity of probesets measuring induced transcript levels that are commonbetween I and C at individual time points. These data dem-onstrate that an underlying core response by G. max toH. glycines infection is present at each time point during Iand C.
Fig. 12 Contrasting probe set expression patterns (having dissimilartopologies between I and C over time). Six diVerential expression pro-Wles (a–f) for G. max probe sets identiWed by MA of whole roots infect-ed with I (in blue) or C (in red). The time points were 12 hpi, 3 and8 dpi. The expression proWles are presented as the average expressionfor the sum of probe set measurements for each proWle. The number(N) of genes for both I and C G. max transcripts in each proWle is pro-vided in the bottom right corner of each Wgure. The time point is pro-vided on the x-axis. The fold expression is provided on the y-axis. aProbe sets measuring transcript abundance that is induced in I and sup-pressed in C. b Probe sets measuring transcript abundance that is in-duced in I at all time points while in C are suppressed at 12 hpi but then
become induced at 3 and 8 dpi. c Probe sets measuring transcript abun-dance that is induced in I at all time points while in C are suppressed at12 hpi and 3 dpi but then become induced at 8 dpi. d Probe sets mea-suring transcript abundance that is suppressed at all time points in Cand suppressed in I at 12 hpi but then become induced at 3 and 8 dpi.e Probe sets measuring transcript abundance that is suppressed at alltime points in C and suppressed in I at 12 hpi and 3 dpi but induced at8 dpi. f Probe sets measuring transcript abundance that is suppressed inC at 12 hpi and 3 dpi but become induced at 8 dpi. In I, those probe setsmeasuring transcript abundance that is suppressed at 12 hpi butbecome induced at 3 and 8 dpi
123

Planta (2007) 226:1423–1447 1441
MA indicated that the most highly induced gene com-mon to I and C encodes PR1. PR1 acts downstream of Nonexpressor of PR genes 1 (NPR1) (Cao et al. 1994) duringSA signaling. Other defense-related probe sets identiWed inour analysis included EDS1. EDS1 works in concert withthe known EDS1 interactor PHYTOALEXIN-DEFI-CIENT4 (PAD4) and SAG101 to mediate resistance in A.thaliana to P. syringae (Feys et al. 2005). Transcript levelsof PAL1, encoding an enzyme that is at the beginning ofthe phenylpropanoid pathway are induced in I and C at12 hpi. Numerous other genes encoding enzymes of thephenylpropanoid defense pathway are also induced in I andC at 12 hpi. Genes encoding LOX, a component of the jas-monic acid defense pathway, and ACC oxidase, involved inethylene signaling, are induced in I and C. MA identiWed aset of gene-for-gene resistance (R) genes induced in both Iand C. R genes are essential for defense and confer resis-tance in plants to other nematode species such as the para-sitic nematode H. schachtii (Cai et al. 1997) M. javanica
and M. incognita (Milligan et al. 1998) and Globoderarostochiensis (Paal et al. 2004). MA also identiWed inducedtranscript levels of the genes encoding members of cell wallmodifying dirigent proteins. Dirigent proteins are involvedin ligniWcation (Burlat et al. 2001) and their genes havebeen shown to experience signiWcant increase in transcriptabundance upon infection of the white pine weevil (Pis-sodes strobi Peck), in Sitka spruce [Picea sitchensis (Bong)Carriere; clone FB3-425] (Ralph et al. 2006). Our MAresults demonstrate that changes in gene expression in G.max roots occur rapidly after infection by H. glycines. Thisrapid induction includes genes encoding components ofmultiple defense pathways. These genes were found to beinduced in common between both I and C at 12 hpi. Alkha-rouf et al. (2006), using cDNA-based microarrays contain-ing >6,500 features, used time points spanning both themigration (6 and 12 hpi) and syncytium establishmentphases (1, 2, 4 and 8 dpi) to study C. That analysis demon-strated that hundreds of G. max genes were diVerentially
Fig. 13 Functional categoriza-tion of results obtained in Fig. 12. There are 18 functional categories. In blue are the genes common to the I and C reaction. a Functional categorization of Fig. 12a; b functional categori-zation of Fig. 12b; c functional categorization of Fig. 12c; d functional categorization of Fig. 12d; e functional categori-zation of Fig. 12e; f functional categorization of Fig. 12e
123

1442 Planta (2007) 226:1423–1447
expressed at 6 hpi during the nematode migration phase.This is the only microarray analysis that evaluated G. maxtranscript expression during the migration phase of thenematode. Some of the genes identiWed in that analysiswere defense-related and included KTI, germin, peroxi-dase, phospholipase D, OPR, PR1, phospholipase C, lipox-ygenase, WRKY6 transcription factor and calmodulin(Alkharouf et al. 2006). Thus, multiple defense pathwayswere induced early during the C reaction (Alkharouf et al.2006). Our MA results conWrm that diVerential expressionis occurring during the nematode migration phase and thatalso demonstrates a core gene expression pattern in G. maxroots irrespective of the nematode population used. It isunclear that these induced defense genes are relevant toresistance because they are common to I and C. Our obser-vations show that the same G. max genetic background (cv.Peking) can distinguish between I and C H. glycines popu-lations. Recent experiments of a C reaction in S. lycopersi-cum cv. Moneymaker infected by the root knot nematode(RKN) (M. incognita) revealed some changes in geneexpression by 12 hpi (SchaV et al. 2007). These experi-ments also compared an I reaction in a diVerent cultivar S.lycopersicum cv. Motelle by infection with another RKNspecies M. hapla (SchaV et al. 2007). Those experimentsdid identify some genes (N = 5) in common between I andC. Unfortunately, direct comparisons of gene activityoccurring between the I and C reactions at 12 hpi were notpresented. However, observations of both SCN and RKNinfection processes demonstrate that early transcriptionalevents pertaining to I and C during the migration phase areoccurring and may exhibit aspects common to each.
The large quantity of diVerentially expressed genesunique to I and C suggest that contrasting gene expressionmay be important during I and C during the course of H.glycines infection. These genes that are exhibiting contrast-ing expression may represent the lagging gene expressionidentiWed by Lamb et al. (1992). Our MA indicated that G.max diVerentiated between I and C nematodes, which sup-ports the observations in A. thaliana (Tao et al. 2003) andG. max (Zabala et al. 2006) that these plants could diVeren-tiate between I and C strains of P. syringae. Several studieshave demonstrated that gene expression during a diseaseresponse changes over time during P. syringae infection ofA. thaliana and this can be seen as a shift from housekeep-ing genes to defense genes and energy metabolism used tofuel the defense response (Scheideler et al. 2001). Tran-script expression during a disease response also lags overtime in C as compared to I during P. syringae infection ofA. thaliana, presumably providing a temporal advantage tothe host when defending against the pathogen (Tao et al.2003). Our observations of Xuctuations in gene expressionoccurring at least over the Wrst three days of infection dur-ing I in G. max contrast with observations made during
RKN infection of S. lycopersicum (SchaV et al. 2007) as weobserved both changes in expression occurring over timeand diVerences in expression chronology between the I andC reactions.
We compared the quantity of induced and suppressedtranscript levels for I and C at 12 hpi, 3 and 8 dpi. MA iden-tiWed very few induced genes at 3 dpi in C as compared to I.MA also identiWed a contrasting trend in transcript expres-sion occurring between 3 and 8 dpi for I and C. The quan-tity of suppressed genes in I at 3 dpi had decreased at 8 dpi.The quantity of suppressed genes in C at 3 dpi hadincreased substantially by 8 dpi. These expression trendsdemonstrate that G. max roots respond diVerently during Iand C. The observation that relatively few transcripts arecommon between I and C as compared to the quantityunique to I or C demonstrate that G. max perceives the twopopulations of H. glycines diVerently during infection.These observations are consistent with I and C infection ofS. lycopersicum with M. hapla and M. incognita, respec-tively (SchaV et al. 2007). These transcripts that are exhibit-ing contrasting gene expression may represent the lagginggene expression found to be important during I (Lamb et al.1992; Tao et al. 2003) that represent shifts from one type ofgene expression to another during the course of infection(Scheideler et al. 2001). That was clear from our functionalcategorizations of those diVerentially expressed probe sets.
Glycine max experiences transcript expression unique to I during H. glycines migration phase
We sought to determine if there were genes expresseduniquely during I or C at 12 hpi. This would provide anestimate as to whether G. max could sense I and C nema-todes diVerently before they had established feeding sites.Our MA identiWed a relatively small quantity of probe setscommon between I and C as compared to those unique to Iand C that were measuring suppressed transcript levels.Many of these probe sets measured amplitude diVerencesbetween I and C. These observations demonstrate thatG. max can sense the presence of individual populations ofH. glycines at 12 hpi. This population-speciWc response byG. max to infection by H. glycines occurs early duringinfection, demonstrating that the population-speciWc sens-ing process by G. max begins as the nematodes are burrow-ing through the root. This is consistent with the ability of A.thaliana to distinguish rapidly (within 9 h of infection)between I and C strains of P. syringae (Tao et al. 2003).Similar observations were also made concerning the diVer-ential expression of genes encoding components of the phe-nylpropanoid pathway in G. max during infection with Iand C strains of P. syringae (Zabala et al. 2006). Theseresults are consistent with Zou et al. (2005) who demon-strated that approximately 10% of G. max leaf genes are
123

Planta (2007) 226:1423–1447 1443
diVerentially expressed during P. syringae infection duringI versus C.
Our gene classiWcations permitted the identiWcation ofquantitative diVerences for Disease and Defense, Metabo-lism, Secondary Metabolism, Signal Transduction andTranscription probe sets occurring as early as 12 hpibetween I and C reactions. These results may indicate thatG. max is fortifying root cells in ways that drive I later dur-ing feeding site establishment phase of the H. glycines life-cycle. This fortiWcation may involve the large number ofWRKY genes that are induced in I reactions at both 12 hpiand 3 dpi. WRKY genes are important to defense. Therewas a substantial diVerence in the expression of genesencoding WRKY transcription factors between I and C. WeidentiWed 107 members of the WRKY family of transcrip-tion factors for G. max on the AVymetrix® microarrays.Analysis of these WRKY probe sets revealed complexexpression both during the course of infection and betweenI and C nematode populations beginning at 12 hpi. MAidentiWed a large quantity of genes encoding WRKY tran-scription factors that were uniquely expressed in I at 12 hpi.WRKY transcription factors are important in defense(Wang et al. 2006; Zheng et al. 2006; Liu et al. 2006; Ryuet al. 2006; Ulker et al. 2007). A WRKY6 homolog wasshown to be induced during H. glycines infection of G. max(Alkharouf et al. 2006). WRKY genes have been shown tobe rapidly induced during I in pepper (Capsicum annum)(Oh et al. 2006). Numerous other observations also pointtoward the involvement of WRKY genes in plant defense(Zheng et al. 2006; Ryu et al. 2006; Xu et al. 2006; Journot-Catalino et al. 2006; Shen et al. 2007).
R genes work in concert with WRKY genes during thedefense response. We observed a substantial number ofNBS-LRR (R) genes induced during I. Gene for gene resis-tance is essential for I by recognizing pathogen avirulence(Avr) proteins (Hammond-Kosak and Jones 1997; Dangland Jones 2001) and are encoded by NBS-LRR (R) genes.These R genes exhibit a substantial diVerence in transcriptabundance between I and C during G. max infection by H.glycines. We identiWed 68 NBS-LRR-like genes on themicroarrays and many of those genes were induced in I by12 hpi. The induction of R gene expression that was uniqueto I is consistent with their involvement in resistance to par-asitic nematodes (Cai et al. 1997; Milligan et al. 1998;Hwang et al. 2000, 2003; Paal et al. 2004). However, it wasunclear whether a functional link exists between theseWRKY and R genes. Another class of immune receptors isthe membrane-resident pattern recognition receptors(PRRs) (Jones and Dangl 2006). These proteins recognizepathogen proteins (i.e. bacterial Xagellin or chitin) referredto as pathogen-associated molecular patterns (PAMPs)(Jones and Dangl 2006). The PRRs are involved in imped-ing pathogen growth. R gene and PRR pathways are linked
and involve WRKY transcription factors that de-repressbasal defense that is triggered by PAMPs (Shen et al.2007). In those experiments, the powdery mildew Blumeriagraminis AVRA10 protein works through the barley mildewA (MLA) R locus (MLA10) to associate with WRKY tran-scription factors. WRKY then represses PAMP-triggeredplant basal defense. This repression caused by WRKY isinterfered with by MLA and thus ensures that basal resis-tance activity is maintained (Shen et al. 2007). It is notclear whether functional homologs exist in all agriculturalplants. However, the induction of WRKY and R geneexpression during I as G. max overcomes infection by H.glycines is consistent with such a defense role.
Glycine max experiences transcript expression unique to C during H. glycines migration phase
An intriguing observation was the large quantity of genesencoding peroxidases that were induced speciWcally in C by12 hpi, but were not induced in I. Peroxidases are involvedin the hypersensitive response (HR). Scheideler et al.(2001) demonstrated in A. thaliana infected with P. syrin-gae that most of the HR response was complete by 24 hpi.However, in our analysis, some peroxidases were alsofound to be common to I and C, but many more were founduniquely in C at 12 hpi. Our MA identiWed only one perox-idase gene that was induced that was unique to I at 12 hpi.Thus, while the induction of WRKY and R gene mediateddefense pathways are prominent in I at 12 hpi, a large quan-tity of peroxidase genes are induced in C at 12 hpi. Ouranalysis was not designed to account for gene expressionprior to 12 hpi. Thus, it is possible that peroxidases areinduced in I prior to 12 hpi, representing accelerated orshifts in gene expression.
Glycine max experiences transcript expression unique to I at 3 dpi
There are substantial diVerences in the quantity of genesinduced in I as compared to C at 3 dpi. Our MA revealed alarge quantity of defense probe sets at 3 dpi in I thatincludes several peroxidases. Numerous transcription factorprobe sets, including the aforementioned WRKY transcrip-tion factors, are well represented in I at 3 dpi.
The NAM family of transcription factors is particularlywell represented in I at 3 dpi. NAM belongs to a family oftranscription factors Wrst identiWed in Petunia (Souer et al.1996) and is required for pattern formation in embryosand Xowers. Its expression pattern in meristems andorgan boundaries was consistent with mutant phenotypeslacking apical meristems or having aberrant Xoral organquantity (Souer et al. 1996). NAM is a member of a fam-ily of transcription factors including NAM, ATAF, and
123

1444 Planta (2007) 226:1423–1447
CUP-SHAPED COTYLEDON (CUC) and referred to asNAC (Vroeman et al. 2003). A. thaliana has at least 105NAC genes while Oryza sativa has at least 75 (Olsen et al.2005). The NAC family gene, ATAF (Collinge and Boller2001), is induced by wounding and P. syringae infection.The O. sativa NAC gene, OsNAC6, is responsive towounding and JA treatment (Ohnishi et al. 2005). NAC1 isinvolved in lateral root emergence (Guo et al. 2005; Heet al. 2005) and has also been shown to be involved in sec-ondary cell wall thickening (Kubo et al. 2005; Mitsudaet al. 2005, 2007). Ectopic expression of SND1, a NAChomolog, induces the deposition of secondary wall materialin cells that normally do not have secondary wall thicken-ings (Zhong et al. 2006). This is consistent with the cellwall thickenings observed in syncytia and cells surroundingthe syncytium as it collapses during I (Endo 1965, 1991;Riggs et al. 1973; Kim et al. 1987). Our MA also demon-strated that NAC probe sets are measuring suppressed tran-scriptional activity at 3 dpi in C. This is consistent with ourprevious observations of reduced transcript levels for NACat 24 hpi during C (Alkharouf et al. 2006).
Glycine max experiences transcript expression unique to I at 8 dpi
By 8 dpi, G. max is undergoing substantial diVerences ingene expression between I and C. MA identiWed inducedgenes in I at 8 dpi that encoded LOX, HSP and genesinvolved in energy metabolism that were not present in C.These genes were induced to some extent at 3 dpi in I, butare more highly induced in I at 8 dpi. One of these HSPswas HSP90. The HSP90 chaperone complex is crucial forR gene mediated plant defense and other aspects of devel-opment (reviewed in Sangster and Queitsch 2005). Theinduction of HSPs also coincides with the impairment ofmitochondrial function (Kuzmin et al. 2004). The inductionof HSPs in mutants impaired for mitochondrial function,however, does not involve Ca+2 or ROS-dependent path-ways (Karpova et al. 2002). Our MA identiWed probe setsmeasuring induced transcript levels of ClpB/HSP101 at8 dpi. ClpB/HSP101 is crucial during recovery after severecellular damage (Queitsch et al. 2000). Our MA also identi-Wed HSP70 probe sets measuring induced transcript levelsat 8 dpi. HSP70 is important in preventing mitochondriafrom inducing both caspase-dependent and independentapoptosis (Saleh et al. 2000; Ravagnan et al. 2001). Theseresults may put into context why, in Nicotiana sylvestris,nad7 mutants that delete NAD7 (Pla et al. 1995), and lead-ing to an impaired mitochondrial function (Gutierres et al.1997), experience a concomitant increase in resistance toviral infection and tolerance to O3 stresses (Dutilleul et al.2003). Altered HSP70 expression aVects root development(Sung and Guy 2003) whereby overexpression of HSP70 in
A. thaliana results in shorter roots that are more branched(Sung and Guy 2003). Thus, the overexpression of HSP70can be attributed to a root phenotype. The identiWcation ofthese and several other HSPs by our MA are consistent withtheir role during recovery after cellular damage. It may alsoexplain why HSP genes are induced at 8 dpi in I and not inC.
A core G. max response occurs irrespective of the nematode population over time
Experiments using microarrays to investigate plant geneexpression during nematode infection have typicallyfocused on C reactions (PuthoV et al. 2003; Alkharouf et al.2004, 2006; Jammes et al. 2005; Ithal et al. 2007). In ourexperiments, we analyzed both the I and C reactions usingmicroarrays and we analyzed these reactions that wereoccurring over time. Our MA identiWed a core set of probesets that are measuring diVerential expression over timethat are common between I and C. A large proportion of thegenes we identiWed as diVerentially expressed in both I andC reactions were suppressed throughout the time points weselected for our analysis. This demonstrates that G. maxresponds to the presence of H. glycines by suppressing thetranscription of many genes, irrespective of whether or notI or C is occurring. It is unclear if some of these genes (likePR1) contribute to I, because they are highly induced tosimilar levels during both I and C. Many genes were alsosuppressed in C reactions in A. thaliana infected with M.incognita (Jammes et al. 2005). A panel of genes was sup-pressed in C reactions during a C reaction in G. max cv.Williams (Ithal et al. 2007). Unlike our analysis, few genesappeared to be common between I and C reactions in S.lycopersicum cv. Motelle and cv. Moneymaker, respec-tively (SchaV et al. 2007).
Our MA identiWed diVerences in gene transcript abun-dance as measured by the probe sets on the microarrays.These diVerences in transcript abundance are present asearly as 12 hpi (i.e. Fig. 10h). These observations occurringbetween I and C are similar to Lamb et al. (1992) and Taoet al. (2003). However, induction of gene expression doesnot appear to occur for genes encoding members of alldefense pathways during H. glycines infection of G. max.Our results indicate that the use of multiple populations ofnematodes to achieve I or C may be useful in terms of bet-ter understanding fundamental aspects of nematode patho-genicity in plants. This is because it is possible to identifydiVerentially expressed genes that are common to I and C inroots infected with diVerent populations of nematodes. Thecommonalties may represent the core response by the plantregardless of the nematode population. Some commonali-ties were recently observed during a time-course of I and Cinfection of S. lycopersicum by M. hapla and M. incognita,
123

Planta (2007) 226:1423–1447 1445
respectively (SchaV et al. 2007). Conversely, by using mul-tiple nematode populations like our analyses have pre-sented, it may be possible to identify genes that actuallyunderlie I and C and make then distinct. Such observationswere recently made by using diVerent RKN species toachieve I and C reactions in diVerent S. lycopersicum culti-vars (SchaV et al. 2007).
Unique aspects of transcript expression in G. max over time during I and C
Our observations demonstrate that there is a core responseby G. max roots during I and C reactions to H. glycines.Our results also indicate that important changes in geneexpression are occurring before the nematode has had achance to select their feeding site. Thus, G. max appears tobe engaging unique I and C transcriptional programs tocope with I and C nematodes as early as their migrationphase and before feeding site selection has occurred. Thus,G. max can distinguish between nematode populationsbefore syncytium establishment occurs. It appears thatmuch of the gene expression between whole I and C rootsare diVerent throughout infection. However, there are addi-tional diVerences in gene expression occurring locallywithin the syncytia as they develop. These changes in geneexpression make syncytia diVerent from the surrounding Iand C tissue (reviewed by Gheysen and Fenoll 2002; Klinket al. 2005). Experiments on isolated syncytium samplesare clarifying these issues, especially from the standpoint ofcell fusion events that are central to the formation of thesyncytium Klink et al. 2007b). However, it is unclear whataVect the homogenization of various cell types (i.e. cortexand pericycle) has on the gene expression during the forma-tion of the syncytium.
Acknowledgments The authors thank Dr. David Munroe and NicoleLum at the Laboratory of Molecular Technology, SAIC-Frederick, Na-tional Cancer Institute at Frederick, Frederick, MD 21701, USA for theAVymetrix® array hybridizations and data acquisition. All data, raw andnormalized, are stored in the Soybean Genomics and Microarray Database(Alkharouf et al. 2004), available through the web site (http://www.towson.edu/nalkharo/SGMD/SupplementalSites/GmWholeRootIC/).The authors greatly appreciate the continued support provided by theUnited Soybean Board under grant 5214. Mention of trade names or com-mercial products in this article is solely for the purpose of providing spe-ciWc information and does not imply recommendation or endorsement bythe United States Department of Agriculture. The authors greatly appre-ciate careful reading and critical comments of the manuscript provided byDr. Leslie Wanner, United States Department of Agriculture. The authorsthank Veronica Martins for careful editing of the manuscript.
References
Alkharouf N, Matthews BF (2004) SGMD: the soybean genomics andmicroarray database. Nucleic Acids Res 32:D398–D400
Alkharouf NW, Klink VP, Chouikha IB, Beard HS, MacDonald MH,Meyer S, Knap HT, Khan R, Matthews BF (2006) Timecoursemicroarray analyses reveals global changes in gene expression ofsusceptible Glycine max (soybean) roots during infection by Het-erodera glycines (soybean cyst nematode). Planta 224:838–852
Altschul SF, Madden TL, SchaVer AA, Zhang J, Zhang Z, Miller W,Lipman DJ (1997) Gapped BLAST and PSI-BLAST: a new gen-eration of protein database search programs. Nucleic Acids Res25:3389–3402
Burlat V, Kwon M, Davin LB, Lewis NG (2001) Dirigent proteins anddirigent sites in lignifying tissues. Phytochemistry 57:883–897
Byrd DW Jr, Kirkpatrick T, Barker KR (1983) An improved techniquefor clearing and staining plant tissue for detection of nematodes.J Nematol 15:142–143
Cai D, Kleine M, KiXe S, HarloV HJ, Sandal NN, Marcker KA, Klein-Lankhorst RM, Salentijn EM, Lange W, Stiekema WJ, Wyss U,Grundler FM, Jung C (1997) Positional cloning of a gene for nem-atode resistance in sugar beet. Science 275:832–834
Cao H, Bowling SA, Gordon AS, Dong X (1994) Characterization ofan Arabidopsis mutant that is nonresponsive to inducers of sys-temic acquired resistance. Plant Cell 6:1583–1592
Cho HJ, Farrand SK, Noel GR, Widholm JM (2001) High-eYciencyinduction of soybean hairy roots and propagation of the soybeancyst nematode. Planta 210:195–204
Collinge M, Boller T (2001) DiVerential induction of two potato genes,Stprx2 and StNAC, in response to infection by Phytophthora in-festans and to wounding. Plant Mol Biol 46:521–529
Cregan PB, Mudge J, Fickus EW, Marek LF, Danesh D, Denny R,Shoemaker RC, Matthews BF, Jarvik T, Young ND (1999) Tar-geted isolation of simple sequence repeat markers through the useof bacterial artiWcial chromosomes. Theor Appl Genet 98:919–928
Dangl JL, Jones JD (2001) Plant pathogens and integrated defence re-sponses to infection. Nature 411:826–833
Dutilleul C, Garmier M, Noctor G, Mathieu C, Chetrit P, Foyer CH, dePaepe R (2003) Leaf mitochondria modulate whole cell redoxhomeostasis, set antioxidant capacity, and determine stress resis-tance through altered signaling and diurnal regulation. Plant Cell15:1212–1226
Endo BY (1964) Penetration and development of Heterodera glycinesin soybean roots and related and related anatomical changes. Phy-topathology 54:79–88
Endo BY (1965) Histological responses of resistant and susceptiblesoybean varieties, and backcross progeny to entry development ofHeterodera glycines. Phytopathology 55:375–381
Endo B (1971) Synthesis of nucleic acids at infection sites of soybeanroots parasitized by Heterodera glycines. Phytopathology61:395–399
Endo BY (1991) Ultrastructure of initial responses of resistant and sus-ceptible soybean roots to infection by Heterodera glycines. RevNematol 14:73–94
Endo BY (1998) Atlas on ultrastructure of infective juveniles of thesoybean cyst nematode Heterodera glycines. Agricultura hand-book number 711, 224 pp
Endo BY, Veech JA (1970) Morphology and histochemistry of soy-bean roots infected with Heterodera glycines. Phytopathology60:1493–1498
Feys BJ, Wiermer M, Bhat RA, Moisan LJ, Medina-Escobar N, Neu C,Cabral A, Parker JE (2005) Arabidopsis SENESCENCE-ASSO-CIATED GENE101 stabilizes and signals within an EN-HANCED DISEASE SUSCEPTIBILITY1 complex in plantinnate immunity. Plant Cell 17:2601–2613
Gentleman RC, Carey VJ, Bates DM, Bolstad B, Dettling M, Dudoit S,Ellis B, Gautier L, Ge Y, Gentry J, Hornik K, Hothorn T, HuberW, Iacus S, Irizarry R, Li FLC, Maeschler M, Rossini AJ, Saw-itzki G, Smith C, Smyth G, Tierney L, Yang JYH, Zhang J (2004)
123

1446 Planta (2007) 226:1423–1447
Bioconductor: open software development for computationalbiology and bioinformatics. Genome Biol 5:R80
Gheysen G, Fenoll C (2002) Gene expression in nematode feedingsites. Annu Rev Phytopathol 40:191–219
Gipson I, Kim KS, Riggs RD (1971) An ultrastructural study of syncy-tium development in soybean roots infected with Heterodera gly-cines. Phytopathology 61:347–353
Guo HS, Xie Q, Fei JF, Chua NH (2005) MicroRNA directs mRNAcleavage of the transcription factor NAC1 to downregulate auxinsignals for Arabidopsis lateral root development. Plant Cell17:1376–1386
Gutierres S, Sabar M, Lelandais C, Chetrit P, Diolez P, Degand H,Boutry M, Vedel F, de Kouchkovsky Y, De Paepe R (1997) Lackof mitochondrial and nuclear-encoded subunits of complex I andalteration of the respiratory chain in Nicotiana sylvestris mito-chondrial deletion mutants. Proc Natl Acad Sci USA 94:3436–3441
Hammond-Kosack KE, Jones JD (1997) Plant disease resistancegenes. Annu Rev Plant Physiol Plant Mol Biol 48:575–607
He XJ, Mu RL, Cao WH, Zhang ZG, Zhang JS, Chen SY (2005) At-NAC2, a transcription factor downstream of ethylene and auxinsignaling pathways, is involved in salt stress response and lateralroot development. Plant J 44:903–916
Hwang CF, Bhakta AV, Truesdell GM, Pudlo WM, Williamson VM(2000) Evidence for a role of the N terminus and leucine-rich re-peat region of the Mi gene product in regulation of localized celldeath. Plant Cell 12:1319–1329
Hwang CF, Williamson VM (2003) Leucine-rich repeat-mediatedintramolecular interactions in nematode recognition and celldeath signaling by the tomato resistance protein Mi. Plant J34:585–593
Irizarry R, Bolstad BM, Collin F, Cope LM, Hobbs B, Speed TP(2003a) Summaries of AVymetrix GeneChip probe level data.Nucleic Acids Res 31:e15
Irizarry R, Hobbs B, Collin F, Beazer-Barclay YD, Antonellis KJ,Scherf U, Speed TP (2003b) Exploration, normalization, andsummaries of high density oligonucleotide array probe level data.Biostatistics 4:249–264
Ithal N, Recknor J, Nettleston D, Hearne L, Maier T, Baum TJ, Mit-chum MG (2007) Parallel genome-wide expression proWling ofhost and pathogen during soybean cyst nematode infection of soy-bean. Mol Plant Microbe Int 20:293–305
Jammes F, Lecomte P, de Almeida-Engler J, Bitton F, Martin-Magni-ette ML, Renou JP, Abad P, Favery B (2005) Genome-wideexpression proWling of the host response to root-knot nematodeinfection in Arabidopsis. Plant J 44:447–458
Jones MGK, Northcote DH (1972) Nematode-induced syncytium-amultinucleate transfer cell. J Cell Sci 10:789–809
Jones MGK, Dropkin VH (1975) Scanning electron microscopy ofsyncytial transfer cells induced in roots by cyst-nematode. Phys-iol Plant Pathol 7:259–263
Jones JD, Dangl JL (2006) The plant immune system. Nature 444:323–329
Journot-Catalino N, Somssich IE, Roby D, Kroj T (2006) The tran-scription factors WRKY11 and WRKY17 act as negative regula-tors of basal resistance in Arabidopsis thaliana. Plant Cell18:3289–3302
Jung C, Wyss U (1999) New approaches to control plant parasitic nem-atodes. Appl Microbiol Biotechnol 51:439–446
Karpova OV, Kuzmin EV, Elthon TE, Newton KJ (2002) DiVerentialexpression of alternative oxidase genes in maize mitochondrialmutants. Plant Cell 14:3271–3284
Khan R, Alkharouf N, Beard HS, MacDonald M, Chouikha I, MeyerS, Grefenstette J, Knap H, Matthews BF (2004) Resistance mech-anisms in soybean: gene expression proWle at an early stage ofsoybean cyst nematode invasion. J Nematol 36:241–248
Kim YH, Riggs RD, Kim KS (1987) Structural changes associatedwith resistance of soybean to Heterodera glycines. J Nematol19:177–187
Klink VP, MacDonald M, Alkharouf N, Matthews BF (2005) Lasercapture microdissection (LCM) and expression analyses of Gly-cine max (soybean) syncytium containing root regions formed bythe plant pathogen Heterodera glycines (soybean cyst nematode).Plant Mol Biol 59:969–983
Klink VP, Overall CC, Matthews BF (2007a) Developing a systemsbiology approach to study disease progression caused by Hetero-dera glycines in Glycine max. Gene Regulat Syst Biol 2:17–33
Klink VP, Overall CC, Alkharouf N, MacDonald M, Matthews BF(2007b) Laser capture microdissection (LCM) and comparativemicroarray expression analysis of syncytial cells isolated fromincompatible and compatible soybean (Glycine max) roots infect-ed by the soybean cyst nematode (Heterodera glycines) (in press)
Kubo M, Udagawa M, Nishikubo N, Horiguchi G, Yamaguchi M, ItoJ, Mimura T, Fukuda H, Demura T (2005) Transcription switchesfor protoxylem and metaxylem vessel formation. Genes Dev19:1855–1860
Kuzmin EV, Karpova OV, Elthon TE, Newton KJ (2004) Mitochon-drial respiratory deWciencies signal up-regulation of genes forheat shock proteins. J Biol Chem 279:20672–20677
Lamb CJ, Ryals JA, Ward ER, Dixon RA (1992) Emerging strategiesfor enhancing crop resistance to microbial pathogens. Biotechnol-ogy 10:1436–1445
Lipshutz RJ, Fodor SP, Gingeras TR, Lockhart DJ (1999) High densitysynthetic oligonucleotide arrays. Nat Genet (1 suppl):20–24
Liu X, Bai X, Wang X, Chu C (2006) OsWRKY71, a rice transcriptionfactor, is involved in rice defense response. J Plant Physiol (inpress)
Matthews BF, Devine TE, Weisemann JM, Beard HS, Lewers KS,MacDonald MH, Park Y-B, Maiti R, Lin J-J, Kuo J, Pedroni MJ,Cregan PB, Saunders JA (2001) Incorporation of sequencedcDNA and genomic markers into the soybean genetic map. CropSci 41:516–521
Matthews B, MacDonald MH, Thai VK, Tucker ML (2003) Molecularcharacterization of argenine kinase in the soybean cyst nematode(Heterodera glycines). J Nematol 35:252–258
Milligan SB, Bodeau J, Yaghoobi J, Kaloshian I, Zabel P, WilliamsonVM (1998) The root knot nematode resistance gene Mi from to-mato is a member of the leucine zipper, nucleotide binding, leu-cine-rich repeat family of plant genes. Plant Cell 10:1307–1319
Mitsuda N, Seki M, Shinozaki K, Ohme-Takagi M (2005) The NACtranscription factors NST1 and NST2 of Arabidopsis regulate sec-ondary wall thickenings and are required for anther dehiscence.Plant Cell 17:2993–3006
Mitsuda N, Iwase A, Yamamoto H, Yoshida M, Seki M, Shinozaki K,Ohme-Takagi M (2007) NAC transcription factors, NST1 andNST3, are key regulators of the formation of secondary walls inwoody tissues of Arabidopsis. Plant Cell (in press)
Mujer CV, Andrews DL, Manhart JR, Pierce SK, Rumpho ME (1996)Chloroplast genes are expressed during intracellular symbioticassociation of Vaucheria litorea plastids with the sea slug Elysiachlorotica. Proc Natl Acad Sci USA 93:12333–12338
Niblack TL, Arelli PR, Noel GR, Opperman CH, Orf JH, Schmitt DP,Shannon JG, Tylka GL (2002) A revised classiWcation scheme forgenetically diverse populations of Heterodera glycines. J Nema-tol 34:279–288
Oh SK, Yi SY, Yu SH, Moon JS, Park JM, Choi D (2006) CaWRKY2,a chili pepper transcription factor, is rapidly induced by incompat-ible plant pathogens. Mol Cells 22:58–64
Ohnishi T, Sugahara S, Yamada T, Kikuchi K, Yoshiba Y, Hirano HY,Tsutsumi N (2005) OsNAC6, a member of the NAC gene family,is induced by various stresses in rice. Genes Genet Syst 80:135–139
123

Planta (2007) 226:1423–1447 1447
Olsen AN, Ernst HA, Leggio LL, Skriver K (2005) NAC transcriptionfactors: structurally distinct, functionally diverse. Trends PlantSci.10:79–87
Paal J, Henselewski H, Muth J, Meksem K, Menendez CM, SalaminiF, Ballvora A, Gebhardt C (2004) Molecular cloning of the potatoGro1-4 gene conferring resistance to pathotype Ro1 of the rootcyst nematode Globodera rostochiensis, based on a candidategene approach. Plant J 38:285–297
Pla M, Mathieu C, De Paepe R, Chetrit P, Vedel F (1995) Deletion ofthe last two exons of the mitochondrial nad7 gene results in lackof the NAD7 polypeptide in a Nicotiana sylvestris CMS mutant.Mol Gen Genet 248:79–88
PuthoV DP, Nettleton D, Rodermel SR, Baum TJ (2003) Arabidopsisgene expression changes during cyst nematode parasitism re-vealed by statistical analyses of microarray expression proWles.Plant J 33:911–921
Queitsch C, Hong SW, Vierling E, Lindquist S (2000) Heat shock pro-tein 101 plays a crucial role in thermotolerance in Arabidopsis.Plant Cell 12:479–492
Ralph S, Park JY, Bohlmann J, MansWeld SD (2006) Dirigent proteinsin conifer defense: gene discovery, phylogeny, and diVerentialwound- and insect-induced expression of a family of DIR andDIR-like genes in spruce (Picea spp.). Plant Mol Biol 60:21–40
Ravagnan L, Gurbuxani S, Susin SA, Maisse C, Daugas E, ZamzamiN, Mak T, Jaattela M, Penninger JM, Garrido C, Kroemer G(2001) Heat-shock protein 70 antagonizes apoptosis-inducingfactor. Nat Cell Biol 3:839–843
Riggs RD, Schmitt DP (1991) Optimization of the Heterodera glycinesrace test procedure. J Nematol 23:149–154
Riggs RD, Kim KS, Gipson I (1973) Ultrastructural changes in Pekingsoybeans infected with Heterodera glycines. Phytopathology63:76–84
Ryu HS, Han M, Lee SK, Cho JI, Ryoo N, Heu S, Lee YH, Bhoo SH,Wang GL, Hahn TR, Jeon JS (2006) A comprehensive expressionanalysis of the WRKY gene superfamily in rice plants during de-fense response. Plant Cell Rep 25:836–847
Saleh A, Srinivasula SM, Balkir L, Robbins PD, Alnemri ES (2000)Negative regulation of the Apaf-1 apoptosome by Hsp70. NatCell Biol 2:476–483
Sangster TA, Queitsch C (2005) The HSP90 chaperone complex, anemerging force in plant development and phenotypic plasticity.Curr Opin Plant Biol 8:86–892
Sardanelli S, Kenworthy WJ (1997) Soil moisture control and directseeding for bioassay of Heterodera glycines on Soybean. J Nema-tol (Suppl) 29:625–634
Sass JE (1958) Botanical microtechnique. Iowa State College Press,Ames
SchaV JE, Nielsen DM, Smith CP, Scholl EH, Bird DMck (2007).Comprehensive transcriptome proWling in tomato reveals a rolefor glycosyltransferase in Mi-mediated nematode resistance.Plant Physiol (in press)
Scheideler M, Schlaich NL, Fellenberg K, Beissbarth T, Hauser NC,Vingron M, Slusarenko AJ, Hoheisel JD (2001) Monitoring theswitch from housekeeping to pathogen defense metabolism inArabidopsis thaliana using cDNA arrays. J Biol Chem277:10555–10561
Shen QH, Saijo Y, Mauch S, Biskup C, Bieri S, Keller B, Seki H, UlkerB, Somssich IE, Schulze-Lefert P (2007) Nuclear activity ofMLA immune receptors links isolate-speciWc and basal disease-resistance responses. Science 315:1098–1103
Smyth GK (2004) Linear models and empirical bayes methods forassessing diVerential expression in microarray experiments. StatAppl Genet Mol Biol 3:Article3
Souer E, van Houwelingen A, Kloos D, Mol J, Koes R (1996) The noapical meristem gene of Petunia is required for pattern formationin embryos and Xowers and is expressed at meristem and primor-dia boundaries. Cell 85:159–170
Sung DY, Guy CL (2003) Physiological and molecular assessment ofaltered expression of Hsc70-1 in Arabidopsis. Evidence for pleio-tropic consequences. Plant Physiol 132:979–987
Tao Y, Xie Z, Chen W, Glazebrook J, Chang HS, Han B, Zhu T, ZouG, Katagiri F (2003) Quantitative nature of Arabidopsis responsesduring C and I interactions with the bacterial pathogen Pseudo-monas syringae. Plant Cell 15:317–330
The Gene Ontology Consortium (2004) The Gene Ontology (GO) data-base and informatics resource. Nucleic Acids Res 32:D258–D261
Ulker B, Shahid Mukhtar M, Somssich IE (2007) The WRKY70 tran-scription factor of Arabidopsis inXuences both the plant senes-cence and defense signaling pathways. Planta (in press)
Vroemen CW, Mordhorst AP, Albrecht C, Kwaaitaal MA, de Vries SC(2003) The CUP-SHAPED COTYLEDON3 gene is required forboundary and shoot meristem formation in Arabidopsis. PlantCell 15:1563–1577
Wang D, Amornsiripanitch N, Dong X (2006) A genomic approach toidentify regulatory nodes in the transcriptional network of sys-temic acquired resistance in plants. PLoS Pathog 2:e123
Williamson VM, Kumar A (2006) Nematode resistance in plants: thebattle underground. Trends Genet 22:396–403
Wrather JA, Koenning SR (2006) Estimates of disease eVects on soy-bean yields in the United States 2003–2005. J Nematol 38:173180
Xu X, Chen C, Fan B, Chen Z (2006) Physical and functional interac-tions between pathogen-induced Arabidopsis WRKY18,WRKY40, and WRKY60 transcription factors. Plant Cell18:1310–1326
Zabala G, Zou J, Tuteja J, Gonzalez DO, Clough SJ, Vodkin LO (2006)Transcriptome changes in the phenylpropanoid pathway of Gly-cine max in response to Pseudomonas syringae infection. BMCPlant Biol 6:26
Zhang C, Ghabrial SA (2006) Development of Bean pod mottle virus-based vectors for stable protein expression and sequence-speciWcvirus-induced gene silencing in soybean. Virology 344:401–411
Zheng Z, Qamar SA, Chen Z, Mengiste T (2006) ArabidopsisWRKY33 transcription factor is required for resistance to necro-trophic fungal pathogens. Plant J 48:592–605
Zhong R, Demura T, Ye ZH (2006) SND1, a NAC domain transcrip-tion factor, is a key regulator of secondary wall synthesis in Wbersof Arabidopsis. Plant Cell 18:3158–3170
Zou J, Rodriguez-Zas S, Aldea M, Li M, Zhu J, Gonzalez DO, VodkinLO, DeLucia E, Clough SJ (2005) Expression proWling soybeanresponse to Pseudomonas syringae reveals new defense-relatedgenes and rapid HR-speciWc downregulation of photosynthesis.Mol Plant Microbe Interact 18:1161–1174
123
Copyright © 2022 FDOKUMEN