The Transcriptional and Gene Regulatory Network of Lactococcus lactis MG1363 during Growth in Milk
12
The Transcriptional and Gene Regulatory Network of Lactococcus lactis MG1363 during Growth in Milk Anne de Jong 1 , Morten E. Hansen 2 , Oscar P. Kuipers 1 , Mogens Kilstrup 2 *, Jan Kok 1 1 Department of Molecular Genetics, University of Groningen, Groningen Biomolecular Sciences and Biotechnology Institute, Groningen, The Netherlands, 2 Center for Systems Microbiology, Institute of Systems Biology, Technical University of Denmark, Lyngby, Denmark Abstract In the present study we examine the changes in the expression of genes of Lactococcus lactis subspecies cremoris MG1363 during growth in milk. To reveal which specific classes of genes (pathways, operons, regulons, COGs) are important, we performed a transcriptome time series experiment. Global analysis of gene expression over time showed that L. lactis adapted quickly to the environmental changes. Using upstream sequences of genes with correlated gene expression profiles, we uncovered a substantial number of putative DNA binding motifs that may be relevant for L. lactis fermentative growth in milk. All available novel and literature-derived data were integrated into network reconstruction building blocks, which were used to reconstruct and visualize the L. lactis gene regulatory network. This network enables easy mining in the chrono-transcriptomics data. A freely available website at http://milkts.molgenrug.nl gives full access to all transcriptome data, to the reconstructed network and to the individual network building blocks. Citation: de Jong A, Hansen ME, Kuipers OP, Kilstrup M, Kok J (2013) The Transcriptional and Gene Regulatory Network of Lactococcus lactis MG1363 during Growth in Milk. PLoS ONE 8(1): e53085. doi:10.1371/journal.pone.0053085 Editor: Raya Khanin, Memorial Sloan Kettering Cancer Center, United States of America Received May 30, 2012; Accepted November 27, 2012; Published January 17, 2013 Copyright: ß 2013 de Jong et al. This is an open-access article distributed under the terms of the Creative Commons Attribution License, which permits unrestricted use, distribution, and reproduction in any medium, provided the original author and source are credited. Funding: Morten Ejby was supported by a grant from the Danish Dairy Research Foundation. The funders had no role in study design, data collection and analysis, decision to publish, or preparation of the manuscript. No additional external funding received for this study. Competing Interests: The authors have declared that no competing interests exist. * E-mail: [email protected] Introduction Dairy lactic acid bacteria [LAB] such as Lactococcus lactis thrive in milk, a nutritionally rich medium that can efficiently support their sugar-based fermentative lifestyle. Milk must have been adopted by LAB in the last approximately ten thousand years, because milk storage is exclusively a human cultural phenomenon. LAB are very important in the food industry for their ability to produce healthy, safe and tasteful foods with extended shelflifes. Thus, LAB are studied intensively to obtain fundamental as well as application-oriented knowledge. With respect to the former, recent years have seen the elucidation of the genomic sequences of several dairy and non-dairy LAB. Among the best studied of these is L. lactis strain MG1363 [1]. The genome sequences have been used for extensive (phylogenetic) comparisons. Importantly, they have allowed examining genome-wide analyses by DNA microarray technology of a number of LAB species [2,3]. These studies and earlier work has led to the detailed description of many metabolic and regulatory networks in L. lactis, such as purine and pyrimidine biosynthesis [4,5,6], amino acid biosynthesis [7], peptide uptake and degradation [8], transcriptional regulators[9,10] and global transcriptional regulators such as CcpA [11] and CodY [12,13]. Many of the studies presented so far entail single time point analysis of e.g., a genetic mutation (mutant-parent analysis). It is quite a challenge to examine the behavior of a bacterium’s transcriptome in time during growth in a complex medium such as cheese [14]. Here, we performed chrono-transcriptomics of L. lactis fermentation of milk. Vitamins and sugar (lactose) are readily available to L. lactis in milk but it has to actively liberate amino acids from milk proteins (caseins) by proteolysis. It is generally believed that the multiple auxotrophies in LAB have accumulated as a consequence of the abundance of growth supplements in milk [2]. This has made bacteria dependent on the correct (temporal) release/use of all essential growth factors for optimal growth. When L. lactis is growing in milk it will have to meet several challenges to survive in an ever-changing environment; changing concentrations of amino acids, peptides, sugars, (an)organic compounds, decrease of pH and increasing cell density and ultimately, nutrient limitation. Many of these changes should be visible as a response in the gene transcriptional network a large part of which will be controlled by transcriptional regulators [15,16]. Analysis of these responses by DNA microarrays will provide insights on when and how transcriptional regulation is managed in the cell. Monitoring mRNA levels and production profiles offers a key to how gene expression is regulated in response to the changing environment. Transcription regulators affect gene expression by binding to specific upstream DNA regions. Computer algorithms [MEME [17], SCOPE [18]] can be used to mine for conserved DNA regions (DNA binding motifs) in the promoter regions of co-regulated genes. When a DNA binding motif is located in separate promoter regions, in addition to those of co-regulated genes, this indicates that these additional genes may be under the control of the same regulator [10]. To supply data for a gene regulatory network of L. lactis in its natural and also in the food industrial environment, we cultured two biological replicates of the L. lactis MG1363 in milk and performed temporal transcriptome analysis using DNA micro- arrays. PLOS ONE | www.plosone.org 1 January 2013 | Volume 8 | Issue 1 | e53085
-
Upload
independent -
Category
Documents
-
view
1 -
download
0
Transcript of The Transcriptional and Gene Regulatory Network of Lactococcus lactis MG1363 during Growth in Milk

The Transcriptional and Gene Regulatory Network ofLactococcus lactis MG1363 during Growth in MilkAnne de Jong1, Morten E. Hansen2, Oscar P. Kuipers1, Mogens Kilstrup2*, Jan Kok1
1 Department of Molecular Genetics, University of Groningen, Groningen Biomolecular Sciences and Biotechnology Institute, Groningen, The Netherlands, 2 Center for
Systems Microbiology, Institute of Systems Biology, Technical University of Denmark, Lyngby, Denmark
Abstract
In the present study we examine the changes in the expression of genes of Lactococcus lactis subspecies cremoris MG1363during growth in milk. To reveal which specific classes of genes (pathways, operons, regulons, COGs) are important, weperformed a transcriptome time series experiment. Global analysis of gene expression over time showed that L. lactisadapted quickly to the environmental changes. Using upstream sequences of genes with correlated gene expressionprofiles, we uncovered a substantial number of putative DNA binding motifs that may be relevant for L. lactis fermentativegrowth in milk. All available novel and literature-derived data were integrated into network reconstruction building blocks,which were used to reconstruct and visualize the L. lactis gene regulatory network. This network enables easy mining in thechrono-transcriptomics data. A freely available website at http://milkts.molgenrug.nl gives full access to all transcriptomedata, to the reconstructed network and to the individual network building blocks.
Citation: de Jong A, Hansen ME, Kuipers OP, Kilstrup M, Kok J (2013) The Transcriptional and Gene Regulatory Network of Lactococcus lactis MG1363 duringGrowth in Milk. PLoS ONE 8(1): e53085. doi:10.1371/journal.pone.0053085
Editor: Raya Khanin, Memorial Sloan Kettering Cancer Center, United States of America
Received May 30, 2012; Accepted November 27, 2012; Published January 17, 2013
Copyright: � 2013 de Jong et al. This is an open-access article distributed under the terms of the Creative Commons Attribution License, which permitsunrestricted use, distribution, and reproduction in any medium, provided the original author and source are credited.
Funding: Morten Ejby was supported by a grant from the Danish Dairy Research Foundation. The funders had no role in study design, data collection andanalysis, decision to publish, or preparation of the manuscript. No additional external funding received for this study.
Competing Interests: The authors have declared that no competing interests exist.
* E-mail: [email protected]
Introduction
Dairy lactic acid bacteria [LAB] such as Lactococcus lactis thrive
in milk, a nutritionally rich medium that can efficiently support
their sugar-based fermentative lifestyle. Milk must have been
adopted by LAB in the last approximately ten thousand years,
because milk storage is exclusively a human cultural phenomenon.
LAB are very important in the food industry for their ability to
produce healthy, safe and tasteful foods with extended shelflifes.
Thus, LAB are studied intensively to obtain fundamental as well as
application-oriented knowledge. With respect to the former, recent
years have seen the elucidation of the genomic sequences of several
dairy and non-dairy LAB. Among the best studied of these is L.
lactis strain MG1363 [1]. The genome sequences have been used
for extensive (phylogenetic) comparisons. Importantly, they have
allowed examining genome-wide analyses by DNA microarray
technology of a number of LAB species [2,3]. These studies and
earlier work has led to the detailed description of many metabolic
and regulatory networks in L. lactis, such as purine and pyrimidine
biosynthesis [4,5,6], amino acid biosynthesis [7], peptide uptake
and degradation [8], transcriptional regulators[9,10] and global
transcriptional regulators such as CcpA [11] and CodY [12,13].
Many of the studies presented so far entail single time point
analysis of e.g., a genetic mutation (mutant-parent analysis). It is
quite a challenge to examine the behavior of a bacterium’s
transcriptome in time during growth in a complex medium such as
cheese [14]. Here, we performed chrono-transcriptomics of L.
lactis fermentation of milk.
Vitamins and sugar (lactose) are readily available to L. lactis in
milk but it has to actively liberate amino acids from milk proteins
(caseins) by proteolysis. It is generally believed that the multiple
auxotrophies in LAB have accumulated as a consequence of the
abundance of growth supplements in milk [2]. This has made
bacteria dependent on the correct (temporal) release/use of all
essential growth factors for optimal growth.
When L. lactis is growing in milk it will have to meet several
challenges to survive in an ever-changing environment; changing
concentrations of amino acids, peptides, sugars, (an)organic
compounds, decrease of pH and increasing cell density and
ultimately, nutrient limitation. Many of these changes should be
visible as a response in the gene transcriptional network a large
part of which will be controlled by transcriptional regulators
[15,16]. Analysis of these responses by DNA microarrays will
provide insights on when and how transcriptional regulation is
managed in the cell. Monitoring mRNA levels and production
profiles offers a key to how gene expression is regulated in response
to the changing environment. Transcription regulators affect gene
expression by binding to specific upstream DNA regions.
Computer algorithms [MEME [17], SCOPE [18]] can be used
to mine for conserved DNA regions (DNA binding motifs) in the
promoter regions of co-regulated genes. When a DNA binding
motif is located in separate promoter regions, in addition to those
of co-regulated genes, this indicates that these additional genes
may be under the control of the same regulator [10].
To supply data for a gene regulatory network of L. lactis in its
natural and also in the food industrial environment, we cultured
two biological replicates of the L. lactis MG1363 in milk and
performed temporal transcriptome analysis using DNA micro-
arrays.
PLOS ONE | www.plosone.org 1 January 2013 | Volume 8 | Issue 1 | e53085

Materials and Methods
Growth conditionsMilk medium was prepared by heat-treating 10% reconstituted
skimmed milk at 90uC for 30 min. The milk was inoculated with a
1/20 volume of an exponentially growing culture of Lactococcus
lactis MG1363 carrying pLP712, a plasmid containing the genes to
degrade lactose (Lac+) and proteins (Prt+) [19], in milk shortly
after the temperature had reached 30uC. The inoculum of L. lactis
MG1363 had been growing exponentially in milk at 30uC for
approximately 5 generations and had reached a pH of 5.5. The
skimmed milk powder was a gift from Arla Foods, Viby, Denmark.
Determination of colony forming units and pHMedium pH was monitored by taking samples at appropriate
time points and measuring pH with an electrode. Colony forming
units were determined by appropriately diluting samples in M17
and plating on M17 (Difco, USA) agar plates containing 0.5% w/v
glucose. Colonies were counted after overnight incubation at
30uC.
Total RNA extraction from milk cultures and DNAmicroarray methodology
Cellular processes were quickly quenched by rapid cooling of
10 ml samples in large glass flasks (with large heat capacity) pre-
chilled in an ice-ethanol bath. Following centrifugation at 6000 g
for 10 min at 4uC, the pellet was resuspended in 1 ml ice-cold 3 M
guanidinium chloride. Following solubilisation of the milk
coagulate by five cycles of vortex mixing and chilling on ice, each
for one minute, cells were collected from the cleared solution by
centrifugation at 4uC at 3500 g for 15 min. After two washed in
ice cold 0.9% saline solution the cell samples were frozen at
280uC or used directly for RNA extraction.
RNA was extracted by the hot phenol method as described
before [5]. Subsequently, cDNA was obtained and labeled with
Cy3 and Cy5 dyes and slide hybridization was performed at 45uCas described previously [20] on in-house spotted L. lactis MG1363
DNA microarrays (for details see platform GPL5048 in the GEO
database [21]).
DNA microarray data normalizationIntensity levels of the signals on the slides in the different data
sets were scaled to equal total intensities and normalized with
lowess grid-based normalization using Microprep [22]. This
scaling is equivalent to assuming that the total mRNA concentra-
tion in the cell is constant throughout the experiment; although
this assumption is not true for absolute levels it is valid for the
relative expression profiles of genes. The raw data and the
normalized data are deposited in Base2 [23]. Global analyses were
performed on these scaled normalized intensity level data. The sets
of intensity values were normalized and combined into (I) intensity
ratios, corresponding to ratios between mRNA levels from two
time points; and (II) intensity levels, corresponding to absolute
mRNA levels for each time point.
DNA microarray data analysisGenome2D [24] was used to visualize expression profiles and to
calculate the hypergeometrical distribution of classes. TM4 [25]
was used for Principle Component Analysis (PCA). The method of
Ahdesmaki et al. [26] was used to filter out genes with very low
expression levels in order to circumvent false correlation of
background signals in GeneNet. To find links between operons
with (partial) co-expression, GeneNet [27] was used to calculate
gene interactions. To calculate the Pearson’s correlation between
gene expression profiles an in-house routine in R [28] was
developed (available on request). The sliding window routine is a
modified R routine based on GeneCycle [29] (available on
request). DISCLOSE [30] was used to mine for conserved DNA
motifs. Cytoscape [31] was used to reconstruct and visualize the
gene network.
Genome annotation dataThe genome annotation data of L. lactis MG1363,
AM406671_GR, was retrieved from the Genome Reviews
database of EMBL-EBI (http://www.ebi.ac.uk/
GenomeReviews/). This Genome Review file was used as a
source for the COG classification. In total 102 pathways were
extracted from the metabolic data base of KEGG (http://www.
genome.jp/kegg/) using the organism-specific entry ‘llm’ of
MG1363.
Operon predictionLittle or no information is available on operons in bacterial
genomes. Several tools for the in silico examination of operons are
available but none gives a reliable operon prediction [32]. Here we
used TransTermHP [33] to predict transcriptional terminators.
Subsequently, Genome2D ([24] was used to generate putative
operons based on the results of TransTermHP (see Supplementary
Materials).
DNA motif miningNatural log-transformed gene expression ratio data from this
milk fermentation time series was used as a data source to mine for
(novel) transcription factor binding sites (TFBS) in the genome of
L. lactis MG1363. COG classification and GO annotation of the
genes of L. lactis MG1363 were derived from NCBI and EBI,
respectively. The PePPER database [34] was used as a source of
literature-based regulon classes. These data sources were loaded in
DISCLOSE [30] followed by k-means clustering using Pearson,
Spearman and Euclidean distance settings on 10 to 60 clusters. All
clustering settings were tested for overrepresentation of classes
(pathway, GO, COG and regulon) within one cluster. The sum of
overrepresented classes in each cluster represents the total score of
a clustering setting.
We combined DNA-motif mining with various gene classifica-
tions (operon, GO (http://www.geneontology.org/) and metabolic
pathways (http://www.genome.jp/kegg/)) and subsequently vali-
dated the obtained DNA-motifs with literature data. A DNA-motif
was assigned valid if electrophoretic mobility shift assays (EMSA’s)
or DNA foot printing data were available in the primary literature
describing the motif. For validation on the basis of classes, a weight
matrix was made using the DNA-motifs obtained by DISCLOSE,
followed by a genome-wide screen using this weight matrix. A
hypergeometrical test was performed on the obtained sequences to
screen for DNA motif-enriched classes. If an enriched class was
found, the DNA-motif was marked as valid.
Software and webserverFor calculation of gene-to-gene correlation over time we used
GeneNet version 1.2.4 (http://strimmerlab.org/software/
genenet/), which is an R package (http://www.r-project.org/)
for obtaining high-dimensional dependency networks from
genomic data [27]. Cytoscape 2.7.0 [31] was used for building
and visualizing of the gene regulatory network (http://www.
cytoscape.org/). Genome2D [24] was used for motif visualization
and mining in genomic data. The interactive website which
Transcriptome Analysis of L. lactis Grown in Milk
PLOS ONE | www.plosone.org 2 January 2013 | Volume 8 | Issue 1 | e53085

contains the resource data described in this article (http://milkts.
molgenrug.nl) was built in Joomla using PHP for session
management and R for graphical presentation of the data.
Reconstruction of the Gene Regulatory NetworkAn interactive Gene Regulatory Network (GRN) was built using
all data of the analyses described in this paper combined with
literature data. To this end, distinct data sets were made that
describe relation/correlation between genes, transcription profiles,
operons, regulons, TFBSs and metabolic compounds. The first
relation between genes is the correlation (Pearson’s correlation) of
their expression profiles over the complete time-series. The second
relation is based on the results of the time sliding analysis, which
describes when the expression of a gene changes significantly
during growth. For the third correlation, a p-value describing the
putative interactions between genes was calculated using the
network reconstruction algorithm GeneNet [25]. The fourth
relation between genes is based on the fact that genes belonging
to one operon are transcribed from one mRNA and, therefore, will
show the same or very similar expression profiles. This relation
was established by our operon prediction method, which does not
completely match the real situation because operon prediction
algorithms do not predict mRNA stability or dynamic changes in
mRNA levels [34]. The fifth relation is based on shared DNA
motifs in upstream regions of genes or operons, indicating that
they may be controlled by the same transcriptional regulator. This
correlation is based on literature-derived DNA motifs supple-
mented with novel motifs discovered by DISCLOSE [30] using
the time-series data and functional annotation of genes. The sixth
relation is based on regulon data derived from literature and on
our in-house regulon data sets. The seventh relation is between genes
and compounds; it is based on the metabolic reaction database
specific for L. lactis MG1363 [35,36] that couples production and
consumption of compounds to gene products. The results of all
seven correlation analyses were stored in a Cytoscape [31]
compatible format and include their weight factors, if applicable.
Cytoscape ‘‘Merge Networks’’ and the Cytoscape ‘‘plug-in’’
CABIN [37] were used to combine the seven data sources to
create a gene regulatory network.
Results and Discussion
Standardization of milk fermentation conditionsMilk is a very complex medium that changes continuously
during fermentation by L. lactis as the milk protein (casein) is being
degraded by the bacterial proteases and the resulting peptides and
amino acids, as well as vitamins, are used. At the same time,
lactose is being consumed and lactate and other fermentation
products are being produced, changing the pH of the medium. An
outgrown frozen or freeze-dried milk culture is typically used to
inoculate fresh milk for fermentations. Because such cultures are
acidic and the bacteria have undergone an acid stress response,
their physiological status is highly unpredictable. To ensure the
highest degree of reproducibility in this study, the milk medium
was inoculated with an exponentially growing culture of L. lactis in
milk. Even with these precautions it should be noted that milk will
never support balanced growth of any bacterium. Balanced
growth is the only state with a defined physiological status of the
bacterium, so not even theoretically can full reproducibility be
attained with a milk medium.
The growth rates (as measured by the number of colony
forming units in time) and lactate production (as measured by
medium pH) are in close accordance for the two parallel cultures,
A and B (Fig. 1A; data only shown for culture A). Both growth
curves are characterized by at least two distinct phases, an
exponential phase between 100 and 400 min after inoculation and
a stationary phase after 400 min, which coincides with a drop in
pH below 5.0. Entry into early stationary phase can be recognized
after 250 min by a slight decrease in the growth rate at the point
where oligopeptides present in the sterilized milk become limiting
[38]. At the time points indicated with arrows in Fig. 1A, samples
were withdrawn from each culture and used for transcriptome
analysis.
Genome-wide transcription analysisAt the end of the fermentation, the milk medium had fully
coagulated but our novel extraction technique, using 3 M
guanidinium hydrochloride (the procedure will be published
separately), enabled us to obtain pure bacterial fractions from
these late stages of growth. From each of the two milk
fermentations, RNA samples were obtained over the full
fermentation period, from 100 min to 1100 min after inoculation.
In this way, a total of 12 samples were taken from each culture
(T1–T12). The RNA was analyzed by DNA microarray analysis
according to the scheme shown in Fig. 1B. Intensive data analysis
was done on the results derived from the fermentation culture A
while the second data set (derived from culture B) was used to
verify and/or confirm observations in the data set of culture A.
The DNA microarray raw data sets and normalized ratio data can
be downloaded from the NCBI GEO database [19] as series
GSE40780 and scaled signal data can be found at the
accompanying website to this paper (http://milkts.molgenrug.nl).
A global view of the transcriptome of L. lactis MG1363during milk fermentation reveals temporal geneexpression responses
The analysis of the transcriptome data from culture A followed
a two-step procedure. First, the data was divided into distinct
response periods using algorithms for the mining for global trends.
Second, each of these response periods was then characterized by
identifying the Clusters of Orthologous Groups (COG) [39] that
responded most significantly.
A principal component analysis (PCA) of the intensity levels
showed a division of the time points into three distinct response
periods (Fig. 2B). Time points T1–T6 cluster together as do time
points T8–T12 while time point T7 assumes an intermediate
position. The first cluster could be argued to consist of a time point
T1–T4 sub-cluster and a time point T5–T6 sub-cluster. A
homogenous trajectory was manually drawn from sub-cluster
T1–T4 through sub- cluster T5–T6 and time point T7 to cluster
T8–T12, suggesting that the changes in gene expression are
gradual.
A somewhat similar grouping of the data set was obtained when
a Pearson’s correlation was calculated between all time points
(Fig. 2). Highest correlation of gene expression exists between time
points T1 to T7 and between time points T8 to T12, whereas no
correlation was observed between these two major clusters. Within
the T1–T7 cluster, the correlation was strongest between T1, T2,
T3 and T4 and somewhat less between T5 and T6.
Together, the PCA and Pearson’s correlation analysis suggest a
division of L. lactis gene expression during milk fermentation into
five distinct temporal response groups. The characteristics of each
response period are shown in Table 1.
The fact that the fermentation process can be divided into
response periods with respect to gene expression levels implies that
the cells encountered different stressful conditions at four critical
points in time, namely at T4, T7, T9, and T10. The nature of the
Transcriptome Analysis of L. lactis Grown in Milk
PLOS ONE | www.plosone.org 3 January 2013 | Volume 8 | Issue 1 | e53085
stress conditions is so far unknown, although the increasing acidity
and the accumulation of increasingly more lactate in the medium
must be important in this respect. The response of the different
gene clusters suggests certain changes in metabolite concentrations
and intracellular environment.
To proceed from the analysis of overall global trends in gene
expression towards trends in expression of individual genes, the
number of genes with significantly high intensity ratios throughout
the fermentation was assessed i.e., the genes of which the
expression level changed significantly between two consecutive
time points (Table 1). A minor response period was seen from time
point T4 to T6, within the exponential growth phase. In this
period, the expression levels of approximately 40 to 80 genes
significantly changed between consecutive time points (data not
shown). At the very end of the exponential growth phase (T6 and
T7), when the culture reaches a pH of 5.0, a high number of genes
(more than 200) showed a significant change in expression. The
analysis shows that a marked response takes place when the
culture enters the stationary phase, at T7. The expression levels of
approximately 230 genes changed significantly in the period from
T7 to T8. In the next period (T8–T10), characterized by a 1.7-fold
reduction in the number of colony-forming units, the expression
levels of approximately 40 to 50 genes changed significantly
between consecutive time points. Finally, from time point T10 up
to time point T12, the expression of only a few genes (4 to 12)
changed.
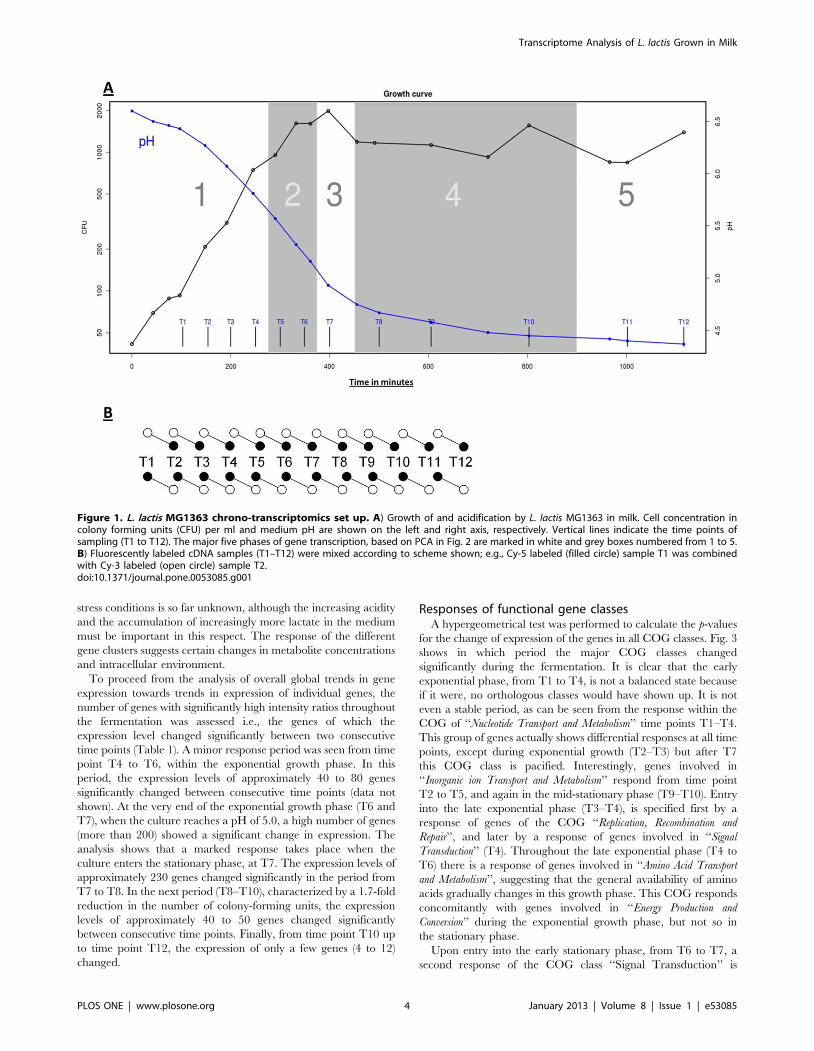
Responses of functional gene classesA hypergeometrical test was performed to calculate the p-values
for the change of expression of the genes in all COG classes. Fig. 3
shows in which period the major COG classes changed
significantly during the fermentation. It is clear that the early
exponential phase, from T1 to T4, is not a balanced state because
if it were, no orthologous classes would have shown up. It is not
even a stable period, as can be seen from the response within the
COG of ‘‘Nucleotide Transport and Metabolism’’ time points T1–T4.
This group of genes actually shows differential responses at all time
points, except during exponential growth (T2–T3) but after T7
this COG class is pacified. Interestingly, genes involved in
‘‘Inorganic ion Transport and Metabolism’’ respond from time point
T2 to T5, and again in the mid-stationary phase (T9–T10). Entry
into the late exponential phase (T3–T4), is specified first by a
response of genes of the COG ‘‘Replication, Recombination and
Repair’’, and later by a response of genes involved in ‘‘Signal
Transduction’’ (T4). Throughout the late exponential phase (T4 to
T6) there is a response of genes involved in ‘‘Amino Acid Transport
and Metabolism’’, suggesting that the general availability of amino
acids gradually changes in this growth phase. This COG responds
concomitantly with genes involved in ‘‘Energy Production and
Conversion’’ during the exponential growth phase, but not so in
the stationary phase.
Upon entry into the early stationary phase, from T6 to T7, a
second response of the COG class ‘‘Signal Transduction’’ is
Figure 1. L. lactis MG1363 chrono-transcriptomics set up. A) Growth of and acidification by L. lactis MG1363 in milk. Cell concentration incolony forming units (CFU) per ml and medium pH are shown on the left and right axis, respectively. Vertical lines indicate the time points ofsampling (T1 to T12). The major five phases of gene transcription, based on PCA in Fig. 2 are marked in white and grey boxes numbered from 1 to 5.B) Fluorescently labeled cDNA samples (T1–T12) were mixed according to scheme shown; e.g., Cy-5 labeled (filled circle) sample T1 was combinedwith Cy-3 labeled (open circle) sample T2.doi:10.1371/journal.pone.0053085.g001
Transcriptome Analysis of L. lactis Grown in Milk
PLOS ONE | www.plosone.org 4 January 2013 | Volume 8 | Issue 1 | e53085

observed. A new group of genes involved in ‘‘Translation, Ribosomal
Structure and Biogenesis’’ responds for at the transition point from
exponential to stationary growth (T7–T8). Throughout the early
stationary phase (T7 to T9), the group of ‘‘Unknown’’ genes
responds. A significant response from genes involved in ‘‘Posttrans-
lational Modification, Protein Turnover and Chaperones’’ is detected
between all consecutive time points, except for time point T8–T9.
This may suggest a change in protein turnover as many of these
genes are regulated by the heat shock response [40].
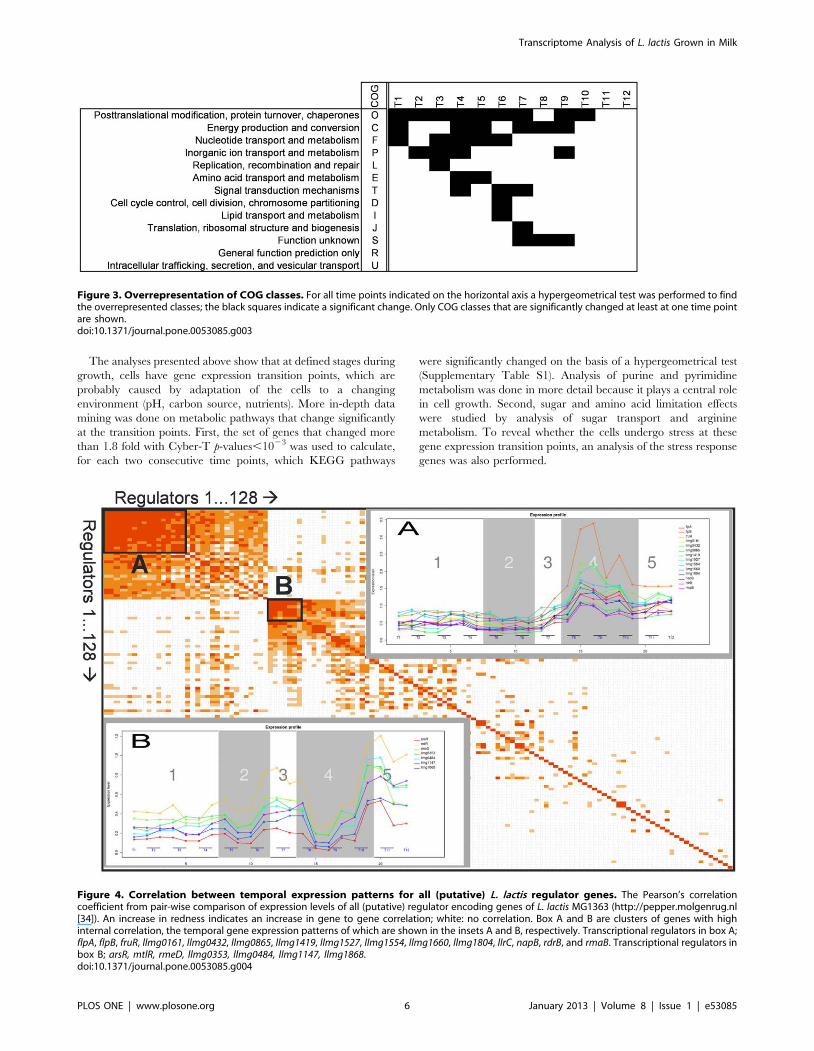
A customized functional group of genes, namely the 128
putative and the known transcriptional regulators [41] in the
genome of L. lactis MG1363 was analyzed with respect to possible
gene-to-gene expression correlations. In Fig. 4, rows and columns
are shown with descending probabilities, emphasizing the high
correlation that exists between the members of the first cluster,
consisting of 15 regulator genes (Fig. 4, box A), and between the 6
genes of an unrelated second cluster (Fig. 4, box B). Whereas box
A genes show a constant expression level before T7 followed by an
induction phase (Fig. 4, inset A), the second group of genes shows a
more complex behavior. Both expression patterns reveal the
presence of a critical point around T7, while for box B genes a
second imported moment in time is after T9.
Figure 2. Correlation between time points. A) Pearson’scorrelation. Sets of intensity levels from each time point (average ofthe two biological replicates) were analysed as separate curves withshapes determined by the intensity levels of the genes as a function ofthe gene number. Pearson’s correlation was calculated for pairs of thesegenome-wide intensity curves and are shown in the T1–T126T1–T12matrix. Grey scale: decreasing intensity corresponds to decreasingcorrelation; white: no correlation. B) PCA. Projection of the 12 timepoints using 3 principle components shows 5 distinct clusters; 1: T1–T4,2: T5–T6, 3: T7, 4: T8–T10 and 5: T11–T12.doi:10.1371/journal.pone.0053085.g002
Ta
ble
1.
Re
spo
nse
pe
rio
ds
ide
nti
fie
dfo
rL.
lact
isd
uri
ng
ferm
en
tati
on
of
milk
.
Te
mp
ora
lre
spo
nse
gro
up
Tim
ep
oin
tT
ime
aft
er
inn
occ
ula
tio
n(m
in)
Ce
lld
en
sity6
10
8m
l21
pH
ran
ge
Nu
mb
er
of
up
reg
ula
ted
ge
ne
sN
um
be
ro
fd
ow
nre
gu
late
dg
en
es
Re
spo
nd
ing
CO
G#
Ea
rly
ex
po
ne
nti
al
T1
,T
2,
T3
,T
41
00
–2
50
1–
66
.7–
6.1
40
–5
02
0–
40
C,
E,F,
L,O
,P
,T
La
tee
xp
on
en
tia
lT
5,
T6
30
0–
35
08
–1
15
.9–
5.2
50
–7
03
0–
60
C,
D,
E,F,
O
Ea
rly
sta
tio
na
ryT
74
00
12
5.1
13
01
80
C,
J,O
,S,
T
Mid
dle
sta
tio
na
ryT
8,
T9
,T
10
50
0–
80
01
04
.6-
4.5
50
–1
40
20
–2
20
C,
O,
P,
S,T
La
test
ati
on
ary
T1
1,
T1
29
00
–1
10
01
04
.5–
4.3
0–
30
0–
50
#Le
tte
rsco
rre
spo
nd
toth
est
and
ard
CO
Gab
bre
viat
ion
.d
oi:1
0.1
37
1/j
ou
rnal
.po
ne
.00
53
08
5.t
00
1
Transcriptome Analysis of L. lactis Grown in Milk
PLOS ONE | www.plosone.org 5 January 2013 | Volume 8 | Issue 1 | e53085
The analyses presented above show that at defined stages during
growth, cells have gene expression transition points, which are
probably caused by adaptation of the cells to a changing
environment (pH, carbon source, nutrients). More in-depth data
mining was done on metabolic pathways that change significantly
at the transition points. First, the set of genes that changed more
than 1.8 fold with Cyber-T p-values,1023 was used to calculate,
for each two consecutive time points, which KEGG pathways
were significantly changed on the basis of a hypergeometrical test
(Supplementary Table S1). Analysis of purine and pyrimidine
metabolism was done in more detail because it plays a central role
in cell growth. Second, sugar and amino acid limitation effects
were studied by analysis of sugar transport and arginine
metabolism. To reveal whether the cells undergo stress at these
gene expression transition points, an analysis of the stress response
genes was also performed.
Figure 3. Overrepresentation of COG classes. For all time points indicated on the horizontal axis a hypergeometrical test was performed to findthe overrepresented classes; the black squares indicate a significant change. Only COG classes that are significantly changed at least at one time pointare shown.doi:10.1371/journal.pone.0053085.g003
Figure 4. Correlation between temporal expression patterns for all (putative) L. lactis regulator genes. The Pearson’s correlationcoefficient from pair-wise comparison of expression levels of all (putative) regulator encoding genes of L. lactis MG1363 (http://pepper.molgenrug.nl[34]). An increase in redness indicates an increase in gene to gene correlation; white: no correlation. Box A and B are clusters of genes with highinternal correlation, the temporal gene expression patterns of which are shown in the insets A and B, respectively. Transcriptional regulators in box A;flpA, flpB, fruR, llmg0161, llmg0432, llmg0865, llmg1419, llmg1527, llmg1554, llmg1660, llmg1804, llrC, napB, rdrB, and rmaB. Transcriptional regulators inbox B; arsR, mtlR, rmeD, llmg0353, llmg0484, llmg1147, llmg1868.doi:10.1371/journal.pone.0053085.g004
Transcriptome Analysis of L. lactis Grown in Milk
PLOS ONE | www.plosone.org 6 January 2013 | Volume 8 | Issue 1 | e53085
Expression profiles of genes involved in nucleotidemetabolism define changes in PRPP and nucleotideavailability
Purine and pyrimidine nucleotides, the building blocks for DNA
and RNA synthesis, are formed de novo from 5-phosphoribosyl-1-
pyrophosphate (PRPP) and amino acids in L. lactis and most other
bacteria [5]. Through alternative salvage pathways, nucleotides
can be synthesized from PRPP and either nucleosides or
nucleobases. Most of the purine de novo genes are regulated by
the PurR activator, which responds in a feed-forward manner to
the concentration of PRPP. The expression patterns of the known
PurR regulon members in the nucleotide orthologous group
clearly show that at least two critical time points exist before T7
(Fig. 5A). From T5 to T9, the expression of the PurR regulon
members drops, indicating that the amount of PRPP had
decreased from high at T5 to low at T9. In contrast, the sharp
rise in PurR regulon gene expression from T4 to T5 indicates that
PRPP accumulated from an intermediary level at T4 to a high
level at T5. A short period of decreasing PurR regulon mRNA
from T2 to T3 is observed for almost all PurR regulon members.
The PurR regulon is a good example of the lack in coordination
between the expression of regulator and target genes, as the
temporal expression curve of the purR gene (red line in Fig. 5A) is
almost flat. The purR gene is known to be under PRPP-
independent repression control by binding of PurR to its promoter
region. In contrast, the PurR regulon members are under PRPP-
regulated PurR-mediated activator control [5]. Purine genes are
divided into at least three clusters in L. lactis, according to
regulatory mechanisms. A small regulon comprised of guaA and
guaB responds to changes in the G-nucleotide concentration by an
unknown mechanism (Mogens Kilstrup, unpublished). The guaAB
genes show only minor changes in their temporal expression
patterns (Fig. 5B). In other words, the intracellular G-nucleotide
concentration did not severely change during the fermentation.
The xpt-pbuX operon is subject to riboswitch control, with the
purine bases guanine or hypoxanthine as low molecular weight
effectors [5,42]. The temporal expression of these genes followed
that of the PurR regulon members, suggesting that an inverse
correlation exists between the levels of PRPP and free purine bases
during fermentation.
It appears that the highest expression of the PurR regulon genes
during milk fermentation coincides with a decrease in the growth
rate. Previously, it was observed that growth in a synthetic amino-
acid-supplemented SA medium resulted in a partial purine
deficiency [43]. Purine addition increased the growth rate and
lowered the expression of PurR regulon members. It appears that
the purine deficiency, as indicated by the increased expression
observed for purR genes, is due to an inability of the de novo
pathway to meet the high consumption rate during the stressful
transition into the stationary phase. Since the PurR regulon genes
are induced under these conditions, the precursor PRPP pool was
elevated compared to the normal level. Upon the subsequent
lowering of the growth rate in the stationary phase, the
consumption rate lowered and matched the production rate. This
resulted in renormalization of the PRPP pool and down regulation
of PurR regulon members. Analysis of the upstream DNA regions
of the PurR regulon genes and genes with correlated transcription
profiles is described below.
Fig. 5C shows the temporal expression patterns of the genes of
the regulon of PyrR, an RNA binding protein responding to high
uridine 5-monophaspate (UMP) concentrations. The PyrR
regulon has one critical time point at around T3. From T1 to
T3, expression of all regulon members continually increases. A
subsequent decrease in expression levels until T9 is indicative of an
increase in the UMP concentration. PyrR is a genuine member of
the PyrR regulon and is transcribed from the PyrR-regulated
pyrRPB-carA operon. Accordingly, pyrR mRNA levels follow the
same trend as those of the other PyrR regulon members.
The heat stress response genes behave as an explicitgroup
The temporal expression profiles of the major stress response
genes groEL2, groES, hrcA, dnaJ and dnaK show a high correlation
during growth in milk. This similar expression behavior allowed to
pinpoint the common CIRCE DNA motif, see below. When L.
lactis MG1363 was inoculated, the stress genes showed relatively
low levels of expression up to T6 (T5 for hrcA). The expression of
all genes increased when the cells entered the transition state of
growth (T6 to T7). Subsequently, the expression increased even
more in the early stationary growth phase (T8 to T9). There
appears to be no correlation between the expression profiles of the
heat stress genes and global gene expression during the transition
from the early to the late stationary phase of growth. In other
words, although some processes are affected by stress gene
responses, the majority of processes are not correlated to the
expression of stress response genes during stationary phase.
DNA-motifs discovered on basis of gene expressionprofiles
Transcriptional regulators play central roles in the expression of
genes by binding to specific binding sites (TFBSs) in upstream
intergenic regions. To uncover DNA-motifs that are potential
TFBSs, we searched for overrepresented DNA sequences in the
upstream intergenic region of genes that showed correlated
expression. The results are presented in the supplementary Table
S1 which include a column indicating if the DNA motif is
identified in the upstream region of a core genome gene of L. lactis
[44].
A total of 58 clusters of genes identified by k-means clustering
(using Euclidian distance) were examined using the DISCLOSE
software package [30]. Many of the identified DNA-motifs that
consisted of four to five bases were discarded because of their
abundance. Non-palindromic elements were only selected if their
general occurrence in intergenic regions of the L. lactis MG1363
genome was less than 5%. This manual curation pinpointed 25
new DNA-motifs as being potential motifs of regulatory signifi-
cance. For each motif a weight matrix was built and used to screen
all the intergenic regions in the L. lactis MG1363 genome for
further occurrences.
The upstream regions of the genes in some clusters contained
more than one potential DNA-motif whereas others contained no
obvious DNA-motif. DISCLOSE identified two motifs in cluster
25, containing 11 genes. One DNA motif, GA-
CAAAWWTWTTTGAC (motif name = llmg_m001), is located
upstream of llmg_2249, nifJ, and cadA, which encode proteins with
significant similarity to an iron-dependent oxidoreductase, a
pyruvate-flavodoxin oxidoreductase, and an ion efflux ATPase,
respectively. Expression of these three genes is known to be
reduced in the absence of cysteine [45]. Allowing for one
mismatch, similar motifs are also present upstream of the genes
llmg_1857 and llmg_2516/llmg_2517, that are not known to be
involved in the regulon mentioned above. The second motif
(TCAGTWWACTG; llmg_m002) in cluster 25 is located
upstream of pyrR and pyrB and is also present upstream of arcD1
and acmC. Cluster 47 also contained two motifs (llmg_m003 and
llmg_m004), of which the latter (WWWCCGAACWWW) occurs
9 times and resembles the known PurBox (AWWWCC-
Transcriptome Analysis of L. lactis Grown in Milk
PLOS ONE | www.plosone.org 7 January 2013 | Volume 8 | Issue 1 | e53085

Transcriptome Analysis of L. lactis Grown in Milk
PLOS ONE | www.plosone.org 8 January 2013 | Volume 8 | Issue 1 | e53085

GAACWWT) [46]. It is present upstream of the purine
biosynthesis genes glyA, fhs, purC, purM, purD, purH and purR.
The other is the DNA-motif (llmg_m003) that is highly specific for
purine biosynthesis; it was found upstream of only three other
genes, yajC, llmg_1234 and llmg_1550 previously unlinked to purine
biosynthesis. Strikingly, a tiled motif is present upstream of genes
coding for other proteins involved in purine biosynthesis, namely
purL, pbuO, purM, purC. This motif (TTCNNNNNNNNCGAAC;
llmg_m003), was present upstream of seven genes unrelated to
purine biosynthesis and has recently been described by Jendresen
and co-workers [47].
The motif (AGCACTCWWWTWWWWAGAGTGC-
TAAWW; llmg_m005) is present upstream of groES, and dnaK,
two member of cluster 2. This motif resembles the so-called
CIRCE box; (TTAGCACT-10N-GAGTGCTAA; [48]). This box
is also present upstream of groEL2, hrcA and dnaJ. A survey of the
intergenic regions with motif llmg_m005 also identified it
upstream of two other stress response genes, hrcA and dnaJ. A
weight matrix allowed identifying two more copies of this sequence
namely upstream of llmg_0268 - llmg_0269, encoding a putative
ABC-type multidrug transporter, and upstream of sugE, specifying
a protein putatively involved in multidrug resistance.
The divergently transcribed genes llmg_1235 and llmg_1236,
both part of cluster 39, share a perfect palindromic sequence
(TATATGAGATATCTCATATA) in their upstream region. The
llmg_1236 gene, encoding a transmembrane protein with unknown
function, starts 93 bp downstream of this DNA motif while the
llmg_1235 gene, encoding for a cAMP-binding protein, is only
31 bp downstream of the same DNA motif.
Genes of cysteine metabolism (GO:0006534) are present in
cluster 11, which means that their expression profiles are very
similar over the complete time-series. A motif (GACWNAATAT-
TYYGTCA; llmg_m017) in the upstream regions of three out of
four genes is also present upstream of the genes of two putative
ABC transporters (llmg_1973 and llmg_0341) and two putative
membrane proteins (llmg_1683 and llmg_2454), all of which have
no known functions.
General stress protein genes are overrepresented in cluster 49
according to the FIVA analysis but no common motif could be
identified in their upstream sequences, even though the expression
profiles correlated really well in this cluster.
Two genes that are possible members of the KEGG pathway
‘‘Starch and Sucrose Metabolism’’ of L. lactis MG1363 (path_llm00500)
share the motif GCGNNNCGCT. One of them, llmg_1195 is
known to be a member of the CcpA regulon [11].
Two DNA-motifs (GAT-N9-CCC; llmg_m024 and CCC-N9-
GGC; llmg_m025) are present upstream of seven and four
operons, respectively, of the ten operons of cluster 32. Subsequent
mapping on the genome revealed that the motifs overlap at one
position: the elongated DNA motif GAT-N9-CCC-N9-GGC
(llmg_m044) is present upstream of the operon dexA, maa, amyY,
agl, mapA.
The motifs described above all contain a spacing of around 9–
10 bases. This is not the case for the DNA-motif upstream of the
genes in cluster 20. In this cluster, genes coding for proteins
involved in the ‘‘Organic Acid Metabolic Process’’ (GO_0006082) are
overrepresented. The DNA motif consists of a direct repeat with
variable spacing (see Table 2). This extra freedom in spacing
reduces the significance of the score for this kind of motif, which is
not easily discovered by the current DNA motif mining tools. This
would suggest that many more interesting DNA motifs still remain
to be discovered.
Discovery of DNA-motifs based on known regulonsThe method used to discover regulatory motifs was also applied
to genes belonging to the same regulon. In this way, 10 additional
motifs were identified.
The expression of arginine metabolism in L. lactis is controlled
by the two homologous transcriptional regulators ArgR and AhrC.
Using the upstream DNA regions of genes under control of AhrC,
the obtained DNA motif (GTATWATWATA; llmg_m027) is
comparable with the AhrC DNA binding motif known from
literature (RNATAWWWRWRCW [49]). A weight matrix search
using motif llmg_m027 identified this motif upstream of all AhrC
members except the operon argGH. No significant motif could be
obtained for the ArgR regulon because the known ArgR motif
(Larsen et al) is very AT rich leading to a high background.
Interestingly, next to the known PyR DNA motif
(ARTCCNGNGAGGYT, [50]), an overrepresented DNA motif
(CTGACAGWTCTRTCA ; llmg_m043) is present in the
upstream regions of all PyR regulon members.
The transcription profiles of the homologous transcriptional
regulator genes flpA and flpB show a high correlation and we could
discern a highly conserved motif (TTTAWRMWYMGW-
WYMGCGG ; llmg_m028) that is specific for these two genes.
It is located at 2200 relative to the start codon of each gene.
Although a putative DNA binding motif has been proposed for
FlpA of L. lactis IL1403 [51], this sequence is not present in the
upstream region of flpB in L. lactis strains IL1403 and MG1363.
Analysis of the regulon of the global regulator CodY revealed
that besides the known CodY-Box [12] a second motif is present.
In three of the CodY-regulated operons this motif is not located in
the upstream intergenic regions but in the relatively large
intergenic region between the second and the third gene of each
operon. It is not clear whether this motif at such an unusual
location could have any function.
L. lactis CcpA is a global regulator controlling the expression of a
large number of genes [52]. The expression profiles of several
CcpA regulon members differ during growth in milk, suggesting
that other regulators are also involved in the expression of these
genes. Indeed, in addition to the known CcpA DNA-binding motif
cre, two additional motifs (llmg_m032, llmg_m033) in the upstream
Figure 5. Transcription profiles of purine and pyrimidine metabolism genes. A) PurR regulon members; purB, purC, purD, purE, purF, purH,purK, purL purM, purN, purQ and purR (red line). B) Transcription profile of; purA, guaA, guaB, xpt and pbuX. C) PyrR regulon members; carA, pyrB, pyrC,pyrDb, pyrE, pyrK, pyrP and pyrR (red line).doi:10.1371/journal.pone.0053085.g005
Table 2. Motifs with variable spacing between the conservedDNA repeats present upstream of the genes in cluster 20.
lysS (llmg_0389) TGTCAGT 5N TGTaAGT
lysA (llmg_1185) TGTCAGT 11N TGTCAGT
leuC (llmg_1281) TGTCAGT 39N TGTCAGT
hom (llmg_1331) TGTCAGT 32N TGTCAGT
arcD1 (llmg_2311) TGTCAGT 11N TGTCAGT
llmg_2586 TGTCAGT 22N TGTCAGT
doi:10.1371/journal.pone.0053085.t002
Transcriptome Analysis of L. lactis Grown in Milk
PLOS ONE | www.plosone.org 9 January 2013 | Volume 8 | Issue 1 | e53085
regions of several CcpA regulon members could be involved in
their fine tuning.
In total 36 new DNA-motifs were identified in the genome of L.
lactis MG1363, of which 29 were pinpointed on the basis of the
clustering results and 10 were identified using regulon classification
data. To make this valuable information easily accessible, a
database was made from the 27 known and the 39 new DNA-
motifs, the consensus sequences of which were built from the
alignments (see Supplementary Materials, Table S1 and http://
milkts.molgenrug.nl). Furthermore, the database contains all DNA
sequence elements from which the motifs were derived.
Building an L. lactis GRNUsing the ‘‘Network Building Blocks’’ presented Table 3 a Gene
Regulatory Network (GRN) was built and visualized in Cytoscape
[53] (Fig. 6). The GRN obtained in this way is especially useful for
discovery of interactions between genes, regulatory elements and
metabolic compounds. One straightforward method to mine the
GRN is to build the network step by step, starting with a single
gene or operon of interest and subsequently adding coupled
information, such as regulons, TFBSs, gene-to-gene expression
correlation and metabolic compounds and pathways. Subsequent-
ly, these connected items (first order connection) can be used to
expand the network to a second order.
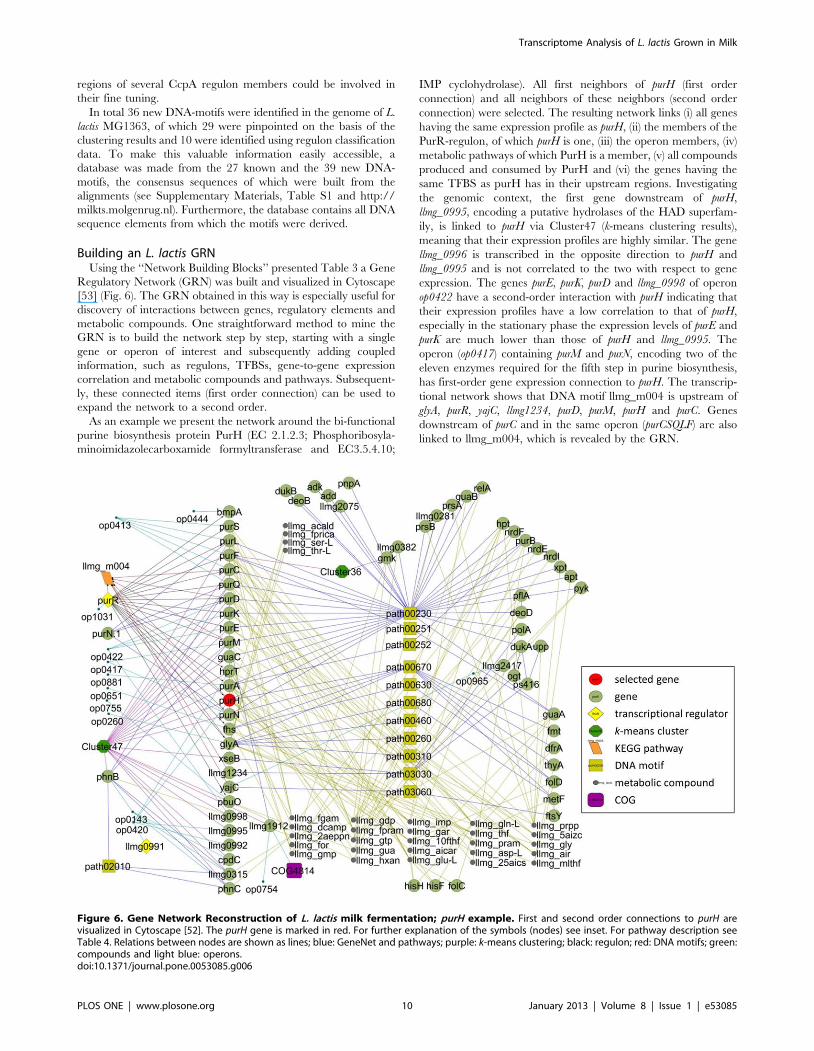
As an example we present the network around the bi-functional
purine biosynthesis protein PurH (EC 2.1.2.3; Phosphoribosyla-
minoimidazolecarboxamide formyltransferase and EC3.5.4.10;
IMP cyclohydrolase). All first neighbors of purH (first order
connection) and all neighbors of these neighbors (second order
connection) were selected. The resulting network links (i) all genes
having the same expression profile as purH, (ii) the members of the
PurR-regulon, of which purH is one, (iii) the operon members, (iv)
metabolic pathways of which PurH is a member, (v) all compounds
produced and consumed by PurH and (vi) the genes having the
same TFBS as purH has in their upstream regions. Investigating
the genomic context, the first gene downstream of purH,
llmg_0995, encoding a putative hydrolases of the HAD superfam-
ily, is linked to purH via Cluster47 (k-means clustering results),
meaning that their expression profiles are highly similar. The gene
llmg_0996 is transcribed in the opposite direction to purH and
llmg_0995 and is not correlated to the two with respect to gene
expression. The genes purE, purK, purD and llmg_0998 of operon
op0422 have a second-order interaction with purH indicating that
their expression profiles have a low correlation to that of purH,
especially in the stationary phase the expression levels of purE and
purK are much lower than those of purH and llmg_0995. The
operon (op0417) containing purM and purN, encoding two of the
eleven enzymes required for the fifth step in purine biosynthesis,
has first-order gene expression connection to purH. The transcrip-
tional network shows that DNA motif llmg_m004 is upstream of
glyA, purR, yajC, llmg1234, purD, purM, purH and purC. Genes
downstream of purC and in the same operon (purCSQLF) are also
linked to llmg_m004, which is revealed by the GRN.
Figure 6. Gene Network Reconstruction of L. lactis milk fermentation; purH example. First and second order connections to purH arevisualized in Cytoscape [52]. The purH gene is marked in red. For further explanation of the symbols (nodes) see inset. For pathway description seeTable 4. Relations between nodes are shown as lines; blue: GeneNet and pathways; purple: k-means clustering; black: regulon; red: DNA motifs; green:compounds and light blue: operons.doi:10.1371/journal.pone.0053085.g006
Transcriptome Analysis of L. lactis Grown in Milk
PLOS ONE | www.plosone.org 10 January 2013 | Volume 8 | Issue 1 | e53085
In the next step of GRN building data of transcription
regulation derived from literature was added, extending the
network with genes under control of PurR. The PurBox’s
described by Kilstrup and Jendresen [44,45] was not included in
this network because it defines a poorly conserved motif and would
add many irrelevant genes to the GRN. Subsequently, integration
of the k-means clusters derived from DISCLOSE adds links
between genes with similar expression profiles over the complete
time-series. Cluster 47 contains the majority of the pur genes
(operons: purCSQLF, purDEK llmg0998, purMN, purH) but the GRN
also links a putative phosphonate transporter operon (phnB phnC
llmg_0315 cpdC), and the guanine permease gene pbuO, Further-
more, several genes encoding hypothetical proteins are now linked
to known genes on the basis of their expression profiles and other
edges of the transcriptional network. Thus llmg_1912 is linked to
pnuO, llmg_0998 to purDEK, llmg_0995 to purH and llmg_315 to
phnBC. Interestingly, glyA and purD are involved in consumption of
compound llmg_gly while they also have the same upstream motif
llmg_m004.
This single example shows the power of GRNs to discover links
between various biological systems. It is beyond the scope of this work
to describe all the interesting findings derived from this GRN. The
network built here, starting with purH as the centre node, is available
as an XGML file (‘‘subnetwork_purH.xgmml’’) for Cytoscape. The
complete network can be downloaded from our website.
Conclusion
This analysis shows how genes and classes of genes behave when
L. lactis is grown in milk. Deep insights in the processes of gene
regulation are gained and leads for future experimental research
can be obtained from this detailed analysis of this milk
transcriptome time-series. As an example, we uncovered a
substantial number of novel putative TFBSs which seem to be
operational during growth in milk. Finally, all results were used to
build the L. lactis milk fermentation GRN. The GRN building
blocks that we used are freely available on-line and will give
researchers in the field the exiting possibility to mine and visualize
in detail their process of interest. In another paper this valuable
resource is extended with an in-depth elucidation of the growth
behavior of L. lactis MG1363 in rich GM17 medium.
Supporting Information
Table S1 An overview of the identified DNA motifs onthe basis of clustering or regulon data.(XLSX)
Acknowledgments
We thank Rutger Brouwer for various R routines and fruitful discussions.
Author Contributions
Conceived and designed the experiments: AJ MEH MK. Performed the
experiments: AJ MEH. Analyzed the data: AJ MEH MK JK. Contributed
reagents/materials/analysis tools: AJ MEH. Wrote the paper: AJ MEH
MK OPK JK.
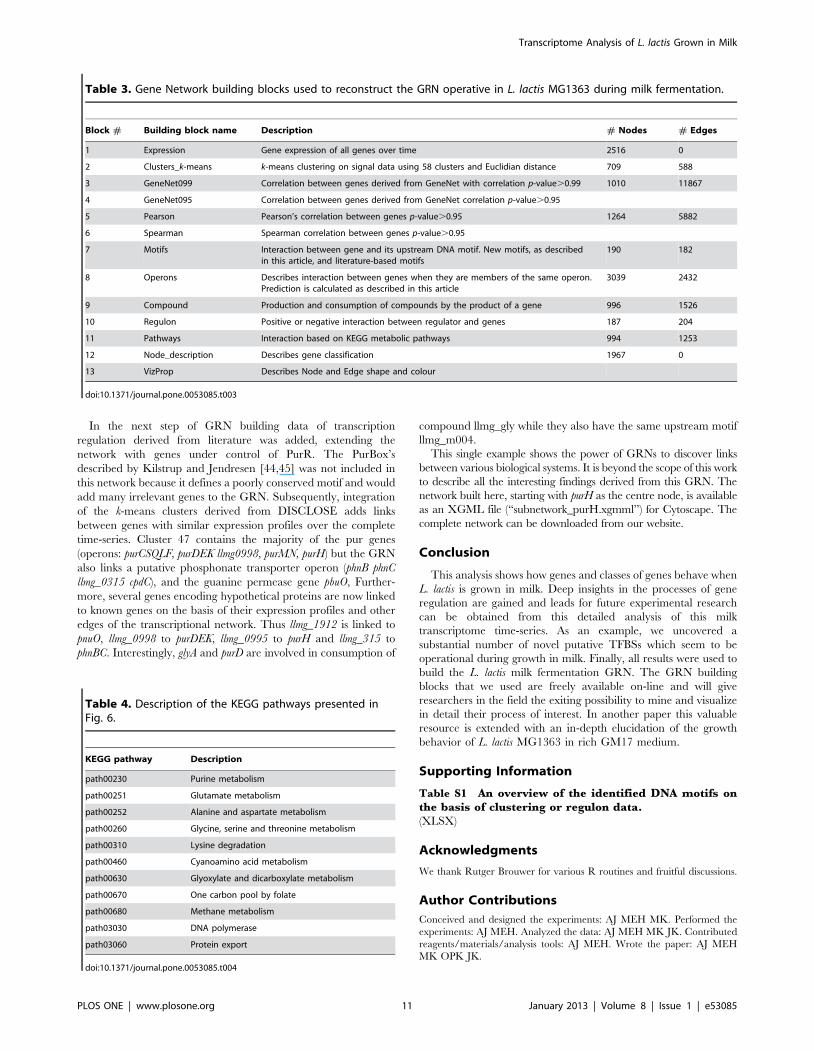
Table 3. Gene Network building blocks used to reconstruct the GRN operative in L. lactis MG1363 during milk fermentation.
Block # Building block name Description # Nodes # Edges
1 Expression Gene expression of all genes over time 2516 0
2 Clusters_k-means k-means clustering on signal data using 58 clusters and Euclidian distance 709 588
3 GeneNet099 Correlation between genes derived from GeneNet with correlation p-value.0.99 1010 11867
4 GeneNet095 Correlation between genes derived from GeneNet correlation p-value.0.95
5 Pearson Pearson’s correlation between genes p-value.0.95 1264 5882
6 Spearman Spearman correlation between genes p-value.0.95
7 Motifs Interaction between gene and its upstream DNA motif. New motifs, as describedin this article, and literature-based motifs
190 182
8 Operons Describes interaction between genes when they are members of the same operon.Prediction is calculated as described in this article
3039 2432
9 Compound Production and consumption of compounds by the product of a gene 996 1526
10 Regulon Positive or negative interaction between regulator and genes 187 204
11 Pathways Interaction based on KEGG metabolic pathways 994 1253
12 Node_description Describes gene classification 1967 0
13 VizProp Describes Node and Edge shape and colour
doi:10.1371/journal.pone.0053085.t003
Table 4. Description of the KEGG pathways presented inFig. 6.
KEGG pathway Description
path00230 Purine metabolism
path00251 Glutamate metabolism
path00252 Alanine and aspartate metabolism
path00260 Glycine, serine and threonine metabolism
path00310 Lysine degradation
path00460 Cyanoamino acid metabolism
path00630 Glyoxylate and dicarboxylate metabolism
path00670 One carbon pool by folate
path00680 Methane metabolism
path03030 DNA polymerase
path03060 Protein export
doi:10.1371/journal.pone.0053085.t004
Transcriptome Analysis of L. lactis Grown in Milk
PLOS ONE | www.plosone.org 11 January 2013 | Volume 8 | Issue 1 | e53085

References
1. Wegmann U, O’Connell-Motherway M, Zomer A, Buist G, Shearman C, et al.
(2007) Complete genome sequence of the prototype lactic acid bacteriumLactococcus lactis subsp. cremoris MG1363. J Bacteriol 189: 3256.
2. Klaenhammer T R, Azcarate-Peril MA, Altermann E, Barrangou R (2007)Influence of the dairy environment on gene expression and substrate utilization
in lactic acid bacteria. J Nutr 137: 748S.
3. Pfeiler EA, Klaenhammer TR (2007) The genomics of lactic acid bacteria.Trends Microbiol 15: 546–553.
4. Kilstrup M, Martinussen J (1998) A transcriptional activator homologous to thebacillus subtilis PurR repressor is required for expression of purine biosynthetic
genes in Lactococcus lactis. J Bacteriol 180: 3907–3916.
5. Kilstrup M, Hammer K, Jensen PR, Martinussen J (2005) Nucleotidemetabolism and its control in lactic acid bacteria. FEMS Microbiol Rev 29:
555–590.6. Fernandez M, Zuniga M (2006) Amino acid catabolic pathways of lactic acid
bacteria. Crit Rev Microbiol 32: 155–183.7. Dressaire C, Redon E, Gitton C, Loubiere P, Monnet V, et al. (2011)
Investigation of the adaptation of Lactococcus lactis to isoleucine starvation
integrating dynamic transcriptome and proteome information. Microb Cell Fact10: S18.
8. Doeven MK, Kok J, Poolman B (2005) Specificity and selectivity determinants ofpeptide transport in lactococcus lactis and other microorganisms. Mol Microbiol
57 640–649.
9. Kok J, Buist G, Zomer AL, Hijum SAFT, Kuipers OP (2005) Comparative andfunctional genomics of lactococci. FEMS Microbiol Rev 29: 411–433.
10. van Hijum SAFT, Medema MH, Kuipers OP (2009) Mechanisms and evolutionof control logic in prokaryotic transcriptional regulation. Microbiology and
Molecular Biology Reviews 73: 481.11. Zomer AL, Buist G, Larsen R, Kok J, Kuipers OP (2006) Time-resolved
determination of the CcpA regulon of Lactococcus lactis spp. cremoris MG1363.
J Bacteriol 189(4):1366–81.12. den Hengst CD, van Hijum SAFT, Geurts JMW, Nauta A, Kok J, et al. (2005)
The Lactococcus lactis CodY regulon. J Biol Chem 280: 34332.13. Guedon E, Sperandio B, Pons N, Ehrlich SD, Renault P (2005) Overall control
of nitrogen metabolism in lactococcus lactis by CodY and possible models for
CodY regulation in firmicutes. Microbiology 151: 3895–3909.14. Cretenet M, Laroute V, Ulve V, Jeanson S, Nouaille S, et al. (2011) Dynamic
analysis of the Lactococcus lactis transcriptome in cheeses made from milkconcentrated by ultrafiltration reveals multiple strategies of adaptation to
stresses. Appl Environ Microbiol 77: 247–257.15. van de Guchte M, Serror P, Chervaux C, Smokvina T, Ehrlich SD, et al. (2002)
Stress responses in lactic acid bacteria. Antonie Van Leeuwenhoek 82: 187–216.
16. Makarova K, Slesarev A, Wolf Y, Sorokin A, Mirkin B, et al. (2006)Comparative genomics of the lactic acid bacteria. Proceedings of the National
Academy of Sciences 103: 15611.17. Bailey TL, Boden M, Buske FA, Frith M, Grant CE, et al. (2009) MEME
SUITE: Tools for motif discovery and searching. Nucleic Acids Res 37: W202.
18. Carlson JM, Chakravarty A, DeZiel CE, Gross RH (2007) SCOPE: A webserver for practical de novo motif discovery. Nucleic Acids Res 35(Web Server
issue): W259–64.19. Gasson MJ (1983) Plasmid complements of Streptococcus lactis NCDO 712 and
other lactic streptococci after protoplast-induced curing. J Bacteriol 154: 1.20. van Hijum SAFT, de Jong A, Baerends RJ, Karsens HA, Kramer NE, et al.
(2005) A generally applicable validation scheme for the assessment of factors
involved in reproducibility and quality of DNA-microarray data. BMCGenomics 6: 77.
21. Barrett T, Troup DB, Wilhite SE, Ledoux P, Rudnev D, et al. (2009) NCBIGEO: Archive for high-throughput functional genomic data. Nucleic Acids Res
37: D885–90.
22. Van Hijum SAFT, de la Nava JG, Trelles O, Kok J, Kuipers OP (2003)MicroPreP: A cDNA microarray data pre-processing framework. Appl
Bioinformatics 2: 241–244.23. Saal LH, Troein C, Vallon-Christersson J, Gruvberger S, Borg A, et al. (2002)
BioArray software environment (BASE): A platform for comprehensive
management and analysis of microarray data. Genome Biol 3: 1–0003.6.24. Baerends R, Smits W, De Jong A, Hamoen L, Kok J, et al. (2004) Genome2D: A
visualization tool for the rapid analysis of bacterial transcriptome data. GenomeBiol 5: R37.
25. Saeed AI, Bhagabati NK, Braisted JC, Liang W, Sharov V, et al. (2006) TM4microarray software suite. Meth Enzymol 411: 134–193.
26. Ahdesmaki M, Lahdesmaki H, Pearson R, Huttunen H, Yli-Harja O (2005)
Robust detection of periodic time series measured from biological systems. BMCBioinformatics 6: 117.
27. Opgen-Rhein R, Strimmer K (2007) From correlation to causation networks: Asimple approximate learning algorithm and its application to high-dimensional
plant gene expression data. BMC Syst Biol 1: 37.
28. Ihaka R, Gentleman R (1996) R: A language for data analysis and graphics.Journal of Computational and Graphical Statistics 5: 299–314.
29. Ahdesmaki M, Lahdesmaki H, Gracey A, Shmulevich L, Yli-Harja O (2007)Robust regression for periodicity detection in non-uniformly sampled time-
course gene expression data. BMC Bioinformatics 8: 233.
30. Blom EJ, van Hijum SAFT, Hofstede KJ, Silvis R, Roerdink JB, et al. (2008)DISCLOSE: DISsection of CLusters obtained by SEries of transcriptome data
using functional annotations and putative transcription factor binding sites.
BMC Bioinformatics 9: 535.
31. Shannon P, Markiel A, Ozier O, Baliga NS, Wang JT, et al. (2003) Cytoscape: Asoftware environment for integrated models of biomolecular interaction
networks. Genome Res 13: 2498.
32. Brouwer RWW, Kuipers OP, Hijum SAFT (2008) The relative value of operonpredictions. Briefings in Bioinformatics 9: 367–375.
33. Kingsford C, Ayanbule K, Salzberg S (2007) Rapid accurate computationaldiscovery of rho-independent transcription terminators illuminates their
relationship to DNA uptake. Genome Biol 8: R22.
34. de Jong A, Pietersma H, Cordes M, Kuipers OP, Kok J (2012) PePPER: Awebserver for prediction of prokaryote promoter elements and regulons. BMC
Genomics 13: 299.
35. Picard F, Dressaire C, Girbal L, Cocaign-Bousquet M (2009) Examination of
post-transcriptional regulations in prokaryotes by integrative biology. ComptesRendus Biologies 332: 958–973.
36. Notebaart RA, van Enckevort FH, Francke C, Siezen RJ, Teusink B (2006)
Accelerating the reconstruction of genome-scale metabolic networks. BMC
Bioinformatics 7: 296.
37. Singhal M, Domico K (2007) CABIN: Collective analysis of biologicalinteraction networks. Computational Biology and Chemistry 31: 222–225.
38. Juillard V, Le Bars D, Kunji ER, Konings WN, Gripon JC, et al. (1995)
Oligopeptides are the main source of nitrogen for lactococcus lactis duringgrowth in milk. Appl Environ Microbiol 61: 3024–3030.
39. Wheeler DL, Barrett T, Benson DA, Bryant SH, Canese K, et al. (2006)Database resources of the national center for biotechnology information. Nucleic
Acids Res 37(Database issue): D5–15.
40. Foucaud-Scheunemann C, Poquet I (2003) HtrA is a key factor in the responseto specific stress conditions in Lactococcus lactis. FEMS Microbiol Lett 224: 53–
59.
41. Wegmann U, O’Connell-Motherway M, Zomer A, Buist G, Shearman C, et al.
(2007) Complete genome sequence of the prototype lactic acid bacteriumLactococcus lactis subsp. cremoris MG1363. J Bacteriol 189: 3256.
42. Mandal M, Boese B, Barrick JE, Winkler WC, Breaker RR (2003) Riboswitches
control fundamental biochemical pathways in bacillus subtilis and other
bacteria. Cell 113: 577–586.
43. Beyer NH, Roepstorff P, Hammer K, Kilstrup M (2003) Proteome analysis ofthe purine stimulon from lactococcus lactis. Proteomics 3: 786–797.
44. Siezen RJ, Bayjanov JR, Felis GE, van der Sijde MR, Starrenburg M, et al.
(2011) Genome-scale diversity and niche adaptation analysis of Lactococcuslactis by comparative genome hybridization using multi-strain arrays. Microb
Biotechnol 4: 383–402.
45. Sperandio B, Polard P, Ehrlich DS, Renault P, Guedon E (2005) Sulfur amino
acid metabolism and its control in lactococcus lactis IL1403. J Bacteriol 187:3762.
46. Jendresen CB, Martinussen J, Kilstrup M (2012) The PurR regulon in
lactococcus lactis - transcriptional regulation of the purine nucleotide
metabolism and translational machinery. Microbiology 158: 2026–2038.
47. Kilstrup M, Martinussen J (1998) A transcriptional activator homologous to theBacillus subtilis PurR repressor is required for expression of purine biosynthetic
genes in lactococcus lactis. J Bacteriol 180: 3907.
48. Martirani L, Raniello R, Naclerio G, Ricca E, Felice M (2001) Identification of
the DNA-binding protein HrcA of streptococcus thermophilus. FEMS MicrobiolLett 198: 177–182.
49. Larsen R, Kok J, Kuipers OP (2005) Interaction between ArgR and AhrC
controls regulation of arginine metabolism in Lactococcus lactis. J Biol Chem280: 19319.
50. Bonner ER, D’Elia JN, Billips BK, Switzer RL (2001) Molecular recognition of
pyr mRNA by the bacillus subtilis attenuation regulatory protein PyrR. Nucleic
Acids Res 29: 4851.
51. Scott C, Guest JR, Green J (2000) Characterization of the Lactococcus lactistranscription factor FlpA and demonstration of an in vitro switch. Mol Microbiol
35: 1383–1393.
52. Zomer AL, Buist G, Larsen R, Kok J, Kuipers OP (2007) Time-resolved
determination of the CcpA regulon of Lactococcus lactis subsp. cremorisMG1363. J Bacteriol 189: 1366–1381.
53. Kohl M, Wiese S, Warscheid B (2011) Cytoscape: Software for visualization and
analysis of biological networks. Methods Mol Biol 696: 291–303.
Transcriptome Analysis of L. lactis Grown in Milk
PLOS ONE | www.plosone.org 12 January 2013 | Volume 8 | Issue 1 | e53085