The synthesis and systematic evaluation of modified polymeric ...
161
UNLV Theses, Dissertations, Professional Papers, and Capstones 5-2009 The synthesis and systematic evaluation of modified polymeric The synthesis and systematic evaluation of modified polymeric foams and electrically conductive polyimide/carbon/metal films foams and electrically conductive polyimide/carbon/metal films John Macharia Kinyanjui University of Nevada, Las Vegas Follow this and additional works at: https://digitalscholarship.unlv.edu/thesesdissertations Part of the Analytical Chemistry Commons, Materials Chemistry Commons, and the Polymer Chemistry Commons Repository Citation Repository Citation Kinyanjui, John Macharia, "The synthesis and systematic evaluation of modified polymeric foams and electrically conductive polyimide/carbon/metal films" (2009). UNLV Theses, Dissertations, Professional Papers, and Capstones. 1136. http://dx.doi.org/10.34917/2511891 This Dissertation is protected by copyright and/or related rights. It has been brought to you by Digital Scholarship@UNLV with permission from the rights-holder(s). You are free to use this Dissertation in any way that is permitted by the copyright and related rights legislation that applies to your use. For other uses you need to obtain permission from the rights-holder(s) directly, unless additional rights are indicated by a Creative Commons license in the record and/or on the work itself. This Dissertation has been accepted for inclusion in UNLV Theses, Dissertations, Professional Papers, and Capstones by an authorized administrator of Digital Scholarship@UNLV. For more information, please contact [email protected].
-
Upload
khangminh22 -
Category
Documents
-
view
2 -
download
0
Transcript of The synthesis and systematic evaluation of modified polymeric ...
UNLV Theses, Dissertations, Professional Papers, and Capstones
5-2009
The synthesis and systematic evaluation of modified polymeric The synthesis and systematic evaluation of modified polymeric
foams and electrically conductive polyimide/carbon/metal films foams and electrically conductive polyimide/carbon/metal films
John Macharia Kinyanjui University of Nevada, Las Vegas
Follow this and additional works at: https://digitalscholarship.unlv.edu/thesesdissertations
Part of the Analytical Chemistry Commons, Materials Chemistry Commons, and the Polymer
Chemistry Commons
Repository Citation Repository Citation Kinyanjui, John Macharia, "The synthesis and systematic evaluation of modified polymeric foams and electrically conductive polyimide/carbon/metal films" (2009). UNLV Theses, Dissertations, Professional Papers, and Capstones. 1136. http://dx.doi.org/10.34917/2511891
This Dissertation is protected by copyright and/or related rights. It has been brought to you by Digital Scholarship@UNLV with permission from the rights-holder(s). You are free to use this Dissertation in any way that is permitted by the copyright and related rights legislation that applies to your use. For other uses you need to obtain permission from the rights-holder(s) directly, unless additional rights are indicated by a Creative Commons license in the record and/or on the work itself. This Dissertation has been accepted for inclusion in UNLV Theses, Dissertations, Professional Papers, and Capstones by an authorized administrator of Digital Scholarship@UNLV. For more information, please contact [email protected].
THE SYNTHESIS AND SYSTEMATIC EVALUATION OF MODIFIED POLYMERIC
FOAMS AND ELECTRICALLY CONDUCTIVE POLYIMIDE/CARBON/METAL
FILMS
by
John Macharia Kinyanjui
Bachelor of Science Geneva College, Beaver Falls, PA
1999
Master of Science University of Nevada, Las Vegas
2003
A dissertation submitted in partial fulfillment of the requirements for the
Doctor of Philosophy Degree in Chemistry Department of Chemistry
College of Sciences
Graduate College University of Nevada, Las Vegas
May 2009
UMI Number: 3383981
INFORMATION TO USERS
The quality of this reproduction is dependent upon the quality of the copy
submitted. Broken or indistinct print, colored or poor quality illustrations and
photographs, print bleed-through, substandard margins, and improper
alignment can adversely affect reproduction.
In the unlikely event that the author did not send a complete manuscript
and there are missing pages, these will be noted. Also, if unauthorized
copyright material had to be removed, a note will indicate the deletion.
®
UMI UMI Microform 3383981
Copyright2009by ProQuest LLC All rights reserved. This microform edition is protected against
unauthorized copying under Title 17, United States Code.
ProQuest LLC 789 East Eisenhower Parkway
P.O. Box 1346 Ann Arbor, Ml 48106-1346
Copyright by John M. Kinyanjui 2009 All Rights Reserved
IN Dissertation Approval The Graduate College University of Nevada, Las Vegas
Apr i l 28 .20 09
The Dissertation prepared by
John Macharia Kinyanjui
Entitled
The Synthesis and Systematic Evaluation of Modified Polymeric Foams
and Electrically Conductive Polyimide/Carbon/Metal Films
is approved in partial fulfillment of the requirements for the degree of
Doctor of Philosophy in Chemistry
Graduate College Faculty Representative
Examination Committee Chair
Dean of the Graduate College
1017-52 i i
ABSTRACT
The Synthesis and Systematic Evaluation of Modified Polymeric Foams and Electrically Conductive Polyimide/Carbon/Metal Films
by
John Macharia Kinyanjui
Dr. David W. Hatchett, Examination Chair Assistant Professor of Chemistry University of Nevada, Las Vegas
Thermally processed PU foams are examined as a function of processing
temperatures (25, 45, 65, and 85°C) at the side, middle, and center of a simple cylindrical
mold. The PU foams show both chemical and morphological differences as a function of
the processing temperature and radial position within the mold. Thermal degradation of
uretoneimine structures, the emergence of carbodiimide structures, and extent of reaction
of isocyanate groups are measured using photoacoustic FTIR spectroscopy. Chemical
gradients and morphology differences between the side, middle, and center of the molded
foam are observed for all processing temperatures. The data indicate that thermal
activation at the center of the mold is important for samples regardless of processing
temperature. Furthermore, in spite of thermal processing at temperatures well above the
decomposition of uretoneimine structures (40°C), chemical gradients remain within the
simple molded foams.
Thermally treated epoxy foams were found to undergo both chemical and structural
changes associated with the degradation of Diels-Alder bonds and changing structural
i i i
packing of siloxane units in the foam network. FTIR results show that these changes are
not reversible and occur immediately after thermal exposure. The combination of
changing chemistry, structure, and thermal expansion lower the overall density of the
foam by approximately 41% relative to the pristine foam. The change in density also
influences the modulus of the material which is reduced by 68% after ten thermal cycles.
The results indicate that thermal exposure reduces the rigidity of the material through
chemical and structural changes that cause the foam to expand, lowering the density and
modulus in the process.
A composite material was successfully prepared by incorporating carbon black in
PI. Platinum metal was successfully deposited on the resulting Pi/Carbon film using
cyclic voltammetry. Results obtained from four-point probe conductivity measurements
show that increased carbon loading or platinum loading enhances the electrical
conductivity of the composite. However, beyond 10% carbon loading, the mechanical
integrity of the film is compromised. TGA and DSC results show that the thermal
stability of PI is maintained with carbon incorporation and platinum deposition.
Pl/carbon/Pt was found be thermally stable up to 561 °C as determined by DSC and
559°C as determined by TGA. SEM imaging suggests that carbon is well dispersed in PI
while XPS results show that the platinum deposited Carbon/PI is metallic. The
deposition of gold on carbon/PI was found to enhance its sensitivity to the ferricyanide
redox couple. However, slower electron transfer is observed at both Pl/Carbon/Pt and
PI/Carbon/Au films as compared to Pt and Au planar electrodes.
IV
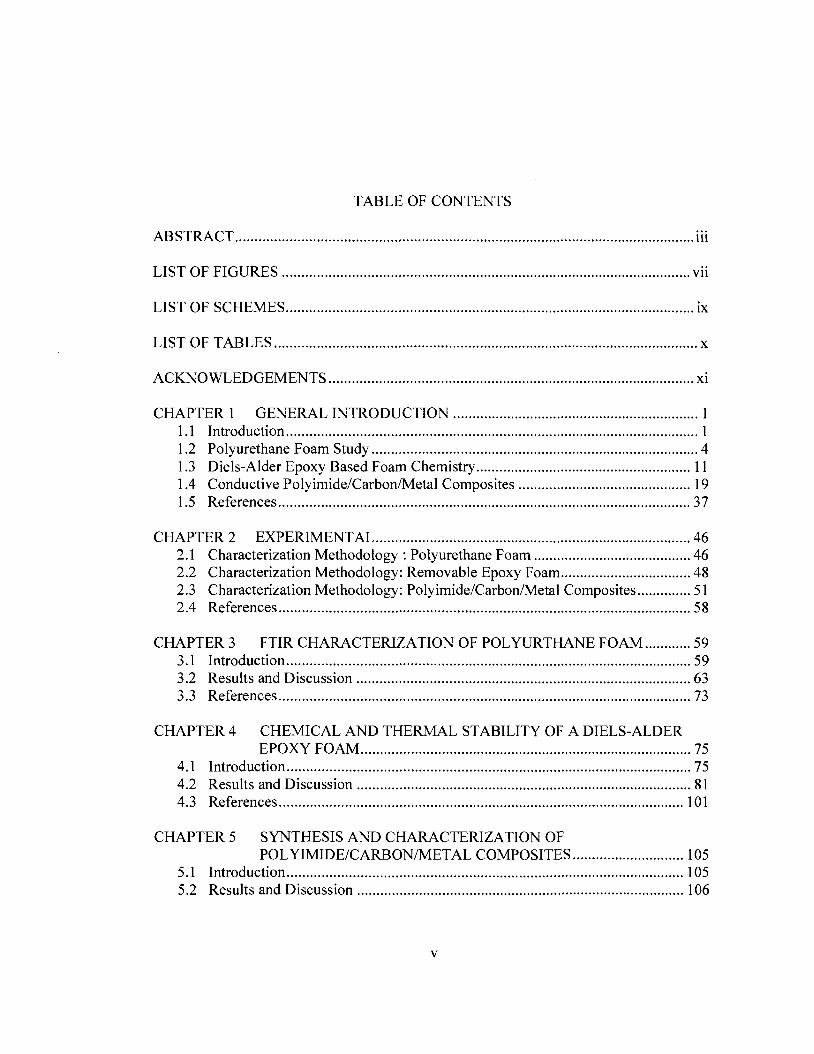
TABLE OF CONTENTS
ABSTRACT iii
LIST OF FIGURES vii
LIST OF SCHEMES ix
LIST OF TABLES x
ACKNOWLEDGEMENTS xi
CHAPTER 1 GENERAL INTRODUCTION 1 1.1 Introduction 1 1.2 Polyurethane Foam Study 4 1.3 Diels-Alder Epoxy Based Foam Chemistry 11 1.4 Conductive Polyimide/Carbon/Metal Composites 19 1.5 References 37
CHAPTER 2 EXPERIMENTAL 46 2.1 Characterization Methodology : Polyurethane Foam 46 2.2 Characterization Methodology: Removable Epoxy Foam 48 2.3 Characterization Methodology: Polyimide/Carbon/Metal Composites 51 2.4 References 58
CHAPTER 3 FTIR CHARACTERIZATION OF POLYURTHANE FOAM 59 3.1 Introduction 59 3.2 Results and Discussion 63 3.3 References 73
CHAPTER 4 CHEMICAL AND THERMAL STABILITY OF A DIELS-ALDER EPOXY FOAM 75
4.1 Introduction 75 4.2 Results and Discussion 81 4.3 References 101
CHAPTER 5 SYNTHESIS AND CHARACTERIZATION OF POLYIMIDE/CARBON/METAL COMPOSITES 105
5.1 Introduction 105 5.2 Results and Discussion 106
v
5.3 References 134
CHAPTER 6 CONCLUSIONS & FUTURE WORK 137
6.1 References 141
APPENDIX A 142
VITA 144
VI
LIST OF FIGURES
Figure 1.1 General Schematic of a direct methanol fuel cell (DMFC) 34 Figure 1.2 General Schematic of a hydrogen fuel cell 35 Figure 1.3 General schematic of an organic solar cell 36 Figure 1.4 Envisioned PI/carbon/Au layered OFET 37 Figure 2.1 Three-electrode electrochemical cell used for cyclic voltammetry 55 Figure 3.1 FTIR/PAS spectra of PU foam processed at 85°C 64 Figure 3.2 FTIR/PAS spectra of uretoneimine structure for molded PU foam 66 Figure 3.3 FTIR/PAS spectra highlighting the isocyanate and carbodiimide structures
for molded PU foam as a function of processing temperature 68 Figure 3.4 Integrated FTIR/PAS bands for uretoneimine, carbodiimide and
isocyanate groups as a function of mold position 70 Figure 3.5 Optical images of PU foam as a function of position and processing
temperature 72 Figure 4.1 FTIR spectra of reactants used in the preparation of removable epoxy foam.
Spectral range: 800cm"1 to 4000 cm"1 83 Figure 4.2 FTIR spectra of reactants used in the preparation of removable epoxy foam.
Spectral range: 800 cm"1 to 1350 cm"1 84 Figure 4.3 FTIR spectra of reactants used in the preparation of removable epoxy foam.
Spectral range: 1350 cm"1 to 1900 cm"1 85 Figure 4.4 Difference FTIR spectra for removable epoxy foam as a function of
temperature. Spectral Range: 800-4000 cm"1 89 Figure 4.5 Difference FTIR spectra for removable epoxy foam as a function of
temperature. Spectral Range: 800-1395 cm"1 90 Figure 4.6 Difference FTIR spectra for removable epoxy foam as a function of
temperature. Spectral Range: 1350-1900 cm"1 91 Figure 4.7 Difference FTIR spectra for removable epoxy foam as a function of
temperature. Spectral Range: 1900-4000 cm"1 92 Figure 4.8 TMA curves of removable epoxy foam as a function of thermal cycling 95 Figure 4.9 Density removable epoxy foam as a function of thermal cycling 97 Figure 4.10 Modulus of removable epoxy foam as a function of thermal cycling 99 Figure 5.1 FTIR Spectra of PI and Pi/carbon films prior and after thermal imidization.
Spectral Range: eOO-̂ OOcm"1 108 Figure 5.2 FTIR Spectra of PI and Pi/carbon prior and after thermal imidization.
Spectral Range: 1900-3700 cm"1 109 Figure 5.3 Effect of carbon loading on electrical conductivity of polyimide 112 Figure 5.4 Differential scanning calorimetry (DSC) curves of PI and Pi/carbon film
prior and after thermal imidization 114 Figure 5.5 Thermal gravimetric analysis (TGA) curves of PI and Pi/carbon film prior
and after thermal imidization 115
vii
Figure 5.6 Cyclic voltammograms for the deposition of platinum at a planar Pt sheet electrode 118
Figure 5.7 Cyclic voltammograms for the deposition of platinum at a Pi/carbon electrode 119
Figure 5.8 SEM images of Pl/carbon/Pt composite with varying Pt loading 124 Figure 5.9 XPS survey of Pl/carbon/Pt composite 125 Figure 5.10 DSC Comparison of Pi/carbon and Pl/carbon/Pt 127 Figure 5.11 TGA Comparison of Pi/carbon and Pl/carbon/Pt 128 Figure 5.12 Conductivity of Pl/carbon/Platinum films as a function of Pt loading 129 Figure 5.13 Cyclic voltammograms for PI/carbon/Au films in the ferricyanide redox
couple 132 Figure Al Cyclic voltammograms for methanol oxidation at Pl/carbon/Pt 142 Figure A2 Cyclic voltammograms for methanol oxidation at Pl/carbon/Pd 143
viii
LIST OF SCHEMES
Scheme 1.1 General reaction for the preparation of polyurethane foam reaction using water as the blowing catalyst 6
Scheme 1.2 Chemical structures of 2,4-toluene diisocyanate (TDI) and 4,4-methylene diisocyanate 8
Scheme 1.3 Formation of carbodiimide and uretoneimine linkages in Rubinate®1680.. 9 Scheme 1.4 Chemical structure of the epoxy ring 12 Scheme 1.5 Chemical structure of diglycidyl ether of bisphenol A (DGEBA) 12 Scheme 1.6 Epoxide group reaction with a primary amine 13 Scheme 1.7 Removable epoxy resins used to prepare removable epoxy foam (REF) ..14 Scheme 1.8 General Diels-alder reaction between a simple diene and a dienophile 15 Scheme 1.9 Reversible Diels-Alder Reaction between a Furan and Maleimide 16 Scheme 1.10 Chemical structure of tetrasiloxane tethers 17 Scheme 1.11 Preparation of siloxane from the condensation of silanols 17 Scheme 1.12 General repeating structure of apolyimide 22 Scheme 1.13 Chemical structure for PMDA-ODA polyimide 23 Scheme 1.14 Two-step preparation of PMDA-ODA polyimide 24 Scheme 1.15 Side reactions during thermal imidization of PMDA-ODA polyimide 26 Scheme 1.16 Reaction between PMDA-ODA polyimide and KOH to form a salt 27 Scheme 3.1 Thermally initiated decomposition of the uretoneimine linkage 60 Scheme 4.1 The general Diels-Alder reaction between Furan and Maleimide 77 Scheme 4.2 Epoxide Group Reaction with a Primary Amine 78 Scheme 4.3 Resin used in formulating removable epoxy foam (REF) 80 Scheme 4.4 Loss of furfuryl glycidyl ether during reverse Diels-Alder reaction 88
IX
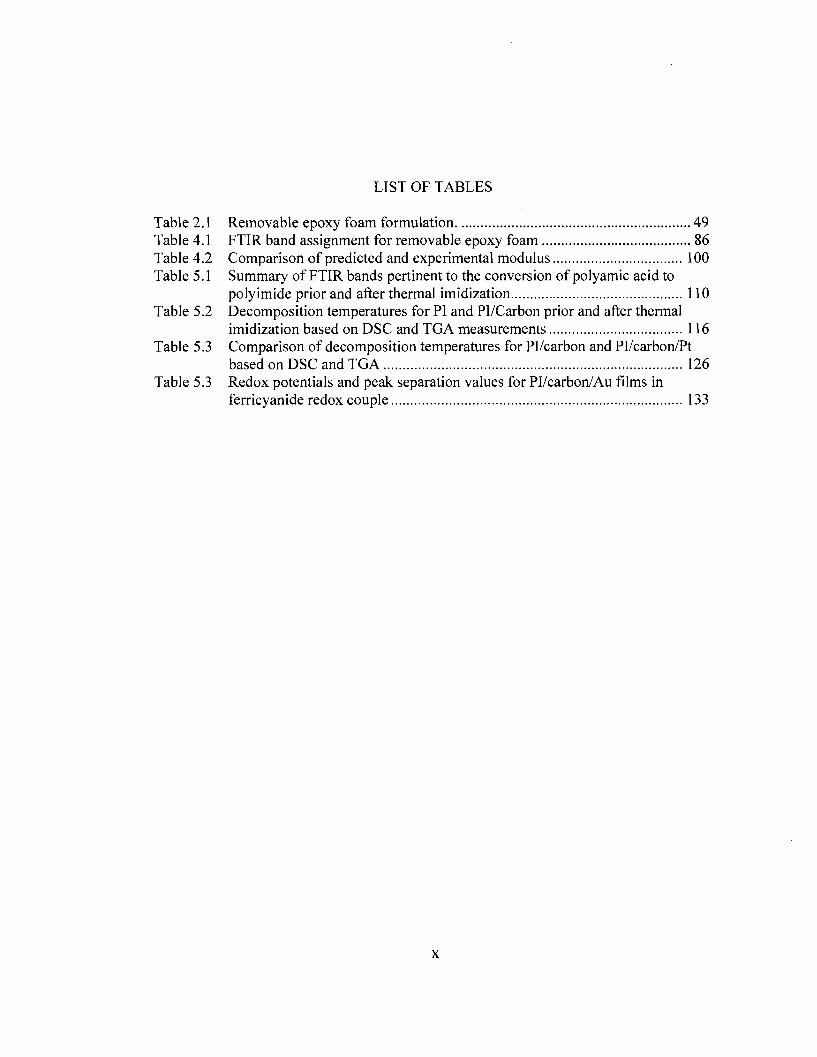
LIST OF TABLES
Table 2.1 Removable epoxy foam formulation 49 Table 4.1 FTIRband assignment for removable epoxy foam 86 Table 4.2 Comparison of predicted and experimental modulus 100 Table 5.1 Summary of FTIR bands pertinent to the conversion of polyamic acid to
polyimide prior and after thermal imidization 110 Table 5.2 Decomposition temperatures for PI and Pi/Carbon prior and after thermal
imidization based on DSC and TGA measurements 116 Table 5.3 Comparison of decomposition temperatures for Pi/carbon and Pl/carbon/Pt
based on DSC and TGA 126 Table 5.3 Redox potentials and peak separation values for PI/carbon/Au films in
ferricyanide redox couple 133
x
ACKNOWLEDGEMENTS
I would like to take this opportunity to thank my academic advisor Dr. David
Hatchett under whose indelible help, encouragement and direction that I have been able
to achieve many a milestone during my stay at UNLV, this being one of them. We did it
once again! My deepest and sincerest appreciation goes to him and his wonderful family
for their kindness and friendship to me.
Secondly, I wish to thank my examination committee members; Dr. Clemens Heske,
Dr. Spencer Steinberg and Dr. Brendan O'Toole. They have also been actively involved
in my dissertation project in one way or the other and I will always be grateful for their
invaluable advice on the course and focus of my research.
A special thanks to Dr. Jim Aubert at Sandia National Laboratories for providing
epoxy foam samples analyzed in this project. I would also like to thank Dr. Anthony
Smith who assisted me with installing equipment for electrical conductivity
measurements presented herein. Thanks to Dr. Lothar Weinhardt (currently at University
of. Wurzburg), Timo Hoffmann and Kyle George who as part of Dr. Heske's group
helped in obtaining and interpreting x-ray photoelectron spectroscopy (XPS) data. I
would also like to thank, Dr. Dong-Chan Lee whose door was always open for any
questions. Thanks to Dr. Robert Mohan and Julio Malpica, from Dr. O'Toole's group,
who we collaborated in the preparation and mechanical testing of polyurethane foam
samples. Their help is greatly appreciated.
xi
I must also thank members of our research group especially Dr. Asanga Ranasinghe
who has always provided immense advice and help to me in the course of writing this
dissertation. His friendship is greatly appreciated. Special thanks to my fellow graduate
students Jade Morgan, Nicole Millick, Sandra Elkouz and Pauline Serrano for all their
assistance. To the best group of undergraduates Gina Castruita, Brad Walling, Grace
Park, Thuy Tran, Wally Atterberry who have tirelessly assisted me in carrying out my
research, I could not have done it without your help.
Special thanks for funding and salary support from the Department Of Energy
through the High Pressure Science Center (HIPSEC), Center for Energy Research (CER)
and the Hydrogen Fuel Cells and Storage Technology (FCAST) project. I would also like
to express my gratitude to the Department of Chemistry for support through the course of
my study here at UNLV. Specifically, let me thank Mark Miyamoto and Deborah
Masters at the department office who have assisted me tremendously in every facet of my
graduate student life. Their warmth, kindness and readiness to assist me will always be
cherished.
Finally and most importantly let me also thank my family and friends to whom I
dedicate this dissertation. To my beautiful fiancee Ms. Gladwell Gacuga, I love you so
much and am so glad that I met you. Thank you for your moral support and being such a
wonderful listener. To my father the Venerable Canon David Kinyanjui and my mother
Rosemary Kinyanjui who have always supported me in all my endeavors and pursuits, I
say thank you from the bottom of my heart. You have always believed in me and pushed
me to pursue excellence but most of all learn to trust in God. To my two beautiful sisters
Mrs. Beatrice Kinyanjui Mpinga and Dr. Sarah Kinyanjui, I wish to say thank you for
xii

always being there for me. Special thanks to Mr. & Mrs. J. Robert Manuel III, who have
always been my parents away from home. To all my friends, please accept my thank you
for always being there when I needed you.
xiii
CHAPTER 1
GENERAL INTRODUCTION
1.1 Introduction
The chemical modification, functionalization and combination of different chemical
species can be used to develop new materials with unique chemical, physical or
mechanical properties when compared to the starting materials. New or enhanced
chemical, physical or mechanical properties may be realized in the process, which allows
new applications to be envisioned and developed. Prior to realizing new applications for
these materials, however, a clear understanding of their new or enhanced properties is
essential. Furthermore, more complex properties of the functionalized or modified
materials as compared to their parent materials require a systematic evaluation.
Analytical tools and methods have been developed to study, correlate and expand our
knowledge of the complex chemical, physical, and mechanical properties of these
materials.
The first part of this project investigates changes in the chemical composition and
mechanical stability of thermally treated modified polyurethane (PU) foam and Diels-
Alder epoxy based foams. These foams are candidates for replacing aging polyurethane
foam currently used for shock mitigation and encapsulation of electrical components in
our national nuclear stockpile. Moreover, these foams have complex chemistry that
influences the physical and mechanical properties of the materials. The modified
1
polyurethane foam contains uretoneimine crosslinks that provide enhanced structural
rigidity over traditional polyurethane foam currently used in other applications. The
polyurethane foams require harsh removal methods (i.e. sand blasting or use of caustic
chemicals) which can damage any encapsulated electronic or mechanical components.
In contrast, epoxy based foams incorporate Diels-Alder chemistry which allows the foam
to be removed from encapsulated devices without damaging the potted components.
Although these two foam systems have been proposed as encapsulants for nuclear
warheads, the complex chemistry associated with each material will influence the final
physical and chemical properties and determine their applicability. The foams must have
high chemical and mechanical stability when exposed to thermal gradients to be useful.
Evaluating the influence of thermal exposure on the chemical, physical and mechanical
properties of foam systems is a daunting task requiring a large suite of experimental
techniques. The first part of this study will focus on the development of experimental
tools for the evaluation of the chemical, physical and mechanical properties of foam
systems with complex chemistry that vary as a function of thermal exposure. The goal is
to correlate any chemical changes in the foam systems with changes in their physical or
mechanical properties. More importantly, the suite of characterization tools developed
will allow the chemical, physical and mechanical properties of other complex materials to
be systematically evaluated.
Polyimide is widely used in electrical insulation because of its excellent chemical and
thermal stability, high tensile strength, good adhesion properties and low electrical
conductivity. These unique characteristics make polyimide especially attractive for high
temperature applications beyond the range where other common polymeric materials can
2
be used. One envisioned use of this polymer is as a flexible metallized back-end electrode
material for solar devices or as an electron donor layer material for organic photovoltaic
solar cells. However, the electrical insulating properties of polyimide do not allow the
polymer to be used in applications that require electron transport. The polymer must be
modified to provide an electrically conducting material, while still maintaining the
overall thermal and chemical stability and mechanical strength of polyimide. The second
part examines the modification of electrical properties of polyimide, through the
incorporation of graphite to form a composite material. The incorporation of graphite into
polyimide changes the electronic properties of the polymer while maintaining its
mechanical properties. The conductive composite is further modified by electrochemical
deposition of a transition metal onto the polymer surface for catalytic applications. The
new physical properties of the polyimide/carbon/metal composites when combined with
the inherent thermal stability of the polymer allow applications to be explored that were
not previously possible. For example, the suitability of the composites as working
electrodes in electrochemical reactions is explored. This is only possible because the
composite has enhanced electrical conductivity in comparison to the pristine polyimide.
Additionally, other applications can be envisioned using these materials for solid state
applications such as photovoltaic devices and field effect transistors (FET). The
chemical, physical, and mechanical properties of these materials are complex and must be
evaluated for applications to be realized. Therefore, the synthesis, optimization of
chemical constituents, and complete characterization of the composite properties is
critical.
FTIR spectroscopy is used to evaluate changes in the chemical composition of both
3
polyurethane and epoxy-based foams during thermal treatment. The thermal stability of
materials is investigated using differential scanning calorimetry (DSC), thermal
gravimetric analysis (TGA) and thermo-mechanical analysis (TMA). Additionally,
mechanical analysis techniques are used to determine the compressive strength of the
materials studied. Imaging techniques, such as light microscopy and scanning electron
microscopy (SEM), are also employed to investigate the morphological characteristics of
the materials. Electrochemical techniques, specifically cyclic voltammetry, are utilized
for the deposition of metal onto polyimide/carbon composites in addition to probing
electrochemical reactions supported by the polyimide/carbon/metal composites.
1.2 Polyurethane Foam Study
1.2.1 Background
Polyurethane foams have found a wide array of applications in thermal insulation
because of their extremely low thermal conductivity. Polyurethane foams belong to a
larger family of cellular solids. The unique physical structure of a cellular solid is
comprised of an inner "cell" structure and a surrounding "strut" structure. Cellular solids
with perforated cells or broken struts that allow air to fill all the void space in the solid
are referred to as open cell solids and are typically flexible and exhibit lower elastic
moduli. Cellular solids whose cells are not perforated and are gas-filled are referred to as
closed cell solids. Closed cell solids are structurally rigid with higher elastic moduli as
compared to open cell solids. In addition to high elastic moduli, very low thermal
conductivities are also exhibited by closed cell solids making them highly insulating.
Gas-filled closed cells serve as heat sequestering regions in the solid which prevent heat
4
from diffusing through the solid.
Rigid closed cell polyurethane foams are currently prevalent in our national stockpile
as shock absorbing materials and as encapsulants for electronic parts in nuclear warheads.
Scheme 1.1 presents the general reaction for the formation of the urethane linkage, the
repeating unit of polyurethane, from a diisocyanate and a diol. This reaction is referred
to as the gel reaction. The functional group, Ri, of the diisocynante can be varied
depending on the desired structural characteristics of the resulting polyurethane foam.
For example, the use of aromatic rings leads higher structural rigidity as compared to the
use of straight chain alkyl groups which leads to a more flexible polymeric material.
However, flexibility or rigidity of the polyurethane is not solely dependent on the R\
functional group of the diisocyanate. Because of the high reactivity of the diisoyanate
group, secondary reactions accompany the polymerization reaction, leading to a more
complex three-dimensional foam structure network.
The foaming reaction (also referred to as the gel reaction) occurs simultaneously with
the polymerization of the diisocyanate to form urethane linkages. A blowing agent is
required to facilitate the formation of a closed cell cellular structure leading to the
formation of gas bubbles that are trapped in the cell. The most common blowing agents
used in the manufacture of PU foams include water and hydrocarbons gases.[l-4] The
gel reaction using water as the blowing agent is also presented in Scheme 1.1. In this
reaction water reacts with diisocyanate to form a carbamic acid intermediate which
subsequently decomposes to form a primary amine in addition to releasing carbon
dioxide which is trapped in the cell structure of the foam. The primary amine formed can
further react with the diisocyanate to form urea linkages. The urea linkage is one of the
5
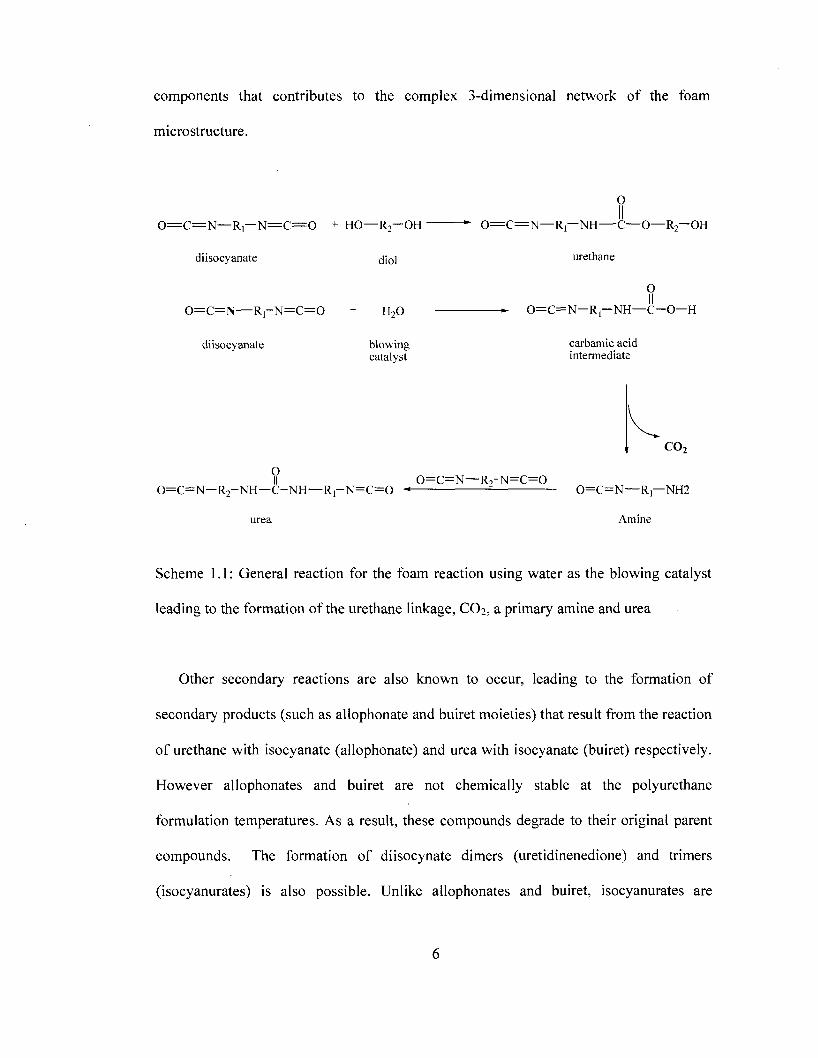
components that contributes to the complex 3-dimensional network of the foam
microstructure.
O
0 = C = N — R , — N = C = 0 + HO—R2—OH *" 0 = C = N — R — NH C—O—R2—OH
diisocyanate d;0] urethane
0 = C = N — R , - N = C = 0 + H,0
diisocyanate blowing catalyst
O II
0 = C = N — R 2 - N H — C - N H — R 1 - N = C = 0
O
— 0 = C = N — R , — N H — C - O — H
0 = C = N — R 2 - N = C = 0
1
carbamic acid intermediate
co2
0 = C = N — R , — N H 2
Amine
Scheme 1.1: General reaction for the foam reaction using water as the blowing catalyst
leading to the formation of the urethane linkage, CO2, a primary amine and urea
Other secondary reactions are also known to occur, leading to the formation of
secondary products (such as allophonate and buiret moieties) that result from the reaction
of urethane with isocyanate (allophonate) and urea with isocyanate (buiret) respectively.
However allophonates and buiret are not chemically stable at the polyurethane
formulation temperatures. As a result, these compounds degrade to their original parent
compounds. The formation of diisocynate dimers (uretidinenedione) and trimers
(isocyanurates) is also possible. Unlike allophonates and buiret, isocyanurates are
6
chemically stable at the foam formulation temperatures and will not degrade during the
formulation process. As a result, isocyanurates remain as a chemical component of the
foam.
Rigid foams currently used in national defense applications were primarily prepared
from the polymerization of toluene diisocyanate (TD1). Two of the most common toluene
diisocyanates used in the manufacture of polyurethane are 2,4- toluene diisocyanate and
2,6- toluene diisocyanate. The main drawback of using TDI based polyurethane foams
are the health hazards posed by TDI. For example, human exposure even to low amounts
of TDI is known to cause respiratory complications such as asthma.[5-7] As an
alternative to using TDI-based polyurethane foams, researchers at Sandia National
Laboratories have investigated the use of 4,4-methylene diisocyanate (MDI) to formulate
polyurethane foams aimed at replacing the current aging TDI-based foam. The main
advantage derived from preparing PU foam from the polymerization of MDI is that there
are fewer health hazards posed by MDI as compared to those posed by TDI. Scheme 1.2
presents the chemical structures of TDI and MDI. In addition to lower toxicity of MDI as
compared to that of TDI, the formation of uretoneimine crosslinks resulting from a side
reaction involving the urethane linkage and MDI offers an added advantage of improved
structural rigidity of MDI over TDI.
1.2.2 MDI Foam Chemistry
The rigid polyurethane foam investigated in this project is prepared from a
commercially supplied MDI under the trade name Rubinate 1680 (Huntsman
Corporation). Rubinate 1680 is a liquid at room temperature with a melting point below
20°C. Rubinate 1680 is a partially polymerized variant of 4,4-methylene diisocyanate
7
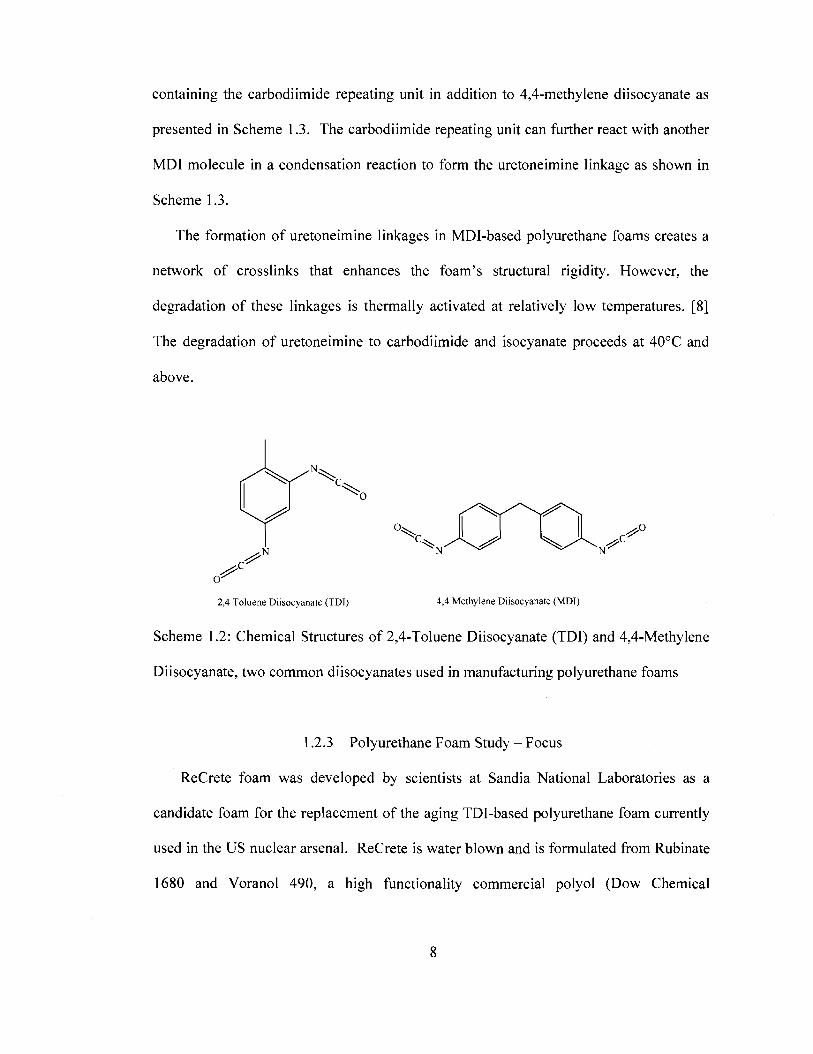
containing the carbodiimide repeating unit in addition to 4,4-methylene diisocyanate as
presented in Scheme 1.3. The carbodiimide repeating unit can further react with another
MDI molecule in a condensation reaction to form the uretoneimine linkage as shown in
Scheme 1.3.
The formation of uretoneimine linkages in MDI-based polyurethane foams creates a
network of crosslinks that enhances the foam's structural rigidity. However, the
degradation of these linkages is thermally activated at relatively low temperatures. [8]
The degradation of uretoneimine to carbodiimide and isocyanate proceeds at 40°C and
above.
2,4 Toluene Diisocyanate (TDI) 4,4 Methylene Diisocyanate (MDI)
Scheme 1.2: Chemical Structures of 2,4-Toluene Diisocyanate (TDI) and 4,4-Methylene
Diisocyanate, two common diisocyanates used in manufacturing polyurethane foams
1.2.3 Polyurethane Foam Study - Focus
ReCrete foam was developed by scientists at Sandia National Laboratories as a
candidate foam for the replacement of the aging TDl-based polyurethane foam currently
used in the US nuclear arsenal. ReCrete is water blown and is formulated from Rubinate
1680 and Voranol 490, a high functionality commercial polyol (Dow Chemical
8

Company) specifically formulated for rigid foam applications.
O = C = N ^ V ^ O - N = C = O ^ ^ O = C = N - < 0 ^ S C ^ N = C = N H C ) / X O N = C = O
^—^ ^ - ^ Catalyst 1 ^ ^ x— ' N—' MEM carbodiimide
catalyst 2
^^OwO-psN-O^ON=c=o
0=C=i-Q^Q-N=C=0
2+2 Addition
0 = c = N-O^tO"Jf"£= N"O^OrN = c = 0
O'' v
Scheme 1.3: Polymerization reaction in the formation of carbodiimide, the repeating unit
in Rubinate 1680. The carbodiimide can further react with diisocynate to form the
uretoneimine linkages that constitute Rubinate 1680
Previous studies in our laboratory have shown that the post-cure temperature at which
ReCrete foam is processed has an effect on the chemical and mechanical properties of the
foam. [8] Specifically, the processing (post-cure) temperature was found to influence the
amount of unreacted isocyanate and the concentration of uretoneimine linkages. An
increase in the processing temperature leads to a more chemically homogeneous foam
since the chemical reactivity of the isocyanate group increases with the processing
temperature and therefore decreases the amount of unreacted isocyanate in the foam.
However, an increase in the processing temperature leads to decreased structural rigidity
of the foam. This is attributed to the degradation of the uretoneimine linkages with
increased processing temperature leading to less cross-linking within the foam
microstructure. Inversely, as the uretoneimine linkages are degraded with higher
processing temperatures, the concentration of the carbodiimide increases.
The variations that occur in the chemical compositions of the uretoneimine linkage,
carbodiimide and isocyanate in the radial geometry of ReCrete foam as a function of the
post-cure processing temperature is the focus of this study. Fourier Transform Infrared
(FTIR) spectroscopy is employed to investigate the changes in the intensities of
functional groups specific to the uretoneimine, carbodiimide and isocyanate groups. The
complex microstructure of PU foams created from polymerization of the diisocyanate and
other secondary reactions requires highly methodical evaluation of the FTIR spectra. To
quantify the concentration of each functional group at each radial position as a function
of temperature, a methodology has been developed to measure and quantify FTIR spectra
in addition to identifying a sensitive FTIR technique to perform sample measurements.
FTIR photoacoustic spectroscopy is selected to measure the FTIR spectra of the
polyurethane foam. Optical imaging aids in investigating changes in the cell structure
across the radial geometry of the foam caused by increasing the post cure processing
temperature.
10
1.3 Diels-Alder Epoxy Based Foam Chemistry
1.3.1 Background
One major drawback of using polyurethane foam as an encapsulation material is the
difficulty of removing the foam from the encapsulated device due to polyurethane's
propensity to adhere strongly to surfaces. Removal of the foam could be necessitated in
situations where the encapsulated device needs to be accessed for repair or replacement.
The integrity of the encapsulated device cannot be assured during the removal process
since such removal methods as sandblasting are required to remove the foam.
Removable epoxy-based foams (REFs) that employ Diels-Alder chemistry were
developed by scientists at Sandia National Laboratories and are another set of candidate
foams (in addition to MDI-based foam) for replacing aging TDI-based polyurethane
foam.[9, 10] These foams are based on removable Diels-Alder epoxy based resin
analogs.[11, 12] The inclusion of Diels-Alder chemistry in the resin backbone gives the
removable functionality to the epoxy based foams.
1.3.2 Epoxy Resin Chemistry
Since their advent in 1936, epoxy-based materials have found a wide range of
applications, making the production of such materials a multibillion-dollar industry.
Some of the common applications for epoxy-based materials include use as adhesives,
coatings, hardeners, paints and coatings. Epoxy-based resins are commonly used as
adhesives for household applications because of their good adhesion properties on a wide
range of surfaces.
The epoxy ring, the active functional group in epoxy resins, is a carbon ring
connected by an ether bond. The chemical structure of the epoxy ring is presented in
11
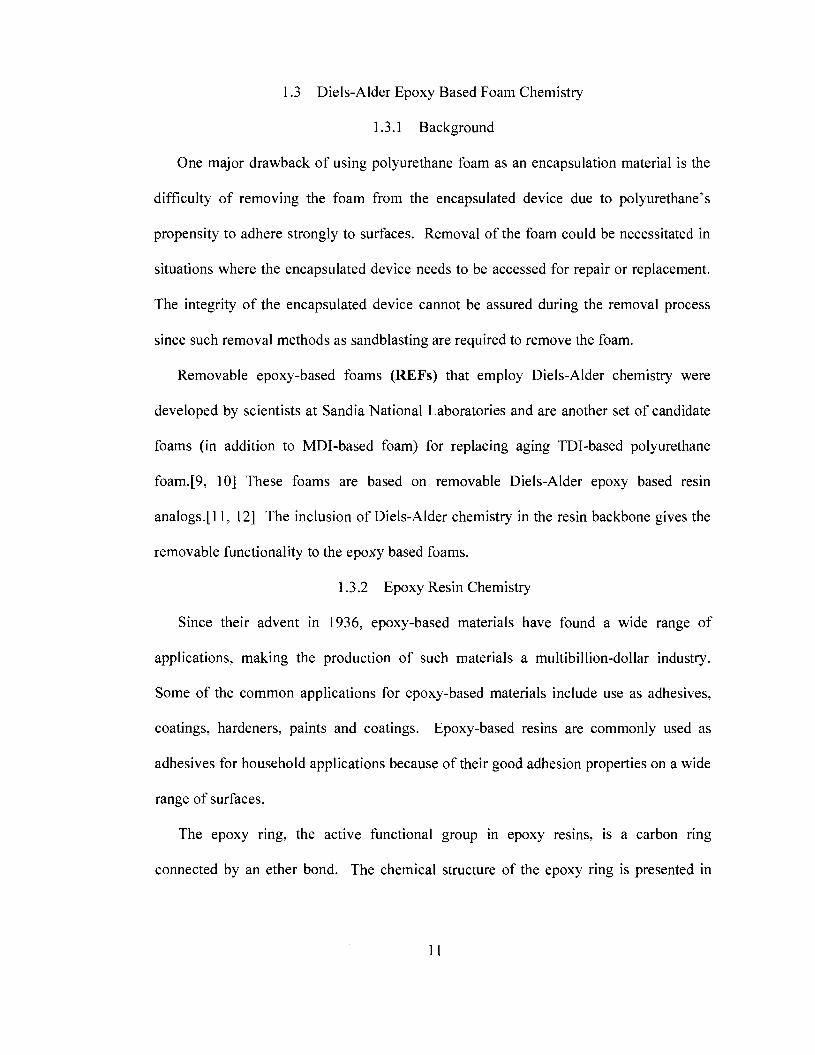
Scheme 1.4. Other commonly used names for the epoxy ring included epoxide ring or
oxirane ring.
O
H2C CH2
Scheme 1.4: The chemical structure of the epoxy ring
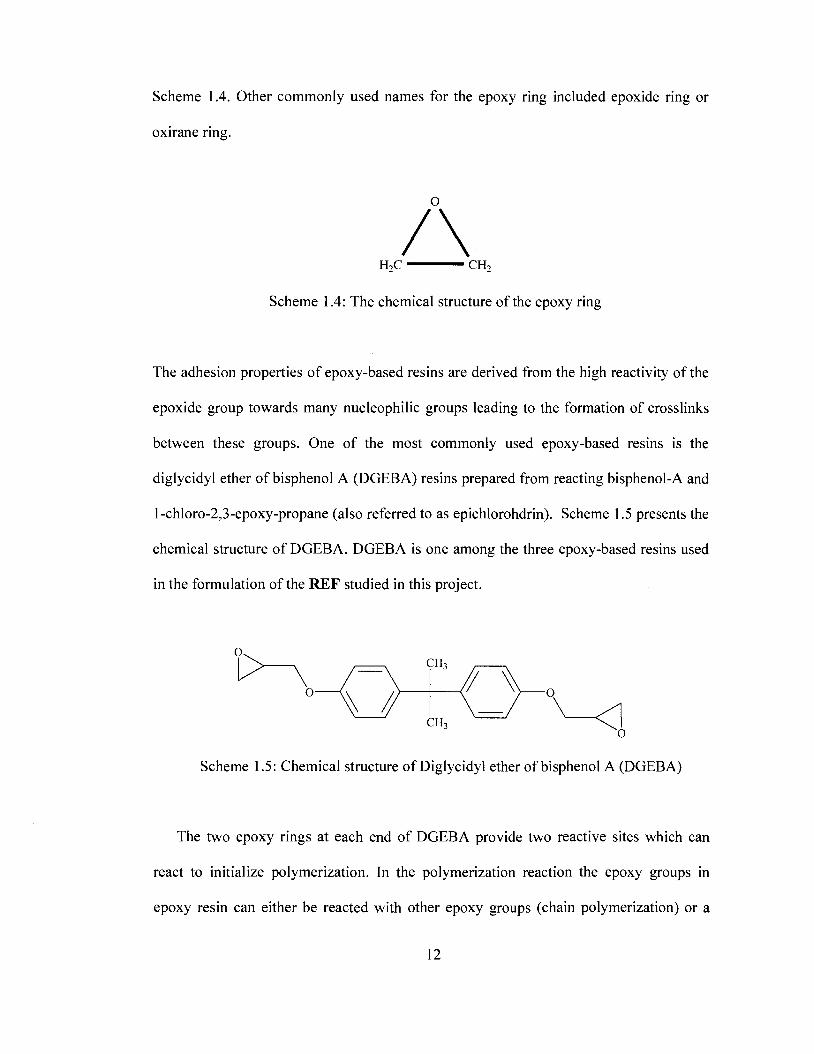
The adhesion properties of epoxy-based resins are derived from the high reactivity of the
epoxide group towards many nucleophilic groups leading to the formation of crosslinks
between these groups. One of the most commonly used epoxy-based resins is the
diglycidyl ether of bisphenol A (DGEBA) resins prepared from reacting bisphenol-A and
1 -chloro-2,3-epoxy-propane (also referred to as epichlorohdrin). Scheme 1.5 presents the
chemical structure of DGEBA. DGEBA is one among the three epoxy-based resins used
in the formulation of the REF studied in this project.
o—
CH,
-O
O
Scheme 1.5: Chemical structure of Diglycidyl ether of bisphenol A (DGEBA)
The two epoxy rings at each end of DGEBA provide two reactive sites which can
react to initialize polymerization. In the polymerization reaction the epoxy groups in
epoxy resin can either be reacted with other epoxy groups (chain polymerization) or a
12
curative such as a polyamine (step-growth polymerization) leading to the formation of
crosslinks. The resulting product comprises of a polymer crosslink network that provides
the strong adhesion properties of the resin. This polymerization reaction in which the
epoxy group is reacted with another epoxy group or with a curative is also commonly
referred to as the "curing" reaction.
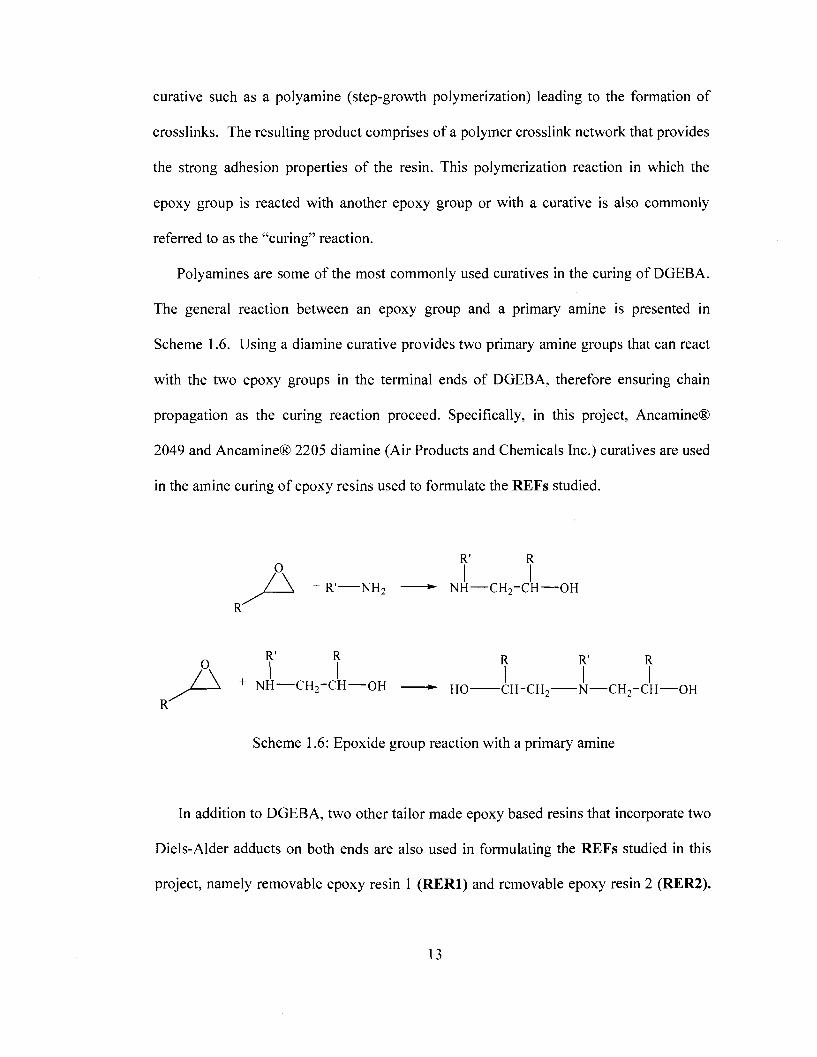
Polyamines are some of the most commonly used curatives in the curing of DGEBA.
The general reaction between an epoxy group and a primary amine is presented in
Scheme 1.6. Using a diamine curative provides two primary amine groups that can react
with the two epoxy groups in the terminal ends of DGEBA, therefore ensuring chain
propagation as the curing reaction proceed. Specifically, in this project, Ancamine®
2049 and Ancamine® 2205 diamine (Air Products and Chemicals Inc.) curatives are used
in the amine curing of epoxy resins used to formulate the REFs studied.
/ \ + R' NH2 NH—CH2-CH—OH
0 f R R R R
L—\ + NH CH2-CH—OH ^ HO CH"CH2 N—CH2~CH—OH R
Scheme 1.6: Epoxide group reaction with a primary amine
In addition to DGEBA, two other tailor made epoxy based resins that incorporate two
Diels-Alder adducts on both ends are also used in formulating the REFs studied in this
project, namely removable epoxy resin 1 (RER1) and removable epoxy resin 2 (RER2).
13

The chemical structures for RER1 and RER2 are presented in Scheme 1.7.
\\ /r° ° ° ° °^\ //
/
N 0
0 K^"° %^< Q
o N xy i
Scheme 1.7: Removable epoxy resins (RER) used in formulating REF's investigated in
this project a. RER1 resin b. RER2 resin
For the RER1 resin siloxane linkages are used as a backbone connecting the two Diels-
Alder adducts. These unique modifications to the epoxy resin lead to changes in the
chemical and physical properties of the resins and the REFs prepared from these resins.
Specifically, introducing the Diels-Alder chemistry leads to a removable resin or foam
while introducing the siloxane linkages to RER1 leads to a low viscosity liquid that can
easily be mixed with the diamine curative at ambient conditions.
14
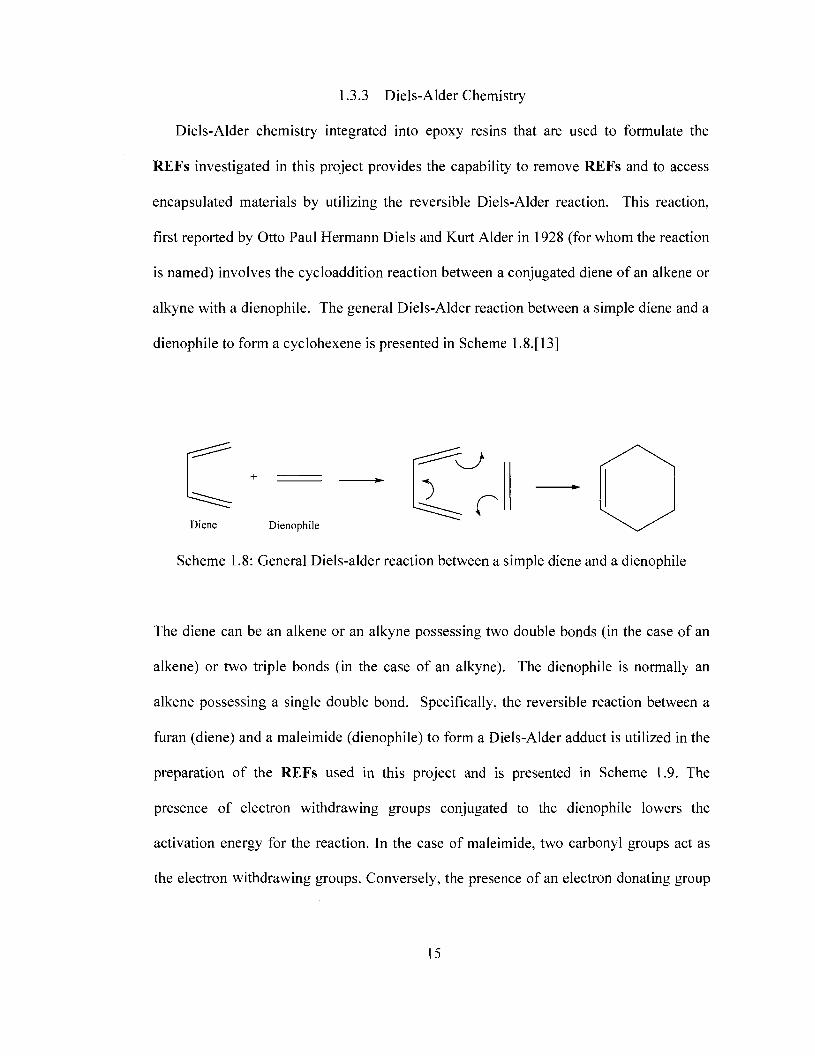
1.3.3 Diels-Alder Chemistry
Diels-Alder chemistry integrated into epoxy resins that are used to formulate the
REFs investigated in this project provides the capability to remove REFs and to access
encapsulated materials by utilizing the reversible Diels-Alder reaction. This reaction,
first reported by Otto Paul Hermann Diels and Kurt Alder in 1928 (for whom the reaction
is named) involves the cycloaddition reaction between a conjugated diene of an alkene or
alkyne with a dienophile. The general Diels-Alder reaction between a simple diene and a
dienophile to form a cyclohexene is presented in Scheme 1.8.[13]
^J-") r
Diene Dienophile
Scheme 1.8: General Diels-alder reaction between a simple diene and a dienophile
The diene can be an alkene or an alkyne possessing two double bonds (in the case of an
alkene) or two triple bonds (in the case of an alkyne). The dienophile is normally an
alkene possessing a single double bond. Specifically, the reversible reaction between a
furan (diene) and a maleimide (dienophile) to form a Diels-Alder adduct is utilized in the
preparation of the REFs used in this project and is presented in Scheme 1.9. The
presence of electron withdrawing groups conjugated to the dienophile lowers the
activation energy for the reaction. In the case of maleimide, two carbonyl groups act as
the electron withdrawing groups. Conversely, the presence of an electron donating group
15
in the diene leads to faster reaction kinetics. In the case of furan, an alkyl group
substituent acts as the electron donor.
V> Furan
+
O
N-R'
O
Maleimide
60 °C
90 °C
O
R <
P •N--R
O
Exo product o R'
Endo product
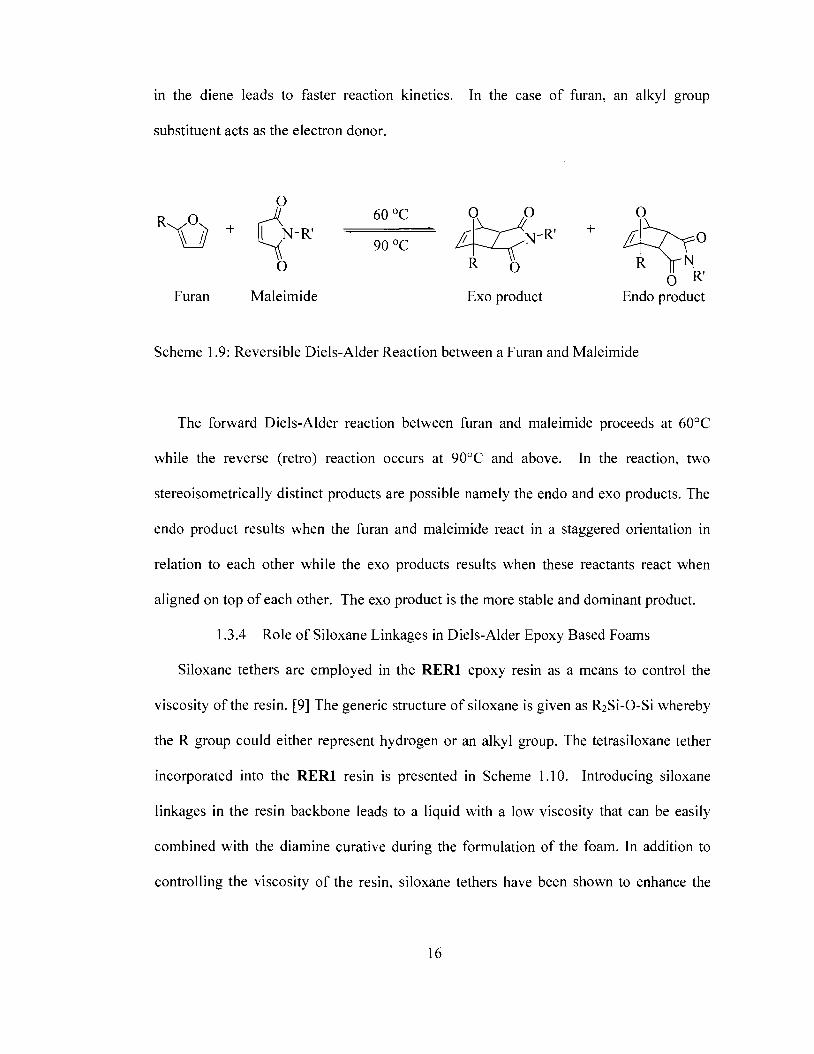
Scheme 1.9: Reversible Diels-Alder Reaction between a Furan and Maleimide
The forward Diels-Alder reaction between furan and maleimide proceeds at 60°C
while the reverse (retro) reaction occurs at 90°C and above. In the reaction, two
stereoisometrically distinct products are possible namely the endo and exo products. The
endo product results when the furan and maleimide react in a staggered orientation in
relation to each other while the exo products results when these reactants react when
aligned on top of each other. The exo product is the more stable and dominant product.
1.3.4 Role of Siloxane Linkages in Diels-Alder Epoxy Based Foams
Siloxane tethers are employed in the RER1 epoxy resin as a means to control the
viscosity of the resin. [9] The generic structure of siloxane is given as R2Si-0-Si whereby
the R group could either represent hydrogen or an alkyl group. The tetrasiloxane tether
incorporated into the RER1 resin is presented in Scheme 1.10. Introducing siloxane
linkages in the resin backbone leads to a liquid with a low viscosity that can be easily
combined with the diamine curative during the formulation of the foam. In addition to
controlling the viscosity of the resin, siloxane tethers have been shown to enhance the
16
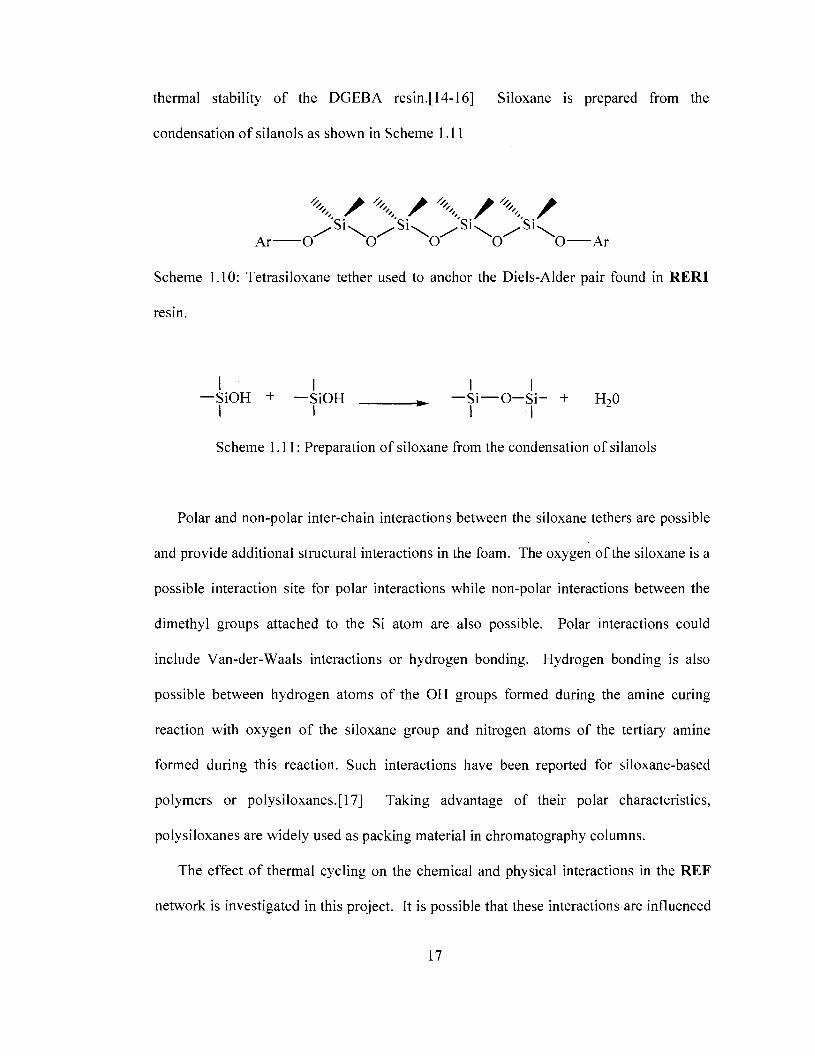
thermal stability of the DGEBA resin.[14-16] Siloxane is prepared from the
condensation of silanols as shown in Scheme 1.11
\ AX/\ /X / A r — o / S ' % ^ S ' ^ O / S ' X O ^ S ' X 0 - A r
Scheme 1.10: Tetrasiloxane tether used to anchor the Diels-Alder pair found in RER1
resin.
I I II -SiOH + —SiOH ^ —Si—O—Si- + H20
Scheme 1.11: Preparation of siloxane from the condensation of silanols
Polar and non-polar inter-chain interactions between the siloxane tethers are possible
and provide additional structural interactions in the foam. The oxygen of the siloxane is a
possible interaction site for polar interactions while non-polar interactions between the
dimethyl groups attached to the Si atom are also possible. Polar interactions could
include Van-der-Waals interactions or hydrogen bonding. Hydrogen bonding is also
possible between hydrogen atoms of the OH groups formed during the amine curing
reaction with oxygen of the siloxane group and nitrogen atoms of the tertiary amine
formed during this reaction. Such interactions have been reported for siloxane-based
polymers or polysiloxanes.[17] Taking advantage of their polar characteristics,
polysiloxanes are widely used as packing material in chromatography columns.
The effect of thermal cycling on the chemical and physical interactions in the REF
network is investigated in this project. It is possible that these interactions are influenced
17
or disrupted during thermal cycling of the foam. Any changes in the chemical properties
could lead to changes in the physical properties, weakening the foam structure.
1.3.5 Diels-Alder Epoxy Based Foams - Focus
Although the formulation process and the chemical and mechanical properties of
Diels-Alder epoxy foams are well documented, the variations in these properties as a
function of thermal exposure or thermal cycling have not been investigated in detail. [11,
12] The influence of thermal exposure and cycling is of critical importance since any
foam must be able to withstand large temperature fluctuations to be useful in defense
applications. The foams have to withstand low temperatures at high altitudes in addition
to high temperatures due to thermal radiation released from components in direct contact
with the foam.
This project investigates changes in the physical, chemical, and mechanical properties
of the foam resulting from repeated heating and cooling are evaluated. For example, the
presence of Diels-Alder adducts in the foam network presents a possible point of
weakness in the mechanical structure of the foam. Although the Diels-Alder reaction is
reversible, the formation and reformation of the Diels-Alder adduct in a complex REF
network may be affected by the presence of other linkages such as crosslinks formed by
the reaction between the diamine curative and epoxide groups of the resins. Furthermore,
the complex foam network is comprised of other products that result from side reactions
which occur during the foaming reaction. One such reaction is a Michael addition
reaction between pentaerythritol tetraacrylate (PETA) and the diamine curative. PETA is
used as a stabilizing agent through the formation of micelles that enhance the dispersion
of reactants during the foaming reaction.[18, 19] This reaction involves the unsaturation
18
of amine groups leading to the formation of chemical crosslinks that contribute to the
complex polymer network and chemistry of the removable foam.
In addition to changes in the chemical composition of the foam, other aspects of the
REF are studied. The mechanical properties of the foam are interrelated to its chemical
properties by measuring the structural rigidity of the foam. The breakage of chemical
linkages or physical interactions within the foam network can lead to the overall
structural weakening of the foam. We have previously shown in studies performed by our
group that the breakage of linkages in a ReCrete PU foam network leads to the decreased
structural rigidity. [8] Specifically for the ReCrete foam, the drop in the structural rigidity
of foam is attributed to the degradation of uretoneimine linkages found in polyurethane
foam.
Thermal expansion of the epoxy foam is examined as a function of thermal exposure.
Expansion in the foam could signify irreversible change in the chemistry of the system
due to the breakage of chemical crosslinks and the loss of physical interactions within the
foam network. The structural rigidity of the foam material is highly dependent on its
density. Therefore, expansion and contraction of the foam can lead to changes in its
density which translate to changes in the foam's structural rigidity [20]
1.4 Conductive Polyimide/Carbon/Metal Composites
1.4.1 Background
The initial goal of these studies was to develop thin, flexible, light-weight substrates
to replace the often bulky, heavy and fragile glass substrates used in the conventional
fabrication of solar cells. The flexible light weight substrates are especially suitable for
19
space or terrestrial applications where the weight of the solar device must be minimized
and the solar device must be folded to fit into compact areas for deployment. We
envisioned the development of a free-standing flexible polymeric electrode material as a
starting point with the following defined characteristics:
1. A target electrical conductivity of 1 ohm-cm.
2. High thermal stability between 200-300°C.
3. Resistance to harsh acidic or basic mediums.
4. Incorporation of catalytic metals such as gold, platinum, silver or transition
metals as photocatalysts into the topmost layers or on the surface.
Polyimides have found a wide range of applications because of their attractive
thermal, chemical and mechanical properties. Kapton® tape, Kapton film and other
competing products are used widely in high temperature electrical insulation applications
due to their high thermal stability, low electrical conductivity and high tensile strength.
For example, Kapton® HN film is highly stable at operating temperatures of -269°C to
400°C and has a tensile modulus of 2.5GPa and electrical resistivity of about 1017 Q-cm.
[21] Numerous studies have been carried out to investigate the suitability of polyimide as
a substrate for solar cells because of the polymer's thermal stability and mechanical
flexibility.[22-26] In some cases substrates are prepared using commercially available
polyimide films, such as DuPont Kapton® or UBE Upilex® films, while in some studies
polyimide substrates are prepared from a polyimide precursor, a polyamic acid (PAA)
solution which offers more flexibility in the fabrication and processability of the
substrates.
Polyimide (PI) requires the incorporation of a conductive material onto its surface
20
or into its matrix for the polymer to become electrically conductive. The incorporation of
conductive carbon particles into polyimide films is explored. The resulting conductive
polyimide/carbon composite can be used for a variety of applications. In addition to
functioning as back-end electrodes in solar cell devices, the deposition of transition
metals which can include gold, platinum and palladium onto the film surface is possible,
making the composite suitable for electrocatalytic applications. The electrocatalytic
oxidation of primary alcohols for fuel cell applications is envisioned for the
polyimide/carbon/metal composites.
The direct electrochemical deposition of gold, platinum and palladium metals on the
surface of polyimide/carbon composites to form polyimide/carbon/metal composites is
explored. The suitability of these polyimide/carbon/metal composites as working
electrodes used to probe electrochemical reactions is also investigated
1.4.2 Polyimide Chemistry
The chemical structure of polyimide is comprised of an imide functional group
repeating unit as presented in Scheme 1.12. Functional groups (Rj, R2 and R3)
incorporated into the polyimide backbone can be varied with by either introducing linear
chains or aromatic rings into the polymer's repeating unit. Polyimides containing
aromatic groups in their repeating unit belong to the classification group of aromatic
polyimides. Adjusting the functional groups can be used to design polyimides with
certain desired physical and mechanical characteristics. For example, introducing
aromatic groups into the polyimide backbone leads to enhanced thermal stability while
the introduction of polar groups as poly(ethlyene glycol) improves its solubility [27-29]
In addition to varying the R groups, two heterocyclic imide groups fused by an aromatic
21
ring can be incorporated into the repeating units of polyimide leading to enhanced
thermal stability.
n
Scheme 1.12: General repeating structure of a polyimide
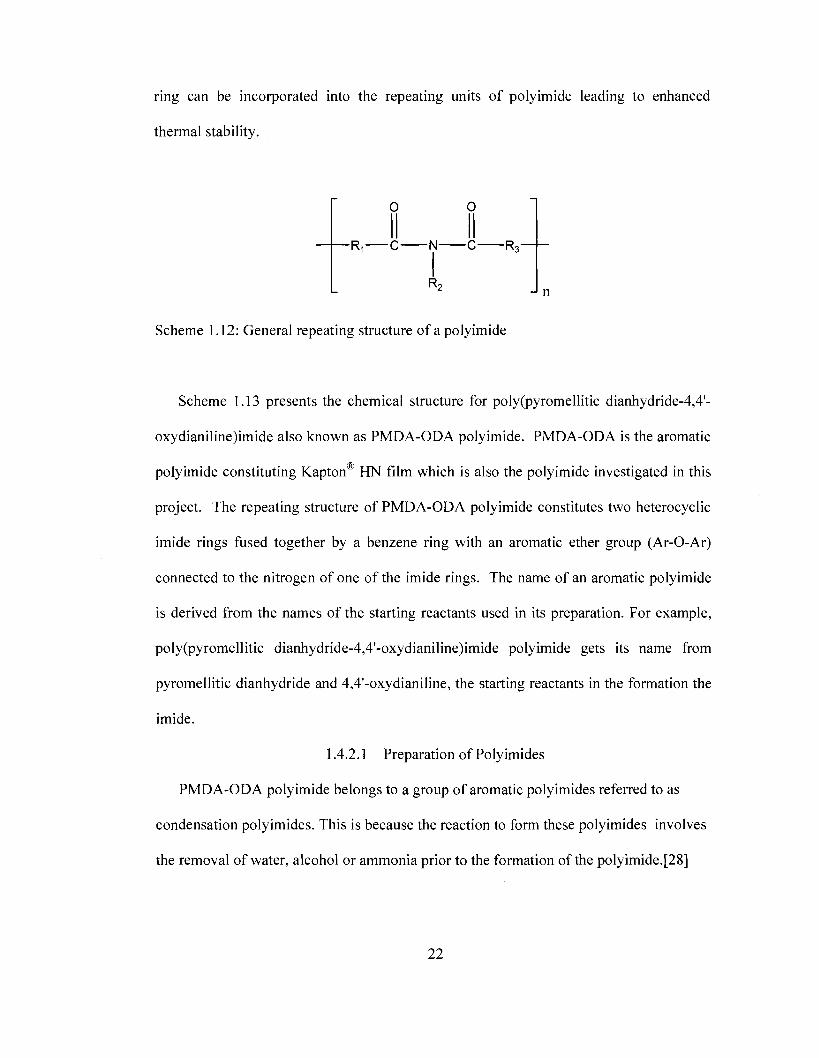
Scheme 1.13 presents the chemical structure for poly(pyromellitic dianhydride-4,4'-
oxydianiline)imide also known as PMDA-ODA polyimide. PMDA-ODA is the aromatic
polyimide constituting Kapton HN film which is also the polyimide investigated in this
project. The repeating structure of PMDA-ODA polyimide constitutes two heterocyclic
imide rings fused together by a benzene ring with an aromatic ether group (Ar-O-Ar)
connected to the nitrogen of one of the imide rings. The name of an aromatic polyimide
is derived from the names of the starting reactants used in its preparation. For example,
poly(pyromellitic dianhydride-4,4'-oxydianiline)imide polyimide gets its name from
pyromellitic dianhydride and 4,4'-oxydianiline, the starting reactants in the formation the
imide.
1.4.2.1 Preparation of Polyimides
PMDA-ODA polyimide belongs to a group of aromatic polyimides referred to as
condensation polyimides. This is because the reaction to form these polyimides involves
the removal of water, alcohol or ammonia prior to the formation of the polyimide.[28]
22
Scheme 1.13: Chemical structure for Poly(pyromellitic dianhydride-4,4'-
oxydianiline)imide
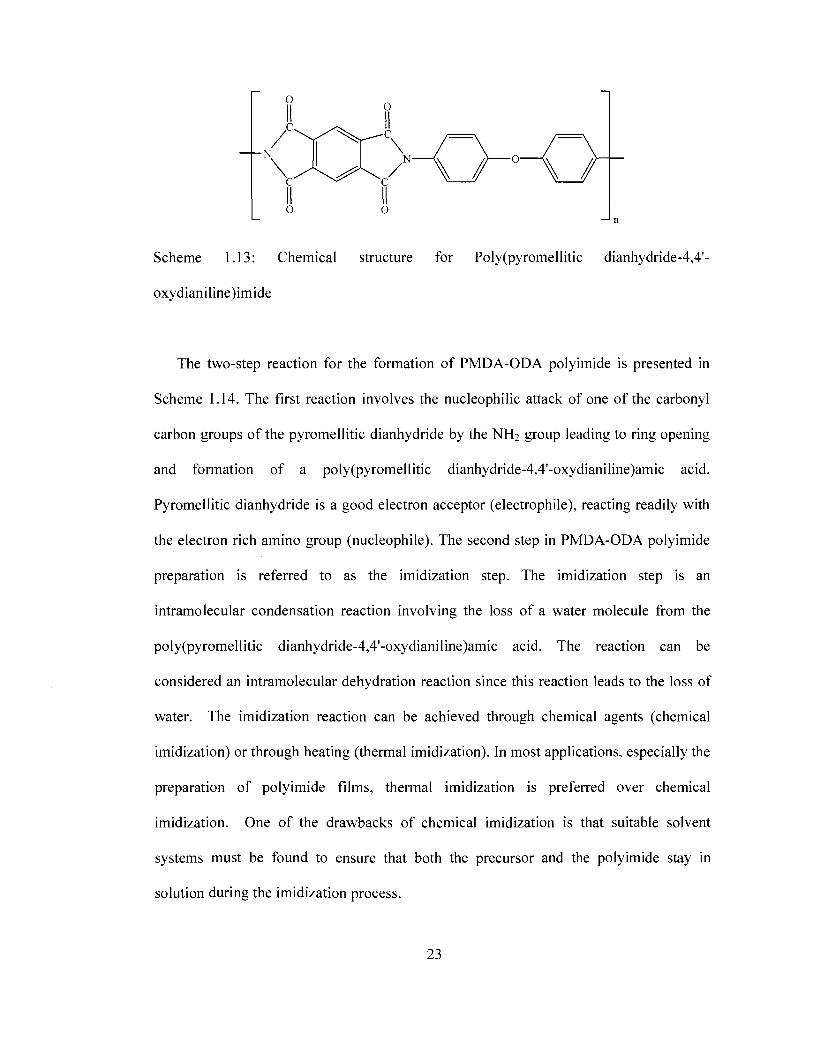
The two-step reaction for the formation of PMDA-ODA polyimide is presented in
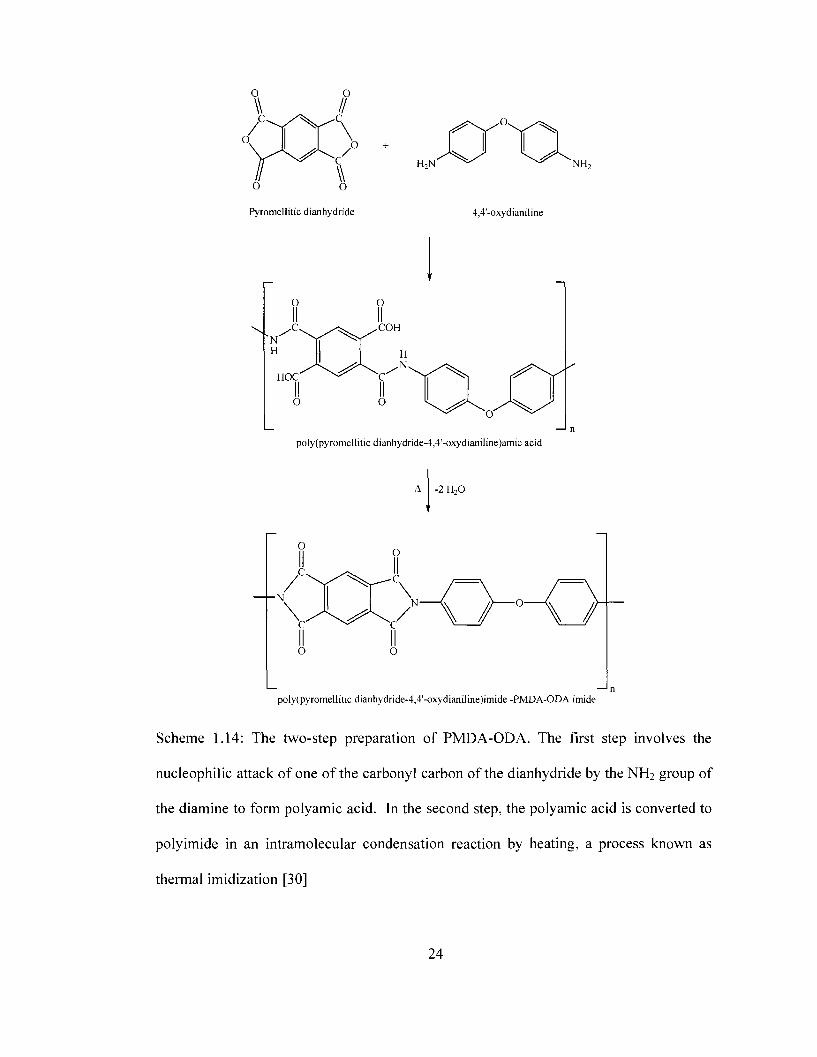
Scheme 1.14. The first reaction involves the nucleophilic attack of one of the carbonyl
carbon groups of the pyromellitic dianhydride by the NH2 group leading to ring opening
and formation of a poly(pyromellitic dianhydride-4,4'-oxydianiline)amic acid.
Pyromellitic dianhydride is a good electron acceptor (electrophile), reacting readily with
the electron rich amino group (nucleophile). The second step in PMDA-ODA polyimide
preparation is referred to as the imidization step. The imidization step is an
intramolecular condensation reaction involving the loss of a water molecule from the
poly(pyromellitic dianhydride-4,4'-oxydianiline)amic acid. The reaction can be
considered an intramolecular dehydration reaction since this reaction leads to the loss of
water. The imidization reaction can be achieved through chemical agents (chemical
imidization) or through heating (thermal imidization). In most applications, especially the
preparation of polyimide films, thermal imidization is preferred over chemical
imidization. One of the drawbacks of chemical imidization is that suitable solvent
systems must be found to ensure that both the precursor and the polyimide stay in
solution during the imidization process.
23
H9N NH,
Pyromellitic dianhydride 4,4'-oxydianiline
poly(pyromellitic dianhydride-4,4'-oxydianiline)amic acid
-2H20
poly(pyromellitic dianhydride-4,4'-oxydianiline)imide -PMDA-ODA imide
Scheme 1.14: The two-step preparation of PMDA-ODA. The first step involves the
nucleophilic attack of one of the carbonyl carbon of the dianhydride by the NH2 group of
the diamine to form polyamic acid. In the second step, the polyamic acid is converted to
polyimide in an intramolecular condensation reaction by heating, a process known as
thermal imidization [30]
24

Therefore, chemical imidization is mostly used for the preparation of soluble polyimides
[30] PMDA-ODA polyimide is highly insoluble in most solvents and therefore thermal
imidization is primarily preferred in its preparation from PMDA-ODA polyamic acid and
is utilized for all studies. A temperature range of 250-300°C is reported in literature for
the thermal imidization of polyamic acid to polyimide.[30-32] However, thermal
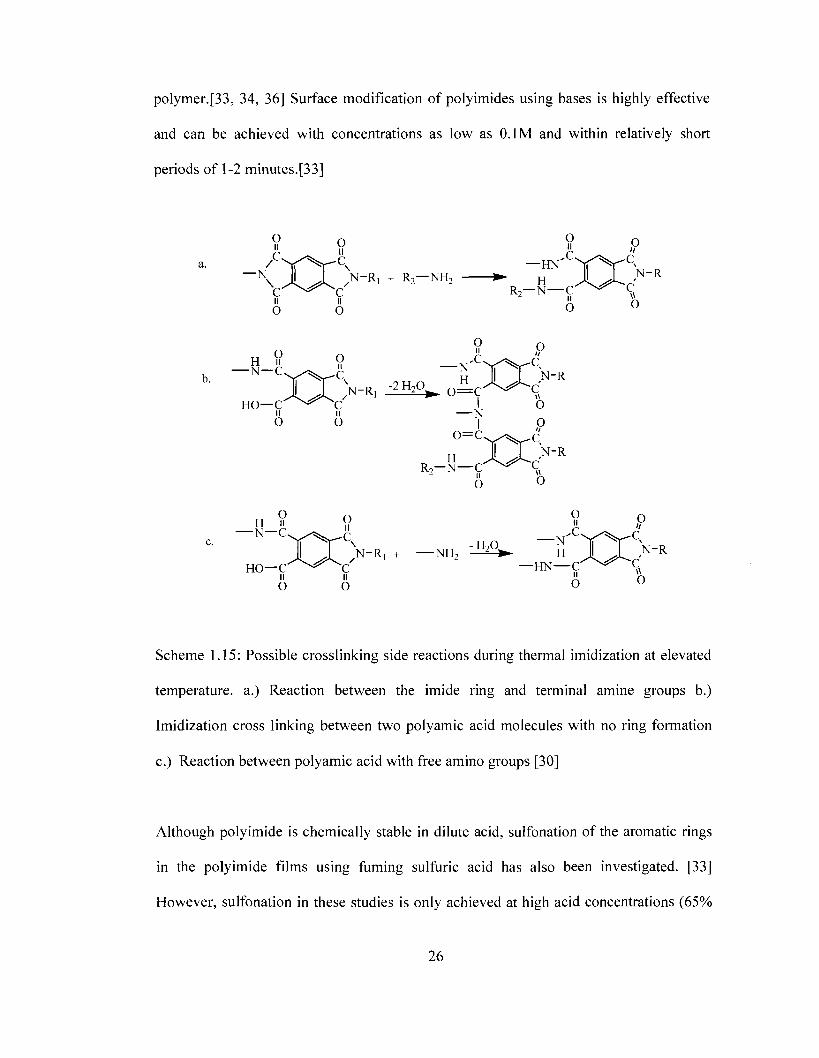
imidization does not achieve 100% conversion of polyamic acid to polyimide. Full
imidization can be achieved through chemical processes. [30] In addition side reactions
are possible between polyamic acid or polyimide chains and free or terminal NH2 groups
at these elevated temperatures. The side reactions are presented in Scheme 1.15.
However, the occurrence of these reactions leads to the formation of crosslinks that
contribute to the overall complex chemistry and strength of the polymer.
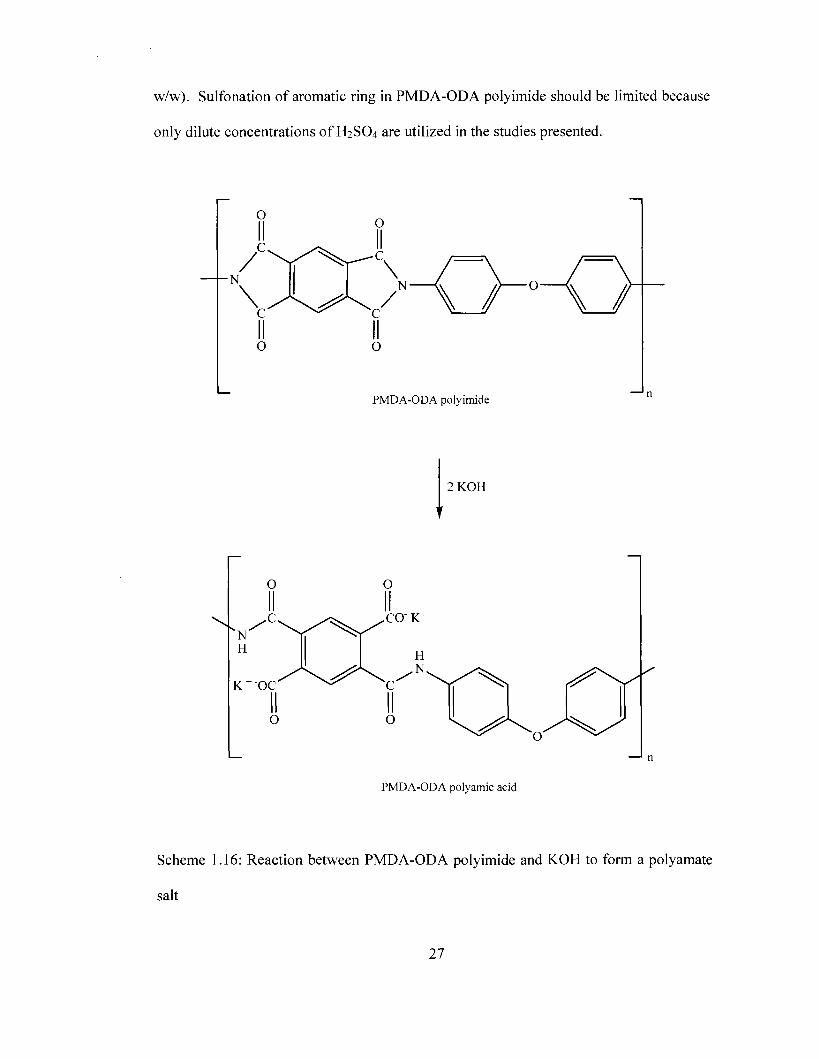
1.4.2.2 Chemical Stability PMDA-ODA polyimide in Acid and Bases
One application of interest is the use of polyimide/carbon/metal composites
developed in this study as anode or cathode electrode materials in photoelectrochemical
cells (PECs) and fuels cells containing acid electrolytes in continuous contact with the
electrode. The chemical and thermal stability of PMDA-ODA polyimide in dilute acids
makes it an attractive material for elevated temperature applications in acidic mediums.
In contrast, the use of polyimide/carbon/metal composites in alkaline electrolytes is
limited by the fact that PMDA-ODA polyimide reacts with dilute alkaline solutions,
resulting in a ring opening reaction forming the PMDA-ODA polyamic acid salt. [33-35]
The reaction between potassium hydroxide (KOH) and PMDA-ODA polyimide is
presented in Scheme 1.16. This reaction is widely used as a surface etching technique for
polyimide to improve metal or metal oxide particle adhesion to the surface of the
25
polymer.[33, 34, 36] Surface modification of polyimides using bases is highly effective
and can be achieved with concentrations as low as 0.1M and within relatively short
periods of 1-2 minutes.[33]
ti ° tip a. / > T % ^ C \ —HN >rT ^ - S
N II | \ r -R , x R . - N H . * • TT II J N-R
c II
\ A J k /N_Rl + R2_N"2 *" H - ^ - r C ^ ^ ^ C R2-N—C ^ ^ S
II Q 0 0 O
0 O O n r ''
HO—C ^ ^ C I O M II N
O O 1 0 o=c
H R 2 —N—C z II
O
N-R
c' O
H ti O tip
\-R, + —NH2 ' - ^ . H I I N-R H O - C ^ ^ ^ c ' - H N - C ^ ^ ^ C
II II »
o o o o
Scheme 1.15: Possible crosslinking side reactions during thermal imidization at elevated
temperature, a.) Reaction between the imide ring and terminal amine groups b.)
Imidization cross linking between two polyamic acid molecules with no ring formation
c.) Reaction between polyamic acid with free amino groups [30]
Although polyimide is chemically stable in dilute acid, sulfonation of the aromatic rings
in the polyimide films using fuming sulfuric acid has also been investigated. [33]
However, sulfonation in these studies is only achieved at high acid concentrations (65%
26
w/w). Sulfonation of aromatic ring in PMDA-ODA polyimide should be limited because
only dilute concentrations of H2SO4 are utilized in the studies presented.
PMDA-ODA polyimide
2 K O H
PMDA-ODA polyamic acid
Scheme 1.16: Reaction between PMDA-ODA polyimide and KOH to form a polyamate
salt
27
1.4.2.3 Solubility of PMDA-ODA polyimide
PMDA-ODA polyimide is insoluble in many organic solvents. The lack of good
solubility makes it difficult to cast or process polyimide into films wtih variable
thickness. However, PMDA-ODA polyamic acid precursor allows for better
processability due to its good solubility properties in polar aprotic solvents such as N,N-
dimethylformide (DMF), N-methyl-2-pyrrolidone (NMP), methyl glycol (MG), N,N-
dimethylacetamide (DMAC), tetramethyl urea (TMU) and dimethyl sulfoxide
(DMSO).[28, 32, 37, 38] The improved solubility is derived from the presence of the
proton of the PMDA-ODA polyamic acid. The carboxylic acid groups provide solvation
sites at which the positively charged protons interact with the negative dipole of polar
aprotic solvent molecules leading to ion/dipole interactions.[39] Therefore, for PMDA-
ODA polyimide applications, the precursor is applied or molded onto substrates prior to
thermal imidization. In this project a 15% (w/w) PMDA-ODA polyamic acid solution in
a 80/20 percent NMP/Aromatic hydrocarbon solvent system under the trade name Pyre
ML® RC5057 is used (Industrial Summit Technologies Corp.). Pyre-ML is a highly
viscous liquid and in most cases requires further dilution prior to processing, to and
during thermal imidization. This is especially true for DMSO and NMP. Gradual and
total removal of the solvent is critical, as it can influence the mechanical and physical
integrity of the resulting polyimide film. Rapid removal of the solvent at the high
imidization temperatures can lead to formation of air pockets and fractures caused by
uneven stress on the film. Furthermore, if these solvents are used to dilute polyamic acid,
large periods of time are required to ensure the gradual evaporation and removal of the
solvent from the PI films.
28
Traditional solvents used in the dilution of PMDA-ODA polyamic have low volatility
due to their relatively high boiling points and are therefore difficult to remove them prior
to and during imidization. To solve the problems associated with the low volatility of
solvent, an aprotic polar solvent system that consists of acetone and DMSO is used.
While PMDA-ODA polyamic acid is soluble in DMSO, it precipitates from solution
containing only acetone. However, the precursor is readily soluble in a 5:1 binary solvent
system containing acetone and DMSO, respectively. In addition, since the solvent system
contains large amounts of highly volatile acetone and small amounts DMSO, larger
solvent volumes for polyamic acid processing can be used. The high volatility of acetone
ensures that the time required for the removal of solvent prior to thermal imidization is
reasonable. In addition, large solvent volumes are useful in the minimization of carbon
aggregation during the formation of PMDA-ODA polyamic acid/carbon precursor films.
1.4.3 Carbon Incorporation into Polyimide Matrix
Carbon black is an inexpensive, common material used in polyimides, providing a
conductive material embedded within the polymer matrix.[27, 40, 41] The carbon black
forms fibrous aggregates with chain-like connections that allow electrons to flow through
the polymer. In most cases, carbon is incorporated into a polyamic acid solution prior to
thermal imidization to provide a more homogeneous distribution of the carbon.
The use of carbon black as conductive fillers in polymers is not limited to polyimide.
The incorporation of carbon black into polymers such as high density polyethylene
(HDPE), ethylnene-proylenediene monomer (EPDM) rubber, and acrylonitrile butadiene
rubber (NBR) has also been reported.[42, 43] Recent studies have examined both single
walled carbon nanotubes (SWNT) and multi walled carbon nanotubes (MWNT) as
29
polyimide filler materials. Both have demonstrated superior electrical conductivity in
comparison to carbon blacks.[44-48] In addition, polyimide/carbon nanotube composites
such as AURUMTM by Mitsui are now commercially available. However, the high cost
of carbon nanotubes is the main drawback to the bulk production and application of
conductive polyimide/carbon nanotube composites.
Pi/carbon films are prepared using a method provided by Lin et. al. [28] In their
study, they investigated the influence of morphology on electrical conductivity
characteristics of polyimide films filled with five different carbon blacks. Based on this
study, conductex® SC carbon black offered superior conductivity when compared to the
rest of the carbon fillers. This carbon material is therefore chosen for all the
Pi/carbon/metal composite studies.
A standard operating procedure for preparing Pi/carbon films of varying thickness
and uniform carbon dispersion on glass substrates using layer by layer application of a
precursor/carbon solution is developed in this project. The polyamic acid/carbon
precursor films are imidized using a step-wise temperature ramp to form the
polyimide/carbon films. In addition, curing studies have been performed to evaluate the
influence of solvent composition on the Pl/carbon composite films. These curing studies
demonstrate that the gradual and complete removal of the less volatile DMSO and NMP
is critical to ensuring that the mechanical integrity of the films is maintained.
1.4.4 Metal Incorporation into Polyimide/Carbon
The use of polyimide-metal composites in microelectronics and biosensor
applications has been reported. [49, 50] The formation of polyimide/metal composites
has been limited to sol gel processes, photoirradiation and chemical vapor deposition
30
techniques due to the insulating properties of polyimide substrates. [37, 51-57] However,
metal deposition at free standing polyimide substrates has not been extensively studied.
The majority of studies for the electrochemical deposition of metal onto polyimide
surfaces have been conducted after polyimide is coated onto an electroactive
substrate.[37, 50] Polyimide films are often grafted using other methods such as photo
irradiation of the precursor onto a conductive substrate. The properties of the resulting
laminate polyimide are then probed electrochemically. [58, 59] The electrodeposition of
PAA/metal salt solution into an electrode surface to create PAA/metal hybrids has also
been documented. [58-60] Andrescu et al. investigated the incorporation of Au and Ag
nanoparticles into electrochemically deposited PAA to form a PAA/metal composite by
taking advantage of PAA's affinity to reduce incorporated cations. Specifically, when the
carboxyl group of the PAA reacts with triethylamine, a polyamate salt is formed with a
cation that readily exchanges for the metal cation. The metal cation is then thermally or
electrochemically reduced to metallic form.
1.4.5 Conductive Polyimide/Carbon/Metal Composites - Focus and Envisioned
Applications
Although methods exist for the chemical insertion of metal into polyimide, there have
been no documented examples of the direct deposition of metals where the conducting
polyimide/carbon composites are utilized directly as an electrode. In this study the direct
electrochemical deposition of gold, platinum and palladium metals on the surface of
polyimide/carbon composites to form polyimide/carbon/metal composites is explored.
The suitability of these polyimide/carbon/metal composites as working electrodes used to
probe electrochemical reactions is also investigated. Additionally, the polyimide cure
31

procedure, polyamic acid-to-solvent ratios and carbon loading are optimized to produce
uniform conductive Pi/carbon composites. For comparison, gold metal is also deposited
using chemical vapor deposition (CVD) on Pi/carbon substrates, and the electrochemical
properties are compared. Finally, the chemical and mechanical properties of the
Pi/carbon/metal composites are evaluated.
The characterization of the physical, chemical, and mechanical properties after
incorporation of carbon and metal deposition onto the surface of PMDA-ODA polyimide
are investigated using a host of analytical techniques. The thermal stability of PMDA-
ODA polyimide prior and after incorporation of carbon and metal is studied using
thermal analysis techniques, specifically differential scanning calorimetry (DSC) and
thermal gravimetric analysis (TGA). The presence and distribution of metal on the
surface of the polyimide carbon composites are investigated using x-ray photoelectron
spectroscopy (XPS) and scanning electron microscopy (SEM).
Electrochemical methods, including cyclic voltammetry, are used for the deposition
of metal and probing electrochemical interactions at the surface of the Pi/carbon/metal
electrodes. Specifically, the electrooxidation of alcohols such as, methanol at the surface
of the Pi/carbon/metal (i.e. platinum and palladium) in acidic or alkaline media are
investigated.[61, 62] Platinum or platinum-ruthenium electrocatalysts embedded or on
the surface of the anode material of direct methanol fuel cells (DMFC) facilitate the
oxidation of methanol, the half reaction occurring at the anode side of the fuel cell.[63]
However, a 50:50 atomic ratio binary mixture of a platinum-ruthenium electrocatalyst is
preferred over platinum since it is less prone to carbon monoxide poisoning. Carbon
monoxide, an intermediate of the methanol oxidation reaction, strongly adsorbs on the
32
platinum electrode surface, diminishing the efficiency of platinum to catalyze methanol
oxidation. Hydroxyl groups adsorbed on the ruthenium particles catalyze the
electrooxidation of the adsorbed CO species, therefore freeing the platinum sites for
methanol oxidation. For the cathode side, platinum or a platinum-chromium
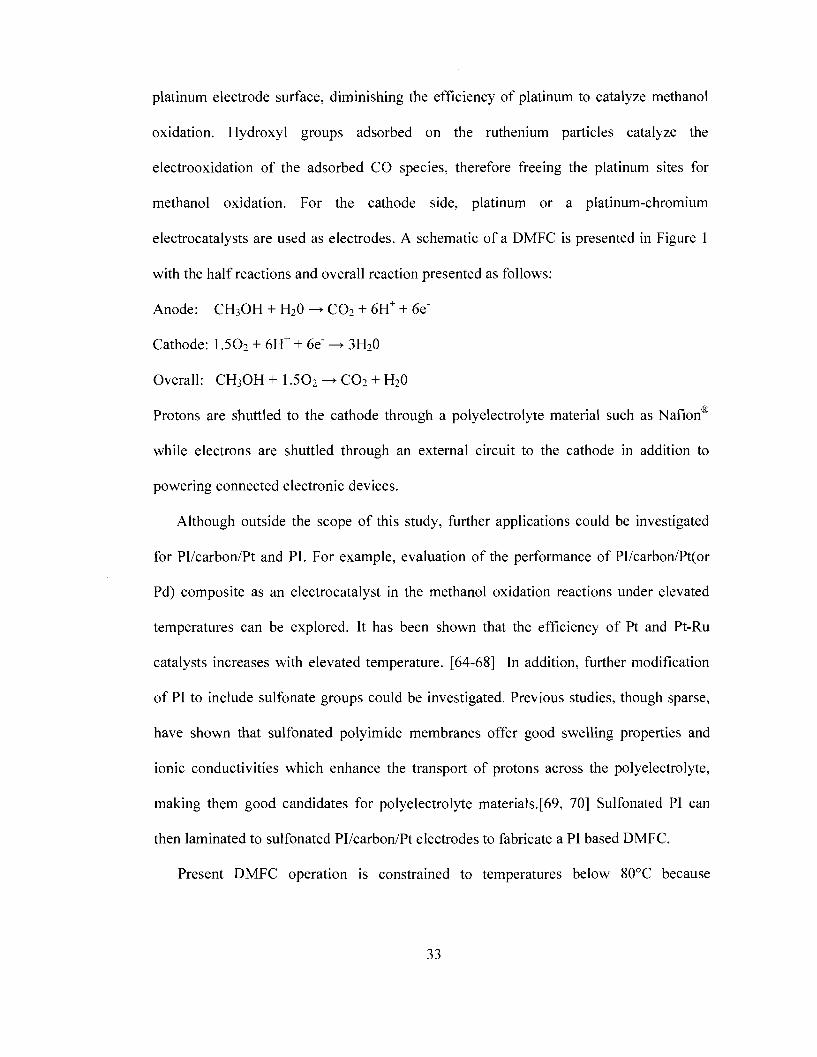
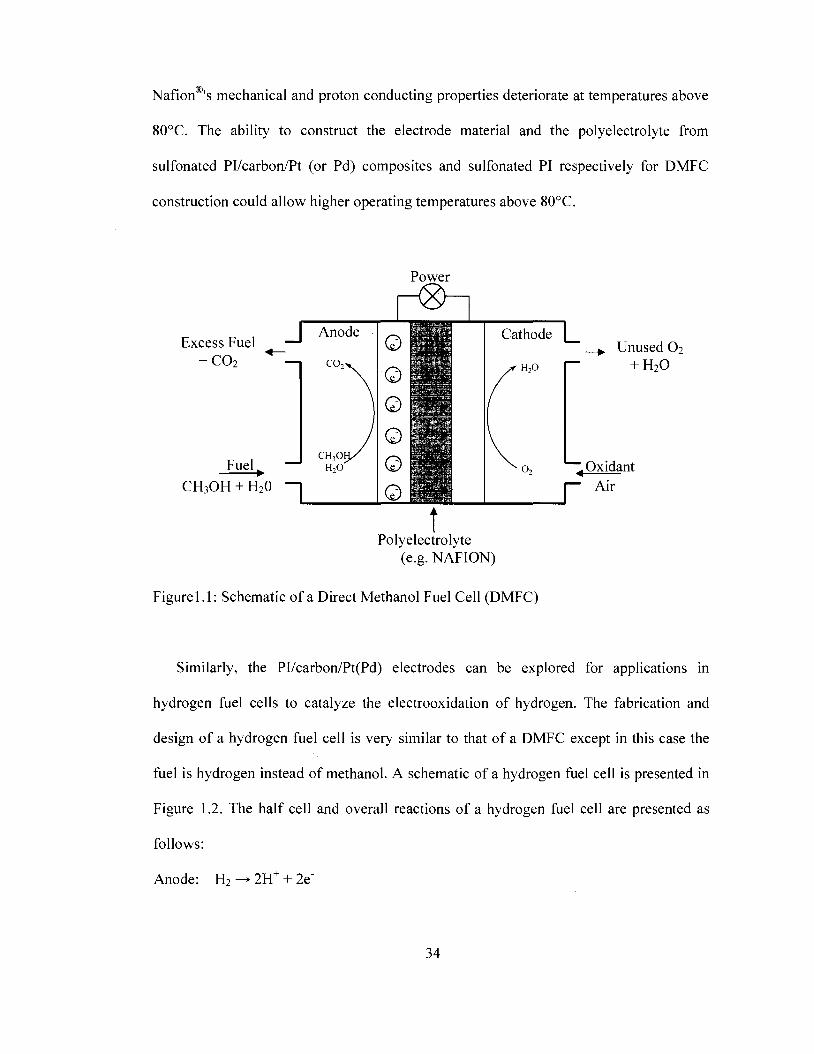
electrocatalysts are used as electrodes. A schematic of a DMFC is presented in Figure 1
with the half reactions and overall reaction presented as follows:
Anode: CH3OH + H20 - • C02 + 6H+ + 6e~
Cathode: 1.502 + 6H+ + 6e - • 3H20
Overall: CH3OH + 1.502 -> C02 + H20
Protons are shuttled to the cathode through a polyelectrolyte material such as Nafion
while electrons are shuttled through an external circuit to the cathode in addition to
powering connected electronic devices.
Although outside the scope of this study, further applications could be investigated
for Pl/carbon/Pt and PI. For example, evaluation of the performance of PI/carbon/Pt(or
Pd) composite as an electrocatalyst in the methanol oxidation reactions under elevated
temperatures can be explored. It has been shown that the efficiency of Pt and Pt-Ru
catalysts increases with elevated temperature. [64-68] In addition, further modification
of PI to include sulfonate groups could be investigated. Previous studies, though sparse,
have shown that sulfonated polyimide membranes offer good swelling properties and
ionic conductivities which enhance the transport of protons across the polyelectrolyte,
making them good candidates for polyelectrolyte materials.[69, 70] Sulfonated PI can
then laminated to sulfonated Pl/carbon/Pt electrodes to fabricate a PI based DMFC.
Present DMFC operation is constrained to temperatures below 80°C because
33
Nafion 's mechanical and proton conducting properties deteriorate at temperatures above
80°C. The ability to construct the electrode material and the polyelectrolyte from
sulfonated Pl/carbon/Pt (or Pd) composites and sulfonated PI respectively for DMFC
construction could allow higher operating temperatures above 80°C.
Power
Excess Fuel + C02 "~—,
I Anode
Fuel CH3OH + H20 ~L
r§h ©
.fffrt*5
0 0 0 0
K S l r
Cathode | _
H,0
Unused O2 + H20
. Oxidant
r Air
Polyelectrolyte (e.g. NAFION)
Figurel.l: Schematic of a Direct Methanol Fuel Cell (DMFC)
Similarly, the PI/carbon/Pt(Pd) electrodes can be explored for applications in
hydrogen fuel cells to catalyze the electrooxidation of hydrogen. The fabrication and
design of a hydrogen fuel cell is very similar to that of a DMFC except in this case the
fuel is hydrogen instead of methanol. A schematic of a hydrogen fuel cell is presented in
Figure 1.2. The half cell and overall reactions of a hydrogen fuel cell are presented as
follows:
Anode: H2 -»• 2H+ + 2e~
34
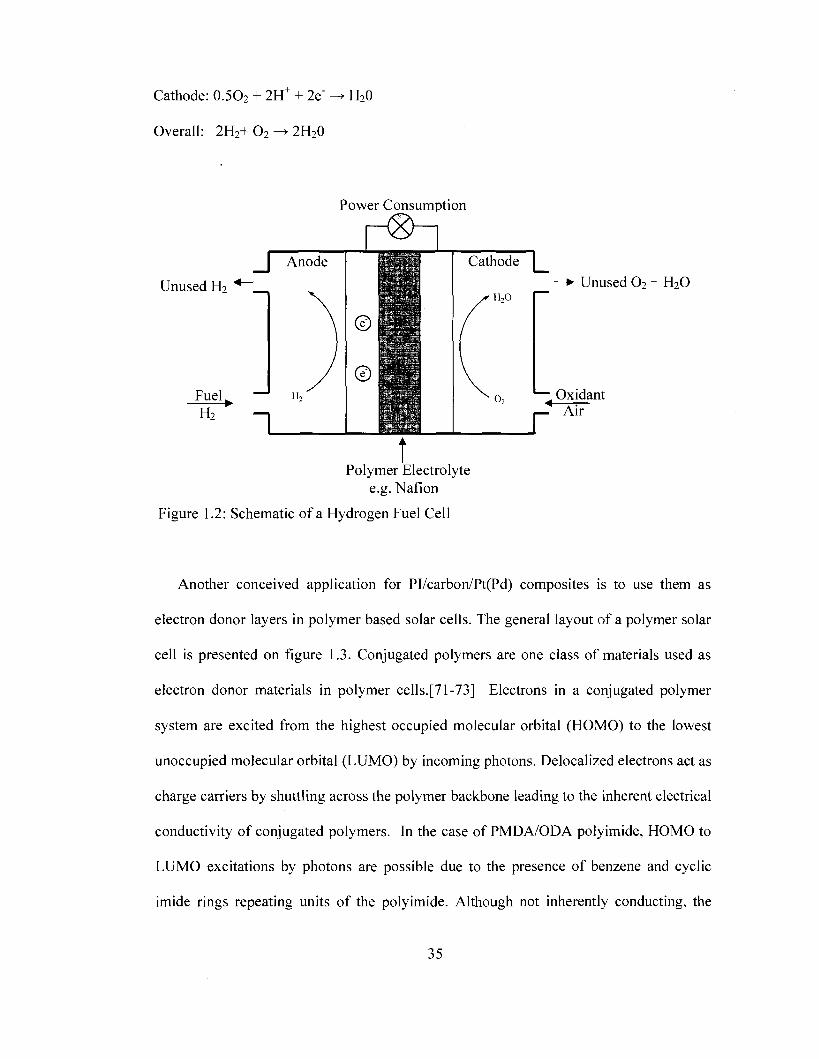
Cathode: 0.5O2 + 2H+ + 2e~ -> H20
Overall: 2H2+ 0 2 -> 2H20
Power Consumption
| Anode
Unused H?
F u e l ^ — H2
H2 ~L
©
©
£S*?g£
S S B
Cathode | _
Polymer Electrolyte e.g. Nation
Figure 1.2: Schematic of a Hydrogen Fuel Cell
H,O Unused 0 2 + H 2 0
o2 Oxidant I— Air
Another conceived application for PI/carbon/Pt(Pd) composites is to use them as
electron donor layers in polymer based solar cells. The general layout of a polymer solar
cell is presented on figure 1.3. Conjugated polymers are one class of materials used as
electron donor materials in polymer cells.[71-73] Electrons in a conjugated polymer
system are excited from the highest occupied molecular orbital (HOMO) to the lowest
unoccupied molecular orbital (LUMO) by incoming photons. Delocalized electrons act as
charge carriers by shuttling across the polymer backbone leading to the inherent electrical
conductivity of conjugated polymers. In the case of PMDA/ODA polyimide, HOMO to
LUMO excitations by photons are possible due to the presence of benzene and cyclic
imide rings repeating units of the polyimide. Although not inherently conducting, the
35
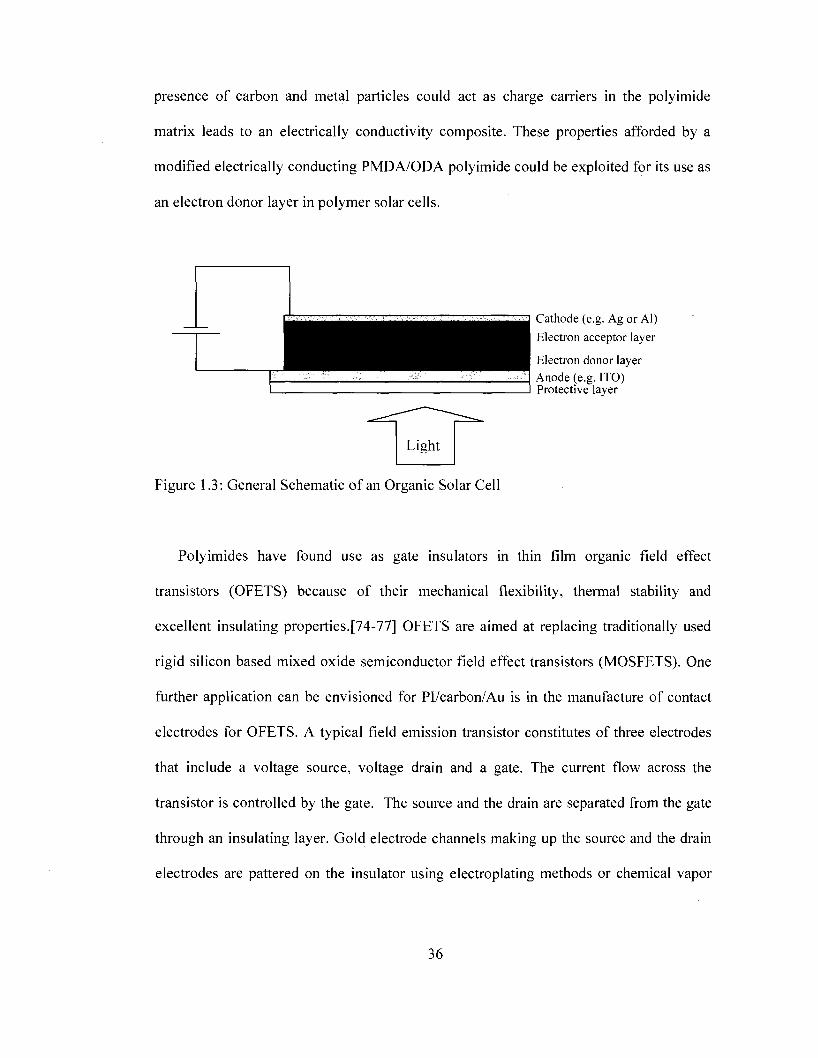
presence of carbon and metal particles could act as charge carriers in the polyimide
matrix leads to an electrically conductivity composite. These properties afforded by a
modified electrically conducting PMDA/ODA polyimide could be exploited for its use as
an electron donor layer in polymer solar cells.
Cathode (e.g. Ag or Al) Electron acceptor layer
Electron donor layer Anode (e.g. ITO) Protective layer
Light
Figure 1.3: General Schematic of an Organic Solar Cell
Polyimides have found use as gate insulators in thin film organic field effect
transistors (OFETS) because of their mechanical flexibility, thermal stability and
excellent insulating properties.[74-77] OFETS are aimed at replacing traditionally used
rigid silicon based mixed oxide semiconductor field effect transistors (MOSFETS). One
further application can be envisioned for Pl/carbon/Au is in the manufacture of contact
electrodes for OFETS. A typical field emission transistor constitutes of three electrodes
that include a voltage source, voltage drain and a gate. The current flow across the
transistor is controlled by the gate. The source and the drain are separated from the gate
through an insulating layer. Gold electrode channels making up the source and the drain
electrodes are pattered on the insulator using electroplating methods or chemical vapor
36
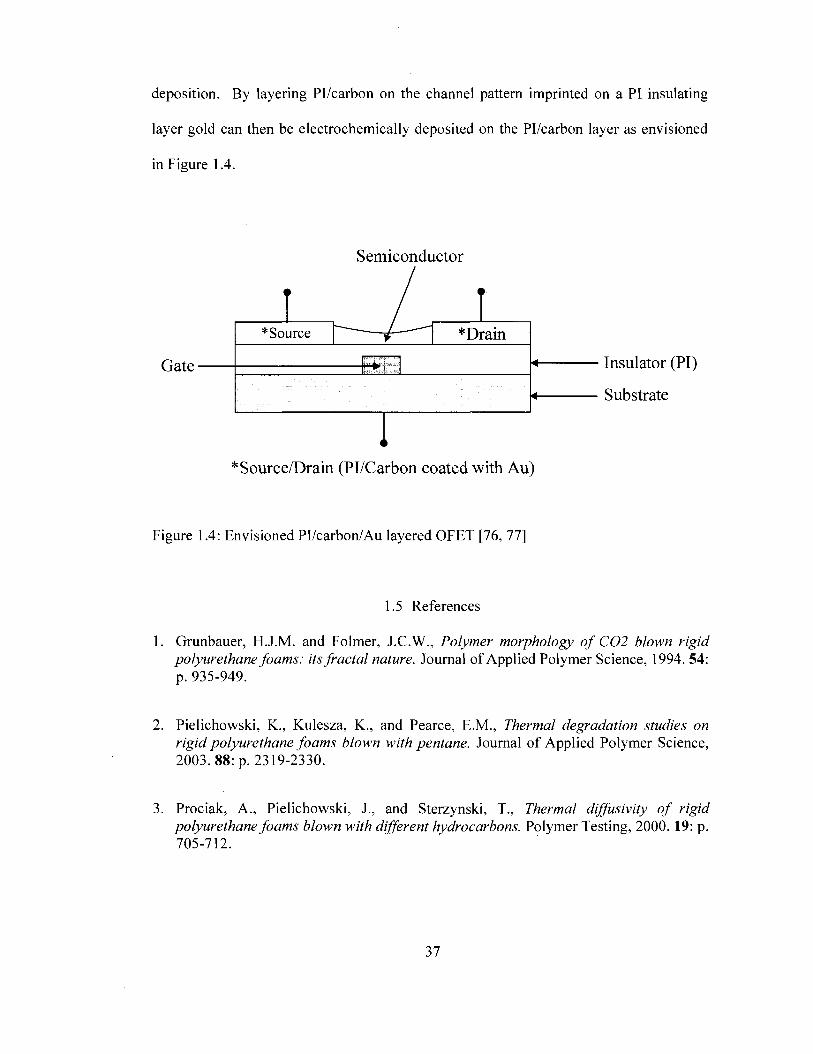
deposition. By layering Pi/carbon on the channel pattern imprinted on a PI insulating
layer gold can then be electrochemically deposited on the Pi/carbon layer as envisioned
in Figure 1.4.
Semiconductor
Gate
•
* Source
< > •
*Drain
< »
4 Insulator (PI)
Substrate
* Source/Drain (Pi/Carbon coated with Au)
Figure 1.4: Envisioned PI/carbon/Au layered OFET [76, 77]
1.5 References
1. Grunbauer, H.J.M. and Folmer, J.C.W., Polymer morphology of C02 blown rigid polyurethane foams: its fractal nature. Journal of Applied Polymer Science, 1994. 54: p.935-949.
2. Pielichowski, K., Kulesza, K., and Pearce, E.M., Thermal degradation studies on rigid polyurethane foams blown with pentane. Journal of Applied Polymer Science, 2003. 88: p. 2319-2330.
3. Prociak, A., Pielichowski, J., and Sterzynski, T., Thermal diffusivity of rigid polyurethane foams blown with different hydrocarbons. Polymer Testing, 2000. 19: p. 705-712.
37
4. Seo, W.J., Jung, H.C., Hyun, J.C., Kim, W.N., Lee, Y.B., Choe, K.H., and Kim, S.B., Mechanical, morphological, and thermal properties of rigid polyurethane foams blown by distilled water. Journal of Applied Polymer Science, 2003. 90(1): p. 12-21.
5. Broberg, K., Tinnerberg, H., Axmon, A., Warholm, M., Rannug, A., and Littorin, M., Influence of genetic factors on toluene diisocyanate-related symptoms: evidence from a cross-sectional study. Environmental Health, 2008. 7(15).
6. Banks, D.E., Rando, R.J., and Barkman, H.W., Persistence Of Toluene Diisocyanate-induced Asthma Despite Negligible Workplace Exposures. . Chest, 1990. 97(1): p. 121-125.
7. Bello, D., Herrick, C.A., Smith, T.J., Woskie, S.R., Streicher, R.P., Cullen, M.R., Liu, Y.C., and Redlich, C.A., Skin exposure to isocyanates: Reasons for concern. Environmental Health Perspectives, 2007.115(3): p. 328-335.
8. Hatchett, D.W., Kodippili, G., Kinyanjui, J.M., Benincasa, F., and Sapochak, L., FTIR analysis of thermally processed PU foam. Polymer Degredation and Stability, 2005. 87:p.555-561.
9. McElhanon, J.R., Russick, E.M., Wheeler, D.R., Loy, D.A., and Aubert, J.H., Removable foams based on an epoxy resin incorporating reversible Diels-Alder adducts. Journal of Applied Polymer Science, 2002. 85: p. 1496-1502.
10. Russick, E.M. and Rand, P.B., Development and characterization of a new epoxy foam encapusulant as ablefoam replacement., in Sandia Report:SAND98-2538. 1998, Sandia National Laboratories.
11. Aubert, J., Thermally removable epoxy adhesives incorporating thermally reversible Diels-Alder adducts. Journal of Adhesion, 2003. 79: p. 609-616.
12. Aubert, J.H., Tallant, D.R., Sawyer, P.S., and Garcia, M.J. Synthesis and formulation of a removable conformal coating using Diels-Alder thermally-reversible adducts. ACS Fall National Meeting, Poly, PMSE and FSCT preprints. 8/22-26, 2004. Philadelphia, PA.
13. Brown, R.F., Organic Chemistry. 1975, Belmont, CA: Wadsworth Publishing Company, Inc.
38
14. Chang, T.C., Wu, K.H., Liao, C.L., Lin, S.T., and Wang, G.P., Thermo-oxidative degradation of siloxane-containing polyimide and unmodified polyimide. Polymer Degradation and Stability, 1998. 62: p. 299-305.
15. Lin, S.-T. and Huang, S.K., Thermal degradation study of siloxane-DGEBA epoxy copolymers. European Polymer Journal, 1997. 33: p. 365-373.
16. Dvornic, P.R., Perpall, H.J., Uden, P.C., and Lenz, R.W., Exactly alternating silarylene-siloxane polymers. VII. Thermal Stabilityand degradation behavior of p-silphenylene-siloxane polymers with methyl, vinyl, hydrido, and/or fluoralky side groups. Journal of Polymer Science: Part A: Polymer Chemistry, 1989. 27: p. 3503-3514.
17. Barthel, H. and Nikitina, E., INS and IR Study of Intermolecular Interactions at the Fumed Silica-Polydimethylsiloxane Interphase. Part 3 Silica-Siloxane Adsorption Complexes. Silicon Chemistry, 2004.1(4): p. 261-279.
18. Petrov, P., Bozukov, M., Burkhardt, M., Muthukrishnan, S., Muller, A.H.E., and Tsvetanov, C.B., Stabilization of polymeric micelles with a mixed polyfethylene oxide)/poly(2-hydroxyethyl methacrylate) shell by formation of polyfpentaerythritol tetraacrylate) nanonetworks within the micelles. Journal of Materials Chemistry, 2006.16(22): p. 2192-2199.
19. Kim, Y.B., Kim, H.K., and Hong, J.W., UV-curable methacrylic epoxy dispersions for cationic electrodeposition coating. Journal of Applied Polymer Science, 2006. 102(6): p. 5566-5570.
20. Gibson, L.J. and Ashby, M.F., Cellular solids: structure and properties. 1997, Cambridge: Cambridge University Press.
21.Dupont. Kapton® HN. 2007 [cited; Available from: http://www2.dupont.com/Kapton/en_US/assets/downloads/pdf/HN_datasheet.pdf.
22. Kaufmann C.A., Neisser A., Klenk R., and R., S., Transfer of Cu(In,Ga)Se2 thin film solar cells to flexible substrates using an in situ process control. Thin Solid Films, 2005. 480-481: p. 515-519.
23. Kessler F. and Rudmann D., Technological aspects of flexible CIGS solar cells and modules Solar Energy, 2004. 77(6): p. 685-695.
39
24. Southward R.E., Thompson D.S., Thompson D.W., Caplan ML., and A.K., S.C., Synthesis of Reflective Polyimide Films via In Situ Silver (I) Reduction. Chemistry of Materials, 1995. 7: p. 2171-2180.
25. Tiwari A.N., Romeo A., Baetzner D., and Zogg H., Flexible CdTe solar cells on polymer films. Progress in Photovoltaics: Research and Applications, 2001. 9(3): p. 211-215.
26. Vijh A., Yang X., Du W., and Deng, X. Film adhesion in triple junction a-Si solar cells on polyimide substrates, in Photovoltaic Specialists Conference. 2005: IEEE XPLORE.
27. Bower, G.M. and Frost, L. W., Aromatic polyimides. Journal of Polymer Science Part A: General Papers, 1963.1(10): p. 3135-3150.
28. Lin J-S. and Chiu H-T., Preparation and Properties of Conductive Polyimide films. Journal of Polymer Research, 2002. 9: p. 189-194.
29. Srividhya, A. and Reddy, B.S.R., Synthesis and characterization of polyimide containing PEG/PDMS amphiphilic conetworks by hydrosilylation: Correlation between structure and properties. Journal of Polymer Science Part a-Polymer Chemistry, 2007. 45(9): p. 1707-1726.
30. Kricheldorf H.R., Nuyken O., and Swift G., Handbook of Polymer Synthesis. 2005, New York: Marcel Dekker.
31. Li, L., Qinghua, L., Jie, Y., Xuefeng, Q., Wenkai, W., Zikang, Z., and Zongguang, W., Photosensitive polyimide (PSPI) materials containing inorganic nano particles (I)PSPI/Ti02 hybrid materials by sol-gel process. Materials Chemistry and Physics, 2002. 74(2): p. 210-213.
32. Zhai, Y., Yang, Q., Zhu, R.Q., and Gu, Y., The study on imidization degree of polyamic acid in solution and ordering degree of its polyimide film. Journal of Materials Science, 2008. 43(1): p. 338-344.
33. Ranucci, E., Sandgren, A., Andronova, N., and Albertsson, A.C., Improved polyimide/metal adhesion by chemical modification approaches. Journal of Applied Polymer Science, 2001. 82(8): p. 1971-1985.
40
34. Lee, K.W., Kowalczyk, S.P., and Shaw, J.M., Surface Modification OfPMDA-ODA Polyimide - Surface-Structure Adhesion Relationship. Macromolecules, 1990. 23(7): p. 2097-2100.
35. Zhao, Y., Lu, Q.H., Chen, D.S., and Wei, Y., Superhydrophobic modification of polyimide films based on gold-coated porous silver nanostructures and self-assembled monolayers. Journal of Materials Chemistry, 2006.16(46): p. 4504-4509.
36. Huang, X.D., Bhangale, S.M., Moran, P.M., Yakovlev, N.L., and Pan, J.S. Surface modification studies of Kapton (R) HN polyimide films. 2003: John Wiley & Sons Ltd.
37. Ghosh M.K. and Mittal K.L., eds. Polyimides. 1996, Marcel Dekker: New York.
38. Lee, T., Park, S.S., Jung, Y., Han, S., Han, D., Kim, I., and Ha, C.-S., Preparation and characterization of polyimide/mesoporous silica hybrid nanocomposites based on water-soluble polyfamic acid) ammonium salt. European Polymer Journal, 2009. 45(1): p. 19-29.
39. Sorrell, T.N., Organic Chemistry. 2 ed. 2006, Sausalito, CA.: University Science Books.
40. Imai Y., Fueki T., Inoue T., and M-A., K., A New Direct Preparation of Electroconductive Polyimide/Carbon Composite Via Poly condensation of Nylon-Salt Type Monomer/Carbon Black Mixture Journal of Polymer Science: Part A:Polymer Chemistry, 1998. 36: p. 1031-1034.
41.Pantea D., Darmstadt H., Kaliaguine S., and Roy C , Electrical conductivity of conductive carbon blacks influence of surface chemistry and topology. Applied Surface Science, 2003. 217: p. 181-193.
42. Luo S. and Wong C.P., Study on effect of acrbon black on behavior of conductive polymer composites with positive temperature coefficient. IEEE Transactions on Components and Packaging Technologies, 200. 23(1): p. 151-156.
43. Zhang W., Dehghani-Sanij, A.A., and Blackburn R.S., Carbon based conductive polymer composites. Journal of Materials Science, 2007. 42: p. 3408-3418.
41

44. Hill D., Lin Y., Qu L., Kitagorodskiy A., Connell J.W., Allard L.F., and Y-P., S., Functionalization of Carbon nanotubes with Derivatized Polyimide. Macromolecules, 2005. 38: p. 7670-7675.
45. Jiang X., Bin Y., and Matsuo M., Electrical and Mechanical Properties of Polyimide-Carbon Nanotubes Composites Fabricated by In Situ Polymerization. Polymer, 2005. 46: p. 7418-7424.
46. Shigeta M., Komatsu M., and Nakashima N., Individual Solubilization of Single-Walled Carbon Nanotubes Using Totally Aromatic Polyimide. Chemical Physics Letters, 2006. 418: p. 115-118.
47. Wise K.E., Park C , Siochi E.J., and J.S., H., Stable Dispersion of single Wall Carbon Nanotubes in Polyimide: The Role ofCovalent Interactions. Chemical Physics Letters 2004. 391: p.207-211.
48. Zhu B-K., Xie S-H., Xu Z-K., and Y-Y, X., Preparation and Properties of the Polyimide/Multi-Wailed Carbon Nanotubes (MWNTs) Nanocomposites. Composites Science and Technology, 2005. 66 p. 548-554.
49. Harrington C.B., Harrington M.I., Sultan M.F., and J.R., T., Durable Platinum /Poyimide Sensing Structures, Office, U.S.P., Editor. 1998, General Motors Corporation: United States.
50. Metz S., Heuschkel M.O., Avila B.V., Holzer R., Bertrand D., and P., R. Microelectrodes with Three-Dimensional Structures for Improved Neural Interfacing. in Proceedings of the 23rd Annual EMBS International Conference. 2001. Instabul, Turkey.
51. Bergmeister J.J., Rnacourt J.D., and Taylor L.T., Synthesis and Characterization of Magnetic Iron Modified Polyimide Films. Chemistry of Materials, 1990. 2: p. 640-641.
52. Cardoso, J., GomezDaza, O., Ixtlilco, L., Nair, M.T.S., and Nair, P.K., Conductive copper sulfide thin films on polyimide foils. Semiconductor Science and Technology, 2001.16(2): p. 123-127.
53. Horn K., Bradshaw A.M. , Doblhofer K., Krause S. , Weinberg G., Seidenspinner H.M., and R., S., A Study of the Adhesion of Copper to Polyimide Foils using Surface Analytical Techniques. Fresenius Z Anal Chem, 1989. 333: p. 590-595.
42
54. Maggioni G., Carturan S., Boscarino D., G., D.M., and U., P., Polyimide and platinum containing polyimide thin films obtained by vapour deposition polymerization; effects of thermal treatments. Materials Letters, 1997. 32(2-3): p. 147-150.
55. Sawada T. and Ando S., Synthesis, Characterization, and Optical Properties of Metal-Containing Fluorinated Polyimide Films Chemistry of Materials, 1998. 10: p. 3368-3378.
56. Sessler G.M., Hahn B., and Yoon D.Y., Electrical Conduction in Polyimide Films. Journal of Applied Physics, 1986. 60(1): p. 318-326.
57. Yoda S., Hasegawa A., Suda H., Uchimaru Y., Haraya K., Tsujui T., and Otake K., Preparation of a Platinum and Palladium/Polyimide Nanocomposite Film as a Precursor of Metal-Doped Carbon Molecular Sieve Membrane via Supercritical Impregnation. Chemistry of Materials, 2004. 16: p. 2363-2368.
58. Anderson, M.R., Davis, R.M., Taylor, CD., Parker, M., Clark, S., Marciu, D., and Miller, M., Thin Polyimide Films Prepared by Ionic Self Assembly. Langmuir, 2001. 17: p. 8380-8385.
59. Oh S-Y., Park J-K., Choi J-W., and Moon C , Fabrication of Micro Array of Polyimide LB Film and Its Application in Bioelectronics Device. Molecular Crystals and Liquid Crystals, 2002. 377: p. 241-244.
60. Andreescu D., Wanekaya A.K., Sadik O.A., and J., W., Nanostructured Polyamic Acid Membranes as Novel Electrode Materials. Langmuir, 2005. 21(15): p. 6891-6899.
61. Hatchett, D.W., Wijeratne R., and Kinyanjui J.M., Reduction ofPtCl/'andPtCl/' in polyaniline: Catalytic oxidation of methanol at morphologically different composites. Journal of Electroanalytical Chemistry, 2006. 593: p. 203-210.
62. Ye, J., Liu, J., Xu, C , Jiang, S.P., and Tong, Y., Electrooxidation of 2-propanol on Pt, Pd and Au in alkaline medium. Electrochemistry Communications, 2007. 9: p. 2760-2763.
63. Haile, S.M., Fuel cell materials and components. Acta Materialia, 2003. 51(19): p. 5981-6000.
43
64. Arico, A.S., Baglio, V., Di Blasi, A., Modica, E., Antonucci, P.L., and Antonucci, V., Analysis of the high-temperature methanol oxidation behaviour at carbon-supported Pt-Ru catalysts. Journal of Electroanalytical Chemistry, 2003. 557: p. 167-176.
65. Arico, A.S., Baglio, V., Di Blasi, A., Modica, E., Monforte, G., and Antonucci, V., Electrochemical analysis of high temperature methanol electro-oxidation at Pt-decorated Ru catalysts. Journal of Electroanalytical Chemistry, 2005. 576(1): p. 161-169.
66. Arico, A.S., Monforte, G., Modica, E., Antonucci, P.L., and Antonucci, V., Investigation of unsupported Pt-Ru catalysts for high temperature methanol electro-oxidation. Electrochemistry Communications, 2000. 2(7): p. 466-470.
67. Dickinson, A.J., Carrette, L.P.L., Collins, J.A., Friedrich, K.A., and Stimming, U., Performance of methanol oxidation catalysts with varying Pt: Ru ratio as a function of temperature. Journal of Applied Electrochemistry, 2004. 34(10): p. 975-980.
68. Umeda, M., Sugii, H., and Uchida, I., Alcohol electrooxidation at Pt and Pt-Ru sputtered electrodes under elevated temperature and pressurized conditions. Journal of Power Sources, 2008. 179(2): p. 489-496.
69. Gebel, G., Meyer, G., Gonon, L., Capron, P., Marscaq, D., Marestin, C , and Mercier, R., Degradation of sulfonated polyimide membranes in fuel cell conditions. Journal of Power Sources|Journal of Power Sources, 2006.157(1): p. 293-301.
70. Okamoto, K., Sulfonated polyimides for polymer electrolyte membrane fuel cell. Journal of Photopolymer Science and Technology, 2003.16(2): p. 247-254.
71.Hertel, D. and Bassler, H., Photoconduction in amorphous organic solids. ChemPhysChem, 2008. 9(5): p. 666-688.
72. Mayer, A.C., Scully, S.R., Hardin, B.E., Rowell, M.W., and McGehee, M.D., Polymer-based solar cells. Materials Today, 2007. 10(11): p. 28-33.
73. Brabec, C.J., Dyakonov, V., Parisi, C.J., ;, and Sariciftci, N.S., Organic Photovoltaics; Concepts and Realization. 2003, New York: Springer-Verlag.
44
74. Ahn, T., Choi, Y., Jung, H.M., and Yi, M , Fully aromatic polyimide gate insulators with low temperature processability for pentacene organic thin-film transistors. Organic Electronics, 2009. 10(1): p. 12-17.
75. Zhen, L.J., Guan, W.H., Shang, L.W., Liu, M , and Liu, G. Organic thin-film transistor memory with gold nanocrystals embedded in polyimide gate dielectric. 2008: lop Publishing Ltd.
76. Yusaku, K., Shingo, I., Ryohei, T., Tsuyoshi, S., Takao, S., Hiroshi, K., and Takayasu, S., High mobility of pentacene field-effect transistors with polyimide gate dielectric layers. Applied Physics Letters, 2004. 84(19): p. 3789-3791.
77. Horowitz, G., Organic field-effect transistors. Advanced Materials, 1998. 10(5): p. 365-377.
45

CHAPTER 2
EXPERIMENTAL
2.1 Characterization Methodology: Polyurethane Foam
2.1.1 Chemicals and Solutions
PU Foam: The PU foam was prepared using Voranol 490 (Dow Chemical Company,
Midland MI), DC 193 Surfactant (Dow Corning Corporation, Taylor, MI), Polycat 17
amine catalyst (Air Products, New Milford, CT), distilled water, and Rubinate 1680
(Huntsman Polyurethanes, Geismar, LA). The mass of each component was selected to
produce a target foam density of O.lg/cc.
2.1.2 Polyurethane Foam Synthesis
A Model D700, a two-reactant mixing system by Decker Industries was used to
automatically mix and dispense the components used to formulate the PU foam. The
Voranol, amine catalyst, surfactant and water were pre-mixed at a ratio (by volume) of
86.96: 2.03: 0.55: 1.00 respectively to make up a two-and-half gallon batch. This mixture
was then added to the "poly" compartment of the mixing system. An equal volume of
rubinate was added to the "iso" compartment.
During the dispensing process, the components were metered, mixed, and injected
into eight 28.7 mm inner diameter, 143 mm tall, cylindrical aluminum molds using a shot
time of ~2 seconds. The molds were capped at the bottom and open at the top to allow the
foam to rise and expand freely. A sufficient amount of the formula was injected into each
46
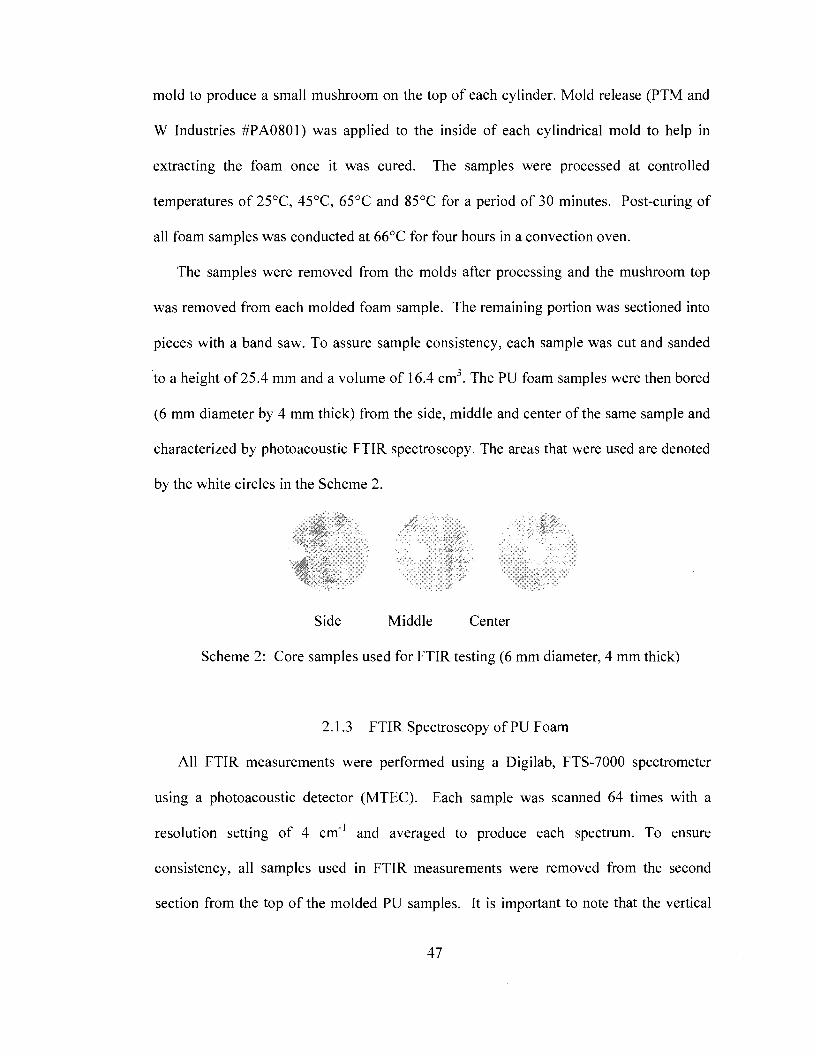
mold to produce a small mushroom on the top of each cylinder. Mold release (PTM and
W Industries #PA0801) was applied to the inside of each cylindrical mold to help in
extracting the foam once it was cured. The samples were processed at controlled
temperatures of 25°C, 45°C, 65°C and 85°C for a period of 30 minutes. Post-curing of
all foam samples was conducted at 66°C for four hours in a convection oven.
The samples were removed from the molds after processing and the mushroom top
was removed from each molded foam sample. The remaining portion was sectioned into
pieces with a band saw. To assure sample consistency, each sample was cut and sanded
to a height of 25.4 mm and a volume of 16.4 cm3. The PU foam samples were then bored
(6 mm diameter by 4 mm thick) from the side, middle and center of the same sample and
characterized by photoacoustic FTIR spectroscopy. The areas that were used are denoted
by the white circles in the Scheme 2.
Side Middle Center
Scheme 2: Core samples used for FTIR testing (6 mm diameter, 4 mm thick)
2.1.3 FTIR Spectroscopy of PU Foam
All FTIR measurements were performed using a Digilab, FTS-7000 spectrometer
using a photoacoustic detector (MTEC). Each sample was scanned 64 times with a
resolution setting of 4 cm"1 and averaged to produce each spectrum. To ensure
consistency, all samples used in FTIR measurements were removed from the second
section from the top of the molded PU samples. It is important to note that the vertical
47
foam sections did not differ appreciably. It is somewhat surprising that there is little
difference in the chemistry in the vertical sections of the mold. It is possible the vertical
expansion of the mold minimizes the thermal differences vertically in the mold.
However, changes in the radial distribution of species in the mold were consistent in the
mold. The data were normalized using the technique described by Bhattacharjee et al. for
the integration and quantifying of isocyanurate and isocyanate conversion in PU foams
using FTIR spectra.fl] A minimum of five samples were used for each temperature at
the side, middle, and center position. All reported integration values have a relative error
of less than two percent for the sample group (not shown on plots).
2.2 Characterization Methodology: Removable Epoxy Foam
2.2.1 Epoxy Foam Synthesis
Foam cylinders were prepared at Sandia National Laboratory in a stainless steel
cylindrical mold by injecting the mixed resins, curatives, surfactant, and blowing agent
into the mold. The foam formulation is shown in Table 2.1. A Stochiometric mix was
utilized with a ratio of 1:0.565 part A to part B, respectively. After injection into the
mold, the foam expanded within the mold and was packed to the desired density of
approximately 0.17 g/cm3 (with a packing factor of approximately 2). The foams were
treated with a two step cure (65 °C for 2 hrs / 75 °C for 22 hrs). The top and bottom of
each foam cylinder was removed and then the remainder was sectioned using a band saw.
To assure sample consistency, each sample was cut and sanded to a height of 25.4 mm
for each section and a volume of 16.4 cm3.
48
PART A
Epon®8121: 40% (epoxy resin)
RER 1:48%
RER2: 12%
PARTB
Ancamine 2049: 38.1%(diamine)
Ancamine 2205: 15.0% (diamine)
Fluorinert FC-72: 44.2% (blowing agent)
DC 193: 1.8% (surfactant)
Cab-O-Sil M5: 0.9% (nucleating agent)
Table 2.1: Removable Epoxy Foam Formulation
2.2.2 Thermal Cycling
Epoxy foam sections were placed in a Lindberg-Blue MO1420A gravity oven at 95
°C and maintained at this temperature for 24 hours. The temperature control accuracy
provided by the manufacturer for the oven is ±0.5% and chamber temperature uniformity
of ±1% at 100°C. The oven was then allowed to return to room temperature and the foam
equilibrated for an additional 24 hour period. The process of heating and cooling was
designated as one thermal cycle. Samples were treated and removed at 1, 5 and 10 cycles.
A minimum of 5 sections were used for each thermal cycle. In addition, five untreated
foam sections were used as a baseline for the study and denoted as the 0 cycle specimens.
2.2.3 FTIR Spectroscopy of Epoxy Foam
All FTIR measurements were performed using a Digilab FTS-7000 spectrometer
coupled with a Digilab UMA-600 IR microscope. In-situ FTIR measurements were
conducted using an untreated foam sample placed on a gold mica substrate affixed to a
49
heating stage. The stage is equipped with a thermostat and thermocouple to ensure the
accuracy of the temperature within ± 10 °C. The in-situ samples were examined after
equilibrating at a given temperature for five minutes. For these measurements the
difference spectra were obtained using the pristine foam as the background. Any change
in the FTIR properties of the foam appear as positive or negative bands as their
composition increases or decreases, respectively. All spectra were obtained from an
average of 64 scans at a resolution setting of 8 cm" . All FTIR measurements were
performed on the second section from the top of the mold to ensure sample consistency.
Liquid samples were analyzed using a germanium attenuated total reflectance (ATR)
crystal attachment.
2.2.4 Thermal Mechanical Analysis (TMA)
Thermal mechanical analysis (TMA) was conducted using a Netzsch TMA 202
instrument. Thermal mechanical analysis experiments were run at 5 °C/min, under N2 gas
(50 ml/min) with a constant force of 5cN applied to the sample. The average length of
foam material tested was 2.0 mm.
2.2.5 Mechanical Analysis of Epoxy Foams
Compression tests were performed on the cylindrical sections to obtain the modulus
using a United Testing (UTM) SSTM-1 frame. In accordance with the ASTM D1621 test
and specimen standard, a 4.4kN load cell at a crosshead speed of 0.127 cm/min was
applied. An equal number of sections from each vertical position in the removable epoxy
foam cylinders were tested.
2.2.6 Density Analysis of Epoxy Foams
The weight of the cylindrical sections was determined using an analytical balance (±
50
0.000lg). The weight and the volume of each section were then used to calculate the
density. The average density for each thermally cycled group was calculated by
averaging the densities of all sections.
2.3 Characterization Methodology: Polyimide/Carbon/Metal Composites
2.3.1 Chemicals and Solutions
Poly(pyromellitic dianhydride-co-4,4'-oxydianiline), amic acid (PAA) solution
(Aldrich, 15.0 wt. % ±5 wt. % in NMP/aromatic hydrocarbons, CatJ 575828, trade
name:Pyre-M.L.® RC-5057), dimethyl sulfoxide (Aldrich, >99.9%, CatJ 154938),
conductex SC carbon black (Columbian Chemical company), potassium
tetrachloroplatinate, K^PtCU (Strem, 98%, CatJ 78-1970), potassium tetrachloroaurate,
KAuCl4 (Aldrich, 98%, Cat.#206075), potassium tetrachloropalladate K2PdCl4 (Strem
Chemicals, 99%, Cat.#46-2126), perchloric acid (J.T. Baker, 69-72% , Cat# 9652-33),
Acetone (J.T. Baker, 99.5% , Cat.#9006-7), Potassium Ferricyanide, (K3Fe(CN)6)
2.3.2 Preparation of Polyimide/Carbon Composites
2.3.2.1 Determination of PAA Solvent System
The solubility of the precursor materials used in polyimide synthesis is low in most
solvents used for traditional polymer synthesis. Low volatility Polar solvents such as N-
methyl-2 pyrolidone (NMP), N,N-dimethylformanimide (DMF), dimethylsulfoxide
(DMSO) or methylglycol (MG) are used to dissolve polyamic acid. For example, Pyre
ML® is supplied as a highly viscous liquid that contains 15-16% PMDA/ODA amic acid
in NMP. Uniform dispersion of secondary components such as carbon black or metal
cations in this solution is difficult due to the high viscosity. Therefore, dilution with
51
suitable solvent is required prior to casting thin films or the introduction of carbon filler
materials.
In contrast, the removal of all solvent from the cast film prior to the imidization is an
important step in preventing fractures in the film due to heat-related evaporation stress.
Therefore a more volatile solvent system is required to maintain polymer precursor
solubility prior to casting and facilitate evaporation during the curing stage prior to
imidization.
The choice of acetone as a desirable polar aprotic solvent for PAA was based on its
high volatility, relatively low health risks as compared to other solvents used for PAA. A
small amount of PAA solution was added to 20 ml of acetone. The PAA precipitated
immediately upon addition and did not dissolve even after 24 hours of stirring. However,
the PAA became soluble in the solution upon mixing 5 ml of DMSO to 20 ml of acetone
prior to adding PAA. Although PAA was soluble upon adding only 1ml DMSO to 20 ml
acetone, PAA was found to precipitate out of solution after sitting for about 48 hours.
This was also observed for PAA/carbon solution where precipitation occurred
immediately after stirring was stopped. Therefore, a 1:5 DMSO to Acetone solvent
system was used for all studies.
2.3.2.2 PAA Solution Preparation (10% Carbon Content)
In a sealable plastic container, 5.45 g of conductex sc carbon was added to 100 ml
acetone. The carbon/acetone mixture was left stirring for 24 hours and then sonicated in a
water bath at room temperature for about 3 hours. In a fume hood, 54.5g of polyamic acid
(PAA) was weighed in a separate container. 20 ml of DMSO was added to the PAA
solution. The PAA/DMSO mixture was thoroughly mixed for five minutes at 2000 rpm
52
using a VWR general purpose mixer. While still mixing at the maximum mixer speed,
the carbon/acetone mixture was added very slowly to the PAA solution. After adding all
the carbon mixture to PAA mixture was allowed to mix for about 20 minutes. The
mixture was then visually inspected for uniformity.
The order of adding carbon/acetone and PAA/DMSO mixtures was found to
influence the uniformity of the resulting mixture. For example, adding the DMSO/PAA
to carbon/acetone led to immediate precipitation of PAA. However, on adding
carbon/acetone to DMSO/PAA, PAA precipitation did not occur. Therefore, the latter
sequence was followed in preparing all PAA/carbon solutions.
2.3.2.3 PAA Solution Application on a glass substrate
A small amount PAA/Carbon mixture was poured near the outer edge of the glass
substrate. Using a glass slide of the same width as the substrate, the mixture was spread
evenly on the substrate. This procedure was repeated until the whole glass substrate was
covered. The applied layer was allowed to dry for a period of 24 hours before applying
the next layer. This procedure was repeated for a total of five applications. For
PAA/carbon films used for fabricating Pl/Carbon/Pt films, a mixture containing 1ml
2x10" M K.2PtCl6 " dissolved in water and 10ml of PAA/Carbon solution was applied as a
final layer. The film was then allowed to dry in a fume hood for 48 hours.
2.3.2.4 PAA Film Curing and Imidization
The glass substrate containing the PAA/Carbon film was inserted into a vacuum
oven. The film was left to dry at a temperature at about 80°C and vacuum setting of
about 20 mmHg for a period one week. This was a very critical step to ensure maximum
removal of residual low volatility DMSO and NMP solvents from the film. Failure to
53
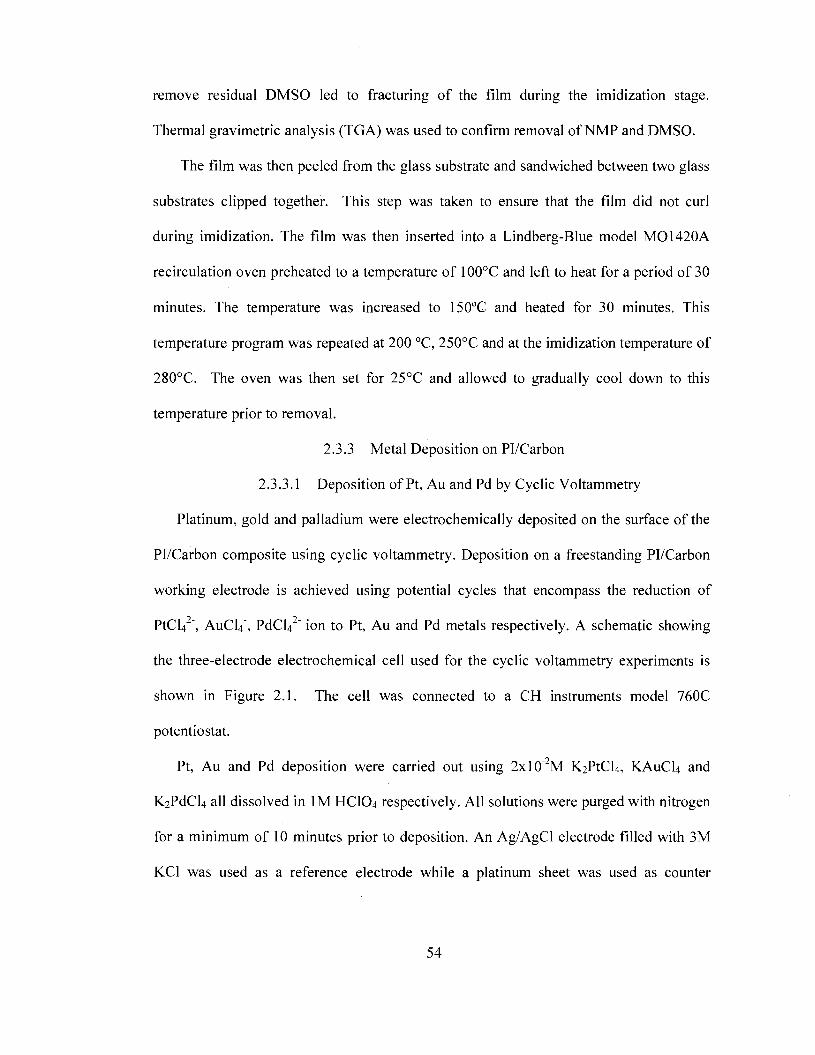
remove residual DMSO led to fracturing of the film during the imidization stage.
Thermal gravimetric analysis (TGA) was used to confirm removal of NMP and DMSO.
The film was then peeled from the glass substrate and sandwiched between two glass
substrates clipped together. This step was taken to ensure that the film did not curl
during imidization. The film was then inserted into a Lindberg-Blue model MO1420A
recirculation oven preheated to a temperature of 100°C and left to heat for a period of 30
minutes. The temperature was increased to 150°C and heated for 30 minutes. This
temperature program was repeated at 200 °C, 250°C and at the imidization temperature of
280°C. The oven was then set for 25°C and allowed to gradually cool down to this
temperature prior to removal.
2.3.3 Metal Deposition on Pi/Carbon
2.3.3.1 Deposition of Pt, Au and Pd by Cyclic Voltammetry
Platinum, gold and palladium were electrochemically deposited on the surface of the
Pi/Carbon composite using cyclic voltammetry. Deposition on a freestanding Pi/Carbon
working electrode is achieved using potential cycles that encompass the reduction of
PtCU2", AuCU", PdCU2" ion to Pt, Au and Pd metals respectively. A schematic showing
the three-electrode electrochemical cell used for the cyclic voltammetry experiments is
shown in Figure 2.1. The cell was connected to a CH instruments model 760C
potentiostat.
Pt, Au and Pd deposition were carried out using 2xlO"2M K2PtCl4, KAuCU and
K^PdCU all dissolved in 1M HCIO4 respectively. All solutions were purged with nitrogen
for a minimum of 10 minutes prior to deposition. An Ag/AgCl electrode filled with 3M
KC1 was used as a reference electrode while a platinum sheet was used as counter
54
electrode.
Working Electrode: Carbon/PI
Reference Electrode: Ag/AgCl
N2 gas Purge
Pt counter electrode
Figure 2.1: Three-electrode electrochemical cell used for cyclic voltammetry
2.3.3.2 Chemical Vapor Deposition of Au on Pi/Carbon
Gold deposition on cleaved mica and Pi/Carbon was performed in a Denton DV-
502A high vacuum carbon filament evaporator accessorized with an Inficon XTM/2
quartz crystal oscillator thickness monitor. A chamber vacuum pressure of 4x10" Torr
and an average deposition rate of 3 A/sec were maintained during the deposition period.
2.3.4 Characterization
2.3.4.1 X-Ray Photoelectron Spectroscopy
X-ray photoelectron spectroscopy was employed to identify the oxidation state of
platinum in the Pl/Carbon/Platinum composites. XPS measurements were performed
using a Specs PHOIBOS 150MCD electron analyzer with both Mg Ka and Al Ka X-ray
sources. The base pressure was in the 10"'° mbar range for all measurements. The
electron spectrometer was calibrated using XPS and Auger line positions of different
metals (Cu, Ag, and Au).[2]
55
2.3.4.2 Simultaneous Thermal Analysis and Determination of Platinum Loading
in Pl/Carbon/Pt Films
Simultaneous Thermal Analysis (STA) was conducted using a Netzsch STA449C
thermal analyzer. Simultaneous differential scanning calorimetry (DSC) and thermal
gravimetric analysis (TGA) were performed on PAA, PI, Pi/Carbon and Pl/Carbon/Pt
under air as both the purge (50ml/min) and protective (20 ml/min) gas at a heating rate of
10 °C/min. Samples were placed in alumina pans and covered with an alumina lid with a
centered pin-hole. The furnace was evacuated to about 10"3 torr prior to introducing purge
and protective gases.
Platinum loading in the Pl/carbon/Platinum composites with a uniform carbon
loading of 10% was estimated using TGA. The composite was heated to a temperature of
about 900°C at which all the Pi/carbon organic component of the composite was
decomposed. All mass loss was assigned to the decomposition of the organic component.
The remaining mass in the test crucible at the end of the experiment was then used to
estimate the metal content for the composite material. For statistics, a minimum of three
runs were performed at all platinum loadings examined.
2.3.4.3 Scanning Electron Microscopy
SEM images of PANI/Au composites were obtained using a JEOL 5600 electron
microscope equipped with a backscattered electron (BSE) detector. The films were
affixed to the sample holder using carbon tape and measurements were performed at an
acceleration voltage of 15 kV. Metal shadowing was not required prior to SEM
measurement.
56
2.3.4.4 Conductivity Characterization
Contacts with Pi/Carbon and Pl/Carbon/Pt films were made using a Cascade
Microtech C4S-64/50 probe head with tungsten carbide electrodes. The four point probe
sheet resistance of each film was then measured at locations across the surface of the
pellet using an Agilent 34401A Digital Multimeter connected through a Cascade
Microtech CPS-05 probe station. Constant pressure for each measurement was
maintained for the probe head contacting the substrate. A total of five measurements at
different locations, measured twice, are presented with representative standard deviations
and relative standard deviations for the measurements.
2.3.4.5 Fourier Transform Infrared (FTIR) Spectroscopy measurements
All FTIR measurements were performed using a Digilab, FTS-7000 spectrometer
using a photoacoustic detector (MTEC) on pristine samples. Each sample was scanned
64 times with a resolution setting of 4 cm"1 and averaged to produce each spectrum.
2.3.4.6 Cyclic voltammetry: PI/Carbon/Au characterization in Ferricyanide
Experiments to probe the ferricyanide redox couple using PI/Carbon/Au composite
films as working electrodes were performed in 0.01M potassium ferricyanide
[K3Fe(CN)6] in 1M KNO3. A cyclic voltammetry assembly identical to Figure 2.1 was
used for the experiment. A total of four working electrodes were used for the experiment
as follows:
1. Carbon/PI with no Au layer.
2. Carbon/PI/Au containing Au deposited Carbon/PI using cyclic voltammetry.
3. Carbon/PI/Au with 100A Au layer deposited on Carbon/PI using CVD.
57
4. A "reference" working Au planar electrode with 3000A deposited on cleaved
mica using CVD.
2.4 References
1. Bhattacharjee, D. and Engineer, R., An improved technique for the determination of isocyanurate and isocyanate conversion by photoacoustic chemistry. Journal of Cellular Plastics, 1996. 32: p. 261-273.
2. Briggs, D. and Seah, M.P., Practical Surface Analysis. Vol. 1. 1990, New York Wiley.
58
CHAPTER 3
FTIR CHARACTERIZATION OF POLYURETHANE FOAM
3.1 Introduction
Polyurethanes have been used in wide variety of applications including insulating
panels, coatings, sealants and adhesives. The continued use of rigid polyurethane (PU)
foams in industrial applications is primarily based on insulating properties and low
thermal conductivity of the materials. In contrast, the materials mechanical properties are
more important for applications including thermal coatings, sealants and adhesives.fi-3]
The application determines the degree of rigid (hard structure) versus flexible (soft
structure) units that should be employed. [4]
Polyurethanes are extremely versatile materials employing diverse chemical
functional groups that are incorporated into the polymer matrix during the reaction of the
polyol with isocyanate. This reaction forms the structural backbone of the polymer and
the flexibility or rigidity of the PU foam is based on the chemical constituents of the
reactants. Typical diisocyanates include 2, 4- and 2, 6-toluene diisocyanate (TDI), 4, 4'-
methylene diphenyl diisocyanate (MDI), and 1, 6-hexamethylene diisocyanate (HDI).
However, each of these diisocyantes is hazardous if handled improperly. To minimize
the hazard of common diisocyanates, a partially polymerized MDI was developed by
Huntsman Chemical. The partially polymerized MDI (Rubinate 1680) contains chemical
structures that can then be incorporated into the polymer matrix during the formation of
59
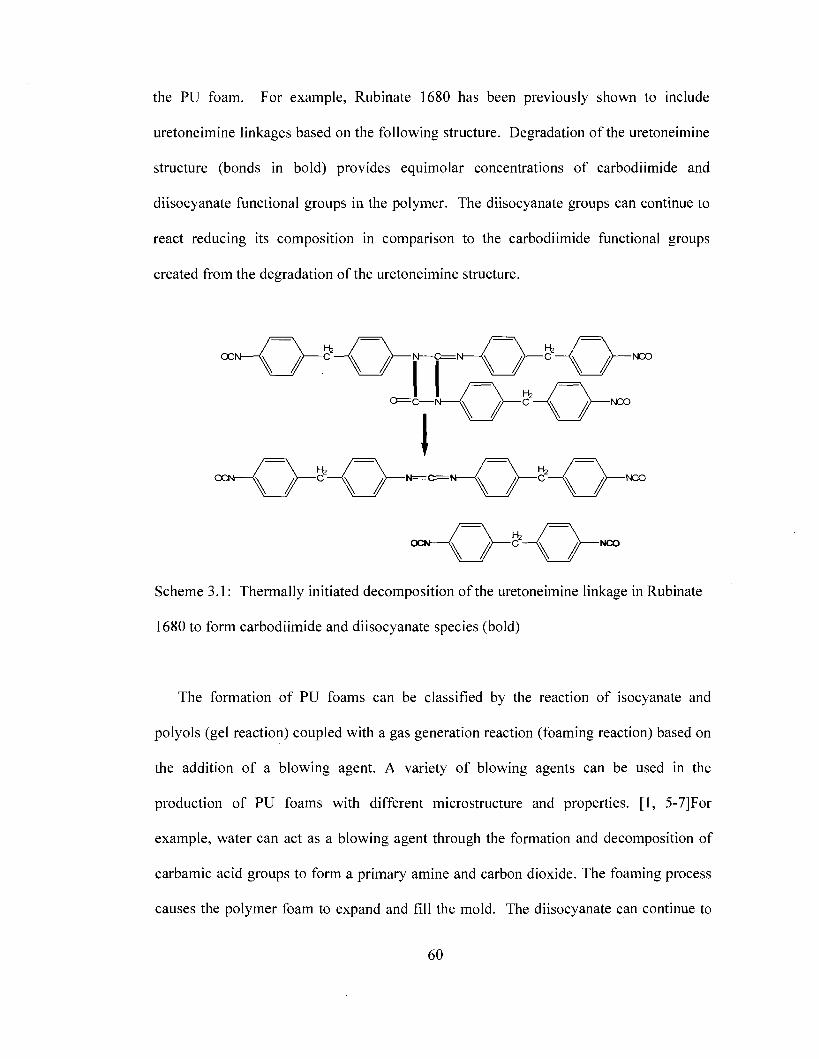
the PU foam. For example, Rubinate 1680 has been previously shown to include
uretoneimine linkages based on the following structure. Degradation of the uretoneimine
structure (bonds in bold) provides equimolar concentrations of carbodiimide and
diisocyanate functional groups in the polymer. The diisocyanate groups can continue to
react reducing its composition in comparison to the carbodiimide functional groups
created from the degradation of the uretoneimine structure.
\ /~H / r r H /~H /r™ °-*^\ /~H t~m
\ /~H /—-"-"-v r*-\ /rm
Scheme 3.1: Thermally initiated decomposition of the uretoneimine linkage in Rubinate
1680 to form carbodiimide and diisocyanate species (bold)
The formation of PU foams can be classified by the reaction of isocyanate and
polyols (gel reaction) coupled with a gas generation reaction (foaming reaction) based on
the addition of a blowing agent. A variety of blowing agents can be used in the
production of PU foams with different microstructure and properties. [1, 5-7]For
example, water can act as a blowing agent through the formation and decomposition of
carbamic acid groups to form a primary amine and carbon dioxide. The foaming process
causes the polymer foam to expand and fill the mold. The diisocyanate can continue to
60
react in the foaming process forming additional chemical functional groups such as urea,
uretoneimine, iso-alophonate, biuret, carbodiimide and uretidinedione, which all
contribute to the overall structure and rigidity of the material.[3, 4, 8] Rigid PU foams
offer a very low thermal conductivity giving them the highest insulating value among all
conventional insulating materials that are commercially available. Moreover, the trapped
gas within the closed cell structure of the polymer matrix further reduces heat transfer
that might occur by conduction. [9, 10] These factors produce regions of thermal isolation
within the molded PU foam.
The complex microstructure, heterogeneity and mechanical characteristics of PU
foams produced using the modified MDI have been examined previously.[11] The
correlation of the physical, mechanical and chemical changes that occur in this foam
when exposed to different processing conditions for a variety of mold geometries has also
been examined. [12] The study demonstrated that the average density and radial density
decreases with increasing processing temperature and larger mold geometry. In addition,
the morphology of the foam is directly influenced by the processing temperature. The
density, collapse strength, and Young's modulus have been used primarily to characterize
the physical properties and rigidity of the molded PU foam in these studies. This
research has focused on correlating the physical, mechanical and chemical properties of
the foam to provide a more thorough understanding of processes that occur during
preparation, processing, and curing of the material.[13]
The effect of thermal gradients in molded PU foams has largely been ignored in the
literature. The exothermic nature of the reactions implies that internal thermal gradients
may be present in the complex foam system. In addition, the foaming reaction creates
61
thermal isolated regions within the foam causing a certain degree of thermal segregation
within molds. In previous studies of PU foams prepared using Rubinate 1680 it has been
show that increasing processing temperature causes a significant decrease in the
uretoneimine linkages in the polymer and a corresponding decrease in the density and
modulus. [11-13] However, analysis of the heterogeneity of the chemistry with respect to
the mold and position within the mold was not addressed. In the preparation of the PU
foam, the foaming reaction is exothermic expanding up and out toward the wall of the
mold. The reaction creates thermal gradients within the reaction mixture due to
differences in the rate of heat transfer at the center and the side of the molded foam. The
highest temperature should be at the center of the mold, decreasing in intensity as one
moves toward the outer surface. In addition, the mold provides a surface for thermal
convection reducing the temperature of the foam at the surface relative to the center. The
influence of these processes on the chemistry of the molded polyurethane foam is the
focus of this study.
In this study, the chemical composition (radially from side to center) of molded PU
foam at different processing temperatures is explored using FTIR/PAS spectroscopy.
Specifically, the concentration of the uretoneimine linkages, carbodiimide functional
groups, and unreacted isocyanate groups are examined as a function of processing
temperatures (25°C, 45°C, 65°C and 85°C). Quantitative analysis of the complex foam
samples is obtained by examining the emergence and depletion of chemical species in the
FTIR/PAS spectra. The resulting chemical gradients are identified and quantified with
respect to radial position of the mold. The data is used to determine how thermal and
chemical gradients influence the homogeneity and morphology of PU foam in a simple
62
cylindrical mold.
3.2 Results and Discussion
3.2.1 Photoacoustic FTIR (FTIR/PAS) Analysis of PU Foam
FTIR is a useful tool for determining the chemical composition of the complex PU
foam. The PU foam is comprised of a complex mixture of unreacted starting materials
and emerging chemical functional groups associated with the polymerization reaction.
The functional groups that exhibit IR absorption bands can be monitored provided they
can be isolated from other bands. The identification of the thermally sensitive functional
groups within the polymer matrix is also critical to the analysis of the degradation
properties of the material. FTIR/PAS is also a non-destructive measurement of pristine
samples requiring no pre-treatment or grinding of the material into a KBr pellet which
allows archival and future measurement of samples. Therefore, quantitative analysis of
chemical species of interest can be performed using the characteristic bands exhibited by
the unique functional groups within the foam provided experimental parameters are kept
constant for each measurement. The measurements can be made over extended periods
of time consistent with the normal degradation routines of the polymer [14].
This project is particularly interested in the qualitative and quantitative analysis of the
bands associated with cross-linked structures (uretoneimine, 1379 cm"1 and 1726 cm"1),
unreacted isocyanate (2320 cm"1), and emerging carbodiimide (2134 cm'1 and 2098 cm"1)
bands associated with degradation of the uretoneimine structures, Figure 3.1. The
carbodiimide and isocyanate species generated from the degradation of the uretoneimine
can be monitored and compared.
63
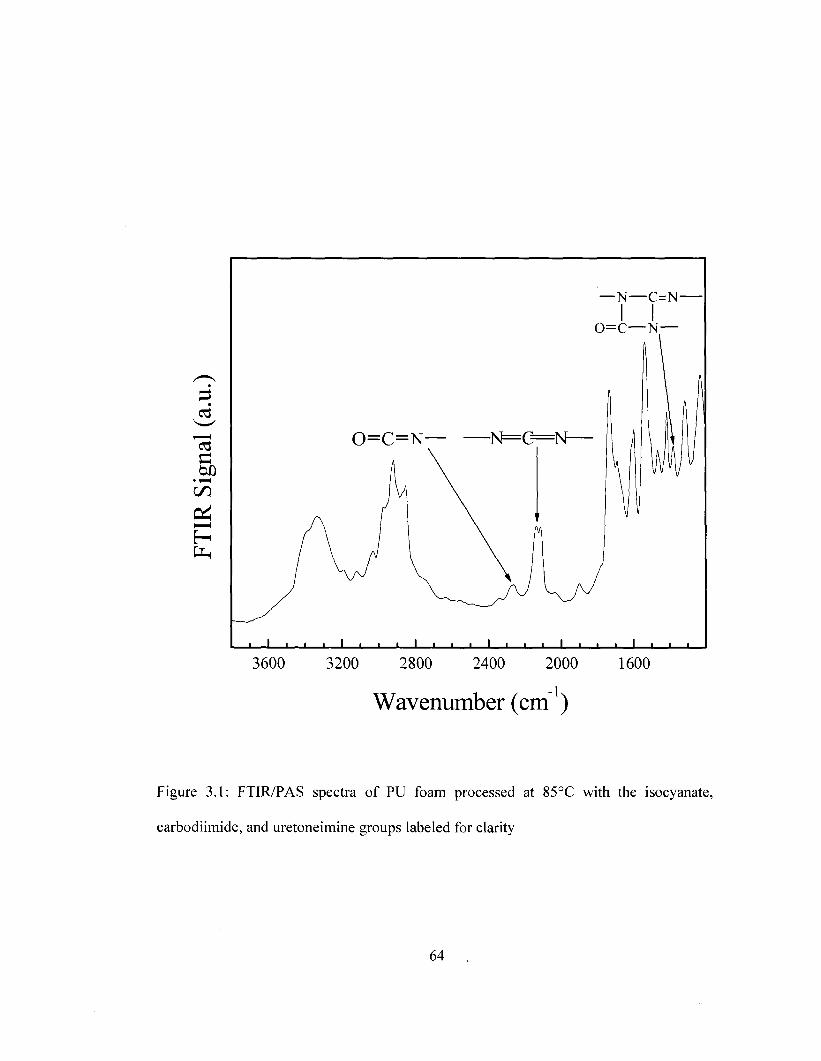
—N—C=N-I I
0 = C — N —
0=C=N— —N=G=N-
J _ _ I i i i i i__i _L J I I I I L. X _L 3600 3200 2800 2400 2000 1600
1> Wavenumber (cm")
Figure 3.1: FT1R/PAS spectra of PU foam processed at 85°C with the isocyanate,
carbodiimide, and uretoneimine groups labeled for clarity
64
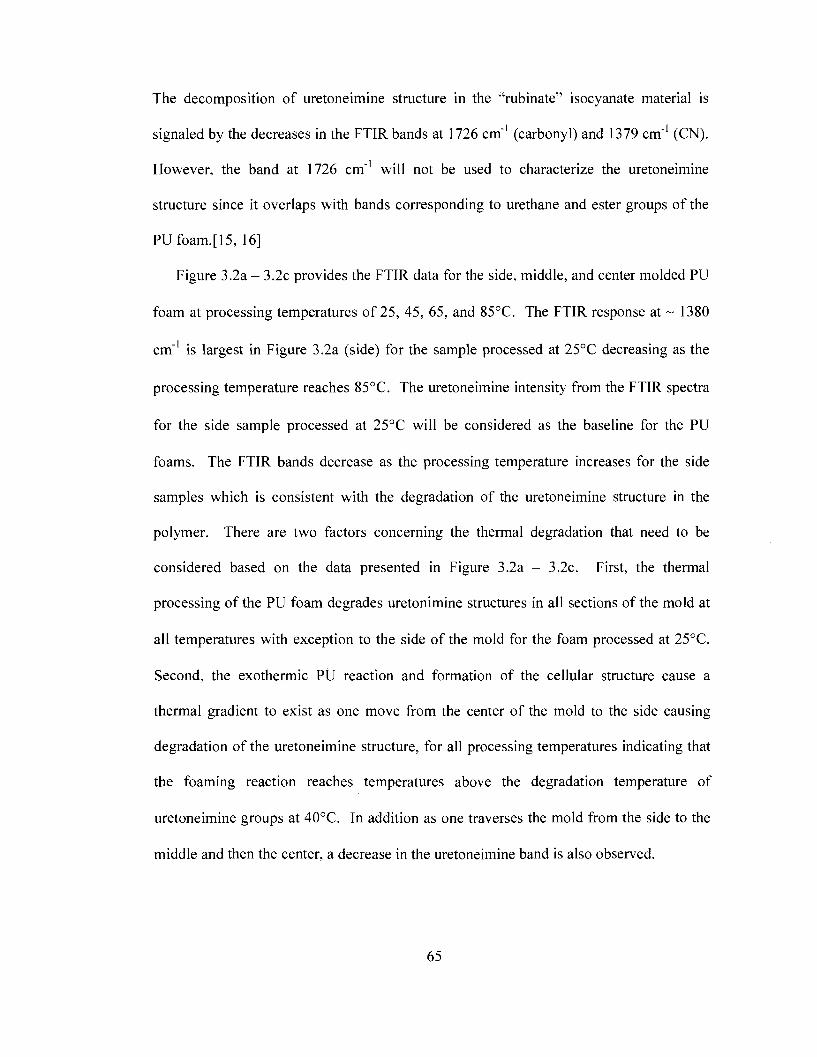
The decomposition of uretoneimine structure in the "rubinate" isocyanate material is
signaled by the decreases in the FTIR bands at 1726 cm"1 (carbonyl) and 1379 cm"1 (CN).
However, the band at 1726 cm"1 will not be used to characterize the uretoneimine
structure since it overlaps with bands corresponding to urethane and ester groups of the
PUfoam.[15, 16]
Figure 3.2a - 3.2c provides the FTIR data for the side, middle, and center molded PU
foam at processing temperatures of 25, 45, 65, and 85°C. The FTIR response at ~ 1380
cm"1 is largest in Figure 3.2a (side) for the sample processed at 25°C decreasing as the
processing temperature reaches 85°C. The uretoneimine intensity from the FTIR spectra
for the side sample processed at 25°C will be considered as the baseline for the PU
foams. The FTIR bands decrease as the processing temperature increases for the side
samples which is consistent with the degradation of the uretoneimine structure in the
polymer. There are two factors concerning the thermal degradation that need to be
considered based on the data presented in Figure 3.2a - 3.2c. First, the thermal
processing of the PU foam degrades uretonimine structures in all sections of the mold at
all temperatures with exception to the side of the mold for the foam processed at 25°C.
Second, the exothermic PU reaction and formation of the cellular structure cause a
thermal gradient to exist as one move from the center of the mold to the side causing
degradation of the uretoneimine structure, for all processing temperatures indicating that
the foaming reaction reaches temperatures above the degradation temperature of
uretoneimine groups at 40°C. In addition as one traverses the mold from the side to the
middle and then the center, a decrease in the uretoneimine band is also observed.
65
140
a.
R'—N—C=N—R'
0 = C — N — R
1390 1340 1390 1340 1390 1340
Wavenumber (cm-1)
Figure 3.2: FT1R/PAS spectra highlighting the uretoneimine structure for molded PU
foam processed at 25°C (Black), 45°C (Green), 65°C (Red), and 85°C (Blue) at the a.
side, b. middle, and, c. center of the cylindrical mold
66
Finally, the side of the mold is in part, thermally isolated from the center of the mold and
the exothermic foaming reaction causing less degradation of the uretoneimine structure
for all processing temperatures.
The FTIR spectra for the isocyanate and carbodiimide between 1900 cm"1 - 2500 cm"1
is presented in Figure 3.3a - 3.3c, for the side, middle, and center of the molded PU foam
(see experimental section) processed at temperatures of 25°C, 45°C, 65°C and 85°C. In
Figure 3.3a, the side sample processed at 25°C shows very little in the spectral signal
associated with the carbodiimide structure at 2134 cm"1 and 2098 cm"1. This supports
choosing the side sample processed at 25°C as the baseline value for the uretoneimine
structure in Figure 3.2a. In addition, the unreacted isocyanate (-2320 cm"1) for the side
sample processed at 25°C is the largest for all samples examined.
There are a few trends that can be observed for the samples with respect to the
carbodiimide and isocyanate functional groups. The carbodiimide increases in intensity
for the side, middle, and center of the mold as the processing temperature increases. In
contrast, the isocyanate band decreases for the side, middle, and center of the mold.
These results are consistent with the degradation properties associated with uretoneimine
structures in the polymer and the increases reactivity of isocyanate as processing
temperatures are increased.
3.2.2 FTIR Analysis of Functional Groups in PU Foam.
Integration of the uretonimine, carbodiimide, and isocyanate bands from a minimum
of five samples in Figure 3.4a - 3.4c provides a summary of the FTIR results.The side,
middle, and center samples are denoted by the filled squares, filled circles, and filled
triangles, respectively.
67

60
50
a.
0 = C = N -
i i i i I • i i i I i i i i I i i i i i I • i • • I • • • • I • 1 • • ' ' ' • ' • ' • • • •
2350 2200 2050 2350 2200 2050 2350 2200 2050
Wavenumber (cm1)
Figure 3.3: FTIR/PAS spectra highlighting the isocyanate and carbodiimide structures
for molded PU foam processed at 25°C (Black), 45°C (Green), 65°C (Red), and 85°C
(Blue) at the a. side, b. middle, and, c. center of the cylindrical mold
68
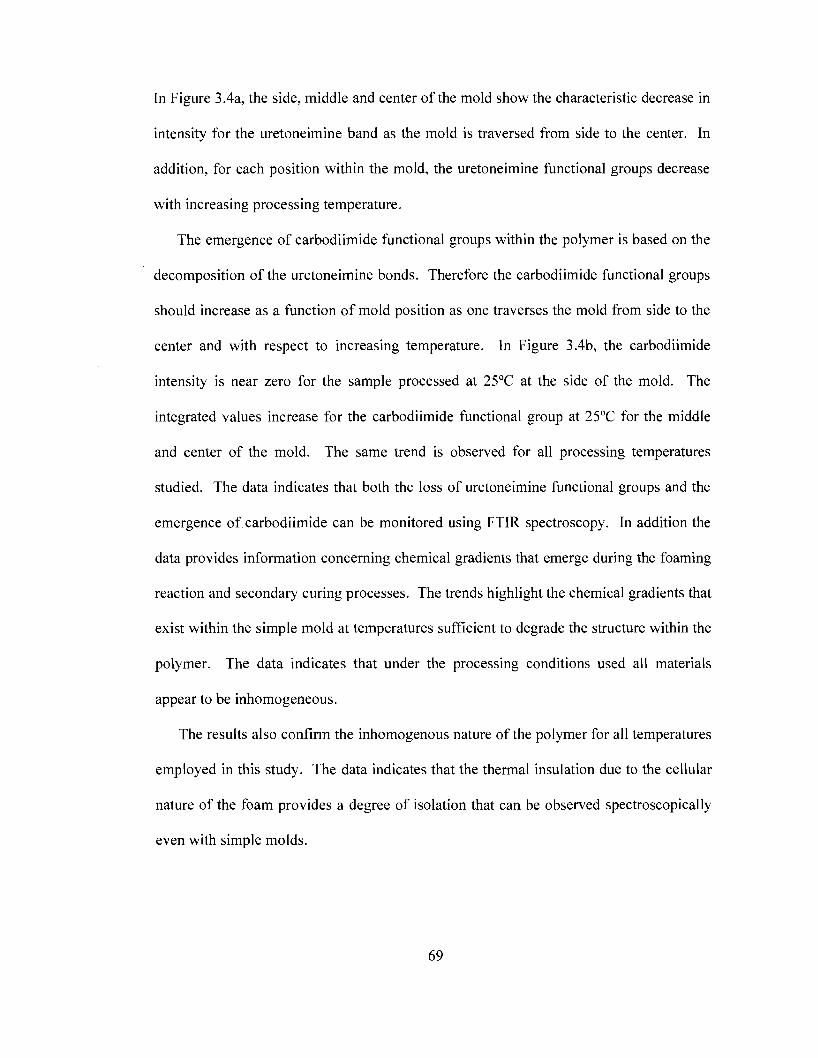
In Figure 3.4a, the side, middle and center of the mold show the characteristic decrease in
intensity for the uretoneimine band as the mold is traversed from side to the center. In
addition, for each position within the mold, the uretoneimine functional groups decrease
with increasing processing temperature.
The emergence of carbodiimide functional groups within the polymer is based on the
decomposition of the uretoneimine bonds. Therefore the carbodiimide functional groups
should increase as a function of mold position as one traverses the mold from side to the
center and with respect to increasing temperature. In Figure 3.4b, the carbodiimide
intensity is near zero for the sample processed at 25°C at the side of the mold. The
integrated values increase for the carbodiimide functional group at 25°C for the middle
and center of the mold. The same trend is observed for all processing temperatures
studied. The data indicates that both the loss of uretoneimine functional groups and the
emergence of carbodiimide can be monitored using FTIR spectroscopy. In addition the
data provides information concerning chemical gradients that emerge during the foaming
reaction and secondary curing processes. The trends highlight the chemical gradients that
exist within the simple mold at temperatures sufficient to degrade the structure within the
polymer. The data indicates that under the processing conditions used all materials
appear to be inhomogeneous.
The results also confirm the inhomogenous nature of the polymer for all temperatures
employed in this study. The data indicates that the thermal insulation due to the cellular
nature of the foam provides a degree of isolation that can be observed spectroscopically
even with simple molds.
69
1200
1100 h
a
<
N
13
1000
900
o £ 800
700
3750
3000
2250
1500
750
2600
2100
1600
1100
5 0 0 I I I I I I I I I I I I I I I I I I I I I I I M I o l i ' i i f i i i i l i i i i l n i i l i i i i i 5 0 0 '
20 40 60 80 20 40 60 80 20 40 60 80
Processing Temperature (°C)
Figure 3.4: Integrated FTIR/PAS bands for a. uretoneimine, b.carbodiimide, and c.
isocyanate groups as a function of mold position (• - side, • - middle, A - center).
Bands areas are normalized versus the area of the phenyl C=C band located at 1600 cm"
70
The center and side of the samples show the largest difference due to thermal activation
during foaming process and because heat flow is limited due to low thermal conductivity
of the cellular foam.
A secondary indication of chemical differences that exist within the foam can be
observed through the change in composition of unreacted isocyanate in Figure 3.4c. The
data indicates that the largest concentration of unreacted isocyanate exists in the foam
processed at 25°C in the side position of the mold. The concentration of unreacted
isocyanate at the middle and center of the mold decreases appreciably relative to the side
of the mold. In addition, a decrease in the isocyanate is observed for all positions as a
function of increasing processing temperature. The data indicates that a greater amount
of unreacted material is present in the foam if the processing temperatures are lower. The
composition of isocyanate at the side of the mold never reaches values comparable to
either the middle or center of the foam. The data indicates that the side of the mold is not
at thermal equilibrium with the sample. This suggests that the thermal properties of the
mold and the ability of the mold to act as a thermal conductor influence the composition
of all three of functional groups identified in this study.
3.2.3 Imaging of PU Foam
The FTIR data indicates that thermal gradients exist within the molded PU foam
regardless of the processing temperatures employed. The emergence of chemical
gradients in PU foams due to thermal gradients can also influence the morphology of the
molded PU foam. Previously studies have shown that increasing temperatures used
during thermal processing decreases the density of the foam through thermal expansion
and evolution of CO2 during the foaming process. Decreasing density can be attributed
71
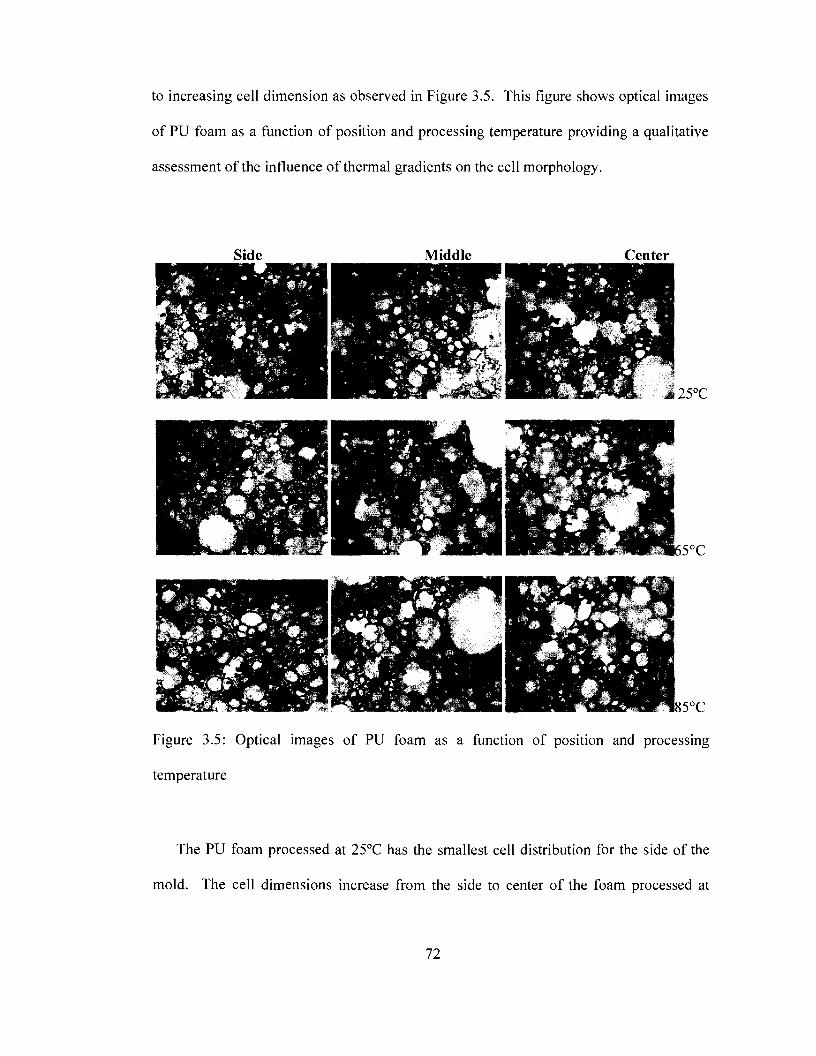
to increasing cell dimension as observed in Figure 3.5. This figure shows optical images
of PU foam as a function of position and processing temperature providing a qualitative
assessment of the influence of thermal gradients on the cell morphology.
Side Middle Center
J25°C
5°C
85°C
Figure 3.5: Optical images of PU foam as a function of position and processing
temperature
The PU foam processed at 25°C has the smallest cell distribution for the side of the
mold. The cell dimensions increase from the side to center of the foam processed at
72
25°C. Larger dimension cells are predominantly observed in the center of the mold with
a few appearing in the middle for the foam processed at 25°C. Increasing cell dimensions
are observed as one increases the processing temperature for all positions in the molded
PU foam. The same trend is observed as a function of increasing processing temperature
with the center sample processed at 65°C and 85°C showing the largest cell dimension
and distribution. The images are consistent with the decrease in cross-link structures
(uretoneimine) observed in the FTIR data and the thermal activation of the foaming
process.
3.3 References
1. Gupta, T. and Adhikari, B., Thermal degradation of HTPB-based polyurethane and polyurethane ureas. Thermochimica Acta, 2003. 402: p. 169-181.
2. Harbron, D.R., Paige, C.J., and Scarrow, R.K., Methods of minimizing density gradients in rigid polyurethane foams Journal of Cellular Plastics, 2001. 37: p. 43-57.
3. Szycher, M., Szycher's Handbook of polyurethanes. 1999, New York, NY: CRC Press.
4. Pompe, G., Pohlers, A., Potschke, P., and Pionteck, J., Influence of processing conditions on the multiphase structure of segmented polyurethanes. Polymer, 1998. 39: p. 5147-5153.
5. Grunbauer, H.J.M. and Folmer, J.C.W., Polymer morphology of C02 blown rigid polyurethane foams: its fractal nature. Journal of Applied Polymer Science, 1994. 54: p. 935-949.
6. Pielichowski, K., Kulesza, K., and Pearce, E.M., Thermal degradation studies on rigid polyurethane foams blown with pentane. Journal of Applied Polymer Science, 2003. 88: p. 2319-2330.
73
7. Seo, W.J., Jung, H.C., Hyun, J.C., Kim, W.N., Lee, Y.B., Choe, K.H., and Kim, S.B., Mechanical, morphological, and thermal properties of rigid polyurethane foams blown by distilled water. Journal of Applied Polymer Science, 2003. 90(1): p. 12-21.
8. Chattopadhyay, D.K., Sreedhar, B., and Raju, K.V.S.N., Thermal stability of chemically crosslinked moisture-cured polyurethane coatings. Journal of Applied Polymer Science, 2005. 95: p. 1509-1518.
9. Biedermann, A., Kudoke, C , Merten, A., Minogue, E., Rotermund, U., Ebert, H.P., Hienemann, U., and Fricke, J., Analysis of heat transfer mechanisms in polyurethane rigid foam. Journal of Cellular Plastics, 2001. 37: p. 467-483.
10. Prociak, A., Pielichowski, J., and Sterzynski, T., Thermal diffusivity of rigid polyurethane foams blown with different hydrocarbons. Polymer Testing, 2000. 19(6): p. 705-712.
11. Hawkins, M.C., O'Toole, B., and Jackovich, D., Cell morphology and mechanical properties of rigid polyurethane foam. Journal of Cellular Plastics, 2005. 41: p. 267-285.
12. Jackovich, D., O'Toole, B., and Hawkins, M.C., Temperature and mold size effects on physical and mechanical properties of a polyurethane foam. Journal of Cellular Plastics, 2005. 41: p. 153-168.
13.Hatchett, D.W., Kodippili, G., Kinyanjui, J.M., Benincasa, F., and Sapochak, L., FTIR analysis of thermally processed PU foam. Polymer Degredation and Stability, 2005. 87:p.555-561.
14. Bhattacharjee, D. and Engineer, R., An improved technique for the determination of isocyanurate and isocyanate conversion by photoacoustic chemistry. Journal of Cellular Plastics, 1996. 32: p. 261-273.
15. Dillon, J.G., Infrared Spectroscopic Atlas of Polyurethanes. 1989, Lancaster, PA.: Technomic Publishing Co.
16. Silverstein, R.M. and Webster, F.X., Spectrometric identification of organic compounds. 1998, New York: John Wiley & Sons.
74
CHAPTER 4
CHEMICAL AND THERMAL STABILITY OF A DIELS-ALDER EPOXY FOAM
4.1 Introduction
Polymeric foams are versatile materials that have been used for a broad range of
applications based on their chemical, physical and mechanical properties. The synthetic
conditions can be varied to provide rigid or flexible foams with variable densities and
mechanical strength. For example polyurethane (PU) foams can be prepared as rigid
impact resistance materials or flexible memory materials that can retain shape after
decompression by changing chemical substituent groups in the PU polymer chain.
Chemical cross links are often utilized to provide more rigid foams. Rigid (PU) foams
have been used to encapsulate electro-mechanical components and provide shock
isolation and impact resistance. The foam can be injected into a cavity where it expands
encapsulating the component. The PU foam adheres strongly to the component providing
shock isolation. Although PU foams have high mechanical strength required for shock
isolation, the material is extremely difficult to remove without damaging the encapsulated
component. Strong adhesion of PU foams to surfaces requires that harsh methods such as
sand blasting or chemical reactions with strong bases be used to remove the foam from
components. Damage or corrosion of sensitive electrical components can occur using
these methods. Therefore repair of components that have been previously encapsulated is
unlikely. Foam systems that can be easily removed using less harsh methods while
75
maintaining the integrity of the encapsulated components are required.
Removable epoxy foams (REFs) have been developed as a possible replacement for
traditional rigid PU foams currently used to encapsulate sensitive components. REFs
have been proposed as replacements for PU foams because they provide a simple
chemical method to remove the foam from the encapsulated components for repair,
replacement of damaged parts, or dismantlement and disposal. Reversible Diels-Alder
linkages are incorporated into the foam which can thermally degrade to facilitate
dissolution. The foam dissolves in the presence of suitable solvent under more benign
conditions than required for removing PU foams, minimizing any damage to the
encapsulated components. Moreover, REFs have similar properties when compared to
PU foams. They can easily expand to fill complicated geometric shapes with good
adhesion to provide shock isolation.
The incorporation of chemical groups that enhance the removal of the foam is an
important factor when considering the utility of the foam system. However, REFs must
have similar mechanical properties when compared to PU foams to be useful for a wide
range of applications. Previously it was demonstrated that the mechanical properties of
PU foams degrade with time and exposure to elevated temperature.[l, 2] Decreases in
Young's modulus and density of PU foams are common when exposed to elevated
temperatures and multiple thermal cycles due to chemical changes in the foam.
Therefore, REFs must have comparable thermal and mechanical stability to be used as
replacements for PU foams in encapsulation applications.
The synthesis of removable epoxy foams is achieved through the incorporation of
Diels-Alder bonds in the structure. The simplest Diels-Alder reaction between furan and
76

maleimide is shown in reaction scheme 4.1. A higher yield of the exo species is obtained
relative to the endo species during the reaction. The formation of the Diels-Alder species
is favored below 60 °C. The reverse reaction becomes more prominent as the temperature
is increased above 90 °C, resulting in thermal degradation of the Diels-Alder bonds.
Removable resins and foams based on reversible Diels-Alder chemistry have been
prepared and utilized for a variety of applications including adhesives and potting of
electronic components.[3-6] The epoxy resins incorporate Diels-Alder chemistry directly
into the REFs structure. The reversibility of the Diels-Alder bonds has not been
extensively studied for REFs. More importantly, questions remain with respect to the
influence of thermal exposure on the overall chemical and mechanical stability of REFs.
R O J( 60°C O O O
X) + QN-R' 90oC 4 2 < N ' R ' + T^X° ° J R'
Furan Maleimide Exo product Endo product
Scheme 4.1: The general Diels-Alder reaction between Furan and Maleimide
The role of other reactions within the epoxy based foams is also extremely important.
These reactions within the epoxy resin based foams can also be influenced by thermal
exposure changing both the chemistry and structure of the foam. For example, the
formation of chemical cross links within the foam occurs when epoxy resins are reacted
with diamines or polyamines. The process is commonly referred to as amine curing.
Curing results in a highly crosslinked solid with superior adhesion and mechanical
77
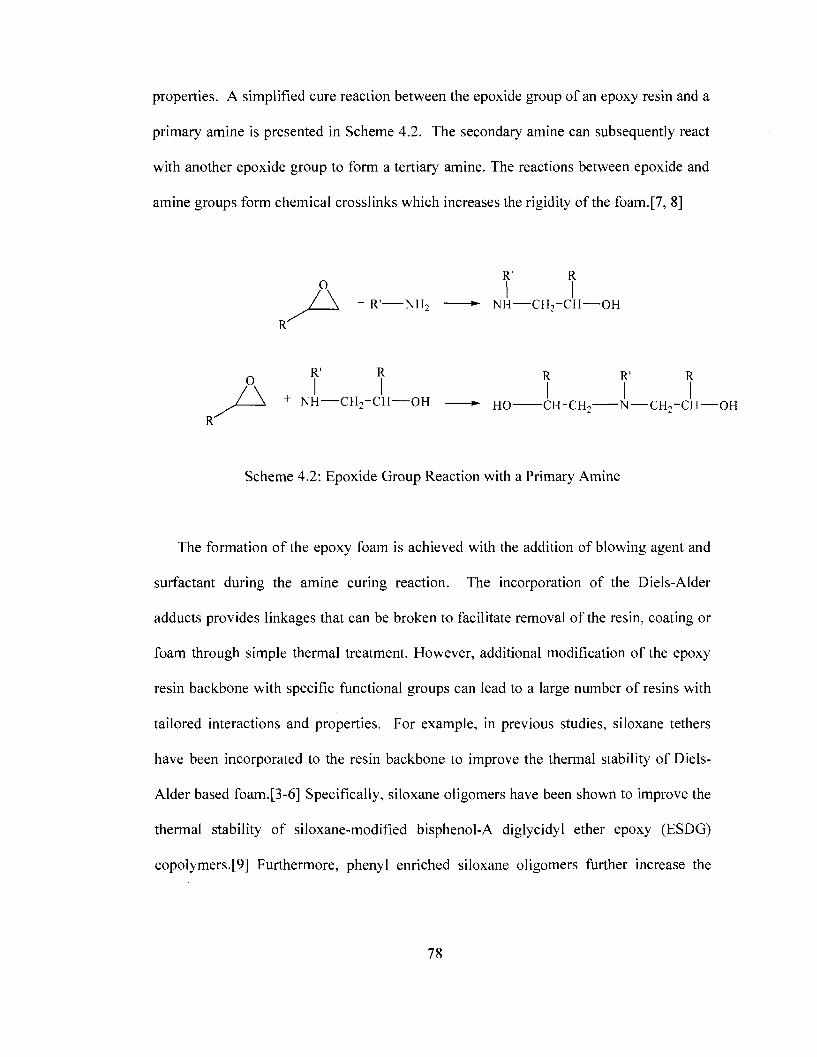
properties. A simplified cure reaction between the epoxide group of an epoxy resin and a
primary amine is presented in Scheme 4.2. The secondary amine can subsequently react
with another epoxide group to form a tertiary amine. The reactions between epoxide and
amine groups form chemical crosslinks which increases the rigidity of the foam. [7, 8]
O R' R I I
-NH2 *- NH—CH 2 -CH—OH R'
o R' R R R' R
, / _ A + NH CH2-CH—OH ^ H O CH"CH2 N—CH 2~CH—OH R"
Scheme 4.2: Epoxide Group Reaction with a Primary Amine
The formation of the epoxy foam is achieved with the addition of blowing agent and
surfactant during the amine curing reaction. The incorporation of the Diels-Alder
adducts provides linkages that can be broken to facilitate removal of the resin, coating or
foam through simple thermal treatment. However, additional modification of the epoxy
resin backbone with specific functional groups can lead to a large number of resins with
tailored interactions and properties. For example, in previous studies, siloxane tethers
have been incorporated to the resin backbone to improve the thermal stability of Diels-
Alder based foam.[3-6] Specifically, siloxane oligomers have been shown to improve the
thermal stability of siloxane-modified bisphenol-A diglycidyl ether epoxy (ESDG)
copolymers.[9] Furthermore, phenyl enriched siloxane oligomers further increase the
78

degradation temperature of the bisphenol-A diglycidyl ether (DGEBA) resin over
dimethyl siloxane oligomers.
Although the synthetic process for preparing Diels-Alder based removable epoxy
resins and foams is well documented, the characterization of the chemical and
mechanical properties of REFs under thermal conditions that should encompass the
degradation of the Diels-Alder adduct has not been extensively studied. In addition, the
repeated thermal cycling of REFs and the chemical reversibility of Diels-Alder adduct
formation/decomposition has not been addressed in terms of the materials stability. A
search of the literature provide a single high temperature investigation of a heat transfer
model to study the effect of heat fluxes on Diels-Alder REFs from room temperature to
about 900°C.[10] However, there is limited experimental data to accompany this study.
In addition, the theoretical studies do not explore the influence of thermal cycling on the
chemical and mechanical properties of the materials.
The present study focuses on Diels-Alder REFs synthesized from a mixture of epoxy
(ft)
resins that include a commercial epoxy resin, Epon 8121, and two removable Diels-
Alder epoxy resins. The first removable epoxy resins was prepared through the reaction
of octamethyltetrasiloxane with di-4,1-phenoxy-bismaleimide. This species was then
reacted with two furfuryl glycidyl ether units. This product is referred to as Removable
Epoxy Resin 1 or, RER1. The second epoxy resin, RER2, was prepared using the same
procedure used to prepare RER1, substituting 1,3-phenoxy dimaleimide for di-4,1-
phenoxy-bismaleimide octamethyltetrasiloxane. The second step in the preparation of
RER1 and RER2 is presented in Scheme 4.3a and 4.3b respectively. Scheme 4.3c
represents the structure of bisphenol-A diglycidyl ether which is the active constituent of
79
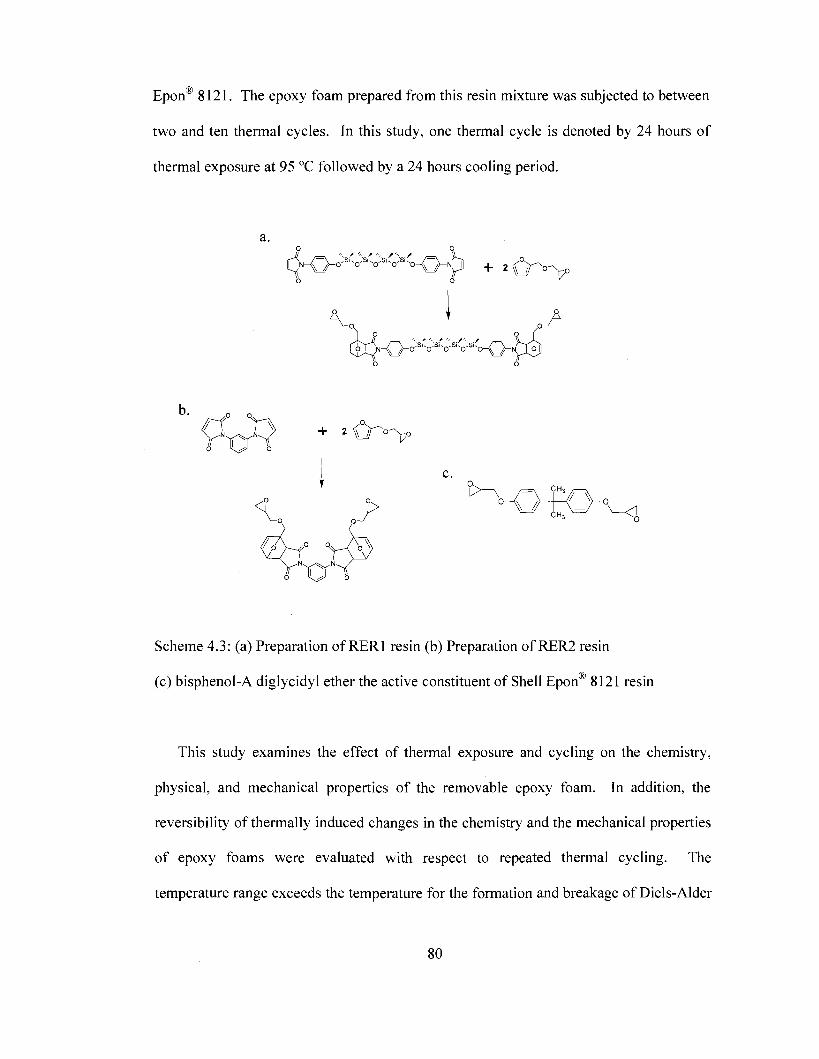
Epon 8121. The epoxy foam prepared from this resin mixture was subjected to between
two and ten thermal cycles. In this study, one thermal cycle is denoted by 24 hours of
thermal exposure at 95 °C followed by a 24 hours cooling period.
a. o o
b o ' /
jXK^^-^^^KKri
o K-i? o 2 \ r °-
C
•"V
o
Scheme 4.3: (a) Preparation of RER1 resin (b) Preparation of RER2 resin
(c) bisphenol-A diglycidyl ether the active constituent of Shell Epon 8121 resin
This study examines the effect of thermal exposure and cycling on the chemistry,
physical, and mechanical properties of the removable epoxy foam. In addition, the
reversibility of thermally induced changes in the chemistry and the mechanical properties
of epoxy foams were evaluated with respect to repeated thermal cycling. The
temperature range exceeds the temperature for the formation and breakage of Diels-Alder
80
bonds and the inter-chain physical interactions between functional groups in the
polymeric resin chains such as hydrogen bonding and polar interactions. The physical
interactions and packing of the siloxane groups in the RER1 adduct can be influenced at
temperatures well below the degradation of the Diels-Alder bonds. In addition, siloxane
groups are known to exhibit high chemical stability well above the temperatures used in
this study.[9, 11, 12] The influence of thermal exposure on the chemical, physical and
mechanical properties of removable epoxy foams was examined using Fourier transform
infrared (FT1R) microsampling analysis and thermal mechanical analysis (TMA). In
addition, the density and Young's modulus were examined as an indication of thermal
expansion and changes in the mechanical properties of the thermally cycled REFs.
4.2 Results and Discussion
4.2.1 FTIR Analysis
Analysis of the chemical properties of complex foam systems requires an
understanding of the FTIR characteristics of the individual components used in the
preparation. This is particularly important in the fingerprint region (1000 - 2000 cm"1),
which contains multiple bands that can be used to identify constituent functional groups.
This region can also be used to monitor changes in chemical composition and structure of
the epoxy foam during thermal exposure, provided the functional groups can be
identified. The FTIR spectra of the foam building blocks, furfuryl alcohol, furfuryl
glycidyl ether, di-4,l-phenoxy-bismaleimide octamethyltetrasiloxane, and the RER1
resin (di-4,l-phenoxy-bismaleimide octamethyltetrasiloxane reacted with furfuryl
glycidyl ether) and epoxy foam are presented in Figure 4.1a - 4.1e, respectively.
81
Furfuryl alcohol is included in the study because it was present in the RER1 resin. For
clarity, Figure 4.2 and Figure 4.3 provide a more detailed plot of the IR bands for spectral
ranges between 800-1350 cm"1 and 1350-1900 cm"', respectively. Previous studies have
identified characteristic bands associated with epoxy foams using FT1R spectroscopy.
[13] In this study, the IR bands associated with the adduct, including ether groups,
siloxane chain extenders, C-N, and C-0 functional groups have been identified. The
band assignments for the foam are provided in Table 4.1. Many of the characteristic
species are observed as overlapping bands in the fingerprint region encompassing C-O-C
ether modes between 1000 - 1300 cm"1, Si-O-Si and CH3-Si-0 modes between 1000 -
1275 cm"1, C-N-C modes around 1390 cm"1 and C=0 modes between 1650 and 1750.[14,
15]
It is impossible to evaluate the individual contribution of each functional group
independently due to the high degree of overlap between the bands. However, the band
at 1255 cm"1 in Figure 4.1c for di-4,l-phenoxy-bismaleimide octamethyltetrasiloxane is
not present in either the alcohol or furfuryl glycidal ether spectra. The absence of C-O-C
bands in this structure precludes assignment of this band to the ether functional group.
Rather, the band is the result of the repeating CH3-Si-0 functional group typically
observed at medium to high intensity between 1200 - 1270 cm"1. This band appears in
both the RER1 and foam with similar intensities. This band is examined for the foam to
determine if the siloxane extenders are influenced by thermal processing. The strong
carbonyl band located at 1710 cm"1 can be attributed to the bismaleimide functional
group. This band can be observed at 1714 cm"1 for the RER1 resin, with the emergence
of a second carbonyl band at 1774 cm"1.[15, 16]
82
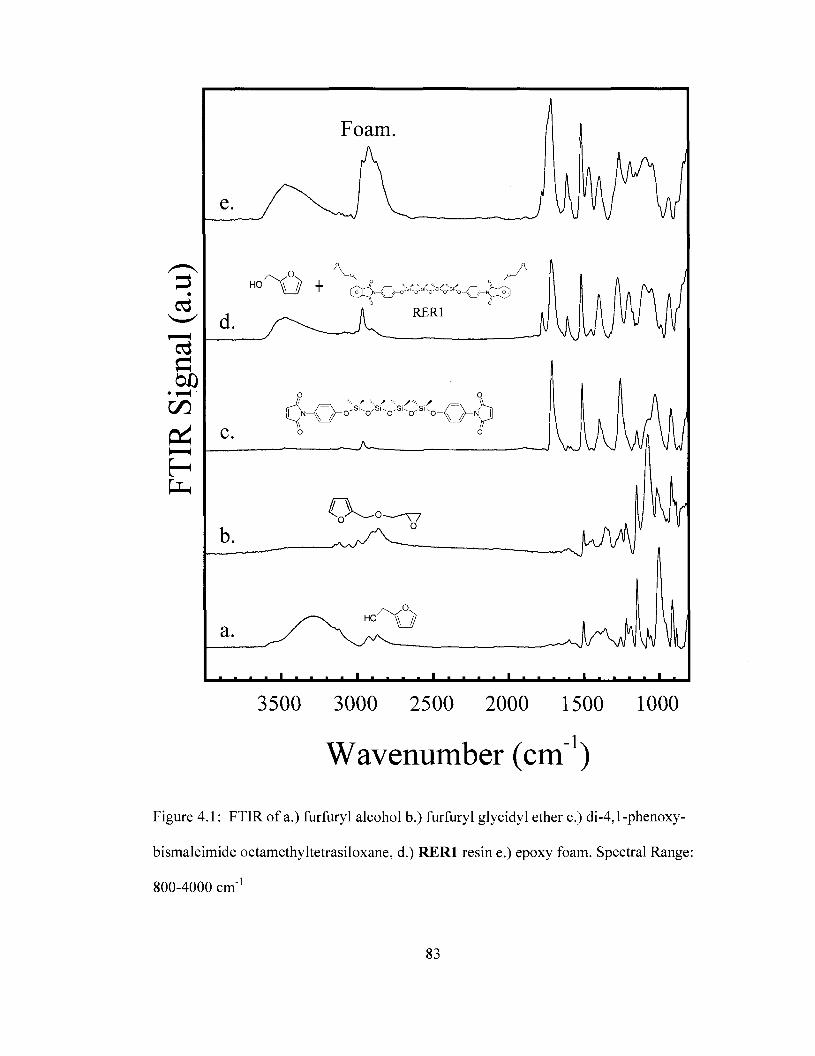
Foam.
e.
4 c.
'--. / '-•• / ''-. . / ' • • • '
\ /^0' S KO' S'^0' S'^0' S K0-<^ h— N.
a. _ J I A A N
3500 3000 2500 2000 1500 1000
Wavenumber (cm")
Figure 4.1: FTIR of a.) furfuryl alcohol b.) furfuryl glycidyl ether c.) di-4,l-phenoxy-
bismaleimide octamethyltetrasiloxane, d.) RER1 resin e.) epoxy foam. Spectral Range:
800-4000 cm'
83

J I I I I I I I I I I I I I I I I l _ l I I I I I I L
1300 1200 1100 1000 900
Wavenumber (cm")
Figure 4.2: FTIR of a.) furfuryl alcohol b.) furfuryl glycidyl ether c.) di-4,l-phenoxy-
bismaleimide octamethyltetrasiloxane, d.) RER1 resin e.) epoxy foam. Spectral Range:
800-1340 cm"1
84
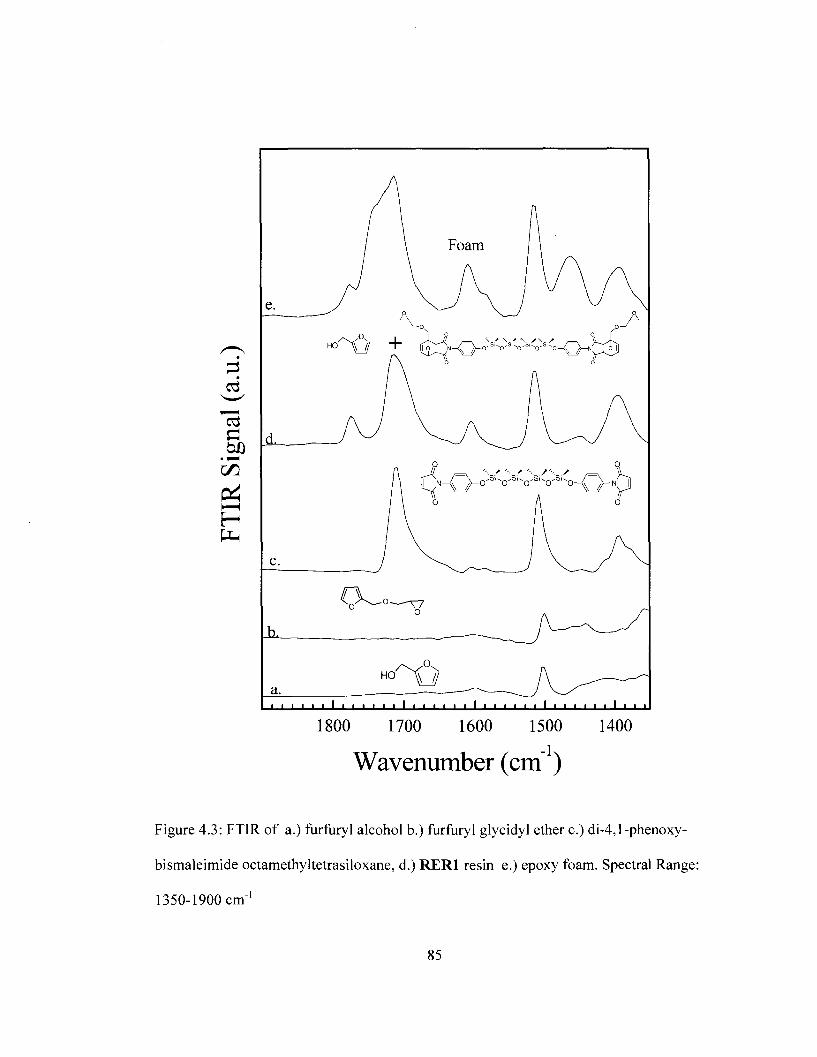
I * I I I I I I
1800 1700 1600 1500 1400
Wavenumber (cm")
Figure 4.3: FTIR of a.) furfuryl alcohol b.) furfuryl glycidyl ether c.) di-4,1 -phenoxy-
bismaleimide octamethyltetrasiloxane, d.) RER1 resin e.) epoxy foam. Spectral Range:
1350-1900 cm"1
85
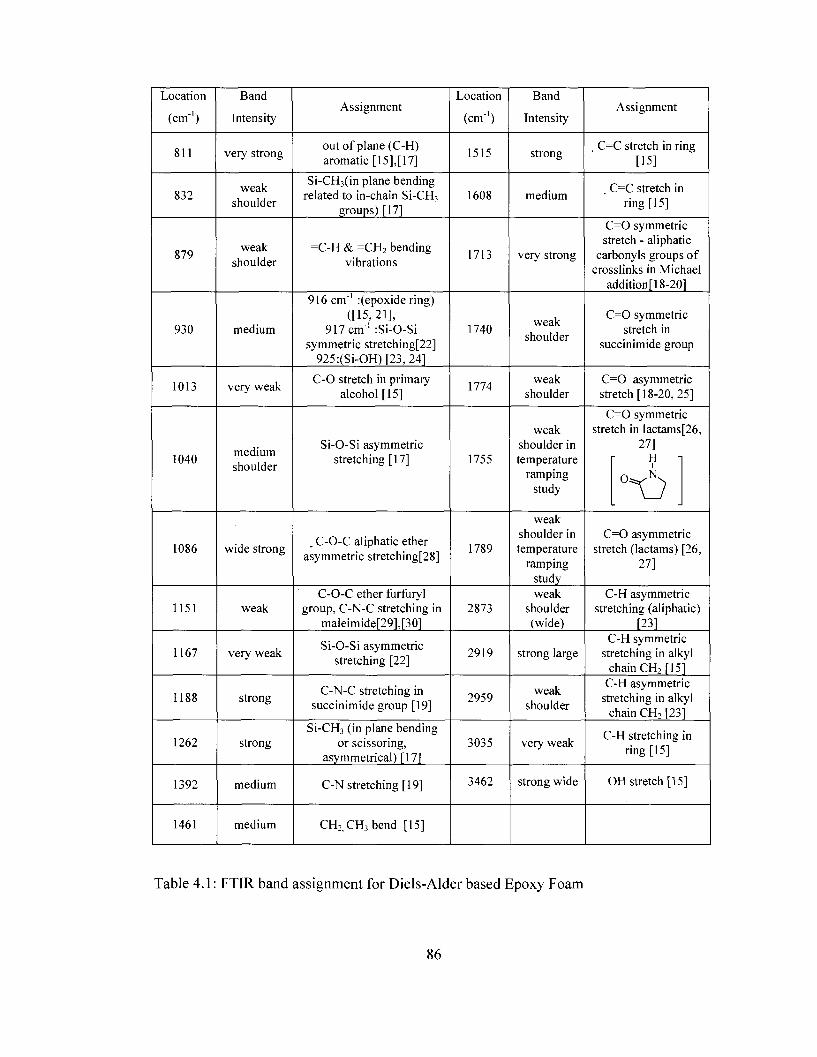
Location
(cm"1)
811
832
879
930
1013
1040
1086
1151
1167
1188
1262
1392
1461
Band
Intensity
very strong
weak shoulder
weak shoulder
medium
very weak
medium shoulder
wide strong
weak
very weak
strong
strong
medium
medium
Assignment
out of plane (C-H) aromatic [15],[17]
Si-CH3(in plane bending related to in-chain Si-CH3
groups) [17]
=C-H & =CH2 bending vibrations
916 cm"1 :(epoxide ring) ([15,21],
917 cm"1 :Si-0-Si symmetric stretching[22]
925:(Si-OH)[23,241
C-0 stretch in primary alcohol [15]
Si-O-Si asymmetric stretching [17]
. C-O-C aliphatic ether asymmetric stretching[28]
C-O-C ether furfuryl group, C-N-C stretching in
maleimide[29],[30]
Si-O-Si asymmetric stretching [22]
C-N-C stretching in succinimide group [19]
Si-CH3 (in plane bending or scissoring,
asymmetrical) [17]
C-N stretching [19]
CH2CH3bend [15]
Location
(cm"1)
1515
1608
1713
1740
1774
1755
1789
2873
2919
2959
3035
3462
Band
Intensity
strong
medium
very strong
weak shoulder
weak shoulder
weak shoulder in temperature
ramping study
weak shoulder in temperature
ramping study weak
shoulder (wide)
strong large
weak shoulder
very weak
strong wide
Assignment
C=C stretch in ring [15]
C=C stretch in ring [15]
C=0 symmetric stretch - aliphatic
carbonyls groups of crosslinks in Michael
addition[l 8-201
C=0 symmetric stretch in
succinimide group
C=0 asymmetric stretch [18-20, 25]
C=0 symmetric stretch in lactams[26,
27]
C=0 asymmetric stretch (lactams) [26,
27]
C-H asymmetric stretching (aliphatic)
T23] C-H symmetric
stretching in alkyl chain CH2 [151
C-H asymmetric stretching in alkyl
chain CH2 [231
C-H stretching in ring [15]
OH stretch [15]
Table 4.1: FTIR band assignment for Diels-Alder based Epoxy Foam
86
The emergence of the latter band in the RER1 spectrum is characteristic of the formation
of the succinimide groups for Diels-Alder adducts of maleimides.[20, 28] Both carbonyl
bands are also present in the foam spectrum at 1713 cm"1 and 1775 cm" indicating the
Diels-Alder adduct remains intact within the foam network prior to thermal treatment.
When the foam is subjected to thermal treatment it is possible to break the Diels-
Alder bonds in the RER1 and RER2 resins. Thermal degradation of the Diels-Alder
bonds typically occurs above 90 °C. The structure of the adduct is particularly useful for
evaluating the FTIR bands that should be influenced by the loss of the furfuryl glycidyl
ether from the di-4,l-phenoxy-bismaleimide octamethyltetrasiloxane and 1,3-phenoxy
dimaleimide as shown in Scheme 4.4.
Thermal processing of the foam can influence the structure and physical properties of
the epoxy foam. First, the degradation of the Diels-Alder adduct can decrease the rigidity
of the foam, increasing thermal expansion. Molecular interactions of the siloxane groups
can be disrupted during the expansion of the foam. Therefore, both chemical and
structural changes in the epoxy foam can be observed during thermal cycling. The
physical and chemical changes appear as changes in the FTIR signature of the foam. The
structural and chemical changes in the foam were monitored using in-situ FTIR at
elevated temperatures. The FTIR bands associated with the Diels-Alder and siloxane
functional groups were monitored as a function of increasing and decreasing exposure
temperatures in Figure 4.4. The FTIR spectrum of the untreated epoxy foam at room
temperature (25 °C) is presented in Figure 4.4a. The FTIR difference spectra are
provided for increasing temperatures 40, 80, and 120 °C in Figure 4.4b. The reversibility
of the thermal exposure is evaluated as the temperature is decreased with FTIR
87
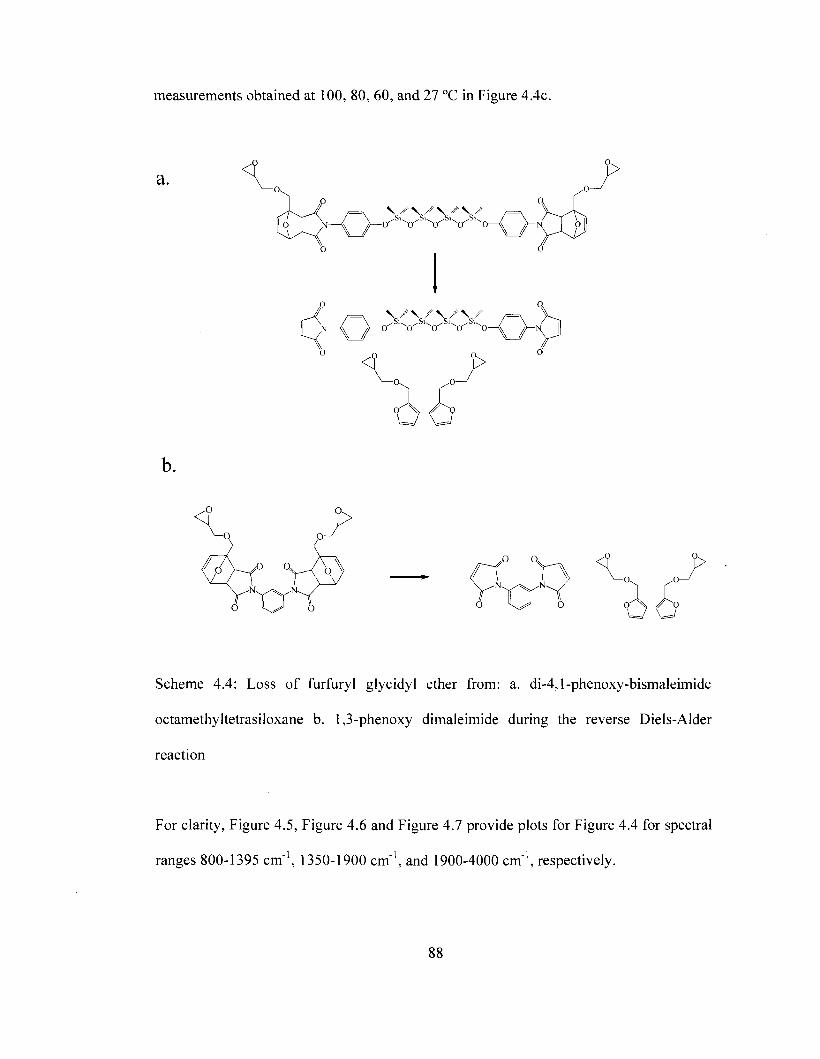
measurements obtained at 100, 80, 60, and 27 °C in Figure 4.4c.
a. ^SL ^Su ^SL ^ S K
^ O v 0
\ / A . / \ / A ./ -Si^ ^Su ^Su ^Su
-o o o o o
A AQ
p
oA A»
Scheme 4.4: Loss of furfuryl glycidyl ether from: a. di-4,l-phenoxy-bismaleimide
octamethyltetrasiloxane b. 1,3-phenoxy dimaleimide during the reverse Diels-Alder
reaction
For clarity, Figure 4.5, Figure 4.6 and Figure 4.7 provide plots for Figure 4.4 for spectral
ranges 800-1395 cm"1, 1350-1900 cm"1, and 1900-4000 cm"1, respectively.
88
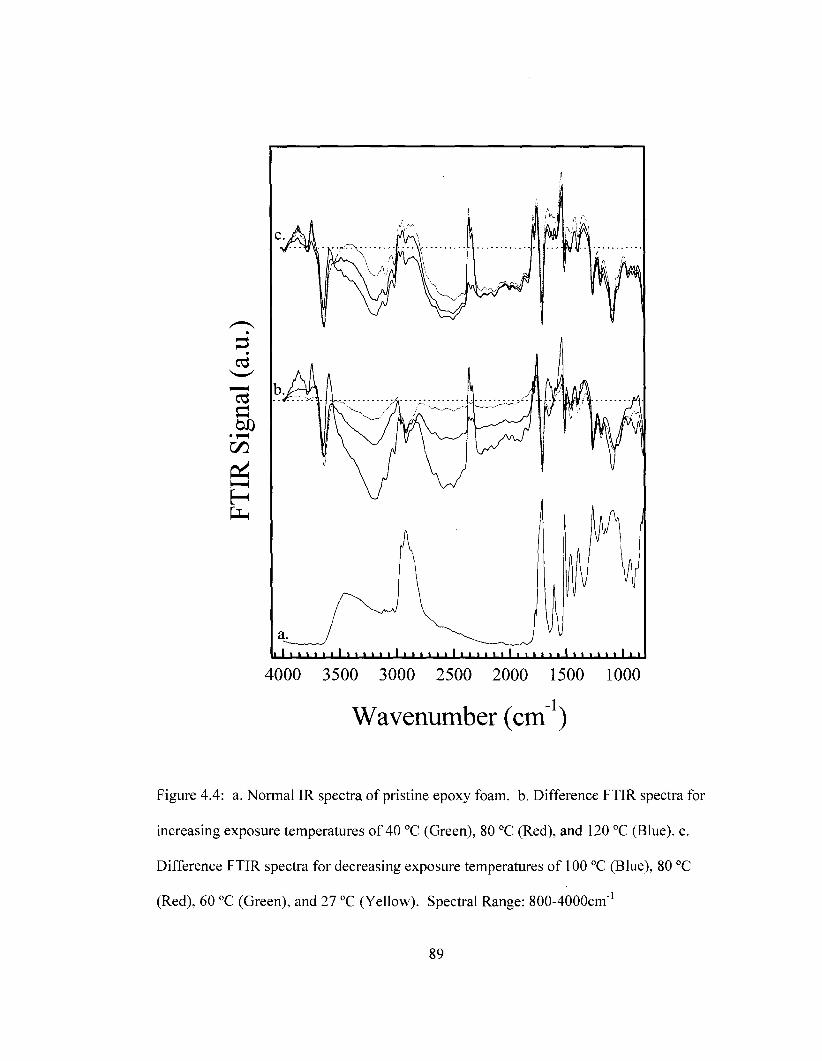
" * I • • I I I • I I • I I I • I I I I I I I I I I I I I I I I l l
4000 3500 3000 2500 2000 1500 1000
Wavenumber (cm")
Figure 4.4: a. Normal IR spectra of pristine epoxy foam. b. Difference FTIR spectra for
increasing exposure temperatures of 40 °C (Green), 80 °C (Red), and 120 °C (Blue), c.
Difference FTIR spectra for decreasing exposure temperatures of 100 °C (Blue), 80 °C
(Red), 60 °C (Green), and 27 °C (Yellow). Spectral Range: 800-4000cm_1
89
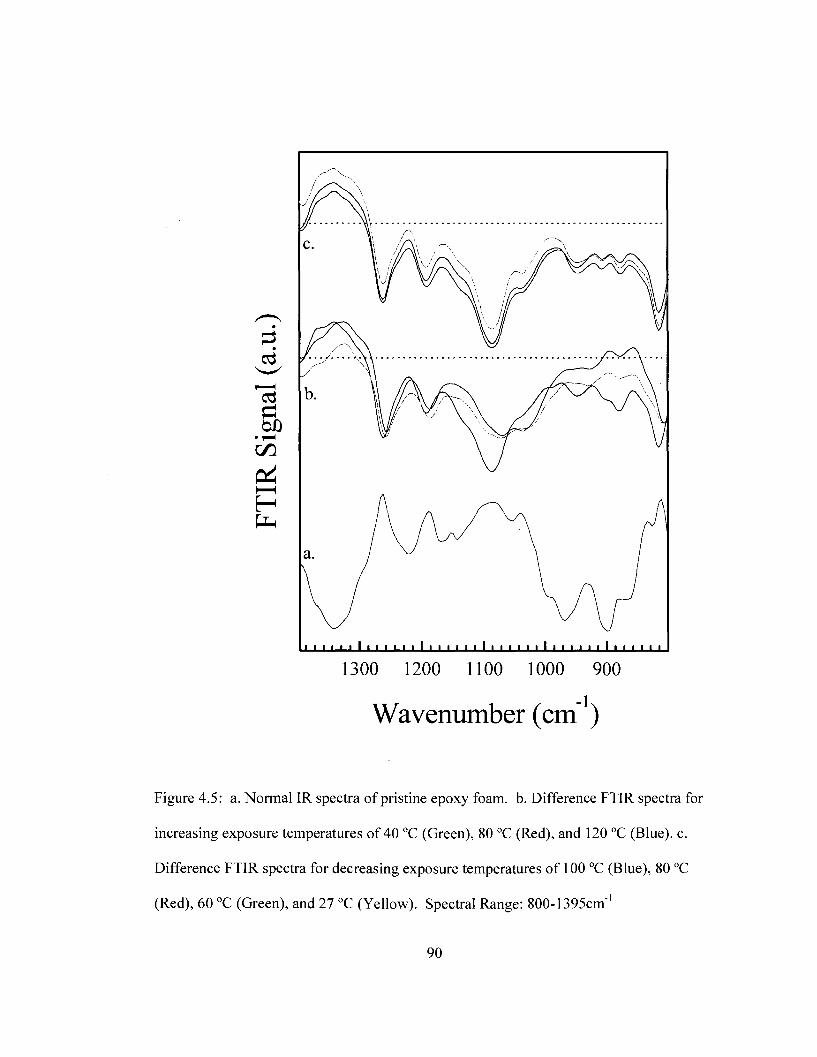
• I I I * ' I I I I I I I
1300 1200 1100 1000 900
Wavenumber (cm")
Figure 4.5: a. Normal IR spectra of pristine epoxy foam. b. Difference FTIR spectra for
increasing exposure temperatures of 40 °C (Green), 80 °C (Red), and 120 °C (Blue), c.
Difference FTIR spectra for decreasing exposure temperatures of 100 °C (Blue), 80 °C
(Red), 60 °C (Green), and 27 °C (Yellow). Spectral Range: 800-1395cm"1
90
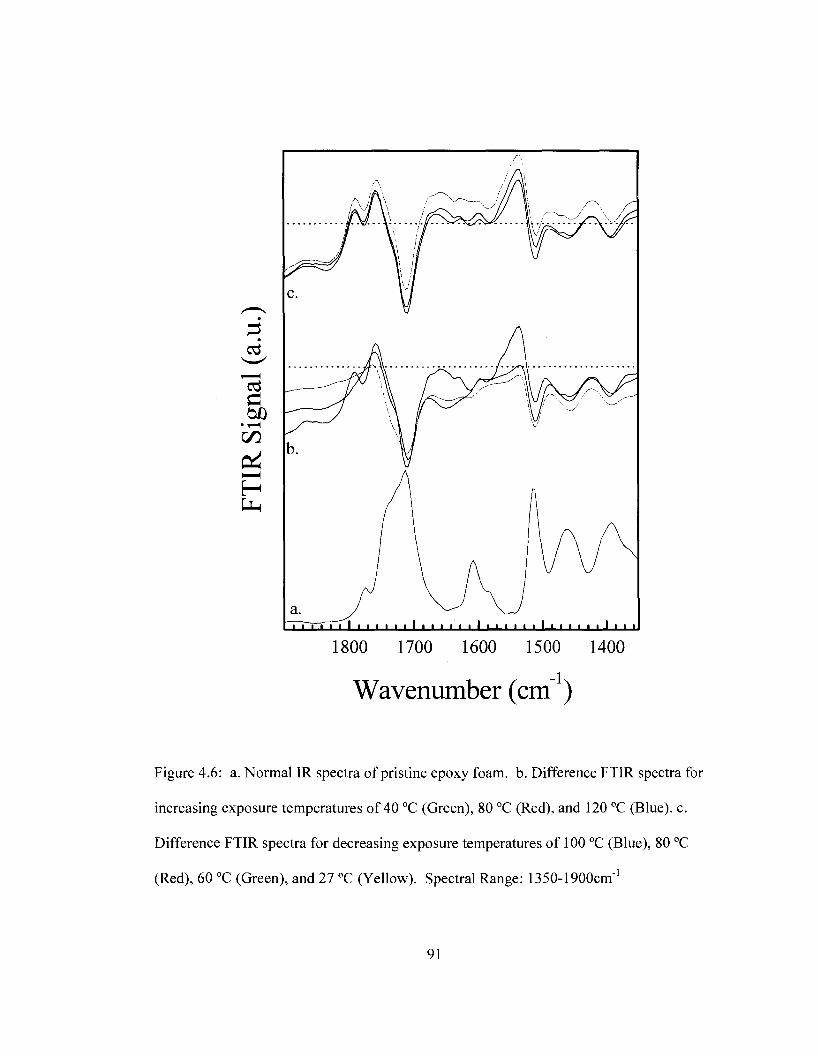
1800 1700 1600 1500 1400
Wavenumber (cm")
Figure 4.6: a. Normal IR spectra of pristine epoxy foam. b. Difference FTIR spectra for
increasing exposure temperatures of 40 °C (Green), 80 °C (Red), and 120 °C (Blue), c.
Difference FTIR spectra for decreasing exposure temperatures of 100 °C (Blue), 80 °C
(Red), 60 °C (Green), and 27 °C (Yellow). Spectral Range: 1350-1900cm"1
91
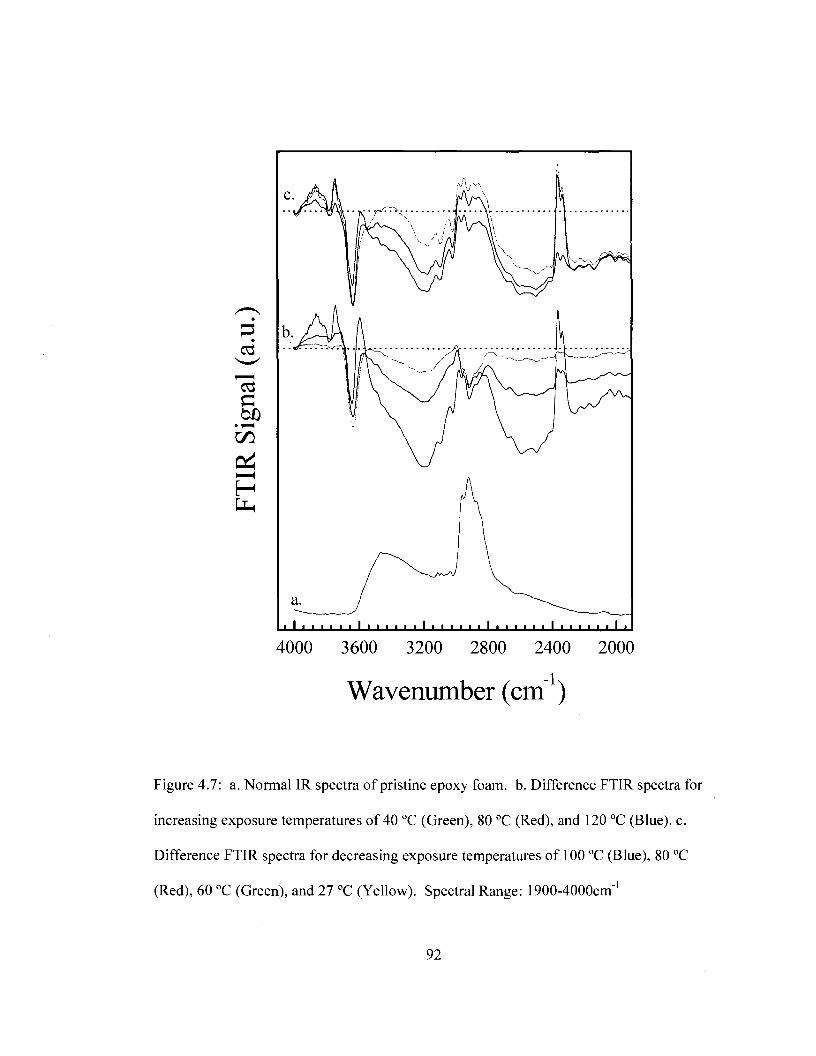
• * * * I I I I I I I I I I I 1 I I I I I
4000 3600 3200 2800 2400 2000
Wavenumber (cm")
Figure 4.7: a. Normal IR spectra of pristine epoxy foam. b. Difference FTIR spectra for
increasing exposure temperatures of 40 °C (Green), 80 °C (Red), and 120 °C (Blue), c.
Difference FTIR spectra for decreasing exposure temperatures of 100 °C (Blue), 80 °C
(Red), 60 °C (Green), and 27 °C (Yellow). Spectral Range: 1900-4000cm"1
92
The difference FTIR spectra were obtained at temperatures encompassing the Diels-Alder
bond formation and breakage. FTIR bands that show negative absorbance are indicative
of a decrease in the concentration of chemical functional groups, or disruption of
resonance of a given functional group due to structural changes. Positive absorbance
bands appear due to increasing concentration and shifts in energy associated with
chemical species during thermal changes in structure and chemistry of the system.
The trend observed for the difference spectra in Figure 4.4b is consistent with the
decomposition of the Diels-Alder structures as well as changes in the siloxane functional
group interactions. Specifically a wholesale decrease in band intensity is observed from
800 to 1450 cm"1. This region encompasses the ether C-O-C, Si-O-Si, CH3-Si-0 (1259
cm"1), and C-N-C (1390 cm"1) modes. In addition, a decrease in the intensity of the C=C
aromatic band at 1503 cm"1 is observed with a corresponding emergence of a new band at
higher energy (1535 cm"1). A similar trend is observed for C=0 bands with decreases in
intensity at 1710 cm" and an increase in the band intensity at 1755 cm"1. The changes in
the chemistry and structure of the epoxy foam are consistent with the loss of the furfuryl
glycidyl ether and changing electron density within the two adjacent ring structures. The
difference spectra for the decreasing temperatures show that the changes in the foam
structure and chemistry are not reversible. None of the bands return to their pre thermal
exposure intensities. It is expected that the permanent loss of Diels-Alder structures and
the corresponding expansion of the foam will lower both the modulus and density of the
foam. More importantly the first changes in the foam chemistry and structure were
documented at 40 °C, a temperature -50 °C lower than the thermal decomposition of the
93
Diels-Alder bonds. This implies that structural changes are significant at temperatures
that are far below the degradation threshold of the Diels-Alder bonds.
4.2.2 Thermal Mechanical Analysis (TMA)
TMA is useful for examining thermal expansion of foams. Any change in the axial
dimension of the foam is measured as function of temperature. Contraction or expansion,
designated as dL, is recorded as a percentage of the original length of the sample, Lo and
plotted as a function of temperature for 0, 1, 5 and 10 thermal cycles in Figure 4.8.
Pristine foam (0 thermal cycles) exhibits an expansion of -17 % at an onset temperature
of 97 °C followed by contraction at 105 °C. A much smaller, secondary expansion of the
foam occurs at ~ 120 °C. Densification of the foam is not observed for this sample under
the temperature range studied. In contrast, samples subjected to thermal cycles show no
additional expansion with densification observed above an applied temperature of-110
°C. The results suggest that the thermal expansion is immediate and occurs during the
first thermal cycle. The foams exposed to more than one thermal cycle have undergone
the bulk of the expansion prior to TMA measurements. The expansion of the pristine
foam occurs after the temperature associated with the degradation of the Diels-Alder
bonds has been exceeded.
Degradation of chemical bonds and changing intermolecular chain interactions within
the foam matrix directly influence the expansion of the foam. These results are
consistent with the changing chemistry and functional group interactions that were in the
FTIR difference spectra shown in Figure 4.7. The glass transition temperature (Tg) can
also be estimated from the TMA results for the foam that has been thermally cycled.
94
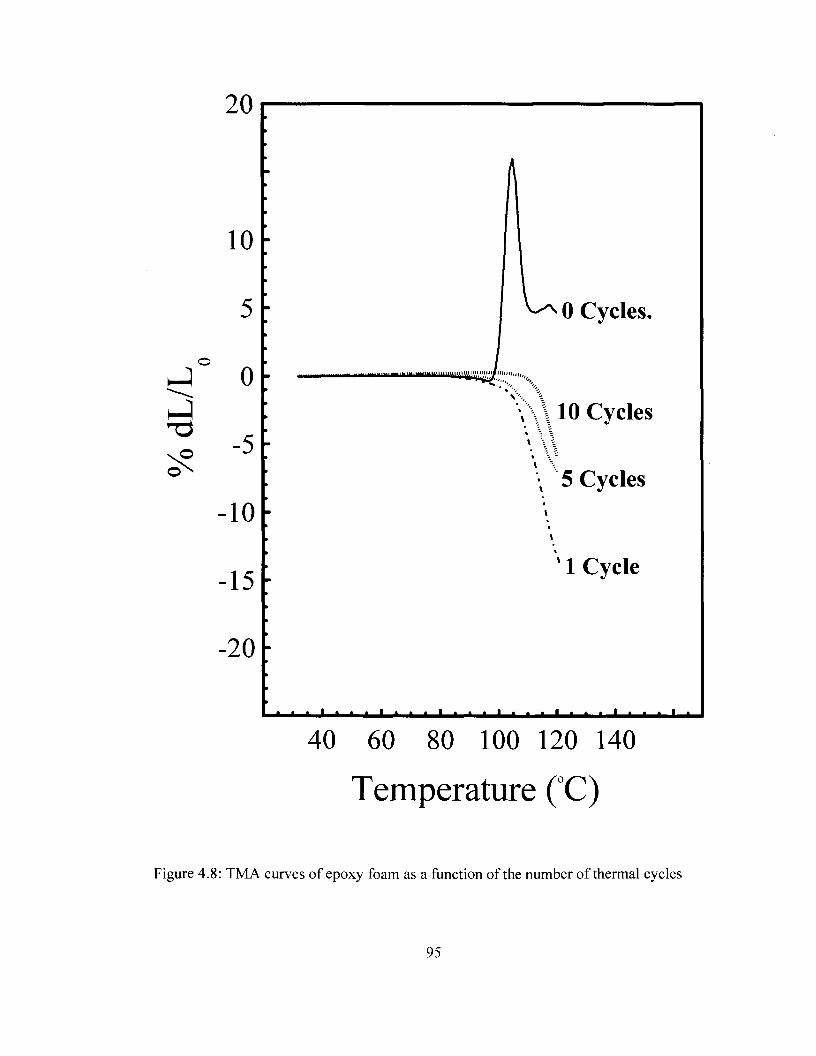
20
10
0
-5
-10
-15
-20
0 Cycles.
V\\ 10 Cycles
\ 5 Cycles
s 1 Cycle
• • • •
40 60 80 100 120 140
Temperature (°C)
Figure 4.8: TMA curves of epoxy foam as a function of the number of thermal cycles
95
The inflection point for the contraction of the foam has previously been assigned to the
glass transition temperature (Tg) epoxy polymer chains.[9, 31, 32] The large expansion
observed for the pristine foam precludes the identification of the Tgfor this sample. From
the inflection point, the Tg for foam samples exposed to 1, 5, and 10 thermal cycles was
determined to be 109.1 °C, 114.6 °C and 117.1 °C, respectively. The increase in the Tg
values may be indicative of increased cross links between the epoxide group and the
diamine curative (Scheme 4.2) as thermal cycling proceeds.[7, 31-33] The values are in
agreement with Tg values reported previously for other epoxy resins. For example, the Tg
for both the bisphenol-A diglycidyl ether (DGEBA) resin and siloxane modified DGEBA
copolymers were estimated at 99 °C. [9, 33]
4.2.3 Foam Density Analysis
The FTIR analysis of the epoxy foam suggests that that the degradation of Diels-
Alder bonds and changing molecular interactions occur during thermal exposure. In
addition, TMA shows that thermal expansion occurs after the temperature required for
Diels-Alder bond degradation. Based on these observations the foam density should
decrease as a function of thermal cycling. A plot of the average foam density as a
function of thermal cycling is presented in Figure 4.9. The plot shows the average
density for foam treated for 0, 1, 5 and 10 thermal cycles. The average densities were
found to be 0.13 ± 0.0075 g/cm3 (±6 %), 0.12 ± 0.0041 g/cm3 (± 4 %), 0.089 ±0.011
g/cm3 (± 13 %) and 0.077 ±0.010 g/cm3 (±13 %), for 0, 1, 5 and 10 thermal cycles,
respectively. The overall density loss observed for the sample treated to ten thermal
thermal cycles is 41 % compared to the pristine foam. The decrease in density indicates
that expansion occurs after the foam is exposed to increasing temperatures.
96

en
> > • l - H
CO
Q
0.13 h
0.11 h
0.09 h
0.07 h
0 10
Number of Cycles
Figure 4.9: Density of the epoxy foam as a function of thermal cycling
97
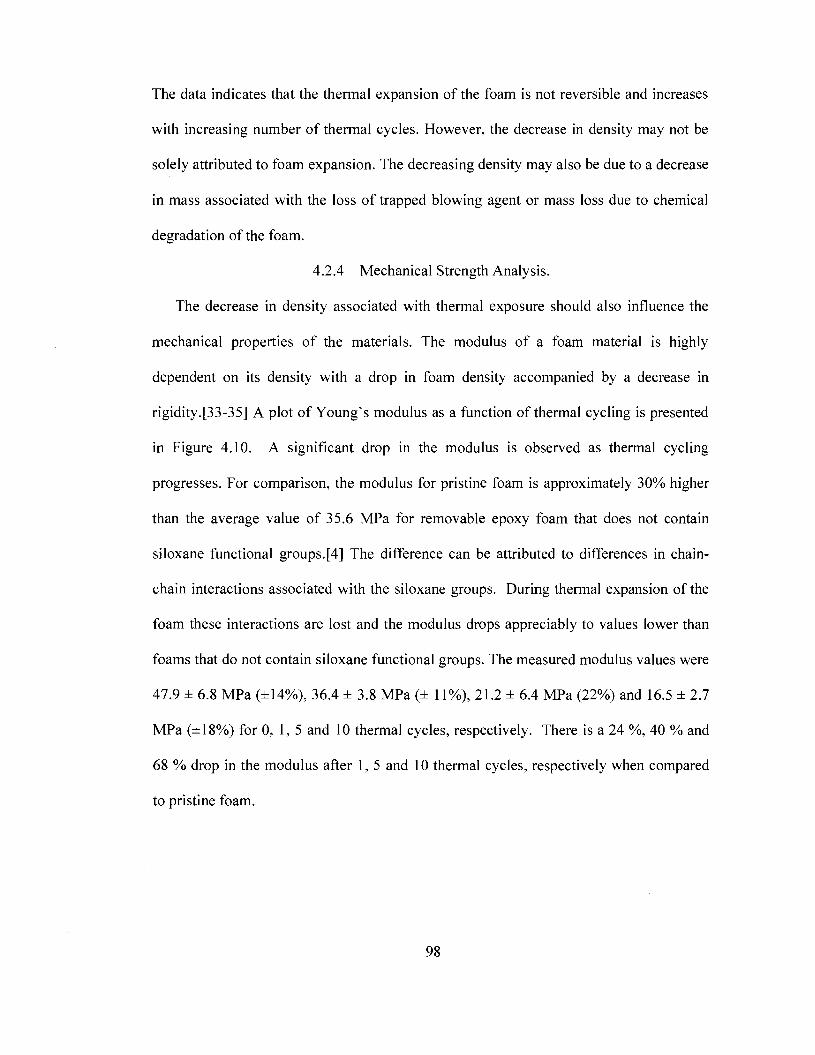
The data indicates that the thermal expansion of the foam is not reversible and increases
with increasing number of thermal cycles. However, the decrease in density may not be
solely attributed to foam expansion. The decreasing density may also be due to a decrease
in mass associated with the loss of trapped blowing agent or mass loss due to chemical
degradation of the foam.
4.2.4 Mechanical Strength Analysis.
The decrease in density associated with thermal exposure should also influence the
mechanical properties of the materials. The modulus of a foam material is highly
dependent on its density with a drop in foam density accompanied by a decrease in
rigidity.[33-35] A plot of Young's modulus as a function of thermal cycling is presented
in Figure 4.10. A significant drop in the modulus is observed as thermal cycling
progresses. For comparison, the modulus for pristine foam is approximately 30% higher
than the average value of 35.6 MPa for removable epoxy foam that does not contain
siloxane functional groups.[4] The difference can be attributed to differences in chain-
chain interactions associated with the siloxane groups. During thermal expansion of the
foam these interactions are lost and the modulus drops appreciably to values lower than
foams that do not contain siloxane functional groups. The measured modulus values were
47.9 ± 6.8 MPa (±14%), 36.4 ± 3.8 MPa (± 11%), 21.2 ± 6.4 MPa (22%) and 16.5 ± 2.7
MPa (±18%>) for 0, 1, 5 and 10 thermal cycles, respectively. There is a 24 %, 40 % and
68 % drop in the modulus after 1, 5 and 10 thermal cycles, respectively when compared
to pristine foam.
98
60
50 -
J3 40 -
30 -
20
B
B
o
\ 1 1 B
B
m
I I L.
0 10
Number of Cycles
Figure 4.10: Modulus of removable epoxy foam as a function of thermal cycling
99
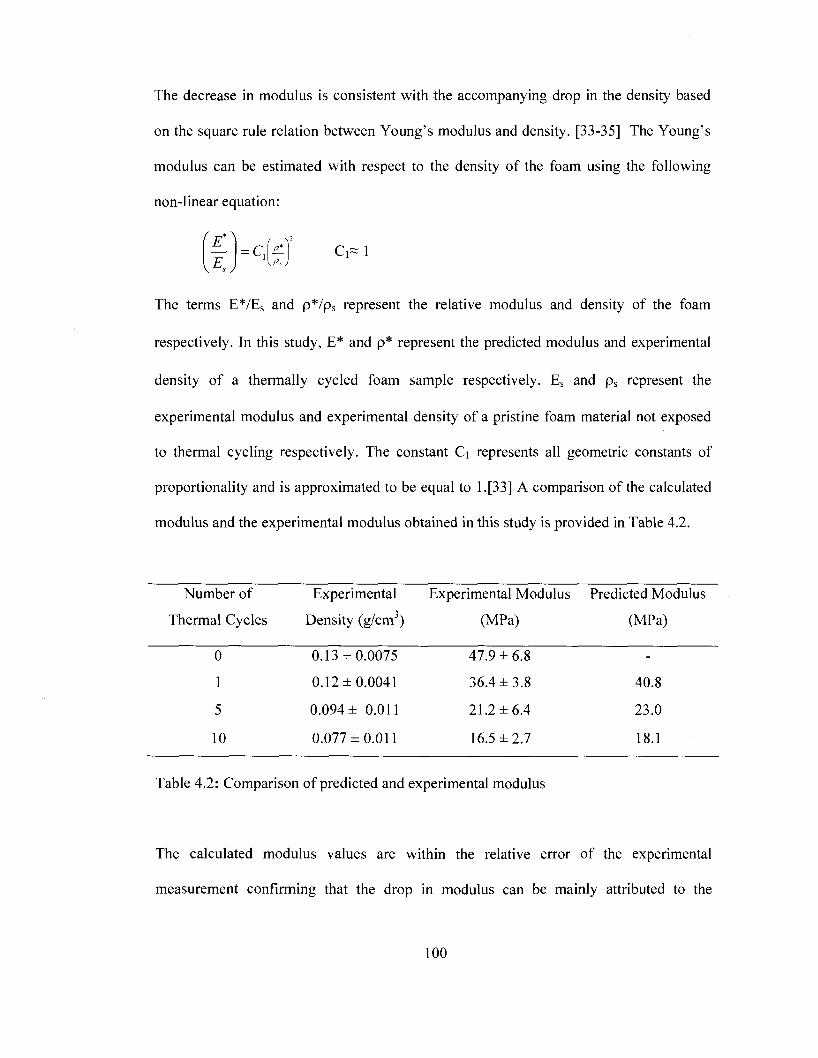
The decrease in modulus is consistent with the accompanying drop in the density based
on the square rule relation between Young's modulus and density. [33-35] The Young's
modulus can be estimated with respect to the density of the foam using the following
non-linear equation:
(E*} ( V
UJ UJ
The terms E*/Es and p*/ps represent the relative modulus and density of the foam
respectively. In this study, E* and p* represent the predicted modulus and experimental
density of a thermally cycled foam sample respectively. Es and ps represent the
experimental modulus and experimental density of a pristine foam material not exposed
to thermal cycling respectively. The constant Ci represents all geometric constants of
proportionality and is approximated to be equal to l.[33] A comparison of the calculated
modulus and the experimental modulus obtained in this study is provided in Table 4.2.
Number of Experimental Experimental Modulus Predicted Modulus
Thermal Cycles Density (g/cm3) (MPa) (MPa)
0 0.13 ±0.0075 47.9 ±6.8
1 0.12 ±0.0041 36.4 ±3.8 40.8
5 0.094 ± 0.011 21.2 ±6.4 23.0
10 0.077 ±0.011 16.5 ±2.7 18.1
Table 4.2: Comparison of predicted and experimental modulus
The calculated modulus values are within the relative error of the experimental
measurement confirming that the drop in modulus can be mainly attributed to the
100
decrease in density associated with thermal cycling and expansion of the epoxy foam.
4.3 References
1. Hatchett, D.W., Kinyanjui, J.M., and Sapochak, L., FTIR analysis of chemical gradients in thermally processed molded polyurethane foam. Journal of Cellular Plastics, 2007. 43: p. 183-196.
2. Hatchett, D.W., Kodippili, G., Kinyanjui, J.M., Benincasa, F., and Sapochak, L., FTIR analysis of thermally processed PU foam. Polymer Degredation and Stability, 2005. 87:p.555-561.
3. Loy, D.A., Wheeler, D.R., Russick, E.M., McElhannon, J.R., and Saunders, R.S., Method of making thermally removable epoxies. January 2002, Sandia Corporation: USA.
4. McElhanon, J.R., Russick, E.M., Wheeler, D.R., Loy, D.A., and Aubert, J.H., Removable foams based on an epoxy resin incorporating reversible Diels-Alder adducts. Journal of Applied Polymer Science, 2002. 85: p. 1496-1502.
5. Russick, E.M. and Rand, P.B., Development and characterization of a new epoxy foam encapusulant as ablefoam replacement., in Sandia Report.SAND98-2538. 1998, Sandia National Laboratories.
6. Small, J.H., Loy, D.A., Wheeler, D.R., McElhannon, J.R., Saunders, R.S., and Randall, S., Method of making thermally removable polymeric encapsulants, Office, U.S.P., Editor. August 2001, Sandia National Laboratories.
7. Kent, J.A., ed. Riegel's handbook of industrial chemistry. 2003, Academics/Plenum Publishers: New York.
8. Sbirrazouli, N., Mititeli-Mija, A., Vincent, L., and Alzina, C , Isoconversional kinetic analysis of stochiometric and off-stochiometric epoxy-amine cures. Thermochimica Acta, 2006. 447: p. 167-177.
9. Lin, S.-T. and Huang, S.K., Thermal degradation study of siloxane-DGEBA epoxy copolymers. European Polymer Journal, 1997. 33: p. 365-373.
101
10. Hobbs, M.L., Modeling epoxy foams exposed to fire like-heat fluxes. Polymer Degradation and Stability, 2005. 89: p. 353-372.
11. Chang, T.C., Wu, K.H., Liao, C.L., Lin, S.T., and Wang, G.P., Thermo-oxidative degradation of siloxane-containing polyimide and unmodified polyimide. Polymer Degradation and Stability, 1998. 62: p. 299-305.
12. Dvornic, P.R., Perpall, H.J., Uden, P.C., and Lenz, R.W., Exactly alternating silarylene-siloxane polymers. VII. Thermal Stabilityand degradation behavior of p-silphenylene-siloxane polymers with methyl, vinyl, hydrido, and/or fluoralky side groups. Journal of Polymer Science: Part A: Polymer Chemistry, 1989. 27: p. 3503-3514.
13. Aubert, J.H., Tallant, D.R., Sawyer, P.S., and Garcia, M.J. Synthesis and formulation of a removable conformal coating using Diels-Alder thermally-reversible adducts. ACS Fall National Meeting, Poly, PMSE and FSCT preprints. 8/22-26, 2004. Philadelphia, PA.
14. Pavia, D.L., Lampman, G.M., and Kriz, G.S., Introduction to spectroscopy: a guide for students of organic chemistry. 1979, Orlando: Saunders College Publishing.
15. Silverstein, R.M. and Webster, F.X., Spectrometric identification of organic compounds. 1998, New York: John Wiley & Sons.
16. Laita, H., Boufi, S., and Gandini, A., The application of the Diels-Alder reaction to polymers bearing fur an moieties. 1. Reactions with maleimides. European Polymer Journal, 1997. 33(8): p. 1203-1211
17. Barthel, H. and Nikitina, E., INS and IR Study of Intermolecular Interactions at the Fumed Silica-Polydimethylsiloxane Interphase. Part 3 Silica-Siloxane Adsorption Complexes. Silicon Chemistry, 2004. 1(4): p. 261-279.
18. Adachi, K., Achimuthu, A.K., and Chujo, Y., Synthesis of organic-inorganic polymer hybrids controlled by Diels-Alder reaction. Macromolecules, 2004. 37(26): p. 9793-9797.
19. Gousse, C , Gandini, A., and Hodge, P., Application of the Diels-Alder reaction to polymers bearing furan moieties. 2. Diels-Alder and retro-Diels-Alder reactions involving fur an rings in some styrene copolymers. Macromolecules, 1998. 31(2): p. 314-321.
102
20. Imai, Y., Itoh, H., Naka, K., and Chujo, Y., Thermally reversible IPN organic-inorganic polymer hybrids utilizing the Diels-Alder reaction. Macromolecules, 2000. 33: p. 4343-4346.
21. Eidelman, N., Raghavan, D., Forster, A.M., Amis, E.J., and Karim, A. Combinatorial approach to characterizing epoxy curing. 2004: Wiley-V C H Verlag Gmbh.
22. Guo, X., Guo, H., Fu, L., Zhang, H., Deng, R., Sun, L., Feng, J., and Dang, S., Novel hybrid periodic mesoporous organosilica material grafting with Tb complex: Synthesis, characterization and photoluminescence property. Microporous and Mesoporous Materials, 2009.119(1-3): p. 252-258.
23. Matsumoto, T., Takayama, Y., Wada, N., Onoda, H., Kojima, K., Yamada, H., and Wakabayashi, H., Acid-free synthesis of poly-organo-siloxane spherical particles using a W/O emulsion. Journal of Materials Chemistry, 2003.13(7): p. 1764-1770.
24. Leyden, D.E., Murthy, R.S.S., Blitz, J.P., Atwater, J.B., and Rachetti, A., Reflectance FTIR Investigations Of The Reactions Of Silanes On Silica Surfaces Mikrochimica Acta, 1988. 2(1-6): p. 53-56.
25. Lee, Y.J., Kim, Y.W., Ha, J.D., Oh, J.M., and Yi, M.H., Synthesis and characterization of novel polyimides with 1-octadecyl side chains for liquid crystal alignment layers. Polymers for Advanced Technologies, 2007.18(3): p. 226-234.
26. Jiang, T. and Xu, K., FTIR study of ultradispersed diamond powder synthesized by explosive detonation. Carbon, 1995. 33(12): p. 1663-1671.
27. Jarrahpour, A.A., Shekarriz, M., and Taslimi, A., Asymmetric synthesis and antimicrobial activity of some new mono and bicyclic beta-lactams. Molecules, 2004. 9(11): p. 939-948.
28. Aubert, J.H., Thermally removable epoxy adhesives incorporating thermally reversible Diels-Alder adducts. Journal of Adhesion, 2003. 79(6): p. 609-616.
29. Aubert, J., Thermally removable epoxy adhesives incorporating thermally reversible Diels-Alder adducts. Journal of Adhesion, 2003. 79: p. 609-616.
103
30. C. Di Giulio, M.G.B.J., Fourier transform infrared spectroscopic characterization of aromatic bismaleimide resin cure states. Journal of Applied Polymer Science, 1984. 29(5): p. 1771-1779.
31. Wang, H. and Siow, K.S., Measurement of Tg in epoxy resins by DSC-effects of residual stress. Polymer Engineering and Science, 1999. 39: p. 422-429.
32. Wu, C.S., Influence of post-curing and temperature effects on bulk density, glass transition and stress strain behaviour of imidazole-cured epoxy network. Journal of Materials Science, 1992. 27: p. 2952-2959.
33. Gibson, L.J. and Ashby, M.F., Cellular solids: structure and properties. 1997, Cambridge: Cambridge University Press.
34. Hawkins, M.C., O'Toole, B., and Jackovich, D., Cell morphology and mechanical properties of rigid polyurethane foam. Journal of Cellular Plastics, 2005. 41: p. 267-285.
35. Jackovich, D., O'Toole, B., and Hawkins, M.C., Temperature and mold size effects on physical and mechanical properties of a polyurethane foam. Journal of Cellular Plastics, 2005. 41: p. 153-168.
104
CHAPTER 5
SYNTHESIS AND CHARACTERIZATION OF POLYIMIDE/CARBON/METAL
COMPOSITES
5.1 Introduction
Electrically conductive poly(pyromellitic dianhydride-4,4'-oxydianiline)imide
(PMDA-ODA polyimide) films are prepared by incorporating carbon into the insulating
polymer matrix. Changes in the chemical composition of the polymer prior to and after
carbon incorporation are investigated using a variety of analytical techniques. In
addition, the conversion of PMDA-ODA polyamic acid to PMDA-ODA polyimide
during thermal imidization is evaluated to determine the extent of polymerization.
Thermal analysis techniques (DSC/TGA) are used to evaluate the thermal stability for
the polymer and composite after introducing carbon. TGA and DSC are also used to
investigate the effectiveness of the curing process in removing solvents constituting the
new binary acetone/DMSO solvent system used during the casting and curing process.
These techniques are critical in evaluating the influence of the removal and residual
content of the solvent prior to thermal imidization on the mechanical integrity of
polyimide.
Electrochemical methods will be used to metalize the Pi/carbon composite materials
providing an electrochemical/catalytic interface. The Pt particle distribution on the
Pi/carbon surface and possible carbon aggregation at the surface are investigated
105
using scanning electron microscopy (SEM). X-ray-photoelectron spectroscopy (XPS) is
used to determine the oxidation state of the metal deposits. For optimum electrode
response, uniform metal nucleation on the surface of the Pi/carbon films is desired. The
goal is to provide the highest level of catalytic activity using the lowest mass of Pt metal
deposited.
Finally, the use of Pi/carbon composites as working electrodes is studied using
various methods for producing gold coatings that include chemical vapor deposition
(CVD) and electrodeposition. The quality of the gold deposits is evaluated
electrochemically using the ferricyanide redox couple. The reversibility and electron
transfer kinetics of the ferricyanide couple at the surface of Pl/carbon/gold composites
are investigated and compared to a gold planar electrode. Pl/carbon/Au would be useful
in fabricating flexible organic field effect transistors (OFET).
5.2 Results and Discussion
5.2.1 FTIR Analysis
The conversion of polyamic acid to polyimide resulting from thermal imidization is
evaluated using FTIR photoacoustic spectroscopy.[l] Figure 5.1a-5.1d presents the FTIR
spectra of PMDA/ODA polyamic acid (PAA), PMDA/ODA polyimide (PI),
PMDA/ODA polyamic acid/carbon (PAA/carbon) and PMDA/ODA polyimide/carbon
(Pi/carbon) for the 600-1900 cm"1 spectral range while figure 5.2a-5.2d represent the
same materials for the 1900-3700 cm"1 spectral range. The loss of bands related to
carboxylic acid and amide functional groups specific to PAA and the appearance of imide
bands specific to polyimide signify the conversion of the precursor to polyimide. Table
5.1 presents the band assignments for bands pertinent to the conversion of PAA to PI
106
during thermal imidization, confirming that thermal imidization occurs.
The strong broad band spanning 2500-3600 cm"1 is assigned to the carboxylic acid
OH group as shown in the PAA spectrum (Figure 5.2a). In addition, characteristic
secondary amide NH stretch bands occurring as multiple bands are observed in the same
region between 3065-3300 cm"1. [2] Both OH and NH bands are also observed for
PAA/carbon as shown in Figure 5.2c although their size is diminished as compared to
PAA. The diminished size of the OH and NH band intensities in the PAA/carbon
spectrum possibly results from interference by carbon and has been previously reported
for plastic/carbon composites. [3] A carbon black reference is used to obtain the baseline
in FTIR-PAS at high carbon loadings. However, carbon black can impede diffusion of
the thermal wave from the sample to the surrounding helium gas, therefore leading to a
lower signal output from the PAS detector. The OH and NH bands are absent in both PI
and Pi/carbon spectra as seen in Figure 5.2c and 5.2d respectively confirming the
conversion of PAA to PI. In addition to these bands, a medium sized band located at 1550
cm"1 overlapping with the aromatic C=C stretch band attributed to the secondary amide
C-NH group in PAA is observed for both PAA and PAA/carbon. This band is greatly
diminished in intensity for both PI and Pi/carbon indicating the loss of the amide group in
PAA with the formation of a cyclic imide in PI following thermal imidization.
The appearance of bands related to the imide functional group signify the formation
of PI. For example, the C=0 asymmetric stretch band located at around 1780 cm"1 is
indicative and specific to the imide group marking the formation of polyimide with
thermal imidization.
107
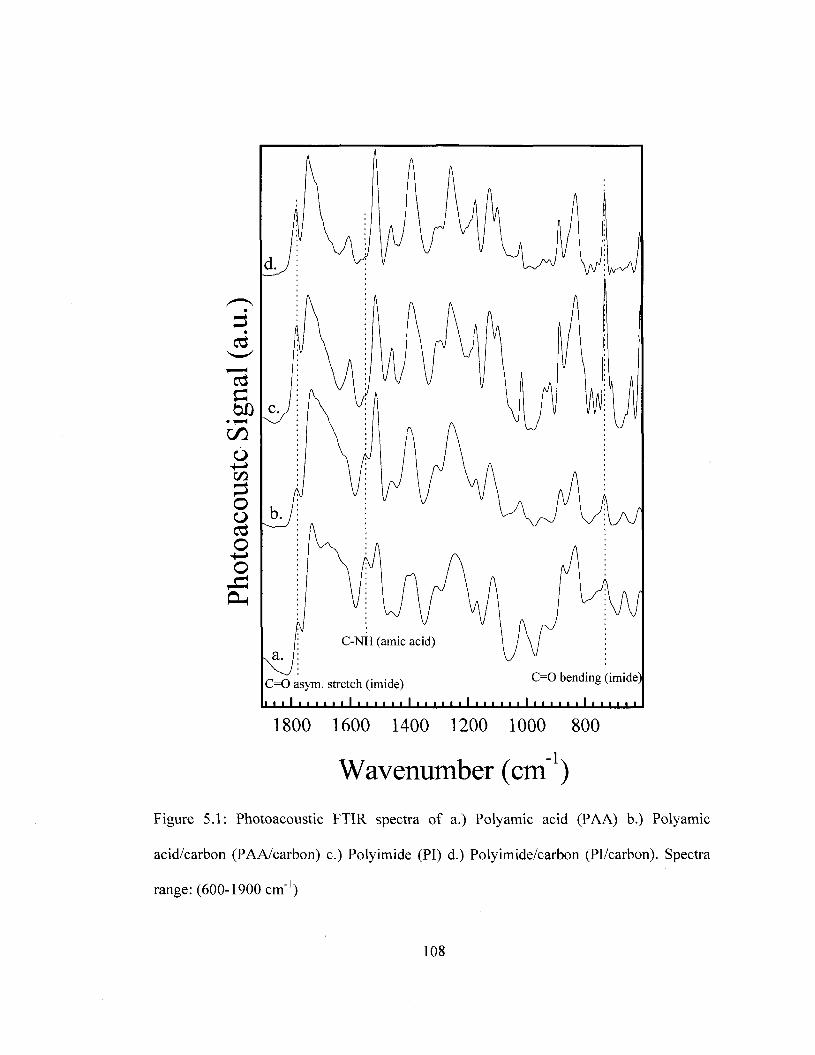
C=0 asym. stretch (imide)
• • • ' • • • •
C=0 bending (imide)
1 I '
1800 1600 1400 1200 1000 800
Wavenumber (cm")
Figure 5.1: Photoacoustic FTIR spectra of a.) Polyamic acid (PAA) b.) Polyamic
acid/carbon (PAA/carbon) c.) Polyimide (PI) d.) Polyimide/carbon (Pi/carbon). Spectra
range: (600-1900 cm"1)
108
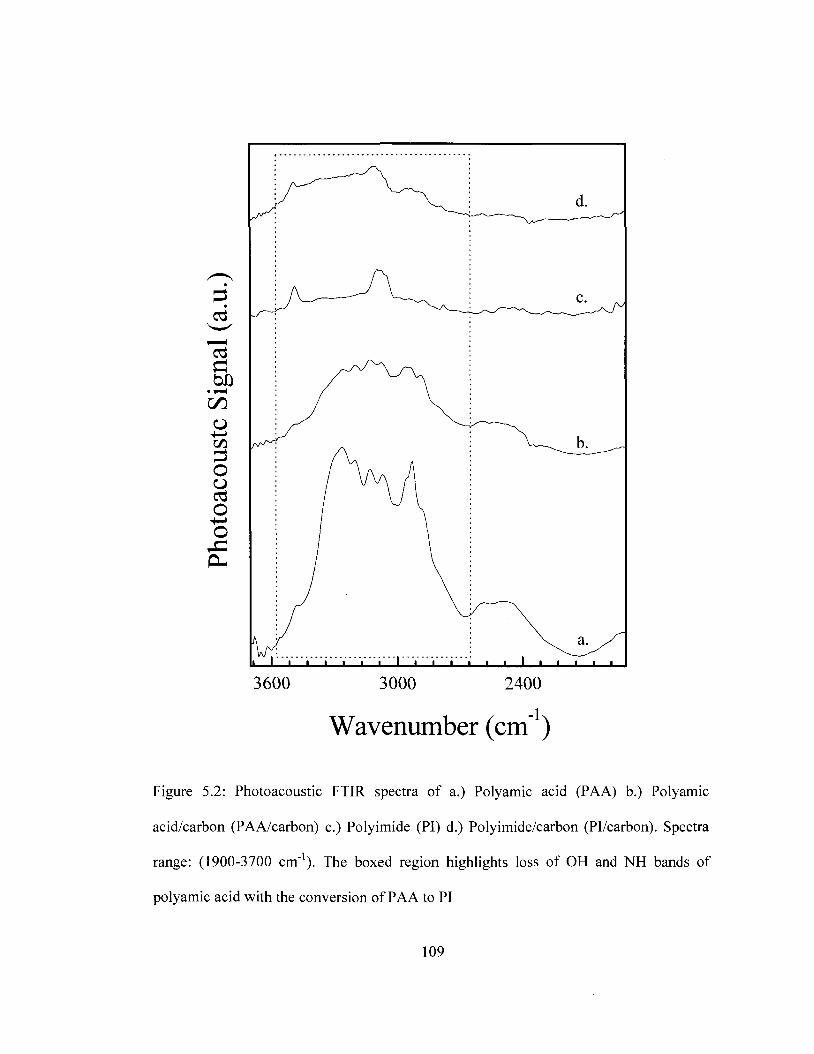
2 d
o
o o o
+->
o
3600 3000 2400
Wavenumber (cm")
Figure 5.2: Photoacoustic FTIR spectra of a.) Polyamic acid (PAA) b.) Polyamic
acid/carbon (PAA/carbon) c.) Polyimide (PI) d.) Polyimide/carbon (Pi/carbon). Spectra
range : (1900-3700 cm"1). The boxed region highlights loss of OH and NH bands of
polyamic acid with the conversion of PAA to PI
109
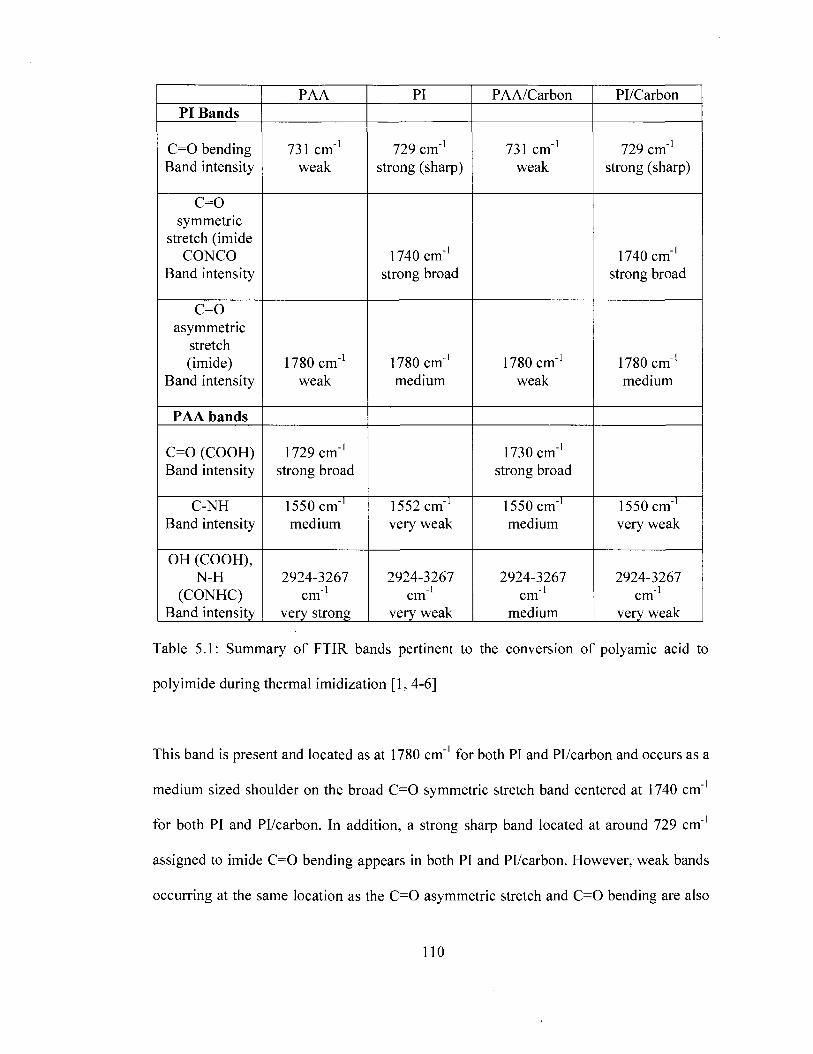
PI Bands
C=0 bending Band intensity
C=0 symmetric
stretch (imide CONCO
Band intensity
C=0 asymmetric
stretch (imide)
Band intensity
PAA bands
C=0 (COOH) Band intensity
C-NH Band intensity
OH (COOH), N-H
(CONHC) Band intensity
PAA
731 cm"1
weak
1780 cm"1
weak
1729 cm"1
strong broad
1550 cm"1
medium
2924-3267 cm"1
very strong
PI
729 cm"1
strong (sharp)
1740 cm"1
strong broad
1780 cm"1
medium
1552 cm"' very weak
2924-3267 - i
cm very weak
PAA/Carbon
731 cm"1
weak
1780 cm"1
weak
1730 cm"1
strong broad
1550 cm"1
medium
2924-3267 cm"
medium
Pi/Carbon
729 cm"1
strong (sharp)
1740 cm"1
strong broad
1780 cm"1
medium
1550 cm"1
very weak
2924-3267 cm"1
very weak
Table 5.1: Summary of FTIR bands pertinent to the conversion of polyamic acid to
poly imide during thermal imidization [1, 4-6]
This band is present and located as at 1780 cm"1 for both PI and Pi/carbon and occurs as a
medium sized shoulder on the broad C=0 symmetric stretch band centered at 1740 cm"1
for both PI and Pi/carbon. In addition, a strong sharp band located at around 729 cm"1
assigned to imide C=0 bending appears in both PI and Pi/carbon. However, weak bands
occurring at the same location as the C=0 asymmetric stretch and C=0 bending are also
110
observed for both PAA and PAA/carbon. This could signify that residual starting
dianhydride might be present in the supplied PAA solution. Pyromellitic dianhydride
exhibits the C=0 asymmetric stretch at 1780 cm"1 and C=0 bending at 720 cm"1, which
are very proximate to those of polyimide carbonyl groups.
5.2.2 Influence of carbon loading on PMDA/ODA Polyimide
The influence of the carbon content on the electrical conductivity of PI is evaluated
and presented in Figure 5.3. Carbon loading is reported as based on % mass of
carbon/mass of polyamic acid. Significant changes are observed as the amount of carbon
introduced into the polyimide matrix is increased. A 7000 fold jump in the conductivity
of PI is recorded as the carbon loading is increased between 2.5 percent and 5 percent.
The drastic jump in conductivity is attributed to formation of fibrous chain-like carbon
networks in the polymer matrix and has been previously reported for polyimide/carbon
black composites. [7, 8] These networks are formed after particles reach a critical mass
leading to coagulation and contact between the particles. [7-9] One theory describing this
phenomenon is the percolation theory which states that after a critical carbon content
(also referred to percolation threshold) is reached, the composite is converted from an
insulator to a conductor. [10, 11]
After 5% carbon loading, the conductivity of the membrane improves gradually and
does not change drastically after 10% carbon content is reached as seen in Figure 5.3
(inset). However, the mechanical stability of the films is compromised when the carbon
content is 12.5% with fractures developing and flexibility decreasing. For this reason,
composites with 10% carbon loading were used for all studies.
I l l
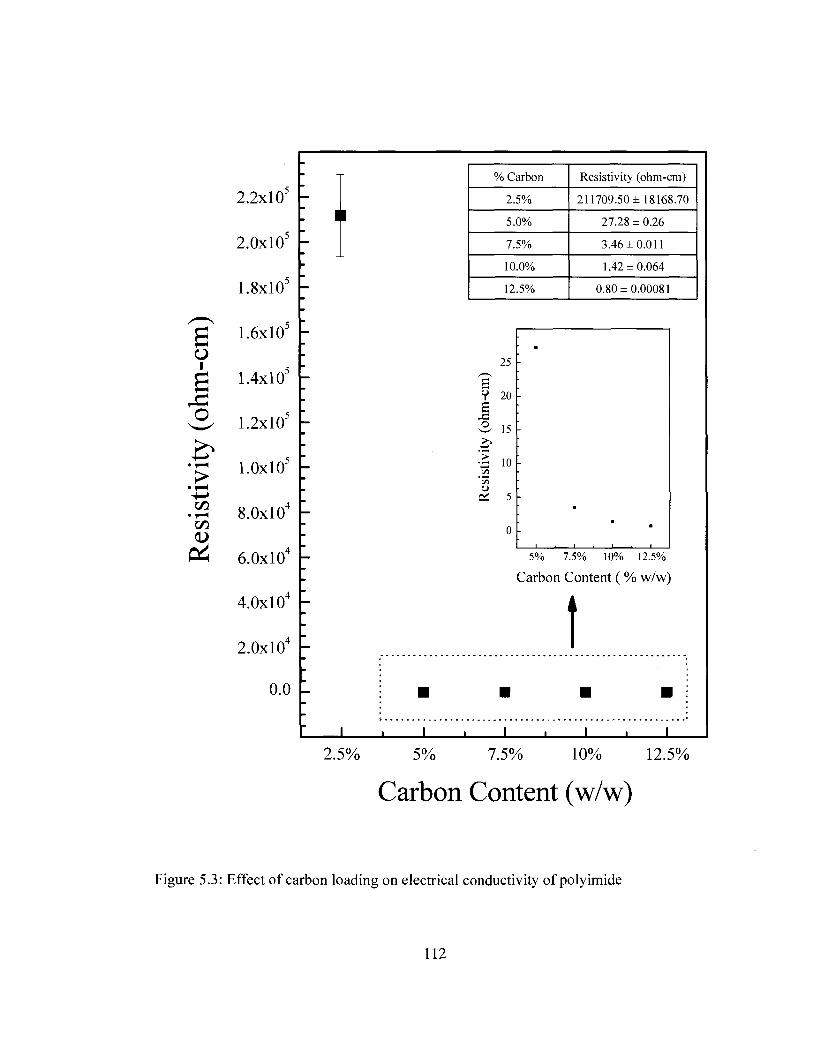
2.2xl05
2.0xl05
1.8xl05
1.6xl05
1.4xl05
1.2xl05
l.OxlO5
8.0xl04
6.0xl04
4.0xl04
2.0xl04
0.0
•
-
. ,
i .
• i
1 i , . i ,
2.5% 5%
% Carbon
2.5%
5.0%
7.5%
10.0%
12.5%
Resistivity (ohm-cm)
211709.50± 18168.70
27.28 ±0.26
3.46 ±0.011
1.42 ±0.064
0.80 ±0.00081
25
V 20
s 3 15 >> +^
1 10 "5a o
04 5
0
•
-
_
•
1 . 1
• •
1 . 1
5% 7.5% 10% 12.5%
Carbon Content ( % w/w)
f L - . . . . . . . . . . . . . .
_L 7.5% 10% 12.5%
Carbon Content (w/w)
Effect of carbon loading on electrical conductivity of polyimide
112
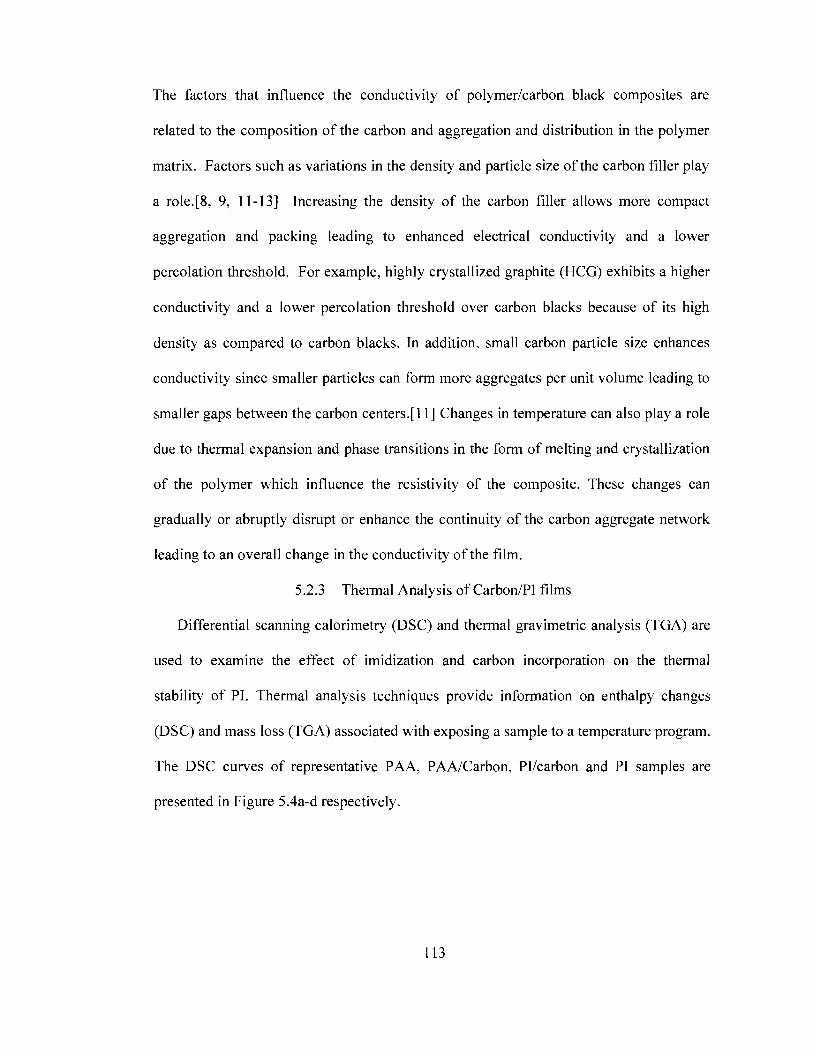
The factors that influence the conductivity of polymer/carbon black composites are
related to the composition of the carbon and aggregation and distribution in the polymer
matrix. Factors such as variations in the density and particle size of the carbon filler play
a role.[8, 9, 11-13] Increasing the density of the carbon filler allows more compact
aggregation and packing leading to enhanced electrical conductivity and a lower
percolation threshold. For example, highly crystallized graphite (HCG) exhibits a higher
conductivity and a lower percolation threshold over carbon blacks because of its high
density as compared to carbon blacks. In addition, small carbon particle size enhances
conductivity since smaller particles can form more aggregates per unit volume leading to
smaller gaps between the carbon centers.[l 1] Changes in temperature can also play a role
due to thermal expansion and phase transitions in the form of melting and crystallization
of the polymer which influence the resistivity of the composite. These changes can
gradually or abruptly disrupt or enhance the continuity of the carbon aggregate network
leading to an overall change in the conductivity of the film.
5.2.3 Thermal Analysis of Carbon/PI films
Differential scanning calorimetry (DSC) and thermal gravimetric analysis (TGA) are
used to examine the effect of imidization and carbon incorporation on the thermal
stability of PI. Thermal analysis techniques provide information on enthalpy changes
(DSC) and mass loss (TGA) associated with exposing a sample to a temperature program.
The DSC curves of representative PAA, PAA/Carbon, Pi/carbon and PI samples are
presented in Figure 5.4a-d respectively.
113
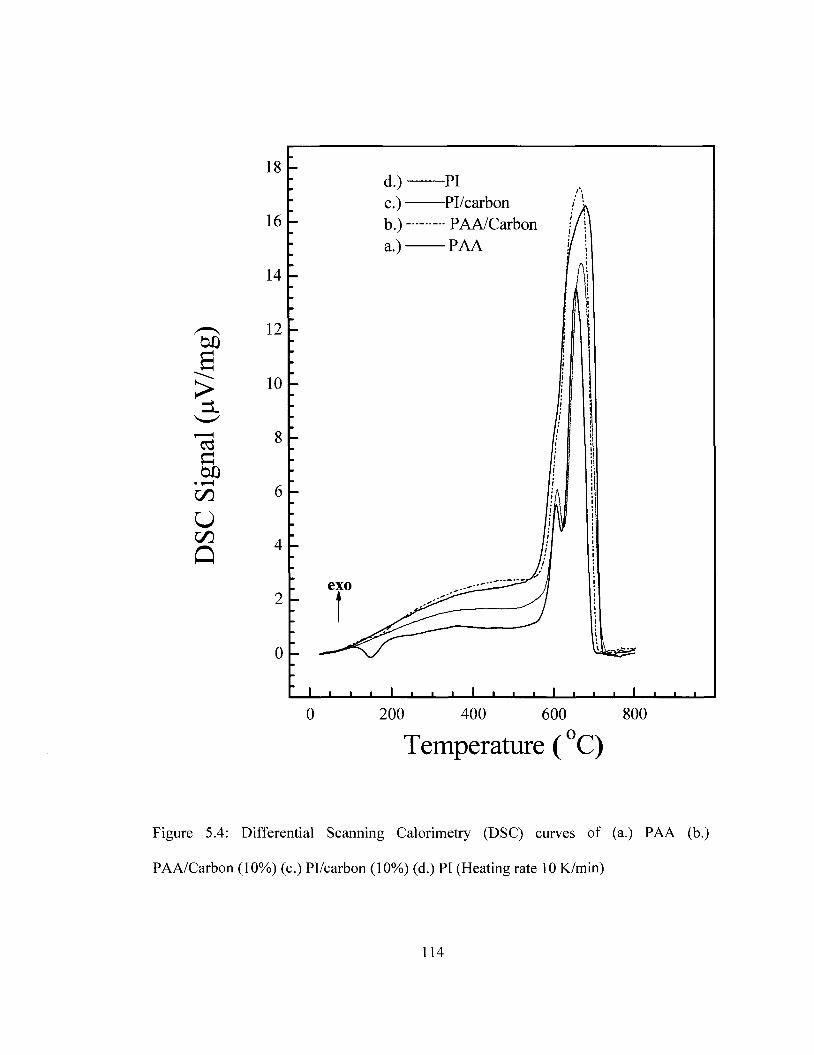
a
•T -H
U Q
18
16
14
12
10
8
6
4
2
0
-
" 1
exo
f
i i
d . ) -
c ) -b . ) -a . ) -
^£^Z~
• 1 .
— P I Pi/carbon /
----- PAA/Carbon \l PAA i
\ I
f
1 f ^4 ^r J
1 1 1 1
l i J L s ^ *
i . . .
0 200 400 600 800
Temperature (°C)
Figure 5.4: Differential Scanning Calorimetry (DSC) curves of (a.) PAA (b.)
PAA/Carbon (10%) (c.) Pl/carbon (10%) (d.) PI (Heating rate 10 K/min)
114
GO GO
O
GO GO
a
100 \- > _ :
80
60
40
20
•Pi/Carbon PAA/CarM
•PI PAA
J. _L J_ _L 0 100 200 300 400 500 600 700 800 900
Temperature (°C)
Figure 5.5: Thermal Gravimetric Analysis (TGA) curves of (a.) PAA (b.) PI. (c.)
PAA/Carbon (d.) Pl/carbon Heating rate: lOK/min
115
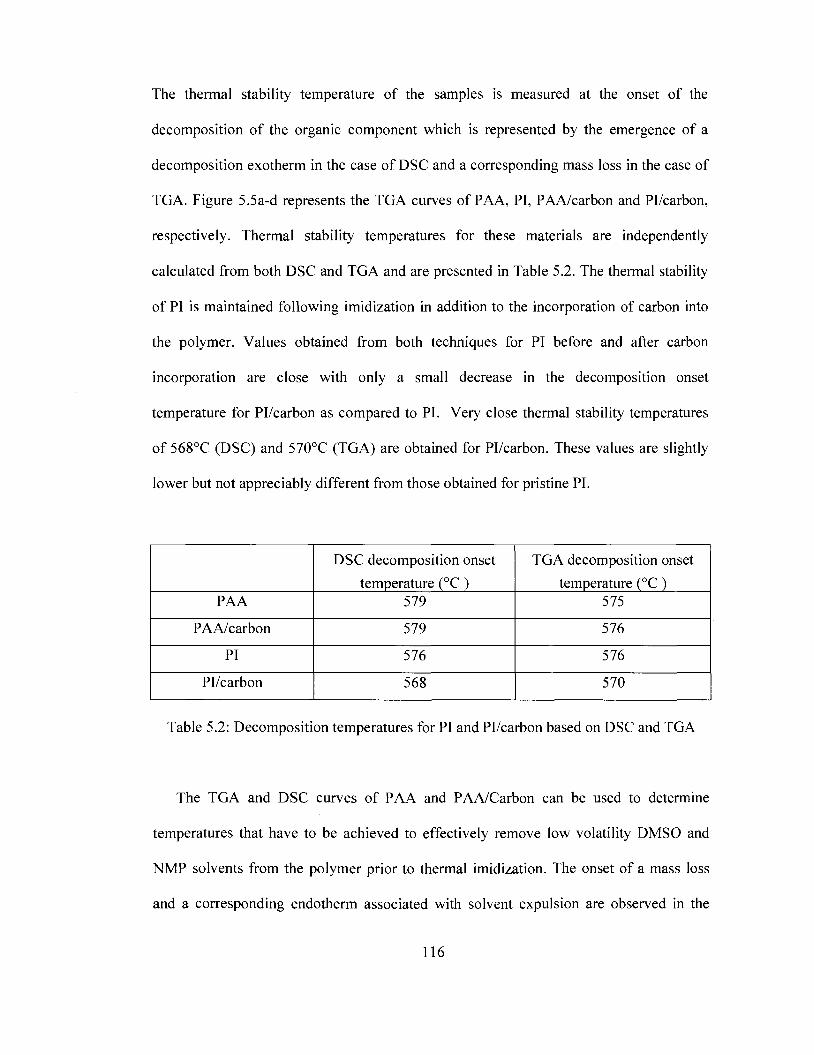
The thermal stability temperature of the samples is measured at the onset of the
decomposition of the organic component which is represented by the emergence of a
decomposition exotherm in the case of DSC and a corresponding mass loss in the case of
TGA. Figure 5.5a-d represents the TGA curves of PAA, PI, PAA/carbon and Pi/carbon,
respectively. Thermal stability temperatures for these materials are independently
calculated from both DSC and TGA and are presented in Table 5.2. The thermal stability
of PI is maintained following imidization in addition to the incorporation of carbon into
the polymer. Values obtained from both techniques for PI before and after carbon
incorporation are close with only a small decrease in the decomposition onset
temperature for Pi/carbon as compared to PI. Very close thermal stability temperatures
of 568°C (DSC) and 570°C (TGA) are obtained for Pi/carbon. These values are slightly
lower but not appreciably different from those obtained for pristine PI.
PAA
PAA/carbon
PI
Pi/carbon
DSC decomposition onset
temperature (°C ) 579
579
576
568
TGA decomposition onset
temperature (°C) 575
576
576
570
Table 5.2: Decomposition temperatures for PI and Pi/carbon based on DSC and TGA
The TGA and DSC curves of PAA and PAA/Carbon can be used to determine
temperatures that have to be achieved to effectively remove low volatility DMSO and
NMP solvents from the polymer prior to thermal imidization. The onset of a mass loss
and a corresponding endotherm associated with solvent expulsion are observed in the
116
thermal analysis curve of both PAA and PAA/Carbon. The mass loss is recorded at
124.5°C and 144°C for PAA and PAA/carbon respectively. [8] The higher temperature
needed to expel solvent from the PAA/Carbon as compared to PAA can be explained by
the presence of carbon which can trap the solvent in its porous structure making it harder
to remove the solvent from the composite. A 46% and 22% mass loss is observed for
PAA and PAA/Carbon respectively. The DSC endotherm associated with the removal of
solvent is observed at 124.6°C for PAA which matches the onset of the mass loss.
However, the onset temperature for PAA/Carbon could not be determined accurately due
to the small size of the endotherm.
The decomposition of pure SC-conductex carbon black proceeds from 572°F (300°C)
which is much lower than the temperature observed for PI/carbon.[14] No
decomposition endotherm or mass loss is recorded at this temperature. The fact that the
decomposition of carbon is not observed at its decomposition temperature suggests that
PI binds carbon into its matrix which increases its thermal stability.
5.2.4 Electrochemical Deposition of Platinum
Deposition on freestanding Pi/carbon working electrode is achieved using potential
cycles that encompass the reduction of PtCl42" ion to Pt metal. The reduction reaction and
potential for PtCU2" are given as follows:
PtCl42" + 2e~ —• Pt(0) + 4C1" E = 0.520V versus Ag/AgCl [15]
Platinum is electrochemically deposited on the surface of the Pi/carbon composite using
cyclic voltammetry. The cyclic voltammogram for deposition of platinum on the film is
compared and referenced to that of a planar platinum electrode.
117
1.0 0.8 0.6 0.4 0.2 0.0 -0.2
Potential vs. Ag/AgCl (V)
Figure 5.6: Cyclic voltammograms at planar Pt sheet electrode of (a) 1M HCIO4 prior to
deposition (b) Pt deposition using 2.0x10"2M PtCl42" in 1M HC104 (c) 1M HC104 after
deposition. Scan rate: 0.01 V/s
118
5k
<
o a.
1 * * i i i i i i i i i J_L
1.0 0.8 0.6 0.4 0.2 0.0 -0.2
Potential vs. Ag/AgCl (V)
Figure 5.7: Cyclic voltammograms at a Pi/carbon electrode of (a) 1M HCIO4 prior to
deposition (b) Pt deposition using 2.0x10"2M PtCl42~ in 1M HC104 (c) 1M HC104 after
deposition. Scan rate: 0.01 V/s
119
Specifically, voltammetric waves related to the deposition of platinum and the ensuing
chemistry at the surface of the deposited platinum layer are evaluated for both electrodes.
Figure 5.6a represents the background voltammogram of a bare Pt sheet electrode in
1M HCIO4 supporting electrolyte while the deposition of platinum using 2.0x10"2M
PtCU^in IMHCIO4 on the same electrode is presented in figure 5.6b. Figure 5.6c shows
the voltammogram of the electrode immersed in 1M HCIO4 following Pt deposition.
Figure 5.7a represents the background voltammogram of a Pi/carbon in 1M HCIO4
supporting electrolyte while the deposition of platinum on the electrode is presented in
figure 5.7b. Figure 5.7c shows the voltammogram of the electrode immersed in 1M
HCIO4 following Pt deposition.
While no voltammetric waves are observed for both electrodes when immersed in
supporting HCIO4 solution (Figure 5.6a) prior to Pt deposition, significant changes can be
seen following the deposition of Pt. New waves associated with the deposition of
platinum emerge and are labeled for clarity on the voltammetric wave representing
electrode immersed in PtCl42" for both the Pt sheet (figure 5.6b) and Pi/carbon (figure
5.7b). In addition, waves resulting from competing processes occurring at the surface of
the newly deposited platinum are also recorded. Specifically, in acidic medium, the
adsorption/desorption of hydrogen following proton reduction and formation and
reduction of PtO can occur and inhibit electron transfer at the surface of the electrode.
The small wave centered at 0.201V (wave B) in the Pt sheet voltammogram is
assigned to the reduction on PtCU2" to Pt metal. This wave is also observed for Pt
deposition at carbon/PI as shown in Figure 5.7b and is located at 0.215V. However, it is
absent when both electrodes are immersed in HCIO4 prior and after metal deposition
120
suggesting that the wave is related to the reduction of the PtCU2" ion. The assignment of
the PtCLj2" reduction wave is made difficult by the small size of wave B. However, the
presence of other waves in the deposition voltammogram resulting from surface
processes occurring at newly deposited platinum sites can be used to confirm that metal
deposition occurs.
For example, the presence of proton adsorption/desorption waves provides further
evidence that Pt deposition occurs at the surface of both the Pt sheet and Pi/carbon. Wave
C located at -0.107 V is assigned to the adsorption of H atoms produced from the
reduction of protons on the newly deposited platinum and is outlined as follows:
H + e —» H —> Hads
The location of this wave is consistent with reported values of below 0 V vs. Ag/AgCl for
the process. [15-18] Proton adsorption at a polycrystalline platinum electrode is a two
step process representing weak adsorption followed by strong adsorption of hydrogen
atoms to the surface of the electrode.[17] However, this process is highly dependent on
the crystal surface structure of the electrode with the number of peaks observed being
determined by the number of crystal planes of the electrodes surfaces that are
exposed.[16, 19] The presence of defects and impurities can lead to disorder in the
crystal structure of the electrode becoming hard to observe distinct adsorption waves
from the different crystal planes. At negative potentials beyond proton adsorption,
hydrogen evolution occurs as follows:
2Hads — H2 a d s^ H2(g) E = -0.197V vs Ag/AgCl [15]
In the case of the pt sheet electrode and the Pi/carbon electrodes, a single peak with a
small shoulder is observed. With potential cycling, the area of proton
121
adsorption/desorption peaks increases because every deposition cycle provides additional
sites for the process to occur. As cycling proceeds, proton desorption from the Pt sheet
electrode surface is observed at -0.0397V (wave C). A similar trend is observed for Pt
deposition at Pi/carbon (Figure 5.7b). However, proton adsorption and desorption are
observed at slightly more negative potentials of-0.123 V and -0.0660 V respectively as
compared to the Pt sheet.
In addition to proton adsorption during Pt deposition, passivation of the Pt surface
through the formation of a PtO monolayer (wave A) is observed for both the platinum
sheet and PI/carbon.[18] PtO formation is observed at anodic potentials of 0.857V for Pt
sheet and 0.915V for carbon/PI. A corresponding wave (wave A') related to the reduction
of PtO layer is observed at 0.654V and 0.622 for the pt sheet electrode and carbon PI
respectively. PtO reduction is presented as follows [20]:
PtO(s) + 2e" + 2H+ - ^ - ^ Pt(s) + H20 E = 0.78 V vs. Ag/AgCl
Similar to proton adsorption and desorption waves, an increase in the area of PtO peaks
as cycling proceeds is observed as the number of platinum sites increases with every
successive metal deposition cycle.
Both proton adsorption/desorption processes and the formation and reduction of PtO
can be observed when the Pt sheet and Pi/carbon are immersed in HCIO4 following Pt
deposition as shown in Figure 5.6c and 5.7c respectively. These processes are not
observed when the electrodes are immersed in the same solution prior to metal
deposition. The occurrence of these processes in the HCIO4 electrolyte solution provides
further evidence that PtCU2" is reduced to Pt metal at the surface of the electrode.
However, some differences can be observed between the deposition voltammograms
122
of the Pt sheet and Pi/carbon electrodes. One difference is the separation of
hydrogen/desorption waves and PtO formation/reduction waves is larger for carbon/PI as
compared to the Pt sheet suggesting slower electron transfer at Pi/carbon. The slower
electron transfer could be attributed to the lower electrical conductivity of Pi/carbon as
compared to the Pt sheet electrode.
5.2.5 Scanning Electron Microscopy and X-Ray Photoelectron Spectroscopy
Scanning electron microscopy (SEM) is used to investigate the morphology of the
Pi/carbon/platinum composite and particle distribution of deposited platinum on the
surface of the Pi/carbon platform as shown in Figures 5.8a and 5.8b which represents
films with a Pt loading of 6% and 30% respectively. During Pt deposition, the films are
divided into two sections with platinum deposited in one partition and no platinum
deposited on the other partition. At low Pt loading, the metal appears as evenly spaced,
discrete clusters of Pt (-400 nm diameter) in Pl/carbon/Pt composites. In contrast, the Pt
deposited in the Pl/carbon/Pt composites with high loading show a coalesced deposit of
metal with no discernible clusters. The morphology of the carbon/PI suggests that good
carbon dispersion in PI is achieved with the acetone/DMSO solvent system. Carbon
aggregation at the PI surface is not discernable even at a high magnification of 8000
(Figure 5.8c).
Lin et al. observe large surface defects appearing as lumps approximately 60um in
size on the surface Pi/carbon films prepared from SC conductex carbon black. The
authors attribute these defects to formation of pockets by trapped water vapor produced
during imidization. [8]
123
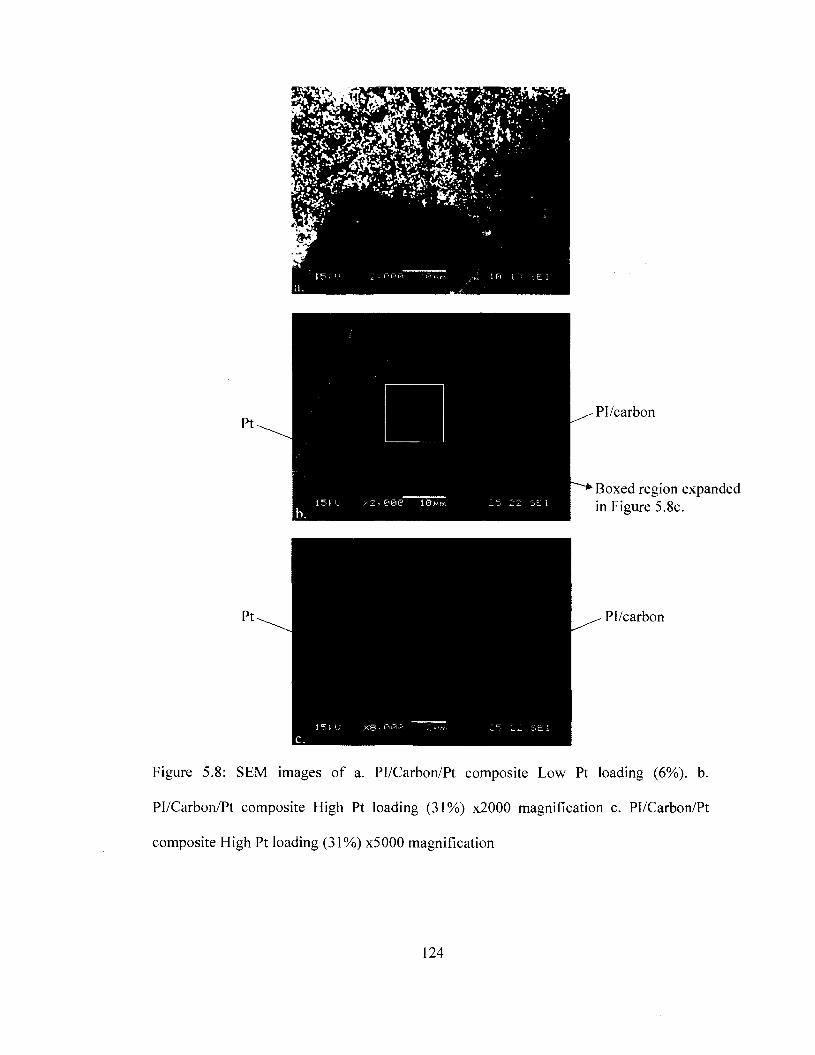
Pi/carbon
Boxed region expanded in Figure 5.8c.
Pi/carbon
Figure 5.8: SEM images of a. Pl/Carbon/Pt composite Low Pt loading (6%). b.
Pl/Carbon/Pt composite High Pt loading (31%) x2000 magnification c. Pl/Carbon/Pt
composite High Pt loading (31%) x5000 magnification
124
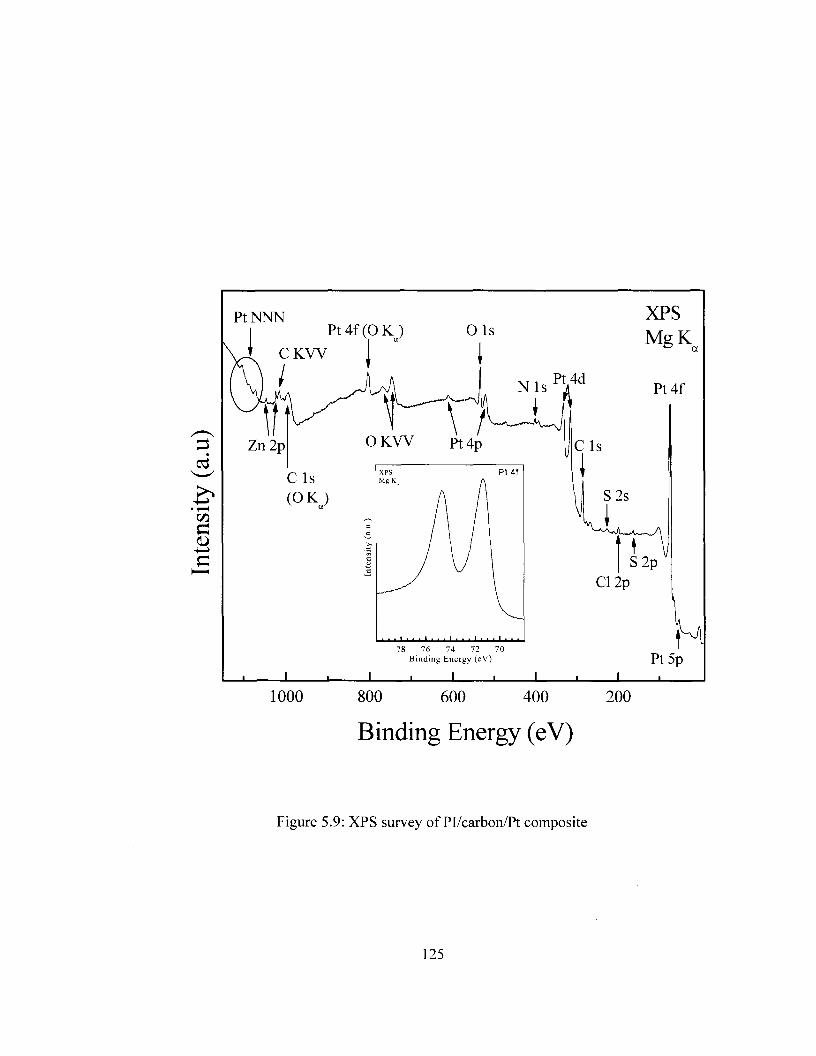
PtNNN P t 4 f ( 0 K )
XPS MgK
• • • • ' • • • •
78 76 74 72 70 Binding Energy (eV)
1000 800 600 400
Binding Energy (eV)
200
Figure 5.9: XPS survey of Pl/carbon/Pt composite
125
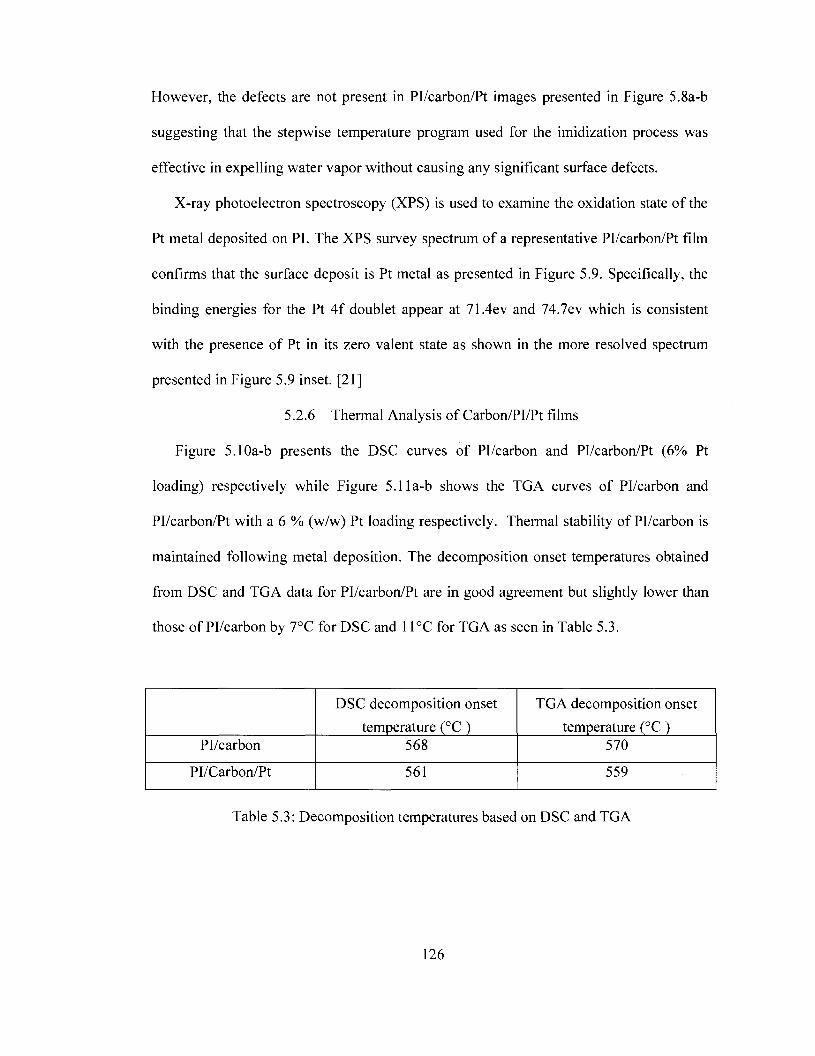
However, the defects are not present in Pl/carbon/Pt images presented in Figure 5.8a-b
suggesting that the stepwise temperature program used for the imidization process was
effective in expelling water vapor without causing any significant surface defects.
X-ray photoelectron spectroscopy (XPS) is used to examine the oxidation state of the
Pt metal deposited on PI. The XPS survey spectrum of a representative Pl/carbon/Pt film
confirms that the surface deposit is Pt metal as presented in Figure 5.9. Specifically, the
binding energies for the Pt 4f doublet appear at 71.4ev and 74.7ev which is consistent
with the presence of Pt in its zero valent state as shown in the more resolved spectrum
presented in Figure 5.9 inset. [21]
5.2.6 Thermal Analysis of Carbon/PI/Pt films
Figure 5.10a-b presents the DSC curves of Pi/carbon and Pl/carbon/Pt (6% Pt
loading) respectively while Figure 5.1 la-b shows the TGA curves of Pi/carbon and
Pl/carbon/Pt with a 6 % (w/w) Pt loading respectively. Thermal stability of Pi/carbon is
maintained following metal deposition. The decomposition onset temperatures obtained
from DSC and TGA data for Pl/carbon/Pt are in good agreement but slightly lower than
those of Pi/carbon by 7°C for DSC and 11°C for TGA as seen in Table 5.3.
Pi/carbon
Pl/Carbon/Pt
DSC decomposition onset
temperature (°C) 568
561
TGA decomposition onset
temperature (°C) 570
559
Table 5.3: Decomposition temperatures based on DSC and TGA
126
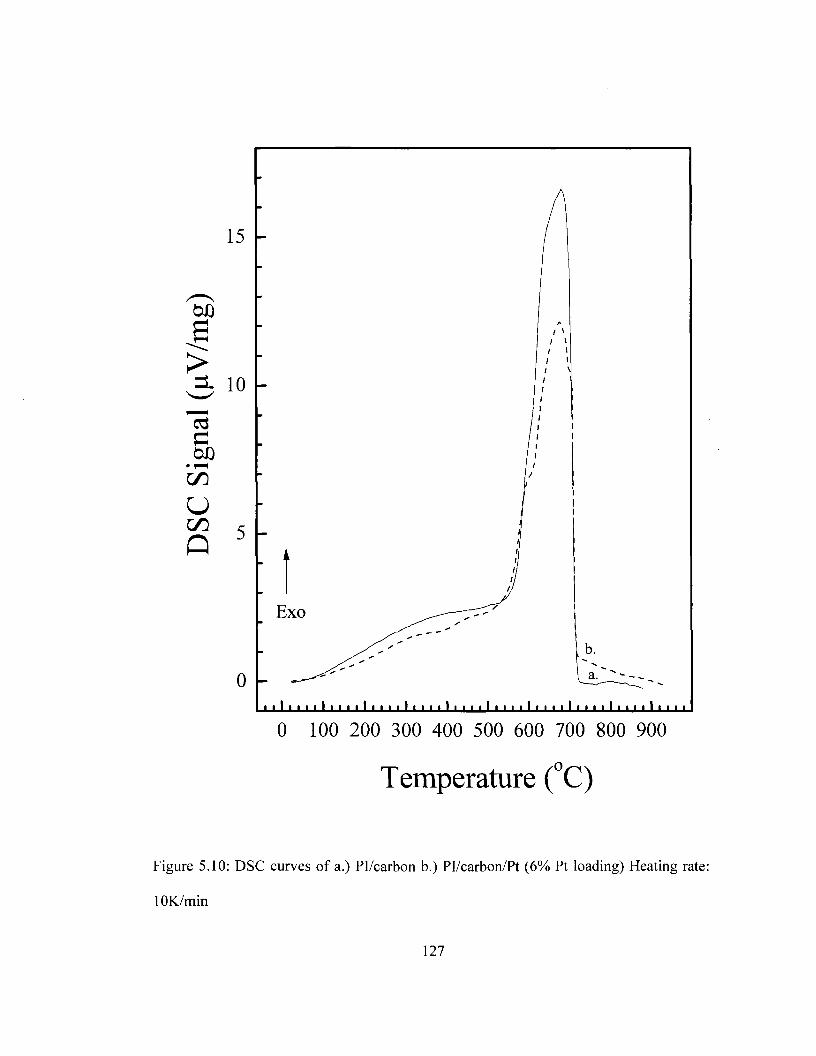
15
10
5
0
_ f i
ii
Exo ^—r^
• • * • • • • * • • • • i • • • • > • • • • * • • • • * • • •
i \
1 i i 1 '
; /
1 i
I i 1 / 1/
i
I
b.
i 1 i i i • 1 i i i i 1 i i i i 1 i i i i
0 100 200 300 400 500 600 700 800 900
Temperature (°C)
0: DSC curves of a.) Pi/carbon b.) Pl/carbon/Pt (6% Pt loading) Heating rate:
127
O
m m
so O N
100
90
80
70
60
50
40
30
20
10
0
L _____
\
1 1 1
1 1
ll 1) ll
-
1 1
1 1 1
TT]
1 1
1
_ 1 _ 1 1 1 1 1 l_.l 1 1 1 l 1 _l_ 1 1 1 1 l 1 1 1 1 l l l 1 1 1 l l l 1 1 1 1
II M 1
| b.
v a-
i 1 i i i i 1 i i i i 1 i i i i
0 100 200 300 400 500 600 700 800 900
Temperature (°C)
Figure 5.11: TGA curves of curves of a.) Pi/carbon b.) Pl/carbon/Pt (6% Pt loading)
Heating rate: lOK/min
128
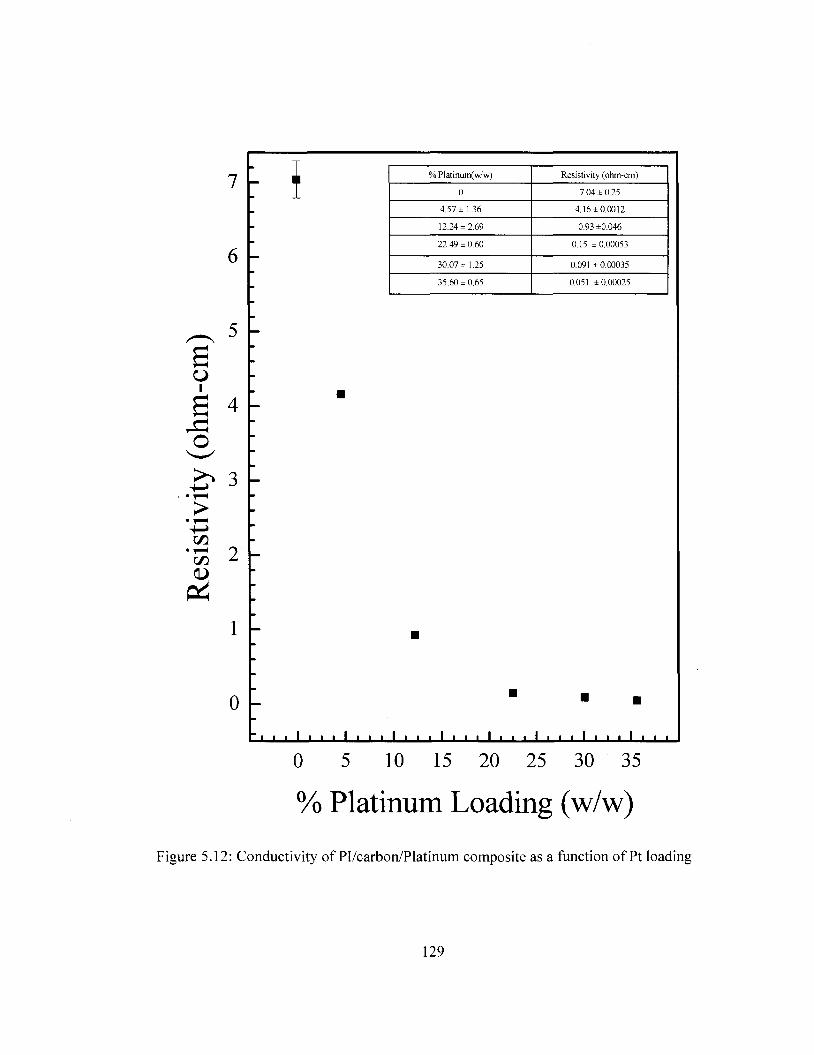
FT % Plalinum(w/w)
0
4.57 ± 1.36
12.24 ±2.69
22.49 ± 0.60
30.07 ±1.25
35.60 ±0.65
Resistivity (ohm-cm)
7.04 ±0.25
4.16±0.0012
0.93 ±0.046
0.15 ±0.00053
0.091 ± 0.00035
0.051 ±0.00025
• • • I . . . I . . . I . . . I . . . I I • • • I • • •
0 5 10 15 20 25 30 35
% Platinum Loading (w/w)
ure 5.12: Conductivity of Pl/carbon/Platinum composite as a function of Pt loadin
129
5.2.7 Estimation of Percent Platinum Content and its Effect on Electrical Conductivity
Platinum loading in the Pl/carbon/Pt composites with a uniform carbon loading of
10% is estimated using TGA. The composite is heated to a temperature of about 900°C
at which all the Pi/carbon organic component of the composite is decomposed. All mass
loss is assigned to the decomposition of the organic component, which is complete at
about 800°C. The remaining mass in the test crucible at the end of the experiment is then
used to estimate the metal content for the composite material. Figure 5.12 represents the
electrical conductivity of the Pl/carbon/Pt composites as a function of platinum loading.
As expected, the electrical conductivity of the composite is enhanced as the amount of
platinum deposited on the composite surface is increased relative to Pi/carbon. A
resistivity of 7.04 ohm-cm is observed for Pi/carbon. This value is higher than 1.42 ohm-
cm observed for a carbon/PI film in Figure 5.3 suggesting that batch-to-batch
conductivity variations might exist. A steady decrease in resistivity is recorded as Pt
loading until a 22% loading is achieved. After this loading, there is minimal improvement
in the conductivity of the Pl/carbon/Pt film. One possible explanation for this plateau is
that at higher Pt loading, the Pt layer becomes the main contributor to the recorded
resistivity of the film because the contacts of the four point probe are preset to contact
and not penetrate the film.
5.2.8 Cyclic Voltammetry of PI/carbon/Gold in the Ferricyanide Redox Couple
As a preliminary test for the electroactivity, freestanding PI/carbon/Au composites
are used to probe the simple electrochemical redox reaction involving the ferricyanide
redox couple. The Ferricyanide redox couple is as follows:
130
Fe(CN)63" + e" <=> Fe(CN)6
4" E°= 0.161V vs. Ag/AgCl [22]
Figure 5.13a shows a cyclic voltammogram of a Pi/carbon film in 0.01M K.2Fe(CN)6 in
1M K.NO3. While the Pi/carbon film shows minimal electroactivity in ferricyanide,
depositing a 100A layer of gold on the film surface by chemical vapor deposition
(PI/carbon/AucvD) leads to enhanced sensitivity in the same solution as shown in Figure
5.13b. Enhanced sensitivity is also observed for Pi/carbon film with gold
electrodeposited on its surfaces by cyclic voltammetry (PI/carbon/AuECHEM) for 5cycles
at O.lV/s Figure 5.13c. For comparison and reference, a planar electrode fabricated from
gold coated mica was also used to probe the same ferricyanide solution and is presented
in Figure 5.13d.
The anodic and cathodic peaks are well defined and appear in equal magnitudes
for all the electrodes, showing that both the forward and reverse reactions of the couple
occur at the surface of the electrode. However, differences can be observed for gold
deposited Pi/carbon films as compared to gold planar electrode. Specifically, shifts in
peak cathodic potentials (Epc) and peak anodic potentials (Epa) can are recorded for
Pi/carbon films relative to the gold planar electrode. The Epc and Epa values for both
Pi/carbon film in the ferricyanide couple are presented in Table 5.4 in addition to those of
a gold planar electrode used as a reference. For the (PI/carbon/Aucvo), the Epc and Epaare
close to values recorded for the gold planar electrode.
The separation between Epa and Epc is denoted as AEp and is an indicator for electron
transfer on the surface of the electrode. Theoretically for a totally reversible nernstian
process, under fast kinetics, AEp is equal to 59.1 mV/n where n is the number of
electrons involved in the redox reaction.
131
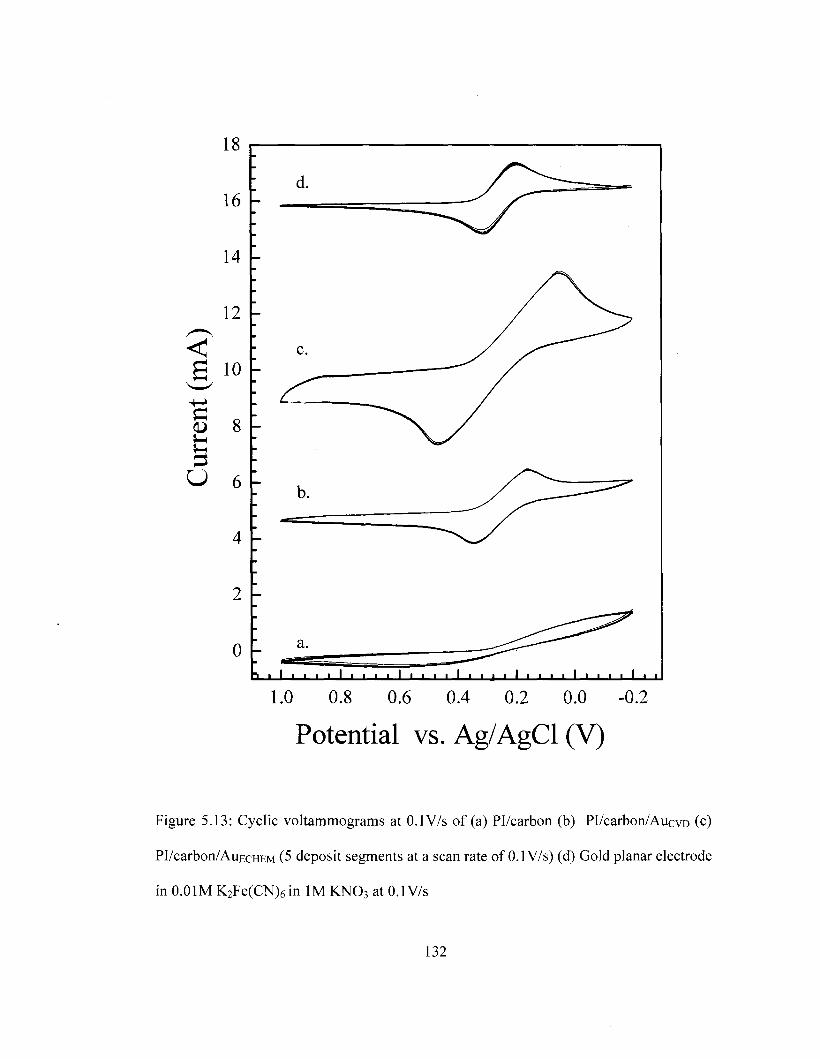
h i I i i • i I i i i i I i i i i I i i i i I i » i i I i i i i I • i
1.0 0.8 0.6 0.4 0.2 0.0 -0.2
Potential vs. Ag/AgCl (V)
Figure 5.13: Cyclic voltammograms at 0.1 V/s of (a) Pi/carbon (b) PI/carbon/AucvD (c)
PI/carbon/AuECHEM (5 deposit segments at a scan rate of 0.1 V/s) (d) Gold planar electrode
in 0.01M K2Fe(CN)6 in 1M KN03 at 0.1 V/s
132
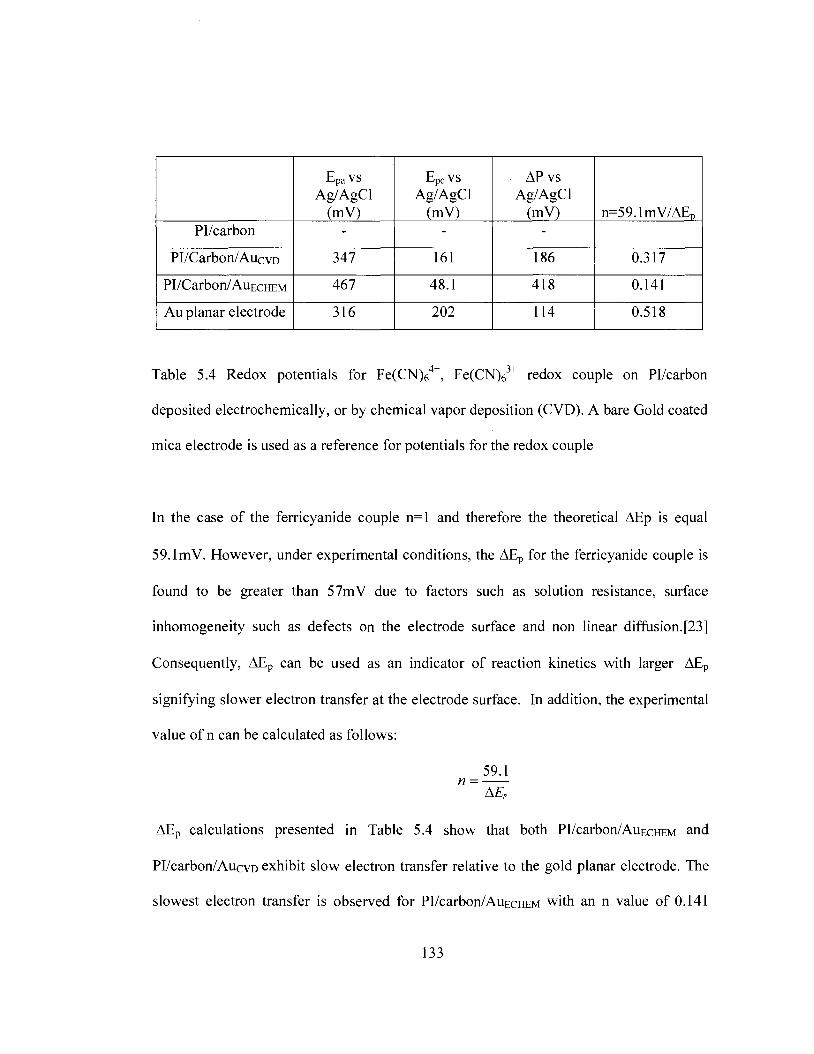
Pi/carbon
PI/Carbon/AucvD
PI/Carbon/AiiECHEM
Au planar electrode
Ep aVS
Ag/AgCl (mV)
-
347
467
316
Epcvs Ag/AgCl
(mV) -
161
48.1
202
APvs Ag/AgCl
(mV) -
186
418
114
n=59.1mV/AEp
0.317
0.141
0.518
Table 5.4 Redox potentials for Fe(CN)6 , Fe(CN)6 redox couple on Pi/carbon
deposited electrochemically, or by chemical vapor deposition (CVD). A bare Gold coated
mica electrode is used as a reference for potentials for the redox couple
In the case of the ferricyanide couple n=l and therefore the theoretical AEp is equal
59.1mV. However, under experimental conditions, the AEP for the ferricyanide couple is
found to be greater than 57mV due to factors such as solution resistance, surface
inhomogeneity such as defects on the electrode surface and non linear diffusion.[23]
Consequently, AEP can be used as an indicator of reaction kinetics with larger AEP
signifying slower electron transfer at the electrode surface. In addition, the experimental
value of n can be calculated as follows:
59.1 n =
AE,
AEP calculations presented in Table 5.4 show that both PI/carbon/AuEcHEM and
PI/carbon/AucvD exhibit slow electron transfer relative to the gold planar electrode. The
slowest electron transfer is observed for PI/carbon/AuECHEM with an n value of 0.141
133
while a value of 0.317 is obtained for PI/carbon/AucvD-
5.3 References
1. Ghosh M.K. and Mittal K.L., eds. Polyimides. 1996, Marcel Dekker: New York.
2. Silverstein, R.M. and Webster, F.X., Spectrometry identification of organic compounds. 1998, New York: John Wiley & Sons.
3. Bart, J.C.J., Plastics Additives: Advanced Industrial Analysis. 2006, Amsterdam IOS Press.
4. Kim, G.-H., Dong, W., Yoon, C.S., and Kim, Y.-H., Synthesis of duplex nanoparticles in polyimide by the reaction ofpolyamic acid with Cu-Zn alloy films. Colloids and Surfaces A: Physicochemical and Engineering Aspects, 2008. 321(1-3): p. 292-296.
5. Zhai, Y., Yang, Q., Zhu, R.Q., and Gu, Y., The study on imidization degree of polyamic acid in solution and ordering degree of its polyimide film. Journal of Materials Science, 2008. 43(1): p. 338-344.
6. Thomas, R.R., Buchwalter, S.L., Buchwalter, L.P., and Chao, T.H., Organic-Chemistry on a Polyimide Surface. Macromolecules, 1992. 25(18): p. 4559-4568.
7. Imai Y., Fueki T., Inoue T., and M-A., K., A New Direct Preparation of Electroconductive Polyimide/Carbon Composite Via Poly condensation of Nylon-Salt Type Monomer/Carbon Black Mixture Journal of Polymer Science: Part A:Polymer Chemistry, 1998. 36: p. 1031-1034.
8. Lin J-S. and Chiu H-T., Preparation and Properties of Conductive Polyimide films. Journal of Polymer Research, 2002. 9: p. 189-194.
9. Narkis, M. and Vaxman, A., Resistivity Behavior Of Filled Electrically Conductive Crosslinked Polyethylene. Journal of Applied Polymer Science, 1984. 29(5): p. 1639-1652.
10. Ghofraniha, M. and Salovey, R., Electrical Conductivity Of Polymers Containing Carbon-black. Polymer Engineering and Science, 1988. 28(1): p. 58-63.
134
11. Zhang W., Dehghani-Sanij, A.A., and Blackburn R.S., Carbon based conductive polymer composites. Journal of Materials Science, 2007. 42: p. 3408-3418.
12. Pantea, D., Darmstadt, H., Kaliaguine, S., and Roy, C , Electrical conductivity of conductive carbon blacks: influence of surface chemistry and topology. Applied Surface Science, 2003. 217(1-4): p. 181-193.
13. Murugaraj, P., Mora-Huertas, N., Mainwaring, D.E., Ding, Y., and Agrawal, S., Influence of thermal stresses on electron transport in carbon-polymer nanocomposite films. Composites Part A: Applied Science and Manufacturing, 2008. 39(2): p. 308-313.
14. Material Safety Data Sheet - Carbon Black - Columbian Chemicals Company. 2007 [cited; Available from: http://www.columbianchemicals.eom/Portals/0/Columbian_Ind_Carbon_English_200 7-07-03.pdf.
15. Kinyanjui, J.M., Wijeratne, N.R., Hanks, J., and Hatchett, D.W., Chemical and electrochemical synthesis of polyaniline/platinum composites. Electrochimica Acta, 2006. 51(14): p. 2825-2835.
16. Bard, A.J. and Faulkner, L.R., Electrochemical Methods. 1980, Hoboken, NJ.: John Wiley & Sons Inc.
17. Rodriguez, J.M.D., Melian, J.A.H., and Pena, J.P., Determination of the real surface area ofPt electrodes by hydrogen adsorption using cyclic voltammetry. Journal of Chemical Education, 2000. 77(9): p. 1195-1197.
18. Aschauer, E., Fasching, R., Urban, G., Nicolussi, G., and Husinsky, W., Surface characterization of thin-film platinum electrodes for biosensors by means of cyclic voltammetry and laser SNMS. Journal of Electroanalytical Chemistry, 1995. 381(1-2): p. 143-150.
19. Bockris, J.O.M., Conway, B.E., and White, R.E., eds. Modern Aspects of Electrochemistry. Vol. 22. 1992, Springer: New York.
20. Bard, A. J., Parsons, R., and Jordan, J., Standard Potentials in Aqueous Solution. 1985, New York: Marcel Dekker.
135
21. Liu, Z., Lee, J.Y., Han, M., Chen, W., and Gan, L.M., Synthesis and Characterization ofPtRu/C Catalysts from Microemulsions and Emulsions. J. Mater. Chem., 2002.12: p. 2453-2458.
22. Lide, D.R., ed. Handbook of Chemistry & Physics 89 ed. 2008, CRC Press: Boca Raton, FL.
23. Ji, X., Banks, C.E., Crossley, A., and Compton, R.G., Oxygenated Edge Plane Sites Slow the Electron Transfer of the Ferro-ZFerricyanide Redox Couple at Graphite Electrodesl3. ChemPhysChem, 2006. 7(6): p. 1337-1344.
136
CHAPTER 6
CONCLUSIONS & FUTURE WORK
A series of analytical tools were developed and used to systematically investigate
and interrelate chemical, physical and mechanical properties of complex functionalized
or modified polymeric systems. Because of their complex chemistry resulting from
modification, complementary techniques and methods were designed to study and
confirm changes in these materials as compared to their parent analogs. A requirement
for the modification is to introduce new functionalities to the parent polymer without
compromising other properties that suit it for the envisioned application. The analytical
tools were geared towards providing information specific to possible changes in these
inherent properties in addition to new properties that result from modification. Based on
the information obtained, applications can be narrowed only to those compatible with the
properties of the modified materials. Furthermore, these applications require to be
tailored in light of the interdependence between the chemical, physical and mechanical
properties in determining the overall properties of the modified material, as evidenced in
this study and in previous work in our laboratory.
Specifically, FTIR analysis of PU foam at the center and side of a mold was
provided for processing temperatures of 25, 45, 65, and 85°C. The FTIR data suggest
that there are two factors that influence the chemical composition of the molded PU
foam. First, thermal gradients in the mold arise as the foam expands in the mold with
137
thermally isolated regions present in the radial direction. These gradients can play a role
in the chemical composition with reactions at the center thermally activated relative to
the side. Degradation of uretoneimine, emergence of carbodiimide, and the degree of
unreacted isocyanate groups as a function of radial position in the mold and thermal
processing temperatures produces morphologically and chemically distinct material
within the same mold. In spite of the uniform and simple geometry of the mold used in
these studies, homogeneity was not achieved at any processing temperature. The side of
the mold was shown to minimize the thermal degradation of uretoneimine, emergence of
carbodiimide, and reaction of isocyanate due to thermal isolation from the center. The
data suggest that thermal gradients in the PU foam mold can influence the chemical and
morphological homogeneity of the PU foam. Specifically, PU foams containing
thermally degradable chemical structures may not be suitable if homogeneity is required
in the final material.
Thermally treated epoxy foams were found to undergo both chemical and
structural changes associated with the degradation of Diels-Alder bonds and changing
structural packing of siloxane units in the adduct. FT1R results show that these changes
are not reversible and occur immediately after thermal exposure. The temperature
required to see irreversible changes in the foam chemistry are much lower (40 °C) than
the temperatures required for degradation of the Diels-Alder bonds (90 °C). Thermal
expansion of the foam occurs at temperatures exceeding the degradation of the Diels-
Alder bond decreasing the overall density of the foam. The combination of changing
chemistry, structure, and thermal expansion lower the overall density of the foam by
approximately 41% relative to the pristine foam. The change in density also influences
138
the modulus of the material which is reduced by 68% after ten thermal cycles. The
results indicate that thermal exposure reduces the rigidity of the material through
chemical and structural changes that cause the foam to expand, lowering the density and
modulus in the process. The changes in density and modulus, even at low temperatures
relative to the breaking of Diels-Alder bonds, suggest that removable epoxy foams may
not be a good alternative for more common PU foams if high stability and structural
rigidity is required.
A composite material was successfully prepared by incorporating carbon black in
PI. Platinum metal was successfully deposited on the resulting Pi/Carbon film using
cyclic voltammetry. Results obtained from four-point probe conductivity measurements
show that increased carbon loading or platinum loading enhances the electrical
conductivity of the composite. However, beyond 10% carbon loading, the mechanical
integrity of the film is compromised. TGA and DSC results show that the thermal
stability of PI is maintained with carbon incorporation and platinum deposition.
Pl/carbon/Pt was found be thermally stable up to 561°C as determined by DSC and
559°C as determined by TGA. SEM imaging suggests that carbon is well dispersed in PI
while XPS results show that the platinum deposited Carbon/PI is metallic. The
deposition of gold on carbon/PI was found to enhance its sensitivity to the ferricyanide
redox couple. However, slower electron transfer is observed at both Pl/Carbon/Pt and
PI/Carbon/Au films as compared to Pt and Au planar electrodes.
Future work planned in the characterization and envisioned applications of
Pl/Carbon/Pt (Pd or Au) composites include:
i. Optimizing the Pi/carbon film preparation procedures. Methods to produce
139
films with uniform thickness and reproducible electrical resistivities should be
explored.
ii. Tensile strength testing to investigate the effect of introducing carbon into the
PI matrix on the tensile strength of PI. For example, introducing Multi walled
carbon nanotubes (MWNTS) into the PI matrix has been shown to enhance the
tensile strength of PI. [1] The optimum film thickness that leads to the highest
tensile strength while maintaining the flexibility of Pi/Carbon could also be
examined.
iii. Determination of optimum Pt loading leading to the highest level of catalytic
activity in Pl/carbon/Pt films prior to testing the films in fuel cell applications.
iv. Improving metal adherence onto Pi/carbon through surface etching prior to
metal deposition. One method that warrants further investigation is KOH
etching which has been shown to provide uniform etching in short periods of
time. [2-4]
v. Investigating composite stability under repeated testing at typical operating
conditions for envisioned device applications. For example, studies on
Pl/Carbon/Pt chemical stability and metal adherence in acidic conditions over
prolonged times periods are required. In addition, the thermal stability of
PI/Carbon/Au envisioned for OFET applications at the elevated FET operating
temperatures caused by heat emitted by the transistor, should be investigated.
vi. Fabrication of actual devices for applications outlined following the completion
of the Pl/carbon/metal composite characterization phase.
140
6.1 References
1. Zhu B-K., Xie S-H., Xu Z-K., and Y-Y, X., Preparation and Properties of the Polyimide/Multi-Wailed Carbon Nanotubes (MWNTs) Nanocomposites. Composites Science and Technology, 2005. 66 p. 548-554.
2. Ranucci, E., Sandgren, A., Andronova, N., and Albertsson, A.C., Improved polyimide/metal adhesion by chemical modification approaches. Journal of Applied Polymer Science, 2001. 82(8): p. 1971-1985.
3. Lee, K.W., Kowalczyk, S.P., and Shaw, J.M., Surface Modification Of PMDA-ODA Polyimide - Surface-Structure Adhesion Relationship. Macromolecules, 1990. 23(7): p. 2097-2100.
4. Huang, X.D., Bhangale, S.M., Moran, P.M., Yakovlev, N.L., and Pan, J.S. Surface modification studies of Kapton (R) HN polyimide films. 2003: John Wiley & Sons Ltd.
141
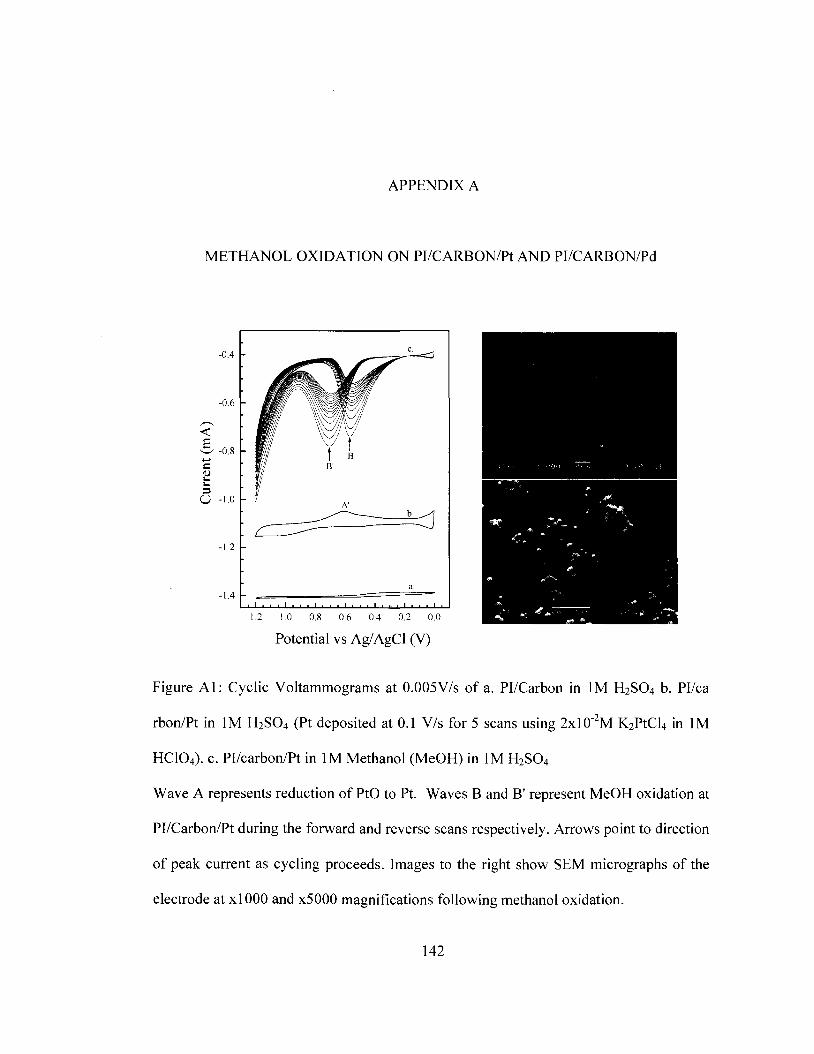
APPENDIX A
METHANOL OXIDATION ON PI/CARBON/Pt AND PI/CARBON/Pd
Potential vs Ag/AgCl (V)
Figure Al: Cyclic Voltammograms at 0.005V/s of a. Pi/Carbon in 1M H2S04 b. Pl/ca
rbon/Pt in 1M H2S04 (Pt deposited at 0.1 V/s for 5 scans using 2xlO~2M K2PtCl4 in 1M
HC104). c. Pl/carbon/Pt in 1M Methanol (MeOH) in 1M H2S04
Wave A represents reduction of PtO to Pt. Waves B and B' represent MeOH oxidation at
Pl/Carbon/Pt during the forward and reverse scans respectively. Arrows point to direction
of peak current as cycling proceeds. Images to the right show SEM micrographs of the
electrode at xlOOO and x5000 magnifications following methanol oxidation.
142

Potential vs. Ag/AgCl (V)
Figure A2: Cyclic Voltammograms at 0.005V/s of a. Pi/Carbon in 1M KOH b.
Pl/carbon/Pd in 1M KOH (Pd deposited at 0.1 V/s for 5 scans using 2xlO"2M K2PdCl4 in
1M HCIO4). c. Pl/carbon/Pd in 1M Methanol (MeOH) in 1M KOH
Waves A and A' represent MeOH oxidation at Pl/Carbon/Pd during the forward and
reverse scans respectively. Arrows point to direction of peak current as cycling proceeds.
Images to the right show SEM micrographs of the electrode at xlOOO and x4500
magnifications following methanol oxidation.
143
VITA
Graduate College University of Nevada, Las Vegas
John Macharia Kinyanjui
Local Address: 5223 Caspian Springs Drive #102 Las Vegas, Nevada 89120
Home Address: P.O. Box 2983 Nakuru, Kenya
Degrees: Bachelor of Science, Chemical Engineering and Chemistry, 1999 Geneva College, Beaver Falls, Pennsylvania
Master of Science, Chemistry, 2003 University of Nevada, Las Vegas
Special Awards: Recipient, Nowak-Notre Dame Award to the Most Outstanding Graduate Student for Excellence in Chemistry, Department of Chemistry, University of Nevada, Las Vegas, 2007-2008
Recipient, Merriman Academic Scholarship, Department of Chemistry, Geneva College, 1997-1999.
Publications: 1. Jang, K.; Kinyanjui, J.M.; Hatchett, D.W.; Lee, D-C. Morphological Control of
One-Dimensional Nano structures of T-Shaped Asymmetric Bisphenazine via Cyanophenyl interactions. In Press. Chemistry of Materials.
2. Mohan, R.B.; O'Toole B.J.; Malpica, J.; Hatchett D.W.; Kodippili G.; and Kinyanjui J.M. Effects of Processing Temperature on ReCrete Polyurethane Foam. Journal of Cellular Plastics 2008; 44: 327-345.
3. Hatchett, DW; Kinyanjui, J. M; Sapochak, L. FTIR Analysis of Chemical Gradients in Thermally Processed Molded Polyurethane Foam. Journal of Cellular Plastics 2007; 43, 183-196.
4. Hatchett; Kinyanjui, J. M. PtCli' andPtCl/' Reduction in Polyaniline: Methanol Oxidation at Morphologically Different Composites. ECS Transactions; 2006; 3 (12), 13-19.
5. Hatchett, D.W; Wijeratne, N. R; Kinyanjui, J. M. Reduction ofPtClt andPtCl/' in Polyaniline: Catalytic Oxidation of Methanol at Morphologically Different Composites. Journal of Electroanalytical Chemistry; 2006; 593, 203-210.
144
6. Kinyanjui, J. M.; Wijeratne, N. R; Hatchett, D.W. Comparison of Chemically and Electrochemically Formed Poly aniline Platinum Composites. Electrochimica Acta; 2006; 51(14), 2825-2835.
7. Hatchett, DW; Kodippili, G; Kinyanjui, J. M; Benincasa, F.; Sapochak, L. FTIR Analysis of Thermally Processed PU Foam. Polymer Degradation and Stability; 2005; 87(3), 555-561.
8. Hatchett, D.W; Kinyanjui, J. M.; Smith, A. J.; Josowicz, M. Chemical Synthesis of Poly aniline/Gold Composite using Tetrachloroaurate. Polymer Preprints; 2004; 45(1), 143.
9. Kinyanjui, J. M ; Harris-Burr, R.; Wagner, J. G.; Wijeratne, N. R.; Hatchett, D. W.; A Hexachloroplatinate-Initiated Synthesis of Polyaniline/Platinum Composite. Macromolecules; 2004; 37(23); 8745-8753.
10. Kinyanjui, J. M.; Hatchett, D.W; Smith, A. J.; Josowicz, M. Chemical Synthesis of a Polyaniline/Gold Composite using Tetrachloroaurate. Chem. Mater; 2004; 16(17), 3390-3398.
11. Kinyanjui, J. M.; Hatchett, D.W.; Hanks, J.; Smith, A. J.; Josowicz, M. Chemical and Electrochemical Synthesis of Polyaniline/Gold Composites. J. Electrochem. Soc.;2004; 151 (12), D113-D120.
Dissertation Title: The Synthesis and Systematic Evaluation of Modified Polymeric Foams and Electrically Conductive Polyimide/Carbon/Metal Films
Dissertation Examination Committee: Chairperson, Dr. David W. Hatchett, Ph.D. Committee Member, Dr. Clemens Heske, Ph.D. Committee Member, Dr. Spencer Steinberg, Ph.D. Graduate College Representative, Dr. Brendan O'Toole, Ph.D.
145