The Stem Species of Our Species: A Place for the Archaic Human Cranium from Ceprano, Italy
11
The Stem Species of Our Species: A Place for the Archaic Human Cranium from Ceprano, Italy Aure ´ lien Mounier 1 , Silvana Condemi 1 , Giorgio Manzi 2,3 * 1 Unite ´ Mixte de Recherche 6578 – Unite ´ d’Anthropologie Bioculturelle, Centre National de la Recherche Scientifique/Universite ´ de la Me ´ diterrane ´ e/Etablissement Franc ¸ais du Sang, Marseille, France, 2 Dipartimento di Biologia Ambientale, Sapienza - Universita ´ di Roma, Roma, Italia, 3 Istituto Italiano di Paleontologia Umana, Roma, Italia Abstract One of the present challenges in the study of human evolution is to recognize the hominin taxon that was ancestral to Homo sapiens. Some researchers regard H. heidelbergensis as the stem species involved in the evolutionary divergence leading to the emergence of H. sapiens in Africa, and to the evolution of the Neandertals in Europe. Nevertheless, the diagnosis and hypodigm of H. heidelbergensis still remain to be clarified. Here we evaluate the morphology of the incomplete cranium (calvarium) known as Ceprano whose age has been recently revised to the mid of the Middle Pleistocene, so as to test whether this specimen may be included in H. heidelbergensis. The analyses were performed according to a phenetic routine including geometric morphometrics and the evaluation of diagnostic discrete traits. The results strongly support the uniqueness of H. heidelbergensis on a wide geographical horizon, including both Eurasia and Africa. In this framework, the Ceprano calvarium – with its peculiar combination of archaic and derived traits – may represent, better than other penecontemporaneous specimens, an appropriate ancestral stock of this species, preceding the appearance of regional autapomorphic features. Citation: Mounier A, Condemi S, Manzi G (2011) The Stem Species of Our Species: A Place for the Archaic Human Cranium from Ceprano, Italy. PLoS ONE 6(4): e18821. doi:10.1371/journal.pone.0018821 Editor: John H. Relethford, State University of New York College at Oneonta, United States of America Received December 27, 2010; Accepted March 10, 2011; Published April 20, 2011 Copyright: ß 2011 Mounier et al. This is an open-access article distributed under the terms of the Creative Commons Attribution License, which permits unrestricted use, distribution, and reproduction in any medium, provided the original author and source are credited. Funding: This research was partly supported by resources of the Sapienza - University of Rome and co-financed by the Italian Ministry of University and Research (MIUR), including grants for Progetti di Rilevante Interesse Nazionale (PRIN). The funders had no role in study design, data collection and analysis, decision to publish, or preparation of the manuscript. Competing Interests: The authors have declared that no competing interests exist. * E-mail: [email protected] Introduction Human fossil discoveries, such as those of the Sierra de Atapuerca, Spain [1,2], have revealed the evidence for the presence of hominins in Europe well before 500 ka, in contradiction with the so-called ‘‘short chronology’’ model [3]. For more than a decade, the adult calvarium found near Ceprano in southern Latium, Italy [4] supported this view, par- ticularly in account of its archaic morphology [4,5], its possible relationship with Oldowan Palaeolithic assemblages from the same area [6], and its supposed dating to 800-900 ka [4,7]. Recently, however, the site has been re-dated on the basis of multidisciplinary investigations to the mid of the Middle Pleistocene, between 430 and 385 ka [8,9]. By contrast, the peculiar morphology of the Ceprano calvarium has no equivalent in Europe or elsewhere and its taxonomic status has been so far controversial, being alternatively viewed as a ‘‘late’’ H. erectus [4,10], a possible adult individual of H. antecessor [5], or the holotype of a new species named H. cepranensis [11]. A number of studies [5,12–14] also highlighted phenetic links with Mid- Pleistocene fossils from Africa (e.g. Kabwe 1) and Europe (e.g. Petralona), identifying Ceprano as the possible representative of an ancestral stock of H. heidelbergensis [15]. At the same time, despite the diagnosis and the hypodigm of H. heidelbergensis are still to be clarified [16-19], this species could represent the taxon of origin of the divergence between two distinct lineages of the Middle Pleistocene [20,21]: those of the Neanderthals in Europe and H. sapiens in Africa. We argue that the morphology of Ceprano, in view of the new proposed chronology, may help to better evaluate the significance of H. heidelbergensis for human evolution [21]. Thus, our aim here is to reconsider Ceprano in a wide comparative framework. An original phenetic routine [18,19] (see [Methods]) – based on both geometric morphometrics and the scoring of morphological features – was performed to evaluate the taxonomic status of this specimen with respect to samples grouped as Early Pleistocene fossils (H. ergaster and/or H. erectus), Mid-Pleistocene hominins usually referred to H. heidelbergensis, Neandertals, and anatomically modern humans. Overall, Ceprano has been compared to 42 fossils from Africa and Eurasia ranging from ,1.8 Ma to ,12 ka (Table 1) and to 68 Holocene modern humans (see, Table S1). A comparison of the Ceprano calvarium with such an extensive sample, especially considering the H. neanderthalensis and H. sapiens specimens, was never carried out before [5,14]. Results Geometric morphometrics (shape analysis) The M Box test results (M = 68.660, F = 0.945, ddl1 = 42, ddl2 = 860.99, p = 0.572) indicates that the covariance matrices are homogenous, and therefore a linear Discriminant Function Analysis (DFA) is appropriate. The first discriminant function (F1) of the DFA accounts for 80.9% of the total variance; it clearly separates the three predefined groups (i.e. modern humans, Neandertals and Early Pleistocene fossils). The second function (F2: 19.9% of variance) PLoS ONE | www.plosone.org 1 April 2011 | Volume 6 | Issue 4 | e18821
Transcript of The Stem Species of Our Species: A Place for the Archaic Human Cranium from Ceprano, Italy
The Stem Species of Our Species: A Place for the ArchaicHuman Cranium from Ceprano, ItalyAurelien Mounier1, Silvana Condemi1, Giorgio Manzi2,3*
1 Unite Mixte de Recherche 6578 – Unite d’Anthropologie Bioculturelle, Centre National de la Recherche Scientifique/Universite de la Mediterranee/Etablissement Francais
du Sang, Marseille, France, 2 Dipartimento di Biologia Ambientale, Sapienza - Universita di Roma, Roma, Italia, 3 Istituto Italiano di Paleontologia Umana, Roma, Italia
Abstract
One of the present challenges in the study of human evolution is to recognize the hominin taxon that was ancestral toHomo sapiens. Some researchers regard H. heidelbergensis as the stem species involved in the evolutionary divergenceleading to the emergence of H. sapiens in Africa, and to the evolution of the Neandertals in Europe. Nevertheless, thediagnosis and hypodigm of H. heidelbergensis still remain to be clarified. Here we evaluate the morphology of theincomplete cranium (calvarium) known as Ceprano whose age has been recently revised to the mid of the MiddlePleistocene, so as to test whether this specimen may be included in H. heidelbergensis. The analyses were performedaccording to a phenetic routine including geometric morphometrics and the evaluation of diagnostic discrete traits. Theresults strongly support the uniqueness of H. heidelbergensis on a wide geographical horizon, including both Eurasia andAfrica. In this framework, the Ceprano calvarium – with its peculiar combination of archaic and derived traits – mayrepresent, better than other penecontemporaneous specimens, an appropriate ancestral stock of this species, preceding theappearance of regional autapomorphic features.
Citation: Mounier A, Condemi S, Manzi G (2011) The Stem Species of Our Species: A Place for the Archaic Human Cranium from Ceprano, Italy. PLoS ONE 6(4):e18821. doi:10.1371/journal.pone.0018821
Editor: John H. Relethford, State University of New York College at Oneonta, United States of America
Received December 27, 2010; Accepted March 10, 2011; Published April 20, 2011
Copyright: � 2011 Mounier et al. This is an open-access article distributed under the terms of the Creative Commons Attribution License, which permitsunrestricted use, distribution, and reproduction in any medium, provided the original author and source are credited.
Funding: This research was partly supported by resources of the Sapienza - University of Rome and co-financed by the Italian Ministry of University and Research(MIUR), including grants for Progetti di Rilevante Interesse Nazionale (PRIN). The funders had no role in study design, data collection and analysis, decision topublish, or preparation of the manuscript.
Competing Interests: The authors have declared that no competing interests exist.
* E-mail: [email protected]
Introduction
Human fossil discoveries, such as those of the Sierra de
Atapuerca, Spain [1,2], have revealed the evidence for the presence
of hominins in Europe well before 500 ka, in contradiction with the
so-called ‘‘short chronology’’ model [3].
For more than a decade, the adult calvarium found near
Ceprano in southern Latium, Italy [4] supported this view, par-
ticularly in account of its archaic morphology [4,5], its possible
relationship with Oldowan Palaeolithic assemblages from the
same area [6], and its supposed dating to 800-900 ka [4,7].
Recently, however, the site has been re-dated on the basis of
multidisciplinary investigations to the mid of the Middle
Pleistocene, between 430 and 385 ka [8,9]. By contrast, the
peculiar morphology of the Ceprano calvarium has no equivalent
in Europe or elsewhere and its taxonomic status has been so far
controversial, being alternatively viewed as a ‘‘late’’ H. erectus
[4,10], a possible adult individual of H. antecessor [5], or the
holotype of a new species named H. cepranensis [11]. A number of
studies [5,12–14] also highlighted phenetic links with Mid-
Pleistocene fossils from Africa (e.g. Kabwe 1) and Europe (e.g.
Petralona), identifying Ceprano as the possible representative of
an ancestral stock of H. heidelbergensis [15]. At the same time,
despite the diagnosis and the hypodigm of H. heidelbergensis are still
to be clarified [16-19], this species could represent the taxon of
origin of the divergence between two distinct lineages of the
Middle Pleistocene [20,21]: those of the Neanderthals in Europe
and H. sapiens in Africa.
We argue that the morphology of Ceprano, in view of the new
proposed chronology, may help to better evaluate the significance
of H. heidelbergensis for human evolution [21]. Thus, our aim here is
to reconsider Ceprano in a wide comparative framework. An
original phenetic routine [18,19] (see [Methods]) – based on both
geometric morphometrics and the scoring of morphological
features – was performed to evaluate the taxonomic status of this
specimen with respect to samples grouped as Early Pleistocene
fossils (H. ergaster and/or H. erectus), Mid-Pleistocene hominins
usually referred to H. heidelbergensis, Neandertals, and anatomically
modern humans. Overall, Ceprano has been compared to 42
fossils from Africa and Eurasia ranging from ,1.8 Ma to ,12 ka
(Table 1) and to 68 Holocene modern humans (see, Table S1). A
comparison of the Ceprano calvarium with such an extensive
sample, especially considering the H. neanderthalensis and H. sapiens
specimens, was never carried out before [5,14].
Results
Geometric morphometrics (shape analysis)The M Box test results (M = 68.660, F = 0.945, ddl1 = 42,
ddl2 = 860.99, p = 0.572) indicates that the covariance matrices
are homogenous, and therefore a linear Discriminant Function
Analysis (DFA) is appropriate.
The first discriminant function (F1) of the DFA accounts for
80.9% of the total variance; it clearly separates the three
predefined groups (i.e. modern humans, Neandertals and Early
Pleistocene fossils). The second function (F2: 19.9% of variance)
PLoS ONE | www.plosone.org 1 April 2011 | Volume 6 | Issue 4 | e18821

Table 1. Specimens included in the analytical protocol.
Specimens Chronology Site Analyses Labels Figure 2
Early Pleistocene
D2280 1.8160.05 Ma Dmanisi, Georgia HC p, GM 1
D2700 1.8160.05 Ma Dmanisi, Georgia HC p, GM 2
KNM-ER 1470 ,1.8 Ma East Turkana, Kenya GM 3
KNM-ER1813 1.8660.08 Ma East Turkana, Kenya. HC g+p, GM 4
KNM-ER 3733 ,1.6 Ma East Turkana, Kenya HC g+p, GM 5
KNM-ER 3883 ,1.6 Ma East Turkana, Kenya HC g+p, GM 6
OH9 .1.47 Ma Olduvai Gorges, Tanzania HC p -
BOU-VP-2/66 ,1.0 Ma Bouri, Ethiopia HC p -
Sangiran 17 1-1.5 Ma Java, Indonesia HC p, GM 7
Middle Pleistocene
Ceprano 900-450 ka Ceprano, Italy HC p, GM -
SH5 350-530 ka Sima de los Huesos, Atapuerca, Spain HC g+p, GM -
Petralona 150-250 ka Petralona, Greece HC g+p, GM -
Steinheim 250 ka Steinheim, Germany HC g+p, GM -
Ehringsdorf H 230 ka Ehringsdorf, Germany GM -
Irhoud 1 130-190 ka Jebel Irhoud, Morocco HC g+p, GM -
Kabwe 1 .125 ka Kabwe, Zambia HC g+p, GM -
LH 18 129-108 ka Laetoli, Tanzania HC g+p, GM -
Omo II ,130 ka Omo Kibish, Ethiopia HC p+g -
Singa 13362 ka Singa, Soudan HC g+p, GM -
ZH Skull III (ZH III) 400-780 ka Zhoukoudian, China HC g+p, GM -
ZH Skull XII (ZH XII) 400-780 ka Zhoukoudian, China HC p, GM -
Hexian 412625 ka Hexian, China GM
Dali 260-300 ka Dali, China HC g+p, GM -
Jinniu Shan 200 ka Jinniu Shan, China HC g+p, GM -
Late Pleistocene
Ngandong 6 (Ng 6) 40-200 ka Java, Indonesia HC g+p, GM -
Ngandong 14 (Ng 14) 40-200 ka Java, Indonesia HC g+p, GM -
Ngawi 1 ,40 ka Java, Indonesia HC p, GM -
Saccopastore 1 100-130 ka Saccopastore, Italy GM 8
Gibraltar 1 45-70 ka Forbe’s Quarry, Gibraltar HC p, GM -
La Ferrassie1 53-66 ka La Ferrassie, France HC g+p, GM 9
La Quina H5 ,65 ka La Quina, France HC p -
La Chapelle-aux-Saints ,50 ka La Chapelle-aux-Saints, France HC g+p, GM 10
Guattari 1 52612 ka Monte-Circeo, Italy HC g+p, GM 11
Spy 1 .36 ka Spy, Belgium HC g+p, GM 12
Tabun I 122616 ka Tabun, Israel GM 13
Amud 1 50-60 ka Amud, Israel GM 14
Cro-Magnon I 28 ka Les Eyzies, France HC g+p -
Abri Pataud 1 22 ka Les Eyzies, France HC g+p, GM 15
Chancelade ,12 ka Chancelade, France HC g+p, GM 16
Qafzeh 9 100-130 ka Qafzeh, Israel HC p, GM 17
Qafzeh 6 90-130 ka Qafzeh, Israel GM 18
Skhul V 66-102 ka Skhul, Israel HC g+p, GM 19
Ohalo II 19 ka Ohalo, Israel HC g+p, GM 20
Holocene
Hassi-el-Abiod (N = 6) 69706130 BP Sahara, Mali HC g+p, GM -
Loisy-en-Brie (N = 12) 37406120 BP Loisy-en-Brie, France HC g+p, GM -
Spitalfields (N = 10) XVII-XIX centuries London, United Kingdom HC g+p, GM -
A Place for the Archaic Human Cranium from Ceprano
PLoS ONE | www.plosone.org 2 April 2011 | Volume 6 | Issue 4 | e18821

more distinctly isolates the Neandertals. Wilks’ lambda is
significant (F1: Wilk’s l= 0.030, chi-square = 103.894, df = 12,
p,0.0001; F2: Wilk’s l= 0.309, chi-square = 34.663, df = 5, p,
0.0001) along both the first and second functions suggests that the
variable can be used to distinguish between the groups.
Linear regressions (PC1: R2 = 0.013, p = 0.419; PC2: R2 =
0.041, p = 0.151; PC3: R2 = 0.001, p = 0.891; PC4: R2 = 0.055;
p = 0.094; PC5: R2 = 0.057, p = 0.089; PC6: R2 = 0.008, p = 0.525)
indicate that centroid size does not significantly impact specimens’
shape (see, Table S8). Thus, differences in shape between
specimens are not due to allometry.
The F1 is responsible for most of the dispersion of the cloud of
points (Figure 1A). Neandertals and modern humans groups
slightly overlap at the centre of the chart while Early Pleistocene
specimens are better segregated. It is due to the large dispersion of
the modern human group on F1. H. sapiens fossil specimens tend to
be positioned well within or at the lower left margin of the recent
human cloud of points, while Qafzeh 6, Skhul V and Chancelade
show similarities with the Neandertal shape. Saccopastore 1 shows
extremes values compare to other Neandertals for both functions,
while Tabun I and Guattari I are separated from the other
Neandertals on F1. Early Pleistocene specimens are quite
homogeneous on F1. The African and Dmanisi specimens show
strong similarities in their shape, while Sangiran 17 is more
isolated especially on F2.
We can elaborate on the distributions of calvaria shape among
hominins if we look at Figure 1B. Extreme shapes for modern
humans show an expansion of the calvaria in all dimensions: the
vault is higher, wider and slightly longer. The supra-orbital region
appears to display a weak projection and the linea temporalis
insertions on the frontal and parietal are relatively lower. The
Neandertals are characterized by a cranial vault slightly lower
(bregma, landmark #4) and lengthen (opisthocranion, #2). Post-
orbital region is concave: projecting in its medial part (nasion, #6)
and is retreating laterally (fronto-malare orbital, #7). There is
almost no post-orbital constriction. The occipital and parietal are
Figure 1. Discriminant Function Analysis based on landmarks data (A) and associated cranial shapes (B). A) Crosses indicate centroıdsof each a priori sample. Red spheres = modern humans (plain, fossil specimens; stripe, Holocene specimens); blue spheres = Neandertals; greenspheres = Early Pleistocene composite sample (plain, African specimens; stripe, Eurasian specimens); gray spheres = fossils included a posteriori inthe analysis (stripe spheres are specimens that cluster with Ceprano in the dendrograms of Figure 2). B) The configuration of landmarks is indicatedby yellow circles superimposed on views of the Ceprano cranium (full, visible landmarks; empty, landmarks non visible in the current view); shapes innorma lateralis (upper left), norma verticalis (lower left) and norma facialis (right) are portrayed for the extremities of each axis (full lines, shapechange; dashed lines, consensus). Modern humans, Neandertals and Early Pleistocene specimens are well-discriminated on Function 1. Function 2discriminates modern humans and Early Pleistocene specimens from Neandertals. The architectural shape of Ceprano is closer to Early Pleistocenespecimens and, particularly, to Sangiran 17 from Java (7). Due to the apparent deformation of both Steinheim and Jinniushan, their respectivepositions in the graph are at least questionable.doi:10.1371/journal.pone.0018821.g001
Specimens Chronology Site Analyses Labels Figure 2
Romania (N = 10) XIX century Romania HC g+p, GM -
China (N = 10) XX century Chine – Tibet HC g+p, GM -
Java (N = 10) XX century Java – Maduras HC g+p, GM -
Nigeria (N = 10) XX century Nigeria HC g+p, GM -
Bold types indicate when original fossil was examined. Column ‘‘Analyses’’ indicates in which analyses the specimens were included: HC: hierarchical classification, g:general analysis, p: partial analysis; GM geometric morphometrics.doi:10.1371/journal.pone.0018821.t001
Table 1. Cont.
A Place for the Archaic Human Cranium from Ceprano
PLoS ONE | www.plosone.org 3 April 2011 | Volume 6 | Issue 4 | e18821

more developed (asterion, #12) with a medially positioned euryon
on the parietal which results in the characteristic ‘‘en bombe’’ form
of the Neandertal calvaria in norma occipitalis. Early Pleistocene
fossils show a lower calvaria, an almost straight post-orbital region
with strong lateral and forward developments (nasion #6, and
fronto-malare orbital #7). There is a strong post-orbital
constriction and the insertions of the linea temporalis are in a high
position on the frontal and parietal. The parietal is weakly
developed notably due to the forward and high position of the
lambda (#3), and the planum occipitale is well-developed with almost
coincident inion (#1) and opisthocranion (#2).
The position on the scatter plot of other specimens (i.e.
Ceprano, Mid-Pleistocene fossils and late H. erectus) has been
calculated a posteriori. Ceprano does not present particular affinities
with Mid-Pleistocene specimens and is most similar to Early
Pleistocene specimens, especially to Sangiran 17. Ngandong fossils
too show strong similarities with Early Pleistocene fossils, as it is
the case for the shape of Asian fossils from Zhoukoudian and
Hexian. Also, late Mid-Pleistocene fossils show important
similarities with modern humans for the African (LH 18, Jebel
Irhoud 1 and Singa) and with Neandertals for the European
(Ehringsdorf H). Surprisingly, Steinheim seems to display
similarities with modern humans, and Jinniu Shan with Neander-
tals. Finally, Petralona and Dali are similar to each other and are
quite similar to Early Pleistocene specimens. This is also the case
for Kabwe 1 although its shape is more transitional between Early
Pleistocene specimens and modern humans. Kabwe 1 shares
similarities with Dali and SH5, which in turn resembles much to
Neandertals (Figure 1).
Morphology (scored morphological features)The dendrogram from the global analysis (50 morphological
features, Figure 2A, for more details see Figure S3A) displays a
clear separation between the cluster which includes al modern
humans and the other specimens based on chi-square dissimilarity
index and which indicates a high degree of dissimilarity
(dissimilarity value = 0.334). The second node clearly segregates
Neandertals from other Middle and Early Pleistocene specimens,
as well as from Ngandong fossils (dissimilarity value = 0.142)
(Figure 2A). The next most discriminating node distinguishes Mid-
Pleistocene specimens from Early Pleistocene and Asiatic H. erectus
specimens (dissimilarity value = 0.083). African fossils from late
Middle Pleistocene (Omo II and Jebel Irhoud 1) and Skhul V are
part of the main modern humans cluster. The Ceprano cranium
clusters with Mid-Pleistocene specimens. This group highest value
of dissimilarity is 0.049 which corresponds to the separation of
Jinniu Shan, SH5 and Steinheim from Kabwe 1, Ceprano, Dali
and Petralona. Ceprano shows a strong association with Petralona
and Dali (dissimilarity value 0.020) while Dali and Petralona
present the lowest dissimilarity value of the cluster (0.015). Finally
Figure 2. Hierarchical classification based on discrete features: general (A) and partial (B) analyses. Branches and number at nodesexpress morphological distance between clusters. Numbers represent groups of specimens that are displayed as clusters (A: Irhoud 1, Skhul V; B: 4Holocene specimens; C: 13 Holocene specimens; D: Singa, Cro-Magnon I, Abri Pataud 1, Chancelade, Ohalo II, 35 Holocene specimens; E: Spy 1, LaChapelle-aux-Saints; F: 14 Holocene specimens; G: Singa, LH 18, Cro-Magnon I, Ohalo II, 18 Holocene specimens; H: Irhoud 1, Skhul V; I: Qafzeh 9, AbriPataud 1, Chancelade, 35 Holocene specimens, see Figure S3 for details). Each cluster is described by statistically significant morphological features:pertinence criterion: T-Values.2 at p,0.05 (Tables 2, 3 and Table S15). The Partial analysis (B) allowed the inclusion of 8 additional specimens (Qafzeh9, Gibraltar 1, La Quina H5, Ngawi 1, OH9, D2280, D2700 and Daka); 13 morphological features not preserved on these specimens (2, 10, 14, 15, 16, 18,25, 26, 40, 41, 43, 47, 50) are not used in this analysis. In both analyses, Early Pleistocene specimens and H. erectus sensu stricto (China and Java) aredistinguished as two sub-groups of the same cluster; modern humans are separated from all the other samples, but close to African late Mid-Pleistocene specimens such as Jebel Irhoud 1, Omo II, LH18, and Singa; Ceprano is always part of a the Mid-Pleistocene cluster, with African andEurasian fossils.doi:10.1371/journal.pone.0018821.g002
A Place for the Archaic Human Cranium from Ceprano
PLoS ONE | www.plosone.org 4 April 2011 | Volume 6 | Issue 4 | e18821

African Early Pleistocene specimens (i.e., KNM-ER 3733, KNM-
ER 3883 and KNM-ER 1813) are separated from Asian H. erectus
(i.e., ZH III, Ng 6 and 14) (Figure 2A).
39 morphological features can be identified as statistically
significant (p,0.05) for the description of the modern humans
cluster while 19 morphological features are associated with the
Neandertal cluster. Neandertal and modern humans clusters are
described by well recognize morphological features which are
often used to define these two species (e.g. absence of torus
occipitalis transversus, well-developed tuber parietale and tuber
frontale, auditory meatus positioned under the processus zygo-
maticus temporalis for modern humans; presence of an occipital
bun, presence of a suprainiac fossa, auditory meatus aligned with
the processus zygomaticus temporalis for Neandertals; see Table
S15). The Ceprano’s cluster is characterized by 23 statistically
significant morphological features (e.g. incomplete sulcus supraor-
bitalis, medially concave supra-orbital region in norma verticalis,
medially shifted tuber frontale, presence of a torus angularis
parietalis, intermediate position of the auditory meatus with regard
to the processus zygomaticus temporalis), while 31 morphological
features describe the Early Pleistocene and Asiatic H. erectus cluster
(Table 2). As we emphasized, Ceprano shows strong similarities
with Mid-Pleistocene specimens. Therefore, we may offer the
inclusion of Ceprano among a possible taxon which will include a
regrouping of African and European Mid-Pleistocene fossil
specimens as well as more recent Asiatic specimens (i.e., Dali
and Jinniu Shan).
The partial analysis (Figure 2B, for more details see Figure S3B)
was undertaken following the exclusion of 13 variables (see,
[Methods]) that are not preserved or not available for Early
Pleistocene specimens (D2280, D2700, Daka, OH9). First, there
are no major changes concerning the Neandertals and modern
humans clusters (Figure 2B). As in the general analysis, African
specimens from the late Middle Pleistocene (Omo II, LH18, Singa
and Jebel Irhoud 1) are part of the main modern humans cluster
(Figure 2B). The Ceprano calvarium shows strong similarities with
Mid-Pleistocene specimens, especially with the Dali cranium, but
also with the fossil from Sima de los Huesos (i.e. SH5). The highest
dissimilarity value for this group is lower than in the general
analysis (0.030). There is little change concerning the set of
morphological features that is significant for the description of the
Ceprano cluster: the presence of a weakly-delineated suprainiac
fossa and of a processus retromatsoideus are substituted by the
presence of medially positioned tuber parietale (Table 3). Asian
specimens referred to H. erectus (Zhoukoudian, Ngandong and
Ngawi specimens) are discriminated from all Early Pleistocene
African specimens. This cluster also includes the Georgian fossils
from Dmanisi as well as the Daka cranium, which shares
similarities with OH9 and KNM-ER 3883. Compared to the
general analysis, the presence of a processus retromatoideus and a
straight anterior border of the temporal squama are absent from
the list describing this cluster. On the other hand, the set of
morphological features includes a low temporal squama and a
straight supra-orbital region in norma facialis as well as two
character states (i.e. complete sulcus supraorbitalis and convex
torus occipitalis transversus) which underline a relative morpho-
logical heterogeneity among the cluster. Indeed, other character
states for these morphological features also describe the cluster
(Table 3).
Discussion
Overall, both the geometric morphometric analysis and the
scoring of morphological features included in our phenetic study
support the uniqueness of H. heidelbergensis as a species that was
distributed on a wide geographical horizon, including Eurasia and
Africa; at the same time, it was a rather polymorphic taxon and
was probably ancestral to the origin of both the Neandertals and
our own species, H. sapiens.
The DFA based on geometric morphometrics and Procrustes
analysis (Figure 1) distinguishes between the three pre-defined
groups: Early Pleistocene humans (H. habilis, D2280 and D2700
from Dmanisi, H. ergaster, H. erectus), Neandertals (H. neandertha-
lensis), and modern humans (H. sapiens). Along the first axis (80.9%
of variance), we observe an overall consistency with their
respective chronologies and phylogenetic positions. The empty
chronological space between the Early Pleistocene archaic sample
and the more recent as well as derived groups (Neandertals and
modern humans) is filled by Mid-Pleistocene specimens, including
Ceprano.
However, the morphological space identified by the cranial
shape of Ceprano does not show clear affinities with other Mid-
Pleistocene fossils. Along the first discriminant function it appears
close to the Early Pleistocene sample attributed to H. erectus and,
particularly, to Asian fossils such as Sangiran 17 (near Ceprano
along the second discriminant function as well). The other Asian
specimens (Mid-Pleistocene fossils from Zhoukoudian, China, and
Late Pleistocene specimens from Ngandong, Java) also exhibit
affinities with fossils dated to the Early Pleistocene. Despite the
observed differences in shape between the Asian sample and the
African fossils attributed to H. ergaster (e.g. widening of the
braincase at the stephanion level), it is difficult to conclude whether
these differences are able to distinguish Asian and African
specimens as separate taxa with the widespread and highly
variable taxon referred to as H. erectus. Nevertheless, the main
result from this geometric morphometrics analysis supports
previous claims that Ceprano definitively displays an ‘‘erectus-like’’
morphological architecture [4,14].
By contrast, other Mid-Pleistocene specimens show different
morphological trends. particularly – disregarding the position of
Steinheim and Jinniu Shan, which seems to reflect the important
deformations affecting both these specimens [22,23] – fossils like
SH5, Petralona, Dali, and Kabwe share a similar position in the
shape space, somewhat midway between H. erectus and H.
neanderthalensis.
We should conclude that Ceprano is characterized by an
archaic shape. At the same time, however, it shows a peculiar
combination of discrete features [5], as the second part of our
protocol demonstrates (Figure 2).
Similarly to the previous analysis, the discrete features
succeeded in identifying different taxonomic entities (Figure 2).
Asian and African specimens of the Early Pleistocene show
regional differences, supporting the existence of two distinct taxa
or, at least, two diverging evolutionary lineages: H. erectus sensu
stricto in Asia and H. ergaster in Africa [24]. The H. sapiens group
includes the Qafzeh/Skhul sample and ‘‘pre-modern’’ late Mid-
Pleistocene specimens from Africa (Omo II, LH18, Singa, and
Jebel Irhoud 1). Although this study does not focus on Early
Pleistocene Homo or on the origin of modern humans, we note that
these results support the validity of our phenetic approach.
From this analysis it is clear that Ceprano displays a unique
combination of morphological features (Figure 3). It shows traits
that are found among Mid-Pleistocene specimens (e.g. frontal
tuber weakly developed and medially positioned, supraorbital
region medially concave, incomplete sulcus supraorbitalis,
intermediate position of the external auditory meatus in regard
to the processus zygomaticus temporalis, see, Table 3), but also
traits that are considered as derived (straight torus occipitalis
A Place for the Archaic Human Cranium from Ceprano
PLoS ONE | www.plosone.org 5 April 2011 | Volume 6 | Issue 4 | e18821
transversus, medio-lateral concavity of the articular tubercle)
[25]. However, none of these are really Neandertal autapo-
morphic features, since they are widespread in Eurasia during the
Middle Pleistocene. Actually, most of the Neandertal morpho-
logical features occur in the upper face of the European Mid-
Pleistocene humans [25,26], but in Ceprano only the suborbital
region can be examined and it does not show any Neandertal
resemblance. Conversely, Ceprano exhibits features that are
common among H. erectus and/or H. ergaster (e.g. torus angularis
parietalis, petro-tympanic crest orientated downward, processus
retromastoideus and opisthocranion coincident with inion)
[27,28]. The result of this peculiar morphology is that Ceprano
clusters in our analysis with other European, African and Asian
Mid-Pleistocene specimens – such as Petralona, Dali, Kabwe,
Jinniu Shan, Steinheim, and SH5 – furnishing a rather
plesiomorphic phenetic link among them.
On the basis of this morphological affinity, it seems appropriate
to group Ceprano with these fossils, and consider them as a single
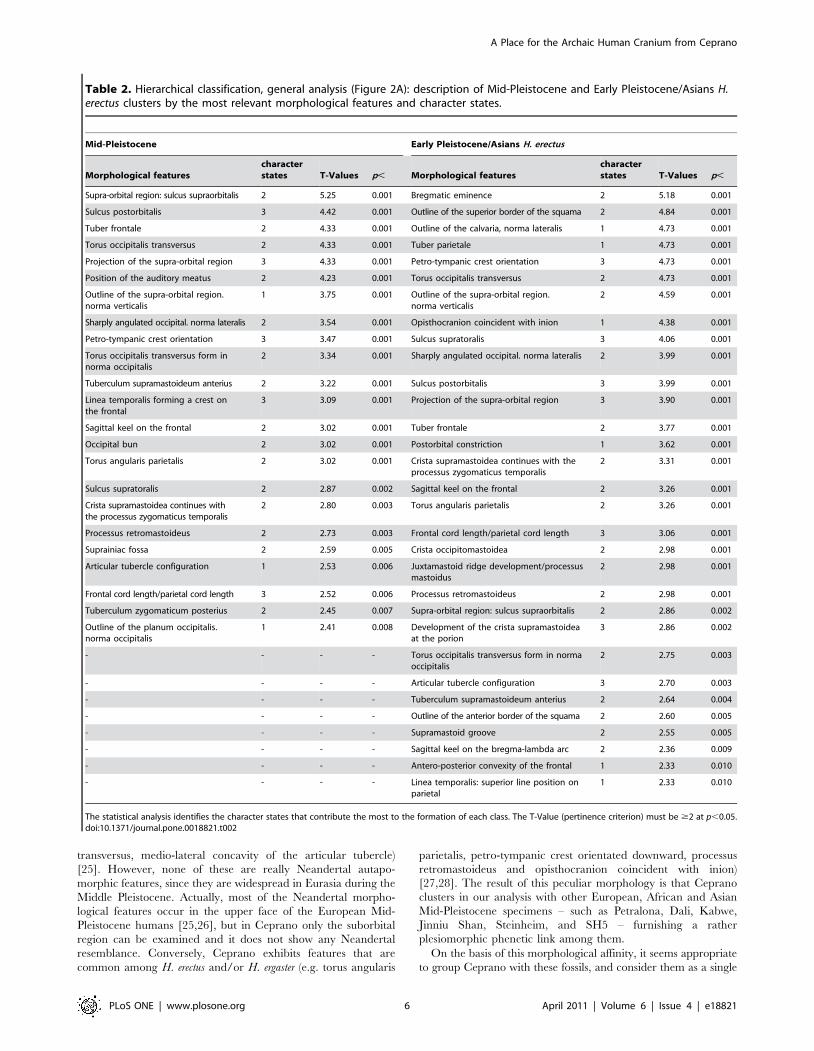
Table 2. Hierarchical classification, general analysis (Figure 2A): description of Mid-Pleistocene and Early Pleistocene/Asians H.erectus clusters by the most relevant morphological features and character states.
Mid-Pleistocene Early Pleistocene/Asians H. erectus
Morphological featurescharacterstates T-Values p, Morphological features
characterstates T-Values p,
Supra-orbital region: sulcus supraorbitalis 2 5.25 0.001 Bregmatic eminence 2 5.18 0.001
Sulcus postorbitalis 3 4.42 0.001 Outline of the superior border of the squama 2 4.84 0.001
Tuber frontale 2 4.33 0.001 Outline of the calvaria, norma lateralis 1 4.73 0.001
Torus occipitalis transversus 2 4.33 0.001 Tuber parietale 1 4.73 0.001
Projection of the supra-orbital region 3 4.33 0.001 Petro-tympanic crest orientation 3 4.73 0.001
Position of the auditory meatus 2 4.23 0.001 Torus occipitalis transversus 2 4.73 0.001
Outline of the supra-orbital region.norma verticalis
1 3.75 0.001 Outline of the supra-orbital region.norma verticalis
2 4.59 0.001
Sharply angulated occipital. norma lateralis 2 3.54 0.001 Opisthocranion coincident with inion 1 4.38 0.001
Petro-tympanic crest orientation 3 3.47 0.001 Sulcus supratoralis 3 4.06 0.001
Torus occipitalis transversus form innorma occipitalis
2 3.34 0.001 Sharply angulated occipital. norma lateralis 2 3.99 0.001
Tuberculum supramastoideum anterius 2 3.22 0.001 Sulcus postorbitalis 3 3.99 0.001
Linea temporalis forming a crest onthe frontal
3 3.09 0.001 Projection of the supra-orbital region 3 3.90 0.001
Sagittal keel on the frontal 2 3.02 0.001 Tuber frontale 2 3.77 0.001
Occipital bun 2 3.02 0.001 Postorbital constriction 1 3.62 0.001
Torus angularis parietalis 2 3.02 0.001 Crista supramastoidea continues with theprocessus zygomaticus temporalis
2 3.31 0.001
Sulcus supratoralis 2 2.87 0.002 Sagittal keel on the frontal 2 3.26 0.001
Crista supramastoidea continues withthe processus zygomaticus temporalis
2 2.80 0.003 Torus angularis parietalis 2 3.26 0.001
Processus retromastoideus 2 2.73 0.003 Frontal cord length/parietal cord length 3 3.06 0.001
Suprainiac fossa 2 2.59 0.005 Crista occipitomastoidea 2 2.98 0.001
Articular tubercle configuration 1 2.53 0.006 Juxtamastoid ridge development/processusmastoidus
2 2.98 0.001
Frontal cord length/parietal cord length 3 2.52 0.006 Processus retromastoideus 2 2.98 0.001
Tuberculum zygomaticum posterius 2 2.45 0.007 Supra-orbital region: sulcus supraorbitalis 2 2.86 0.002
Outline of the planum occipitalis.norma occipitalis
1 2.41 0.008 Development of the crista supramastoideaat the porion
3 2.86 0.002
- - - - Torus occipitalis transversus form in normaoccipitalis
2 2.75 0.003
- - - - Articular tubercle configuration 3 2.70 0.003
- - - - Tuberculum supramastoideum anterius 2 2.64 0.004
- - - - Outline of the anterior border of the squama 2 2.60 0.005
- - - - Supramastoid groove 2 2.55 0.005
- - - - Sagittal keel on the bregma-lambda arc 2 2.36 0.009
- - - - Antero-posterior convexity of the frontal 1 2.33 0.010
- - - - Linea temporalis: superior line position onparietal
1 2.33 0.010
The statistical analysis identifies the character states that contribute the most to the formation of each class. The T-Value (pertinence criterion) must be $2 at p,0.05.doi:10.1371/journal.pone.0018821.t002
A Place for the Archaic Human Cranium from Ceprano
PLoS ONE | www.plosone.org 6 April 2011 | Volume 6 | Issue 4 | e18821

taxon. The available nomen for this putative species is H.
heidelbergensis [15], whose distinctiveness stands on the retention
of a number of archaic traits combined with features that are more
derived and independent from any Neandertal ancestry. Especial-
ly, the morphology of the frontal bone seems to bear most of these
traits (shape of supraorbital torus and occurrence of frontal tuber,
in particular) [5,13]. This conclusion is further supported by the
position of the Ethiopian calvarium known as Daka in the analysis,
where it emerges as part of the H. ergaster cluster along with OH9
and other African specimens (Figure 2). This result would suggest
that H. ergaster survived as a distinct species until 1 Ma, and would
discard the validity of the species H. cepranensis [11], which was
based on the claimed affinities between Daka and Ceprano that we
did not observe. At the same time, it should be noted that the
mandible AT-888 associated with the SH5 cranium from
Atapuerca has been shown to share affinities with the holotype
of H. heidelbergensis: the Mauer mandible [18,29]. Thus we can
include the so-called ‘‘Ante-Neandertals’’ from Europe in the same
taxonomical unit with other Mid-Pleistocene samples from Africa
and continental Asia.
Combining the results of the two approaches of our phenetic
analysis, Ceprano should be reasonably accommodated as part of
a Mid-Pleistocene human taxon H. heidelbergensis, which would
include European, African, and Asian specimens. Moreover, the
combination of archaic and derived features exhibited by the
Italian specimen represents a ‘‘node’’ connecting the different
poles of such a polymorphic humanity. In this respect, it appears of
particular interest that:
1) Ceprano shows strong morphological affinities with extra-
European Mid-Pleistocene specimens, even more than with many
of its European counterparts, supporting the above-mentioned
conclusion of a widespread single species;
2) This morphological proximity suggests a dispersal that
occurred approximately around the Early/Middle Pleistocene
Table 3. Hierarchical classification. partial analysis (Figure 2B): description of Mid-Pleistocene and Early Pleistocene/Asians H.erectus clusters by the most relevant morphological features and character states.
Middle Pleistocene Early Pleistocene – Asians H. erectus
Morphological featurescharacterstates T-Values p, Morphological features
characterstates T-Values p,
Supra-orbital region: sulcus supraorbitalis 2 5.08 0.001 Outline of the calvaria. norma lateralis 1 6.29 0.001
Tuber frontale 2 4.45 0.001 Outline of the superior border of the squama 2 6.24 0.001
Sulcus postorbitalis 3 4.36 0.001 Opisthocranion coincident with inion 1 6.13 0.001
Projection of the supra-orbital region 3 4.28 0.001 Petro-tympanic crest orientation 3 5.79 0.001
Position of the auditory meatus 2 4.16 0.001 Torus occipitalis transversus 2 5.79 0.001
Outline of the supra-orbital region. normaverticalis
1 4.16 0.001 Outline of the supra-orbital region. normaverticalis
1 5.42 0.001
Sharply angulated occipital. norma lateralis 2 3.65 0.001 Tuber parietale 2 5.37 0.001
Torus occipitalis transversus 2 3.59 0.001 Articular tubercle configuration 3 4.98 0.001
Sagittal keel on the frontal 2 3.09 0.001 Sagittal keel on the frontal 3 4.64 0.001
Torus angularis parietalis 2 3.09 0.001 Torus angularis parietalis 2 4.64 0.001
Articular tubercle configuration 1 2.87 0.002 Sulcus postorbitalis 2 4.60 0.001
Crista supramastoidea continues with theprocessus zygomaticus temporalis
2 2.87 0.002 Crista supramastoidea continues with theprocessus zygomaticus temporalis
1 4.60 0.001
Petro-tympanic crest orientation 3 2.82 0.002 Sulcus supratoralis 3 4.60 0.001
Occipital bun 2 2.76 0.003 Postorbital constriction 3 4.60 0.001
Torus occipitalis transversus form in normaoccipitalis
2 2.66 0.003 Projection of the supra-orbital region 2 4.51 0.001
Tuberculum supramastoideum anterius 2 2.66 0.003 Tuber frontale 2 4.34 0.001
Linea temporalis forming a crest on thefrontal
3 2.64 0.003 Sharply angulated occipital. norma lateralis 2 4.00 0.001
Tuberculum zygomaticum posterius 2 2.62 0.004 Supramastoid groove 2 3.84 0.001
Tuber parietale 2 2.53 0.006 Temporal squama height 1 3.42 0.001
Sulcus supratoralis 2 2.39 0.009 Supra-orbital region: sulcus supraorbitalis 2 3.39 0.001
- - - - Torus occipitalis transversus form 2 3.39 0.001
- - - - Tuberculum supramastoideum anterius 3 2.71 0.003
- - - - Supra-orbital region: sulcus supraorbitalis 2 2.64 0.004
- - - - Development of the crista supramastoidea atthe porion
3 2.48 0.0007
- - - - Torus occipitalis transversus form 3 2.40 0.008
- - - - Outline of the supra-orbital region. normafacialis
1 2.40 00008
The statistical analysis identifies the character states that contribute the most to the formation of each class. The T-Value (pertinence criterion) must be $2 at p,0.05.doi:10.1371/journal.pone.0018821.t003
A Place for the Archaic Human Cranium from Ceprano
PLoS ONE | www.plosone.org 7 April 2011 | Volume 6 | Issue 4 | e18821

boundary (0.780 Ma), in Africa and Eurasia, and that is referable
to a single species of derived (i.e. encephalized) humans;
3) Ceprano combines a rather primitive architecture of the
braincase with derived features, thus possibly representing the
ancestral (i.e. the most archaic-looking) morphotype of this taxon
distributed both in Africa and Eurasia;
4) From this perspective, the morphology of Ceprano constitutes
a phylogenetic ‘‘bridge’’ between Early Pleistocene Homo repre-
sentatives and related forms (H. erectus sensu lato), and more recent
and derived populations included in the species H. heidelbergensis;
5) These conclusions are also coherent with the new chronology
proposed for Ceprano (ranging between 430 and 385 ka, [8]),
when assuming a great variability in the Middle Pleistocene of
Europe, with the occurrence of, some populations or single
individuals that exhibit retention of a more archaic shape while
others appear more derived [30].
In sum, our analysis demonstrates that Ceprano, as a calvarium,
could represent an appropriate ‘‘counterpart’’ of, the holotype of
Homo heidelbergensis (the mandible from Mauer [15]), bringing
together both features observed on the human samples of the
Middle Pleistocene referred to this widespread species and
plesiomorphic traits shared with earlier or more archaic humans.
Materials and Methods
MaterialThe fossil sample was selected in order to encompass as much of
the Pleistocene fossil record as possible. 39 fossils from Africa, Asia,
and Europe were studied (Early Pleistocene: 9, Middle Pleistocene:
14 among which Ceprano, Neandertals: 9 late H. erectus: 3, H.
sapiens: 7) (Table 1). Additionally, 68 modern humans from Africa,
Europe and Asia (18 Neolithics, 50 extant modern humans) were
included: 1- provide a sufficient sample of modern humans spread
out over a span of time similar to that of the Neandertals (i.e.
130,000 years); 2- take into account the margin of error in dating
the fossil sample; and 3- test the reliability of the character data set
and the statistical method used in the study. Considering the
continuing debates in palaeoanthropology over taxon recognition,
the fossils were grouped according to their relative chronological
position, with the exception of H. neanderthalensis and H. sapiens for
which a relative consensus exists even though the debate is not
totally closed [31,32]. No a priori species grouping were used.
Finally, no juveniles were included in the study with the exception
of D2700 due to the scarce fossil sample available for Early
Pleistocene.
MethodsGeometric morphometrics shape analysis (see, [33]) is based on
14 landmarks (Figure S1, Table S3) chosen to describe at best the
calvarium morphology, while taking into consideration the state of
preservation of the fossils. We ran a Generalized Procrustes
Analysis, a Principal Component Analysis (PCA) based on the
procrustes residuals and a Discriminant Function Analysis (DFA)
to discriminate three pre-defined groups (modern humans,
Neandertals and Early Pleistocene specimens). This analysis uses
the first 6 Principle Components (PC) (80.56% of the total
variance, see, Tables S4 and S7) since the number of variables
must be lower than 7 (smallest group number of specimens). The
Figure 3. Statistically significant traits that describe the Mid-Pleistocene cluster including Ceprano. Numbers represent the followingmorphological features: Features 1 to 4 (black) traits that are more exclusive of Mid-Pleistocene specimens (i.e. 1: incomplete sulcus supraorbitalis, 2:frontal tuber weakly developed medially shifted, 3: supraorbital region medially concave, 4: intermediate position of the external auditory meatus inregard to the processus zygomaticus temporalis); 5 and 6 (blue) = more derived traits (i.e. 5: straight torus occipitalis transversus, 6: medio-lateralconcavity of the articular tubercle); 7 to 10 (green) = more primitive traits (i.e. 7: petro-tympanic crest orientated downward, 8: opisthocranioncoincident with inion, 9: processus retromastoideus, 10: torus angularis parietalis). Pertinence criterion for statistical significance: T-values.2, p,0.05.Scale bar = 50 mm.doi:10.1371/journal.pone.0018821.g003
A Place for the Archaic Human Cranium from Ceprano
PLoS ONE | www.plosone.org 8 April 2011 | Volume 6 | Issue 4 | e18821
discrimination between these groups is used as a ‘‘pattern’’ to study
fossil of interests which are introduced a posteriori in the analysis.
The Wilks’ lambda statistics [34] (see, Table S6), used to validate
the discrimination, necessitates covariance matrices equality of
each group which can be test using a Box’s M test [35] (Table S5).
In order to run this test we need to randomly select 14 modern
humans to obtain groups, which are of comparable size (i.e.
number of individuals, see Table S2). Additionally, we tested the
impact of size on specimens shape modifications in order to
identify a possible allometric trend in our data. We used linear
regression, which was calculated for each PCs involved in the
computation of the discriminant functions when compared to
centroid size [36]. We used Morphologika 2 v2.5 [37] (APG, ACP,
linear regression) and SPSS v11.5 �SPSS Inc. 1989-2002 (linear
Discriminant Function Analysis).
Hierarchical classification. 50 morphological traits (Figure
S2, Tables S9 and S12) were selected from the literature
[25,27,28,38–43] in order to encompass most of Pleistocene
Homo sp. variation. Features that were too often missing and that
did not meet the standard of repeatability were discarded (see test
of intra-observer repeatability, Tables S10 and S11). We used two
types of variables: binary (absence ‘‘1’’/presence ‘‘2’’) and
continuous variables (divided qualitatively into 3 character
states). Character states were not polarized phylogenetically.
Specimens’ description occurred through three sessions by each
worker and observations were compared to published data. The
phenetic analysis, as recently described [18], uses morphological
distance matrices between specimens (multiple correspondence
analysis, chi-square metric) to build dendrograms (hierarchical
classification, ward’s criterion [44]). Clusters from the dendrogram
are consolidated to obtain the best classification (see, Tables S13
and S14). Each group from the dendrogram are described
by statistically significant morphological features (pertinence
criterion: T-Value.2, p,0.05). The variables do not have to be
independent. No a priori groups were specified before the
beginning of the analysis. Two analyses were run: the global
analysis based on the 50 morphological features and the partial
analysis which allows the inclusion of 8 additional specimens
(Qafzeh 9, Gibraltar 1, La Quina H5, Ngawi 1, OH9, D2280,
D2700 and Daka). Thirteen morphological features (2, 10, 14, 15,
16, 18, 25, 26, 40, 41, 43, 47, 50) not preserved on these specimens
were not used in this analysis. We used SPAD (v5.5 �DECISIA
1996–2002).
Supporting Information
Figure S1 Landmarks used in the geometric morpho-metrics analysis. (Spy 1 � IRSNB, Bruxelles, Belgique).
Description of each landmark can be found in Table S3.
(TIF)
Figure S2 Morphological features included in the study(Abri Pataud). Each number designates a morphological trait
which description can be found in Table S9.
(TIF)
Figure S3 Full dendrograms from hierarchical classifi-cation based on discrete features: general (A) and partial(B) analyses. Branches and number at nodes express morpho-
logical distance between clusters. Clusters are built thanks to
Ward’s criterion. Modern humans are clearly separated from the
fossils in both dendrograms to the exception of African late Mid-
Pleistocene specimens Jebel Irhoud 1, Omo II and LH18.
Neandertals form a cluster which includes the pre-Neandertal
Gibraltar 1. Early Pleistocene specimens and Asian specimens
often referred to H. erectus sensu stricto form two separated sub-
groups in the same larger cluster. A) Ceprano is part of a Mid-
Pleistocene cluster with African and Eurasian fossils. B) Partial
analysis allows the inclusion of 8 additional specimens (Qafzeh 9,
Gibraltar 1, La Quina H5, Ngawi 1, OH9, D2280, D2700 and
Daka). 13 morphological features (2, 10, 14, 15, 16, 18, 25, 26, 40,
41, 43, 47, 50) not preserved on these specimens are not used in
this analysis. Again, Ceprano is included in a Mid-Pleistocene
cluster along with African and Eurasian fossils.
(TIF)
Table S1 Details of the Historic and Neolithic speci-mens. Period, denomination, number of male and female
individuals and total number of specimens.
(DOC)
Table S2 Holocene specimens included in the geometricmorphometrics analysis. Due to the conservation state of the
Saharan series from Hassi El Abiod, no female individual were
included.
(DOC)
Table S3 Landmarks used in for the geometric mor-phometrics analysis. Number. name. description and type for
each landmark.
(DOC)
Table S4 Main Principal Components from the pro-crustes shape analysis. Eigenvalues. percentage of variance
and percentage of cumulated variance for each principal
component.
(DOC)
Table S5 Discriminant Function Analysis: Box’s Mresults on the covariance matrices of the three prede-fined groups. Covariance matrices of the three groups are
considered equals.
(DOC)
Table S6 Discriminant Function Analysis: quality of thediscrimination. The Wilks’ lambda results validate the
discrimination of each function at p,0.0001.
(DOC)
Table S7 Discriminant Function Analysis: PrincipalComponent contribution to each discriminant functionand coefficient for each function. CP1 contributes the most
to the first discriminant function while CP2 contributes the most to
the second discriminant function.
(DOC)
Table S8 Linear regression results for the six firstprincipal components when compared to centroıde size.The six first PCs are involved in the computation of the
discriminant functions. None of the R2 and F values are
significant. Thus, the centroid size does not seem to have a
significant impact on the specimens’ shape.
(DOC)
Table S9 Morphological features and character statesused in the phenetic analyses. Morphological traits and character
states used in the study; the 50 features were selected after a
morphological survey of qualitative features of the calvaria in literature.
(DOC)
Table S10 Frequency distribution of the morphologicaltraits of the study for three repetitions by the sameobserver. N = number of unobservable traits; * marks
morphological features with intra-observer errors.
(DOC)
A Place for the Archaic Human Cranium from Ceprano
PLoS ONE | www.plosone.org 9 April 2011 | Volume 6 | Issue 4 | e18821

Table S11 Chi-square test values for the comparisonsbetween repetitions by the same observer. * These 15
morphological features were found, during the intra-observer test,
to show differences among trials. A chi-square test (with a Yates
correction for small sample size when appropriate) was used to
determine if the differences were significant. None of the tests in
this table are statistically significant.
(DOC)
Table S12 Character states for each morphologicalfeatures and each specimens of the study. First line
numbers indicate morphological features, other lines numbers
indicate the character state for each trait for each specimen, (-)
indicates missing data (see Table S7).
(DOC)
Table S13 Hierarchical classification: general analysis(Figure S3A); classification consolidation through itera-tions. In successive iterations, the probability of the partition (i.e.,
the clustering process) is adjusted (i.e., individuals are randomly
reallocated to the different clusters) to maximize the likelihood of
the data given the number of clusters. The number of iterations is
lower than 10 and the inertia does not vary. The partition is thus,
solid.
(DOC)
Table S14 Hierarchical classification: partial analysis(Figure S3B); classification consolidation through itera-tions. In successive iterations, the probability of the partition (i.e.,
the clustering process) is adjusted (i.e., individuals are randomly
reallocated to the different clusters) to maximize the likelihood of
the data given the number of clusters. The number of iterations is
lower than 10 and the inertia does not vary. The partition is thus,
solid.
(DOC)
Table S15 Hierarchical classification, general analysis(Figure S3A): description of modern Humans andNeandertals clusters by the most relevant morphologi-cal features and character states. The statistical analysis
identifies the character states that contribute the most to the
formation of each class. The T-Value (pertinence criterion) must
be $2 at p,0.05.
(DOC)
Acknowledgments
For permission to study and photograph specimens in their care we thank
direction and curators of the following institutions: Soprintendenza
Archeologia del Lazio, Servizio di Antropologia (Rome, Italy); ‘‘Museo
di Antropologia G. Sergi’’ (Sapienza Universita di Roma, Italy); Museo
preistorico-etonografico ‘‘L. Pigorini’’ (Rome, Italy); Istituto Italiano di
Paleontologia Umana (Roma, Italy); Peabody Museum (Harvard, USA);
Georgian National Museum (Tbilisi, Georgia); Sackler School of Medicine
(Tel-Aviv, Israel); Natural History Museum (London, UK); Staatliches
Museum fur Naturkunde (Stuttgart, Germany); Rheinisches Landesmu-
seum (Bonn, Germany); Thuringisches Landesamt fur Archaologische
Denkmalpflege (Weimar, Germany); Institut royal des Sciences Naturelles
de Belgique (Bruxelles, Belgium); Aristotle University of Thessaloniki
(Athene, Greece); Musee de l’Homme (Paris, France); Institut de
Paleontologie Humaine (Paris, France). We are grateful to Miriam
Belmaker (Harvard University), Hans Petersen (University of South
Denmark) for English editing and statistics. Finally, we thank J. H.
Relethford, and the three anonymous reviewers for valuable comments and
criticisms of earlier drafts, which contributed to the improvement of this
paper.
Author Contributions
Conceived and designed the experiments: AM SC GM. Performed the
experiments: AM SC GM. Analyzed the data: AM SC GM. Wrote the
paper: AM SC GM.
References
1. Bermudez de Castro JM, Arsuaga JL, Carbonell E, Rosas A, Martınez I, et al.
(1997) A hominid from the Lower Pleistocene of Atapuerca, Spain: possible
ancestor to Neandertals and modern humans. Science 276: 1392–1395.
2. Carbonell E, Bermudez de Castro JM, Pares JM, Perez-Gonzalez A, Cuenca-
Bescos G, et al. (2008) The first hominin of Europe. Nature 452: 465–469.
3. Roebroeks W, Van Kolfschoten T (1994) The earliest occupation of Europe: a
short chronology Antiquity 68: 489–503.
4. Ascenzi A, Biddittu I, Cassoli PF, Segre AG, Segre-Naldini E (1996) A calvarium
of late Homo erectus from Ceprano, Italy. J Hum Evol 31: 429–423.
5. Manzi G, Mallegni F, Ascenzi A (2001) A cranium for the earliest Europeans:
Phylogenetic position of the hominid from Ceprano, Italy. Proc Natl Acad
Sci U S A 98: 10011–10016.
6. Ascenzi A, FM, Manzi G, Segre AG, Segre Naldini E (2000) A re-appraisal of
Ceprano calvaria affinities with Homo erectus, after the new reconstruction. J Hum
Evol 39: 443–450.
7. Segre AG, Biddittu I (2009) Pleistocene moyen et inferieur dans le Latium (Italie
centrale). L’Anthropologie 113: 59–65.
8. Manzi G, Magri D, Milli S, Palombo MR, Margari V, et al. (2010) The new
chronology of the Ceprano calvarium (Italy). J Hum Evol 59: 580–585.
9. Muttoni G, Scardia G, Kent DV, Swisher CC, Manzi G (2009) Pleistocene
magnetochronology of early hominin sites at Ceprano and Fontana Ranuccio,
Italy. Earth Planet Sc Lett 286: 255–268.
10. Clarke RJ (2000) A corrected reconstruction and interpretation of the Homo
erectus calvaria from Ceprano, Italy. J Hum Evol 39: 433–442.
11. Mallegni F, Carnieri E, Bisconti M, Tartarelli G, Ricci S, et al. (2003) Homo
cepranensis sp. nov. and the evolution of African-European Middle Pleistocene
hominids. C R Palevol 2: 153–159.
12. Manzi G (2004) Human evolution at the Matuyama-Brunhes boundary. Evol
Anthrop 13: 11–24.
13. Bruner E, Manzi G (2005) CT-based description and phyletic evaluation of the
archaic human calvarium from Ceprano, Italy. Anat Rec A Discov Mol Cell
Evol Biol 285A: 643–657.
14. Bruner E, Manzi G (2007) Landmark-Based Shape Analysis of the Archaic Homo
Calvarium from Ceprano (Italy). Am J Phys Anthropol 132: 355–366.
15. Schoetensack O (1908) Der Unterkiefer des Homo heidelbergensis aus den Sanden
von Mauer bei Heidelberg; Engelmann W, editor. Leipzig. 67 p.
16. Rightmire GP (2008) Homo in the middle pleistocene: Hypodigms, variation, andspecies recognition. Evol Anthrop 17: 8–21.
17. Rightmire GP (1996) The human cranium from Bodo, Ethiopia: Evidence forspeciation in the Middle Pleistocene? J Hum Evol 31: 21–39.
18. Mounier A, Marchal F, Condemi S (2009) Is Homo heidelbergensis a distinct
species? New insight on the Mauer mandible. J Hum Evol 56: 219–246.
19. Mounier A (2009) Validite du taxon Homo heidelbergensis Schoetensack, 1908
[PhD]. Marseille: Universite de la Mediterrannee. 514 p.
20. Endicott P, Ho SYW, Stringer C (2010) Using genetic evidence to evaluate fourpalaeoanthropological hypotheses for the timing of Neanderthal and modern
human origins. J Hum Evol 59: 87–95.
21. Manzi G (2011) Before the emergence of Homo sapiens. Overview on the Early-to-
Middle Pleistocene (with a proposal at the sub-specific level). Int J Evol Biol, in
press.
22. Braun M, Hublin JJ, Bouchet P (1998) New reconstruction of the Middle
Pleistocene skull of Steinheim (Baden-Wurtemberg, Germany). Am J PhysAnthropol suppl 26: 113.
23. Wu R (1988) The reconstruction of the fossil human skull from Jinniushan,
Yinkoun Liaoning Province and its main features. Acta Anthropol Sinica 7:101–107.
24. Wood B (1994) Taxonomy and Evolutionary Relationships of Homo erectus. CourForsch-Inst Senckenberg 171: 159–165.
25. Condemi S (2001) Les Neanderthaliens de La Chaise. Paris: CTHS. 178 p.
26. Dean D, Hublin J-J, Holloway R, Ziegler R (1998) On the phylogenetic positionof the pre-Neandertal specimen from Reilingen, Germany. J Hum Evol 34:
485–508.
27. Rightmire GP (1990) The Evolution of Homo erectus. Comparative Anatomical
Studies of an Extinct Human Species. Cambridge: Cambridge University Press.
260 p.
28. Stringer CB (1984) The definition of Homo erectus and the existence of the species
in Africa and Europe. Cour Forsch-Inst Senckenberg 69: 131–143.
29. Rosas A, Bermudez de Castro JM (1998) The Mauer mandible and theevolutionary significance of Homo heidelbergensis. Geobios 31: 687–697.
30. Hublin J-J (2009) The origin of Neandertals. Proc Natl Acad Sci U S A 106:16022–16027.
31. Green RE, Krause J, Briggs AW, Marici T, Stenzel U, et al. (2010) A Draft
Sequence of the Neandertal Genome. Science 328: 710–722.
A Place for the Archaic Human Cranium from Ceprano
PLoS ONE | www.plosone.org 10 April 2011 | Volume 6 | Issue 4 | e18821

32. Wolpoff MH, Hawks J, Frayer DW, Hunley K (2001) Modern Human Ancestry
at the Peripheries: A Test of the Replacement Theory. Science 291: 293–297.
33. Bookstein FL (1991) Morphometric Tools for Landmark Data: Geometry and
Biology. Cambridge: Cambridge University Press. 456 p.
34. Wilks SS (1962) Mathematical Statistics. New York: John Wiley and Sons.644 p.
35. Colley WW, Lohnes PR (1971) Multivariate data analysis. New York: John
Wiley & Sons. 364 p.
36. Marchal F (2003) Le dimorphisme sexuel de conformation de l’os coxal humain.
Bases biologiques et nouvelles applications possibles. Bull Mem Soc Anthropol
Paris 15: 7–24.
37. O’Higgins P, Jones N (2006) Tools for statistical shape analysis. York: Hull York
Medical School.
38. Andrews PJ (1984) An alternative interpretation of the characters used to define
Homo erectus. Cour Forsch-Inst Senckenberg 69: 167–175.39. Anton SC (2003) Natural history of Homo erectus. Yearb phys Anthrop 46:
126–170.
40. Condemi S (1992) Les Hommes Fossiles de Saccopastore et leurs RelationsPhylogenetiques. Paris: CNRS Editions. 169 p.
41. Weaver TD (2009) The meaning of Neandertal skeletal morphology.Proceedings of the National Academy of Sciences 106: 16028–16033.
42. Vandermeersch B (1981) Les Hommes de Qafzeh (Israel). Paris: CNRS. 319 p.
43. Weidenreich F (1943) The skull of Sinanthropus pekinensis: A comparative study ona primitive hominid skull. Palaeont Sin 10: 1–485.
44. Ward JH (1963) Hierarchical Grouping to optimize an objective function. J AmStat Assoc 58: 236–244.
A Place for the Archaic Human Cranium from Ceprano
PLoS ONE | www.plosone.org 11 April 2011 | Volume 6 | Issue 4 | e18821


![Cult Poetry in Archaic Greece [2012]](https://static.fdokumen.com/doc/165x107/6317a4a0bc8291e22e0e59eb/cult-poetry-in-archaic-greece-2012.jpg)